INTERCOS GROUP Global Cosmetic Manufacturer …web.intercos.it/bond/files/fin/INTERCOS SPA - INTERIM...
35
INTERCOS GROUP Global Cosmetic Manufacturer INTERIM CONSOLIDATED REPORT AT SEPTEMBER 30, 2017 PREPARED IN ACCORDANCE WITH IFRS ENDORSED BY THE EUROPEAN UNION Intercos S.p.A. Registered office in Milan Piazza Generale Armando Diaz 1
Transcript of INTERCOS GROUP Global Cosmetic Manufacturer …web.intercos.it/bond/files/fin/INTERCOS SPA - INTERIM...

INTERCOS GROUP
Global Cosmetic Manufacturer
INTERIM CONSOLIDATED REPORT
AT SEPTEMBER 30, 2017
PREPARED IN ACCORDANCE WITH IFRS ENDORSED BY THE EUROPEAN UNION
Intercos S.p.A. Registered office in Milan Piazza Generale Armando Diaz 1

2
Corporate Information
BOARD OF DIRECTORS *
Name Office
Dario Gianandrea Ferrari Chairman and CEO
Ludovica Arabella Ferrari Director
Gianandrea Ferrari Director
Nikhil Thukral Kumar Director
James Michael Chu Director
Ciro Piero Cornelli ** Director
Renato Semerari Director
Decio Masu*** Director
Federico Vermicelli**** Director
Ginevra Ott**** Director
Maggie Fanari**** Director
BOARD OF STATUTORY AUDITORS *
Name Office
Nicola Pietro Lorenzo Broggi Chairman
Matteo Tamburini Standing auditor
Maria Maddalena Gnudi Standing auditor
Francesco Molinari Alternate auditor
Simone Alessandro Marchiò Alternate auditor
INDEPENDENT AUDITORS
EY S.p.A.
_____________________________________________________________________________________
* The Board of Directors and the Board of Statutory Auditors currently in office will remain in office until the date of the
shareholders’ meeting called to approve the financial statements for the year ended December 31, 2019.
** Ciro Piero Cornelli holds the office of director from April 27, 2017. During the period October 21, 2016 to April 25,
2017, the office was held by Paolo Valsecchi.
*** Decio Masu was coopted a member of the Board of Directors on August 3, 2017 and later confirmed by the shareholders’
meeting held on October 2, 2017.
**** Federico Vermicelli, Ginevra Ott and Maggie Fanari were appointed members of the Board of Directors on October 16,
2017.
3
INTERIM CONSOLIDATED REPORT FOR THE NINE MONTHS
ENDED SEPTEMBER 30, 2017
Introduction
The Interim Consolidated Report at September 30, 2017 of the Intercos Group is prepared in accordance with
the provisions of art. 154 ter, paragraph 5 of Legislative Decree 58/98 – T.U.F., and subsequent modifications
and additions, and drawn up in accordance with IAS 34 – Interim Financial Reporting, issued by the
International Accounting Standards Board (IASB).
The notes to the interim consolidated financial statements at September 30, 2017, pursuant to IAS 34, are
presented in a condensed form and do not include all the information required for annual financial statements,
in that they refer solely to those components which, by amount, composition or variation, are necessary for an
understanding of the results of operations, cash flows and financial position of the Group as of that date.
Therefore, the interim condensed consolidated financial statements at September 30, 2017 should be read in
conjunction with the 2016 consolidated financial statements of Intercos S.p.A.
The accounting policies and basis of preparation of the interim condensed consolidated financial statements
have been applied on basis consistent with those applied in the annual consolidated financial statements at
December 31, 2016.
All amounts are expressed in thousands of Euro, unless otherwise indicated.
The preparation of the Interim Consolidated Report has required the use of estimates by management.
With the intention of providing additional information that reflects the parameters for analysis and control
used by management to assess the Group’s performance, the following pages present the reclassified
consolidated statement of financial position at September 30, 2017 and the reclassified consolidated income
statement for the first nine months then ended, as well as the comparative statements at September 30, 2016
and December 31, 2016, respectively, supplemented with non-GAAP alternative performance measures.
The reclassifications had no effect on the net profit or on the equity reported in the interim consolidated
financial statements.
The non-GAAP alternative performance measures identified in the reclassified consolidated income
statement and the reclassified consolidated statement of financial position are used by management to
provide information for a better assessment of the results of operations and financial position of the Group.
Such performance measures should not be construed as a substitute for the performance measures
established by IFRS.

4
The alternative performance measures are calculated as follows:
EBITDA: is calculated as profit before taxes, financial income (expenses) without any adjustment
and before depreciation, amortization and impairment reversals (losses). EBITDA also excludes
income (expenses) from the result of unconsolidated companies and securities, as well as gains or
losses on disposal of consolidated investments, classified under financial income (expenses) or, for
the share of the profit (loss) of only investments accounted for using the equity method (non-
operating), within the item result from investments accounted for using the equity method.
Adjusted EBITDA: is calculated by the deducting the following, if applicable, from EBITDA, as
defined above:
impairment of goodwill, if any;
amortization of the portion of the purchase price allocated to intangible assets in a business
combination, as established in IFRS 3;
restructuring costs, under specific and significant restructuring plans;
nonrecurring other income (expenses) referring to particularly significant events unrelated to
ordinary business operations.
Operating working capital includes inventories and trade receivables and payables.
Net working capital is given by operating working capital net of other current assets and liabilities.
Net invested capital is the sum of non-current assets, non-current liabilities and net working
capital.
Net debt (cash) or net financial position: is given by the sum of current and non-current financial
liabilities net of short- and long-term financial receivables, including cash and cash equivalents.
Headcount is given by the number of employees registered in the payroll book on the last day of
the reporting period.

5
BUSINESS COMBINATIONS – ACQUISITION OF COSMINT GROUP
On August 3, 2017, Intercos S.p.A. completed the acquisition of 100% of the capital of Cosmint Group
S.p.A., a company operating for over 20 years in the B2B cosmetic sector and leader in the manufacture of
skin, hair and body products. The acquisition will create one of the largest B2B beauty groups worldwide.
Cosmint Group’s manufacturing excellence, profound knowledge of the beauty market and state-of-the-art
factories in Italy and Poland will allow Intercos to grow significantly in terms of organizational skills and
manufacturing capacity. Not least, Intercos will now be able to satisfy customers’ needs in almost every
category of the beauty industry thanks to the addition of Cosmint in the Intercos family.
The acquisition of the Cosmint Group S.p.A. was partly financed by own funds and partly by new credit lines
obtained without modifying the loan contract described in greater detail under subsequent events.
The higher price paid, although not yet entirely paid, was allocated to goodwill on a provisional basis for
€42,643 thousand until completion of the relative allocation process as set out in IFRS 3.
6
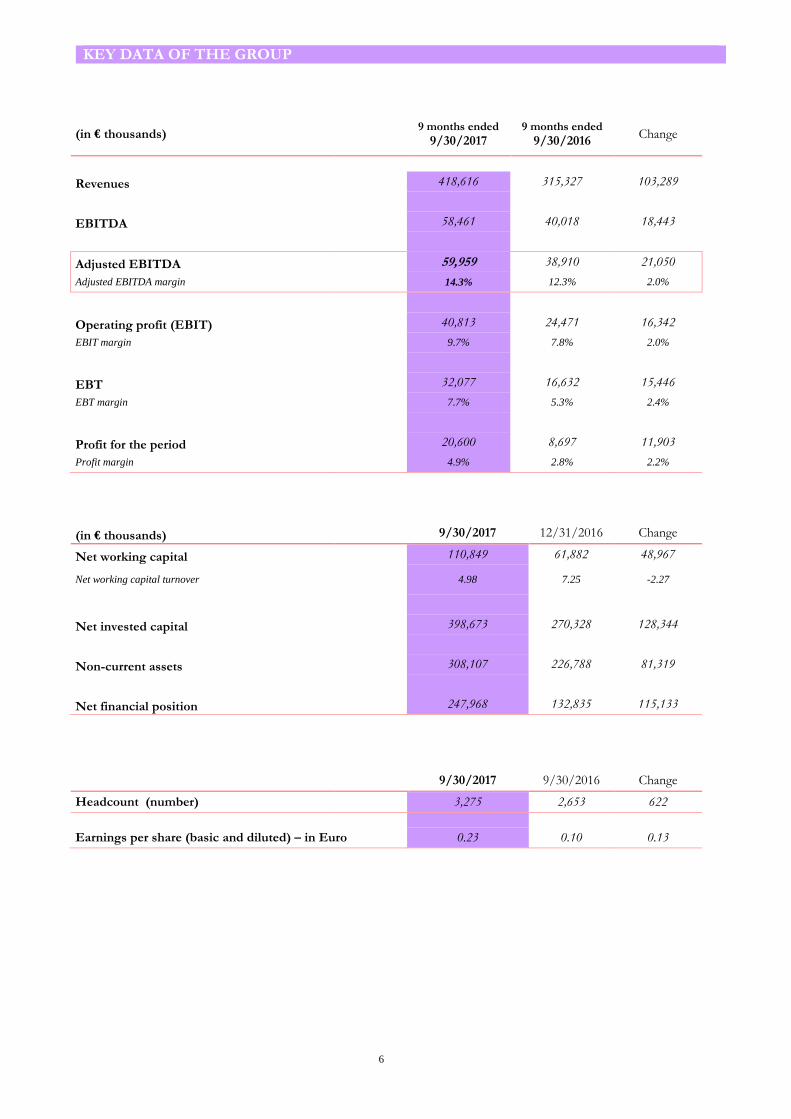
KEY DATA OF THE GROUP
(in € thousands) 9 months ended
9/30/2017 9 months ended
9/30/2016 Change
Revenues 418,616 315,327 103,289
EBITDA 58,461 40,018 18,443
Adjusted EBITDA 59,959 38,910 21,050
Adjusted EBITDA margin 14.3% 12.3% 2.0%
Operating profit (EBIT) 40,813 24,471 16,342
EBIT margin 9.7% 7.8% 2.0%
EBT 32,077 16,632 15,446
EBT margin 7.7% 5.3% 2.4%
Profit for the period 20,600 8,697 11,903
Profit margin 4.9% 2.8% 2.2%
(in € thousands) 9/30/2017 12/31/2016 Change
Net working capital 110,849 61,882 48,967
Net working capital turnover
4.98 7.25 -2.27
Net invested capital 398,673 270,328 128,344
Non-current assets 308,107 226,788 81,319
Net financial position 247,968 132,835 115,133
9/30/2017 9/30/2016 Change
Headcount (number) 3,275 2,653 622
Earnings per share (basic and diluted) – in Euro 0.23 0.10 0.13
7
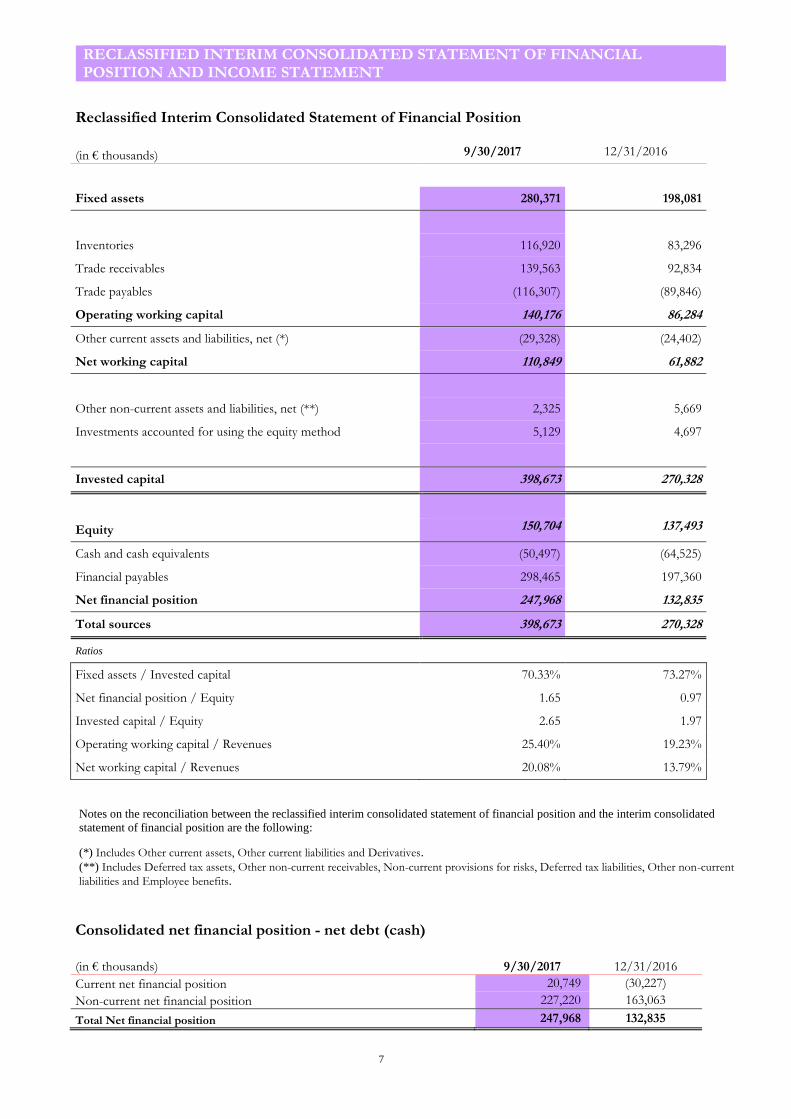
RECLASSIFIED INTERIM CONSOLIDATED STATEMENT OF FINANCIAL POSITION AND INCOME STATEMENT
Reclassified Interim Consolidated Statement of Financial Position
(in € thousands) 9/30/2017 12/31/2016
Fixed assets 280,371 198,081
Inventories 116,920 83,296
Trade receivables 139,563 92,834
Trade payables (116,307) (89,846)
Operating working capital 140,176 86,284
Other current assets and liabilities, net (*) (29,328) (24,402)
Net working capital 110,849 61,882
Other non-current assets and liabilities, net (**) 2,325 5,669
Investments accounted for using the equity method 5,129 4,697
Invested capital 398,673 270,328
Equity 150,704 137,493
Cash and cash equivalents (50,497) (64,525)
Financial payables 298,465 197,360
Net financial position 247,968 132,835
Total sources 398,673 270,328
Ratios
Fixed assets / Invested capital 70.33% 73.27%
Net financial position / Equity 1.65 0.97
Invested capital / Equity 2.65 1.97
Operating working capital / Revenues 25.40% 19.23%
Net working capital / Revenues 20.08% 13.79%
Notes on the reconciliation between the reclassified interim consolidated statement of financial position and the interim consolidated
statement of financial position are the following:
(*) Includes Other current assets, Other current liabilities and Derivatives. (**) Includes Deferred tax assets, Other non-current receivables, Non-current provisions for risks, Deferred tax liabilities, Other non-current
liabilities and Employee benefits.
Consolidated net financial position - net debt (cash) (in € thousands) 9/30/2017 12/31/2016
Current net financial position 20,749 (30,227)
Non-current net financial position 227,220 163,063
Total Net financial position 247,968 132,835

8
Reclassified Interim Consolidated Income Statement by Function
(in € thousands) 9 months ended
9/30/2017
9 months ended 9/30/2016
Revenues 418,616 315,327
Cost of sales (318,533) (243,105)
Industrial gross margin 100,083 72,221
Industrial gross margin percentage
23.9% 22.9%
Research & Development and innovation costs (23,871)
(19,530)
Selling expenses (17,353)
(14,544)
General and administrative expenses (18,789)
(17,310)
Other operating income (expenses) 3,435 3,098
Result from investments accounted for using the equity method (operating) (1,193) (574)
Nonrecurring income (expenses) (1,498)
1,110
Operating profit (EBIT) 40,813 24,471
EBIT margin 9.7% 7.8%
Depreciation, amortization and impairment reversals (losses) (17,648)
(15,548)
Nonrecurring income (expenses) (1,498)
1,110
Adjusted EBITDA (*) 59,959 38,910
Adjusted EBITDA margin 14.3% 12.3%
Financial income (expenses), net (**) (8,771)
(7,868)
Result from investments accounted for using the equity method 35
29
Profit before taxes (EBT) 32,077 16,632
Income taxes (11,478) (7,934)
Profit for the period 20,600 8,697
Of which:
- attributable to the owners of the parent 20,479 8,380
- attributable to non-controlling interests
121
317
Earnings per share:
Basic and diluted - in Euro 0.23
0.10
(*) For additional details, reference should be made to the notes on pages 3 and 4. (**) Financial income (expenses) is the sum of financial income (expenses) without any adjustment.

9
The breakdown of the headcount of the Group at September 30, 2017 is as follows:
Group headcount 9/30/2017 9/30/2016
Executives and mid-level managers 265 242
White collars 1,176 917
Blue collars 1,834 1,494
Total 3,275 2,653
Temporary 2,511 1,618
Total 5,786 4,271
At September 30, 2017, the total headcount of Intercos Group (excluding Cosmint) is 5,096 divided into 2,891
permanent and 2,205 temporary. The headcount of Cosmint is 690, of whom 384 are permanent and 306
temporary.
10
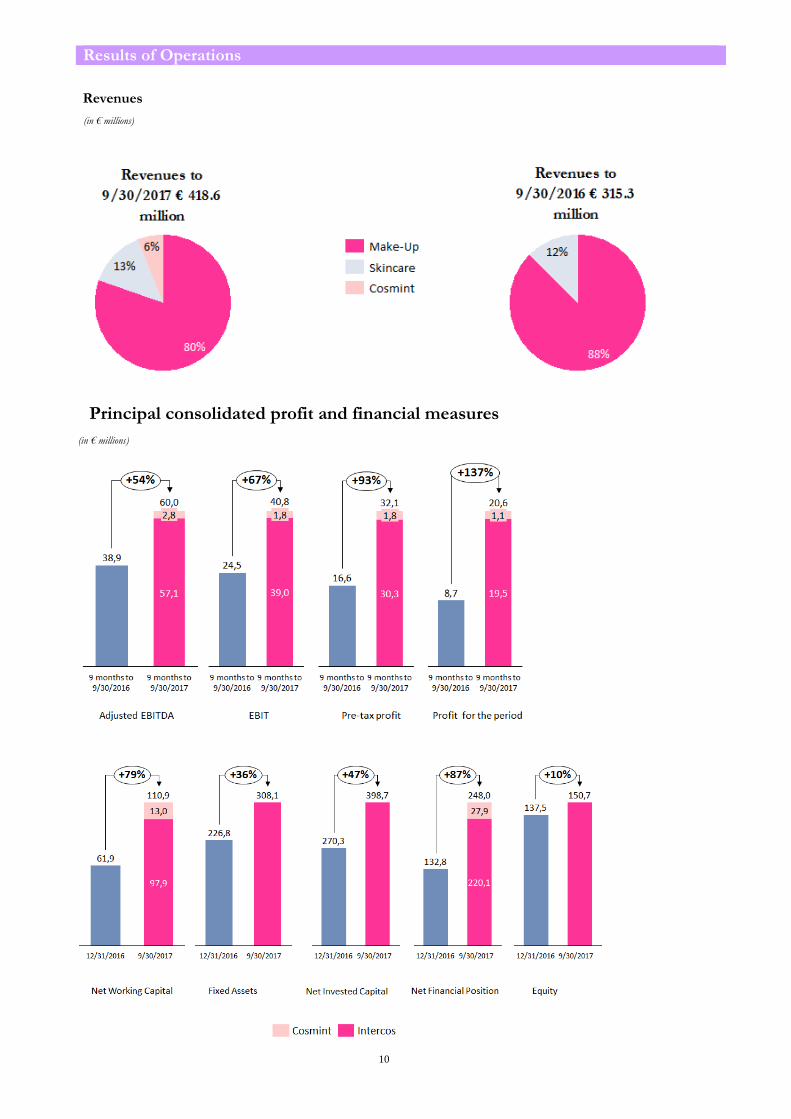
Results of Operations
Revenues
(in € millions)
Principal consolidated profit and financial measures
(in € millions)

11
In the first nine months of 2017, excluding the effect of the contribution made by the newly acquired
company Cosmint, the Group continued to grow and reported revenues from sales of €392,890 thousand
compared to €315,327 thousand in the first nine months of 2016, with an increase of €77,563 thousand, or
24.6%. If Cosmint is included, the total increase is €103,289 thousand (+32.8%), bringing total sales to
€418,616 thousand.
Adjusted EBITDA, excluding Cosmint, increased by 46.9% and is a positive €57,149 thousand, for a 14.5%
adjusted EBITDA margin, compared to 12.3% in the first nine months of 2016 (€38,910 thousand). The total,
including Cosmint, rises to €59,959 thousand, for a 14.3% margin, recording an increase of €21,050 thousand
(+54.1%).
Excluding Cosmint, EBIT is a positive €39,013 thousand (9.9% EBIT margin) against €24,471 thousand to
September 30, 2016 (7.8% EBIT margin), a 59.4% increase. Including Cosmint, total EBIT is €40,813
thousand (9.7% EBIT margin), growing €16,342 thousand (+66.8%).
Capital expenditures in property, plant and equipment and intangible assets for the period January 1 to
September 30, 2017 total €12,146 thousand and €5,613 thousand, respectively.
The consolidated net financial position, excluding Cosmint is €220,063 thousand compared to €132,835
thousand at December 31, 2016. The increase of €87,228 thousand can mainly be ascribed to the acquisition
of the Cosmint Group. The total net financial position of the Group is €247,968 thousand and also includes
€27,905 thousand referring to Cosmint.
Total equity of the Group is to €150,704 thousand compared to €137,493 thousand at December 31, 2016,
with an increase of €13,211 thousand.
12
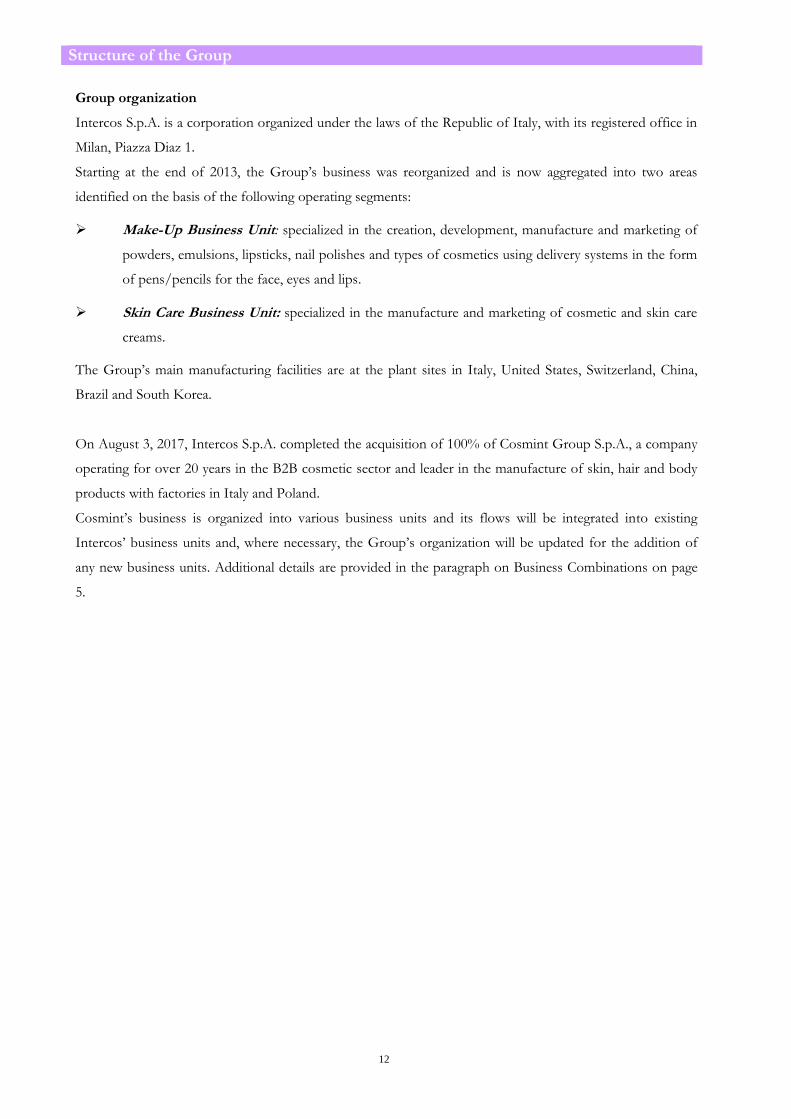
Structure of the Group
Group organization
Intercos S.p.A. is a corporation organized under the laws of the Republic of Italy, with its registered office in
Milan, Piazza Diaz 1.
Starting at the end of 2013, the Group’s business was reorganized and is now aggregated into two areas
identified on the basis of the following operating segments:
Make-Up Business Unit: specialized in the creation, development, manufacture and marketing of
powders, emulsions, lipsticks, nail polishes and types of cosmetics using delivery systems in the form
of pens/pencils for the face, eyes and lips.
Skin Care Business Unit: specialized in the manufacture and marketing of cosmetic and skin care
creams.
The Group’s main manufacturing facilities are at the plant sites in Italy, United States, Switzerland, China,
Brazil and South Korea.
On August 3, 2017, Intercos S.p.A. completed the acquisition of 100% of Cosmint Group S.p.A., a company
operating for over 20 years in the B2B cosmetic sector and leader in the manufacture of skin, hair and body
products with factories in Italy and Poland.
Cosmint’s business is organized into various business units and its flows will be integrated into existing
Intercos’ business units and, where necessary, the Group’s organization will be updated for the addition of
any new business units. Additional details are provided in the paragraph on Business Combinations on page
5.

The Group’s organization structure is updated to the closing of the interim consolidated financial statements at September 30, 2017 and shows the operating companies and
those in liquidation.
100% 100% 100%
65% 99.7% 0.3% 100%
100% 100% 76%
100% 75.01% 70%
100% 100%
100% 100%
100%
20% 100%100%
50%
100% 1.85%
100%
Intercos Asia Pacific Limited
(Hong Kong)
Intercos S.p.A.
(Italy)
CRB S.A.
(Switzerland)
Tatra Spring Polska sp. Z o.o.
(Poland)
Cosmint S.p.A.
(Italy)
Sodisco S.r.l.
(Italy)
Intercos Concept S.r.l.
(Italy)
Vitalab S.r.l.
(Italy)
Intercos Paris S.à r.l.
(France)
Intercos UK Ltd
(United Kingdom)
Intercos Marketing Ltd
(United Kingdom)
Intercos America Inc.
(United States of America)
Intercos do Brasil Indústria e
Comércio de Productos
Cosméticos LTDA
(Brazil)
CRB Benelux Bv
(The Netherlands)
Hana Co. Ltd.
(South Korea)
Intercos Technology (SIP)
Co., Ltd
(P.R. China)
Intercos Cosmetics (Suzhou)
Co., Ltd
(P.R. China)
Interfila Cosmetics
(Shanghai) Co., Ltd
(P.R. China)
Lariana Depur S.p.A.
(Italy)
Shinsegae Intercos Korea Inc.
(South Korea)
Cosmint Group S.p.A.
(Italy)
Intercos Europe S.p.A.
(Italy)
Drop Nail S.r.l.
(Italy)
Ager S.r.l.
(Italy)
Kit Productions S.r.l.
(Italy)
Marketing Projects S.r.l. in a wind-up
(Italy)
100%

Review of Operations
COMPOSITION OF THE GROUP AND RELATED TRANSACTIONS AND INVESTMENTS
The interim consolidated financial statements at September 30, 2017 include the interim financial statements
and/or accounting data of Intercos S.p.A. (group holding company) and the subsidiaries and other companies
(Italian and foreign) that carry out manufacturing and marketing activities, consolidated line-by-line or
accounted for using the equity method.
Scope of consolidation:
SUBSIDIARIES
(consolidated line-by-line)
Name Head Office Currency
Capital in thousands of
currency indicated
Percentage of ownership
Direct Indirect
Intercos Europe S.p.A. Milan Euro 3,000 100,00%
Kit Productions S.r.l. Pessano con Bornago (Milan) Euro 10 70.00%
Marketing Projects S.r.l. in liquidation Milan Euro 40 100.00%
Ager S.r.l. Monza Euro 31 76.00%
Drop Nail S.r.l. Milan Euro 50 100.00%
Intercos America Inc. Wilmington, New Castle, Delaware (USA) US dollar 10 100.00%
Intercos do Brasil Indústria e Comércio de Productos Cosméticos ltda
Atibaia (Brazil) Brazilian real 30,377 99.7% 0.3%
Intercos Paris S.ar.l Paris (France) Euro 14 100.00%
Intercos UK Ltd Barnstaple (UK) British pound 0.1 65.00%
Intercos Marketing Ltd South Molton (UK) British pound 0.001 100%
CRB S.A. Puidoux (Switzerland) Swiss franc 100 100.00%
Vitalab S.r.l. Milan Euro 160 75.01%
CRB Benelux BV Maastricht (Netherlands) Euro 18 100.00%
Intercos Technology Co.Ltd. Suzhou (P.R.C.) US dollar 3,400
100.00%
Interfila Cosmetics (Shanghai) Co. Ltd Shanghai (P.R.C) US dollar 2,700
100.00%
Intercos Cosmetics Suzhou Co. Ltd. Suzhou (P.R.C.) US dollar 12,800
100.00%
Intercos Daily Product (SIP) Co. Ltd ** Suzhou (P.R.C.) RMB 5,000
100.00%
Intercos Asia Pacific Limited Hong Kong US dollar 29,104* 100.00%
Intercos Concept S.r.l Milan Euro 10 100.00%
Cosmint Group S.p.A. *** Como Euro 50 100.00%
Cosmint S.p.A. *** Olgiate Comasco Euro 1,586 100.00%
Sodisco S.r.l. *** Olgiate Comasco Euro 10 100.00%
Tatra Spring Polska Spółka Zoo *** Garwolin (Poland) PLN 50 100.00%
* The investment in Intercos Asia Pacific is recorded for USD 29,101 thousand and HKD 26 thousand; the latter, converted at the exchange rate at
the transaction date, is equal to €3 thousand.
** The SIP Market Inspection Administration Bureau approved the request to cancel the company Intercos Daily Product (SIP) Co. Ltd., effective
May 19, 2017.
*** Company that is an integral part of the Intercos Group as from August 3, 2017 following Intercos S.p.A.’s acquisition of 100% of the capital
of Cosmint Group S.p.A., which, in turn holds 100% of the capital of Cosmint S.p.A., Sodisco S.r.l. and Tatra Spring Polska Spółka Zoo.
Cosmint S.p.A. also has a minority interest (1.85%) in Lariana Depur S.p.A. with registered offices on Via Raimondi 1 in Como (Italy),

15
In January 2017, Intercos S.p.A. increased its investment in the subsidiary Asia Pacific Limited by USD 2,100
thousand. This transaction had no effect on Intercos S.p.A.’s relationship with is a 100% direct investment.
On October 20, 2017, Intercos Asia Pacific Limited approved a capital increase for Intercos Technology (SIP)
Co. Ltd. of USD 5,000,000. Following the capital payment, the share capital of Intercos Technology (SIP) Co.
Ltd. will increase from USD 3,400,000 to USD 8,400,000.
In February 2017, Intercos Asia Pacific increased its investment in the share capital of the subsidiary Shinsegae
Intercos Korea by KRW 2,500,000 thousand. The shareholder Shinsegae also increased its investment in the
company’s share capital so that its percentage investment would remain unchanged.
COMPANY ACCOUNTED FOR AT COST
Company Headquarters Currency Capital in
€/000 Percentage ownership
Direct
Indirect
Lariana Depur S.p.A. Como EUR 24 1.85%
All amounts in the interim financial statements and tables are expressed in thousands of Euro, unless
otherwise indicated.
The exchange rates used for the translation of amounts expressed in currencies other than the Euro are the
following:
Income Statement 9 months ended
9/30/2017
Income Statement 9 months ended
9/30/2016
Statement of Financial Position
9/30/2017
Statement of Financial Position
12/31/2016
Average for period Average for period At September 30, 2017 At December 31,2016
U.S. dollar 1.1132 1.1158 1.1806 1.0541
Pound sterling 0.8725 0.8022 0.8818 0.8562
Swiss franc 1.0946 1.0936 1.1457 1.0739
Chinese renminbi (yuan) 7.5721 7.3432 7.8534 7.3202
South Korean won 1,267.0597 1,296.2855 1,351.8300 1,269.3600
Brazilian real 3.5311 3.9642 3.7635 3.4305

16
SEGMENT REPORTING .
At September 30, 2017, the Group’s business is aggregated into two Business Units identified on the basis of
the following product lines:
“Make-up” Business Unit: specialized in the creation, development, manufacture and marketing of
powders, emulsions, lipsticks, nail polishes and types of cosmetics using delivery systems in the form
of pens/pencils for the face, eyes and lips.
“Skin Care” Business Unit: specialized in the manufacture and marketing of cosmetic and skin
care creams.
The Group’s main manufacturing facilities are at the plant sites in Italy, United States, Switzerland, China,
Brazil and South Korea.
The financial information reported below is periodically reviewed by the Board of Directors and also used for
planning and budgeting.
On August 3, 2017, Intercos S.p.A. completed the acquisition of 100% of the capital of Cosmint Group
S.p.A., a company operating for over 20 years in the B2B cosmetic sector and leader in the manufacture of
skin, hair and body products with factories in Italy and Poland. Cosmint’s business is organized into various
business units and its flows will be integrated into Intercos’ business units and, where necessary, the Group’s
organization will be updated for the addition of any new business units.
Additional details are provided in the paragraph on Business Combinations on page 5.
Detailed information on each identified segment, and separately for Cosmint Group, for the first nine
months ended September 30, 2017 and September 30, 2016, is presented in the following tables.
9 months ended 9/30/2017 - (in € thousands) Make-up Skin Care Cosmint Group Eliminations Total
Revenues 336,560 56,331 25,726 418,616
Adjusted EBITDA (*) 49,253 7,896 2,810 59,959 Depreciation, amortization and impairment reversals (losses) (14,501) (2,137) (1,011) (17,648)
Nonrecurring income (expenses) (1,498)
Financial income (expenses) (8,771) Result from investments accounted for using the equity method 35
Income taxes (11,478)
Profit for the period 20,600
Net invested capital at 9/30/2017 319,314 50,399 97,739** -68,779 398,673
(*) For additional details on adjusted EBITDA, reference should be made to the comments on page 4.
** The figure includes goodwill of €42,643 thousand which will be allocated in the manner and within the time frame
established by IFRS 3.

17
9 months ended 9/30/2016 - (in € thousands) Make-up Skin Care Total
Revenues 276,143 39,184 315,327
Adjusted EBITDA (*) 33,645 5,264 38,909
Depreciation, amortization and impairment reversals (losses) (13,647) (1,901) (15,548)
Nonrecurring income (expenses) 1,110
Financial income (expenses) (7,868)
Result from investments accounting for using the equity method 29
Income taxes (7,934)
Profit for the period 8,695
Net invested capital at 12/31/2016 228,896 41,432 270,328
(*) For additional details on adjusted EBITDA, reference should be made to the comments on page 4. Make-up Business Unit: revenues reported total €336,560 thousand, up €60,417 thousand (+21.9%) over
the figure for the same period of the prior year, and basically include all product families.
Adjusted EBITDA is €49,253 thousand, an increase of €15,608 thousand compared to the first nine months
of 2016, or +46.4% (€33,645 thousand for the nine months to September 30, 2016). The adjusted EBITDA
margin is +14.6% in the first nine months of 2017 (+12.2% in the first nine months of 2016)
Skin Care Business Unit: revenues recorded come to €56,331 thousand, an increase of €17,147 thousand
(+43.8%) over the corresponding period of 2016.
Adjusted EBITDA is €7,896 thousand, up €2,633 thousand, or 50.0%, compared to €5,264 thousand for the
nine months to September 30, 2016. The adjusted EBITDA margin is +14.0% in the first nine months of
2017 (+13.4% in the first nine months of 2016).
Detailed information on revenues by geographical region according to the location in which the recipient of
the invoice has its headquarters is as follows:
(in € thousands)
Sales by Business Unit 9 months ended
9/30/2017 9 months ended
9/30/2016
Make-Up 336,560 276,143
Skin Care 56,331 39,184
Cosmint Group 25,726 -
Total 418,616 315,327
(in € thousands)
Sales by Geographic Region 9 months ended
9/30/2017 9 months ended
9/30/2016
Americas 151,333 106,816 EMEA 194,520 176,830 Asia 47,037 31,681 Cosmint Group 25,726 -
Total 418,616 315,327

18
The different trends in sales by geographic region in the first nine months of 2017 compared to the
corresponding period of the prior year are as follows:
Americas: posts a 42% increase in sales particularly in the Prestige market. Leading this growth are
first of all “multinational” customers, followed by “emerging brands” with a certain degree of stability
recorded by “retailer” customers.
EMEA: reports sales of €194,520 thousand compared to €176,830 thousand in the corresponding
period last year, growing €17,690 thousand (+10%). The gain is mainly attributable to “retailer”
customers where the Group has positively focused the development of commercial relations.
Asia: records total sales of €47,037 thousand, 48% more than the €31,681 thousand reported in the
same period of the prior year. The increase can primarily be traced to the enormous efforts by the
Group to increase the sales volumes of “emerging brands and local “retailers”. In addition, although
to lesser extent, sales with “multinational” customers display a positive growth.
Cosmint Group: almost all sales are concentrated in the EMEA area.

19
NOTES ON THE MAIN ITEMS OF THE INTERIM CONDENSED CONSOLIDATED FINANCIAL STATEMENTS AT SEPTEMBER 30, 2017
1. Movements in property, plant and equipment
Movements in property, plant and equipment during the first nine months of 2017 are as follows:
(in € thousands) December 31,
2016 Increases / Depreciation
Translation differences /
Reclassifications.
Change in scope of
consolidation
Decreases / Utilization
September 30, 2017
Historical cost
Land and buildings 132,464 1,005 (3,575) 27,250 (0) 157,144
Plant and machinery 128,618 4,919 (1,307) 50,962 (214) 182,979
Industrial equipment 36,519 1,451 (115) 3,585 (94) 41,346
Office furniture and equipment 14,622 547 (662) 2,305 (211) 16,602
Motor vehicles and internal transportation equipment
2,188 - (26) 295 (530) 1,926
Cell phones 21 30 207 1,884 - 2,142
Assets under construction and payments on account
4,860 4,194 (4,593) 2,573 29 7,064
Total 319,292 12,146 (10,071) 88,854 (1,020) 409,202
Accumulated depreciation
Land and buildings 74,764 4,376 (2,147) 5,337 (0) 82,330
Plant and machinery 102,777 5,678 (3,395) 33,187 (30) 138,216
Industrial equipment 32,974 1,314 (83) 3,059 (41) 37,222
Office furniture and equipment 9,978 652 (459) 1,870 (182) 11,858
Motor vehicles and internal transportation equipment
1,974 84 (25) 285 (505) 1,813
Cell phones 20 38 - 716 - 774
Total 222,486 12,142 (6,109) 44,453 (759) 272,213
Net carrying amount 96,804 4 (3,962) 44,401 (261) 136,989
2. Movements in intangible assets
Movements in intangible Assets during the first nine months of 2017 are as follows:
(in € thousands) December 31,
2016 Increases
Decreases/ Adjustments /
Translation differences
Reclassifications Amortization
Change in scope of
consolidation
September 30, 2017
Development costs 15,425 893 (141) 0 (3,917) 0 12,259
Patent and software rights 4,110 256 (20) 74 (1,222) 59 3,257
Concessions and licenses 2,163 165 (102) 10 (305) 1 1,931
Assets under development 2,701 4,035 (0) (272) 0 168 6,632
Other intangible assets 111 263 (1) 79 (60) 636 1,028
TOTAL 24,509 5,613 (265) (109) (5,504) 864 25,108

20
3. Borrowings from banks and other lenders
Borrowings from banks and other lenders and relative due dates are provided in the following table:
(in € thousands)
September 30, 2017 Short-term Medium-term Long-term Total
Intercos S.p.A. bonds 1,987 9,937 107,296 119,220
Medium/long-term bank borrowings (pool) 7,342 76,156 - 83,498
Medium/long-term bank borrowings (CRB) 340 1,419 3,749 5,508
Medium/long-term bank borrowings (Cosmint) 8,151 14,019 - 22,169
Mortgages 46 2,944 - 2,990
Finance leases payable 2,214 3,585 - 5,799
Other financial payables 34,799 - - 34,799
Derivatives 385 - - 385
Medium/long-term debt 55,264 108,060 111,045 274,369
Revolving credit facility Intercos China 21,804 - - 21,804
Bank overdrafts 2,292 - - 2,292
Short-term debt 24,096 - - 24,096
Total 79,360 108,060 111,045 298,466
Details of the remaining loans outstanding at September 30, 2017 are as follows:
Company
Bank Amount Internal rate of return
Description
Intercos S.p.A. Bank Pool 25,926 1.504%-1.766% Tranche in EUR
Intercos S.p.A. Bank Pool 29,202 2.040% Tranche B in EUR
Intercos S.p.A. Bank Pool 12,403 3.314% Tranche in USD
Intercos S.p.A. Institutional
investors 119,220 3.719% Bonds
Intercos Europe S.p.A. Bank Pool 15,967 1.831% Tranche in EUR
202,718
CRB S.A. SH Bank 87 0.00% Loan guarantee
CRB S.A. BCV Bank 1,222 1.85% Mortgage (in CHF)
CRB S.A. BCV Bank 4,199 2.18% Batiplus (in CHF)
5,508
Cosmint S.p.A. Sundry 1,871 0.6% - 1.4% Bank loans
Cosmint Group S.p.A. Sundry 13,083 0.08% - 1.329% Bank loans
Sodisco S.r.l. Sundry 7,215 0.08% - 1.4% Bank loans
22,169
Drop Nail BPM Bank 46 1.505% Mortgage (in EUR)
Sodisco S.r.l. Unicredit S.p.A. 2,944 1.5% Mortgage (in EUR)

21
Financial data:
The consolidated net financial position, excluding Cosmint, is €220,063 thousand compared to €132,835
thousand at December 31, 2016. The increase of €87,228 thousand is due primarily to the acquisition of
Cosmint Group in addition to changes in cash flows generated by operations and investments. The total net
financial position of the Group is €247,968 thousand and includes Cosmint for an amount of €27,905
thousand.
The net financial position at September 30, 2017 is analyzed as follows:
(in € thousands) 9/30/2017 12/31/2016
Cash and cash equivalents (50,497) (64,525)
Borrowings from banks and other lenders 71,246 34,298
Total current financial position 20,749 (30,227)
Borrowings from banks and other lenders 227,220 163,063
Non-current financial position 227,220 163,063
Debt (cash) 247,968 132,835

22
4. Financial position data summary
The equity and financial structure of the Group at September 30, 2017 compared to December 31, 2016 is
represented as follows:
(in € thousands) 9/30/2017 12/31/2016
Inventories 116,920 83,296
Trade receivables and other receivables 145,676 100,639
Income taxes receivable 2,420 1,497
Current non-financial liabilities (*) (154,167) (123,550)
Net working capital 110,849 61,882
Property, plant and equipment 136,989 96,806
Other intangible assets (**) 143,357 101,274
Other non-current non-financial assets (*) 27,737 28,707
Investments in other companies 24 -
Non-current assets 308,107 226,788
Employee severance indemnities (10,202) (8,621)
Provisions (1,660) (1,079)
Other non-current non-financial liabilities (*) (8,421) (8,641)
Net invested capital 398,673 270,328
Financed by: Current financial position (*) 20,749 (30,227)
Non-current net financial position (*) 227,220 163,063
Total net financial position 247,968 132,835
Equity 150,704 137,493
Total 398,673 270,328
(*) Details of the composition of these items are provided in the “Reconciliation Schedule” on page 24.
(**) Includes goodwill.
Inventories total €116,920 thousand at September 30, 2017 and show an increase of €33,624 thousand
compared to December 31, 2016. The increase is due to the inclusion of Cosmint inventories for €20,374
thousand and higher inventories in the areas of Europe and Asia. The increase is the result of higher volumes
manufactured during the period and the seasonal nature of the Group’s business which causes a part of its
production to be concentrated in the first half of the year to meet sales requirements that are higher in later
quarters.

23
Trade receivables amount to €139,563 thousand at September 30, 2017. The increase of €46,728 thousand
includes Cosmint trade receivables of €26,929 thousand and those of the Asian subsidiaries and Intercos
Europe.
Equity increased by €13,211 thousand and reflects the negative change in exchange differences on translating
foreign operations of €7,037 thousand and the cash flow hedge of €278 thousand, net profit of €20,600
thousand, actuarial losses of €29 thousand and the negative consolidation reserve of €153 thousand, which
includes the effect of the payment of dividends to non-controlling interests, and the parent’s share capital
increase of €108 thousand.
The net financial position of €247,968 thousand rose by €115,133 thousand compared to December 31, 2016.
It includes the net financial position of Cosmint of €27,905 thousand and higher financial payables deriving
mainly from the transaction for the acquisition of Cosmint Group.
24
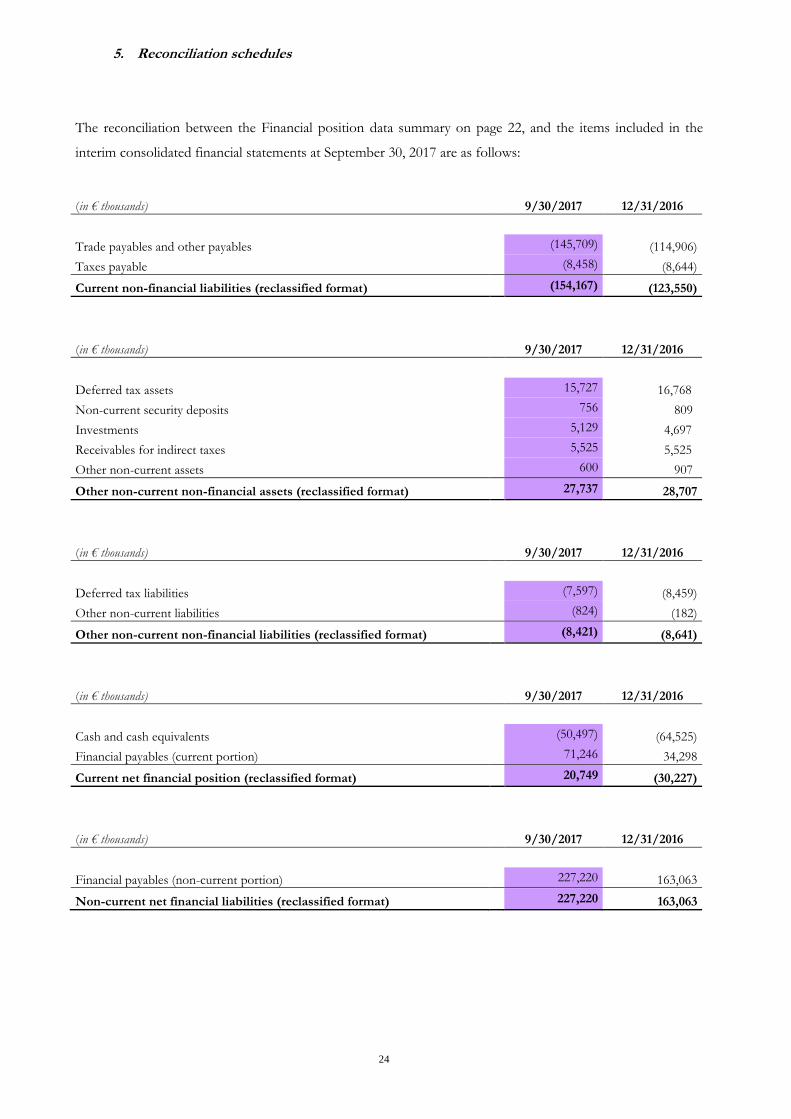
5. Reconciliation schedules
The reconciliation between the Financial position data summary on page 22, and the items included in the
interim consolidated financial statements at September 30, 2017 are as follows:
(in € thousands) 9/30/2017 12/31/2016
Trade payables and other payables (145,709) (114,906)
Taxes payable (8,458) (8,644)
Current non-financial liabilities (reclassified format) (154,167) (123,550)
(in € thousands) 9/30/2017 12/31/2016
Deferred tax assets 15,727 16,768
Non-current security deposits 756 809
Investments 5,129 4,697
Receivables for indirect taxes 5,525 5,525
Other non-current assets 600 907
Other non-current non-financial assets (reclassified format) 27,737 28,707
(in € thousands) 9/30/2017 12/31/2016
Deferred tax liabilities (7,597) (8,459)
Other non-current liabilities (824) (182)
Other non-current non-financial liabilities (reclassified format) (8,421) (8,641)
(in € thousands) 9/30/2017 12/31/2016
Cash and cash equivalents (50,497) (64,525)
Financial payables (current portion) 71,246 34,298
Current net financial position (reclassified format) 20,749 (30,227)
(in € thousands) 9/30/2017 12/31/2016
Financial payables (non-current portion) 227,220 163,063
Non-current net financial liabilities (reclassified format) 227,220 163,063

25
Notes on the interim consolidated income statement
6. Sales analysis
The contribution to sales by Group companies (revenues from sales and services) is summarized below:
(in € thousands)
Company 9 months ended
9/30/2017 9 months ended
9/30/2016
Intercos Europe S.p.A.
189,009 177,912
Intercos America Inc.
86,885 65,626
Intercos Cosmetics Suzhou Co. Ltd
29,791 17,218
Intercos Technology Co. Ltd
41,251 25,532
Interfila Cosmetics (Shanghai) Co. Ltd
24,614 13,405
CRB S.A.
31,768 27,696
Cosmint S.p.A.
23,629 -
Tatra Spring Polska Sp. Zoo
2,001 -
Other
13,861 12,042
Aggregate Total
442,810 339,431
Eliminations (24,194) (24,105)
Consolidated Total 418,616 315,327
During the first nine months of 2017, excluding Cosmint, the Group continued to grow and reported
revenues from sales of €392,890 thousand compared to €315,327 thousand in the first nine months of 2016,
with an increase of €77,563 thousand, or 24.6%. If Cosmint is included, the total increase in revenues is
€103,289 thousand (+32.8%), bringing total sales to €418,616 thousand.
Comments on the revenues of the main companies of the Group are as follows:
Intercos Europe S.p.A.: in terms of volumes, Intercos Europe is the most important company in the Group
with revenues of €189,009 thousand for the first nine months of 2017, up 6% compared to the same period
of 2016.
Intercos America Inc.: revenues up to September 30, 2017 total €86,885 thousand, with an increase of 32%
over the period to September 30, 2016.
Intercos Cosmetics Suzhou Co. Ltd.: revenues reported in the first nine months of 2017 are €29,791
thousand compared to €17,218 thousand in the first nine months of 2016 (+73%).
Intercos Technology Ltd: this company operates the production facility of the Intercos Group for sales in
Chinese territory. Revenues show an increase in the first nine months of 2017 of €15,718 thousand (+62%
compared to the first nine months of 2016).
26
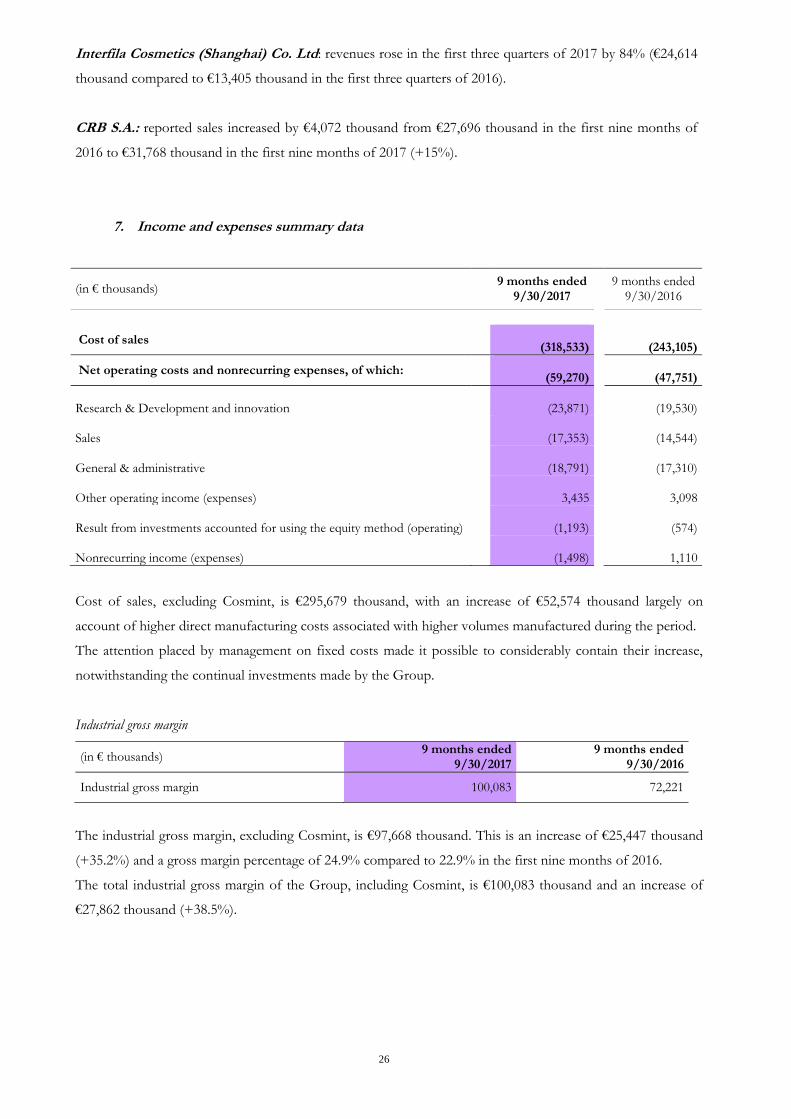
Interfila Cosmetics (Shanghai) Co. Ltd: revenues rose in the first three quarters of 2017 by 84% (€24,614
thousand compared to €13,405 thousand in the first three quarters of 2016).
CRB S.A.: reported sales increased by €4,072 thousand from €27,696 thousand in the first nine months of
2016 to €31,768 thousand in the first nine months of 2017 (+15%).
7. Income and expenses summary data
(in € thousands) 9 months ended
9/30/2017
9 months ended 9/30/2016
Cost of sales
(318,533)
(243,105)
Net operating costs and nonrecurring expenses, of which:
(59,270)
(47,751)
Research & Development and innovation
(23,871)
(19,530)
Sales
(17,353)
(14,544)
General & administrative
(18,791)
(17,310)
Other operating income (expenses)
3,435
3,098
Result from investments accounted for using the equity method (operating)
(1,193)
(574)
Nonrecurring income (expenses)
(1,498)
1,110
Cost of sales, excluding Cosmint, is €295,679 thousand, with an increase of €52,574 thousand largely on
account of higher direct manufacturing costs associated with higher volumes manufactured during the period.
The attention placed by management on fixed costs made it possible to considerably contain their increase,
notwithstanding the continual investments made by the Group.
Industrial gross margin
(in € thousands) 9 months ended
9/30/2017 9 months ended
9/30/2016
Industrial gross margin 100,083 72,221
The industrial gross margin, excluding Cosmint, is €97,668 thousand. This is an increase of €25,447 thousand
(+35.2%) and a gross margin percentage of 24.9% compared to 22.9% in the first nine months of 2016.
The total industrial gross margin of the Group, including Cosmint, is €100,083 thousand and an increase of
€27,862 thousand (+38.5%).

27
Gross operating profit (adjusted EBITDA)
(in € thousands) 9 months ended
9/30/2017 9 months ended
9/30/2016
Gross operating profit (adjusted EBITDA) 59,959 38,910
Thanks to higher sales and the industrial gross margin, adjusted EBITDA, excluding Cosmint, increased by
46.9% and is a positive €57,149 thousand, for a 14.5% adjusted EBITDA margin, compared to 12.3% in the
first nine months of 2016 (€38,910 thousand). The total, including Cosmint, rises to €59,959 thousand, for a
14.3% margin, recording an increase of €21,050 thousand (+54.1%).
Operating profit (EBIT)
(in € thousands) 9 months ended
9/30/2017 9 months ended
9/30/2016
Operating profit (EBIT) 40,813 24,471
Excluding Cosmint, EBIT is a positive €39,013 thousand (9.9% EBIT margin) against €24,471 thousand to
September 30, 2016 (7.8% EBIT margin), a 59.4% increase. Including Cosmint, total EBIT is €40,813
thousand (9.7% EBIT margin), growing €16,342 thousand (+66.8%) and also reflecting the above mentioned
increase in Adjusted EBITDA.
Profit before taxes (EBT):
(in € thousands) 9 months ended
9/30/2017 9 months ended
9/30/2016
Profit before taxes (EBT) 32,077 16,632
Profit before taxes (EBT) is €32,077 thousand, up €15,445 thousand compared to the first nine months of
2016 and includes Cosmint’s EBT of €1,773 thousand.
Profit for the period
(in € thousands) 9 months ended
9/30/2017 9 months ended
9/30/2016
Profit for the period 20,600 8,697
Profit for the period is €20,600 thousand, an increase over the corresponding period of 2016 of €11,903
thousand, including Cosmint’s profit of €1,063 thousand. The positive effect is reflected in the EPS.

28
Related party transactions:
In general, related party transactions are carried out on an arm’s length basis.
There were no atypical and/or unusual transactions during the period.
Details of the most important transactions that were entered into during the period with related
parties, including joint ventures, are as follows:
(in € thousands)
Cost for
industrial
purchases,
services and
leases and
rent
Employee
benefit
expenses
Other
revenues
and costs
Financial
expenses
Financial
income
Trade
receivables
Trade
payables
Financial
payables
Dafe International S.r.l. (113) - - - - - 50 -
Sci Maragia (34) - - - - - 96 -
Je m'en fous - - (5) - - - 22 -
Arterra Bioscience S.r.l. (472) - - (8) - - 231 340
My Style - - (16) - - - - -
Interior (1) - (5) - - - - -
Catterton (12) - - - - - 2 -
Vault (722) - - - - - 64 -
Maragia USA Inc (19) - - - - - 19 -
Cornelli Gabelli e asociati (171) (10) - - - - 81 -
Family and relatives of
Dario Ferrari - (124) - - - - - -
Total (1.544) (134) (25) (8) - - 566 340
(in € thousands)
Costs for
industrial
purchases,
services and
leases and
rent
Employee
benefit
expenses
Other
revenues
and costs
Financial
expenses
Financial
income
Trade
receivables
Trade
payables
Financial
payables
Intercos Korea LTD (974) 40 - - - 1.536 586 -
Hana Co Ltd (3) - - - - - - -
Total (977) 40 - - - 1.536 586 -
29
OUTLOOK
A substantially positive performance is expected for the full year 2017, in effect confirming the Group’s
expectations, as set out in its business plan.
SIGNIFICANT NONRECURRING EVENTS AND TRANSACTIONS
There were no significant nonrecurring events or transactions during the first nine months of 2017.
IMPORTANT EVENTS DURING THE FIRST NINE MONTHS OF 2017 AND SUBSEQUENT EVENTS
In January and February 2017, in order to obtain the best available banking terms on the market,
the parent negotiated, with a syndicate of banks composed of Banca IMI S.p.A., Intesa Sanpaolo
S.p.A., Unicredit S.p.A., BNL S.p.A. and ICBC (Europe) SA – Milan Branch, certain amendments to
the loan contract signed on March 24, 2015 by Intercos Europe S.p.A., Banca IMI S.p.A. and
Unicredit S.p.A., the total amount of which, after such amendments, will nevertheless remain at
€80,000,000. In effect, the repayment date of the Term Facility was extended to December 31, 2021
and a new and better annual interest rate was obtained for both the Term Facility and the Revolving
Facility which are indexed to the performance of the EURIBOR or the LIBOR for the USD tranche.
Also in January and February 2017, the parent negotiated amendments to certain terms and
conditions of the €120,000,000 non-convertible bonds, moving the due date to March 28, 2023 and
obtaining a better fixed rate at 3.25% instead of the previous 3.875%.
On July 28, 2017:
(i) the Intercos S.p.A. shares held by DAFE 3000 S.r.l. were converted into Class A shares, like
those held by DAFE 4000 S.p.A. and DAFE 5000 S.r.l.;
(ii) the Intercos S.p.A. share capital increase was approved, against payment, without exclusion of
the option right (but the exercise of it was waived by all other shareholders), issued and
subscribed at par value and, therefore, without a share premium, for 922,423 Intercos S.p.A.
Class C shares at a price per share of €0.1172824182. This share capital increase was thus equal
to a total of €108,184, bringing the total amount of Intercos S.p.A. to €10,818 thousand
compared to the previous €10,710 thousand).
On August 3, 2017, Intercos S.p.A. finalized the transaction for the acquisition of the entire share
capital of Cosmint Group S.p.A., which, in turn, owns the entire share capital of Cosmint S.p.A.,
30
Sodisco S.r.l. and Tatra Spring Polska Sp. Zoo. (a Polish-registered company). The agreement was
signed with Futura Società Semplice”, sole shareholder of Cosmint Group S.p.A., and with Messrs.
Decio Masu, Alessandro Masu and. Massimiliano Masu (who control Futura).
Intercos S.p.A. also asked and received, in July, approval from the financing banks to conclude the
above described transaction. In addition, the German Antitrust Authority, on July 13, 2017, gave its
approval to the acquisition, affirming that it does not carry the requisites that would impose a veto on
proceeding with the transaction pursuant to art. 36, paragraph 1 of the German Antitrust Law.
As part of the acquisition, Intercos S.p.A. offered Cosmint Group the possibility of securing short-,
medium- and long-term financing at the same terms applied to the Intercos Group, refinancing by
October 31 Cosmint Group S.p.A.’s entire existing debt, and that of its subsidiaries Cosmint S.p.A.
and Sodisco S.r.l., except for the debt on finance lease contracts. The transaction was in fact
concluded on September 29 with a new credit line granted to Cosmint Group for €24,000,000 by a
syndicate of financing banks, with a final due date of December 31, 2021.
In September 2017, the two audits by the financial police begun on June 16, 2015 reached positive
conclusions: (a) the first, relating to the presumed establishment of an offshore company to avoid
taxes by Intercos America Inc., for which the auditors noted neither any exception nor formal or
substantive violation, therefore no expenses were levied or charges brought against the subsidiary; (b)
the second, regarding the statement of findings issued on September 28, 2017 and indicating a higher
taxable income by Intercos S.p.A, will be submitted by the financial police to the Revenues Agency.
On October 16, 2017, the shareholders of Intercos S.p.A., Dafe 4000 S.p.A., Dafe 5000 S.r.l. and
CP7 Beauty Luxco S.à r.l. finalized the August 4, 2017 sale of a minority stake in Intercos S.p.A.,
equal to 20.588%, to Innovation Trust, the beneficiary of which are fully owned by Ontario
Teachers’ Pension Plan Board. The shareholders of Intercos S.p.A. are now represented by: Dafe
3000 S.r.l. (0.221%), Dafe 4000 S.p.A. (31.930%), Dafe 5000 S.r.l. (12.271%), CP7 Beauty Luxco S.à
r.l. (33.746%), Innovation Trust (20.588%) and managers of the company (1.243%).
Dario Ferrari retains the majority of voting rights in the company (by virtue of multiple voting rights
equal to 1.3 votes per share) and the right to appoint the majority of Intercos’ directors.
The investment of the Ontario Teachers’ Pension Plan, the largest professional pension fund in
Canada, reinforces Intercos’ shareholder base and its ability to maintain a dynamic development plan.

31
INTERCOS GROUP Global Cosmetic Manufacturer
INTERIM CONSOLIDATED FINANCIAL
STATEMENTS
AT SEPTEMBER 30, 2017

32
Interim Consolidated Statement of Financial Position at September 30, 2017 – unaudited
(in € thousands) Note September 30,
2017
December 31,
2016
ATTIVITÀ
NON-CURRENT ASSETS
Property, plant and equipment 1 136,989 96,806
Intangible assets 2 25,107 24,509
Goodwill 118,251 76,765
Investments 5 5,153 4,697
Deferred tax assets 5 15,727 16,768
Other non-current receivables 5 6,881 7,241
Non-current assets 308,107 226,788
CURRENT ASSETS
Inventories 4 116,920 83,296
Trade receivables 4 139,563 92,834
Other current assets 8,256 9,301
Derivatives 277 -
Cash and cash equivalents 5 50,497 64,525
Current assets 315,513 249,957
TOTAL ASSETS 623,620 476,745
EQUITY
Share capital 10,818 10,710
Other reserves 66,005 66,005
Retained earnings 71,514 58,424
Equity attributable to owners of the parent 148,338 135,139
Equity attributable to non-controlling interests 2,366 2,354
TOTAL EQUITY 4 150,704 137,493
LIABILITIES
NON-CURRENT LIABILITIES
Borrowings from banks and other lenders 3 227,220 163,063
Provisions 4 1,660 1,079
Deferred tax liabilities 5 7,597 8,459
Other non-current liabilities 5 824 182
Employee benefit obligations 4 10,202 8,621
Non-current liabilities 247,503 181,403
CURRENT LIABILITIES
Borrowings from banks and other lenders 3 33,848 33,667
Other financial payables 3 37,398 631
Trade payables 5 116,307 89,846
Other current liabilities 5 37,860 33,704
Current liabilities 225,412 157,848
-
TOTAL EQUITY AND LIABILITIES 623,620 476,745

33
Interim Consolidated Income Statement for the nine months ended September 30, 2017 - unaudited
(in € thousands) Note 9 months ended
September 30, 2017 9 months ended
September 30, 2016
Revenues 6 418,616 315,327
Cost of sales 7 (318,533) (243,104)
Industrial gross margin
100,083 72,223
Research & Development and innovation costs
(23,871) (19,531)
Selling expenses
(17,353) (14,543)
General and administrative expenses
(18,789) (17,312)
Other operating income (expenses)
3,435 3,098
Result from investments accounted for using the equity method(operating)
(1,193) (574)
Nonrecurring income (expenses)
(1,498) 1,110
Operating profit (EBIT) 7 40,813 24,471
Financial income
3,401 3,547
Financial expenses
(12,171) (11,415)
Result from investments accounted for using the equity method
35 29
Profit before taxes (EBT) 7 32,077 16,632
Income taxes
(11,478) (7,934)
Profit for the period 7 20,600 8,697
Attributable to: - owners of the parent 20,479 8,380
- non-controlling interests 121 317
Earnings per share: Basic and diluted
0.23 0.10
Interim Consolidated Statement of Comprehensive Income – unaudited
(in € thousands)
9 months ended September 30, 2017
9 months ended September 30, 2016
Net profit 7 20,600 8,697
Other comprehensive income that will not be reclassified subsequently to the income statement, net of tax effect - Actuarial gains (losses) on remeasurement of defined benefit plans
(16) (1,277)
- Tax effect
(13) 425
Actuarial losses, net of tax effect
(29) (852)
Other comprehensive income that will be reclassified subsequently to the income statement, net of tax effect - Exchange differences on translating foreign operations (7,037) (1,983)
Exchange differences on translating foreign operations (7,037) (1,983)
- Cash flow hedge
(366) -
- Tax effect
88 -
Cash flow hedge, net of tax effect (278) -
Comprehensive income for the period 13,256 5,862
Attributable to:
- owners of the parent 13,171 5,716 - non-controlling interests 85 146
34
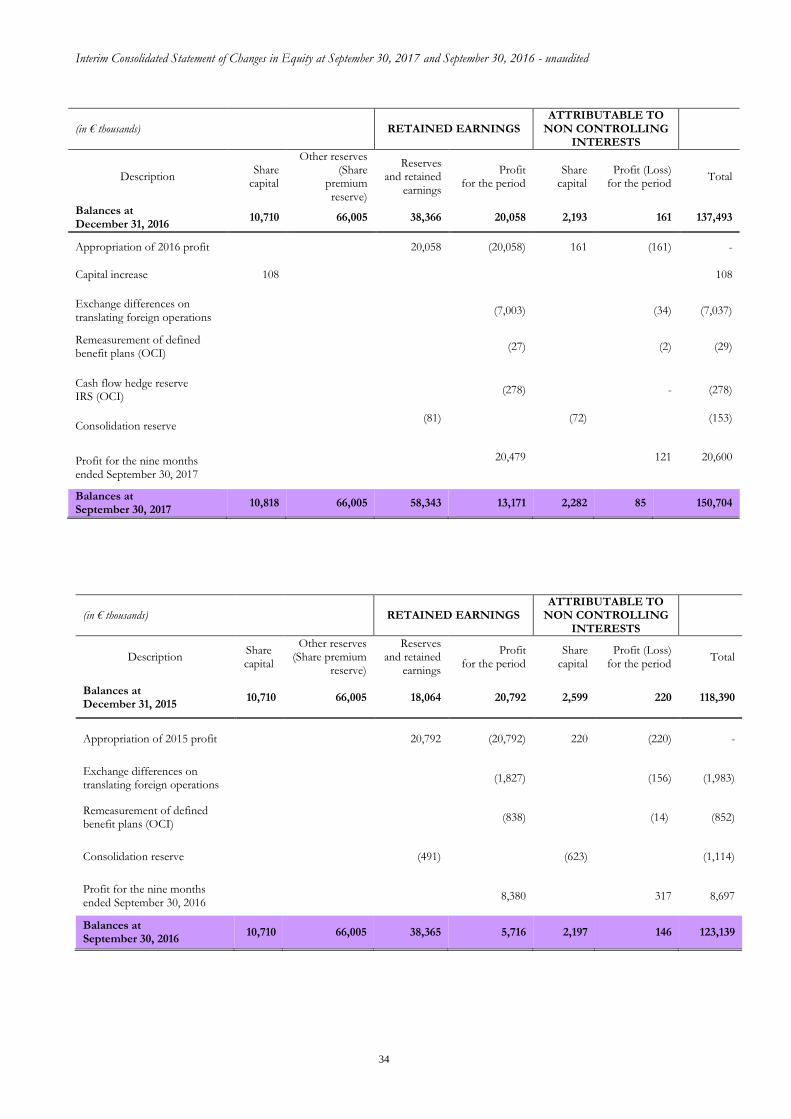
Interim Consolidated Statement of Changes in Equity at September 30, 2017 and September 30, 2016 - unaudited
(in € thousands) RETAINED EARNINGS ATTRIBUTABLE TO
NON CONTROLLING INTERESTS
Description Share
capital
Other reserves (Share
premium reserve)
Reserves and retained
earnings
Profit for the period
Share capital
Profit (Loss) for the period
Total
Balances at December 31, 2016
10,710 66,005 38,366 20,058 2,193 161 137,493
Appropriation of 2016 profit 20,058 (20,058) 161 (161) -
Capital increase 108 108
Exchange differences on translating foreign operations
(7,003) (34) (7,037)
Remeasurement of defined benefit plans (OCI)
(27) (2) (29)
Cash flow hedge reserve IRS (OCI)
(278) - (278)
Consolidation reserve (81) (72) (153)
Profit for the nine months ended September 30, 2017
20,479 121 20,600
Balances at September 30, 2017
10,818 66,005 58,343 13,171 2,282 85 150,704
(in € thousands) RETAINED EARNINGS ATTRIBUTABLE TO
NON CONTROLLING INTERESTS
Description Share capital
Other reserves (Share premium
reserve)
Reserves and retained
earnings
Profit for the period
Share capital
Profit (Loss) for the period
Total
Balances at December 31, 2015
10,710 66,005 18,064 20,792 2,599 220 118,390
Appropriation of 2015 profit 20,792 (20,792) 220 (220) -
Exchange differences on translating foreign operations
(1,827) (156) (1,983)
Remeasurement of defined benefit plans (OCI)
(838) (14) (852)
Consolidation reserve (491) (623) (1,114)
Profit for the nine months ended September 30, 2016
8,380 317 8,697
Balances at September 30, 2016
10,710 66,005 38,365 5,716 2,197 146 123,139
35
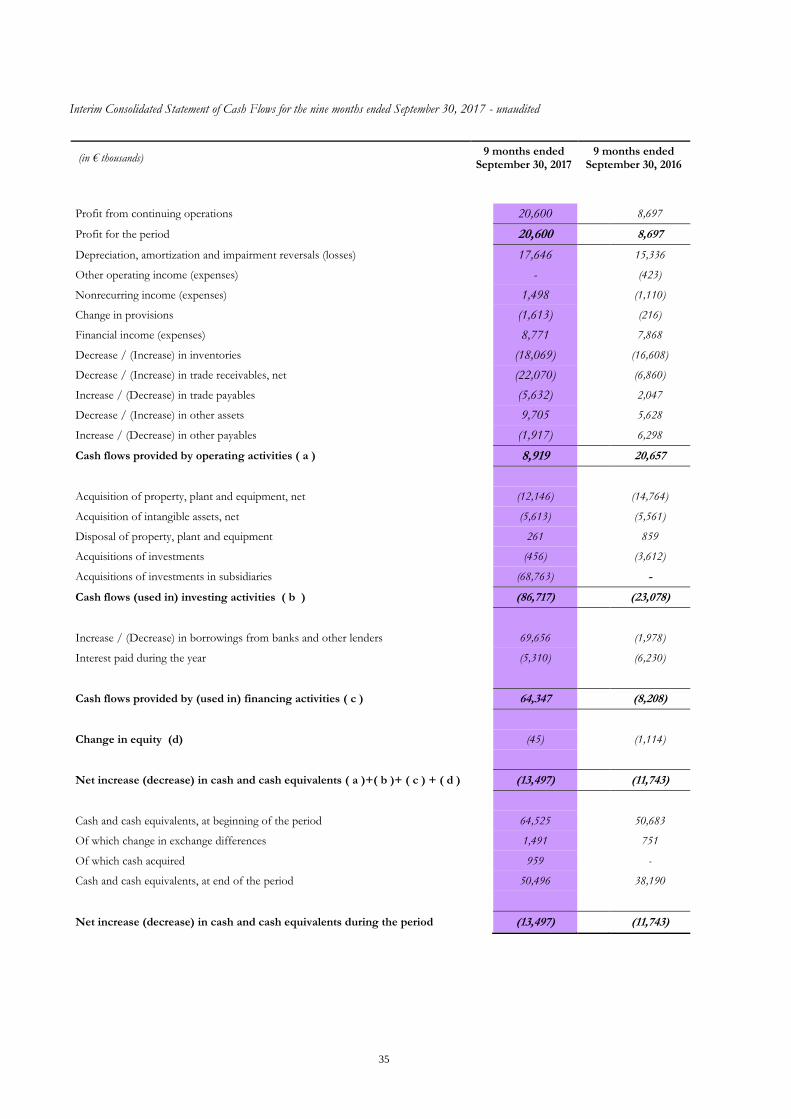
Interim Consolidated Statement of Cash Flows for the nine months ended September 30, 2017 - unaudited
(in € thousands) 9 months ended
September 30, 2017 9 months ended
September 30, 2016
Profit from continuing operations
20,600
8,697
Profit for the period
20,600 8,697
Depreciation, amortization and impairment reversals (losses)
17,646
15,336
Other operating income (expenses)
-
(423)
Nonrecurring income (expenses)
1,498
(1,110)
Change in provisions
(1,613)
(216)
Financial income (expenses)
8,771
7,868
Decrease / (Increase) in inventories
(18,069)
(16,608)
Decrease / (Increase) in trade receivables, net
(22,070)
(6,860)
Increase / (Decrease) in trade payables
(5,632)
2,047
Decrease / (Increase) in other assets
9,705
5,628
Increase / (Decrease) in other payables
(1,917)
6,298
Cash flows provided by operating activities ( a )
8,919 20,657
Acquisition of property, plant and equipment, net
(12,146)
(14,764)
Acquisition of intangible assets, net
(5,613)
(5,561)
Disposal of property, plant and equipment
261
859
Acquisitions of investments
(456)
(3,612)
Acquisitions of investments in subsidiaries
(68,763)
-
Cash flows (used in) investing activities ( b )
(86,717)
(23,078)
Increase / (Decrease) in borrowings from banks and other lenders
69,656
(1,978)
Interest paid during the year
(5,310)
(6,230)
Cash flows provided by (used in) financing activities ( c )
64,347
(8,208)
Change in equity (d)
(45)
(1,114)
Net increase (decrease) in cash and cash equivalents ( a )+( b )+ ( c ) + ( d )
(13,497)
(11,743)
Cash and cash equivalents, at beginning of the period
64,525
50,683
Of which change in exchange differences
1,491
751
Of which cash acquired
959
-
Cash and cash equivalents, at end of the period
50,496
38,190
Net increase (decrease) in cash and cash equivalents during the period
(13,497)
(11,743)