Intercomparison of reflectances observed by GOME and SCIAMACHY in the visible wavelength range
7
Intercomparison of reflectances observed by GOME and SCIAMACHY in the visible wavelength range Lieuwe G. Tilstra and Piet Stammes We compare the Earth reflectances of the spectrometers Global Ozone Monitoring Experiment (GOME) and Scanning Imaging Absorption Spectrometer for Atmospheric Chartography (SCIAMACHY) over their overlapping wavelength range 240–800 nm. The goal is to investigate the quality of the radio- metric calibration of SCIAMACHY using calibrated GOME data as a reference. However, severe degra- dation of the GOME instrument in the UV since 2001 prevents it from being a reliable reference below 500 nm. Above 500 nm, GOME is reliable and we find substantial disagreement between GOME and SCIAMACHY, of the order of 15%–20%, which we can attribute completely to the current calibration problems of SCIAMACHY. These numbers are supported by a previous study in which SCIAMACHY was compared with the imager Medium Resolution Imaging Spectrometer (MERIS) onboard the Envisat satellite. © 2006 Optical Society of America OCIS codes: 280.0280, 010.0010. 1. Introduction Absolute calibration of the reflectance is important for a number of atmospheric products that are re- trieved from measurements by the satellite UV– visible spectrometers Global Ozone Monitoring Experiment (GOME), 1 Scanning Imaging Absorp- tion Spectrometer for Atmospheric Chartography (SCIAMACHY), 2 and Ozone Monitoring Instru- ment. 3 Although retrievals of column densities of trace gases, such as ozone and NO 2 using the differ- ential optical absorption spectroscopy method, 4 are insensitive to errors in the absolute calibration of the reflectance, other products, such as the retrieval of the vertical distribution of ozone, 5–10 the retrieval of cloud properties, 11,12 and aerosol retrieval 13 are highly sensitive. For these retrievals a thorough pre- flight instrument calibration and an in-flight instru- ment monitoring to follow the degradation of the optics are both essential. In-flight calibration, whether it is to monitor the effects of degradation or to correct preflight calibration errors, or shifts in these calibrations after launch, can be performed in a number of ways. First, a common approach for reflectance validation is that of satellite intercomparison. This of course requires one of the instruments to have a known calibration accuracy. Second, radiative transfer models can be used in com- bination with certain target sites (usually cloud-free desert sites) when the site’s simulated reflectance is compared with that measured by the satellite instru- ment in question. 14 These comparisons may even be automatized to cover a larger set of observations over a larger period of time. 15 This paper is devoted to a satellite intercomparison between two spectrometers, namely, GOME 1 onboard the ERS-2 satellite and SCIAMACHY 2 onboard the Envisat satellite. The higher spatial resolution of SCIAMACHY allows a reflectance comparison with high accuracy, provided that we restrict ourselves to scenes without clouds with a homogeneous surface. Studies like this, involving a comparison between GOME and SCIAMACHY, have been attempted be- fore, 16 but they were not as extensive as the present work. The outline of the paper is as follows. Section 2 introduces the two spectrometers, GOME and SCIAMACHY. In Section 3 we introduce the applied method of comparing the two spectrometers and present the results. Sections 4 and 5 deal with two complications that affect the accuracy of this specific comparison: degradation of the optics of the GOME instrument and the time delay between the over- passes of the two satellites that alters the scattering The authors are with the Royal Netherlands Meteorological In- stitute, P.O. Box 201, NL-3730 AE De Bilt, The Netherlands. L. G. Tilstra’s e-mail address is [email protected]. Received 11 August 2005; revised 18 November 2005; accepted 22 December 2005; posted 11 January 2006 (Doc. ID 64073). 0003-6935/06/174129-07$15.00/0 © 2006 Optical Society of America 10 June 2006 Vol. 45, No. 17 APPLIED OPTICS 4129
Transcript of Intercomparison of reflectances observed by GOME and SCIAMACHY in the visible wavelength range

Intercomparison of reflectances observed by GOMEand SCIAMACHY in the visible wavelength range
Lieuwe G. Tilstra and Piet Stammes
We compare the Earth reflectances of the spectrometers Global Ozone Monitoring Experiment (GOME)and Scanning Imaging Absorption Spectrometer for Atmospheric Chartography (SCIAMACHY) overtheir overlapping wavelength range �240–800 nm�. The goal is to investigate the quality of the radio-metric calibration of SCIAMACHY using calibrated GOME data as a reference. However, severe degra-dation of the GOME instrument in the UV since 2001 prevents it from being a reliable reference below500 nm. Above 500 nm, GOME is reliable and we find substantial disagreement between GOME andSCIAMACHY, of the order of 15%–20%, which we can attribute completely to the current calibrationproblems of SCIAMACHY. These numbers are supported by a previous study in which SCIAMACHY wascompared with the imager Medium Resolution Imaging Spectrometer (MERIS) onboard the Envisatsatellite. © 2006 Optical Society of America
OCIS codes: 280.0280, 010.0010.
1. Introduction
Absolute calibration of the reflectance is importantfor a number of atmospheric products that are re-trieved from measurements by the satellite UV–visible spectrometers Global Ozone MonitoringExperiment (GOME),1 Scanning Imaging Absorp-tion Spectrometer for Atmospheric Chartography(SCIAMACHY),2 and Ozone Monitoring Instru-ment.3 Although retrievals of column densities oftrace gases, such as ozone and NO2 using the differ-ential optical absorption spectroscopy method,4 areinsensitive to errors in the absolute calibration of thereflectance, other products, such as the retrieval ofthe vertical distribution of ozone,5–10 the retrieval ofcloud properties,11,12 and aerosol retrieval13 arehighly sensitive. For these retrievals a thorough pre-flight instrument calibration and an in-flight instru-ment monitoring to follow the degradation of theoptics are both essential.
In-flight calibration, whether it is to monitor theeffects of degradation or to correct preflight calibrationerrors, or shifts in these calibrations after launch, can
be performed in a number of ways. First, a commonapproach for reflectance validation is that of satelliteintercomparison. This of course requires one of theinstruments to have a known calibration accuracy.Second, radiative transfer models can be used in com-bination with certain target sites (usually cloud-freedesert sites) when the site’s simulated reflectance iscompared with that measured by the satellite instru-ment in question.14 These comparisons may even beautomatized to cover a larger set of observations overa larger period of time.15
This paper is devoted to a satellite intercomparisonbetween two spectrometers, namely, GOME1 onboardthe ERS-2 satellite and SCIAMACHY2 onboard theEnvisat satellite. The higher spatial resolution ofSCIAMACHY allows a reflectance comparison withhigh accuracy, provided that we restrict ourselves toscenes without clouds with a homogeneous surface.Studies like this, involving a comparison betweenGOME and SCIAMACHY, have been attempted be-fore,16 but they were not as extensive as the presentwork.
The outline of the paper is as follows. Section 2introduces the two spectrometers, GOME andSCIAMACHY. In Section 3 we introduce the appliedmethod of comparing the two spectrometers andpresent the results. Sections 4 and 5 deal with twocomplications that affect the accuracy of this specificcomparison: degradation of the optics of the GOMEinstrument and the time delay between the over-passes of the two satellites that alters the scattering
The authors are with the Royal Netherlands Meteorological In-stitute, P.O. Box 201, NL-3730 AE De Bilt, The Netherlands. L. G.Tilstra’s e-mail address is [email protected].
Received 11 August 2005; revised 18 November 2005; accepted22 December 2005; posted 11 January 2006 (Doc. ID 64073).
0003-6935/06/174129-07$15.00/0© 2006 Optical Society of America
10 June 2006 � Vol. 45, No. 17 � APPLIED OPTICS 4129

geometry. Finally, a short summary of the results isgiven in Section 6.
2. Description of GOME and SCIAMACHY
A. GOME
GOME1 was launched in April 1995 as a small-scaleversion of the spectrometer SCIAMACHY.2 GOME,onboard ERS-2, measures the Earth’s radiance andthe solar irradiance in the UV–visible spectralrange of 240–795 nm at a spectral resolution of0.2–0.4 nm. The ERS-2 satellite is in a near-polar,Sun-synchronous orbit with an orbital period ofaround 100 min. The local crossing time of the de-scending node at the equator is 10:30 a.m.
During its flight, GOME is observing the Earth inthe along-track direction by the movement of the sat-ellite and in the across-track direction by the move-ment of its scan mirror. This mirror scans back andforth in a time period of 6.0 s, of which 4.5 s are spentscanning in the forward direction, when the instru-ment is scanning the Earth’s surface from east towest. After this forward scan, a fast reverse scantakes the mirror back to its starting position. De-pending on the scan direction, the swath is eithercomprised of three forward pixels, called east, nadir,and west (forward scan) or of one large backscan pixel(backward scan). The forward pixels cover approxi-mately 320 km � 40 km of area; the backscan pixelscover roughly 960 km � 40 km. Global coverage ofthe Earth is achieved in a 3 day period.
The main level 2 products of GOME are the globaldistributions of total column amounts of ozone andNO2. Other products that have been successfully ex-tracted from the data are the trace gases OCIO, SO2,H2CO, and BrO; cloud properties; aerosol presence;and ozone vertical profiles.
B. SCIAMACHY
SCIAMACHY2 was launched on 1 March 2002 on-board the Envisat satellite. Like GOME, it waslaunched into a near-polar, Sun-synchronous orbit,with an identical orbital period of �100 min. Thelocal crossing time of the equator is 10:00 a.m., soSCIAMACHY observes a certain ground scene 30min in advance of GOME. A major difference withrespect to GOME is that SCIAMACHY has the abilityto perform not only nadir measurements but alsolimb measurements. These two measurement modesare being alternated along the orbit. The resultingdata are stored in blocks, called states. A nadir statecovers an area of 960 km � 490 km (across trackmultiplied by along track).
The wavelength region covered by SCIAMACHYis 240–2380 nm, with a spectral resolution of0.2–1.5 nm. The scanning sequence is similar to thatof GOME: 4 s forward scan and a fast reverse scan in1 s. The swath is 960 km wide, equal to that ofGOME. A major difference with GOME is that thenadir spectrum is divided into 56 wavelength regions,called clusters, that are all read out with their ownintegration time (IT). This allows a higher spatial
resolution for the most important spectral regions, atthe expense of other wavelength regions where thespectrum is of less scientific interest or would other-wise yield a weak signal. Typical ITs are 0.25 s (pixelsize, 60 km � 30 km) and 1.0 s (pixel size, 240 km� 30 km), but 0.125, 0.5, 5, and 10 s are also used.Because of the alternation of nadir and limb modes,global coverage is achieved in only 6 days instead of3 days for the GOME instrument.
As for the level 2 products of SCIAMACHY, theextension of the Earth’s radiance spectrum to wave-lengths above 800 nm enables the detection of tracegases absorbing in the near IR, including CO, CO2,CH4, and N2O. The limb measuring mode enablesmeasurements of the vertical distribution of all re-trieved trace gases.
3. Intercomparison
A. Method
The method we use relies on the fact that the spatialresolution of the SCIAMACHY instrument is generallyhigher than that of GOME (see Section 2). This makesit possible to create almost identical areas covered byGOME and SCIAMACHY pixels and to directly com-pare the associated top-of-the-atmosphere (TOA)reflectances with each other. In this paper the reflec-tance is defined as
R ��I
�0E, (1)
where I is the TOA radiance reflected by the Earth’satmosphere (in Wm�2 nm�1 sr�1), E is the incidentextra-atmospheric solar irradiance at the TOA per-pendicular to the solar beam (in Wm�2 nm�1), and �0is the cosine of the solar zenith angle �0.
The procedure for comparing the reflectances is ex-plained more clearly in Fig. 1. Here we have plotted thecoverage of two SCIAMACHY states, taken from orbit2509 dated 23 August 2002. For the upper state weplotted the pixels of the wavelength clusters measuredwith a 1.0 s IT; in the lower state the pixels are thoseof the 0.25 s IT clusters. Not shown are the individualGOME pixels, which are from orbit 38,381. However,the black box in the lower state indicates the area thatis being covered by nine subsequent GOME nadir pix-els. Its size is approximately 320 km � 410 km. Forthis area, we can calculate a mean GOME reflec-tance.
To arrive at a similar SCIAMACHY reflectance ofthe same region, the area is tessellated with theavailable SCIAMACHY pixels. The overlap fractionof the SCIAMACHY pixels with the GOME area isrecorded and serves as a weighting factor for thecalculation of the mean SCIAMACHY reflectance.Within the uncertainty of this method of comparison,the GOME and SCIAMACHY reflectances should beidentical if both instruments are calibrated correctly.Figure 2 shows the result of a reflectance comparisonof a nadir area over part of the Sahara Desert.
4130 APPLIED OPTICS � Vol. 45, No. 17 � 10 June 2006

B. Accuracy
There are a number of aspects that determine theaccuracy of this type of comparison. First, the tes-sellation procedure itself is a source of errors be-cause the SCIAMACHY pixels do not perfectlymatch the GOME area (see Fig. 1). This is correctedfor homogeneous scenes by counting only the frac-tion of the SCIAMACHY pixels that are inside theGOME region. However, this does not account for apossible inhomogeneity over the area covered by theSCIAMACHY pixels. We estimate the error in thereflectance due to this mismatch to be less than a
few percent. However, this error is reduced consid-erably over homogeneous scenes.
The second source of error is caused by scenechanges in the time period of 30 min between theoverpasses of GOME and SCIAMACHY. These scenechanges are mostly caused by the movement ofclouds. In the pessimistic case of a thick cloud (spec-tral albedo of �0.8) entering a cloud-free ocean scene(TOA albedo of �0.1) with a speed of �60 km�h andcovering 3 of the 55 SCIAMACHY pixels (see Fig. 1),this would result in an error of roughly 3�55� �0.8–0.1� � 4% in the GOME–SCIAMACHY com-parison. For this reason, clouded scenes were avoidedin the comparison.
Third, because of the same time delay, the solarangles with respect to the ground scene are differentfor GOME and SCIAMACHY. We will study the con-sequences of this effect in Section 5. For the momentit is sufficient to know that the effects will turn out tobe small.
C. Results
Figure 3 shows the main result of the reflectancecomparison presented in this paper. On the verticalaxis we plotted the ratio of the reflectances of GOMEand SCIAMACHY for the three viewing directions (orpixel types) of GOME (east, nadir, west). We usedSCIAMACHY orbit 2509, dated 23 August 2002, andGOME orbit 38,381, of the same day, following thetrack of the SCIAMACHY orbit. The GOME datawere generated by processor version 2.10; theSCIAMACHY data were produced by software ver-sion 5.00. We focused on a region over the SaharaDesert, shown in Fig. 1, which was unclouded at thetime of measurement. Furthermore, the surface al-bedo is more or less constant over the area, whichimproves the accuracy of the comparison.
The result of Fig. 3 shows that there is disagreementbetween GOME and SCIAMACHY over the entirewavelength range. Above �500 nm, the ratios of dif-ferent viewing directions are equal, at least within
Fig. 1. Method used to compare the reflectances measured byGOME and SCIAMACHY. The picture shows two blocks ofSCIAMACHY data (these blocks are called states). In the upperstate we plotted SCIAMACHY pixels of 1.0 s IT. In the lower statewe selected SCIAMACHY pixels of 0.25 s IT and we combined ninesubsequent nadir GOME ground pixels into an area of �320 km �410 km (delineated by thick black lines), yielding an accumulatedmean GOME reflectance. This region is then tessellated withSCIAMACHY ground pixels in such a way that the relative con-tribution of a ground pixel to the accumulated SCIAMACHY re-flectance is proportional to its overlap with the GOME area. Afterthis, the two reflectances may be compared.
Fig. 2. Reflectances measured by SCIAMACHY and GOME as a function of wavelength for the same Earth scene over part of the SaharaDesert (see Fig. 1). The SCIAMACHY reflectance is systematically lower than the GOME reflectance by typically 20%, depending on thewavelength. Note that there are no signs of an etalon effect in the GOME reflectance (compare with Fig. 4), which would have been thecase if we had used the official, out-of-date solar irradiance spectrum.
10 June 2006 � Vol. 45, No. 17 � APPLIED OPTICS 4131
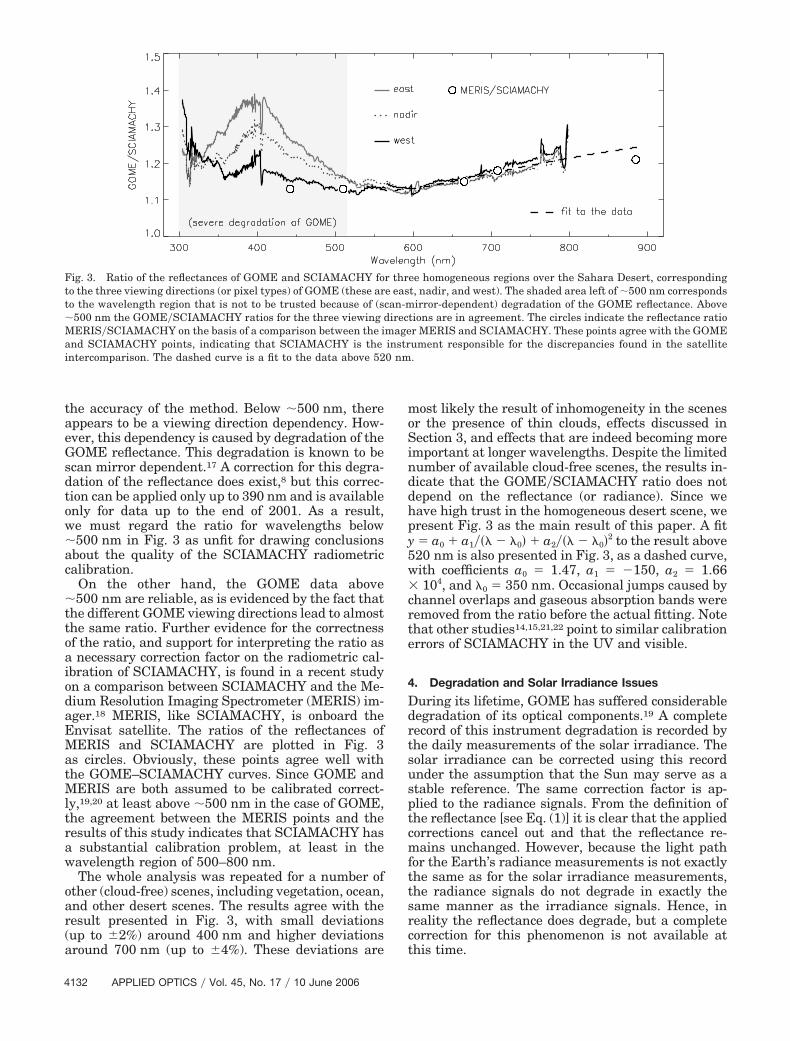
the accuracy of the method. Below �500 nm, thereappears to be a viewing direction dependency. How-ever, this dependency is caused by degradation of theGOME reflectance. This degradation is known to bescan mirror dependent.17 A correction for this degra-dation of the reflectance does exist,8 but this correc-tion can be applied only up to 390 nm and is availableonly for data up to the end of 2001. As a result,we must regard the ratio for wavelengths below�500 nm in Fig. 3 as unfit for drawing conclusionsabout the quality of the SCIAMACHY radiometriccalibration.
On the other hand, the GOME data above�500 nm are reliable, as is evidenced by the fact thatthe different GOME viewing directions lead to almostthe same ratio. Further evidence for the correctnessof the ratio, and support for interpreting the ratio asa necessary correction factor on the radiometric cal-ibration of SCIAMACHY, is found in a recent studyon a comparison between SCIAMACHY and the Me-dium Resolution Imaging Spectrometer (MERIS) im-ager.18 MERIS, like SCIAMACHY, is onboard theEnvisat satellite. The ratios of the reflectances ofMERIS and SCIAMACHY are plotted in Fig. 3as circles. Obviously, these points agree well withthe GOME–SCIAMACHY curves. Since GOME andMERIS are both assumed to be calibrated correct-ly,19,20 at least above �500 nm in the case of GOME,the agreement between the MERIS points and theresults of this study indicates that SCIAMACHY hasa substantial calibration problem, at least in thewavelength region of 500–800 nm.
The whole analysis was repeated for a number ofother (cloud-free) scenes, including vegetation, ocean,and other desert scenes. The results agree with theresult presented in Fig. 3, with small deviations(up to �2%) around 400 nm and higher deviationsaround 700 nm (up to �4%). These deviations are
most likely the result of inhomogeneity in the scenesor the presence of thin clouds, effects discussed inSection 3, and effects that are indeed becoming moreimportant at longer wavelengths. Despite the limitednumber of available cloud-free scenes, the results in-dicate that the GOME�SCIAMACHY ratio does notdepend on the reflectance (or radiance). Since wehave high trust in the homogeneous desert scene, wepresent Fig. 3 as the main result of this paper. A fity � a0 � a1�� � 0� � a2�� � 0�2 to the result above520 nm is also presented in Fig. 3, as a dashed curve,with coefficients a0 � 1.47, a1 � �150, a2 � 1.66� 104, and 0 � 350 nm. Occasional jumps caused bychannel overlaps and gaseous absorption bands wereremoved from the ratio before the actual fitting. Notethat other studies14,15,21,22 point to similar calibrationerrors of SCIAMACHY in the UV and visible.
4. Degradation and Solar Irradiance Issues
During its lifetime, GOME has suffered considerabledegradation of its optical components.19 A completerecord of this instrument degradation is recorded bythe daily measurements of the solar irradiance. Thesolar irradiance can be corrected using this recordunder the assumption that the Sun may serve as astable reference. The same correction factor is ap-plied to the radiance signals. From the definition ofthe reflectance [see Eq. (1)] it is clear that the appliedcorrections cancel out and that the reflectance re-mains unchanged. However, because the light pathfor the Earth’s radiance measurements is not exactlythe same as for the solar irradiance measurements,the radiance signals do not degrade in exactly thesame manner as the irradiance signals. Hence, inreality the reflectance does degrade, but a completecorrection for this phenomenon is not available atthis time.
Fig. 3. Ratio of the reflectances of GOME and SCIAMACHY for three homogeneous regions over the Sahara Desert, correspondingto the three viewing directions (or pixel types) of GOME (these are east, nadir, and west). The shaded area left of �500 nm correspondsto the wavelength region that is not to be trusted because of (scan-mirror-dependent) degradation of the GOME reflectance. Above�500 nm the GOME�SCIAMACHY ratios for the three viewing directions are in agreement. The circles indicate the reflectance ratioMERIS�SCIAMACHY on the basis of a comparison between the imager MERIS and SCIAMACHY. These points agree with the GOMEand SCIAMACHY points, indicating that SCIAMACHY is the instrument responsible for the discrepancies found in the satelliteintercomparison. The dashed curve is a fit to the data above 520 nm.
4132 APPLIED OPTICS � Vol. 45, No. 17 � 10 June 2006
Another issue is the fact that, since October 2001,solar irradiances measured by GOME are affected by apointing problem of the ERS-2 platform. As a result,the official data of the orbit we used contains Earth’sradiance data of the day of measurement (in this case23 August 2002), but a solar irradiance spectrum from16 October 2001. However, using the raw GOME solarirradiance measurements for 22 August 2002, lessthan one day before the GOME orbit of the comparisonof Section 3, we were able to construct a proper solarirradiance spectrum. This solar irradiance spectrum isthe one that is used in the comparison.
Figure 4 shows the ratio between the solar irradi-ance spectrum measured on 22 August 2002 and theofficial solar irradiance spectrum, which is from 16October 2001. Different types of gray are used to dis-tinguish the four spectral channels of the GOME spec-trometer. The first conclusion is that the differencebetween the two solar spectra is quite large �10%�below �500 nm. Second, the ratio contains oscilla-tions. This behavior is caused by what is known asthe etalon effect, which is spectral interference by agrowing ice layer on top of the detector pixels.
This etalon effect is present in all GOME reflec-tance spectra after October 2001, unless a recent so-lar irradiance spectrum is used. Note that with ourapproach we do remove the etalon effect from thespectra, but we do not remove all types of degradationin the reflectance. Especially in the UV there is ascan-mirror-dependent degradation in the GOME re-flectance, shown in Fig. 3 and reported by Van der Aet al.8 For that reason, in Section 3 we focused ourcomparison on the wavelength region of 500–800 nm,where GOME does not suffer much from the effects ofdegradation. For SCIAMACHY, degradation is notreally an issue because the instrument has proved tobe stable and the data we use are from only half of ayear after the launch.
5. Effect of a Different Solar Geometry
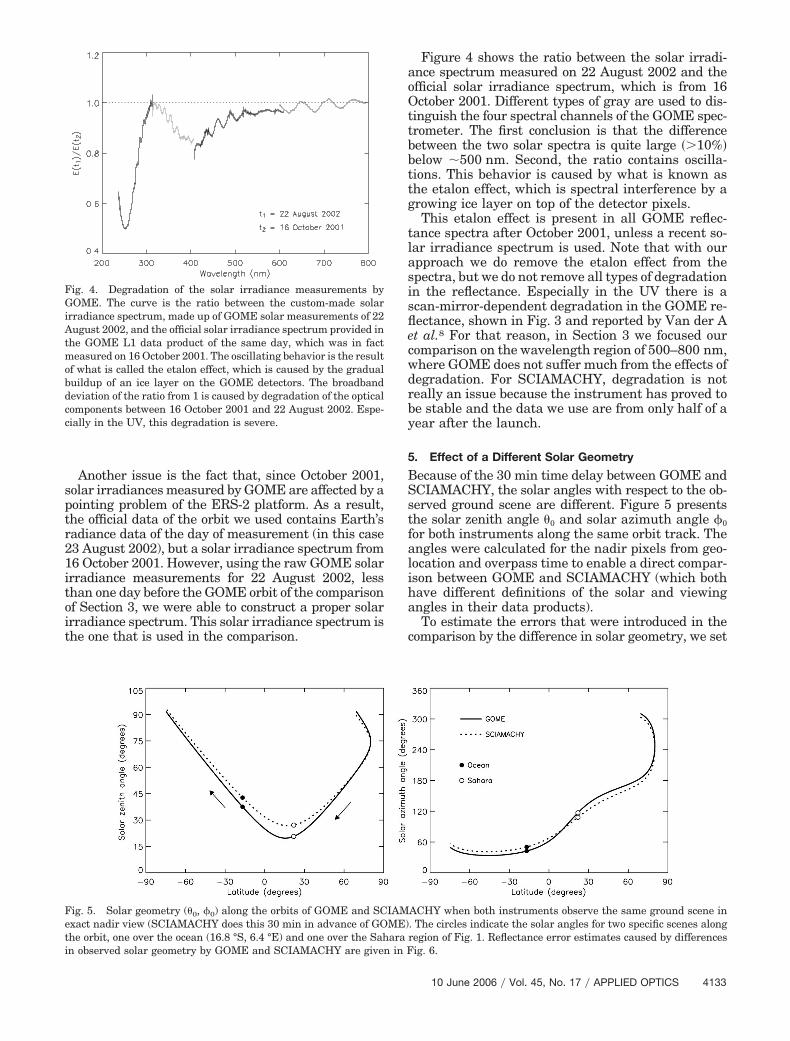
Because of the 30 min time delay between GOME andSCIAMACHY, the solar angles with respect to the ob-served ground scene are different. Figure 5 presentsthe solar zenith angle �0 and solar azimuth angle �0for both instruments along the same orbit track. Theangles were calculated for the nadir pixels from geo-location and overpass time to enable a direct compar-ison between GOME and SCIAMACHY (which bothhave different definitions of the solar and viewingangles in their data products).
To estimate the errors that were introduced in thecomparison by the difference in solar geometry, we set
Fig. 4. Degradation of the solar irradiance measurements byGOME. The curve is the ratio between the custom-made solarirradiance spectrum, made up of GOME solar measurements of 22August 2002, and the official solar irradiance spectrum provided inthe GOME L1 data product of the same day, which was in factmeasured on 16 October 2001. The oscillating behavior is the resultof what is called the etalon effect, which is caused by the gradualbuildup of an ice layer on the GOME detectors. The broadbanddeviation of the ratio from 1 is caused by degradation of the opticalcomponents between 16 October 2001 and 22 August 2002. Espe-cially in the UV, this degradation is severe.
Fig. 5. Solar geometry (�0, �0) along the orbits of GOME and SCIAMACHY when both instruments observe the same ground scene inexact nadir view (SCIAMACHY does this 30 min in advance of GOME). The circles indicate the solar angles for two specific scenes alongthe orbit, one over the ocean (16.8 °S, 6.4 °E) and one over the Sahara region of Fig. 1. Reflectance error estimates caused by differencesin observed solar geometry by GOME and SCIAMACHY are given in Fig. 6.
10 June 2006 � Vol. 45, No. 17 � APPLIED OPTICS 4133

up a number of simulations, all run by the radiativetransfer code Doubling-Adding KNMI (Royal Nether-lands Meteorological Institute) (DAK).23,24 This radia-tive transfer model includes polarization, Lambertiansurface reflection, ozone absorption, clouds, and aero-sols. We selected two scenes from the aforementionedorbits, both unclouded, with one over the ocean(16.8 °S, 6.4 °E) and the other one being the Saharascene used in Figs. 1–3. The solar angles of thesescenes are indicated in Fig. 5 as the open or solid circles(see legend).
Regarding the DAK input parameters, we assumedLambertian surface albedos and determined the spec-tral surface albedos from the GOME Lambert-equivalent reflectivity database.25 The ozone columnvalues are available from either GOME orSCIAMACHY measurements and were in this caseobtained from the Troposphere Emission MonitoringInternet Service website.8,26–28 For the ozone profileswe assumed a standard mid-latitude summer profile29
for both the ocean and the Sahara sites. After this, theradiative transfer code calculated the reflectances forthe two scenes for the geometries of GOME andSCIAMACHY. The ratios between the simulated re-flectances are shown in Fig. 6, where the dashed curverelates to the ocean scene and the solid curve to theSahara scene.
Obviously, the errors are small ��1%� in the wave-length region of interest �500–800 nm�. Note thestrong peak at 305 nm. It is related to the transitionfrom strong ozone absorption below 300 nm to pureRayleigh scattering above �330 nm.14 Although theerrors presented in Fig. 6 were calculated for specificscenes, they are representative of most other situa-tions. In conclusion, the difference in solar geometrydue to the time delay in between the overpasses ofGOME and SCIAMACHY does not have a significanteffect on the reflectance comparison of this paper.
6. Conclusion
In this paper we performed an intercomparison of thereflectances of two satellite spectrometers, namely,
GOME and SCIAMACHY. The accuracy of the com-parison method is increased by focusing on carefullyselected Earth targets, in this case a cloud-free sceneover a homogeneous part of the Sahara Desert. Theeffect of the different solar angles for observations byGOME and SCIAMACHY is investigated and foundto be well below 1%. We estimate the accuracy of theresults to be well within 5%.
The final results indicate that there is disagreementbetween GOME and SCIAMACHY over their entiremutual wavelength range. However, we have to re-strict our conclusions about the quality of the radio-metric calibration of SCIAMACHY to the wavelengthregion of 500–800 nm because GOME is sufferingfrom a severe degradation in the UV, up to 500 nm.For the wavelength region of 500–800 nm, whereGOME is reliable, we find a difference of 15%–20% inthe reflectances. We attribute this completely toSCIAMACHY, which is known to be suffering fromcalibration errors.14,15,18,21,22 Further evidence isfound from a comparison between the imager MERISand SCIAMACHY,18 the results of which closelyagree with ours.
We would like to end this conclusion with an illus-tration of the importance of a proper absolute cali-bration of the Earth’s reflectance. The Fast RetrievalScheme for Clouds from the Oxygen A-band(FRESCO) algorithm11 provides cloud informationand makes use of the oxygen A band (between 758and 775 nm). For SCIAMACHY, the algorithm onlyconverges and produces a good level 2 cloud productwhen the SCIAMACHY reflectance around 765 nm ismultiplied by a factor of 1.2.30 Note that this is ex-actly the same correction factor we find from Fig. 3 at765 nm.
This work was financed by the Netherlands Agencyfor Aerospace Programmes and the Space ResearchOrganisation Netherlands through project EO-076.We thank the European Space Agency and the Deut-sches Zentrum für Luft- und Raumfahrt for providingthe GOME and SCIAMACHY data.
References1. J. P. Burrows, M. Weber, M. Buchwitz, V. Rozanov, A.
Ladstätter-Weißenmayer, A. Richter, R. de Beek, R. Hoogen,K. Bramstedt, K.-U. Eichman, M. Eisinger, and D. Perner,“The Global Ozone Monitoring Experiment (GOME): missionconcept and first scientific results,” J. Atmos. Sci. 56, 151–175(1999).
2. H. Bovensmann, J. P. Burrows, M. Buchwitz, J. Frerick, S.Noël, V. V. Rozanov, K. V. Chance, and A. P. H. Goede,“SCIAMACHY: mission objectives and measurement modes,”J. Atmos. Sci. 56, 127–150 (1999).
3. P. Stammes, P. F. Levelt, J. de Vries, H. Visser, B. Kruizinga,C. Smorenburg, G. W. Leppelmeier, and E. Hilsenrath, “Sci-entific requirements and optical design of the Ozone Monitor-ing Instrument on EOS-CHEM,” in Earth Observing SystemsIV, W. L. Barnes, ed., Proc. SPIE 3750, 221–232 (1999).
4. U. Platt, “Differential Optical Absorption Spectroscopy(DOAS),” in Air Monitoring by Spectroscopic Techniques, Vol.127 of Chemical Analysis Series, M. W. Sigrist, ed. (Wiley,1994), pp. 27–84.
5. R. Munro, R. Siddans, W. J. Reburn, and B. J. Kerridge, “Di-
Fig. 6. Calculated effect of the difference in solar geometry on therelative reflectance when GOME and SCIAMACHY observe thesame scene (in exact nadir view, compare with Fig. 5).
4134 APPLIED OPTICS � Vol. 45, No. 17 � 10 June 2006

rect measurements of tropospheric ozone distributions fromspace,” Nature 392, 168–171 (1998).
6. R. Hoogen, V. V. Rozanov, and J. P. Burrows, “Ozone profilesfrom GOME satellite data: algorithm description and first vali-dation,” J. Geophys. Res. 104D, 8263–8280, doi:10.1029/1998JD100093 (1999).
7. R. J. D. Spurr, “Linearized radiative transfer theory: a generaldiscrete ordinate approach to the calculation of radiances andanalytic weighting functions, with application to atmosphericremote sensing,” Ph.D. dissertation (Technical UniversityEindhoven, The Netherlands, 2001).
8. R. J. van der A, R. F. van Oss, A. J. M. Piters, J. P. F. Fortuin,Y. J. Meijer, and H. M. Kelder, “Ozone profile retrieval fromrecalibrated Global Ozone Monitoring Experiment data,” J.Geophys. Res. 107D, 4239, doi:10.1029/2001JD000696 (2002).
9. O. P. Hasekamp, J. Landgraf, and R. van Oss, “The need ofpolarization modeling for ozone profile retrieval from backscat-tered sunlight,” J. Geophys. Res. 107D, 4692, doi:10.1029/2002JD002387 (2002).
10. Y. J. Meijer, R. J. van der A, R. F. van Oss, D. P. J. Swart,H. M. Kelder, and P. V. Johnston, “Global Ozone MonitoringExperiment ozone profile characterization using interpreta-tion tools and lidar measurements for intercomparison,” J.Geophys. Res. 108D, 4723, doi:10.1029/2003JD003498 (2003).
11. R. B. A. Koelemeijer, P. Stammes, J. W. Hovenier, and J. F.de Haan, “A fast method for retrieval of cloud parametersusing oxygen A band measurements from the Global OzoneMonitoring Experiment,” J. Geophys. Res. 106D, 3475–3490,doi:10.1029/2000JD900657 (2001).
12. J. R. Acarreta, P. Stammes, and W. H. Knap, “First retrieval ofcloud phase from SCIAMACHY spectra around 1.6 micron,”Atmos. Res. 72, 89–105 (2004).
13. M. de Graaf, P. Stammes, O. Torres, and R. B. A. Koelemeijer,“Absorbing aerosol index: sensitivity analysis, application toGOME and comparison with TOMS,” J. Geophys. Res. 110,D01201, doi:10.1029/2004JD005178 (2005).
14. L. G. Tilstra, G. van Soest, and P. Stammes, “Method forin-flight satellite calibration in the ultraviolet using radiativetransfer calculations, with application to Scanning ImagingAbsorption Spectrometer for Atmospheric Chartography(SCIAMACHY),” J. Geophys. Res. 110, D18311, doi:10.1029/2005JD005853 (2005).
15. G. van Soest, L. G. Tilstra, and P. Stammes, “Large-scalevalidation of SCIAMACHY reflectance in the ultraviolet,” At-mos. Chem. Phys. 5, 2171–2180 (2005).
16. B. Kerridge, R. Siddans, J. Reburn, B. Latter, and V. Jay,“Intercomparisons of MIPAS and SCIAMACHY L1 and L2products with GOME and AATSR,” presented at the EnvisatValidation Workshop, Frascati, Italy, 9–13 December 2002.
17. R. Snel, “In-orbit optical path degradation: GOME experienceand SCIAMACHY prediction,” in Proceedings of the ERS-Envisat Symposium, ESA Spec. Publ. SP-461 (European SpaceAgency, 2000).
18. J. R. Acarreta and P. Stammes, “Calibration comparison be-tween SCIAMACHY and MERIS onboard ENVISAT,” IEEEGeosci. Remote Sens. Lett. 2, 31–35, doi:10.1109/LGRS.2004.838348 (2005).
19. I. Aben, M. Eisinger, E. Hegels, R. Snel, and C. Tanzi, “GOMEData Quality Improvement GDAQI final report,” Rep. TN-GDAQI-003SR�2000 (European Space Agency, 2000).
20. R. Santer, N. Martiny, and I. Smolskaia, “Vicarious calibrationof MERIS over dark waters in the near infrared,” in Proceed-ings of the 2004 Envisat and ERS Symposium, ESA Spec. Publ.SP-572 (European Space Agency, 2004).
21. S. Noël, “Determination of correction factors for SCIAMACHYradiances and irradiances,” Tech. Note IFE-SCIA-SN-20040514 (University of Bremen, Bremen, Germany, 2004).
22. W. Gurlit, H. Bösch, H. Bovensmann, J. P. Burrows, A. Butz,C. Camy-Peyret, M. Dorf, K. Gerilowski, A. Lindner, S. Noël,U. Platt, F. Weidner, and K. Pfeilsticker, “The UV-A and vis-ible solar irradiance spectrum: inter-comparison of absolutelycalibrated, spectrally medium resolution solar irradiance spec-tra from balloon- and satellite-borne measurements,” Atmos.Chem. Phys. 5, 1879–1890 (2005).
23. J. F. de Haan, P. B. Bosma, and J. W. Hovenier, “The addingmethod for multiple scattering calculations of polarised light,”Astron. Astrophys. 183, 371–391 (1987).
24. P. Stammes, “Spectral radiance modelling in the UV-visiblerange,” in IRS 2000: Current Problems in Atmospheric Radi-ation, W. L. Smith and Y. M. Timofeyev, eds. (Deepak, 2001),pp. 385–388.
25. R. B. A. Koelemeijer, J. F. de Haan, and P. Stammes, “Adatabase of spectral surface reflectivity in the range 335–772nm derived from 5.5 years of GOME observations,” J. Geophys.Res. 108D, 4070, doi:1029/2002JD002429 (2003).
26. R. J. van der A, H. J. Eskes, J. H. G. M. van Geffen, R. F. vanOss, A. J. M. Piters, P. J. M. Valks, and C. Zehner, “GOMEFast Delivery and Value-Added Products (GOFAP),” in Pro-ceedings of the ERS-Envisat Symposium, ESA Spec. Publ. SP-461 (European Space Agency, 2000).
27. H. J. Eskes, R. J. van der A, E. J. Brinksma, J. P. Veefkind, J.F. de Haan, and P. J. M. Valks, “Retrieval and validation ofozone columns derived from measurements of SCIAMACHYon Envisat,” Atmos. Chem. Phys. Discuss. 5, 4429–4475(2005).
28. Troposphere Emission Monitoring Internet Service (TEMIS),http://www.temis.nl/.
29. G. P. Anderson, S. A. Clough, F. X. Kneizys, J. H. Chetwynd,and E. P. Shettle, “AFGL atmospheric constituent profiles (0–120 km),” Environment Research Paper 954, Rep. AFGL-TR-86-0110 (U.S. Air Force Geophysics Laboratory, Hanscom AirForce Base, Mass., 1986).
30. N. Fournier, P. Stammes, M. de Graaf, R. J. van der A, A. J. M.Piters, R. B. A. Koelemeijer, and A. A. Kokhanovsky, “Improv-ing cloud information over deserts from SCIAMACHY O2
A-band,” Atmos. Chem. Phys. Discuss. 5, 6013–6039 (2005).
10 June 2006 � Vol. 45, No. 17 � APPLIED OPTICS 4135