Interactive Web and Mobil Solutions for Communicating Flood Risk, HAZUS Data and NFIP Information
Upload
truongxuyenCategory
view
225download
5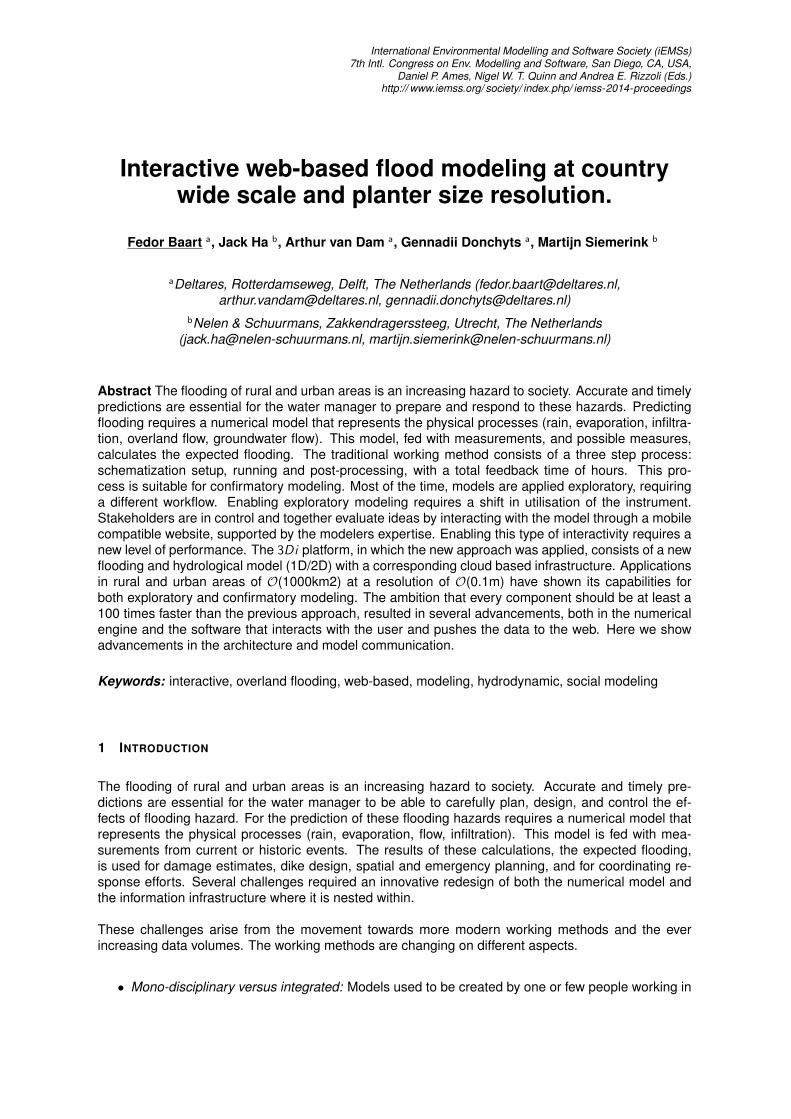
International Environmental Modelling and Software Society (iEMSs)7th Intl. Congress on Env. Modelling and Software, San Diego, CA, USA,
Daniel P. Ames, Nigel W. T. Quinn and Andrea E. Rizzoli (Eds.)http:// www.iemss.org/ society/ index.php/ iemss-2014-proceedings
Interactive web-based flood modeling at countrywide scale and planter size resolution.
Fedor Baart a, Jack Ha b, Arthur van Dam a, Gennadii Donchyts a, Martijn Siemerink b
aDeltares, Rotterdamseweg, Delft, The Netherlands ([email protected],[email protected], [email protected])
bNelen & Schuurmans, Zakkendragerssteeg, Utrecht, The Netherlands([email protected], [email protected])
Abstract The flooding of rural and urban areas is an increasing hazard to society. Accurate and timelypredictions are essential for the water manager to prepare and respond to these hazards. Predictingflooding requires a numerical model that represents the physical processes (rain, evaporation, infiltra-tion, overland flow, groundwater flow). This model, fed with measurements, and possible measures,calculates the expected flooding. The traditional working method consists of a three step process:schematization setup, running and post-processing, with a total feedback time of hours. This pro-cess is suitable for confirmatory modeling. Most of the time, models are applied exploratory, requiringa different workflow. Enabling exploratory modeling requires a shift in utilisation of the instrument.Stakeholders are in control and together evaluate ideas by interacting with the model through a mobilecompatible website, supported by the modelers expertise. Enabling this type of interactivity requires anew level of performance. The 3Di platform, in which the new approach was applied, consists of a newflooding and hydrological model (1D/2D) with a corresponding cloud based infrastructure. Applicationsin rural and urban areas of O(1000km2) at a resolution of O(0.1m) have shown its capabilities forboth exploratory and confirmatory modeling. The ambition that every component should be at least a100 times faster than the previous approach, resulted in several advancements, both in the numericalengine and the software that interacts with the user and pushes the data to the web. Here we showadvancements in the architecture and model communication.
Keywords: interactive, overland flooding, web-based, modeling, hydrodynamic, social modeling
1 INTRODUCTION
The flooding of rural and urban areas is an increasing hazard to society. Accurate and timely pre-dictions are essential for the water manager to be able to carefully plan, design, and control the ef-fects of flooding hazard. For the prediction of these flooding hazards requires a numerical model thatrepresents the physical processes (rain, evaporation, flow, infiltration). This model is fed with mea-surements from current or historic events. The results of these calculations, the expected flooding,is used for damage estimates, dike design, spatial and emergency planning, and for coordinating re-sponse efforts. Several challenges required an innovative redesign of both the numerical model andthe information infrastructure where it is nested within.
These challenges arise from the movement towards more modern working methods and the everincreasing data volumes. The working methods are changing on different aspects.
• Mono-disciplinary versus integrated: Models used to be created by one or few people working in

Baart et al. / Interactive web-based flood modeling
the same discipline. The challenge now is to model the integrated environment, which can bestbe approached as a community [Voinov et al., 2010] of different disciplines.
• Confirmatory versus exploratory: From assuming that the model is valid and can be used forhypothesis testing to realizing it’s a made-up simplification of reality [Oreskes et al., 1994] thatcan be used to explore possibilities.
• Passive versus interactive: Moving from the pre-processing, wait a few hours, post-processingcycle towards a millisecond feedback loop with high resolution and connected physical pro-cesses. The challenge here is to move from the scale of a square kilometer [for example Losassoet al., 2008] to the scale of small country.
• Solitary versus social: The solitary modeler creating static pictures for a 600 page report de-scribing all the different scenarios to a group of stakeholders in control 1 of a model runningsimultaneous on their mobile devices and a big screen in the control room.
The amount of data involved in preparing the model is rapidly increasing. There is an increase in supplyof data caused by the ever growing measurement resolution and spatial coverage. For example, thetopology of waterbodies at a spatial coverage of a small country is used to determine if the water willfind its way into one’s neighborhood. The topography and infiltration rate at a spatial resolution ofa planter determine if the water will flow to one’s backyard or the neighbors. How can we design aplatform that is suitable for this new modeling approach and meets the corresponding challenges?
The 3Di platform, in which these approaches and several new ones are applied, consists of a newoverland flooding model (1D/2D) and a corresponding infrastructure. This platform enables interactiveweb-based modeling of rural and urban areas at coverages of O(1000km2) at a resolution of O(0.1m).Here we describe the advances in the numerical model, architecture, and visualization techniques.
2 NUMERICAL MODEL: FROM PASSIVE TO INTERACTIVE
The 3Di computational core originates from components of the SOBEK 1D2D flooding software[Stelling and Verwey, 2006] with three major improvements: 1. streamlining of the software to offeraccess to the memory of a running model, 2. overland flow at subgrid scale and 3. inclusion subsoilprocesses at subgrid scale .
To enable interactive use, the flooding software was stripped of it’s main timeloop. A core libraryremains, with all numerical algorithms. On top of this library a light-weight Application ProgrammingInterface (API) exposes direct memory access the variables and to the control functions.
By introspection, the outside world (e.g., a Python-based website, a C#-Graphical User Interface (GUI),a MATLAB-script) can examine model state at run time. More specifically: get current water levels andflow fields, current running state of water pumps, and other structures, active meteorological forcings.Each of these state variables can just as easily be set as they are get. These functions are imple-mented in correspondence with the Basic Model Interface (BMI) standard [Peckham et al., 2013]. Thisis how the model directly ‘feels’ and uses its new state.
1. variable = get(“name”): Return a variable from the model
2. set(“name”, variable): Set a variable into the model
The freedom of interaction is possible due to the core adhering to the Hollywood Principle: “Don’tcall us, we’ll call you”. In several workshops, model coupling frameworks [see Jagers, 2010, for anoverview], have agreed on the minimal interface that makes a model adhere to the Hollywood princi-ples; by exposing the following methods:1preferably with guidance from domain experts

Baart et al. / Interactive web-based flood modeling
1. initialize(): Load and initialize a model from file.
2. run(∆t): Run a single timestep.
3. finalize(): Finalize the model, memory cleanup, file flushing, statistics reporting.
Effective head
Ground waterlevel
Surface waterlevel
Δxp
Computational grid cell size
Figure 1. Subgrid infiltration into heterogeneouslandscape.
In between these interface calls, the model statemay be changed from outside and the coreshould support that. The library is loaded andcan serve as a running process for a long time. Apositive side-effect of implementing this interfaceis that it reveals subtle inconsistencies in exist-ing code, for example initializing different modelsafter one another: incomplete cleanup of previ-ous settings, already allocated memory, and un-closed file pointer all become apparent. To re-duce the number of errors a template system wasintroduced to generate the code used to allocate,deallocate, and expose the variables.
Detailed evaluation of overland flow friction andwater storage are simulated at subgrid scale.This enables to compute flooding at the plantersize (0.5m) pixel resolution of digital terrainmaps. It also enables a speedup of a factor 100,as described in Stelling [2012]. To represent wa-ter systems in civilized regions the 2D grid was extended with 1D channels and controllable structures(for example pumps, orifices, weirs). This allows for more realistic and interactive overland floodingsimulation.
The power of the subgrid concept is also applied to the hydrological processes in the subsoil. Animportant factor in potential flooding is the storage of water in the subsoil, or the lack thereof. Thechange in surface water volume is driven by several familiar processes:
∆Vsurface water = (Qoverland + Qprecipitation − Qinfiltration − Qevaporation + Qdrainage) ·∆t
The heterogeneous landscape and land use are specified in the model as gigapixel bitmaps for soiltypes, crop types, drainage resistance, and maximum infiltration. Infiltration, evaporation, and drainageare evaluated at pixel resolution, whereas the computational grid cells are larger and ensure highperformance.
These advantages allow the model to act as a component in the interactive web-based model environ-ment with a wide variety of possible applications.
3 PLATFORM ARCHITECTURE
Now that a numerical model is available that allows high resolution interactive modeling, how canwe hook it up to a tablet, mobile phone and map table, all at the same time, to allow for social andinteractive modeling?
To enable such an environment the most logical choice is to use a web-based environment. Over thelast years this choice has become more apparent. The large list of browser enhancements (for exampleinline Scalable Vector Graphics (SVG), canvas, plugin free video [Berjon et al., 2014], and CascadingStyle Sheets (CSS) animations [Jackson et al., 2013]) allow for rich visualizations independent of thedevice type. An overview of the system architecture is given in Figure 2. The architecture follows

Baart et al. / Interactive web-based flood modeling
the general “Model View Controller” pattern [Gamma et al., 1994], with caching of events and datato accommodate for the model continuously running in the background. The implementation of thissystem required several technical innovations and social considerations.
numericalengine
modelcontroller
schematization
data feed
event+actioncache
data cachetime+mapserver
websocketserver
browser
Figure 2. Architecture overview
The end-users, interact with the web-based GUI.The design philosophy is minimalistic, allowinglittle room for user mistakes. For example dis-charge locations only have two options (normaland extreme discharge) (see Figure 3a). Ses-sions with groups of end-users resulted in thisdesign that provides freedom to explore withoutthe insinuation that the model results are “true”.The application of CSS and SVG allows the inter-face to scale between different screen resolutions so that it can be used on different devices (phones,tablets, browsers, map table).
One of the differences when comparing a desktop user to a web-based user is the short attentionspan. If no indication of progress is given for longer than two second users will start reloading, clickingerratically or will just close the website, searching for a new “frisson” [Carr, 2011]. To make sure thatthe model is ready to run when a user arrives a lot of attention is given to the provisioning of the model.Provisioning, in this context, is preparing a model controller so that it starts its computation on request.The platform runs on GNU/Linux based Infrastructure as a Service (IaaS) providers, such as Amazon.For each running engine (one customer can have multiple running engines) a machine is reserved.These machines are prepared with a container that contains the model schematization, tables andgrids, and hot restart files. These files are read into memory so that the model is ready to start itscomputation when needed, resulting in a time between a user logging in and a model start in under 5seconds.
To communicate the model results the Model Message Interface (MMI) protocol is used [Baart et al.,2014]. This protocol is suitable for sending model variables over the internet. A model messageconsists of a metadata header in JavaScript Object Notation (JSON) format, optionally followed by theserialized array. Listing 1 shows an example of an MMI message. In this project the Zero MessageQueue (ØMQ) protocol is used as a the underlying transport protocol. The advantage of using theMMI, ØMQ combination is that it has flexible metadata, does not copy data, and is very fast.
# The f i r s t pa r t o f the message conta ins metadata{
”name” : ” wa te r l eve l ” ,” shape ” : [ 3 , 3 ] ,” dtype ” : ” f l o a t 6 4 ” ,” a t t r i b u t e s ” : {
” standard name ” : ” s e a s u r f a c e a l t i u d e ” ,” u n i t s ” : ”m”
}}# The second pa r t o f the message conta ins a s e r i a l i z e d ar ray\x81\xb3b\xa0\xe8 . . . \x01\x90\xe5\x84\xb5\xb0
Listing 1. MMI message
Interaction is another challenge where timing is crucial. When a user interacts with the model, forexample places a discharge point, turns on a pump or lowers an orifice, the user expects a responsewithin a second. To achieve this, user interactions are directly sent through websockets [Hickson,2012]. These interactions are cached and pushed into the model on every timestep. Timesteps haveto be kept shorter than in a classical model run, 100ms is common. After a model timestep, the chainis inverted. The model pushes its arrays back in the direction of the browser, which is subscribed tothese messages and can directly visualize.
The social aspect is another source of interesting problems. Several group sessions with differentsettings have been tried. The current setup is that the model is run in a “virtual room”, like a chat

Baart et al. / Interactive web-based flood modeling
room. Multiple people can join the model run. One person is in control and others can view and zoomin on the same model run. Other users can request control of the model. The sessions worked bestwhen a topic expert, not necessary a modeler, was present in the session. A detailed analysis of howthe platform is used in a social context showed that the speed and flexibility determine the suitability[Leskens et al., 2014].
4 VISUALIZATION
The 3Di platform serves a wide variety of end-users. It is important to find a good balance betweenwhat is computed and how information is perceived. For scientific or engineering users one wantsto provide information as close to the model results as possible. For less experienced end users itbecomes important that the information is perceived correctly rather than that it is presented correctly.
First a note about the performance. Humans will detect images at a rate of about 12 s−1 as continuous[Landis, 1954]. To enable the model results to be perceived as continuous, taking into account somerandom network delay, the aim is to generate a map within 50ms. Generating results at this frameratecan be done using two approaches. The first is to reduce the modeling timestep so that it computesin less than 50ms. This is the only way to get true model results at this framerate. An alternative is tointerpolate in time and provide the insinuation of continuous information.
We use both approaches here. We reduce the calculation time so that interaction is fluent and wecan pass the flicker fusion threshold. If one wants to use longer time steps we also visualize at a highframerate. An example of this is the visualization of river flow using dots that are animated with CSSanimations as a function of the current flow velocity (see Figure 3b).
Another performance technique used to achieve the high framerate is to use the “Mahlen nach Zahlen”method, a reference to a product from the German company Ravensburger R©. A map with cell num-bers is prepared in advance. Once a quantity for a new timestep becomes available the map is filledin with the colors corresponding to the cell numbers. This achieves much faster rendering times thandrawing the cells using geometry drawing function.
(a) Representation of two dimensional sub-pixels water level
(b) Representation of one dimensional chan-nel network using an animated stroke pattern.
Figure 3. Browser based interactive model user interface of 3Di
The variety of end-users exposes the numerical model to non-technical users with little appreciation ofimplemented numerical schemes. Some artifacts from the numerical schemes result in confusion. Theworld in the subgrid model is internally represented in voxels (a picture element (pixel) with volume),not unlike the computer game Minecraft. This results in visual artifacts, as represented in Figure 4a.Another type of artifact occurs when a levee crosses a calculation cell both sides of the cell will containwater.
Baart et al. / Interactive web-based flood modeling
One can argue whether to show these “true” yet confusing results or to process the information so thatit is perceived as intended. In the 3Di platform the default visualization hides these artifacts by filteringand smoothing the output. Hiding the square world is implemented using different techniques.
(a) Uninterpolated subgrid water level (b) Interpolated subgrid water level
Figure 4. Linear barycentric interpolation method
A barycentric linear interpolation technique is used. This is one of the few techniques that allow for theinterpolation within the rendering time constraint. It also allows water level results to be interpolated.The quad tree grid is triangulated using Qhull [Barber et al., 1996]. Water level information, fromthe cell centers is linearly interpolated to the underlying subgrid. The interpolation uses a weightedaverage to determine water levels. Figure 4b shows the results of this technique .
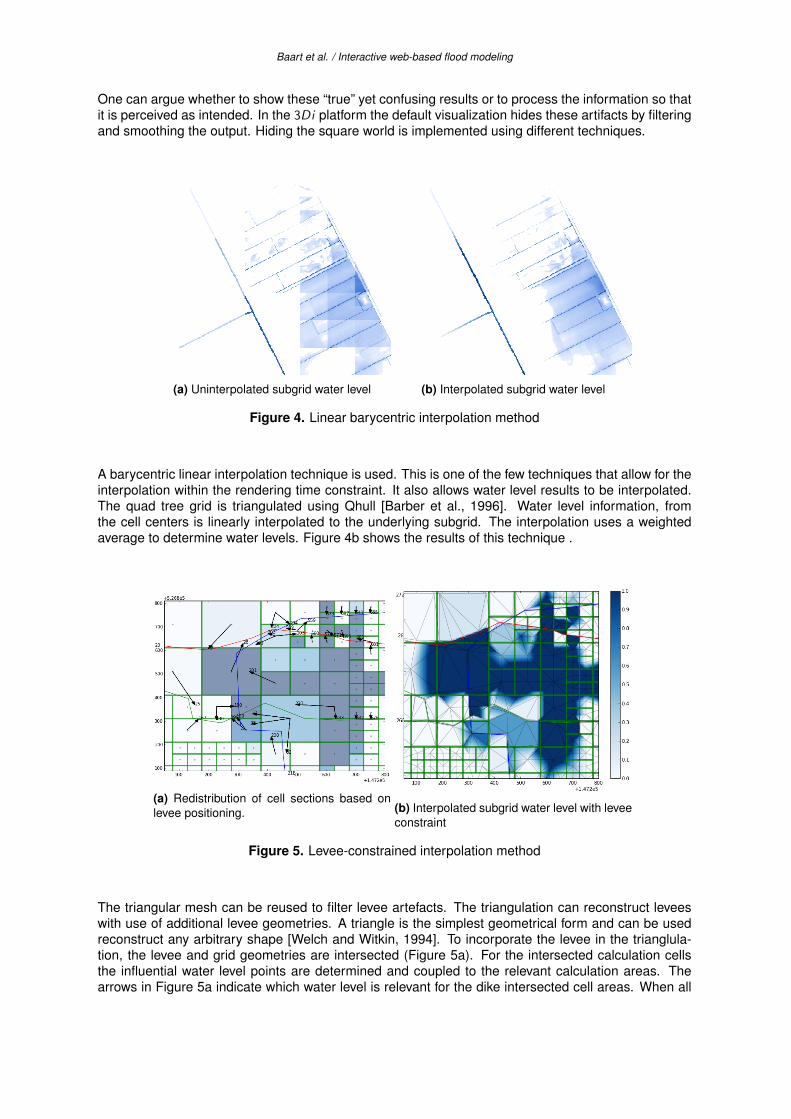
(a) Redistribution of cell sections based onlevee positioning. (b) Interpolated subgrid water level with levee
constraint
Figure 5. Levee-constrained interpolation method
The triangular mesh can be reused to filter levee artefacts. The triangulation can reconstruct leveeswith use of additional levee geometries. A triangle is the simplest geometrical form and can be usedreconstruct any arbitrary shape [Welch and Witkin, 1994]. To incorporate the levee in the trianglula-tion, the levee and grid geometries are intersected (Figure 5a). For the intersected calculation cellsthe influential water level points are determined and coupled to the relevant calculation areas. Thearrows in Figure 5a indicate which water level is relevant for the dike intersected cell areas. When all

Baart et al. / Interactive web-based flood modeling
waterlevel points are allocated to the dike, the triangulation can be executed with the incorporation ofthe levee geometries. The newly created triangular mesh now also follows the added levee geometry.Successively the interpolation is executed, resulting in water being retained behind the dike within onecalculation cell. The interpolated result is shown in Figure 5b.
5 DISCUSSION AND CONCLUSION
The major advancement is that we have enabled interactive web-based modeling at a high resolutionand wide coverage. The interactive, exploratory, overland flooding simulations can be used in sessionswith policy makers to help them make sensible decisions. Several developments have enabled thisadvancement.
The redesign of the numerical engine follows the trends set in inter-model coupling. Applying thehollywood principle transformed the engine from a static executable into an interactive component.
Viewing model results through the web was already a reality (see [Blower et al., 2013] for example).We have made progress to run and interact with models through the browser. The use of modern webtechnologies allows the same interface to be used on a browser, a phone and on a map table. What isnot available, for complex models, is the ability to set up a new model through the web. At the momentit is still cumbersome to implement this functionality. However within the next few years it is likely thatalso this part of the modeling workflow will become browser-based.
The speedup of the model by applying the subgrid method allows for a faster interaction time and amore detailed resolution. Several other models use a similar numerical approach, albeit with limita-tions. The subgrid scheme by Stelling [2012] is partly based on the subgrid method for flooding anddrying by Casulli [2009], who implements his methods in the unstructured UnTRIM research packageCasulli and Walters [2000]. The coupled 1D-2D hydrodynamic model MIKE-FLOOD [Group, 2014]also offers subgrid overland flow.
The high resolution results in great “face validity”. For now, the 3Di platform is suitable for exploratorypurposes, as only a few marks of the confidence checklist [Baart, 2013, pp. 136] have been ticked.Work has started on a skillbed for the 3Di platform. A skillbed is an automated test suite that comparesresults to a wide range of analytical cases, measurements, and results from other numerical models.
A lot of technical and numerical problems have been solved, but the methodological challenges of thenew working methods are proving more difficult. An open issue is that end-users tend to confuse highresolution and higher frequency results with a high accuracy, a topic for further research.
Possible future directions include combining the subgrid approach with an unstructured flow solver,such as Delft3D-FLOW Flexible Mesh [Kernkamp et al., 2011]. The pixel based approach has the ad-vantage that it is simple to implement and to scale. Unfortunately the world is not so square, especiallynot on larger scales, when one goes beyond the scale of a small country.
Another planned step is to incorporate or preferably to couple the system with other numerical engines.The monolithic approach of putting all processes into one model has proven cumbersome in previousimplementations. The current model controller can easily incorporate other models because the com-munication and control are already out of the model engine. Water quality, coastal, and socio-economicmodels are possible candidates for inclusion in the platform.
REFERENCES
Baart, F. (2013). Confidence in Coastal Forecasts. PhD thesis, Technical University of Delft.
Baart, F., Ha, K. K., and Donchyts, G. (2014). Model Message Interface. Software.dx.doi.org/10.5281/zenodo.9876.

Baart et al. / Interactive web-based flood modeling
Barber, C. B., Dobkin, D. P., and Huhdanpaa, H. (1996). The quickhull algorithm for convex hulls. ACMTrans. Math. Softw., 22(4):469–483.
Berjon, R., Faulkner, S., Leithead, T., Doyle Navara, E., O’Connor, E., Pfeiffer, S., and Hickson, I.(2014). Html5: A vocabulary and associated apis for html and xhtml. Editor’s draft, World Wide WebConsortium.
Blower, J., Gemmell, A., Griffiths, G., Haines, K., Santokhee, A., and Yang, X. (2013). A web mapservice implementation for the visualization of multidimensional gridded environmental data. Envi-ronmental Modelling and Software, 47(0):218 – 224.
Carr, N. (2011). The shallows: What the Internet is doing to our brains. WW Norton & Company.
Casulli, V. (2009). A high-resolution wetting and drying algorithm for free-surface hydrodynamics.International Journal for Numerical Methods in Fluids, 60(4):391–408.
Casulli, V. and Walters, R. A. (2000). An unstructured grid, three-dimensional model based on theshallow water equations. International Journal for Numerical Methods in Fluids, 32(3):331–348.
Gamma, E., Helm, R., Johnson, R., and Vlissides, J. (1994). Design patterns: elements of reusableobject-oriented software. Pearson Education.
Group, D. (2014). Software for water environments. http://www.mike-by-dhi.com/.
Hickson, I. (2012). The websocket api. Editor’s draft, World Wide Web Consortium.
Jackson, D., Hyatt, D., Marrin, C., Galineau, S., and David Baron, L. (2013). Css animations. Workingdraft, World Wide Web Consortium.
Jagers, H. (2010). Linking data, models and tools: an overview. In Proceedings of the InternationalCongress on Environmental Modelling and Software (2010) Ottawa, Canada.
Kernkamp, H., Van Dam, A., Stelling, G., and de Goede, E. (2011). Efficient scheme for the shallowwater equations on unstructured grids with application to the continental shelf. Ocean Dynamics,pages 1–14. 10.1007/s10236-011-0423-6.
Landis, C. (1954). Determinants of the critical flicker-fusion threshold. Physiological Reviews,34(2):259–286.
Leskens, J., Brugnach, M., Hoekstra, A., and Schuurmans, W. (2014). Why are decisions in flood dis-aster management so poorly supported by information from flood models? Environmental Modellingand Software, 53(0):53 – 61.
Losasso, F., Talton, J., Kwatra, N., and Fedkiw, R. (2008). Two-way coupled sph and particle level setfluid simulation. Visualization and Computer Graphics, IEEE Transactions on, 14(4):797–804.
Oreskes, N., Shrader-Frechette, K., and Belitz, K. (1994). Verification, validation, and confirmation ofnumerical models in the earth sciences. Science, 263(5147):641.
Peckham, S. D., Hutton, E. W., and Norris, B. (2013). A component-based approach to integratedmodeling in the geosciences: The design of {CSDMS}. Computers & Geosciences, 53(0):3 – 12.Modeling for Environmental Change.
Stelling, G. S. (2012). Quadtree flood simulations with sub-grid digital elevation models. Proceedingsof the ICE - Water Management, 165:567–580(13).
Stelling, G. S. and Verwey, A. (2006). Numerical flood simulation. In Encyclopedia of HydrologicalSciences. John Wiley & Sons.
Voinov, A. A., DeLuca, C., Hood, R. R., Peckham, S., Sherwood, C. R., and Syvitski, J. P. M. (2010). Acommunity approach to earth systems modeling. Eos, Transactions American Geophysical Union,91(13):117–118.
Welch, W. and Witkin, A. (1994). Free-form shape design using triangulated surfaces. In Proceedingsof the 21st annual conference on Computer graphics and interactive techniques, pages 247–256.ACM.