Interactive overlay maps for US patent (USPTO) data based...
17
Interactive overlay maps for US patent (USPTO) data based on International Patent Classification (IPC) Loet Leydesdorff • Duncan Kushnir • Ismael Rafols Received: 24 October 2012 Ó Akade ´miai Kiado ´, Budapest, Hungary 2012 Abstract We report on the development of an interface to the US Patent and Trademark Office (USPTO) that allows for the mapping of patent portfolios as overlays to basemaps constructed from citation relations among all patents contained in this database during the period 1976–2011. Both the interface and the data are in the public domain; the freeware programs VOSViewer and/or Pajek can be used for the visualization. These basemaps and overlays can be generated at both the 3-digit and 4-digit levels of the International Patent Classification (IPC) of the world intellectual property organization (WIPO). The basemaps can provide a stable mental framework for analysts to follow developments over searches for different years, which can be animated. The full flexibility of the advanced search engines of USPTO are available for generating sets of patents and/or patent applications which can thus be visualized and compared. This instrument allows for addressing ques- tions about technological distance, diversity in portfolios, and animating the developments of both technologies and technological capacities of organizations over time. Keywords Map USPTO IPC Patent Classification Overlay L. Leydesdorff (&) Amsterdam School of Communication Research (ASCoR), University of Amsterdam, Kloveniersburgwal 48, 1012 CX Amsterdam, The Netherlands e-mail: [email protected] URL: http://www.leydesdorff.net D. Kushnir Environmental Systems Analysis, Chalmers University of Technology, Go ¨teborg, Sweden e-mail: [email protected] I. Rafols SPRU (Science and Technology Policy Research), University of Sussex, Freeman Centre, Falmer Brighton, East Sussex BN1 9QE, UK e-mail: [email protected] I. Rafols Ingenio (CSIC-UPV), Universitat Polite `cnica de Vale `ncia, Vale `ncia, Spain 123 Scientometrics DOI 10.1007/s11192-012-0923-2
Transcript of Interactive overlay maps for US patent (USPTO) data based...
Interactive overlay maps for US patent (USPTO) databased on International Patent Classification (IPC)
Loet Leydesdorff • Duncan Kushnir • Ismael Rafols
Received: 24 October 2012� Akademiai Kiado, Budapest, Hungary 2012
Abstract We report on the development of an interface to the US Patent and Trademark
Office (USPTO) that allows for the mapping of patent portfolios as overlays to basemaps
constructed from citation relations among all patents contained in this database during the
period 1976–2011. Both the interface and the data are in the public domain; the freeware
programs VOSViewer and/or Pajek can be used for the visualization. These basemaps and
overlays can be generated at both the 3-digit and 4-digit levels of the International Patent
Classification (IPC) of the world intellectual property organization (WIPO). The basemaps
can provide a stable mental framework for analysts to follow developments over searches
for different years, which can be animated. The full flexibility of the advanced search
engines of USPTO are available for generating sets of patents and/or patent applications
which can thus be visualized and compared. This instrument allows for addressing ques-
tions about technological distance, diversity in portfolios, and animating the developments
of both technologies and technological capacities of organizations over time.
Keywords Map � USPTO � IPC � Patent � Classification � Overlay
L. Leydesdorff (&)Amsterdam School of Communication Research (ASCoR), University of Amsterdam,Kloveniersburgwal 48, 1012 CX Amsterdam, The Netherlandse-mail: [email protected]: http://www.leydesdorff.net
D. KushnirEnvironmental Systems Analysis, Chalmers University of Technology, Goteborg, Swedene-mail: [email protected]
I. RafolsSPRU (Science and Technology Policy Research), University of Sussex, Freeman Centre, FalmerBrighton, East Sussex BN1 9QE, UKe-mail: [email protected]
I. RafolsIngenio (CSIC-UPV), Universitat Politecnica de Valencia, Valencia, Spain
123
ScientometricsDOI 10.1007/s11192-012-0923-2

Introduction
Alongside scholarly publishing, patents have increasingly become an output of scholarly
work. The Bayh-Dole Act of 1980, among other things, granted to universities, small
businesses, and non-profit organizations the intellectual property rights to inventions that
result from government funding. Other countries followed this legislation and university
transfer offices were established to promote knowledge transfer in university-industry
relationships. Using non-patent literature references, Narin et al. (1997) signaled a more
intense and closer linkage between patenting and publishing in several fields of science and
technology (Henderson et al. 2005). With increased awareness of the emergence of a
knowledge-based economy, the patent system became further adapted to the publication
system. With the 2011 ‘‘American Invents Act,’’ for example, the USA brought its pat-
enting system in line with the rest of the world by changing (as of 2013) from ‘‘first to
invent’’ to ‘‘first to file’’ as the basis for granting patents.
More generally, patents can also be considered as indicators of input into the
economy. Griliches (1984) focused on patents as such indicators, and noted the dif-
ferent and sometimes incompatible organization of various statistics (Griliches
1994:14). Jaffe and Trajtenberg (2002) then used three million patents and 16 million
citations in the USPTO database in a comprehensive study of what these authors called
‘‘a window on the knowledge-based economy.’’ However, patents are indicators of
invention; innovation presumes the introduction of inventions into a market. Patents are
thus developed in relation to two social contexts: the sciences and markets (Klavans
and Boyack 2009).
Accordingly, patents are classified in terms of technologies and not by products or
industries (Jaffe 1986).1 The long chain between scientific discovery and technological
and/or industrial applications can sometimes be cut short by feedback mechanisms (Kline
and Rosenberg 1986; Von Hippel 1988), but the two processes are very different in terms
of institutional incentives (Rosenberg and Nelson 1994). The rankings of universities that
emerged in the early 2000s, for example, did not include patenting among the indicators of
excellence (Leydesdorff and Meyer 2010).
In summary, patenting is an indicator of industrial activity more than of academic
production (Shelton and Leydesdorff 2012). Whereas scholarly literature is mainly orga-
nized into journals, patents are organized into patent classification systems. There are two
major classification systems: that used by the US Patent and Trade Office (USPTO), and
the International Patent Classification (IPC) developed by the World Intellectual Property
Organization (WIPO) in Geneva. The latter was first developed for international patenting
under the Patent Cooperation Treaty (PCT) that has been signed by most countries of the
world since its inception in 1970.
The European Patent Office (EPO) refined the IPC into the European classification
system (ECLA) in partnership with the WIPO, the Organization for Economic Cooperation
and Development (OECD) in Paris, and the International Patent Documentation Center
(INPADOC) in Vienna. The OECD further developed the concept of patent families into
‘‘triadic patents,’’ that is, those patents held in common by the USPTO, the EPO, and the
1 Schmoch et al. (2003) provided a concordance table between International Patent Classification (IPC) andindustrial classifications with the NACE codes (‘‘Nomenclature statistique des activites economiques dans laCommunaute europeenne’’) used by the OECD.
L. Leydesdorff et al.
123
Japanese Patent Office (JPO).2 ‘‘Triadic patents’’ are considered as the highest-quality
patents, whereas national patenting can be of mixed quality. Patents can be internation-
alized under the Patent Cooperation Treaty (of the WIPO) and are then indicated as PCT
patents.
The various patenting systems offer firms different routes for patenting: one can patent
nationally, internationally (at the WIPO’s PCT), or at the regional level such as the EPO.
The propensity to patent and the internationalization of patenting can be expected to differ
among nations, sectors, disciplines, etc. Among the national patents, USPTO patents are
considered the most valuable because of the competitiveness of the US market; the US is
the world leader in most technologies (Criscuolo 2006). As technology indicators, US
patents can be assumed to be the most reliable because firms want to secure their intel-
lectual property rights in this largest market.
Like publications, patents can also be distinguished in terms of their numbers of cita-
tions, but citation in the case of patenting may mean something different from citation in
scholarly literature. In addition to inventor citations, the examiner can attach citations to
the front page of the patent in order to ensure coverage of prior art because of the
possibility to challenge patents in court (Criscuolo and Verspagen 2008). Since 2001, the
full texts of patents allows one to distinguishes between applicant and examiner citations in
US patents, while the latter are asterisked on the front pages of the patents (Alcacer et al.
2009).3 The patenting system is thus regulated more formally than the publication system.
Whereas journals organize scholarly literature in terms of disciplines and subdisciplines
as latent variables (which one can bring to the fore using, for example, factor analysis of
the citation matrix), patents are categorized manifestly by their patent classification sys-
tems. Citations among journals and journal categories have been used successfully to map
scientific literature (Klavans and Boyack 2009). Rafols et al. (2010) further developed an
overlay technique that enables users to position a document set in terms of its disciplinary
affiliations in terms of journal categories. More recently, this system has been refined to the
journal level (Leydesdorff and Rafols 2012).
In another context, we have developed a similar overlay system for projecting docu-
ments on a basemap of Medical Subject Headings (MeSH) of the Medline database
(Leydesdorff et al. 2012). Using institutional data provided in the bylines of publications
and patents, one can furthermore generate overlays to Google Maps for both publications
(Leydesdorff and Persson 2010; Bornmann and Leydesdorff 2011) and patent data (Ley-
desdorff and Bornmann 2012). The organization of a patent map in terms of technological
categories such as patent classifications provides a hitherto missing link in this series of
studies with the long-term aim of tracing innovations transversally through differently
organized domains (Griliches 1994; Leydesdorff et al. 2012; Narin 2012).
In this study, we turn to mapping the USPTO data in terms of citations among IPC
classes. In an earlier attempt, Leydesdorff (2008) explored mapping WIPO data in terms of
IPC co-classifications, but noted that the hierarchical structure introduced by the thesaurus
made it difficult to map the co-classification structure at the aggregated level. Indexer
2 ‘‘A patent family is a set of patents taken at various offices to protect a given invention. It is triadic whenthe invention to which it refers has been the subject of a patent application at the European Patent Office(EPO) and the Japan Patent Office (JPO), and the subject of the issue of a title of ownership at the UnitedStates Patent and Trademark Office (USPTO). In other words, a triadic patent protects an invention on theU.S., European and Japanese markets simultaneously.’’ Source: http://www.stat.gouv.qc.ca/savoir/indicateurs/triadiques/index_an.htm.3 The program uspto1.exe can be used for downloading the citing patents using the routines available athttp://www.leydesdorff.net/indicators/lesson5.htm (Leydesdorff, 2004).
Interactive overlay maps for USPTO data
123
effects are generated, for example, when classes are split (or otherwise changed) because
they grow too large. Such effects can have an uncontrolled impact on co-classifications.
Classifications make discrete cuts, whereas the network of citation relations can vary in
density within and across clusters (Kay et al. 2012). In other words, the citation network
among the IPC classes is heterarchical, whereas the IPC provides a hierarchical repre-
sentation (with one less degree of freedom). Because of the additional degree of freedom in
networks when compared with hierarchies, one can expect that the citation network is less
sensitive to misclassifications than the co-classification network (Rafols et al. 2010: 1887).
Co-classifications have more often been used for measuring the ‘‘technological dis-
tances’’ between patenting units such as firms or nations (e.g., Breschi et al. 2003; Dolfsma
and Leydesdorff 2011; Jaffe 1986, 1989). More recently, several academic groups have
proposed organizing patent data in terms of aggregated citation structures among IPC
classes (Kay et al. 2012; Schoen 2011). Schoen et al. (2012) use a database derived from
the comprehensive PatStat database, but selected by the Corporate Invention Board (CIB)
and used by the Institute of Prospective Technology Studies of the European Commission.
Furthermore, these authors constructed a classification of their own.
Kay et al. (2012) used EPO data from 2000 to 2006, but varied the number of digits in
the IPC hierarchy in order to optimize the sizes of the categories for the sake of mapping.
In our opinion, one can normalize for size differences among distributions using, for
example, the cosine. Our approach is closest to that of Boyack and Klavans (2008:181),
who developed a USPTO patent map based on co-classifications of 290 IPC classes.
USPTO data were collected by one of us for the years 1976–2011 (approximately 4.2
million patents), and the approximately 39 million citation relations were organized in
terms of IPC classes. The aggregated citation matrices at the 3-digit and 4-digit level of
IPC are normalized using the cosine as a similarity measure among citation distributions in
different classes (Ahlgren et al. 2003). Jaffe (1986, 1989:88) defined ‘‘technological
proximity’’ and ‘‘technological distances’’ in terms of the cosine measure that we also use
standardly in other maps. Our purpose is to make available an interactive basemap com-
parable to the previously constructed basemaps for journals, journal categories, and MeSH
categories, and to leave the user as much flexibility as possible for further adjustments. All
necessary programs and data needed are in the public domain, including the programs
VOSViewer and Pajek that are used for the visualization (De Nooy et al. 2011; Van Eck
and Waltman 2010).
USPTO data has been available online in html format since 1976.4 At the time of this
study, 2011 was the last complete year. All valid citations from the period 1976–2011
among IPC classes at the 3-digit and 4-digit levels are used for the basemaps; two
basemaps are accordingly provided. A routine is available online (at http://www.
leydesdorff.net/ipcmaps) to assist the user in downloading specific sets from the (two)
USPTO databases5 and organizing each set as an overlay to the basemaps. As with our
previous maps, we use the ‘‘citing’’ side of the cited/citing matrix among the classes for the
analysis, because in the ‘‘cited’’ direction older patents may be prevalent, whereas the
analyst is chiefly interested in the current state of a unit of analysis (e.g., a country or a
technology) publishing and citing patents in its knowledge base. In a later state, we
4 EPO data are available online, but there are limitations to the searches (above 500 documents) and someof this data is in the pdf format. PCT patents of WIPO are available online (Leydesdorff 2008), but as notedof lower technological and market quality than USPTO patents (Shelton & Leydesdorff, 2012).5 The two databases can be found at http://patft.uspto.gov/netahtml/PTO/search-adv.htm for granted pat-ents, and http://appft1.uspto.gov/netahtml/PTO/search-adv.html for patent applications, respectively.
L. Leydesdorff et al.
123
envisage extending the system to include the ‘‘being cited’’ counts, as was done—using the
top-quartiles with different colors—in case of the overlays of patent statistics to Google
Maps (Leydesdorff and Bornmann 2012).
Methods and materials
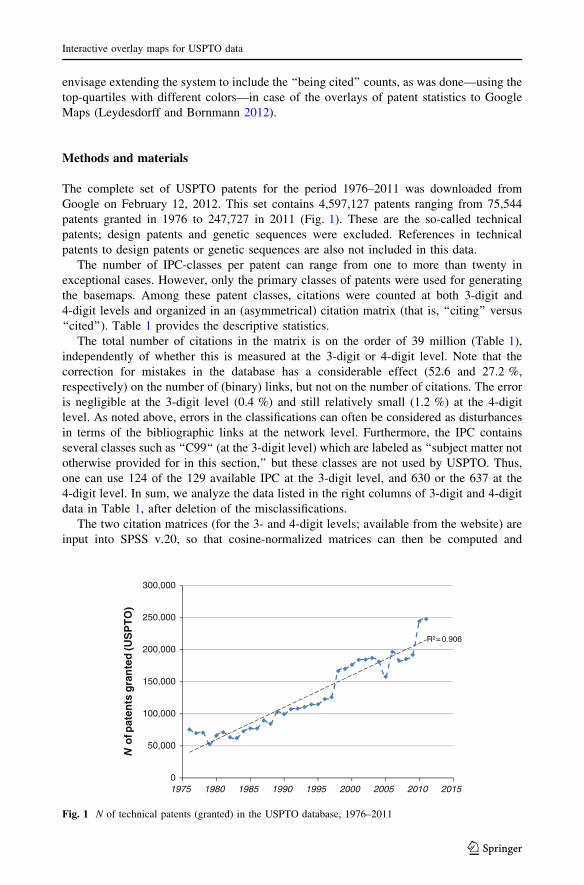
The complete set of USPTO patents for the period 1976–2011 was downloaded from
Google on February 12, 2012. This set contains 4,597,127 patents ranging from 75,544
patents granted in 1976 to 247,727 in 2011 (Fig. 1). These are the so-called technical
patents; design patents and genetic sequences were excluded. References in technical
patents to design patents or genetic sequences are also not included in this data.
The number of IPC-classes per patent can range from one to more than twenty in
exceptional cases. However, only the primary classes of patents were used for generating
the basemaps. Among these patent classes, citations were counted at both 3-digit and
4-digit levels and organized in an (asymmetrical) citation matrix (that is, ‘‘citing’’ versus
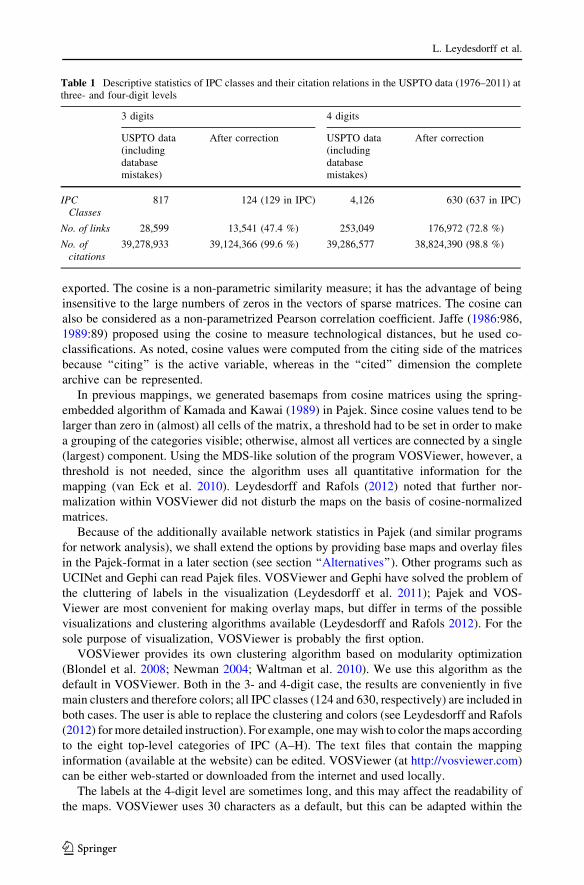
‘‘cited’’). Table 1 provides the descriptive statistics.
The total number of citations in the matrix is on the order of 39 million (Table 1),
independently of whether this is measured at the 3-digit or 4-digit level. Note that the
correction for mistakes in the database has a considerable effect (52.6 and 27.2 %,
respectively) on the number of (binary) links, but not on the number of citations. The error
is negligible at the 3-digit level (0.4 %) and still relatively small (1.2 %) at the 4-digit
level. As noted above, errors in the classifications can often be considered as disturbances
in terms of the bibliographic links at the network level. Furthermore, the IPC contains
several classes such as ‘‘C99‘‘ (at the 3-digit level) which are labeled as ‘‘subject matter not
otherwise provided for in this section,’’ but these classes are not used by USPTO. Thus,
one can use 124 of the 129 available IPC at the 3-digit level, and 630 or the 637 at the
4-digit level. In sum, we analyze the data listed in the right columns of 3-digit and 4-digit
data in Table 1, after deletion of the misclassifications.
The two citation matrices (for the 3- and 4-digit levels; available from the website) are
input into SPSS v.20, so that cosine-normalized matrices can then be computed and
R²= 0.906
0
50,000
100,000
150,000
200,000
250,000
300,000
1975 1980 1985 1990 1995 2000 2005 2010 2015
No
fpat
ents
gra
nte
d(U
SP
TO
)
Fig. 1 N of technical patents (granted) in the USPTO database, 1976–2011
Interactive overlay maps for USPTO data
123
exported. The cosine is a non-parametric similarity measure; it has the advantage of being
insensitive to the large numbers of zeros in the vectors of sparse matrices. The cosine can
also be considered as a non-parametrized Pearson correlation coefficient. Jaffe (1986:986,
1989:89) proposed using the cosine to measure technological distances, but he used co-
classifications. As noted, cosine values were computed from the citing side of the matrices
because ‘‘citing’’ is the active variable, whereas in the ‘‘cited’’ dimension the complete
archive can be represented.
In previous mappings, we generated basemaps from cosine matrices using the spring-
embedded algorithm of Kamada and Kawai (1989) in Pajek. Since cosine values tend to be
larger than zero in (almost) all cells of the matrix, a threshold had to be set in order to make
a grouping of the categories visible; otherwise, almost all vertices are connected by a single
(largest) component. Using the MDS-like solution of the program VOSViewer, however, a
threshold is not needed, since the algorithm uses all quantitative information for the
mapping (van Eck et al. 2010). Leydesdorff and Rafols (2012) noted that further nor-
malization within VOSViewer did not disturb the maps on the basis of cosine-normalized
matrices.
Because of the additionally available network statistics in Pajek (and similar programs
for network analysis), we shall extend the options by providing base maps and overlay files
in the Pajek-format in a later section (see section ‘‘Alternatives’’). Other programs such as
UCINet and Gephi can read Pajek files. VOSViewer and Gephi have solved the problem of
the cluttering of labels in the visualization (Leydesdorff et al. 2011); Pajek and VOS-
Viewer are most convenient for making overlay maps, but differ in terms of the possible
visualizations and clustering algorithms available (Leydesdorff and Rafols 2012). For the
sole purpose of visualization, VOSViewer is probably the first option.
VOSViewer provides its own clustering algorithm based on modularity optimization
(Blondel et al. 2008; Newman 2004; Waltman et al. 2010). We use this algorithm as the
default in VOSViewer. Both in the 3- and 4-digit case, the results are conveniently in five
main clusters and therefore colors; all IPC classes (124 and 630, respectively) are included in
both cases. The user is able to replace the clustering and colors (see Leydesdorff and Rafols
(2012) for more detailed instruction). For example, one may wish to color the maps according
to the eight top-level categories of IPC (A–H). The text files that contain the mapping
information (available at the website) can be edited. VOSViewer (at http://vosviewer.com)
can be either web-started or downloaded from the internet and used locally.
The labels at the 4-digit level are sometimes long, and this may affect the readability of
the maps. VOSViewer uses 30 characters as a default, but this can be adapted within the
Table 1 Descriptive statistics of IPC classes and their citation relations in the USPTO data (1976–2011) atthree- and four-digit levels
3 digits 4 digits
USPTO data(includingdatabasemistakes)
After correction USPTO data(includingdatabasemistakes)
After correction
IPCClasses
817 124 (129 in IPC) 4,126 630 (637 in IPC)
No. of links 28,599 13,541 (47.4 %) 253,049 176,972 (72.8 %)
No. ofcitations
39,278,933 39,124,366 (99.6 %) 39,286,577 38,824,390 (98.8 %)
L. Leydesdorff et al.
123
program interactively. One can also change the color selection interactively or turn off the
prevention of blurring of the labels that is provided as a default. In the case of long labels,
we follow the common practice of using the IPC (sub)headings by cutting off at a max-
imum of 75 characters, with three dots after the right-most space in the string. The user
may edit the files differently if so wished. A default of 30 characters works without
problems in the 3-digit case, but may require some editing in the 4-digit map. Note that the
length of the strings can affect the visibility of individual labels because the program
optimizes readability.
The maps provide a representation of distances between categories and the diversity
among categories in each specifically downloaded set of patents. In addition to the distance
on the visible map, xi � xj
��
��, the (technological) distance in the data between each two
classes can also be denoted analytically as dij = (1 – cosineij). The mapping program
projects the multivariate space—spanned by the citing patents as vectors of the matrix—
into the two dimensions of the map by minimizing a function such as Kruskall’s (1964)
stress.6
The technological distances between categories (dij) can also be summed and normal-
ized in accordance with the weight of the respective categories using their proportions in
the distribution. This leads us to the Rao-Stirling measure of diversity (D) that is some-
times also called ‘‘quadratic entropy’’ (e.g., Izsak and Papp 1995; cf. Rao 1982):
D ¼X
ijpipjdij: ð1Þ
Stirling (2007:712) proposed this measure as a summary statistics for analyzing
diversity and interdisciplinarity in studies of science, technology, and society (Leydesdorff
and Rafols 2011a; Rafols and Meyer 2010). The routine writes the values of this parameter
locally to a text-file (‘‘ipc_rao.txt’’) at both the 3-digit and 4-digit level.
In summary, we operationalize the technological distance between patent classes as the
complement of the cosine between the distributions of citations, and are then able to
compute diversity in terms of Eq. 1. The cosine matrices for both 3-level and 4-level IPC
are available at the webpage, and if these files are present, the routine writes in each run a
file ‘‘ipc_rao.txt’’ that contains the diversity measures given the two matrices at the
respective digit-levels.
Note that there is no hierarchical relation between the two maps because a patent may
contain a single category at the 3-digit level, under which many different 4-digit categories
can be subsumed that co-vary with other 4-digit categories at this level. In the case of the
overlays, IPC classes will be used proportionally, that is, as a proportion of the total
number of IPC classes attributed to each patent, so that each patent contributes a sum value
of unity to the overlays. Both the numbers of patents and the fractional counts are made
available in a file ‘‘vos.dbf’’ at the occasion of each run. Note that this file is overwritten by
a next run!
6 Kruskall’s formula (1964) is expressed as follows:
S ¼ffiffiffiffiffiffiffiffiffiffiffiffiffiffiffiffiffiffiffiffiffiffiffiffiffiffiffiffiffiffiffiffiP
i6¼jð xi�xjk k�dijÞ2P
i6¼jd2
ij
s
In addition to summing the differences between the visually available distances and the algorithmicdistances, this stress value is normalized at the level of the system of distances (in the denominator).Regrettably, VOSViewer does hitherto not provide a stress value for the (deterministic) visualization.
Interactive overlay maps for USPTO data
123
Results
Basemaps at the three- and four-digit level
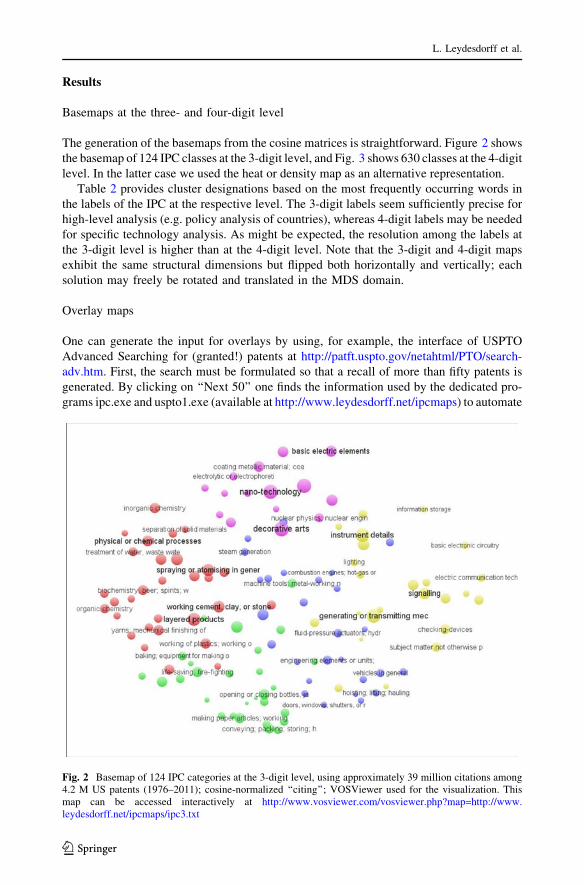
The generation of the basemaps from the cosine matrices is straightforward. Figure 2 shows
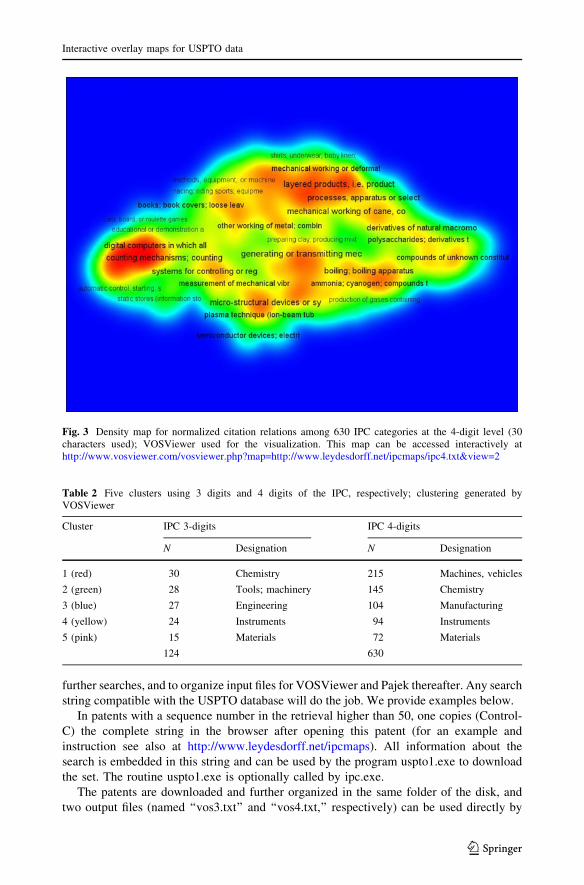
the basemap of 124 IPC classes at the 3-digit level, and Fig. 3 shows 630 classes at the 4-digit
level. In the latter case we used the heat or density map as an alternative representation.
Table 2 provides cluster designations based on the most frequently occurring words in
the labels of the IPC at the respective level. The 3-digit labels seem sufficiently precise for
high-level analysis (e.g. policy analysis of countries), whereas 4-digit labels may be needed
for specific technology analysis. As might be expected, the resolution among the labels at
the 3-digit level is higher than at the 4-digit level. Note that the 3-digit and 4-digit maps
exhibit the same structural dimensions but flipped both horizontally and vertically; each
solution may freely be rotated and translated in the MDS domain.
Overlay maps
One can generate the input for overlays by using, for example, the interface of USPTO
Advanced Searching for (granted!) patents at http://patft.uspto.gov/netahtml/PTO/search-
adv.htm. First, the search must be formulated so that a recall of more than fifty patents is
generated. By clicking on ‘‘Next 50’’ one finds the information used by the dedicated pro-
grams ipc.exe and uspto1.exe (available at http://www.leydesdorff.net/ipcmaps) to automate
Fig. 2 Basemap of 124 IPC categories at the 3-digit level, using approximately 39 million citations among4.2 M US patents (1976–2011); cosine-normalized ‘‘citing’’; VOSViewer used for the visualization. Thismap can be accessed interactively at http://www.vosviewer.com/vosviewer.php?map=http://www.leydesdorff.net/ipcmaps/ipc3.txt
L. Leydesdorff et al.
123
further searches, and to organize input files for VOSViewer and Pajek thereafter. Any search
string compatible with the USPTO database will do the job. We provide examples below.
In patents with a sequence number in the retrieval higher than 50, one copies (Control-
C) the complete string in the browser after opening this patent (for an example and
instruction see also at http://www.leydesdorff.net/ipcmaps). All information about the
search is embedded in this string and can be used by the program uspto1.exe to download
the set. The routine uspto1.exe is optionally called by ipc.exe.
The patents are downloaded and further organized in the same folder of the disk, and
two output files (named ‘‘vos3.txt’’ and ‘‘vos4.txt,’’ respectively) can be used directly by
Fig. 3 Density map for normalized citation relations among 630 IPC categories at the 4-digit level (30characters used); VOSViewer used for the visualization. This map can be accessed interactively athttp://www.vosviewer.com/vosviewer.php?map=http://www.leydesdorff.net/ipcmaps/ipc4.txt&view=2
Table 2 Five clusters using 3 digits and 4 digits of the IPC, respectively; clustering generated byVOSViewer
Cluster IPC 3-digits IPC 4-digits
N Designation N Designation
1 (red) 30 Chemistry 215 Machines, vehicles
2 (green) 28 Tools; machinery 145 Chemistry
3 (blue) 27 Engineering 104 Manufacturing
4 (yellow) 24 Instruments 94 Instruments
5 (pink) 15 Materials 72 Materials
124 630
Interactive overlay maps for USPTO data
123
VOSViewer as input for generating overlays. In addition to ‘‘ipc.exe’’, the user should first
download also the files ‘‘ipc.dbf’’ and ‘‘uspto1.exe’’ from the same website into the same
folder because these files are also required. If the files ‘‘cos_ipc3.dbf’’ and ‘‘cos_ipc4.dbf’’
are also downloaded from the website, the routine writes a local file ‘‘ipc_rao.txt’’ con-
taining the Rao-Stirling diversity values for three and four digits, respectively.
The program ipc.exe opens with the option to download patents in this run or use
patents downloaded in a previous run. Note that patents from a previous run are over-
written in the case of a new download; one should save them elsewhere for future use. The
USPTO limits the number of downloads to one thousand, but one can begin subsequent
downloads at 1001, 2001, etc. The program accepts subsequent numberings. In this case,
one should use uspto1.exe directly, because ipc.exe overwrites results from previous runs.
In the output of the routine (‘‘vos3.txt’’ and ‘‘vos4.txt’’) the IPC classes assigned by the
USPTO to patents in the download are organized into the map files of VOSViewer on the
basis of counting each IPC attribution in proportion to the total number of classes attributed
to the patent at the level in question. In the ‘‘label view’’ of VOSViewer, the empty classes
are made visible as little grey dots for the orientation of the user, but these classes are not
labeled. The classes in use are normalized proportionally to the logarithm of the number ?1.
The ‘‘?1’’ prevents single occurrences or fractions smaller than unity from disappearing.7
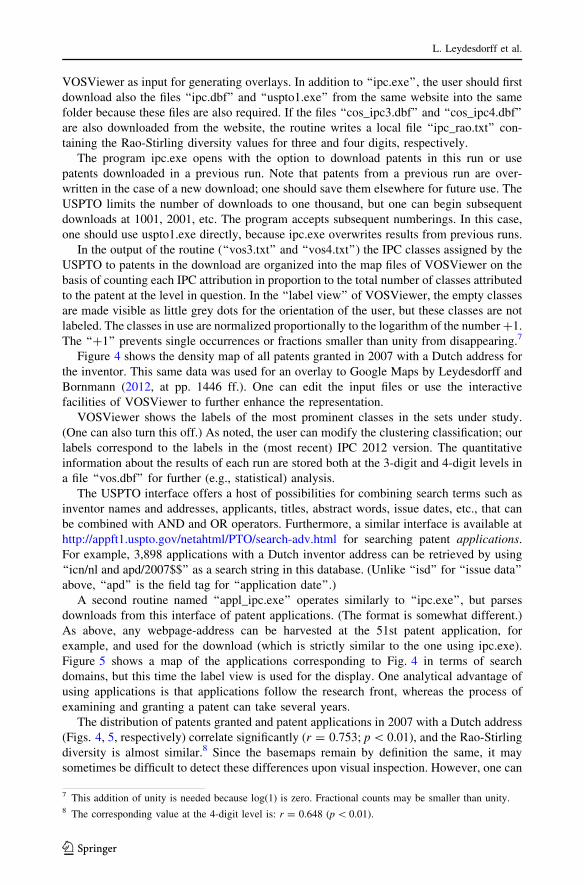
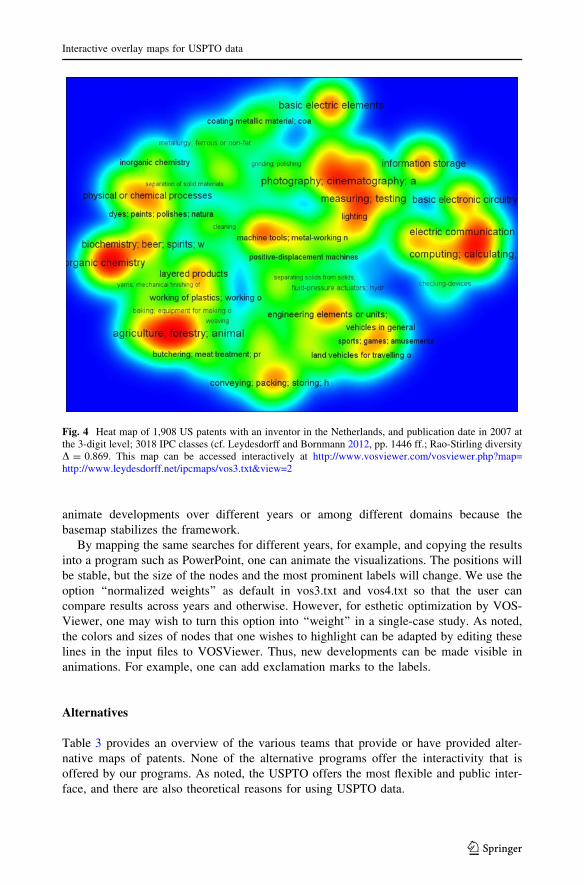
Figure 4 shows the density map of all patents granted in 2007 with a Dutch address for
the inventor. This same data was used for an overlay to Google Maps by Leydesdorff and
Bornmann (2012, at pp. 1446 ff.). One can edit the input files or use the interactive
facilities of VOSViewer to further enhance the representation.
VOSViewer shows the labels of the most prominent classes in the sets under study.
(One can also turn this off.) As noted, the user can modify the clustering classification; our
labels correspond to the labels in the (most recent) IPC 2012 version. The quantitative
information about the results of each run are stored both at the 3-digit and 4-digit levels in
a file ‘‘vos.dbf’’ for further (e.g., statistical) analysis.
The USPTO interface offers a host of possibilities for combining search terms such as
inventor names and addresses, applicants, titles, abstract words, issue dates, etc., that can
be combined with AND and OR operators. Furthermore, a similar interface is available at
http://appft1.uspto.gov/netahtml/PTO/search-adv.html for searching patent applications.
For example, 3,898 applications with a Dutch inventor address can be retrieved by using
‘‘icn/nl and apd/2007$$’’ as a search string in this database. (Unlike ‘‘isd’’ for ‘‘issue data’’
above, ‘‘apd’’ is the field tag for ‘‘application date’’.)
A second routine named ‘‘appl_ipc.exe’’ operates similarly to ‘‘ipc.exe’’, but parses
downloads from this interface of patent applications. (The format is somewhat different.)
As above, any webpage-address can be harvested at the 51st patent application, for
example, and used for the download (which is strictly similar to the one using ipc.exe).
Figure 5 shows a map of the applications corresponding to Fig. 4 in terms of search
domains, but this time the label view is used for the display. One analytical advantage of
using applications is that applications follow the research front, whereas the process of
examining and granting a patent can take several years.
The distribution of patents granted and patent applications in 2007 with a Dutch address
(Figs. 4, 5, respectively) correlate significantly (r = 0.753; p \ 0.01), and the Rao-Stirling
diversity is almost similar.8 Since the basemaps remain by definition the same, it may
sometimes be difficult to detect these differences upon visual inspection. However, one can
7 This addition of unity is needed because log(1) is zero. Fractional counts may be smaller than unity.8 The corresponding value at the 4-digit level is: r = 0.648 (p \ 0.01).
L. Leydesdorff et al.
123
animate developments over different years or among different domains because the
basemap stabilizes the framework.
By mapping the same searches for different years, for example, and copying the results
into a program such as PowerPoint, one can animate the visualizations. The positions will
be stable, but the size of the nodes and the most prominent labels will change. We use the
option ‘‘normalized weights’’ as default in vos3.txt and vos4.txt so that the user can
compare results across years and otherwise. However, for esthetic optimization by VOS-
Viewer, one may wish to turn this option into ‘‘weight’’ in a single-case study. As noted,
the colors and sizes of nodes that one wishes to highlight can be adapted by editing these
lines in the input files to VOSViewer. Thus, new developments can be made visible in
animations. For example, one can add exclamation marks to the labels.
Alternatives
Table 3 provides an overview of the various teams that provide or have provided alter-
native maps of patents. None of the alternative programs offer the interactivity that is
offered by our programs. As noted, the USPTO offers the most flexible and public inter-
face, and there are also theoretical reasons for using USPTO data.
Fig. 4 Heat map of 1,908 US patents with an inventor in the Netherlands, and publication date in 2007 atthe 3-digit level; 3018 IPC classes (cf. Leydesdorff and Bornmann 2012, pp. 1446 ff.; Rao-Stirling diversityD = 0.869. This map can be accessed interactively at http://www.vosviewer.com/vosviewer.php?map=http://www.leydesdorff.net/ipcmaps/vos3.txt&view=2
Interactive overlay maps for USPTO data
123

Leydesdorff (2008) also discussed mapping one year of PCT-patents at WIPO using co-
classifications. Boyack and Klavans (2008) used co-classifications, but the objective of
these authors was to analyze science-technology interrelations in terms of inventors and
scholarly authors. Their map (at p. 181) also explores relations to industrial sectors (cf.
Hinze et al. 1997; Schmoch et al. 2003).
Schoen et al. (2012) uses a selection of patents based on firm-selection within and
outside the European Union. These authors also decided for co-classification after
Fig. 5 Overlay map of 3,898 US patent applications with at least one inventor address in the Netherlands,and application date of 2007 at the 3-digit level; 7,872 IPC classes; Rao-Stirling diversity D = 0.848.http://www.vosviewer.com/vosviewer.php?map=http://www.leydesdorff.net/ipcmaps/vos3appl.txt
Table 3 Comparison among alternative programs for mapping patents
Kay et al. (2012) Schoen et al.(2012)
Boyack and Klavans(2008)
This study
Database EPO 2000–2006 CIB 1986–2006 USPTO 2002–2006 USPTO 1976–2010
No. of patents 760,000 [6 million 907,500 4,597,127
No. of IPCclasses
486 IPC7(modified)
389 290 124 3-digit
630 4-digit
Nr of citations 28,457,418 0 0 Appr. 39 M (seeTable 1)
Similaritymeasure
Cosine Non-normalized K50 measure Cosine
Visualization Pajek Gephi VxOrd VOSViewer, Pajek
L. Leydesdorff et al.
123
comparing the results with citation analysis. Kay et al. (2012) argue (with us) for using
citation analysis among patent categories and against using co-classifications, but these
authors unfortunately used the previous version of IPC (v. 7) and manipulated the cate-
gories so that they are equal sized. In our opinion, the different sizes can be normalized
using the cosine.
The programs differ also in terms of the visualization techniques. In our opinion, Gephi
and VOSViewer offer superior visualization techniques (Leydesdorff et al. 2011), but
Gephi and Pajek/UCINet offer network statistics. However, the comparison made us
realize that with little effort we could also make our outputs compatible with Pajek, and via
Pajek also for Gephi (which reads Pajek files). This offers additional flexibilities such as
using algorithms for community detection among a host of other network statistics which
are available in Pajek and Gephi, but not in VOSViewer.
Baseline maps for Pajek in the 3-digit and 4-digit format can be retrieved at
http://www.leydesdorff.net/ipcmaps/ipc3.paj and http://www.leydesdorff.net/ipcmaps/
ipc4.paj, respectively. The available baselines were in this case partitioned—for didactic
purposes—using Blondel et al.’s (2008) algorithm for community finding. Without a
threshold for the cosine, the visualization is not informative. Using a threshold of
cosine [0.2, the largest components contain 109 of the 124 classes at the 3-digit level (11
communities; Q = 0.529), and 605 of the 630 classes at the 4-digit level (21 communities;
Q = 0.681). However, the experienced user can change these base maps and their parti-
tioning or coloring using the options available in Pajek (or Gephi).9
Both routines (ipc.exe and appl_ipc.exe) provide two vector files (ipc3.vec and ipc4.vec,
respectively) with the same values—‘‘weights’’ in VOSViewer—as used above; that is, the
fractionally counted patents/IPC class. These vector files can be used for the visualization
of the patent contributions to IPC classes in the downloaded sample(s) under study.
Additionally, the so-called cluster files ipc3.cls and ipc4.cls (in the Pajek format) enable the
user to label the sample under study exclusively in the Draw screen under Options [Mark
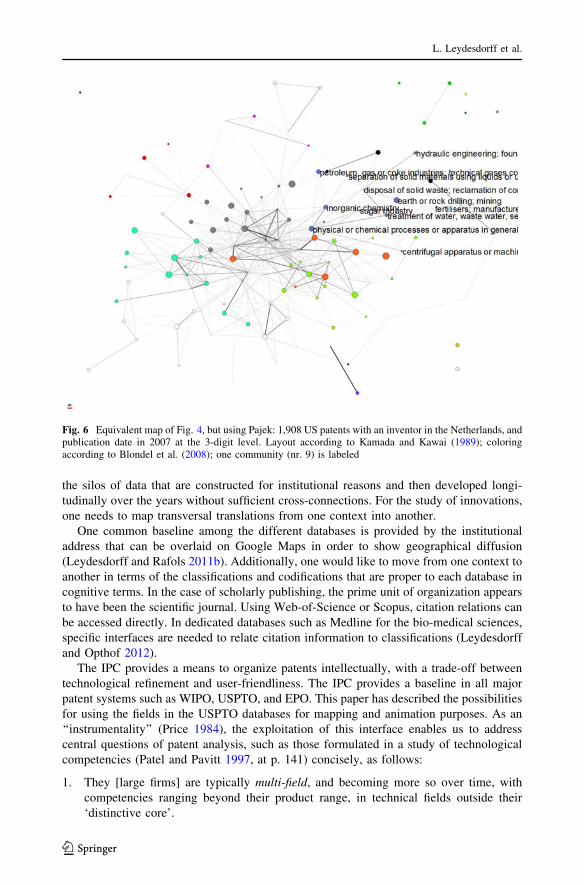
Vertices Using[Mark Cluster only. As an example, Fig. 6 provides a visualization of the same
set as used in Fig. 4 with VOSViewer, but now using the spring-embedded algorithm of Kamada
and Kawai (1989) and exclusive labeling for one of the communities of IPC classes in this set.
All these programs enable the user to export the visualizations as ‘‘scalable vector
graphics’’ (SVG). SVG-files can be edited in considerable detail using the freeware pro-
gram InkScape (at http://inkscape.org) or commercial software such as Adobe Illustrator.
Pajek files can also be used by other network analysis and visualization programs such as
Gephi, VOSViewer, or UCINet. Note that one can zoom in on dense parts in the Draw
screen of Pajek using the right mouse button for selecting specific areas in the map.
Conclusion
By providing basemaps for USPTO data in terms of the IPC and flexible tools for over-
laying patent classifications on top of them both at the coarse-grained level of three digits
and the fine-grained level of four digits, we have complemented our series of studies and
tool development efforts to follow new development more systematically across databases.
Griliches (1994:14) already noted that the core problem in studying innovations has been
9 The full cosine matrices are available at http://www.leydesdorff.net/ipcmaps/cos_ipc3.dbf andhttp://www.leydesdorff.net/ipcmaps/cos_ipc4.dbf for those users who wish to be able to work with cosinevalues lower than the current threshold of 0.2.
Interactive overlay maps for USPTO data
123
the silos of data that are constructed for institutional reasons and then developed longi-
tudinally over the years without sufficient cross-connections. For the study of innovations,
one needs to map transversal translations from one context into another.
One common baseline among the different databases is provided by the institutional
address that can be overlaid on Google Maps in order to show geographical diffusion
(Leydesdorff and Rafols 2011b). Additionally, one would like to move from one context to
another in terms of the classifications and codifications that are proper to each database in
cognitive terms. In the case of scholarly publishing, the prime unit of organization appears
to have been the scientific journal. Using Web-of-Science or Scopus, citation relations can
be accessed directly. In dedicated databases such as Medline for the bio-medical sciences,
specific interfaces are needed to relate citation information to classifications (Leydesdorff
and Opthof 2012).
The IPC provides a means to organize patents intellectually, with a trade-off between
technological refinement and user-friendliness. The IPC provides a baseline in all major
patent systems such as WIPO, USPTO, and EPO. This paper has described the possibilities
for using the fields in the USPTO databases for mapping and animation purposes. As an
‘‘instrumentality’’ (Price 1984), the exploitation of this interface enables us to address
central questions of patent analysis, such as those formulated in a study of technological
competencies (Patel and Pavitt 1997, at p. 141) concisely, as follows:
1. They [large firms] are typically multi-field, and becoming more so over time, with
competencies ranging beyond their product range, in technical fields outside their
‘distinctive core’.
Fig. 6 Equivalent map of Fig. 4, but using Pajek: 1,908 US patents with an inventor in the Netherlands, andpublication date in 2007 at the 3-digit level. Layout according to Kamada and Kawai (1989); coloringaccording to Blondel et al. (2008); one community (nr. 9) is labeled
L. Leydesdorff et al.
123
2. They are highly stable and differentiated, with both the technology profile and the
directions of localised search strongly influenced by firms’ principal products.
3. The rate of search is influenced by both the firm’s principal products, and the
conditions in its home country. However, considerable unexplained variance suggests
scope for managerial choice.
These conclusions identify a research program. The instruments provided here offer
tools for addressing such a program of studies in quantitative terms (e.g., in terms of Rao-
Stirling diversity) and for illustrating the results with animations of, for example, diffusion
and diversification processes. Nowadays, the Internet enables us to upscale and use ‘‘big
data’’ for performing these studies of science, technology, and innovation (Helbing and
Balietti 2011). In our opinion, the development of interfaces to access different databases
(‘‘big data’’) with flexibility, but with similar or equal search strings provides a strategy
which may enable us to follow new developments in science and technology along tra-
jectories and potentially developing into regimes (Leydesdorff et al. 2012).
In most previous studies using OECD data, for example, analysis remained at the
aggregated level and static analysis consequently prevailed (e.g., Jaffe 1989; Patel and
Pavitt 1997). These new instruments enable us to study individual firms, nations, and new
technologies in considerable detail and dynamically by following the available retrieval
options and tracing the various classifications at USPTO. In a follow-up, we envisage
studying. For example, the new classes of ‘‘nanotechnology’’ developed in the IPC and
available as B82$ in USPTO,10 and/or differently in the US Classification System as 977.11
Such a study would allow one to follow the changing position of ‘‘nano-patents’’ in terms
of IPC classifications over time.
Acknowledgments We acknowledge support by the ESRC project ‘Mapping the Dynamics of EmergentTechnologies’ (RES-360-25-0076). We are grateful to Nils Newman and Antoine Schoen for previouscomments and communications.
References
Ahlgren, P., Jarneving, B., & Rousseau, R. (2003). Requirements for a cocitation similarity measure, withspecial reference to Pearson’s correlation coefficient. Journal of the American Society for InformationScience and Technology, 54(6), 550–560.
Alcacer, J., Gittelman, M., & Sampat, B. (2009). Applicant and examiner citations in U.S. patents: anoverview and analysis. Research Policy, 38(2), 415–427.
Blondel, V. D., Guillaume, J. L., Lambiotte, R., & Lefebvre, E. (2008). Fast unfolding of communities inlarge networks. Journal of Statistical Mechanics: Theory and Experiment, 8(10), 10008.
Bornmann, L., & Leydesdorff, L. (2011). Which cities produce excellent papers worldwide more than can beexpected? A new mapping approach–using Google Maps–based on statistical significance testing.Journal of the American Society for Information Science and Technology, 62(10), 1954–1962.
Boyack, K. W., Borner, K., & Klavans, R. (2009). Mapping the structure and evolution of chemistryresearch. Scientometrics, 79(1), 45–60.
Boyack, K. W., & Klavans, R. (2008). Measuring science–technology interaction using rare inventor–authornames. Journal of Informetrics, 2(3), 173–182.
Breschi, S., Lissoni, F., & Malerba, F. (2003). Knowledge-relatedness in firm technological diversification.Research Policy, 32(1), 69–87.
10 Since April 2009, class B82 in IPC replaces the previous class Y01 in ECLA.11 A search with ‘‘icl/B82$’’ provided a recall of 344 patents on September 25, 2012, whereas a search with‘‘ccl/977$)’’ provided a recall of 8,134 patents. Of these two sets 249 overlap (using an AND statement).
Interactive overlay maps for USPTO data
123
Criscuolo, P. (2006). The ‘home advantage’ effect and patent families: a comparison of OECD triadicpatents, the USTPTO and EPO. Scientometrics, 66(1), 23–41.
Criscuolo, P., & Verspagen, B. (2008). Does it matter where patent citations come from? Inventor versusexaminer citations in European patents. Research Policy, 37(10), 1892–1908.
de Nooy, W., Mrvar, A., & Batgelj, V. (2011). Exploratory Social Network Analysis with Pajek (2nd ed.).New York: Cambridge University Press.
Dolfsma, W., & Leydesdorff, L. (2011). Innovation systems as patent networks: the Netherlands, India andnanotech. Innovation Management, Policy and Practice, 13(3), 311–326.
Griliches, Z. (Ed.). (1984). R&D, Patents, and Productivity. Chicago, IL: University of Chicago Press.Griliches, Z. (1994). Productivity, R&D and the Data constraint. American Economic Review, 84(1), 1–23.Helbing, D., & Balietti, S. (2011). How to create an innovation accelerator. The European Physical Journal-
Special Topics, 195(1), 101–136.Henderson, R., Jaffe, A., & Trajtenberg, M. (2005). Patent citations and the geography of knowledge
spillovers: a reassessment—comment. The American Economic Review, 95(1), 461–464.Hinze, S., Reiss, T., & Schmoch, U. (1997). Statistical Analysis on the Distance Between Fields of
Technology. Innovation Systems and European Integration (ISE), Targeted Socio-Economic ResearchProgram, 4th Framework Program of the European Commission (DG XII). Karlsruhe: FraunhoferInstitute for Systems and Innovation Research (ISI).
Izsak, J., & Papp, L. (1995). Application of the quadratic entropy indices for diversity studies of drosophilidassemblages. Environmental and Ecological Statistics, 2(3), 213–224.
Jaffe, A. B. (1986). Technological Opportunity and Spillovers of R&D: evidence from Firm’s Patents,Profits, and Market Value. American Economic Review, 76(5), 984–1001.
Jaffe, A. B. (1989). Real effects of academic research. The American Economic Review, 957–970.Jaffe, A. B., & Trajtenberg, M. (2002). Patents, Citations, and Innovations: A Window on the Knowledge
Economy. Cambridge: MIT Press.Kamada, T., & Kawai, S. (1989). An algorithm for drawing general undirected graphs. Information Pro-
cessing Letters, 31(1), 7–15.Kay, L., Newman, N., Youtie, J., Porter, A. L., & Rafols, I. (2012). Patent Overlay Mapping: Visualizing
Technological Distance. Arxiv preprint arXiv:1208.4380.Klavans, R., & Boyack, K. (2009). Towards a consensus map of science. Journal of the American Society
for Information Science and Technology, 60(3), 455–476.Kline, S., & Rosenberg, N. (1986). An overview of innovation. In R. Landau & N. Rosenberg (Eds.), The
Positive Sum Strategy: Harnessing Technology for Economic Growth (pp. 275–306). Washington, DC:National Academy Press.
Kruskal, J. B. (1964). Multidimensional scaling by optimizing goodness of fit to a nonmetric hypothesis.Psychometrika, 29(1), 1–27.
Leydesdorff, L. (2004). The university-industry knowledge relationship: analyzing patents and the sciencebase of technologies. Journal of the American Society for Information Science and Technology, 55(11),991–1001.
Leydesdorff, L. (2008). Patent classifications as indicators of intellectual organization. Journal of theAmerican Society for Information Science and Technology, 59(10), 1582–1597.
Leydesdorff, L., & Bornmann, L. (2012). Mapping (USPTO) patent data using overlays to Google Maps.Journal of the American Society for Information Science and Technology, 63(7), 1442–1458.
Leydesdorff, L., Hammarfelt, B., & Salah, A. A. A. (2011). The structure of the arts and humanities citationindex: a mapping on the basis of aggregated citations among 1,157 journals. Journal of the AmericanSociety for Information Science and Technology, 62(12), 2414–2426.
Leydesdorff, L., & Meyer, M. (2010). The Decline of University Patenting and the End of the Bayh-DoleEffect. Scientometrics, 83(2), 355–362.
Leydesdorff, L., & Opthof, T. (2012). Citation analysis with medical subject headings (MeSH) using theweb of knowledge: a new routine. Journal of the American Society for Information Science andTechnology (in press).
Leydesdorff, L., & Persson, O. (2010). Mapping the geography of science: distribution patterns and net-works of relations among cities and institutes. Journal of the American Society of Information Scienceand Technology, 61(8), 1622–1634.
Leydesdorff, L., & Rafols, I. (2011a). Indicators of the interdisciplinarity of journals: diversity, centrality,and citations. Journal of Informetrics, 5(1), 87–100.
Leydesdorff, L., & Rafols, I. (2011b). How do emerging technologies conquer the world? an exploration ofpatterns of diffusion and network formation. Journal of the American Society for Information Scienceand Technology, 62(5), 846–860.
L. Leydesdorff et al.
123
Leydesdorff, L., & Rafols, I. (2012). Interactive overlays: a new method for generating global journal mapsfrom web-of-science data. Journal of Informetrics, 6(3), 318–332.
Leydesdorff, L., Rotolo, D., & de Nooy, W. (in press). Innovation as a nonlinear process, the scientometricperspective, and the specification of an ‘‘innovation opportunities explorer’’. Technology Analysis andStrategic Management. http://arxiv.org/abs/1202.6235.
Leydesdorff, L., Rotolo, D., & Rafols, I. (2012). Bibliometric perspectives on medical innovation using themedical subject headings (MeSH) of PubMed. Journal of the American Society for Information Scienceand Technology, 63(11), 2239–2253.
Narin, F. (2012). Tracing the Paths from Basic Research to Economic Impact. F&M Scientist (undersubmission).
Narin, F., Hamilton, K. S., & Olivastro, D. (1997). The increasing link between US technology and publicscience. Research Policy, 26(3), 317–330.
Newman, M. E. J. (2004). Fast algorithm for detecting community structure in networks. Physical Review E,69(6), 066133.
Patel, P., & Pavitt, K. (1997). The technological competencies of the world’s largest firms: complex andpath-dependent, but not much variety. Research Policy, 26(2), 141–156.
Price, D. J. S. (1984). The science/technology relationship, the craft of experimental science, and policy forthe improvement of high technology innovation. Research Policy, 13, 3–20.
Rafols, I., Leydesdorff, L., O’Hare, A., Nightingale, P., & Stirling, A. (2012). How journal rankings cansuppress interdisciplinary research: a comparison between innovation studies and business and man-agement. Research Policy, 41(7), 1262–1282.
Rafols, I., & Meyer, M. (2010). Diversity and network coherence as indicators of interdisciplinarity: casestudies in bionanoscience. Scientometrics, 82(2), 263–287.
Rafols, I., Porter, A., & Leydesdorff, L. (2010). Science overlay maps: a new tool for research policy andlibrary management. Journal of the American Society for Information Science and Technology, 61(9),1871–1887.
Rao, C. R. (1982). Diversity: Its measurement, decomposition, apportionment and analysis. Sankhy : TheIndian Journal of Statistics, Series A, 44(1), 1–22.
Rosenberg, N., & Nelson, R. R. (1994). American universities and technical advance in industry. ResearchPolicy, 23, 323–348.
Schmoch, U., Laville, F., Patel, P., & Frietsch, R. (2003). Linking technology areas to industrial sectors.Final Report to the European Commission, DG Research. ftp://ftp.cordis.europa.eu/pub/indicators/docs/ind_report_isi_ost_spru.pdf.
Schoen, A. (2011). A Global Map of Technology. Paper presented at the IPTS Patent Workshop, Seville,Spain, June 13–14.
Schoen, A., Villard, L., Laurens, P., Cointet, J.-P., Heimeriks, G., & Alkemade, F. (2012). The NetworkStructure of Technological Developments; Technological Distance as a Walk on the Technology Map.Paper presented at the Science & Technology Inidicators (STI) 2012 Montreal.
Shelton, R. D., & Leydesdorff, L. (2012). Publish or Patent: bibliometric evidence for empirical trade-offs innational funding strategies. Journal of the American Society for Information Science and Technology,63(3), 498–511.
Stirling, A. (2007). A general framework for analysing diversity in science, technology and society. Journalof the Royal Society, Interface, 4(15), 707–719.
Van Eck, N. J., & Waltman, L. (2010). Software survey: VOSviewer, a computer program for bibliometricmapping. Scientometrics, 84(2), 523–538.
van Eck, N. J., Waltman, L., Dekker, R., & van den Berg, J. (2010). A comparison of two techniques forbibliometric mapping: multidimensional scaling and VOS. Journal of the American Society forInformation Science and Technology, 61(12), 2405–2416.
Von Hippel, E. (1988). The Sources of Innovation. New York/Oxford: Oxford University Press.Waltman, L., van Eck, N. J., & Noyons, E. (2010). A unified approach to mapping and clustering of
bibliometric networks. Journal of Informetrics, 4(4), 629–635.
Interactive overlay maps for USPTO data
123