Interactive health technologies and value co creation: the
17
Measuring the Impact of the Jobs Initiative: Was the VAT Reduction Passed On and Were Jobs Created? Brendan O’Connor 1 The Jobs Initiative In May 2011 the Government announced a Jobs Initiative which involved a series of measures to boost employment. A key aspect of the Jobs Initiative involved a reduction in the rate of VAT which was targeted mainly at labour intensive goods and services relating to tourism. In this context, a new temporary second reduced rate of VAT at 9% was introduced with effect from 1 July 2011 until end-December 2013. The 9% rate applies to the following categories which had previously been subject to VAT at 13.5%: • The supply of food and drink (excluding alcohol and soft drinks) in the course of catering or by means of a vending machine; • Hot take-away food and hot drinks; • Hotel lettings, including guesthouses, caravan parks, camping sites etc; • Admissions to cinemas, theatres, certain musical performances, museums, art gallery exhibitions; • Amusement services of the kind normally supplied in fairgrounds or amusement park services; • The provision of facilities for taking part in sporting activities by a person other than a non-profit making organisation; • Printed matter e.g. newspapers, brochures, leaflets, programmes, maps, catalogues, printed music (excluding books); and, • Hairdressing services. The exact items from these categories which are included in the CPI basket are set out in the Annex to this paper. This measure was estimated to cost €120 million in 2011 and €350 million in a full year. All other goods and services to which a reduced rate had applied remained subject to the 13.5% rate. In addition, the Finance Act 2012 provided that admissions to historic houses, open farms and built & natural heritage facilities became subject to the 9% VAT rate from 1 January 2012. However, as these services had formerly been exempt from VAT, they are not part of the services being analysed in this study. 1 The author is a senior economist in the fiscal section of the Department of Finance’s Economics Division. An earlier draft was submitted to the Tax Strategy Group. The author thanks colleagues in the Economics and Fiscal Divisions as well as members of the Tax Strategy Group for helpful comments.
Transcript of Interactive health technologies and value co creation: the

Measuring the Impact of the Jobs Initiative:
Was the VAT Reduction Passed On and Were Jobs Created?
Brendan O’Connor1
The Jobs Initiative In May 2011 the Government announced a Jobs Initiative which involved a series of
measures to boost employment. A key aspect of the Jobs Initiative involved a reduction in the
rate of VAT which was targeted mainly at labour intensive goods and services relating to
tourism. In this context, a new temporary second reduced rate of VAT at 9% was introduced
with effect from 1 July 2011 until end-December 2013.
The 9% rate applies to the following categories which had previously been subject to VAT at
13.5%:
• The supply of food and drink (excluding alcohol and soft drinks) in the course of
catering or by means of a vending machine;
• Hot take-away food and hot drinks;
• Hotel lettings, including guesthouses, caravan parks, camping sites etc;
• Admissions to cinemas, theatres, certain musical performances, museums, art gallery
exhibitions;
• Amusement services of the kind normally supplied in fairgrounds or amusement park
services;
• The provision of facilities for taking part in sporting activities by a person other than
a non-profit making organisation;
• Printed matter e.g. newspapers, brochures, leaflets, programmes, maps, catalogues,
printed music (excluding books); and,
• Hairdressing services.
The exact items from these categories which are included in the CPI basket are set out in the
Annex to this paper.
This measure was estimated to cost €120 million in 2011 and €350 million in a full year.
All other goods and services to which a reduced rate had applied remained subject to the
13.5% rate. In addition, the Finance Act 2012 provided that admissions to historic houses,
open farms and built & natural heritage facilities became subject to the 9% VAT rate from 1
January 2012. However, as these services had formerly been exempt from VAT, they are not
part of the services being analysed in this study.
1 The author is a senior economist in the fiscal section of the Department of Finance’s Economics Division.
An earlier draft was submitted to the Tax Strategy Group. The author thanks colleagues in the Economics
and Fiscal Divisions as well as members of the Tax Strategy Group for helpful comments.

As a result of the VAT reduction, VAT receipts in the ‘Accommodation and Food Services’
economic sector have trailed their level in the same month in the preceding year for each of
the months in which the 9% VAT rate has applied. This is shown in Figure 1.
The reduction in VAT targeted from the tourism sector is consistent with the economic
literature which suggests that the price elasticity of demand for tourism related goods is
relatively elastic.2 This means that consumer demand increases by proportionately more than
the percentage reduction in prices in the tourism sector. It was hoped that this demand side
stimulus would increase the demand for jobs in the sector through consumer responses to
lower prices and by sustaining employer margins.
The Minister for Finance announced in his Jobs Initiative speech that to ensure that the
tourism sector is delivering added employment from the 9% rate of VAT, the effects of the
changes will be assessed and the measures reviewed before the end of 2012 in the context of
preparing Budget 2013.
One of the means of testing the effectiveness of the stimulus would be an examination of rate
of pass through of the VAT reduction to lower consumer prices. Data limitations mean that a
study of employer level margins is not possible.
A full year of monthly price data has been provided by the CSO for the affected goods and
services. It is therefore timely to analyse the price trends that have emerged.
The Data
2 Durbarry, R. (2008). Tourism Taxes, Implications for Tourism Demand in the UK. Review of Development
Economics, 12(1), 21–36.
Figure 1: Change in VAT receipts versus same month in previous year,
Accommodation and Food Services
-50%-45%-40%-35%-30%
-25%-20%-15%-10%-5%0%
Change in VAT receipts versus same month in previous year
- Accommodation and Food Services
June 2011=100
Source: The Revenue Commissioners

The CSO publishes monthly changes in the consumer price index relative to a base year price
(currently December 2011). The CSO ordinarily publishes changes in twelve sub-indices
(food and non-alcoholic beverages, clothing and footwear, etc.) which are further
disaggregated on the CSO databank. The published sub-indices do not correspond to the
categories for which the 9% VAT rate was introduced.
On foot of a special request from the Department, the CSO in consultation with the Revenue
Commissioners constructed price series that match with the goods and services at the reduced
9% rate. In all, an index of prices has been constructed for each of the eight reduced VAT
categories as well an overall series that covers all of the 9% VAT rate items. The relevant
items and their respective series are listed in the Annex to this paper.
Employment data is available from the CSO quarterly national household survey (QNHS).
The level of aggregation of activities only permits a meaningful analysis of the employment
impact in food and accommodation services (NACE economic sector I). All other categories
for which the 9% reduced VAT rate applies are small components of wider economic sectors
in the context of the QNHS. Whilst it is not possible to analyse the employment impact for
these other activities, accommodation and food services account for over 70% of expenditure
on the 9% items and can thus be considered a reasonable proxy for the overall employment
impact of the 9% items.
VAT rate pass through The price level for each series in June 2011 – the month prior to the VAT rate reduction – has
been set as a base for this analysis. The trends in prices are compared to this month. Price
data are available up to June 2012.
Between June 2011 and June 2012 overall economy wide inflation increased by 1.7%,
whereas aggregate inflation for the sectors covered by the VAT reduction fell by 1.5%.
It should be noted that the headline inflation rate as measured by the CPI was influenced by
higher than headline rates of inflation in energy and administered prices. To get an
understanding of underlying inflation in the economy an inflation series excluding these two
categories has been constructed. This series recorded a 0.3% price rise over the same period.
The reduction in price in the affected sectors following the VAT reduction is still favourable
when compared to underlying inflation.

Whilst overall prices covered by the VAT reduction fell compared with economy wide
headline and underlying inflation, different rates of inflation occurred in the various
categories covered by the Jobs Initiative.
For example clear evidence of pass through occurred in the following series:
• Meals out;
• Hairdressing;
• Admissions to cinemas, theatres, musicals, museums and art galleries; and,
• Newspapers.
Significant price volatility occurred in the ‘hotels and other accommodation’ series which fell
by 13% from July 2011 to January 2012, and recovered to within 1% of the June 2011 price
level by June 2012. This is driven by the cyclical nature of hotel prices which peak in mid-
year and decline thereafter. Another series impacted by seasonality is hairdressing services
with a clear ‘December effect’ causing a temporary spike in prices around the Christmas
period.
The price changes in each of the series are summarised in Table 1. For convenience, the price
changes for June-December 2011 and January-June 2012 are separately identified as well as
the overall June 2011-June 2012 price change.
Figure 2: Inflation June 2011 to June 2012, overall inflation, underlying inflation, and
Jobs Initiative items
94
96
98
100
102
104
Overall CPICPI less energy and administered pricesAll JI items
June 2011=100
Source: Central Statistics Office

Source: Central Statistics Office
The only sector where prices actually rose in the first six months following the VAT
reduction was in hairdressing services, although this increase was a seasonal effect around
the Christmas period and a price reduction was observed either side of the Christmas increase
(see Figure 11).
No price change was observed for sporting facilities in the first six months after the
reduction. This reflects annual pricing by sporting facilities and club memberships (e.g. gyms
and sports clubs). Full pass-through was observed for this sector from January 2012.
Prices for the remaining items all fell during June-December 2011. For some categories this
represented a reversal of earlier increases and for others it represented an acceleration of an
existing downward trend.
For the period January – June 2012 an upward trend was observed for ‘cinemas, theatres,
musicals, museums, and art galleries’ and for ‘hotels, and other accommodation’ with a
13.6% rise experienced in the latter series. The overall effect of the increase in the ‘hotels and
other accommodation’ category was to restore the prices in this category back to within 1%
of the June 2011 level. This is reflective of the seasonality of hotel and accommodation
pricing which increase during the first half of a calendar year with a mid-year peak and price
reductions thereafter (see Figure 7).
Looking at the 9% VAT rate items as a group, it is interesting that following a 2.5% price
reduction in the first six months, prices increased by 1.9% in the second six month period,
resulting in an overall price reduction of 1.3% by June 2012 compared with June 2011. It is
also noteworthy that the rate increase in the second six month period outpaced both headline
and underlying inflation. This rate rise was however accounted for mainly by seasonally
driven price increases in ‘hotels and other accommodation’ in the first half of 2012.
The cyclical nature of pricing in hotels and other accommodation overstated the decline in
the overall Jobs Initiative series in the final six months of 2011 and similarly overstated the
price increase in the overall series in the first six months of 2012. By excluding hotels and
Table 1: Rates of Inflation June 2011 – June 2012
Category June-December
2011
January –
June
2012
June
2011 –
June
2012 Cinemas, theatres, musicals, museums, art galleries -2.8% 2.4% -0.6%
Hairdressing services 3.5% -4.3% -1.6%
Hot take away foods and hot drinks -0.4% -0.4% -0.5%
Hotels and other accommodation -10.2% 13.6% -0.9%
Meals out including rail car dining -1.3% 0.1% -1.3%
Newspapers -1.7% -0.5% -2.2%
Sport 0.0% -4.5% -4.5%
All 9% items -2.5% 1.9% -1.3%
Headline CPI 0.5% 1.7% 1.7%
Underlying CPI 0.0% 1.4% 0.3%

other accommodation from the overall Jobs Initiative series a more modest decline in prices
of just under 2% relative to June 2011 can be observed for most of the period with the
exception of a slight increase around Christmas 2012 which was largely accounted for by
seasonal hairdressing prices driven by supply and demand factors in that sector. Controlling
for the impact of this “Christmas effect” on hairdressing prices, the overall pass-through of
close to 2% held consistently since the 9% reduced VAT rate came into existence. This
suggests that close to half of the VAT reduction has been passed through to consumer prices.
Given that headline inflation ran at close to 2% for the full period it is likely that some of the
gap between the actual price decrease in the affected sectors and the rate reduction is
accounted for by economy wide inflation.
Employment Impact
The CSO releases employment data quarterly through the QNHS. The most recent QNHS
release was in respect of Q2 2012. The 9% reduced VAT rate came into existence at the start
of Q3 2011. Thus there are four quarters of out-turn data on the employment impact
available, including the quarter in which the rate change occurred.
The QNHS data are published by reference to NACE REV 2 economic sectors. Based on the
data that are publicly available from the CSO the most relevant economic sector that is
mainly accounted for by 9% VAT rate items is NACE sector I – ‘accommodation and food
services’. All other 9% VAT rate items form small parts of broader economic sectors and an
analysis of these sectors would not be informative in terms of the specific impact of the 9%
reduced VAT rate.
Whilst it therefore not possible to look at the impact of the Jobs Initiative across every 9%
VAT rate category, the food and accommodation services covers 70% of the Jobs Initiative
basket according to expenditure data provided by the CSO as part of its price series. It is
Figure 3: Overall Jobs Initiative inflation, all items versus all items excl. hotels
94
96
98
100
102
104
All JI Items excl Hotels & Accom All JI items Overall CPI
June 2011 = 100
Source: Central Statistics Office
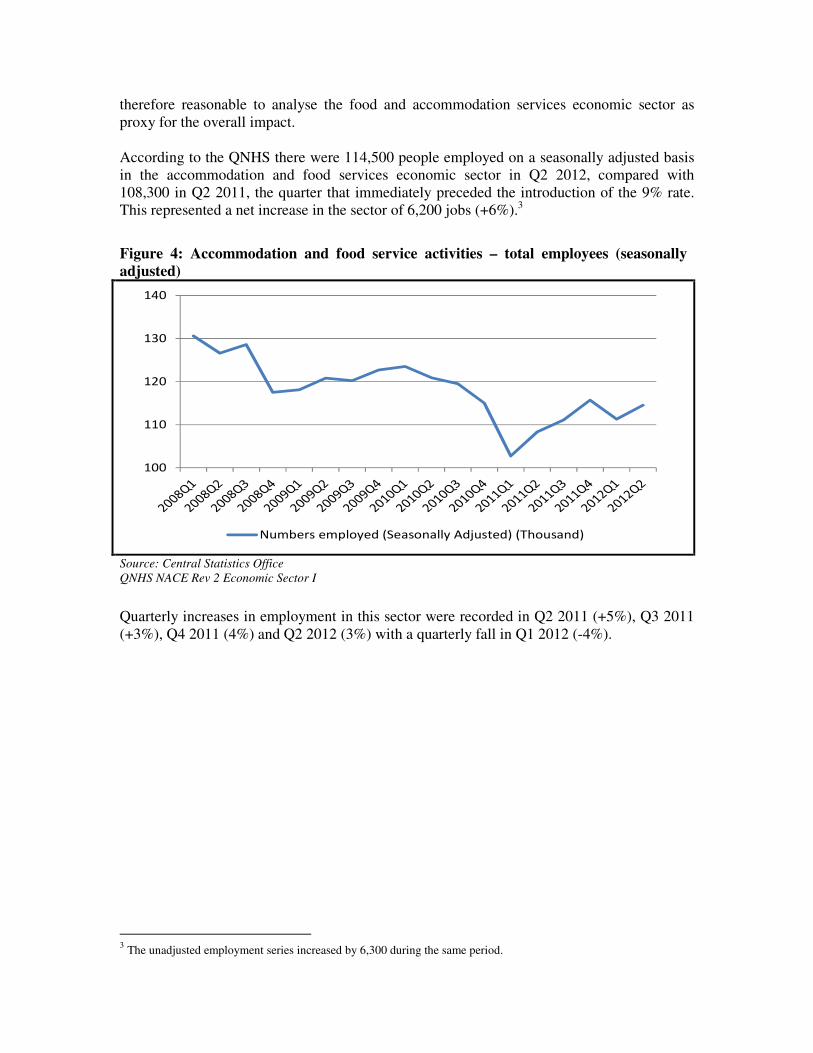
therefore reasonable to analyse the food and accommodation services economic sector as
proxy for the overall impact.
According to the QNHS there were 114,500 people employed on a seasonally adjusted basis
in the accommodation and food services economic sector in Q2 2012, compared with
108,300 in Q2 2011, the quarter that immediately preceded the introduction of the 9% rate.
This represented a net increase in the sector of 6,200 jobs (+6%).3
Quarterly increases in employment in this sector were recorded in Q2 2011 (+5%), Q3 2011
(+3%), Q4 2011 (4%) and Q2 2012 (3%) with a quarterly fall in Q1 2012 (-4%).
3 The unadjusted employment series increased by 6,300 during the same period.
Figure 4: Accommodation and food service activities – total employees (seasonally
adjusted)
100
110
120
130
140
Numbers employed (Seasonally Adjusted) (Thousand)
Source: Central Statistics Office
QNHS NACE Rev 2 Economic Sector I

While a lag would normally be expected between a policy change and an impact on the
labour market, there appears to be reasonable evidence of the desired employment impact in
the accommodation and food services sector.
It is worth comparing the observed employment impact with a counterfactual. While the
theoretical counterfactual would be the impact on employment and food services over the
same period at the old 13.5% rate, this obviously cannot be observed. A counterfactual must
therefore be formed from observable outcomes, for instance the employment outcomes in
comparable sectors.
One possible comparable sector is overall economy-wide employment which fell by 2% over
the same period. However this contains construction, manufacturing and public sector jobs
which may not be relevant for this analysis. Another possible sector is overall services
employment which also fell by 2% over the same period. However the overall services series
includes accommodation and food services as well as public sector employment.
A useful comparison may therefore be overall services excluding accommodation and food
services and public sector employment (including health and education). This series, which
captures employment in market services excluding accommodation and food services, fell by
3% over the same period. The quarterly changes in accommodation and food services and
this counterfactual series are graphed overleaf.
Compared with the range of possible counterfactuals discussed above, there has been a net
employment growth differential of 8%-9% since the introduction of the 9% VAT rate with
the reference series growing by 6% and the counterfactual series falling by 2%-3%.
Figure 5: Accommodation and food service activities – quarterly employment changes
-12%
-10%
-8%
-6%
-4%
-2%
0%
2%
4%
6%
8%
Quarter on quarter change
-20%
-15%
-10%
-5%
0%
5%
10%
Change versus same quarter in previous year
Source: Central Statistics Office
QNHS NACE Rev 2 Economic Sector I
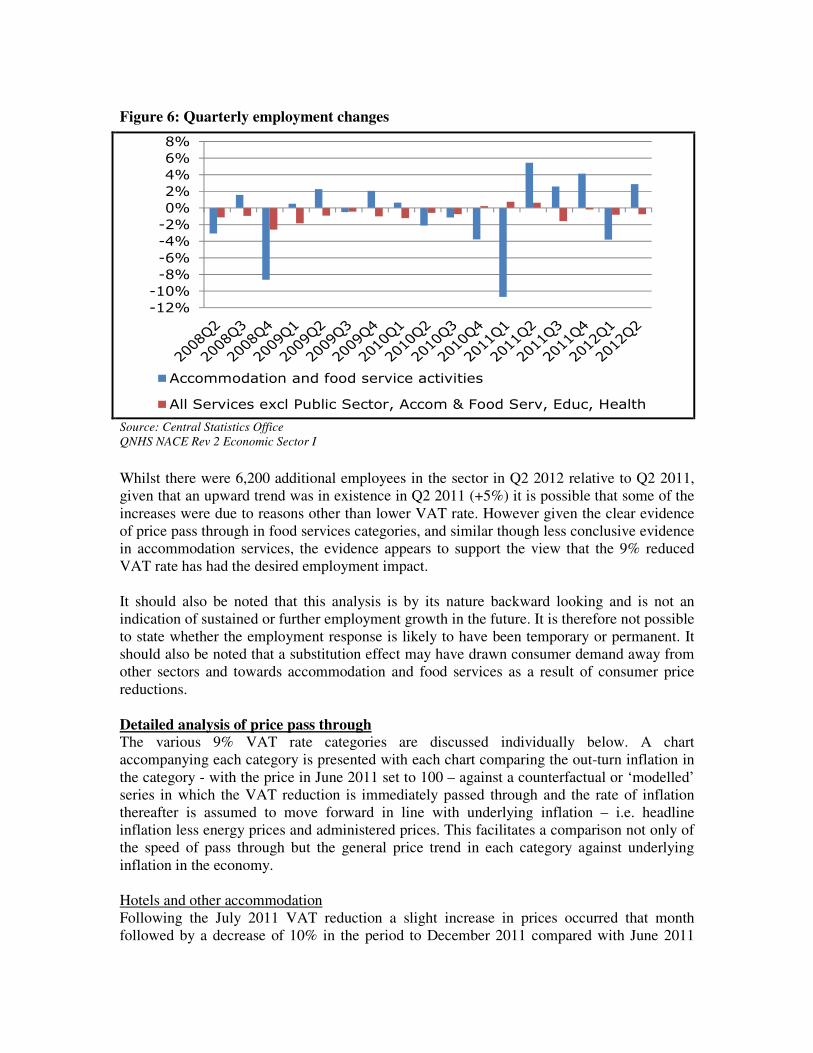
Whilst there were 6,200 additional employees in the sector in Q2 2012 relative to Q2 2011,
given that an upward trend was in existence in Q2 2011 (+5%) it is possible that some of the
increases were due to reasons other than lower VAT rate. However given the clear evidence
of price pass through in food services categories, and similar though less conclusive evidence
in accommodation services, the evidence appears to support the view that the 9% reduced
VAT rate has had the desired employment impact.
It should also be noted that this analysis is by its nature backward looking and is not an
indication of sustained or further employment growth in the future. It is therefore not possible
to state whether the employment response is likely to have been temporary or permanent. It
should also be noted that a substitution effect may have drawn consumer demand away from
other sectors and towards accommodation and food services as a result of consumer price
reductions.
Detailed analysis of price pass through The various 9% VAT rate categories are discussed individually below. A chart
accompanying each category is presented with each chart comparing the out-turn inflation in
the category - with the price in June 2011 set to 100 – against a counterfactual or ‘modelled’
series in which the VAT reduction is immediately passed through and the rate of inflation
thereafter is assumed to move forward in line with underlying inflation – i.e. headline
inflation less energy prices and administered prices. This facilitates a comparison not only of
the speed of pass through but the general price trend in each category against underlying
inflation in the economy.
Hotels and other accommodation
Following the July 2011 VAT reduction a slight increase in prices occurred that month
followed by a decrease of 10% in the period to December 2011 compared with June 2011
Figure 6: Quarterly employment changes
-12%
-10%
-8%
-6%
-4%
-2%
0%
2%
4%
6%
8%
Accommodation and food service activities
All Services excl Public Sector, Accom & Food Serv, Educ, Health
Source: Central Statistics Office
QNHS NACE Rev 2 Economic Sector I

levels. Prices continued to fall in January 2012 with the price index for the hotels and other
accommodation series reaching a level 13% below that of June 2011.
The reduced price levels of 2011 were reversed in 2012 with prices approaching their June
2011 levels by June 2012. This increase is consistent with a cyclical pattern of prices in this
sector with prices tending to increase in the first half of each year towards a mid-year peak
and reduce in the second half.
The trend in hotel prices since June 2007 is presented below with the counterfactual or
‘modelled’ series included from June 2011. It is clear that a downward trend in prices has
been occurring since 2007, though with a deceleration in the rate of reduction in recent years.
The cyclicality in prices is clearly evident with very obvious mid-year peaks and year end
troughs occurring annually. The low-point in the post Jobs Initiative price cycle occurred in
January 2012 and was just under 2% below the January 2011 level, while the June 2012 price
level is within 1% of the price level in June 2011.
The evidence of pass through in the hotels and other accommodation sector is not conclusive.
On the one hand the price decreases throughout the second half of 2011 could be interpreted
as the continuation of an existing trend. Alternatively it could be interpreted as evidence of
pass through given that the January and June 2012 prices are below the equivalent levels in
2011. Ultimately it is impossible to know what would have happened to the price trend in the
absence of the VAT reduction.
Meals out
Figure 7: Hotels and other accommodation – actual and counterfactual ‘modelled’
inflation
85.0
90.0
95.0
100.0
105.0
110.0
115.0
120.0
125.0
130.0
Hotels, guesthouses, hostels Modelled
June 2011=100
The modelled series represent a counterfactual in which the full 4.5 percentage point VAT reduction was
passed through in July 2011 and projects forward in line with underlying inflation
Source: Central Statistics Office

The meals-out category experienced an overall price reduction of 1.3% for the period. There
was an immediate pass through of 1.5% in the first six months following the rate reduction
with prices largely static thereafter.
While the full VAT reduction does not appear to have been passed-though in its entirety, it
should be noted that food prices, a key input into this activity, can have volatile levels of
inflation.
By way of comparison, the diagram overleaf compares the inflation rate for the meals out
category against prevailing food price inflation as measured by both upstream industrial
(wholesale) price inflation for food items and downstream consumer food prices from the
CPI. It is clear that the inflation rate for meals out is less than the rate of consumer and
industrial price inflation for food items generally.
This suggests that the partial pass through could have been reflective of the interaction
between upward cost pressure due to rising food prices and pass through of the lower VAT
rate. It appears that some of the rate reduction was offset by higher input food prices.
Figure 8: Meals Out – actual and counterfactual ‘modelled’ inflation
90.0
92.0
94.0
96.0
98.0
100.0
102.0
Meals out including rail car dining Modelled
June 2011=100
The modelled series represent a counterfactual in which the full 4.5 percentage point VAT reduction was
passed through in July 2011 and projects forward in line with underlying inflation
Source: Central Statistics Office

Hot take away food
After a slight increase in the first two months following the VAT reduction the price series
for ‘hot food and take away’ trended around the June 2011 price level until June 2012. This
suggests limited evidence of pass through for this item. However as with the meals out
category it should be noted that there has been inflation in wholesale and consumer prices for
food items.
As evidenced in Figure 10 there has been a lower rate of inflation in the hot take away food
series than in the wholesale and consumer food price series. The wholesale food price series
is of particular interest given that this is an input cost to vendors of hot take away food.
It appears that the VAT reduction has largely been absorbed by increases in wholesale food
prices.
Figure 9: Meals Out – comparison with industrial and consumer prices for food items
90.0
92.0
94.0
96.0
98.0
100.0
102.0
104.0
Meals out including rail car diningIndustrial food pricesConsumer food prices
June 2011=100
Source: Central Statistics Office

Hairdressing services
The price index for hairdressing services was on a downward trend for the first 6 months of
2011. After the VAT reduction an immediate pass-through of approximately 2% was
observed. This was maintained for most of the following six months with a sharp increase in
December 2011 which brought the series to a level close to 4% above June 2011 prices. This
increase is consistent with a regularly occurring “Christmas effect” caused by seasonal
demand increases in the sector at that time of year. The “Christmas effect” was reversed in
early 2012 with the price series returning to that prevailing up to November 2011.
Figure 11 sets out the price path for hairdressing services since June 2009. The “Christmas
effect” can clearly be seen each year. While an existing downward trend in 2011 should be
acknowledged there is clear evidence of pass through in this sector.
Figure 10: Hot takeaway food, comparison with wholesale and consumer food prices
indexes
90.0
92.0
94.0
96.0
98.0
100.0
102.0
104.0
9% VAT Hot take away foods and hot drinks
Industrial food prices
Consumer food prices June 2011=100
Source: Central Statistics Office

Figure 11: Hairdressing services – actual and counterfactual ‘modelled’ inflation
85.0
90.0
95.0
100.0
105.0
110.0
Hairdressing services Modelled
June 2011=100
The modelled series represent a counterfactual in which the full 4.5 percentage point VAT reduction was passed
through in July 2011 and projects forward in line with underlying inflation
Source: Central Statistics Office
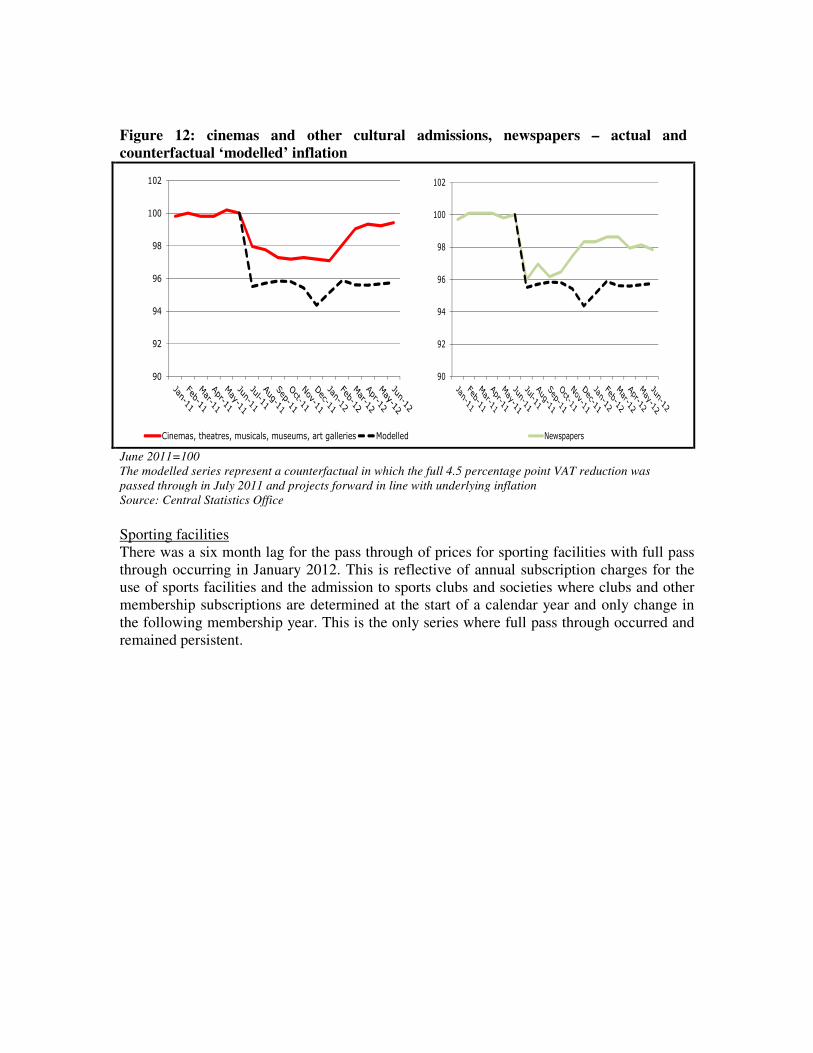
Cinemas, theatres, musicals, museums, art galleries
The full 4.5 percentage point VAT reduction appeared to have been passed through by
November 2011 but this has been reversed in 2012 with the price series trending back
towards the level seen in June 2011, the month prior to the rate reduction. This series has
experienced price increases in 2012 in excess of underlying inflation. This series is presented
in Figure 12.
Newspapers
The newspaper series experienced full and immediate pass through of the VAT reduction
with the price level falling to 95.5 in July 2011 relative to the base of 100 in June 2011. A
trend increase which began in October 2011 has brought the series back to with 2% of its
June 2011 one year later. This series is presented in Figure 12.
Sporting facilities
There was a six month lag for the pass through of prices for sporting facilities with full pass
through occurring in January 2012. This is reflective of annual subscription charges for the
use of sports facilities and the admission to sports clubs and societies where clubs and other
membership subscriptions are determined at the start of a calendar year and only change in
the following membership year. This is the only series where full pass through occurred and
remained persistent.
Figure 12: cinemas and other cultural admissions, newspapers – actual and
counterfactual ‘modelled’ inflation
90
92
94
96
98
100
102
Cinemas, theatres, musicals, museums, art galleries Modelled
90
92
94
96
98
100
102
Newspapers
June 2011=100
The modelled series represent a counterfactual in which the full 4.5 percentage point VAT reduction was
passed through in July 2011 and projects forward in line with underlying inflation
Source: Central Statistics Office

Conclusion
The 9% reduced VAT rate appears to have had the desired impact both in terms of price pass
through and by contributing to employment gains, with an additional 3,000 jobs in quarter 1
2012 relative to quarter 2 2011 in the labour intensive food and accommodations services
sector of the economy.
When considered as an overall group there is evidence of pass through of the VAT rate
reduction, though not the full amount, with an aggregate reduction of 1.3% recorded between
June 2011 and June 2012 and 1.7% when the highly seasonal hotel price series category is
excluded. This compares favourably with economy wide inflation which increased by 1.7%
over the same period on a headline basis and underlying inflation which increased by 0.3%.
The evidence in respect of pass through in the hotels and other accommodation sector is
inconclusive. Whilst the price level for this sector in June 2012 was below the level of June
2011 it may be attributable to either a Jobs Initiative effect or a continuation of a multi-year
trend of falling prices.
The evidence is clearer in respect of the two food categories with meals out falling by 1.3%
and hot take away food falling by 0.5% relative to June 2011 despite inflationary pressures in
wholesale and consumer food prices.
There is some evidence of pass through to consumer prices in all of the other reduced rate
categories.
It is likely that the VAT rate reduction on some of the categories acted as a temporary
employment stimulus, either through direct pass through or by enabling the retention or
expansion of labour demand without offsetting reductions in firm margins.

Annex: List of Jobs Initiative items at new 9% VAT rate
Jobs Initiative list of items CPI sub-index CPI BASKET Items (Base:
December 2011=100)
The supply of food and drink
(excluding alcohol and soft
drinks) in the course of catering or
by means of a vending machine
9% VAT Meals out
including rail car dining
� Chips - small single
� Lunch
� Dinner
� Fast food meal
� Meal in ethnic restaurant
� Canteens
� Rail catering
� Tea/coffee - eat-in (hot)
� Sandwich/wrap/roll/bagel -
eat-in
Hot take-away food and hot drinks
9% VAT Hot take away
foods and hot drinks
� Hot deli foods
� Take-away meal
� Chicken - cooked whole
� Tea/coffee - take-away (hot)
Hotel lettings, including
guesthouses, caravan parks,
camping sites etc
9% VAT Hotels,
guesthouses, hostels
� Guest houses and B&Bs
� Hotels
� Hostels
Admissions to cinemas, theatres,
certain musical performances,
museums, art gallery exhibitions
9% VAT Cinemas,
theatres, musicals,
museums, art galleries
� Cinema
Amusement services of the kind
normally supplied in fairgrounds
or amusement park services
NO RELEVANT ITEM IN
BASKET
The provision of facilities for
taking part in sporting activities by
a person other than a non-profit
making organisation
9% VAT Sport
� Sports participation
� Club & society subscriptions
Printed matter e.g. newspapers,
brochures, leaflets, programmes,
maps, catalogues, printed music
(excluding books)
9% VAT Printed matter -
newspapers, comics,
magazines
� Newspapers
� Comics
� Magazines
Hairdressing services (Note:
beauty treatments:- for example,
facials, massages, nail treatments,
tanning or sunbed services etc.,
remain liable at the 13.5% rate)
9% VAT Hairdressing
services (beauty
treatments are excluded -
remain at 13.5%)
� Gents - dry haircut
� Gents - wash, cut & blowdry
� Ladies - shampoo & set
� Ladies - wash, cut & blowdry
� Ladies - perm/bodywave
� Ladies - hair colour &
highlights