Interactive Exploration of Multidimensional Data
16
1 Interactive Exploration of Multidimensional Data By: Sanket Sinha Nitin Madnani
-
Upload
jayme-ruiz -
Category
Documents
-
view
30 -
download
0
description
Interactive Exploration of Multidimensional Data. By: Sanket Sinha Nitin Madnani. Is It Really That Common ?. You Bet: Demographics Economics Census Microarray Gene Expression Engineering Psychology Health. I can ’ t see it, I tell ya !. Visualization challenges for >= 3D: - PowerPoint PPT Presentation
Transcript of Interactive Exploration of Multidimensional Data

1
Interactive Exploration of Multidimensional Data
Interactive Exploration of Multidimensional Data
By:
Sanket Sinha
Nitin Madnani
By:
Sanket Sinha
Nitin Madnani

2
Is It Really That Common ?Is It Really That Common ?
You Bet: Demographics Economics Census Microarray Gene Expression Engineering Psychology Health
You Bet: Demographics Economics Census Microarray Gene Expression Engineering Psychology Health

3
I can’t see it, I tell ya !I can’t see it, I tell ya !
Visualization challenges for >= 3D: Relationship comprehension is difficult Discovering outliers, clusters and gaps is almost
impossible Orderly exploration is not possible with standard
visualization systems Navigation is cognitively onerous and disorienting
(3D) Occlusion (3D)
Visualization challenges for >= 3D: Relationship comprehension is difficult Discovering outliers, clusters and gaps is almost
impossible Orderly exploration is not possible with standard
visualization systems Navigation is cognitively onerous and disorienting
(3D) Occlusion (3D)

4
Standard SolutionStandard Solution
Can you say “Pro-jek-shun” ? Use lower dimensional projections of
data:
Can you say “Pro-jek-shun” ? Use lower dimensional projections of
data:
1D : Histograms 2D : Scatterplots

5
But there are so many !But there are so many !
For 13 dimensions (columns) : Number of histograms = 13 Number of scatterplots = C(13,2) = 78
Must examine a series of these to gain insights
Unsystematic == Inefficient Must have order !
For 13 dimensions (columns) : Number of histograms = 13 Number of scatterplots = C(13,2) = 78
Must examine a series of these to gain insights
Unsystematic == Inefficient Must have order !

6
Introducing Rank-by-featureIntroducing Rank-by-feature Allows projections to be examined in an
orderly fashion A powerful framework for interactive
detection of: Inter-dimension relationships Gaps Outliers Patterns
Allows projections to be examined in an orderly fashion
A powerful framework for interactive detection of: Inter-dimension relationships Gaps Outliers Patterns

7
How does it work ?How does it work ?
Framework defines ranking criteria for 1D & 2D projections
User selects criterion of interest All projections are scored on the
criterion and ranked User examines projections in the order
recommended Eureka* !!
Framework defines ranking criteria for 1D & 2D projections
User selects criterion of interest All projections are scored on the
criterion and ranked User examines projections in the order
recommended Eureka* !!
*Disclaimer: All users may not be able to make life-altering discoveries

8
Ranking Criteria - 1DRanking Criteria - 1D
Normality: Indicative of how “Gaussian” the dataset is
Uniformity: How “uniform” is the dataset ?(How high is the entropy ?)
Outliers: The number of potential outliers in the dataset
Gap: The size of the biggest gap Uniqueness: Number of unique data points
Normality: Indicative of how “Gaussian” the dataset is
Uniformity: How “uniform” is the dataset ?(How high is the entropy ?)
Outliers: The number of potential outliers in the dataset
Gap: The size of the biggest gap Uniqueness: Number of unique data points
9
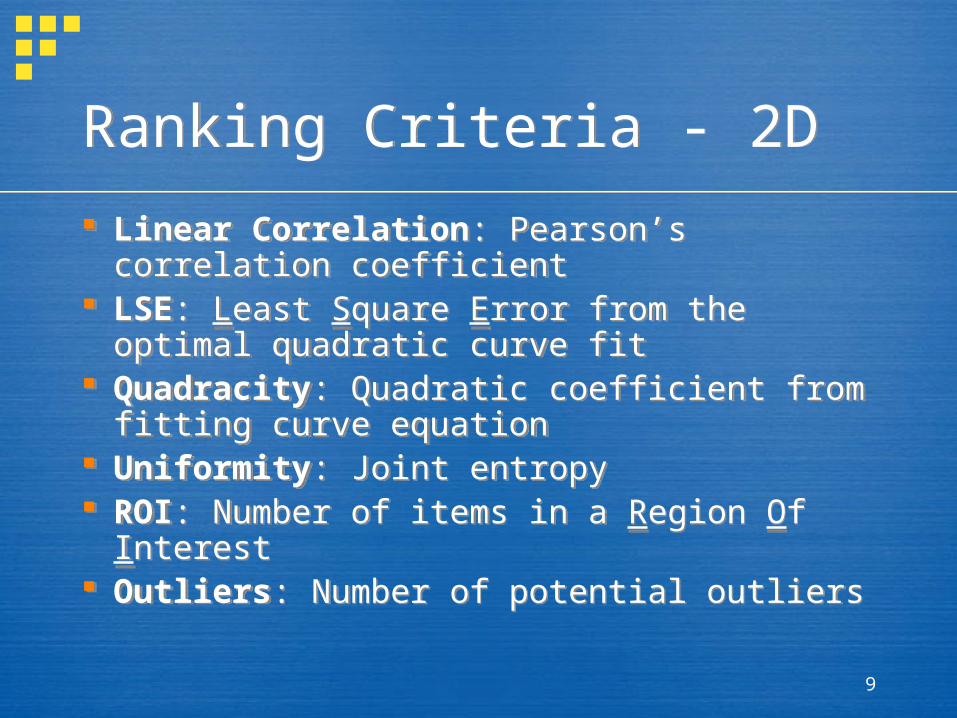
Ranking Criteria - 2DRanking Criteria - 2D
Linear Correlation: Pearson’s correlation coefficient
LSE: Least Square Error from the optimal quadratic curve fit
Quadracity: Quadratic coefficient from fitting curve equation
Uniformity: Joint entropy ROI: Number of items in a Region Of Interest Outliers: Number of potential outliers
Linear Correlation: Pearson’s correlation coefficient
LSE: Least Square Error from the optimal quadratic curve fit
Quadracity: Quadratic coefficient from fitting curve equation
Uniformity: Joint entropy ROI: Number of items in a Region Of Interest Outliers: Number of potential outliers

10
Put A Demo Where Your Mouth Is !
Put A Demo Where Your Mouth Is !

11HCE OverviewHCE Overview
12
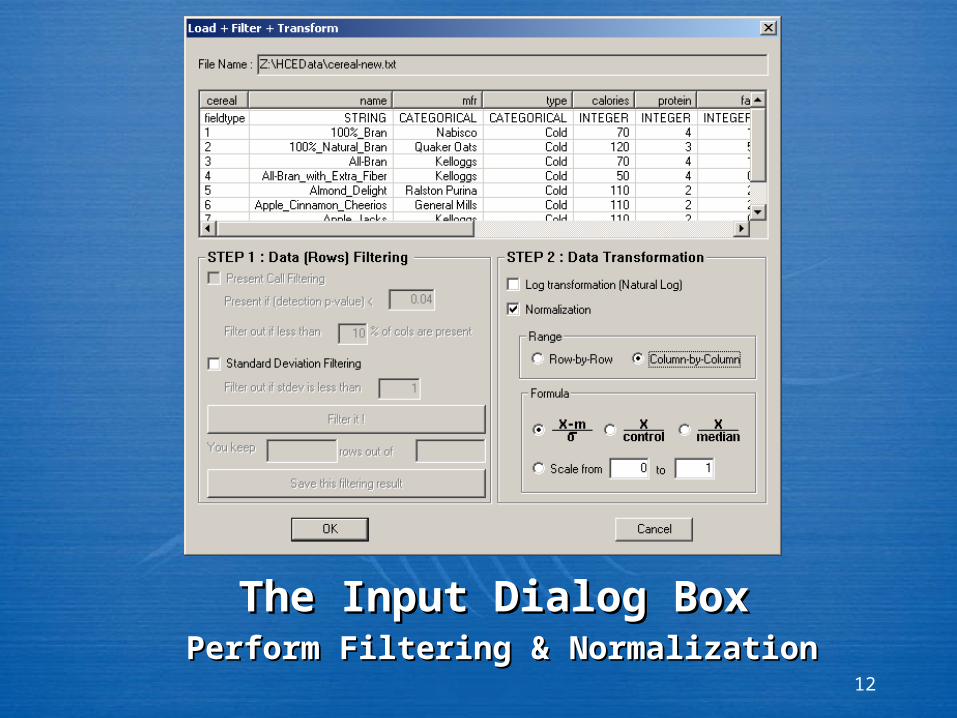
The Input Dialog BoxThe Input Dialog BoxPerform Filtering & NormalizationPerform Filtering & Normalization

13
Histogram OrderingHistogram Ordering

14
Scatterplot OrderingScatterplot Ordering

15
Tabular View of DataTabular View of Data
Select specific data records and annotate if neededSelect specific data records and annotate if needed
16
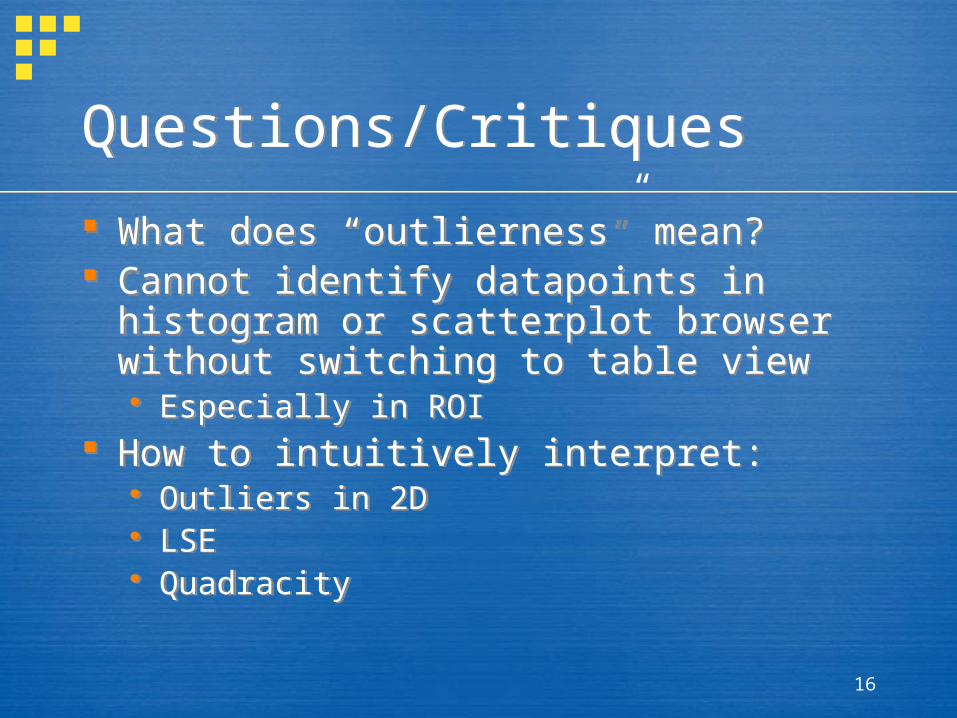
Questions/CritiquesQuestions/Critiques
What does “outlierness” mean? Cannot identify datapoints in histogram or
scatterplot browser without switching to table view Especially in ROI
How to intuitively interpret: Outliers in 2D LSE Quadracity
What does “outlierness” mean? Cannot identify datapoints in histogram or
scatterplot browser without switching to table view Especially in ROI
How to intuitively interpret: Outliers in 2D LSE Quadracity