Interactions of the Anticancer Drug Tamoxifen with Lipid ... · Interactions of the Anticancer Drug...
10
Article Interactions of the Anticancer Drug Tamoxifen with Lipid Membranes Nawal K. Khadka, 1 Xiaolin Cheng, 2,3 Chian Sing Ho, 1 John Katsaras, 4,5,6 and Jianjun Pan 1, * 1 Department of Physics, University of South Florida, Tampa, Florida; 2 Computer Science and Mathematics Division, Oak Ridge National Laboratory, Oak Ridge, Tennessee; 3 Department of Biochemistry and Cellular and Molecular Biology, University of Tennessee, Knoxville, Tennessee; 4 Neutron Sciences Directorate, Oak Ridge National Laboratory, Oak Ridge, Tennessee; 5 Department of Physics and Astronomy, University of Tennessee, Knoxville, Tennessee; and 6 Joint Institute for Neutron Sciences, Oak Ridge National Laboratory, Oak Ridge, Tennessee ABSTRACT Interactions of the hydrophobic anticancer drug tamoxifen (TAM) with lipid model membranes were studied using calcein-encapsulated vesicle leakage, attenuated total reflection Fourier transform infrared (FTIR) spectroscopy, small-angle neutron scattering (SANS), atomic force microscopy (AFM) based force spectroscopy, and all-atom molecular dynamics (MD) simulations. The addition of TAM enhances membrane permeability, inducing calcein to translocate from the interior to the exterior of lipid vesicles. A large decrease in the FTIR absorption band’s magnitude was observed in the hydrocarbon chain region, suggesting suppressed bond vibrational dynamics. Bilayer thickening was determined from SANS data. Force spectros- copy measurements indicate that the lipid bilayer area compressibility modulus K A is increased by a large amount after the incor- poration of TAM. MD simulations show that TAM decreases the lipid area and increases chain order parameters. Moreover, orientational and positional analyses show that TAM exhibits a highly dynamic conformation within the lipid bilayer. Our detailed experimental and computational studies of TAM interacting with model lipid membranes shed new light on membrane modula- tion by TAM. INTRODUCTION Tamoxifen (TAM) is an important anticancer drug that is commonly used in the prevention and treatment of breast cancer (1), and also exhibits antioxidant and cardioprotec- tive effects (2). One mechanism by which TAM inhibits can- cer cell growth is competitive blocking of estrogen receptors (3). However, TAM also inhibits the growth of estrogen-re- ceptor-negative breast cancer cells (4). This implies the presence of additional mechanisms that are not related to es- trogen receptor mediation. TAM was also found to antago- nize protein kinase C without interacting with the enzyme’s active site (5). Other studies have shown that TAM can cause liver toxicity by affecting mitochondria functions (6). Since TAM is highly lipophilic (7), modula- tion of cell membrane structural and mechanical properties may be a reason for its anticancer activity (2) and associated adverse effects (8). Model lipid bilayers composed of one or a few lipid spe- cies are suitable systems for investigating the interactions of membrane active compounds with cell membranes. Previ- ous studies of TAM and lipid bilayers mainly used fluores- cence anisotropy, differential scanning calorimetry (DSC), and Fourier transform infrared (FTIR) spectroscopy. In particular, anisotropy and DSC measurements have shown that TAM decreases lipid-phase transition temperatures (9–14). Studies using anisotropy (9) and FTIR (15) mea- surements reported that TAM disorders gel-phase lipid organization, although another study found no discernible anisotropy change (11). Other studies using FTIR have reported mixed effects on gel-phase chain packing as a function of TAM concentration (12–14,16). Similar discrep- ancies have been reported for fluid-phase lipid chain organi- zation. Chain ordering (9,11,15,17), disordering (10,18,19), and concentration-dependent effects (12–14,16) have all been reported using anisotropy and FTIR measurements (on saturated phospholipids). These mixed reports are complicated by the fact that both fluorescence anisotropy and FTIR are not very sensitive to small changes in lipid bilayer properties. For example, we observed no band shift in our FTIR spectra, whereas our other techniques clearly showed membrane modulation exerted by TAM (see Results section). Similarly, we have unpublished data showing that fluorescence anisotropy is not a sensitive technique when only small changes take place in a fluid phase bilayer. More- over, fluorescence anisotropy relies on membrane-solubi- lized dye molecules, which can modify lipid bilayer properties (20). Finally, many of the above-mentioned studies used bilayers composed of lipids with two saturated chains, mainly because this facilitates access to the gel and fluid phases. Although these lipids are experimentally appealing, lipids with one saturated and one unsaturated chain are better mimics of biological membranes. Here, we examined the effects of TAM on a lipid bilayer composed of 1-palmitoyl-2-oleoyl-sn-glycero-3-phosphati- dylcholine (POPC). Since biological membranes often Submitted September 5, 2014, and accepted for publication April 14, 2015. *Correspondence: [email protected] Editor: Kalina Hristova. Ó 2015 by the Biophysical Society 0006-3495/15/05/2492/10 $2.00 http://dx.doi.org/10.1016/j.bpj.2015.04.010 2492 Biophysical Journal Volume 108 May 2015 2492–2501
Transcript of Interactions of the Anticancer Drug Tamoxifen with Lipid ... · Interactions of the Anticancer Drug...
2492 Biophysical Journal Volume 108 May 2015 2492–2501
Article
Interactions of the Anticancer Drug Tamoxifen with Lipid Membranes
Nawal K. Khadka,1 Xiaolin Cheng,2,3 Chian Sing Ho,1 John Katsaras,4,5,6 and Jianjun Pan1,*1Department of Physics, University of South Florida, Tampa, Florida; 2Computer Science and Mathematics Division, Oak Ridge NationalLaboratory, Oak Ridge, Tennessee; 3Department of Biochemistry and Cellular and Molecular Biology, University of Tennessee, Knoxville,Tennessee; 4Neutron Sciences Directorate, Oak Ridge National Laboratory, Oak Ridge, Tennessee; 5Department of Physics and Astronomy,University of Tennessee, Knoxville, Tennessee; and 6Joint Institute for Neutron Sciences, Oak Ridge National Laboratory, Oak Ridge,Tennessee
ABSTRACT Interactions of the hydrophobic anticancer drug tamoxifen (TAM) with lipid model membranes were studied usingcalcein-encapsulated vesicle leakage, attenuated total reflection Fourier transform infrared (FTIR) spectroscopy, small-angleneutron scattering (SANS), atomic force microscopy (AFM) based force spectroscopy, and all-atom molecular dynamics(MD) simulations. The addition of TAM enhances membrane permeability, inducing calcein to translocate from the interior tothe exterior of lipid vesicles. A large decrease in the FTIR absorption band’s magnitude was observed in the hydrocarbon chainregion, suggesting suppressed bond vibrational dynamics. Bilayer thickening was determined from SANS data. Force spectros-copy measurements indicate that the lipid bilayer area compressibility modulus KA is increased by a large amount after the incor-poration of TAM. MD simulations show that TAM decreases the lipid area and increases chain order parameters. Moreover,orientational and positional analyses show that TAM exhibits a highly dynamic conformation within the lipid bilayer. Our detailedexperimental and computational studies of TAM interacting with model lipid membranes shed new light on membrane modula-tion by TAM.
INTRODUCTION
Tamoxifen (TAM) is an important anticancer drug that iscommonly used in the prevention and treatment of breastcancer (1), and also exhibits antioxidant and cardioprotec-tive effects (2). One mechanism by which TAM inhibits can-cer cell growth is competitive blocking of estrogen receptors(3). However, TAM also inhibits the growth of estrogen-re-ceptor-negative breast cancer cells (4). This implies thepresence of additional mechanisms that are not related to es-trogen receptor mediation. TAM was also found to antago-nize protein kinase C without interacting with theenzyme’s active site (5). Other studies have shown thatTAM can cause liver toxicity by affecting mitochondriafunctions (6). Since TAM is highly lipophilic (7), modula-tion of cell membrane structural and mechanical propertiesmay be a reason for its anticancer activity (2) and associatedadverse effects (8).
Model lipid bilayers composed of one or a few lipid spe-cies are suitable systems for investigating the interactions ofmembrane active compounds with cell membranes. Previ-ous studies of TAM and lipid bilayers mainly used fluores-cence anisotropy, differential scanning calorimetry (DSC),and Fourier transform infrared (FTIR) spectroscopy. Inparticular, anisotropy and DSC measurements have shownthat TAM decreases lipid-phase transition temperatures(9–14). Studies using anisotropy (9) and FTIR (15) mea-
Submitted September 5, 2014, and accepted for publication April 14, 2015.
*Correspondence: [email protected]
Editor: Kalina Hristova.
� 2015 by the Biophysical Society
0006-3495/15/05/2492/10 $2.00
surements reported that TAM disorders gel-phase lipidorganization, although another study found no discernibleanisotropy change (11). Other studies using FTIR havereported mixed effects on gel-phase chain packing as afunction of TAM concentration (12–14,16). Similar discrep-ancies have been reported for fluid-phase lipid chain organi-zation. Chain ordering (9,11,15,17), disordering (10,18,19),and concentration-dependent effects (12–14,16) have allbeen reported using anisotropy and FTIR measurements(on saturated phospholipids). These mixed reports arecomplicated by the fact that both fluorescence anisotropyand FTIR are not very sensitive to small changes in lipidbilayer properties. For example, we observed no band shiftin our FTIR spectra, whereas our other techniques clearlyshowed membrane modulation exerted by TAM (see Resultssection). Similarly, we have unpublished data showing thatfluorescence anisotropy is not a sensitive technique whenonly small changes take place in a fluid phase bilayer. More-over, fluorescence anisotropy relies on membrane-solubi-lized dye molecules, which can modify lipid bilayerproperties (20). Finally, many of the above-mentionedstudies used bilayers composed of lipids with two saturatedchains, mainly because this facilitates access to the gel andfluid phases. Although these lipids are experimentallyappealing, lipids with one saturated and one unsaturatedchain are better mimics of biological membranes.
Here, we examined the effects of TAM on a lipid bilayercomposed of 1-palmitoyl-2-oleoyl-sn-glycero-3-phosphati-dylcholine (POPC). Since biological membranes often
http://dx.doi.org/10.1016/j.bpj.2015.04.010
Tamoxifen Interacting with Lipid Membranes 2493
contain anionic lipids, we also added 10 mol % of 1-palmi-toyl-2-oleoyl-sn-glycero-3-phosphatidylglycerol (POPG) tothe POPC bilayer. For simplicity, we will refer to thismixture as a POPC/POPG bilayer. We first used a fluores-cence leakage assay to elucidate the perturbation effect ofTAM on POPC/POPG bilayer integrity. We also used atten-uated total reflection FTIR spectroscopy to explore lipidbond vibrational dynamics (21). Due to the differences inneutron scattering length between the lipid bilayer’s hydro-carbon chains and the D2O solvent, small-angle neutronscattering (SANS) is widely used to determine the lipidbilayer hydrophobic thickness, as well as other importantstructural parameters (22). We collected SANS data underthree external contrast conditions for POPC/POPG bilayers,with and without TAM, and determined measurable changesin the lipid bilayer thickness. We investigated the effects ofTAM on lipid bilayer mechanical properties using atomicforce microscopy (AFM)-based force spectroscopy mea-surements. We then used the force-distance curves obtainedas the AFM tip approached a solid supported planar bilayerwith different TAM concentrations to extract the lipidbilayer area compressibility moduli KA. Finally, we per-formed all-atom molecular dynamics (MD) simulations togain a mechanistic understanding of TAM interactionswith neighboring lipids. We carried out detailed analysespertaining to TAM orientation and its impact on lipid bilayerproperties, such as the average lipid area, hydrocarbon chainthickness, and chain order parameters.
MATERIALS AND METHODS
Materials
Synthetic POPC and POPG, in powder form, were purchased from Avanti
Polar Lipids (Alabaster, AL). TAM and calcein were purchased from Sigma
Aldrich (St. Louis, MO). All other chemicals were of HPLC grade.
POPC, POPG, and TAM stock solutions were prepared using organic sol-
vents (chloroform for POPC and TAM, and chloroform/methanol 3:1 by
volume for POPG). Lipid mixtures were prepared by mixing appropriate ra-
tios of stock solutions in glass test tubes. Organic solvents were removed by
a gentle stream of argon gas and then placed under vacuum overnight. The
resultant lipid dry films were used for experimental measurements.
Dye leakage
Calcein-encapsulated unilamellar vesicles (ULVs) were prepared using the
method described in the Supporting Material. Fluorescence intensity at
25�C was measured using an FP-8300 fluorometer (Jasco, Easton, MD).
To study the degree of dye leakage as a function of the TAM/lipid ratio,
r, we added different amounts of TAM solubilized in DMSO to microcen-
trifuge tubes containing 1 ml of HEPES buffer B (SupportingMaterial), and
added 15 ml of calcein-encapsulated ULVs at the end. To assess the effect of
DMSO on calcein leakage, we performed control experiments with DMSO
alone. No discernible dye leakage was observed for DMSO concentrations
of <3%. Based on these data, all calcein leakage experiments were carried
out with <1.5% of DMSO.
A time-course measurement was first carried out to establish the equili-
bration time needed for TAM to induce maximum calcein leakage
(Fig. S13). TAM caused a rapid increase in fluorescence intensity during
the first 9 min, followed by a gradual increase. The final equilibrium state
was reached in ~8 h. To eliminate complications associated with incubation
time, all TAM/lipid samples were measured after they were incubated over-
night in the dark under gentle shaking.
After incubation, TAM/lipid/calcein solutions were excited by a wave-
length of 494 nm. The emission spectrum was recorded from 498 nm to
600 nm. Both the excitation and emission bandwidths were 2.5 nm. The
emission maximum near 514 nm was taken as the fluorescence intensity I
for each sample. The fluorescence intensity without any quenching, Imax,
was determined by completely breaking up the ULVs using 100 mM Triton
X-100 (after taking dilution into account). The percentage of calcein
leakage is defined as
G ¼ ðI � I0Þ=ðImax � I0Þ � 100%; (1)
where I0 is the fluorescence intensity from calcein-encapsulated ULVs
without TAM.
FTIR spectroscopy
AVertex 70 Bio ATRII spectrometer (Bruker, Billerica, MA) was used for
attenuated total reflection FTIR measurements. All samples were main-
tained at 25�C using a Huber Ministat water circulator. POPC lipid
(8.0 mg) mixed with different amounts of TAM was hydrated with
0.25 ml of HEPES buffer A (Supporting Material). A multilamellar vesicle
(MLV) solution (30 ml) was loaded into a sample cell. Infrared (IR) absorp-
tion spectra were collected at a range of wavenumbers from 400 to
4000 cm�1 with a resolution of 2 cm�1 (1500 scans). Each spectrum was
corrected for background absorption arising from the water buffer. The final
spectrum was normalized by the lipid concentration.
SANS experiments
Lipid dry films, with and without 10 mol % TAM, were hydrated with D2O
buffer. ULVs were obtained by an extrusion procedure similar to that used
for the leakage experiments. The extruded ULVs in 100% D2O were ali-
quoted into three microcentrifuge tubes and diluted to the desired external
contrast conditions (i.e., 100%, 75%, and 50% D2O) using appropriate ra-
tios of D2O and H2O buffers. SANS data were obtained at 25�C on the
CG-3 Bio-SANS instrument located at Oak Ridge National Laboratory
(ORNL). The beam wavelength was 6.0 A with a dispersion of 12%. The
collected scattering images were corrected for dark current, solid angle, de-
tector sensitivity, and sample transmission. One-dimensional scattering
curves were obtained by powder averaging after correcting for water back-
ground. All data reduction was performed using the Mantid software pro-
vided by ORNL (http://dx.doi.org/10.5286/SOFTWARE/MANTID).
AFM experiments
AFM experiments were performed using a Multimode 8 atomic force mi-
croscope (Bruker, Santa Barbara, CA) operated in a mode referred to as
PeakForce quantitative nanomechanics (QNM). This mode allows simulta-
neous mapping of a sample’s nanomechnical and topographical properties.
Small unilamellar vesicles (SUVs) were used for AFM measurements.
Briefly, lipid films with different TAM concentrations were hydrated with
10 mM of HEPES buffer. SUVs were prepared using an ultrasonicator oper-
ated at 40 W for a total duration of 15 min. The obtained SUVs were centri-
fuged to remove metal particles that detached from the probe. Dynamic
light scattering measurements showed that the ultrasonication-prepared
SUVs had an average diameter of 60 nm. The SUVs were injected into a
liquid cell via a syringe pump. After incubation for 1 h, a mica supported
bilayer was formed. HEPES buffer was injected to flush out excess vesicles.
We scanned hydrated bilayers using a Si3N4 cantilever with a spring con-
stant of 0.1 N/m, which was determined using the thermal noise method
(23). After obtaining a topographic image, we collected multiple
Biophysical Journal 108(10) 2492–2501
2494 Khadka et al.
force-distance curves at different locations on the bilayer. To extract the
lipid bilayer area compressibility modulus, we determined the AFM tip
radius using a tip-quantification function provided by the Nanoscope anal-
ysis software. The tip radius determined for this study was 11.0 nm.
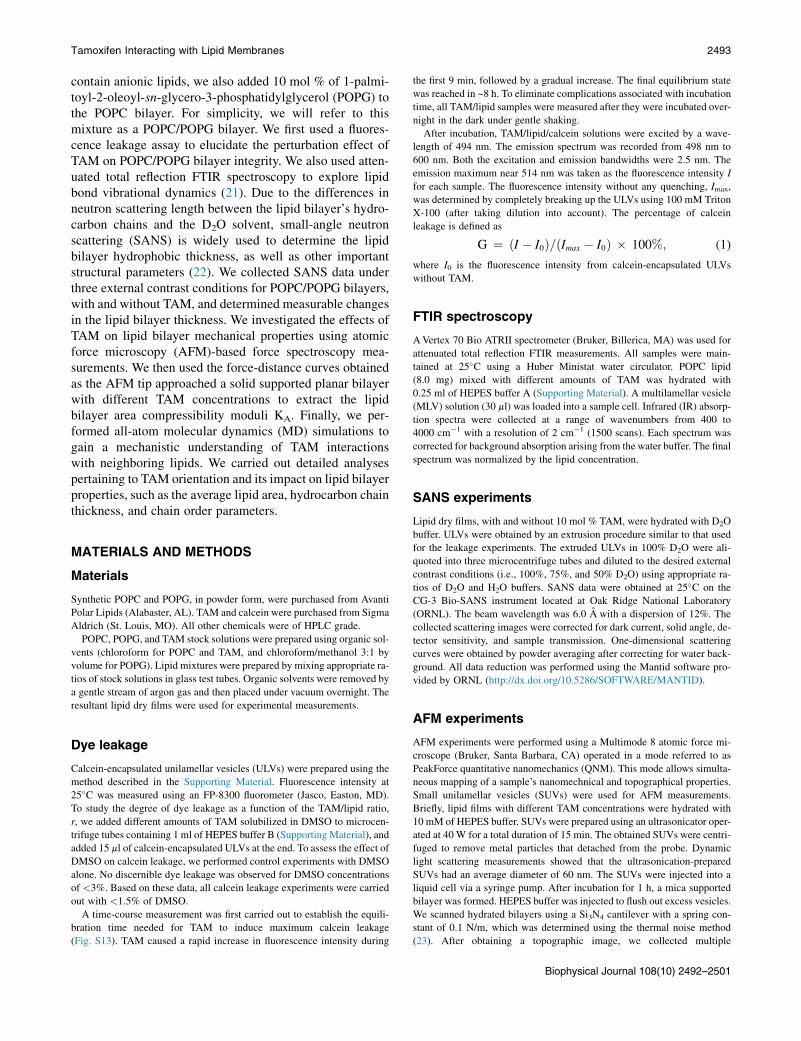
FIGURE 1 Leakage of calcein-encapsulated ULVs induced by TAM.
The solid line is a fit using the empirical Hill equation. To see this figure
in color, go online.
MD simulations
We generated the initial coordinates for two POPC/POPG bilayer models
made up of 200 lipids (i.e., 180 POPC and 20 POPG) using the
CHARMM-GUI Membrane Builder (24) for one model and Packmol
(25) for the other. Despite their different initial structural properties, the
two model bilayers yielded similar results, with comparable average lipid
area and chain thickness (after reaching equilibrium). This highlights that
our simulations do not depend on initial conditions, thus supporting the
convergence of our simulated bilayers. We generated the initial coordinates
for the two POPC/POPG/TAM lipid bilayer systems (i.e., 162 POPC, 18
POPG, and 20 TAM) using Packmol with different random seeds and pack-
ing protocols. All hydrogen atoms were explicitly included (all-atom
model) in addition to ~10,800 water molecules and counterions to
neutralize the system. MD simulations were performed using NAMD 2.9
(26) and the CHARMM 36 lipid force field (27,28) for lipid molecules,
and the CHARMM general force field for TAM was generated using the
ParamChem server (http://www.paramchem.org) (29). Periodic boundary
conditions were applied. For each system, we first minimized the atomic co-
ordinates using the conjugated gradient algorithm for 5000 steps, followed
by 20 ns of equilibration in a constant particle NPT ensemble. The z axis
was allowed to expand and contract independently of the x-y plane (semi-
isotropic pressure coupling). Subsequently, the four simulations (two
POPC/POPG binary mixtures and two POPC/POPG mixed with 10 mol
% TAM) were each run for ~150 ns in the NPT ensemble using the Lange-
vin piston method (target pressure: 1 atm; oscillation period: 200 fs; and
damping timescale: 100 fs) and Langevin dynamics to control the temper-
ature (298 K; damping coefficient: 2.0) during the entire simulation (30,31).
In all simulations, the van der Waals (vdW) interactions were truncated via
a force-based switching function. Starting from a switching distance of 8 A,
the vdW force was brought smoothly to zero at the cutoff distance of 12 A.
Electrostatic interactions were treated using the particle-mesh Ewald
(PME) method with a 1.0 A grid spacing (32,33). The r-RESPA multiple-
time-step method (34) was employed with a 2 fs time step for bonded inter-
actions, and 2 and 4 fs time steps for short-range nonbonded and long-range
electrostatic interactions, respectively. The bonds between hydrogen and
other atoms were constrained using the SHAKE algorithm (35). All simu-
lations were conducted on the Hopper supercomputer located at the
National Energy Research Scientific Computing Center (NERSC).
Only the last 100 ns of all simulations were used for structural analyses.
The orientational order parameter�2SCD for each carbon of POPC’s palmi-
toyl and oleoyl chains was calculated from the angle q of the C-D bond rela-
tive to the bilayer normal (36):
�2SCD ¼ 1
2
�3cos2q� 1
�: (2)
RESULTS
Calcein leakage and bilayer integrity
When TAM is introduced to calcein-encapsulated ULVs, itslarge hydrophobicity prompts it to bind to surroundingULVs. The resulting membrane perturbation causes encap-sulated calcein to leak out. By monitoring the change offluorescence intensity, one can estimate the amount of cal-cein that is released. Fluorescence spectra of POPC/POPG
Biophysical Journal 108(10) 2492–2501
ULVs incubated with different amounts of TAM are shownin Fig. S13. The emission maximum is located near 514 nmand is independent of TAM concentration. The calculatedpercentage of calcein leakage is shown in Fig. 1. It is clearthat the leakage percentage increases rapidly as the TAM/lipid ratio, r, increases. Maximum leakage is reached nearr ¼ 1.0.
We use a Hill equation to qualitatively describe calceinleakage:
Gðr; r0; n;FmaxÞ ¼ Gmax
rn
rn0 þ rn; (3)
where Gmax is the maximum leakage, r is the TAM/lipid ra-tio, r0 is the ratio at which the half-maximum of calceinleakage occurs, and n is the Hill coefficient. We note thatthe use of Eq. 3 is purely empirical. A nonlinear least-squarefit gives rise to a maximum leakage Gmax of 85%, a valuesmaller than unity. This indicates that even at maximumleakage, there is still a portion of calcein encapsulatedwithin the ULVs. Partial maximum leakage has also been re-ported for flavanoid genistein and its derivatives (37), andfibril-forming amyloid peptides (38). The fit to the dataalso results in an r0 of 0.46 at half-maximum leakage, anda Hill coefficient n of 1.5. Overall, our fluorescence datahighlight that TAM impairs bilayer integrity and enhancesthe permeability of calcein across the bilayer. The factthat the maximum leakage is less than 100% suggests thatTAM only modifies the structural properties of the lipidbilayer. This is different from surfactants (39) and antimi-crobial peptides (40), which solubilize or completely per-meabilize lipid vesicles at high concentrations.
FTIR spectroscopy and lipid bond vibrationaldynamics
To study the effect of TAM on lipid vibrational dynamics,we performed attenuated total reflection FTIR
Tamoxifen Interacting with Lipid Membranes 2495
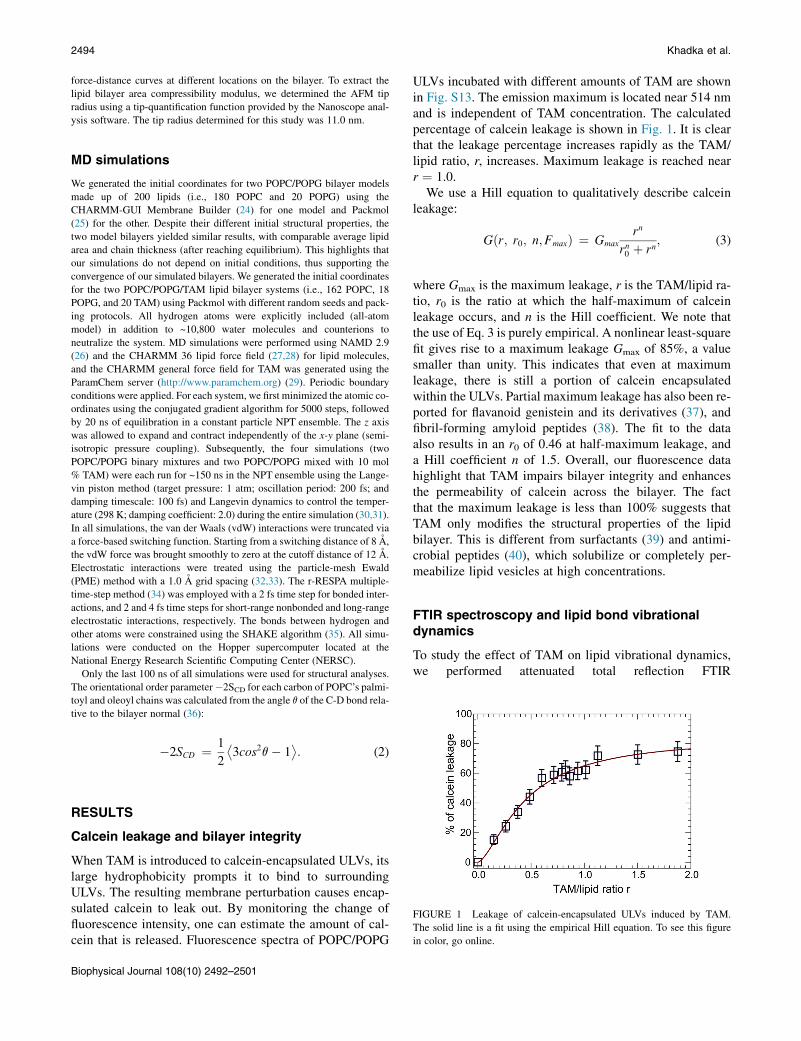
measurements on POPC MLVs mixed with different con-centrations of TAM. Fig. 2 illustrates the absorption bandscorresponding to three chemical groups: the hydrocarbonchain region (CH2, Fig. 2 A), the backbone ester carbonyl(C¼O; Fig. 2 B), and the water-solvated headgroup (PO2
�;Fig. 2 C). The spectrum for each sample is normalized byits lipid concentration. This is corroborated by the nearlyidentical absorption peaks located around 1229 and1087 cm�1, which correspond to PO2
�’s antisymmetricand symmetric vibrations, respectively (Fig. 2 C). Nodiscernible band shift is observed for the two bands corre-sponding to the hydrocarbon chain CH2’s antisymmetric(2923 cm�1) and symmetric (2853 cm�1) vibrations asTAM concentration increases (Fig. 2 A). The absence ofband shift is also noted for the ester carbonyl C¼O(Fig. 2 B). These results contrast with the FTIR measure-ments obtained for TAM in fully saturated lipids(10,13,14,16).
In contrast to the band shift, the band magnitudes for CH2
and C¼O decrease with increasing TAM concentration(Fig. 2, A and B). Since the absorption spectrum is normal-ized by the lipid concentration, the band magnitude is asso-ciated with a change in the bond length (or dipole moment)during bond vibration. Therefore, a reduction in the bandmagnitude implies that TAM dampens the bond-lengthchange for CH2 and C¼O groups. This implies a more rigidconfiguration in the hydrocarbon chains and carbonyl back-bone region. In contrast to CH2 and C¼O, the vibrationalbands for PO2
� remain unaltered after addition of TAM(Fig. 2 C), suggesting that TAM does not interact withPOPC’s phosphate headgroup.
FIGURE 2 Attenuated total reflection FTIR spectrum for POPC MLVs
containing different concentrations of TAM. (A) Lipid IR absorption bands
located near 2923 and 2853 cm�1 correspond to hydrocarbon chain CH2
groups undergoing antisymmetric and symmetric stretching vibrations,
respectively. (B) The absorption band of the backbone ester carbonyl
C¼O occurs near 1733 cm�1. (C) Antisymmetric and symmetric absorption
bands corresponding to the phosphate PO2� are observed near 1229 and
1087 cm�1, respectively. The width of each panel is proportional to the
span of its wavenumber. To see this figure in color, go online.
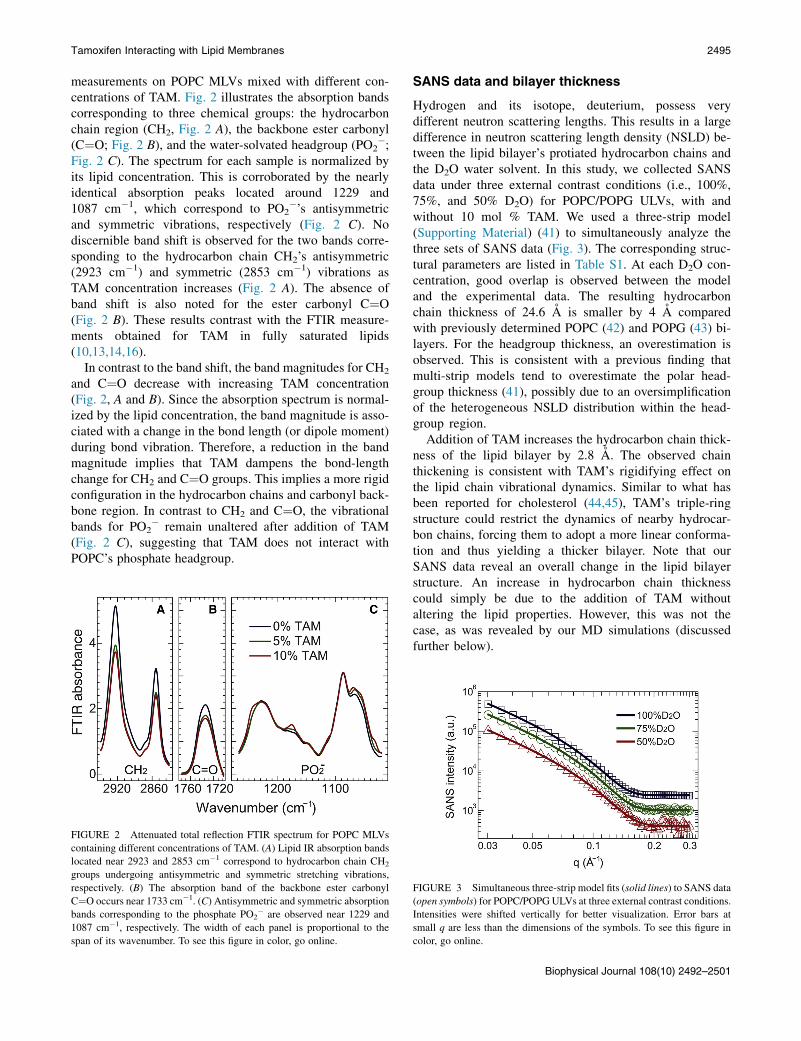
SANS data and bilayer thickness
Hydrogen and its isotope, deuterium, possess verydifferent neutron scattering lengths. This results in a largedifference in neutron scattering length density (NSLD) be-tween the lipid bilayer’s protiated hydrocarbon chains andthe D2O water solvent. In this study, we collected SANSdata under three external contrast conditions (i.e., 100%,75%, and 50% D2O) for POPC/POPG ULVs, with andwithout 10 mol % TAM. We used a three-strip model(Supporting Material) (41) to simultaneously analyze thethree sets of SANS data (Fig. 3). The corresponding struc-tural parameters are listed in Table S1. At each D2O con-centration, good overlap is observed between the modeland the experimental data. The resulting hydrocarbonchain thickness of 24.6 A is smaller by 4 A comparedwith previously determined POPC (42) and POPG (43) bi-layers. For the headgroup thickness, an overestimation isobserved. This is consistent with a previous finding thatmulti-strip models tend to overestimate the polar head-group thickness (41), possibly due to an oversimplificationof the heterogeneous NSLD distribution within the head-group region.
Addition of TAM increases the hydrocarbon chain thick-ness of the lipid bilayer by 2.8 A. The observed chainthickening is consistent with TAM’s rigidifying effect onthe lipid chain vibrational dynamics. Similar to what hasbeen reported for cholesterol (44,45), TAM’s triple-ringstructure could restrict the dynamics of nearby hydrocar-bon chains, forcing them to adopt a more linear conforma-tion and thus yielding a thicker bilayer. Note that ourSANS data reveal an overall change in the lipid bilayerstructure. An increase in hydrocarbon chain thicknesscould simply be due to the addition of TAM withoutaltering the lipid properties. However, this was not thecase, as was revealed by our MD simulations (discussedfurther below).
FIGURE 3 Simultaneous three-strip model fits (solid lines) to SANS data
(open symbols) for POPC/POPGULVs at three external contrast conditions.
Intensities were shifted vertically for better visualization. Error bars at
small q are less than the dimensions of the symbols. To see this figure in
color, go online.
Biophysical Journal 108(10) 2492–2501
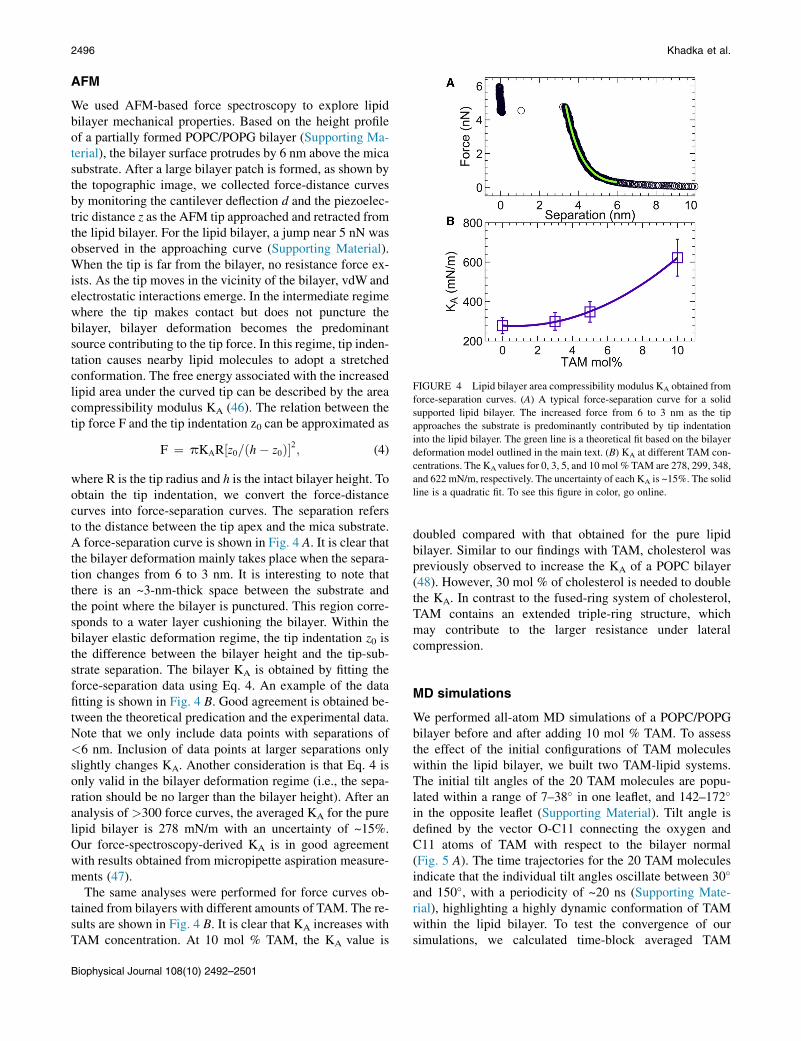
FIGURE 4 Lipid bilayer area compressibility modulus KA obtained from
force-separation curves. (A) A typical force-separation curve for a solid
supported lipid bilayer. The increased force from 6 to 3 nm as the tip
approaches the substrate is predominantly contributed by tip indentation
into the lipid bilayer. The green line is a theoretical fit based on the bilayer
deformation model outlined in the main text. (B) KA at different TAM con-
centrations. The KAvalues for 0, 3, 5, and 10 mol % TAM are 278, 299, 348,
and 622 mN/m, respectively. The uncertainty of each KA is ~15%. The solid
line is a quadratic fit. To see this figure in color, go online.
2496 Khadka et al.
AFM
We used AFM-based force spectroscopy to explore lipidbilayer mechanical properties. Based on the height profileof a partially formed POPC/POPG bilayer (Supporting Ma-terial), the bilayer surface protrudes by 6 nm above the micasubstrate. After a large bilayer patch is formed, as shown bythe topographic image, we collected force-distance curvesby monitoring the cantilever deflection d and the piezoelec-tric distance z as the AFM tip approached and retracted fromthe lipid bilayer. For the lipid bilayer, a jump near 5 nN wasobserved in the approaching curve (Supporting Material).When the tip is far from the bilayer, no resistance force ex-ists. As the tip moves in the vicinity of the bilayer, vdW andelectrostatic interactions emerge. In the intermediate regimewhere the tip makes contact but does not puncture thebilayer, bilayer deformation becomes the predominantsource contributing to the tip force. In this regime, tip inden-tation causes nearby lipid molecules to adopt a stretchedconformation. The free energy associated with the increasedlipid area under the curved tip can be described by the areacompressibility modulus KA (46). The relation between thetip force F and the tip indentation z0 can be approximated as
F ¼ pKAR½z0=ðh� z0Þ�2; (4)
where R is the tip radius and h is the intact bilayer height. Toobtain the tip indentation, we convert the force-distance
curves into force-separation curves. The separation refersto the distance between the tip apex and the mica substrate.A force-separation curve is shown in Fig. 4 A. It is clear thatthe bilayer deformation mainly takes place when the separa-tion changes from 6 to 3 nm. It is interesting to note thatthere is an ~3-nm-thick space between the substrate andthe point where the bilayer is punctured. This region corre-sponds to a water layer cushioning the bilayer. Within thebilayer elastic deformation regime, the tip indentation z0 isthe difference between the bilayer height and the tip-sub-strate separation. The bilayer KA is obtained by fitting theforce-separation data using Eq. 4. An example of the datafitting is shown in Fig. 4 B. Good agreement is obtained be-tween the theoretical predication and the experimental data.Note that we only include data points with separations of<6 nm. Inclusion of data points at larger separations onlyslightly changes KA. Another consideration is that Eq. 4 isonly valid in the bilayer deformation regime (i.e., the sepa-ration should be no larger than the bilayer height). After ananalysis of >300 force curves, the averaged KA for the purelipid bilayer is 278 mN/m with an uncertainty of ~15%.Our force-spectroscopy-derived KA is in good agreementwith results obtained from micropipette aspiration measure-ments (47).The same analyses were performed for force curves ob-tained from bilayers with different amounts of TAM. The re-sults are shown in Fig. 4 B. It is clear that KA increases withTAM concentration. At 10 mol % TAM, the KA value is
Biophysical Journal 108(10) 2492–2501
doubled compared with that obtained for the pure lipidbilayer. Similar to our findings with TAM, cholesterol waspreviously observed to increase the KA of a POPC bilayer(48). However, 30 mol % of cholesterol is needed to doublethe KA. In contrast to the fused-ring system of cholesterol,TAM contains an extended triple-ring structure, whichmay contribute to the larger resistance under lateralcompression.
MD simulations
We performed all-atom MD simulations of a POPC/POPGbilayer before and after adding 10 mol % TAM. To assessthe effect of the initial configurations of TAM moleculeswithin the lipid bilayer, we built two TAM-lipid systems.The initial tilt angles of the 20 TAM molecules are popu-lated within a range of 7–38� in one leaflet, and 142–172�
in the opposite leaflet (Supporting Material). Tilt angle isdefined by the vector O-C11 connecting the oxygen andC11 atoms of TAM with respect to the bilayer normal(Fig. 5 A). The time trajectories for the 20 TAM moleculesindicate that the individual tilt angles oscillate between 30�
and 150�, with a periodicity of ~20 ns (Supporting Mate-rial), highlighting a highly dynamic conformation of TAMwithin the lipid bilayer. To test the convergence of oursimulations, we calculated time-block averaged TAM
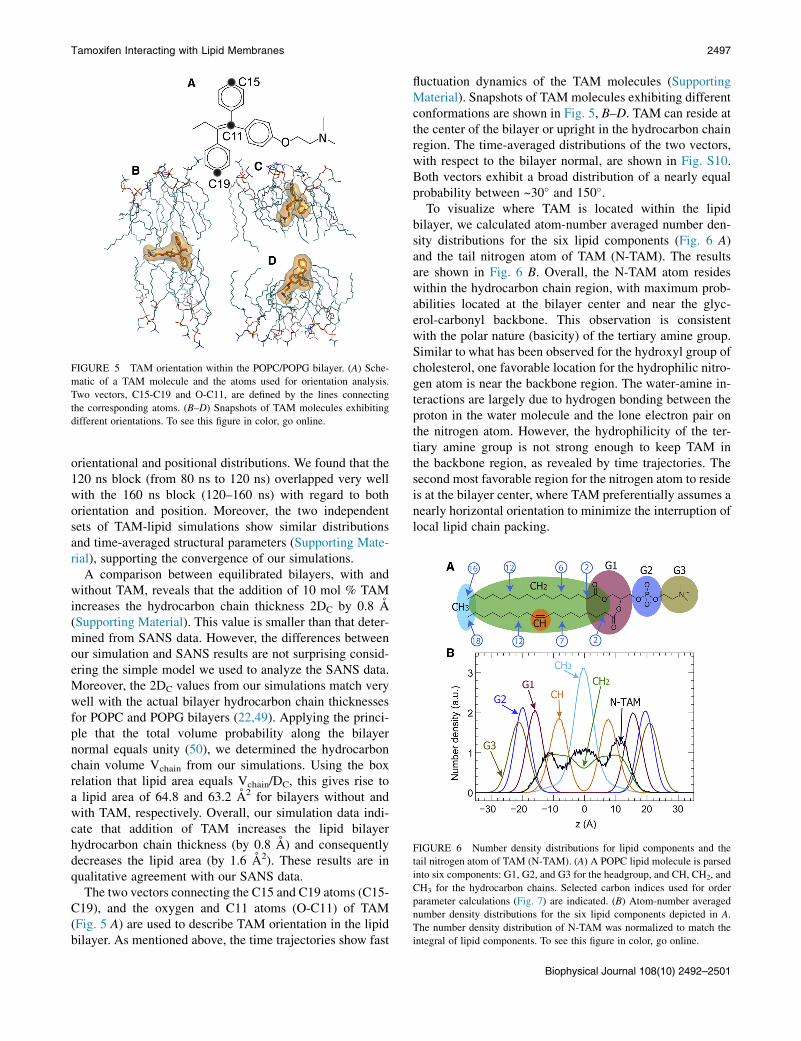
FIGURE 5 TAM orientation within the POPC/POPG bilayer. (A) Sche-
matic of a TAM molecule and the atoms used for orientation analysis.
Two vectors, C15-C19 and O-C11, are defined by the lines connecting
the corresponding atoms. (B–D) Snapshots of TAM molecules exhibiting
different orientations. To see this figure in color, go online.
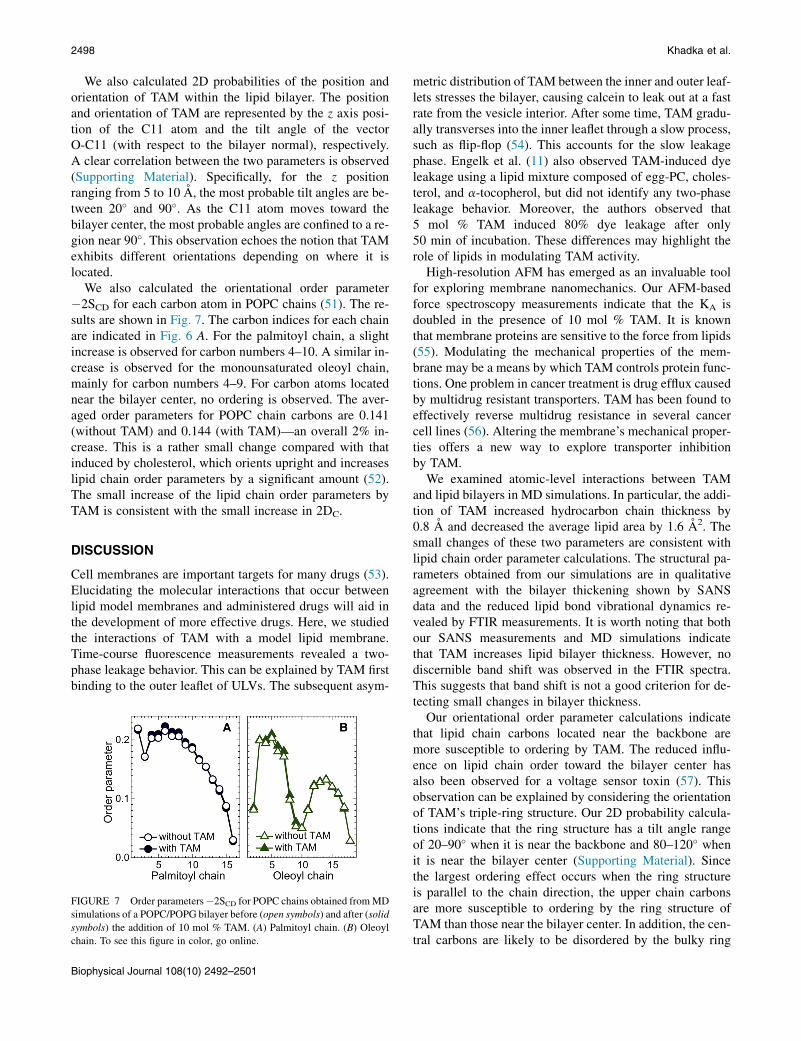
FIGURE 6 Number density distributions for lipid components and the
tail nitrogen atom of TAM (N-TAM). (A) A POPC lipid molecule is parsed
into six components: G1, G2, and G3 for the headgroup, and CH, CH2, and
CH3 for the hydrocarbon chains. Selected carbon indices used for order
parameter calculations (Fig. 7) are indicated. (B) Atom-number averaged
number density distributions for the six lipid components depicted in A.
The number density distribution of N-TAM was normalized to match the
integral of lipid components. To see this figure in color, go online.
Tamoxifen Interacting with Lipid Membranes 2497
orientational and positional distributions. We found that the120 ns block (from 80 ns to 120 ns) overlapped very wellwith the 160 ns block (120–160 ns) with regard to bothorientation and position. Moreover, the two independentsets of TAM-lipid simulations show similar distributionsand time-averaged structural parameters (Supporting Mate-rial), supporting the convergence of our simulations.
A comparison between equilibrated bilayers, with andwithout TAM, reveals that the addition of 10 mol % TAMincreases the hydrocarbon chain thickness 2DC by 0.8 A(Supporting Material). This value is smaller than that deter-mined from SANS data. However, the differences betweenour simulation and SANS results are not surprising consid-ering the simple model we used to analyze the SANS data.Moreover, the 2DC values from our simulations match verywell with the actual bilayer hydrocarbon chain thicknessesfor POPC and POPG bilayers (22,49). Applying the princi-ple that the total volume probability along the bilayernormal equals unity (50), we determined the hydrocarbonchain volume Vchain from our simulations. Using the boxrelation that lipid area equals Vchain/DC, this gives rise toa lipid area of 64.8 and 63.2 A2 for bilayers without andwith TAM, respectively. Overall, our simulation data indi-cate that addition of TAM increases the lipid bilayerhydrocarbon chain thickness (by 0.8 A) and consequentlydecreases the lipid area (by 1.6 A2). These results are inqualitative agreement with our SANS data.
The two vectors connecting the C15 and C19 atoms (C15-C19), and the oxygen and C11 atoms (O-C11) of TAM(Fig. 5 A) are used to describe TAM orientation in the lipidbilayer. As mentioned above, the time trajectories show fast
fluctuation dynamics of the TAM molecules (SupportingMaterial). Snapshots of TAM molecules exhibiting differentconformations are shown in Fig. 5, B–D. TAM can reside atthe center of the bilayer or upright in the hydrocarbon chainregion. The time-averaged distributions of the two vectors,with respect to the bilayer normal, are shown in Fig. S10.Both vectors exhibit a broad distribution of a nearly equalprobability between ~30� and 150�.
To visualize where TAM is located within the lipidbilayer, we calculated atom-number averaged number den-sity distributions for the six lipid components (Fig. 6 A)and the tail nitrogen atom of TAM (N-TAM). The resultsare shown in Fig. 6 B. Overall, the N-TAM atom resideswithin the hydrocarbon chain region, with maximum prob-abilities located at the bilayer center and near the glyc-erol-carbonyl backbone. This observation is consistentwith the polar nature (basicity) of the tertiary amine group.Similar to what has been observed for the hydroxyl group ofcholesterol, one favorable location for the hydrophilic nitro-gen atom is near the backbone region. The water-amine in-teractions are largely due to hydrogen bonding between theproton in the water molecule and the lone electron pair onthe nitrogen atom. However, the hydrophilicity of the ter-tiary amine group is not strong enough to keep TAM inthe backbone region, as revealed by time trajectories. Thesecond most favorable region for the nitrogen atom to resideis at the bilayer center, where TAM preferentially assumes anearly horizontal orientation to minimize the interruption oflocal lipid chain packing.
Biophysical Journal 108(10) 2492–2501
2498 Khadka et al.
We also calculated 2D probabilities of the position andorientation of TAM within the lipid bilayer. The positionand orientation of TAM are represented by the z axis posi-tion of the C11 atom and the tilt angle of the vectorO-C11 (with respect to the bilayer normal), respectively.A clear correlation between the two parameters is observed(Supporting Material). Specifically, for the z positionranging from 5 to 10 A, the most probable tilt angles are be-tween 20� and 90�. As the C11 atom moves toward thebilayer center, the most probable angles are confined to a re-gion near 90�. This observation echoes the notion that TAMexhibits different orientations depending on where it islocated.
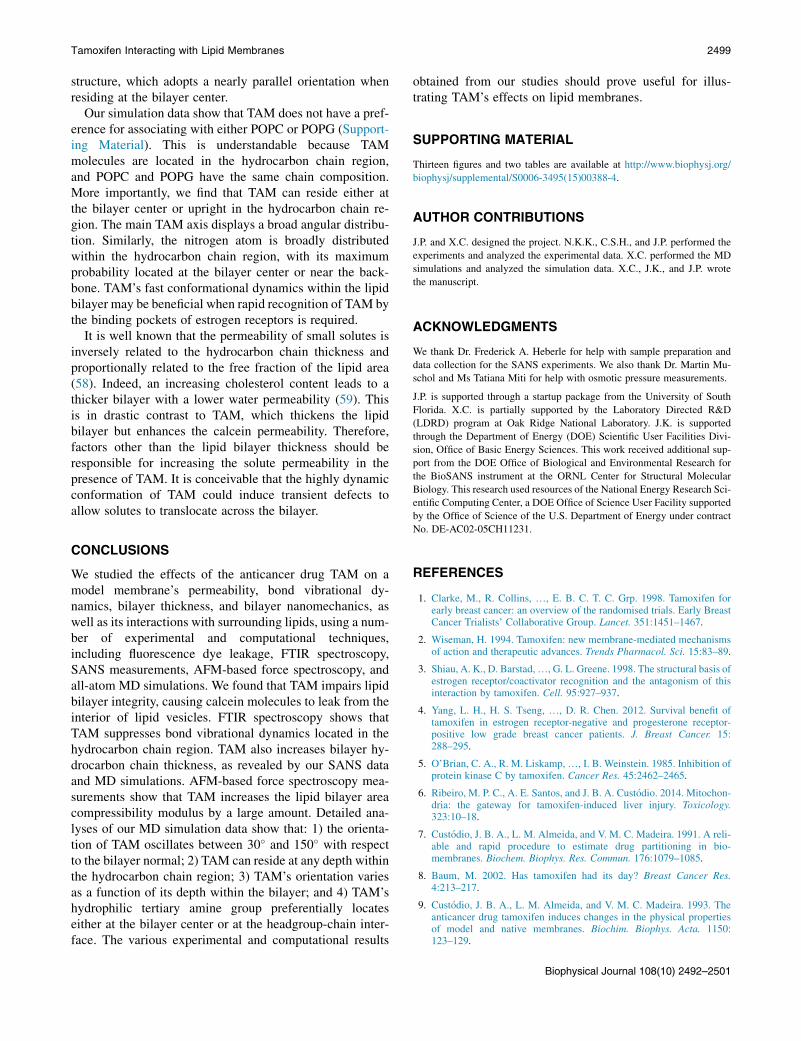
We also calculated the orientational order parameter�2SCD for each carbon atom in POPC chains (51). The re-sults are shown in Fig. 7. The carbon indices for each chainare indicated in Fig. 6 A. For the palmitoyl chain, a slightincrease is observed for carbon numbers 4–10. A similar in-crease is observed for the monounsaturated oleoyl chain,mainly for carbon numbers 4–9. For carbon atoms locatednear the bilayer center, no ordering is observed. The aver-aged order parameters for POPC chain carbons are 0.141(without TAM) and 0.144 (with TAM)—an overall 2% in-crease. This is a rather small change compared with thatinduced by cholesterol, which orients upright and increaseslipid chain order parameters by a significant amount (52).The small increase of the lipid chain order parameters byTAM is consistent with the small increase in 2DC.
DISCUSSION
Cell membranes are important targets for many drugs (53).Elucidating the molecular interactions that occur betweenlipid model membranes and administered drugs will aid inthe development of more effective drugs. Here, we studiedthe interactions of TAM with a model lipid membrane.Time-course fluorescence measurements revealed a two-phase leakage behavior. This can be explained by TAM firstbinding to the outer leaflet of ULVs. The subsequent asym-
FIGURE 7 Order parameters�2SCD for POPC chains obtained fromMD
simulations of a POPC/POPG bilayer before (open symbols) and after (solid
symbols) the addition of 10 mol % TAM. (A) Palmitoyl chain. (B) Oleoyl
chain. To see this figure in color, go online.
Biophysical Journal 108(10) 2492–2501
metric distribution of TAM between the inner and outer leaf-lets stresses the bilayer, causing calcein to leak out at a fastrate from the vesicle interior. After some time, TAM gradu-ally transverses into the inner leaflet through a slow process,such as flip-flop (54). This accounts for the slow leakagephase. Engelk et al. (11) also observed TAM-induced dyeleakage using a lipid mixture composed of egg-PC, choles-terol, and a-tocopherol, but did not identify any two-phaseleakage behavior. Moreover, the authors observed that5 mol % TAM induced 80% dye leakage after only50 min of incubation. These differences may highlight therole of lipids in modulating TAM activity.
High-resolution AFM has emerged as an invaluable toolfor exploring membrane nanomechanics. Our AFM-basedforce spectroscopy measurements indicate that the KA isdoubled in the presence of 10 mol % TAM. It is knownthat membrane proteins are sensitive to the force from lipids(55). Modulating the mechanical properties of the mem-brane may be a means by which TAM controls protein func-tions. One problem in cancer treatment is drug efflux causedby multidrug resistant transporters. TAM has been found toeffectively reverse multidrug resistance in several cancercell lines (56). Altering the membrane’s mechanical proper-ties offers a new way to explore transporter inhibitionby TAM.
We examined atomic-level interactions between TAMand lipid bilayers in MD simulations. In particular, the addi-tion of TAM increased hydrocarbon chain thickness by0.8 A and decreased the average lipid area by 1.6 A2. Thesmall changes of these two parameters are consistent withlipid chain order parameter calculations. The structural pa-rameters obtained from our simulations are in qualitativeagreement with the bilayer thickening shown by SANSdata and the reduced lipid bond vibrational dynamics re-vealed by FTIR measurements. It is worth noting that bothour SANS measurements and MD simulations indicatethat TAM increases lipid bilayer thickness. However, nodiscernible band shift was observed in the FTIR spectra.This suggests that band shift is not a good criterion for de-tecting small changes in bilayer thickness.
Our orientational order parameter calculations indicatethat lipid chain carbons located near the backbone aremore susceptible to ordering by TAM. The reduced influ-ence on lipid chain order toward the bilayer center hasalso been observed for a voltage sensor toxin (57). Thisobservation can be explained by considering the orientationof TAM’s triple-ring structure. Our 2D probability calcula-tions indicate that the ring structure has a tilt angle rangeof 20–90� when it is near the backbone and 80–120� whenit is near the bilayer center (Supporting Material). Sincethe largest ordering effect occurs when the ring structureis parallel to the chain direction, the upper chain carbonsare more susceptible to ordering by the ring structure ofTAM than those near the bilayer center. In addition, the cen-tral carbons are likely to be disordered by the bulky ring
Tamoxifen Interacting with Lipid Membranes 2499
structure, which adopts a nearly parallel orientation whenresiding at the bilayer center.
Our simulation data show that TAM does not have a pref-erence for associating with either POPC or POPG (Support-ing Material). This is understandable because TAMmolecules are located in the hydrocarbon chain region,and POPC and POPG have the same chain composition.More importantly, we find that TAM can reside either atthe bilayer center or upright in the hydrocarbon chain re-gion. The main TAM axis displays a broad angular distribu-tion. Similarly, the nitrogen atom is broadly distributedwithin the hydrocarbon chain region, with its maximumprobability located at the bilayer center or near the back-bone. TAM’s fast conformational dynamics within the lipidbilayer may be beneficial when rapid recognition of TAM bythe binding pockets of estrogen receptors is required.
It is well known that the permeability of small solutes isinversely related to the hydrocarbon chain thickness andproportionally related to the free fraction of the lipid area(58). Indeed, an increasing cholesterol content leads to athicker bilayer with a lower water permeability (59). Thisis in drastic contrast to TAM, which thickens the lipidbilayer but enhances the calcein permeability. Therefore,factors other than the lipid bilayer thickness should beresponsible for increasing the solute permeability in thepresence of TAM. It is conceivable that the highly dynamicconformation of TAM could induce transient defects toallow solutes to translocate across the bilayer.
CONCLUSIONS
We studied the effects of the anticancer drug TAM on amodel membrane’s permeability, bond vibrational dy-namics, bilayer thickness, and bilayer nanomechanics, aswell as its interactions with surrounding lipids, using a num-ber of experimental and computational techniques,including fluorescence dye leakage, FTIR spectroscopy,SANS measurements, AFM-based force spectroscopy, andall-atom MD simulations. We found that TAM impairs lipidbilayer integrity, causing calcein molecules to leak from theinterior of lipid vesicles. FTIR spectroscopy shows thatTAM suppresses bond vibrational dynamics located in thehydrocarbon chain region. TAM also increases bilayer hy-drocarbon chain thickness, as revealed by our SANS dataand MD simulations. AFM-based force spectroscopy mea-surements show that TAM increases the lipid bilayer areacompressibility modulus by a large amount. Detailed ana-lyses of our MD simulation data show that: 1) the orienta-tion of TAM oscillates between 30� and 150� with respectto the bilayer normal; 2) TAM can reside at any depth withinthe hydrocarbon chain region; 3) TAM’s orientation variesas a function of its depth within the bilayer; and 4) TAM’shydrophilic tertiary amine group preferentially locateseither at the bilayer center or at the headgroup-chain inter-face. The various experimental and computational results
obtained from our studies should prove useful for illus-trating TAM’s effects on lipid membranes.
SUPPORTING MATERIAL
Thirteen figures and two tables are available at http://www.biophysj.org/
biophysj/supplemental/S0006-3495(15)00388-4.
AUTHOR CONTRIBUTIONS
J.P. and X.C. designed the project. N.K.K., C.S.H., and J.P. performed the
experiments and analyzed the experimental data. X.C. performed the MD
simulations and analyzed the simulation data. X.C., J.K., and J.P. wrote
the manuscript.
ACKNOWLEDGMENTS
We thank Dr. Frederick A. Heberle for help with sample preparation and
data collection for the SANS experiments. We also thank Dr. Martin Mu-
schol and Ms Tatiana Miti for help with osmotic pressure measurements.
J.P. is supported through a startup package from the University of South
Florida. X.C. is partially supported by the Laboratory Directed R&D
(LDRD) program at Oak Ridge National Laboratory. J.K. is supported
through the Department of Energy (DOE) Scientific User Facilities Divi-
sion, Office of Basic Energy Sciences. This work received additional sup-
port from the DOE Office of Biological and Environmental Research for
the BioSANS instrument at the ORNL Center for Structural Molecular
Biology. This research used resources of the National Energy Research Sci-
entific Computing Center, a DOE Office of Science User Facility supported
by the Office of Science of the U.S. Department of Energy under contract
No. DE-AC02-05CH11231.
REFERENCES
1. Clarke, M., R. Collins, ., E. B. C. T. C. Grp. 1998. Tamoxifen forearly breast cancer: an overview of the randomised trials. Early BreastCancer Trialists’ Collaborative Group. Lancet. 351:1451–1467.
2. Wiseman, H. 1994. Tamoxifen: new membrane-mediated mechanismsof action and therapeutic advances. Trends Pharmacol. Sci. 15:83–89.
3. Shiau, A. K., D. Barstad,., G. L. Greene. 1998. The structural basis ofestrogen receptor/coactivator recognition and the antagonism of thisinteraction by tamoxifen. Cell. 95:927–937.
4. Yang, L. H., H. S. Tseng, ., D. R. Chen. 2012. Survival benefit oftamoxifen in estrogen receptor-negative and progesterone receptor-positive low grade breast cancer patients. J. Breast Cancer. 15:288–295.
5. O’Brian, C. A., R. M. Liskamp,., I. B. Weinstein. 1985. Inhibition ofprotein kinase C by tamoxifen. Cancer Res. 45:2462–2465.
6. Ribeiro, M. P. C., A. E. Santos, and J. B. A. Custodio. 2014. Mitochon-dria: the gateway for tamoxifen-induced liver injury. Toxicology.323:10–18.
7. Custodio, J. B. A., L. M. Almeida, and V. M. C. Madeira. 1991. A reli-able and rapid procedure to estimate drug partitioning in bio-membranes. Biochem. Biophys. Res. Commun. 176:1079–1085.
8. Baum, M. 2002. Has tamoxifen had its day? Breast Cancer Res.4:213–217.
9. Custodio, J. B. A., L. M. Almeida, and V. M. C. Madeira. 1993. Theanticancer drug tamoxifen induces changes in the physical propertiesof model and native membranes. Biochim. Biophys. Acta. 1150:123–129.
Biophysical Journal 108(10) 2492–2501
2500 Khadka et al.
10. Dicko, A., M. Morissette,., T. Di Paolo. 1999. Effect of estradiol andtamoxifen on brain membranes: investigation by infrared and fluores-cence spectroscopy. Brain Res. Bull. 49:401–405.
11. Engelk, M., P. Bojarski, ., H. Diehl. 2001. Tamoxifen perturbs lipidbilayer order and permeability: comparison of DSC, fluorescenceanisotropy, laurdan generalized polarization and carboxyfluoresceinleakage studies. Biophys. Chem. 90:157–173.
12. Kazanci, N., and F. Severcan. 2007. Concentration dependent differentaction of tamoxifen on membrane fluidity. Biosci. Rep. 27:247–255.
13. Bilge, D., I. Sahin, ., F. Severcan. 2014. Interactions of tamoxifenwith distearoyl phosphatidylcholine multilamellar vesicles: FTIRand DSC studies. Spectrochim. Acta A Mol. Biomol. Spectrosc. 130:250–256.
14. Bilge, D., N. Kazanci, and F. Severcan. 2013. Acyl chain length andcharge effect on tamoxifen-lipid model membrane interactions.J. Mol. Struct. 1040:75–82.
15. Boyar, H., and F. Severcan. 1997. Tamoxifen-model membrane interac-tions: an FT-IR study. J. Mol. Struct. 408:265–268.
16. Severcan, F., N. Kazanci, and F. Zorlu. 2000. Tamoxifen increasesmembrane fluidity at high concentrations. Biosci. Rep. 20:177–184.
17. Wiseman, H., P. Quinn, and B. Halliwell. 1993. Tamoxifen and relatedcompounds decrease membrane fluidity in liposomes. Mechanism forthe antioxidant action of tamoxifen and relevance to its anticancerand cardioprotective actions? FEBS Lett. 330:53–56.
18. Luxo, C., A. S. Jurado,., V. M. Madeira. 1996. Use of Bacillus stear-othermophilus as a model to study tamoxifen-membrane interactions.Toxicol. In Vitro. 10:463–471.
19. Suwalsky, M., P. Hernandez, ., C. P. Sotomayor. 1998. Interaction ofthe anticancer drug tamoxifen with the human erythrocyte membraneand molecular models. Z. Naturforsch. C. 53:182–190.
20. Ayuyan, A. G., and F. S. Cohen. 2006. Lipid peroxides promote largerafts: effects of excitation of probes in fluorescence microscopy andelectrochemical reactions during vesicle formation. Biophys. J. 91:2172–2183.
21. Mannock, D. A., R. N. A. H. Lewis, and R. N. McElhaney. 2010. Acalorimetric and spectroscopic comparison of the effects of ergosteroland cholesterol on the thermotropic phase behavior and organization ofdipalmitoylphosphatidylcholine bilayer membranes. Biochim. Biophys.Acta. 1798:376–388.
22. Ku�cerka, N., J. F. Nagle, ., J. Katsaras. 2008. Lipid bilayer structuredetermined by the simultaneous analysis of neutron and X-ray scat-tering data. Biophys. J. 95:2356–2367.
23. Hutter, J. L., and J. Bechhoefer. 1993. Calibration of atomic-force mi-croscope tips. Rev. Sci. Instrum. 64:1868–1873.
24. Jo, S., J. B. Lim,., W. Im. 2009. CHARMM-GUI Membrane Builderfor mixed bilayers and its application to yeast membranes. Biophys. J.97:50–58.
25. Martınez, L., R. Andrade, ., J. M. Martınez. 2009. PACKMOL: apackage for building initial configurations for molecular dynamics sim-ulations. J. Comput. Chem. 30:2157–2164.
26. Phillips, J. C., R. Braun,., K. Schulten. 2005. Scalable molecular dy-namics with NAMD. J. Comput. Chem. 26:1781–1802.
27. Klauda, J. B., R. M. Venable, ., R. W. Pastor. 2010. Update of theCHARMM all-atom additive force field for lipids: validation on sixlipid types. J. Phys. Chem. B. 114:7830–7843.
28. Feller, S. E., D. Yin, ., A. D. MacKerell, Jr. 1997. Molecular dy-namics simulation of unsaturated lipid bilayers at low hydration:parameterization and comparison with diffraction studies. Biophys. J.73:2269–2279.
29. Vanommeslaeghe, K., E. Hatcher, ., A. D. Mackerell, Jr. 2010.CHARMM general force field: a force field for drug-like moleculescompatible with the CHARMM all-atom additive biological forcefields. J. Comput. Chem. 31:671–690.
30. Martyna, G. J., D. J. Tobias, and M. L. Klein. 1994. Constant pressuremolecular dynamics algorithms. J. Chem. Phys. 101:4177–4189.
Biophysical Journal 108(10) 2492–2501
31. Feller, S. E., Y. H. Zhang, ., B. R. Brooks. 1995. Constant pressuremolecular dynamics simulation: the Langevin piston method.J. Chem. Phys. 103:4613–4621.
32. Darden, T., D. York, and L. Pedersen. 1993. Particle mesh Ewald: anN.Log(N) method for Ewald sums in large systems. J. Chem. Phys.98:10089–10092.
33. Essmann, U., L. Perera, ., L. G. Pedersen. 1995. A smooth particlemesh Ewald method. J. Chem. Phys. 103:8577–8593.
34. Tuckerman, M., B. J. Berne, and G. J. Martyna. 1992. Reversible mul-tiple time scale molecular-dynamics. J. Chem. Phys. 97:1990–2001.
35. Ryckaert, J. P., G. Ciccotti, and H. J. C. Berendsen. 1977. Numericalintegration of the Cartesian equations of motion of a system with con-straints: molecular dynamics of n-alkanes. J. Comput. Phys. 23:327–341.
36. Seelig, A., and J. Seelig. 1974. The dynamic structure of fatty acylchains in a phospholipid bilayer measured by deuteriummagnetic reso-nance. Biochemistry. 13:4839–4845.
37. Sroda, K., K. Michalak, ., A. B. Hendrich. 2008. Genistein deriva-tives decrease liposome membrane integrity—calcein release and mo-lecular modeling study. Biophys. Chem. 138:78–82.
38. Sheynis, T., A. Friediger,., R. Jelinek. 2013. Aggregation modulatorsinterfere with membrane interactions of b2-microglobulin fibrils.Biophys. J. 105:745–755.
39. Heerklotz, H., and J. Seelig. 2007. Leakage and lysis of lipidmembranesinduced by the lipopeptide surfactin. Eur. Biophys. J. 36:305–314.
40. Ladokhin, A. S., W. C. Wimley, and S. H. White. 1995. Leakage ofmembrane vesicle contents: determination of mechanism using fluores-cence requenching. Biophys. J. 69:1964–1971.
41. Pencer, J., S. Krueger,., J. Katsaras. 2006. Method of separated formfactors for polydisperse vesicles. J. Appl. Cryst. 39:293–303.
42. Ku�cerka, N., M. P. Nieh, and J. Katsaras. 2011. Fluid phase lipid areasand bilayer thicknesses of commonly used phosphatidylcholines as afunction of temperature. Biochim. Biophys. Acta. 1808:2761–2771.
43. Ku�cerka, N., B. W. Holland, ., J. Katsaras. 2012. Scattering densityprofile model of POPG bilayers as determined by molecular dynamicssimulations and small-angle neutron and X-ray scattering experiments.J. Phys. Chem. B. 116:232–239.
44. Hung, W. C., M. T. Lee,., H. W. Huang. 2007. The condensing effectof cholesterol in lipid bilayers. Biophys. J. 92:3960–3967.
45. Pan, J., T. T. Mills, ., J. F. Nagle. 2008. Cholesterol perturbs lipid bi-layers nonuniversally. Phys. Rev. Lett. 100:198103.
46. Das, C., K. H. Sheikh, ., S. D. Connell. 2010. Nanoscale mechanicalprobing of supported lipid bilayers with atomic force microscopy.Phys. Rev. E Stat. Nonlin. Soft Matter Phys. 82:041920.
47. Rawicz, W., K. C. Olbrich, ., E. Evans. 2000. Effect of chain lengthand unsaturation on elasticity of lipid bilayers. Biophys. J. 79:328–339.
48. Evans, E., W. Rawicz, and B. A. Smith. 2013. Back to the future: me-chanics and thermodynamics of lipid biomembranes. Faraday Discuss.161:591–611.
49. Pan, J., D. Marquardt, ., J. Katsaras. 2014. Revisiting the bilayerstructures of fluid phase phosphatidylglycerol lipids: Accounting forexchangeable hydrogens. Biochim. Biophys. Acta. 1838:2966–2969.
50. Petrache, H. I., S. E. Feller, and J. F. Nagle. 1997. Determination ofcomponent volumes of lipid bilayers from simulations. Biophys. J.72:2237–2242.
51. Berger, O., O. Edholm, and F. Jahnig. 1997. Molecular dynamics sim-ulations of a fluid bilayer of dipalmitoylphosphatidylcholine at full hy-dration, constant pressure, and constant temperature. Biophys. J.72:2002–2013.
52. Sodt, A. J., M. L. Sandar,., E. Lyman. 2014. The molecular structureof the liquid-ordered phase of lipid bilayers. J. Am. Chem. Soc.136:725–732.
53. Hendrich, A. B., and K. Michalak. 2003. Lipids as a target for drugsmodulating multidrug resistance of cancer cells. Curr. Drug Targets.4:23–30.
Tamoxifen Interacting with Lipid Membranes 2501
54. Kornberg, R. D., and H. M. McConnell. 1971. Inside-outside transi-tions of phospholipids in vesicle membranes. Biochemistry. 10:1111–1120.
55. McIntosh, T. J., and S. A. Simon. 2006. Roles of bilayer material prop-erties in function and distribution of membrane proteins. Annu. Rev.Biophys. Biomol. Struct. 35:177–198.
56. Ramu, A., D. Glaubiger, and Z. Fuks. 1984. Reversal of acquired resis-tance to doxorubicin in P388 murine leukemia cells by tamoxifen andother triparanol analogues. Cancer Res. 44:4392–4395.
57. Mihailescu, M., D. Krepkiy,., S. White. 2014. Structural interactionsof a voltage sensor toxin with lipid membranes. Proc. Natl. Acad. Sci.USA. 111:E5463–E5470.
58. Nagle, J. F., J. C. Mathai, ., S. Tristram-Nagle. 2008. Theory ofpassive permeability through lipid bilayers. J. Gen. Physiol. 131:77–85.
59. Rawicz, W., B. A. Smith, ., E. Evans. 2008. Elasticity, strength, andwater permeability of bilayers that contain raft microdomain-forminglipids. Biophys. J. 94:4725–4736.
Biophysical Journal 108(10) 2492–2501