Interactions between toothbrush and toothpaste particles...
33
This is a repository copy of Interactions between toothbrush and toothpaste particles during simulated abrasive cleaning . White Rose Research Online URL for this paper: http://eprints.whiterose.ac.uk/1964/ Article: Lewis, R. and Dwyer-Joyce, R.S. (2006) Interactions between toothbrush and toothpaste particles during simulated abrasive cleaning. Proceedings of the Institution of Mechanical Engineers. Part J: Journal of engineering tribology, 220 (8). pp. 755-765. ISSN 1350-6501 https://doi.org/10.1243/13506501JET96 [email protected] https://eprints.whiterose.ac.uk/ Reuse Unless indicated otherwise, fulltext items are protected by copyright with all rights reserved. The copyright exception in section 29 of the Copyright, Designs and Patents Act 1988 allows the making of a single copy solely for the purpose of non-commercial research or private study within the limits of fair dealing. The publisher or other rights-holder may allow further reproduction and re-use of this version - refer to the White Rose Research Online record for this item. Where records identify the publisher as the copyright holder, users can verify any specific terms of use on the publisher’s website. Takedown If you consider content in White Rose Research Online to be in breach of UK law, please notify us by emailing [email protected] including the URL of the record and the reason for the withdrawal request.
Transcript of Interactions between toothbrush and toothpaste particles...
This is a repository copy of Interactions between toothbrush and toothpaste particles during simulated abrasive cleaning .
White Rose Research Online URL for this paper:http://eprints.whiterose.ac.uk/1964/
Article:
Lewis, R. and Dwyer-Joyce, R.S. (2006) Interactions between toothbrush and toothpaste particles during simulated abrasive cleaning. Proceedings of the Institution of Mechanical Engineers. Part J: Journal of engineering tribology, 220 (8). pp. 755-765. ISSN 1350-6501
https://doi.org/10.1243/13506501JET96
[email protected]://eprints.whiterose.ac.uk/
Reuse
Unless indicated otherwise, fulltext items are protected by copyright with all rights reserved. The copyright exception in section 29 of the Copyright, Designs and Patents Act 1988 allows the making of a single copy solely for the purpose of non-commercial research or private study within the limits of fair dealing. The publisher or other rights-holder may allow further reproduction and re-use of this version - refer to the White Rose Research Online record for this item. Where records identify the publisher as the copyright holder, users can verify any specific terms of use on the publisher’s website.
Takedown
If you consider content in White Rose Research Online to be in breach of UK law, please notify us by emailing [email protected] including the URL of the record and the reason for the withdrawal request.
White Rose Research Online http://eprints.whiterose.ac.uk/
This is an author produced version of a paper published in Proceedings of the Institution of Mechanical Engineers. Part J.
White Rose Research Online URL for this paper: http://eprints.whiterose.ac.uk/1964/
Published paper Lewis, R. and Dwyer-Joyce, R.S. (2006) Interactions between toothbrush and toothpaste particles during simulated abrasive cleaning. Proceedings of the Institution of Mechanical Engineers. Part J: Journal of engineering tribology, 220 (8). pp. 755-765.
White Rose Research Online [email protected]
INTERACTIONS BETWEEN TOOTHBRUSH AND TOOTHPASTE
PARTICLES DURING SIMULATED ABRASIVE CLEANING
R. LEWIS*, R.S. DWYER-JOYCE
Department of Mechanical Engineering, The University of Sheffield, Mappin Street, Sheffield, S1 3JD
*Corresponding author
ABSTRACT
Most people clean their teeth using toothpaste, consisting of abrasive particles in a carrier
fluid, and a filament based toothbrush to remove plaque and stain. In order to optimise
cleaning efficiency it is important to understand how toothbrush filaments, abrasive particles
and fluid interact in a tooth cleaning contact.
Work has been carried out to visualise, simulate, and model the processes in teeth cleaning.
Laboratory cleaning contacts were created between a toothbrush and a transparent surface.
Video and short duration flash photography were used to study the processes by which a
toothbrush traps abrasive particles, loads them against the counterface, and removes material.
Small abrasive particles tend to be trapped at the contact between the filament tip and the
counterface, whilst larger particles are trapped by clumps of filaments or at the contact with
the side of a bent filament.
Measurements of brush friction force were recorded during cleaning for a range of operating
conditions. The presence of abrasive particles in the cleaning mixture increased the
coefficient of friction, but the absolute particle concentration showed a lesser effect. It is
surmised that only a few particles carry any load and cause any abrasion; increasing the
particle concentration does not directly increase the number of load bearing particles.
Abrasive scratch tests were also carried out, using PMMA as a wearing substrate. The
scratches produced during these tests were studied. The microscopy images were used to
deduce how the filaments deflect and drag, and how particles are trapped by filaments and
scratch the surface. Again, it was observed that few of the brush filaments loaded particles to
produce scratches, and that when a filament changes direction of travel the trapped particle is
lost.
Results of these studies were used to develop both qualitative and quantitative models of the
process by which material is removed in teeth cleaning. The quantitative model contains, by
necessity, several empirical factors, but nonetheless predictions compare well with in vitro
wear results from the literature. The results were also used to draw some broad conclusions
on appropriate brushing techniques for optimum tooth cleaning.
Keywords: teeth cleaning, abrasive particles, toothbrush, toothpaste
1 INTRODUCTION
Teeth are usually cleaned using a toothpaste, consisting of abrasive particles in a carrier fluid,
with a filament based toothbrush. Toothbrush effectiveness is typically assessed using in
vitro tests carried out on tooth brushing simulators or by using in vivo tests. A number of
different simulators have been developed [1, 2, 3, 4]. Most operate by mechanically loading
and moving a toothbrush head over a test specimen made from dentine, enamel or acrylic.
The performance of a new brush design is usually compared with that of a standard brush and
toothpaste. Measurements are made of material removal or the colour change of an applied
stain. Toothpastes are tested in a similar manner, by comparison with a standard toothpaste
under standardised conditions of load, number and direction of brushing strokes and
toothpaste slurry concentration (typical standards include [5] and [6]).
The effects of some key brushing parameters on abrasive cleaning have been studied using
both in vivo and in vitro testing. Loads applied during toothbrushing, measured using
instrumented toothbrushes [7, 8], are thought to have a significant effect [7, 9]. Brushing
technique also has an influence. Differences have been found in dentine wear as a result of
using a vertical uni-directional brushing technique as opposed to a horizontal cross-brushing
technique [1, 10]. It as also been noted that filament stiffness as well as filament orientation
and tip shape will also play a part, as yet unquantified [11]. There is, however, no clear
understanding of why these parameters affect cleaning effectiveness.
In order to understand how the cleaning process occurs and how to make efficiency
improvements there is a need to investigate in detail how the abrasive particles in toothpaste
actually cause material removal from a plaque or stain layer. New testing techniques are
required to carry out such studies as current test methods, described above, are only able to
give the final result whilst giving little information about mechanisms occurring in the
cleaning contact.
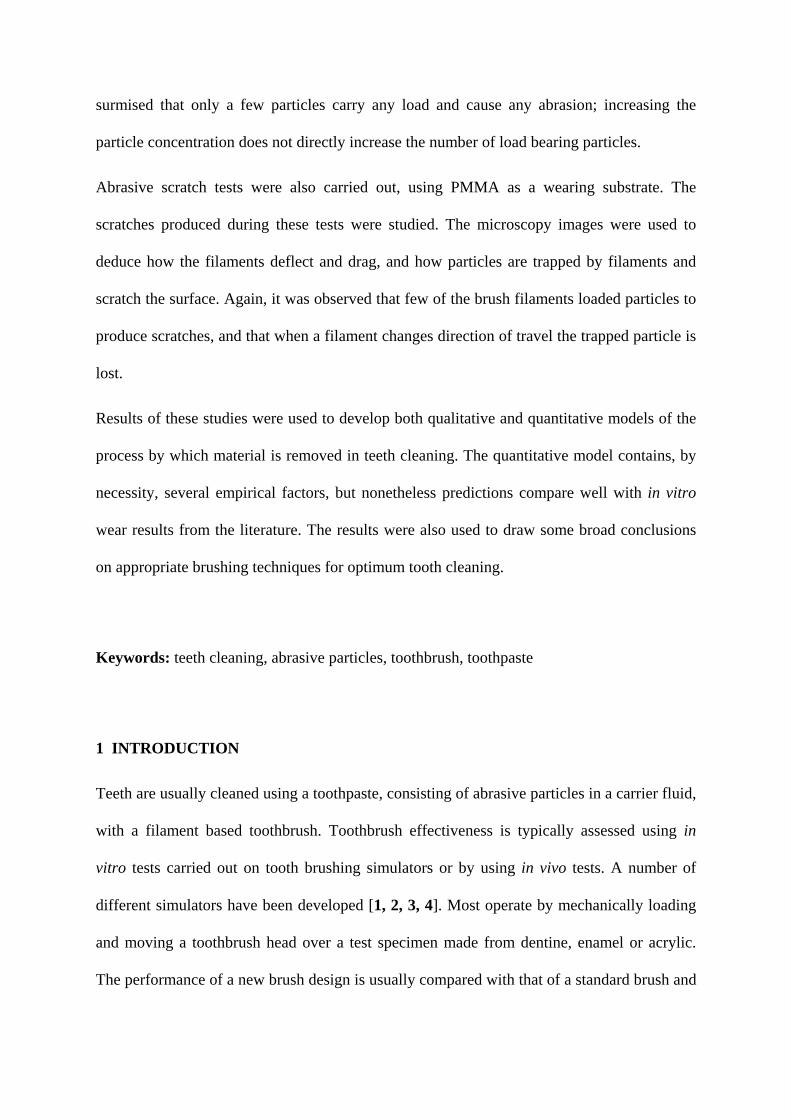
Visualisation studies have been carried out by the present authors [12] that have indicated
how abrasive particles interact with the tips of toothbrush filaments. Uni-directional sliding
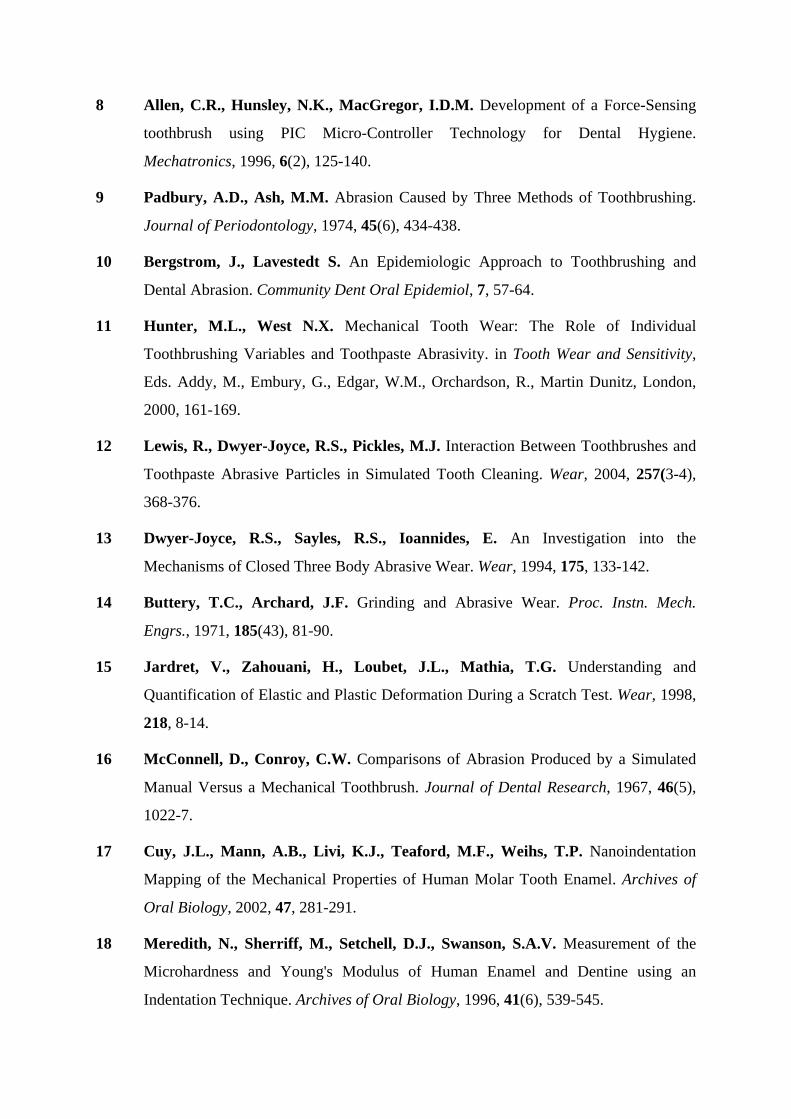
and reciprocating brush motions were investigated. Figure 1 shows a photomicrograph of a
clump of filaments sliding against a glass surface with 7 μm silica particles. The particles are
trapped at the tip of the toothbrush filament where it contacts the counterface. Particles
suspended in fluid approach the filament, as they pass through the contact between the tip
and counterface contact they may become trapped. Where and how the particles are trapped
depends largely on the brushing action, the applied load to the filaments, and hence the
degree of filament deflection, and the particle size.
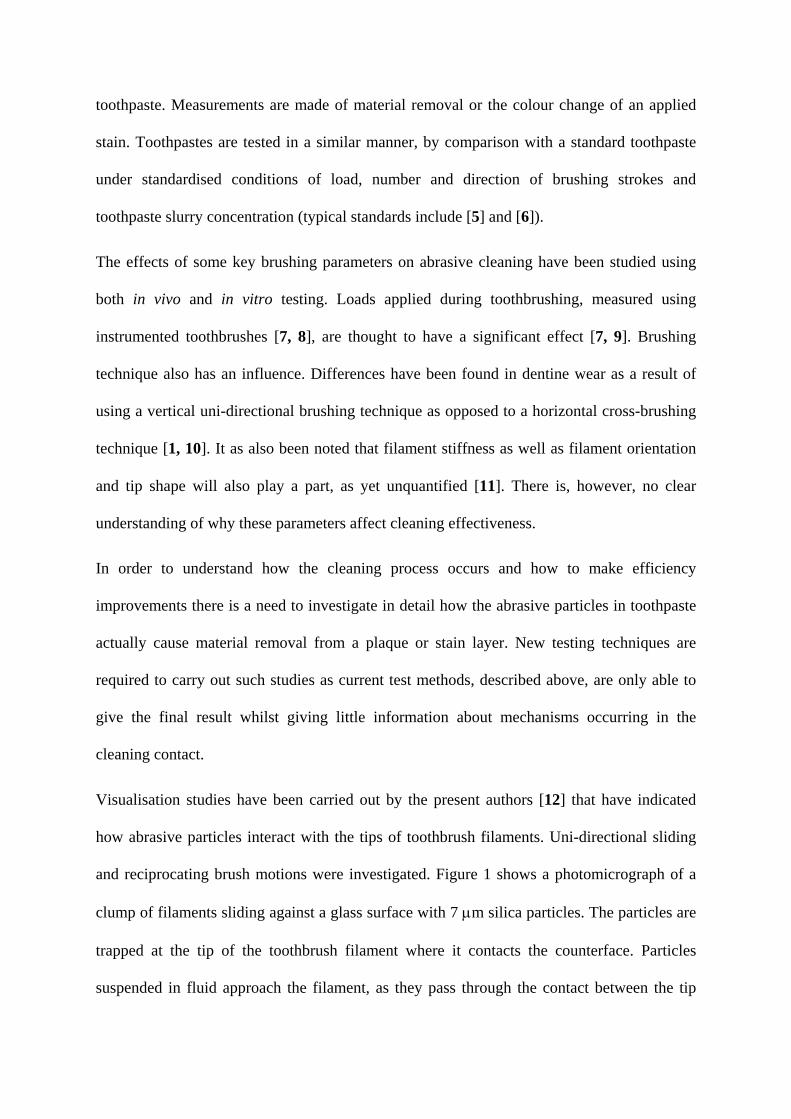
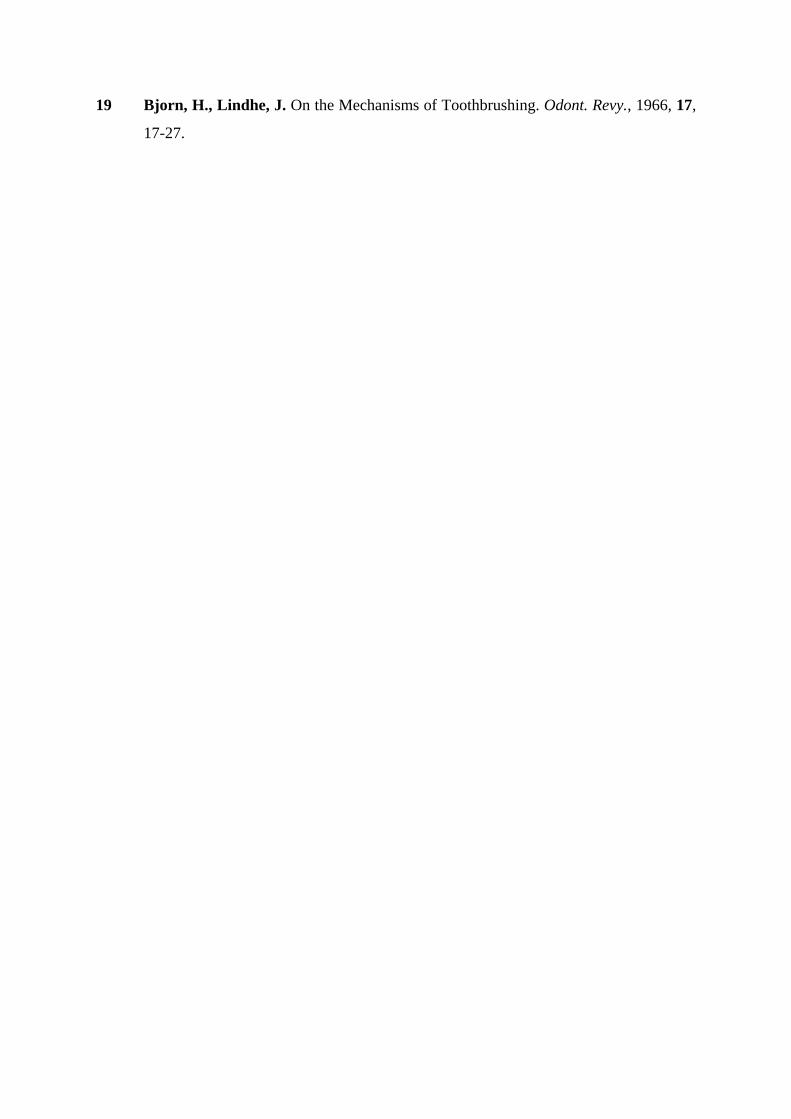
The particles build-up at the edge of the filament tip contact and enter and circulate in the
contact, as shown in Figure 2a. Increasing the load changes the contact geometry and leads to
less particles remaining in the tip contact region (see Figure 2b). Larger particles tend to be
trapped between the filament tips with only a few entering the tip contact region. At higher
loads and hence deflections the particles are trapped under the end of the filaments and none
enter the contact regions. When using a reciprocating motion far more particles are trapped in
the tip contact regions than with the sliding motion and they are only dislodged at high
amplitudes or frequencies.
Greater particle entrainment into the filament tip contact occurred with a reciprocating action
at low filament loads and deflections than with a uni-directional sliding motion. Increasing
brushing speed leads to greater particle motion around the filament tips.
The aim of the present study was to extend this work and apply an engineering approach to
studying the actual mechanism of material removal in a model tooth cleaning contact. The
objectives were to study the effects of particle trapping at a filament tip using both friction
and abrasion tests. This was then related to observations made during the visualisation studies
and a theoretical analysis of particle indentation and scratching to develop a teeth cleaning
model.
2 FRICTION TESTING
In tooth cleaning the friction force arises from; the contact between the filaments and the
counterface, capillary forces, and the ploughing force caused by the particles abrading the
surface. In these tests the overall friction force was measured as the concentration of particles
was varied. The intention was to relate the measured friction force to the abrasive behaviour
of the particles.
2.1 Test Apparatus and Operating Conditions
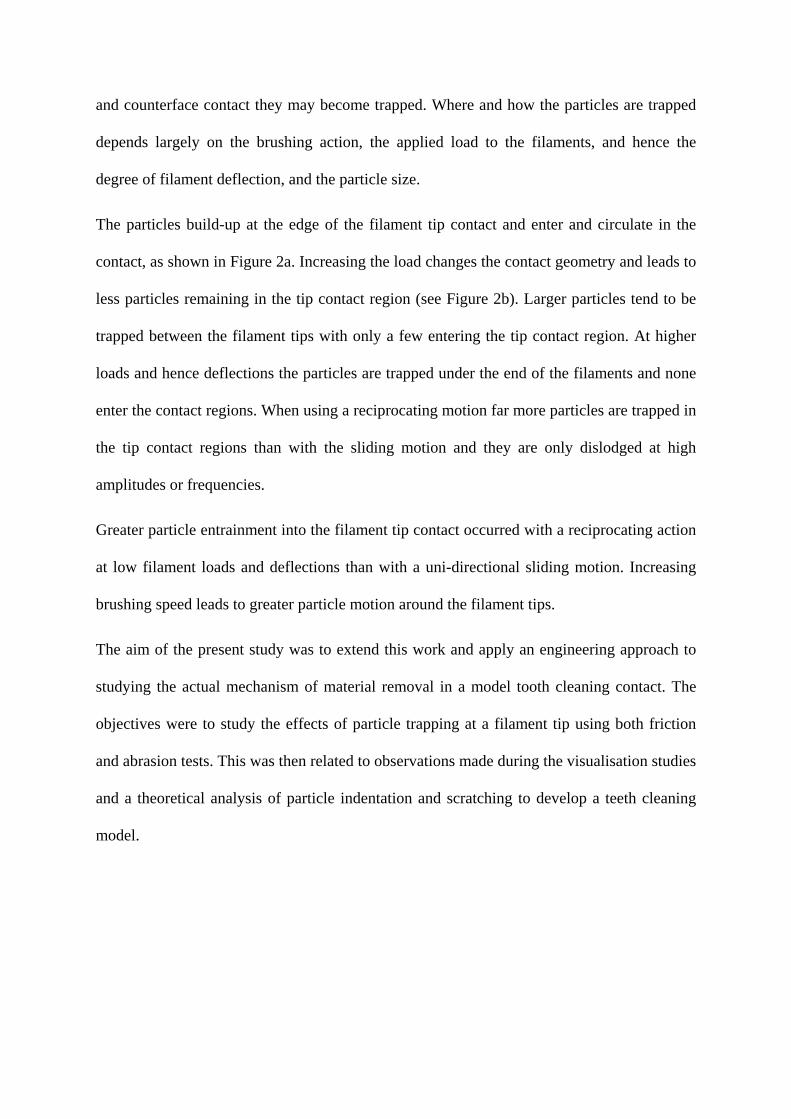
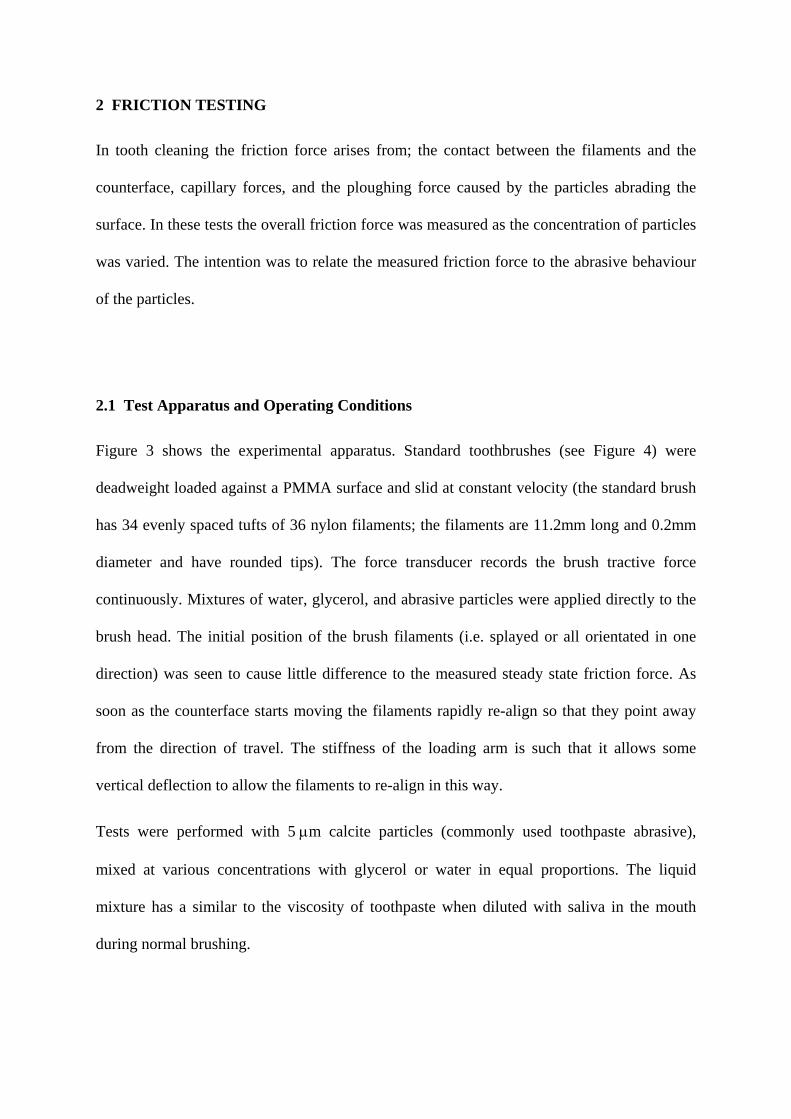
Figure 3 shows the experimental apparatus. Standard toothbrushes (see Figure 4) were
deadweight loaded against a PMMA surface and slid at constant velocity (the standard brush
has 34 evenly spaced tufts of 36 nylon filaments; the filaments are 11.2mm long and 0.2mm
diameter and have rounded tips). The force transducer records the brush tractive force
continuously. Mixtures of water, glycerol, and abrasive particles were applied directly to the
brush head. The initial position of the brush filaments (i.e. splayed or all orientated in one
direction) was seen to cause little difference to the measured steady state friction force. As
soon as the counterface starts moving the filaments rapidly re-align so that they point away
from the direction of travel. The stiffness of the loading arm is such that it allows some
vertical deflection to allow the filaments to re-align in this way.
Tests were performed with 5 μm calcite particles (commonly used toothpaste abrasive),
mixed at various concentrations with glycerol or water in equal proportions. The liquid
mixture has a similar to the viscosity of toothpaste when diluted with saliva in the mouth
during normal brushing.
Loads and brushing speeds used in the tests were based on reported measurements taken
during in vivo experiments [7, 8]. Loads ranged from 1.8N to 3.7N and brushing speeds from
3cm/s to 15cm/s (although varying the brush speed had negligible effect on the measured
friction force).
2.2. Results
Table 1 shows the mean friction coefficient varying with load and particle concentration
(three tests were performed for each case). The addition of liquid causes a large fall in
friction, presumably by lubricating the contact between the filaments and the counterface (all
brushes were soaked in water for 20 minutes before use as gradual water uptake into the
nylon filaments tended to occur).
The addition of a very low concentration of solid particles (0.2%) causes the friction
coefficient to increase by around 25-30% (except for the intermediate load, where the
increase was lower). Increasing the level of particle concentration then has only a minor
effect on the friction coefficient (as shown in the logarithmic scale graph in Figure 5).
The effect of brush load is that it increases the area of contact between the filaments and the
counterface, as the filaments deflect and conform to the surface. This causes the friction
coefficient to rise. The effect of particle concentration is surprising, even increasing the
concentration by 100 times has a very small effect. There are two possibilities, either the
particle abrasive ploughing component of friction is small, or that the majority of the abrasive
particles play no part in the frictional interaction.
If we assume an abrasive particle is pressed into the PMMA surface to a depth of, say, 2 μm,
then, since the hardness of PMMA is 0.5 GPa, the force required to plough the particle
through the surface is approximately 0.002 N (further calculations along these lines are
presented in section 4 of this paper). This represents some 0.5% of the total tractive force. It
is conceivable therefore that 50 particles could be ploughing at any one time and causing the
observed 25-30% rise in friction coefficient. Each toothbrush has 1360 filaments, so this
would indicate that 1 in 27 filaments is causing an abrasive action. However, adding further
particles does not cause this to rise further.
The visualisation studies of [12], tended to show that only a few particles in the brush
counterface contact carry any load. The other particles are free to move throughout the fluid
or remain loosely held between filaments or against the surface. Increasing the concentration
does therefore not increase the number of particles carrying and load.
3 ABRASION TESTING
Abrasion tests were carried out in order to deduce further information about the toothbrush
cleaning action from the morphology of the scratches formed. The approach enables the
study the material removal process and to determine the number of particles trapped at
filament tips and causing damage.
3.1 Test Apparatus and Operating Conditions
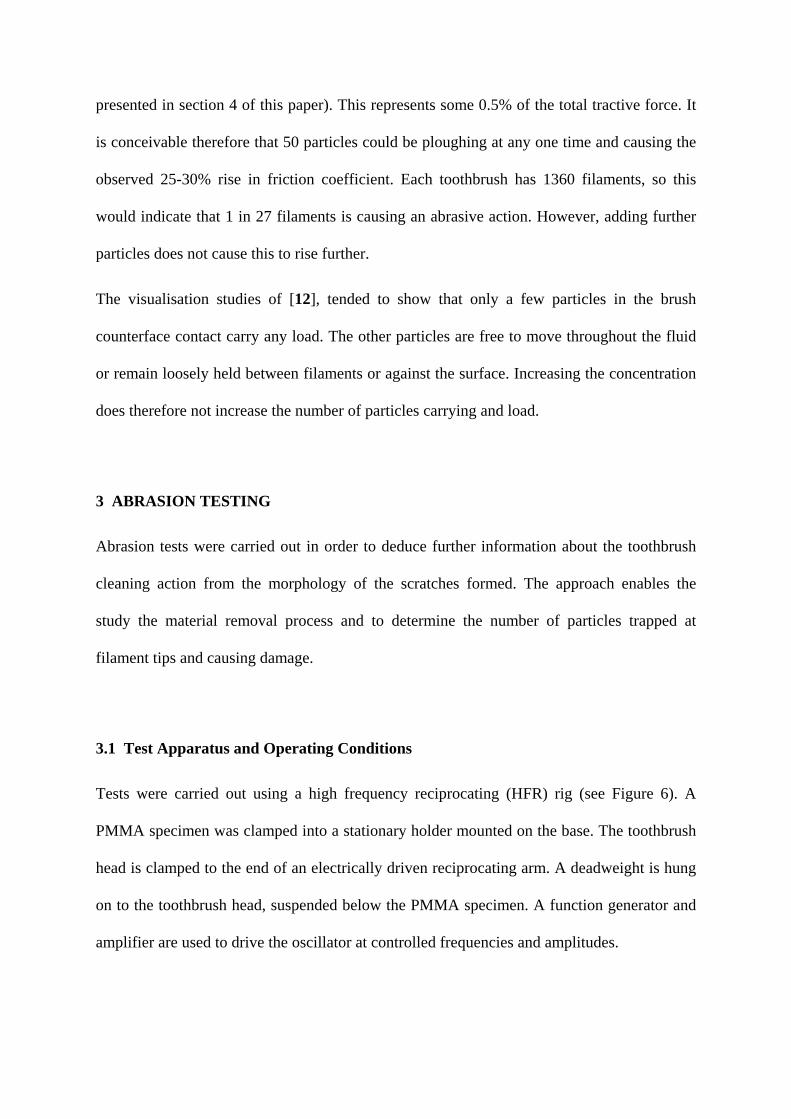
Tests were carried out using a high frequency reciprocating (HFR) rig (see Figure 6). A
PMMA specimen was clamped into a stationary holder mounted on the base. The toothbrush
head is clamped to the end of an electrically driven reciprocating arm. A deadweight is hung
on to the toothbrush head, suspended below the PMMA specimen. A function generator and
amplifier are used to drive the oscillator at controlled frequencies and amplitudes.
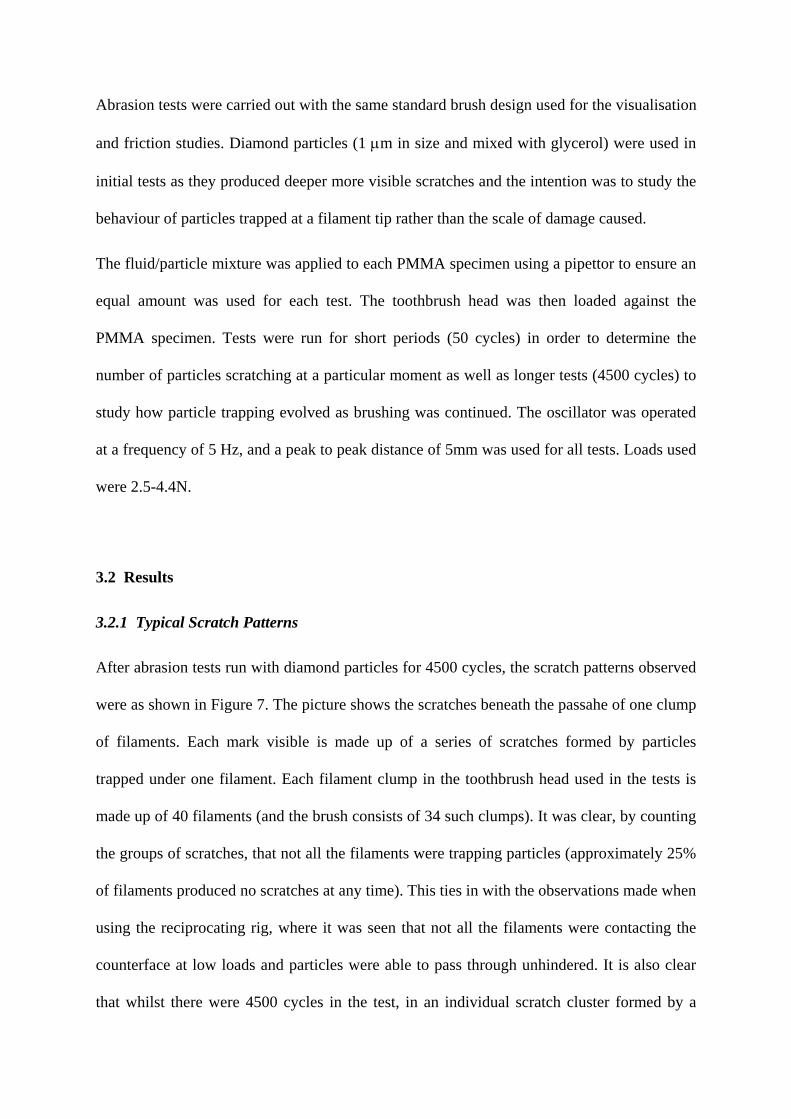
Abrasion tests were carried out with the same standard brush design used for the visualisation
and friction studies. Diamond particles (1 μm in size and mixed with glycerol) were used in
initial tests as they produced deeper more visible scratches and the intention was to study the
behaviour of particles trapped at a filament tip rather than the scale of damage caused.
The fluid/particle mixture was applied to each PMMA specimen using a pipettor to ensure an
equal amount was used for each test. The toothbrush head was then loaded against the
PMMA specimen. Tests were run for short periods (50 cycles) in order to determine the
number of particles scratching at a particular moment as well as longer tests (4500 cycles) to
study how particle trapping evolved as brushing was continued. The oscillator was operated
at a frequency of 5 Hz, and a peak to peak distance of 5mm was used for all tests. Loads used
were 2.5-4.4N.
3.2 Results
3.2.1 Typical Scratch Patterns
After abrasion tests run with diamond particles for 4500 cycles, the scratch patterns observed
were as shown in Figure 7. The picture shows the scratches beneath the passahe of one clump
of filaments. Each mark visible is made up of a series of scratches formed by particles
trapped under one filament. Each filament clump in the toothbrush head used in the tests is
made up of 40 filaments (and the brush consists of 34 such clumps). It was clear, by counting
the groups of scratches, that not all the filaments were trapping particles (approximately 25%
of filaments produced no scratches at any time). This ties in with the observations made when
using the reciprocating rig, where it was seen that not all the filaments were contacting the
counterface at low loads and particles were able to pass through unhindered. It is also clear
that whilst there were 4500 cycles in the test, in an individual scratch cluster formed by a

single filament there are many times fewer scratches. Clearly, a particle is not abrading the
surface during each cycle. The particles must stochastically attach themselves to a filament
for one or more cycles and then be released.
The peak to peak distance moved by the reciprocating arm was 5mm. In Figure 7 it can be
seen that the scratches are not 5mm long. Clearly there is some lag on the filament motion
(see Figure 8). This effect has been observed previously [7], although it was not quantified. It
is likely, given observations made during the visualisation studies, that on top of the filament
lag there is a scratch lag. The filaments will probably move a certain distance before
entraining and trapping a particle that then, when loaded by the filament against the
counterface, will create a scratch. For a 5mm peak to peak arm movement the average scratch
length was 1mm.
When running 50 cycle tests very few scratches were formed (see Figure 9). Most were
single scratches rather than the groups seen after the 4500 cycle tests. Clearly at any instant
very few particles are cutting and causing scratches. This also indicates that the series of
scratches for each filament observed after the 4500 cycle tests were not caused by the same
particle remaining trapped. Rather it is more likely that a particle is trapped and a single
scratch is formed; on reversing direction the particle is lost; after a certain number of cycles
another particle is trapped and a second scratch is formed and the particle is then lost and so
on. It was found that at low load, approximately 10% of the filaments in contact produced
scratches during the 50 cycle test.
3.2.2 Types of Scratches Observed
A number of different scratch “types” were observed after the abrasion tests, as shown in
Figure 9.
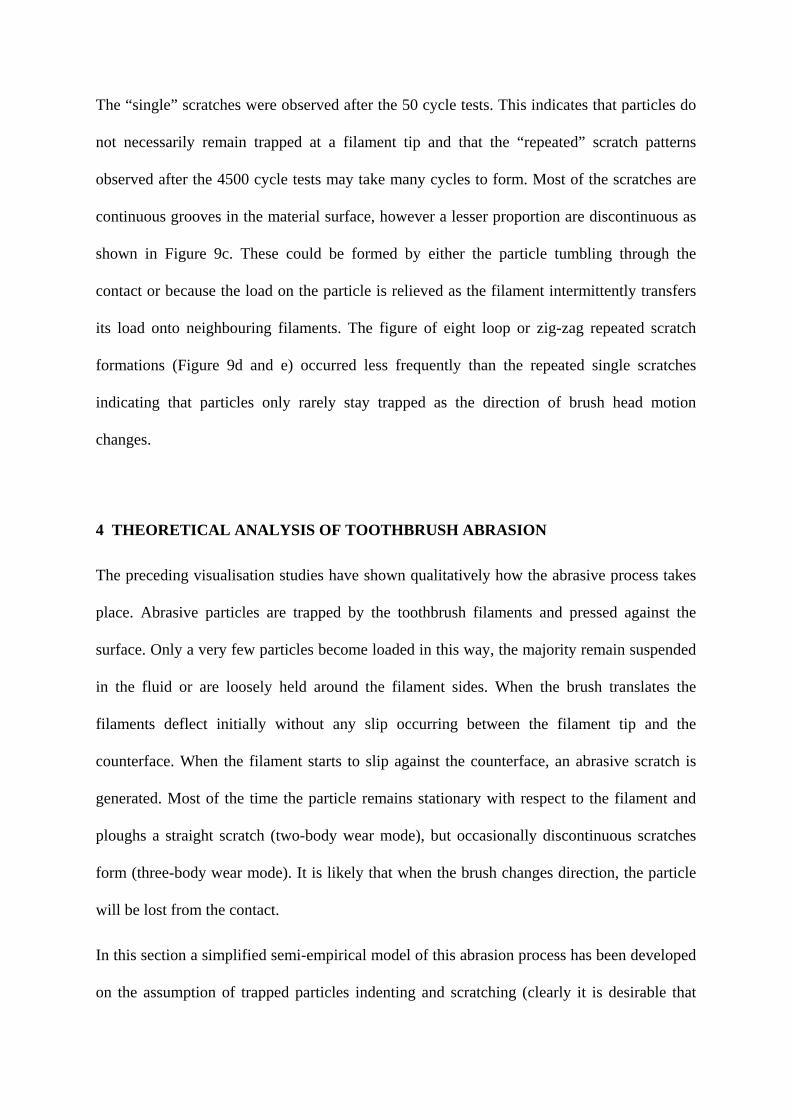
The “single” scratches were observed after the 50 cycle tests. This indicates that particles do
not necessarily remain trapped at a filament tip and that the “repeated” scratch patterns
observed after the 4500 cycle tests may take many cycles to form. Most of the scratches are
continuous grooves in the material surface, however a lesser proportion are discontinuous as
shown in Figure 9c. These could be formed by either the particle tumbling through the
contact or because the load on the particle is relieved as the filament intermittently transfers
its load onto neighbouring filaments. The figure of eight loop or zig-zag repeated scratch
formations (Figure 9d and e) occurred less frequently than the repeated single scratches
indicating that particles only rarely stay trapped as the direction of brush head motion
changes.
4 THEORETICAL ANALYSIS OF TOOTHBRUSH ABRASION
The preceding visualisation studies have shown qualitatively how the abrasive process takes
place. Abrasive particles are trapped by the toothbrush filaments and pressed against the
surface. Only a very few particles become loaded in this way, the majority remain suspended
in the fluid or are loosely held around the filament sides. When the brush translates the
filaments deflect initially without any slip occurring between the filament tip and the
counterface. When the filament starts to slip against the counterface, an abrasive scratch is
generated. Most of the time the particle remains stationary with respect to the filament and
ploughs a straight scratch (two-body wear mode), but occasionally discontinuous scratches
form (three-body wear mode). It is likely that when the brush changes direction, the particle
will be lost from the contact.
In this section a simplified semi-empirical model of this abrasion process has been developed
on the assumption of trapped particles indenting and scratching (clearly it is desirable that
particles are able to remove stain while not damaging the enamel surface during teeth
cleaning). This was achieved by using a theoretical determination of particle indentation to
calculate scratch depths and area and the proportion of material removed. Scratch test data
was then used to determine the length of the scratch and the number of scratches likely to
occur. Finally, the model was validated using experimental test data from the literature.
4.1 Particle Indentation
The model was developed assuming that a particle trapped at a filament tip acts like a micro-
indenter (see Figure 10). Particles were assumed to be sharp cubes indenting on one corner.
Hardness, H (N/m2), is defined as the load, W (N) divided by the surface (pyramidal) area, A
(m2) of the indentation. This can therefore be used to derive the depth and width of the
indentation caused by a particle from the load exerted by the deflected filament. In scratching
only the front part of the indenter (particle) is supporting the load so only this area should be
considered (see Figure 11). The load on the particle is determined by dividing the brush load
by the number of filaments in contact with the counterface.
4.2 Scratching and Wear
The volume of material displaced by the loaded particle can be calculated by multiplying the
cross-sectional area of the indent formed, As (derived using the indentation depth and the
particle geometry), by the length of the brush stroke, l.
However, this volume of displaced material does not necessarily equal the volume of material
removed as wear debris. Firstly, because there will be elastic deflection of the surface during
scratching and elastic recovery inside the scratch groove (see Figures 12a and 12b).
Secondly, the displaced material may plastically flow to form raised shoulders either side of
the scratch [13, 14] (see Figure 12c).
In order to determine the actual amount of material lost for a given particle profile depth, δ,
two factors are therefore required; one to determine the remaining proportion of the indenter
cross-sectional area, As, after elastic deflection and recovery has occurred (g); a second to
determine the proportion of displaced material lost as wear debris (f). The volume removed
from one scratch, Vs, is then given by:
lfgAV ss = (1)
Values for factors g and f were determined from experimental data generated during scratch
experiments on a range of materials to study surface elastic deflection, groove elastic
recovery and plastic deformation [15]. The data was used to plot g (reduction in scratch
cross-sectional area factor) and f (material loss factor) against E/H (see Figure 13).
4.3 Statistics of Particle Entrainment
The visualisation work has shown that not all the filaments were in contact with the
counterface and of those that were only a certain proportion had particles trapped at their tips
causing damage. To model this stochastic behaviour two further empirical factors are
introduced; the proportion of filaments in contact with the counterface material (b), and the
proportion of these with a trapped particle (t).
It was also clear from abrasion tests that the length of a brushstroke does not equal the length
of a scratch formed by a trapped particle. This is because at the start of the stroke the filament
tip does not slide against the counterface whilst its body deflects. A further factor was
required to determine the actual scratch length from the brush stroke length (a brush lag
factor) (s).
If there are N filaments on a brush, then the total scratch volume per brushstroke, Vb, is then
given by:
V NbtA gflsb s = (2)
4.4 Comparison Between Model and Experiment
Equation 2 can then be used to estimate the material removal with toothbrush and abrasive
slurry. The model has been to compare with experimental data on simulated controlled tooth-
brushing from the literature [16]. This reference reports tests performed to simulate manual
and automatic toothbrushing. Manual toothbrushing simulations were carried out using a load
of 2.5N, a frequency of 3Hz and a peak to peak brush head displacement of 22mm.
Automatic toothbrushing simulations were carried out using mechanical brushes loaded to
1.6N, operated at 30Hz, with a stroke length of approximately 0.4mm. Tests were run on
dentin specimens (for 12 hours) and a range of dental materials (for 8 hours). Details of
material properties are given in Table 2.
The material specimens used in the experiments were 5mm across so a filament/scratch lag
factor, s, of 1 was used for manual simulations as it thought that the lag effect would be
negligible compared with the large movement of the brush head. The same value was also
used for automatic simulations.
Values of f and g were estimated for the materials used in the simulated toothbrushing tests
using the data presented in Figure 13. The brush area was larger than the specimens so that
approximately 25% of the filaments were in contact, giving factor b a value of 0.25.
Results of the abrasion experiments carried out were used to determine a value for factor t.
The scratches were counted and divided by the number of filament passes over the test area
and the number of brush strokes. Approximately 10% of the filaments had particles trapped
causing scratches at any one moment, giving t a value of 0.1.
Details of values of factors f and g are given in Table 2. All brushing parameters used in the
predictions carried out are given in Table 2. Results for the predictions of Equation 2, using
the inputs in Tables 2 and 3, are compared with the experimental data in Figure 14.
As can be seen the model produces reasonable predictions of wear to be expected over a
range of materials, but especially for dentin. This is encouraging considering that several
empirical factors are used in the model.
It is interesting to note that the scratching distance for the automatic and manual brushing
simulations are approximately the same (691.2m for automatic compared with 864m for
manual over 8 hours – calculated by multiplying the number of brush strokes by the brush
stroke length and by s, the drag factor).
This indicates that the difference in wear is due to the lower load used. Electric brushes are
generally designed so that the oscillating action of the filaments is inhibited as the load on the
brush head is increased.
5 DISCUSSION
The scratch and friction tests, alongside the previously visualisation work [10], have
demonstrated some of the mechanisms of abrasive cleaning with a filament brush. Particles,
suspended in the fluid approach the filament clumps and as they pass around the tips they
may become trapped. Where and how the particles are trapped depends on the brush load,
and hence the degree of filament deflection, and the particle size. Lightly loaded brushes trap
small particles under the filament tips, whilst heavily loaded brushes trap particles at the
shoulder of the deflected filament or in between filament clumps. The particle is then pressed
against the counterface by the deflected filament. These loaded particles then act in a
predominantly two-body abrasive mode to scratch the surface. However, not all scratches are
continuous, some are intermittent consisting of a line of short scratches a few microns in
length. This is probably because the particle either tumbles in a three-body mode, or the load
on the filament is relieved during the motion, by resting on other neighbouring filaments.
At any instant very few particles actually cause scratches and it is estimated that many
filament passes take place before a scratch is created by all the filaments in contact. This is
either because it takes a while for the particle to become trapped by a filament or because
once trapped only a few particles are loaded in an orientation that actually cause abrasion.
Increasing the concentration of particles does not appear to uniquely increase the chances of
such an abrasive action taking place.
The above mechanisms are clearly complex, both the particle behaviour and the applicator
behaviour are difficult to describe mathematically. Here a simplified semi-empirical approach
has been adopted. The model is developed from the scratch test data and indentation
calculations. Given the assumptions made regarding particle shape and scratch formation and
the nature of the data regarding the number of filaments trapping particles and causing
damage, this can only be considered a crude approach. The results of the comparisons
between the model and test data, however, appear quite promising.
The input parameters for the model, however, were derived from scratch tests at one
particular load. The visualisation studies showed that at different applied loads particle
trapping changed, it is probable therefore that these parameters will vary as load changes.
The range of application of the model is therefore currently limited.
It would be interesting to extend the modelling to study the effects of using different brushing
techniques. In vitro testing of toothbrushes and toothpastes have focused on two different
tooth brushing techniques; a horizontal cross-brushing technique (see Figure 15a) and a
vertical uni-directional brushing technique (see Figure 15b).
These two techniques correlate to those used in the visualisation studies (cross-brushing -
reciprocating and vertical - uni-directional sliding). The visualisation studies carried out
using reciprocating and uni-directional sliding can offer an insight to the cleaning power to
be expected from using the two different techniques.
In vivo force measurements using toothbrushes [7, 19] have shown that a much higher force
is exerted when using the vertical brushing technique (7.7N compared with 3.1-4.4N for the
cross-brushing technique). It is likely that for the vertical technique the filament will deflect
beyond the point where particles are trapped at the filament tip this combined with the
observation that more particles are retained in the contact during reciprocating motion may
indicate that cleaning power is higher with the horizontal cross-brushing technique. Greater
knowledge of how the change in particle entrainment with larger filament deflections affects
material removal is required before this can be confirmed.
As filament load is increased it is likely that the load transmitted to the particles trapped at
filament tips will increase and higher cleaning power should be expected. There must be,
however, given the observations at high filament deflections, a transition load where
filaments bend over such that particles no longer trapped at a tip contact and are entrained
under the bend of a filament and the load transmitted to particles decreases and subsequently
material removal reduces.
An important aspect of tooth cleaning is the removal of a surface stain layer, without damage
to the substrate. The enamel tooth surface is very hard, typically around 3-6 GPa [17], whilst
dentine is much softer (typically around 0.5 GPa [18]). The experiments performed here are
carried out scratching PMMA, which has similar properties to dentine. Clearly the level of
damage observed here is closer to that which might be expected on dentine.
6 CONCLUSIONS
The presence of a water/glycerol mix causes a reduction in tractive force over a dry brush.
This is presumably because the filament is lubricated as it slides against the wetted PMMA
surface. When a very low concentration of particles is added (just 0.2%) this friction
coefficient increases by 10-20%. The particles become trapped at the filament tips, disrupt
lubrication between the filament and counterface and abrade the surface. Increasing the
particle concentration does not change the friction greatly. This suggests that relatively few
particles are carrying load at any instant.
The scratch tests indicated that few of the filaments in a brush cause any abrasive action. This
is because only a proportion are loaded against the counterface initially and relatively few
particles are trapped by these filaments. Further, of those that are trapped only a few are
carrying load and orientated to create a scratch.
It was estimated that approximately 25% of filaments produce no scratches at any time. The
scratching process is intermittent (approximately 10% of the filaments in contact produce
scratches at one moment). In general particles do not stay trapped and each scratch is caused
by a different particle.
The majority of scratches were continuous and indicated a two-body abrasion process caused
by a single particle in one uni-directional pass of the filament. However, occasionally a
particle remained adhered to a filament and scratched on repeated reversals. In addition some
scratches were observed to be intermittent indicated that the particle was not continuously
loaded as it slides across the counterface.
A simplified model of the removal model was developed. This is based on the indentation
and scratching of a single particle when loaded by a brush filament pressed against the
counterface. Estimates of the probability of a particle being filament trapped and loaded by a
filament were obtained empirically. The model shows a reasonable agreement with published
experimental data on abrasion of several dental restorative materials.
REFERENCES
1 Manly, R.S. Factors Influencing Tests on Abrasion of Dentin by Brushing with
Dentifrice. Journal of Dental Research, 1944, 23, 59-72.
2 Heath, J.R., Wilson, H.J. Abrasion of Restorative Materials by Toothpaste. Journal
of Oral Rehabilitation, 1976, 3, 121-138.
3 Harrington, E., Jones, P.A., Fisher, S.E., Wilson, H.J. Toothbrush - Dentifrice
Abrasion - A Suggested Standard Method. British Dental Journal, 1982, 153, 135-
138.
4 Condon, J.R., Ferracane, J.F. A New Multi-Mode Oral Wear Simulator. Dental
Materials, 1996, 12, 218-226.
5 “Dentistry – Toothpastes – Requirements, Test Methods and Marking”, ISO 11609,
1995.
6 “Dental Materials – Guidance on Testing of Wear – Part 1: wear by Tooth brushing”,
ISO/TS 14569-1, 1999.
7 Phaneuf, E.A., Harrington, J.H., Dale, P.P., Shklar, G. Automatic Toothbrush: A
New Reciprocating Action. Journal of the American Dental Association, 1962, 65,
12-25.
8 Allen, C.R., Hunsley, N.K., MacGregor, I.D.M. Development of a Force-Sensing
toothbrush using PIC Micro-Controller Technology for Dental Hygiene.
Mechatronics, 1996, 6(2), 125-140.
9 Padbury, A.D., Ash, M.M. Abrasion Caused by Three Methods of Toothbrushing.
Journal of Periodontology, 1974, 45(6), 434-438.
10 Bergstrom, J., Lavestedt S. An Epidemiologic Approach to Toothbrushing and
Dental Abrasion. Community Dent Oral Epidemiol, 7, 57-64.
11 Hunter, M.L., West N.X. Mechanical Tooth Wear: The Role of Individual
Toothbrushing Variables and Toothpaste Abrasivity. in Tooth Wear and Sensitivity,
Eds. Addy, M., Embury, G., Edgar, W.M., Orchardson, R., Martin Dunitz, London,
2000, 161-169.
12 Lewis, R., Dwyer-Joyce, R.S., Pickles, M.J. Interaction Between Toothbrushes and
Toothpaste Abrasive Particles in Simulated Tooth Cleaning. Wear, 2004, 257(3-4),
368-376.
13 Dwyer-Joyce, R.S., Sayles, R.S., Ioannides, E. An Investigation into the
Mechanisms of Closed Three Body Abrasive Wear. Wear, 1994, 175, 133-142.
14 Buttery, T.C., Archard, J.F. Grinding and Abrasive Wear. Proc. Instn. Mech.
Engrs., 1971, 185(43), 81-90.
15 Jardret, V., Zahouani, H., Loubet, J.L., Mathia, T.G. Understanding and
Quantification of Elastic and Plastic Deformation During a Scratch Test. Wear, 1998,
218, 8-14.
16 McConnell, D., Conroy, C.W. Comparisons of Abrasion Produced by a Simulated
Manual Versus a Mechanical Toothbrush. Journal of Dental Research, 1967, 46(5),
1022-7.
17 Cuy, J.L., Mann, A.B., Livi, K.J., Teaford, M.F., Weihs, T.P. Nanoindentation
Mapping of the Mechanical Properties of Human Molar Tooth Enamel. Archives of
Oral Biology, 2002, 47, 281-291.
18 Meredith, N., Sherriff, M., Setchell, D.J., Swanson, S.A.V. Measurement of the
Microhardness and Young's Modulus of Human Enamel and Dentine using an
Indentation Technique. Archives of Oral Biology, 1996, 41(6), 539-545.
19 Bjorn, H., Lindhe, J. On the Mechanisms of Toothbrushing. Odont. Revy., 1966, 17,
17-27.

Figure Captions Figure 1 Photomicrograph of a Clump of Filaments Sliding against a Glass Surface
with 7 μm Silica Particles
Figure 2 Particle Entrainment at a Toothbrush Filament Tip at (a) Low Load and (b) High Load
Figure 3 Friction Testing Apparatus
Figure 4 Standard Toothbrush used During Friction Testing
Figure 5 Friction Coefficient Variation with Particle Concentration and Brush Load
Figure 6 High Frequency Reciprocating Scratch Test Set-up
Figure 7 Scratches Formed by One Clump of Filaments (4500 cycle test)
Figure 8 Single Filament in Contact with a Counterface Showing Filament Lag
Figure 9 Different Types of Scratch Observed
Figure 10 Particle Trapped at a Filament Tip
Figure 11 Particle and Scratch Geometry
Figure 12 (a) Illustration of Elastic Deflection of the Material Surface, de, with Total Penetration Depth, δ; (b) Remaining Scratch Profile Superimposed with Two Particle Positions to Illustrate Elastic Deflection of the Surface, de, Elastic Recovery in the Scratch Groove, dr and Recovered Scratch Depth, d (c) Formation of Shoulders During Scratching
Figure 13 f and g against E/H (plotted using data from published scratch tests [15])
Figure 14 Model Wear Predictions for Dentin and Dental Materials Compared with Experimental Data [16] (M - manual brushing simulation, A - automatic brushing simulation, error bars represent maximum and minimum experimental data)
Figure 15 Brushing Techniques (a) Horizontal Cross-Brushing; (b) Vertical Uni-directional Brushing Technique
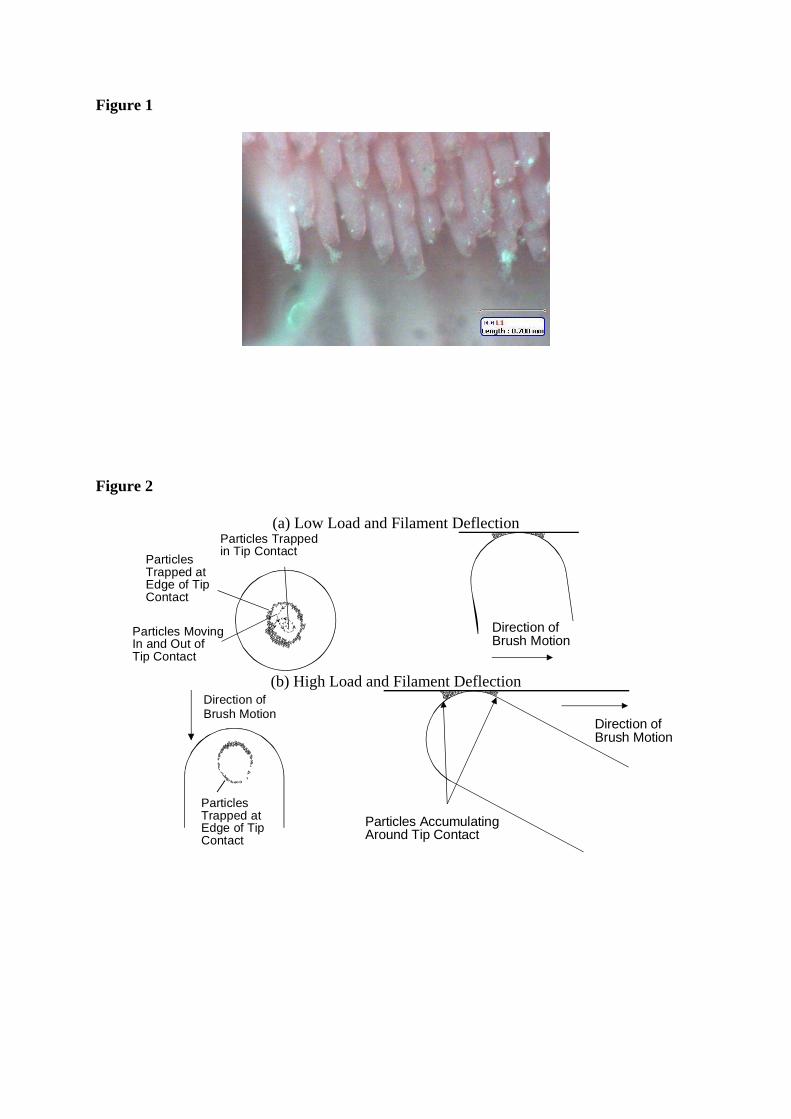
Figure 1
Figure 2
(a) Low Load and Filament Deflection
ParticlesTrapped atEdge of TipContact
Particles Trappedin Tip Contact
Particles MovingIn and Out ofTip Contact
Direction ofBrush Motion
(b) High Load and Filament Deflection Direction ofBrush Motion
ParticlesTrapped atEdge of TipContact
Direction ofBrush Motion
Particles AccumulatingAround Tip Contact
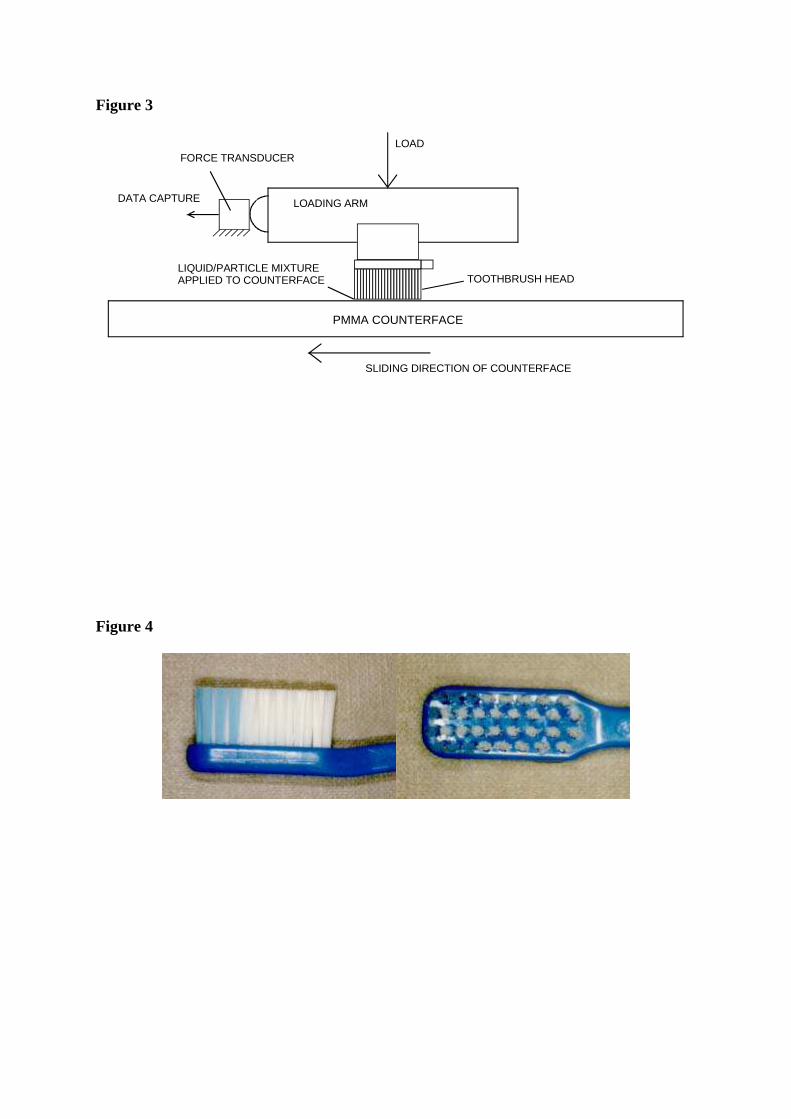
Figure 3
LOADING ARM
LOAD
PERSPEX COUNTERFACE
TOOTHBRUSH HEAD
SLIDING DIRECTION OF COUNTERFACE
FORCE TRANSDUCER
DATA CAPTURE
LIQUID/PARTICLE MIXTUREAPPLIED TO COUNTERFACE
PMMA COUNTERFACE
Figure 4
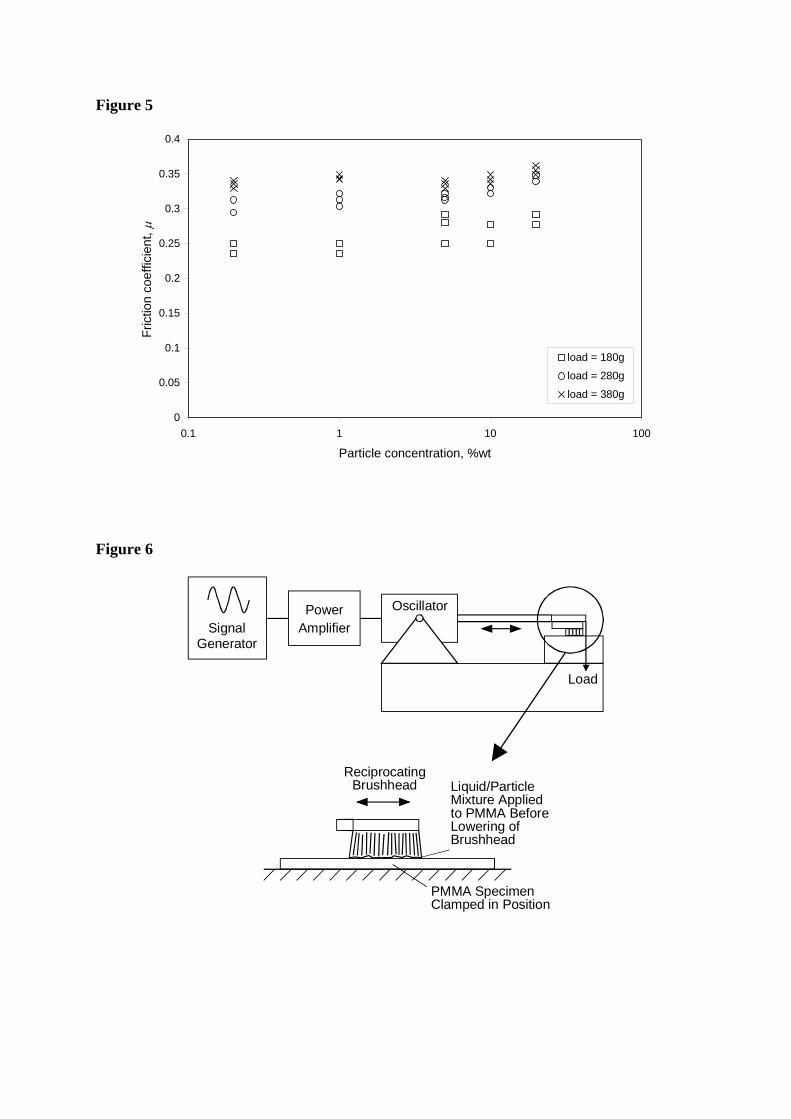
Figure 5
0
0.05
0.1
0.15
0.2
0.25
0.3
0.35
0.4
0.1 1 10 100
Particle concentration, %wt
Fric
tion
coef
ficie
nt, μ
load = 180g
load = 280g
load = 380g
Figure 6
SignalGenerator
PowerAmplifier
Oscillator
Load
PMMA SpecimenClamped in Position
Liquid/ParticleMixture Appliedto PMMA BeforeLowering ofBrushhead
ReciprocatingBrushhead
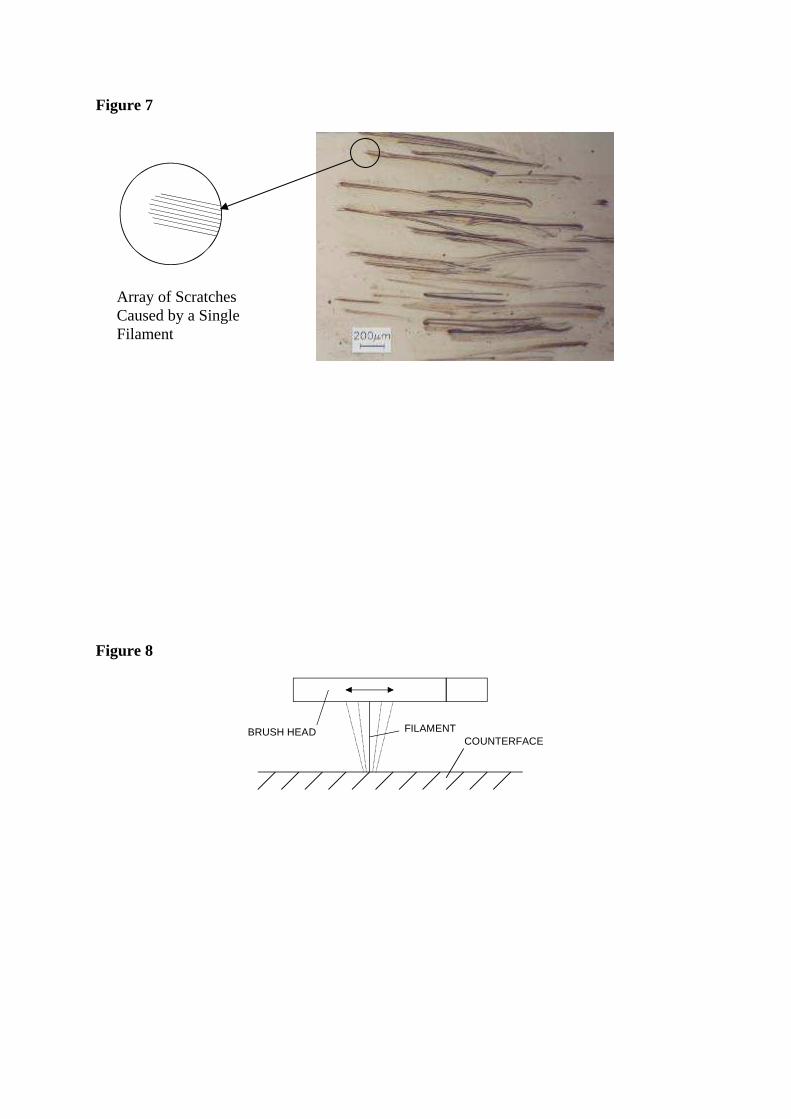
Figure 7
Array of Scratches Caused by a Single Filament
Figure 8
FILAMENTBRUSH HEADCOUNTERFACE
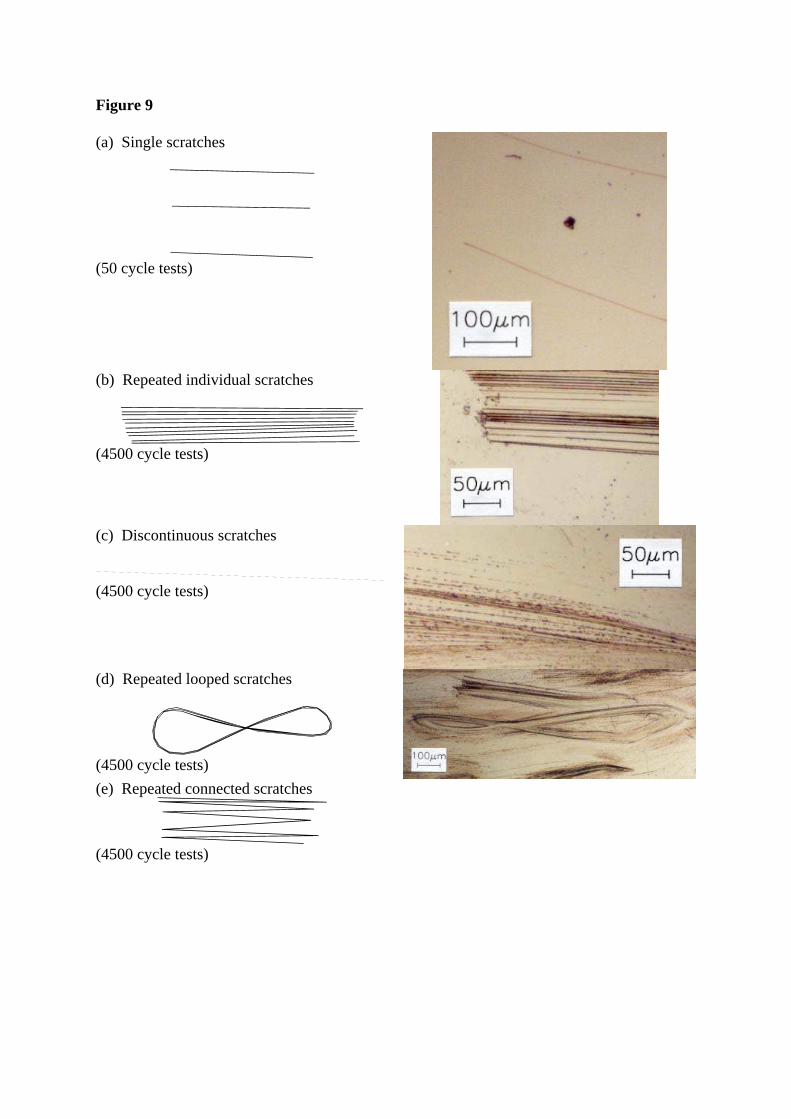
Figure 9 (a) Single scratches
(50 cycle tests)
(b) Repeated individual scratches
(4500 cycle tests)
(c) Discontinuous scratches
(4500 cycle tests)
(d) Repeated looped scratches
(4500 cycle tests)
(e) Repeated connected scratches
(4500 cycle tests)
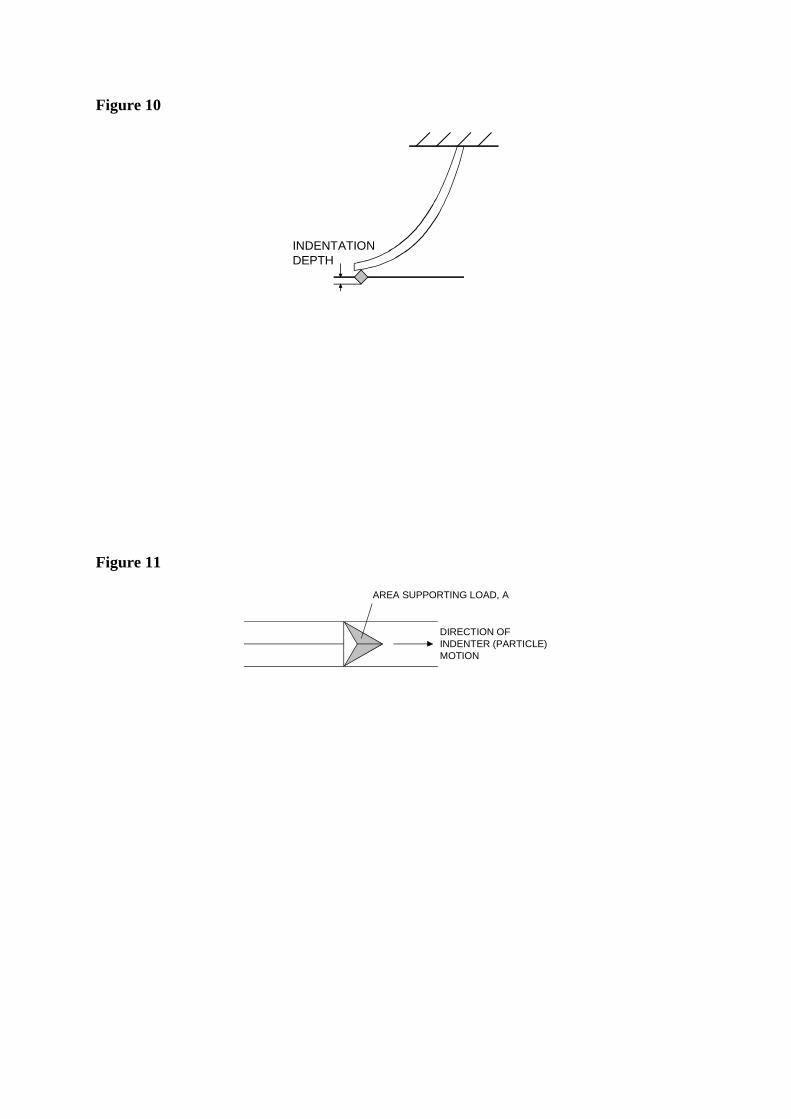
Figure 10
INDENTATIONDEPTH
Figure 11
AREA SUPPORTING LOAD, A
DIRECTION OFINDENTER (PARTICLE)MOTION
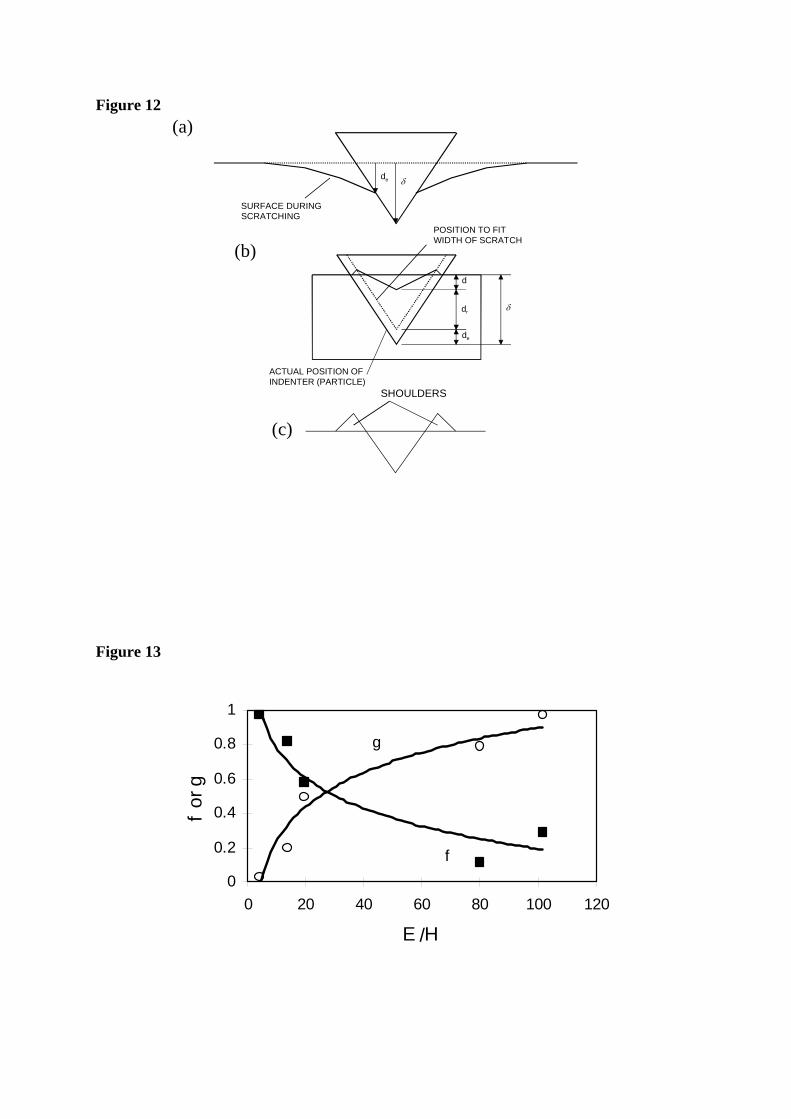
Figure 12 (a)
SURFACE DURINGSCRATCHING
δde
δ
de
dr
d
ACTUAL POSITION OFINDENTER (PARTICLE)
POSITION TO FITWIDTH OF SCRATCH
(b)
SHOULDERS
(c)
Figure 13
0
0.2
0.4
0.6
0.8
1
0 20 40 60 80 100 120
E /H
f or
g
g
f
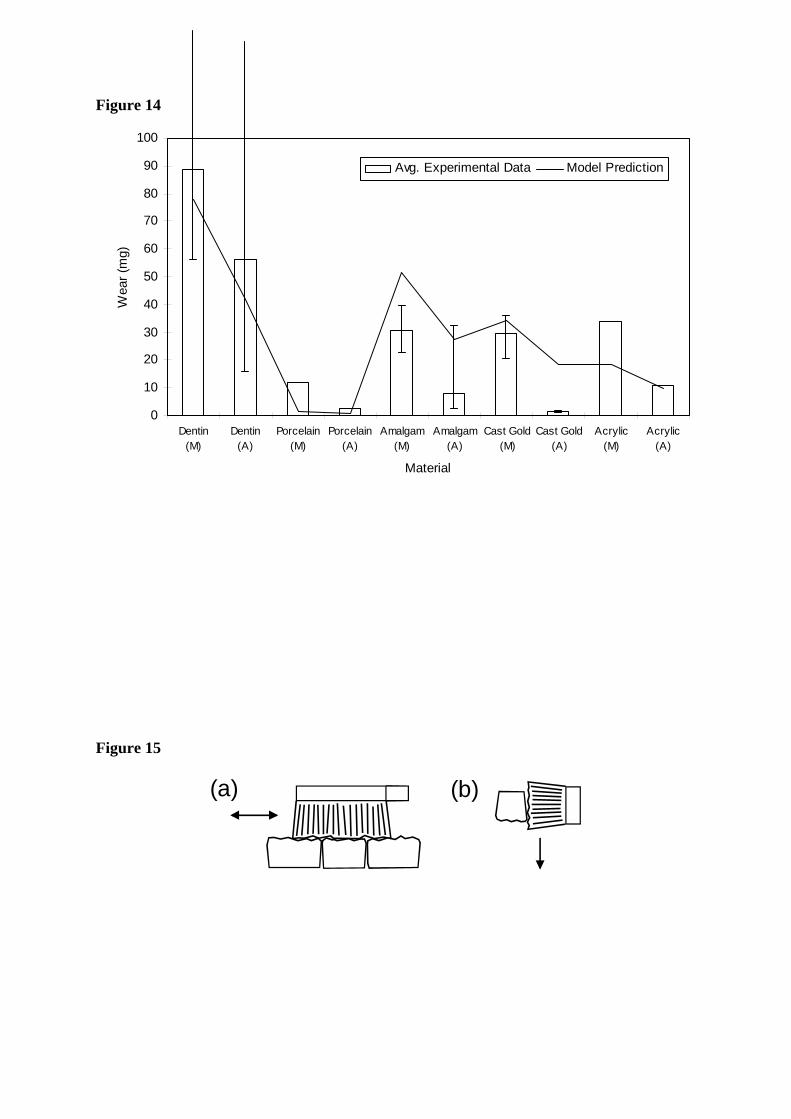
Figure 14
0
10
20
30
40
50
60
70
80
90
100
Dentin(M)
Dentin(A)
Porcelain(M)
Porcelain(A)
Amalgam(M)
Amalgam(A)
Cast Gold(M)
Cast Gold(A)
Acrylic(M)
Acrylic(A)
Material
Wea
r (m
g)
Avg. Experimental Data Model Prediction
Figure 15
(a) (b)

Table Captions Table 1 Friction Coefficient Variation with Particle Concentration and Brush Load
Table 2 Material Properties
Table 3 Brushing Parameter Inputs for Model Predictions
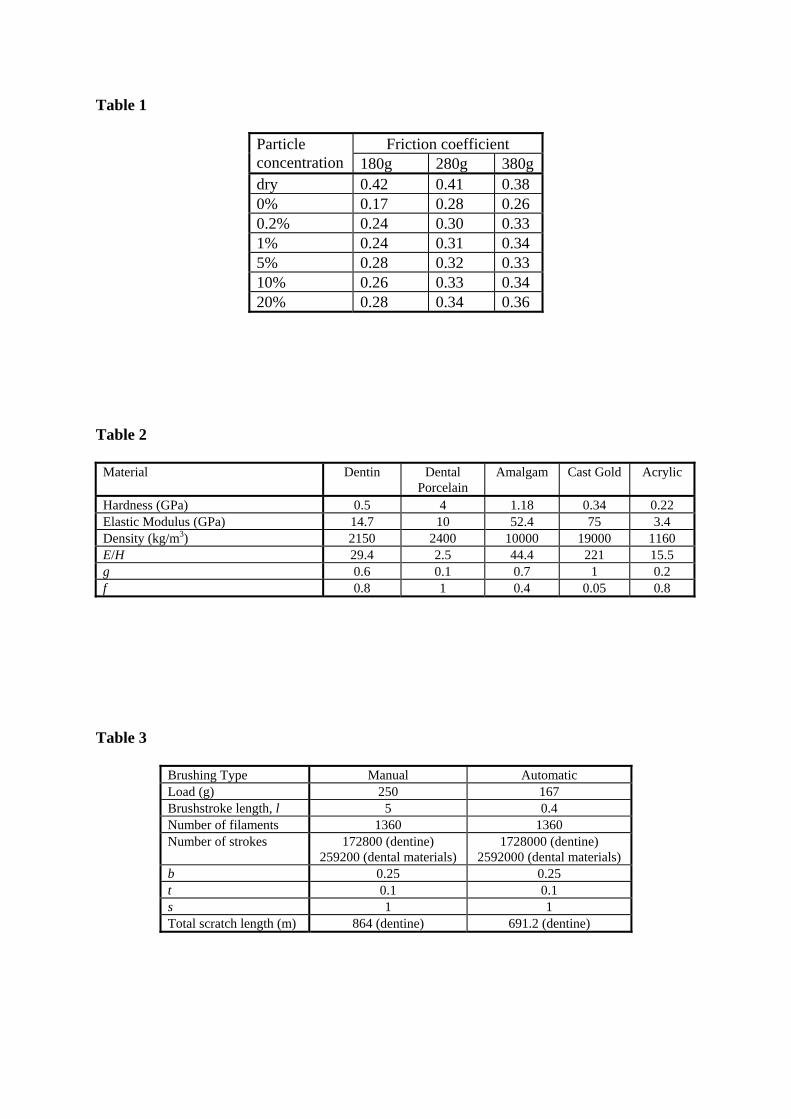
Table 1
Friction coefficient Particle concentration 180g 280g 380gdry 0.42 0.41 0.38 0% 0.17 0.28 0.26 0.2% 0.24 0.30 0.33 1% 0.24 0.31 0.34 5% 0.28 0.32 0.33 10% 0.26 0.33 0.34 20% 0.28 0.34 0.36
Table 2 Material Dentin Dental
Porcelain Amalgam Cast Gold Acrylic
Hardness (GPa) 0.5 4 1.18 0.34 0.22 Elastic Modulus (GPa) 14.7 10 52.4 75 3.4 Density (kg/m3) 2150 2400 10000 19000 1160 E/H 29.4 2.5 44.4 221 15.5 g 0.6 0.1 0.7 1 0.2 f 0.8 1 0.4 0.05 0.8
Table 3
Brushing Type Manual Automatic Load (g) 250 167 Brushstroke length, l 5 0.4 Number of filaments 1360 1360 Number of strokes 172800 (dentine)
259200 (dental materials) 1728000 (dentine)
2592000 (dental materials) b 0.25 0.25 t 0.1 0.1 s 1 1 Total scratch length (m) 864 (dentine) 691.2 (dentine)