Intensive Groundwater Use: Silent Revolution Some comments and additional views Peter Letitre IGRAC...
12
Intensive Groundwater Use: Silent Revolution Some comments and additional views Peter Letitre IGRAC Side event WWF5 “THE ROLE OF GROUNDWATER SILENT REVOLUTION IN ACHIEVING THE MOTTO MORE CASH AND NATURE PER DROP” 20 th of March 2009
-
Upload
laurence-clark -
Category
Documents
-
view
217 -
download
1
Transcript of Intensive Groundwater Use: Silent Revolution Some comments and additional views Peter Letitre IGRAC...

Intensive Groundwater Use: Silent Revolution
Some comments and additional views
Peter LetitreIGRAC
Side event WWF5
“THE ROLE OF GROUNDWATER SILENT REVOLUTION IN ACHIEVING THE MOTTO MORE CASH AND NATURE PER DROP”
20th of March 2009

Contents
1. Interpretations of “intensive use” 2. Where does intensive groundwater use occur?3. Benefits & negative impacts of intensive use

Intensive groundwater
use
What is intensive groundwater use?
Any groundwater use associated with intensive abstraction/
development of groundwater?
How to interpret “intensive”?- In absolute terms [volume/time]- In relative terms (in relation to something/somebody/society)
Where does it occur? Intensive groundwater use in a
geographic context
IGRAC has been
established for
documenting the world’s groundwater
systems

Intensive groundwater development in an absolute sense
Top-10 countries:Bahrain 286 mm/aTaiwan 197 mm/aBarbados 185 mm/aMauritius 111 mm/aMalta 79 mm/aPakistan 75 mm/aBangladesh 74 mm/a India 58 mm/aIsrael 58 mm/a Italy 46 mm/a
GGIS, 2005Groundwater abstraction intensity, in mm/a averaged over entire countries. High intensities in large part of Southern Asia (India+Pakistan+Bangladesh+N.China: half of global GW abstraction)
Data of variable quality and low
spatial resolution
Global mean: 6 mm/a

Countries with largest groundwater abstraction
Top-10 countries:
India 190 km3/aUSA 115 km3/aChina 97 km3/aPakistan 55 km3/aIran 53 km3/aMexico 38 km3/aSaudi Arabia 21 km3/aIndonesia 12.5 km3/aRussia 11.6 km3/aJapan 10.9 km3/a
Subtotal: 604 km3/a
Margat, 2008Groundwater abstractionin km3/a summed over entire countries.
Synchronization of data is poor (data from 1990 to 2004)
Data of variable quality and poor synchronization
Global total: At least 800 km3/a
Top-3 countries:
India 190 km3/aUSA 115 km3/aChina 97 km3/a
Subtotal: 402 km3/a
50 % of global total
75 % of
global total

Intensive groundwater development in a relative sense (1)
Top-10 countries:Saudi Arabia 1520%UAE 330%Libyan A.R. 529%Egypt 408%Qatar 373%Mauritania 293%Israel 240%Algeria 171%Bahrain 169%Moldova 150%
GGIS, 2005Groundwater development indicator: abstraction as a percentage of present-day mean recharge. Significantly modified groundwater balances in N-Africa, Middle-East & other arid regions.
Data of variable quality and low
spatial resolution
Storage depletion

Intensive groundwater development in a relative sense (2)
Top-10 countries:Iran 835 m3/a
Iceland 712 m3/a
Libyan A.R. 673 m3/a
Bulgaria 663 m3/a
UAE 644 m3/a
Georgia 608 m3/a
Saudi Arabia 594 m3/a
Swaziland 568 m3/a
Russian Fed. 533 m3/a
Pakistan 398 m3/a
GGIS, 2005Groundwater abstraction per capita(related to dependency on groundwater)
Data of variable quality and low
spatial resolution

Intensive groundwater development in a relative sense (3)
Zones with large stored volumes of groundwater (blue zones on WHYMAP) are for shorter or longer time resilient to intensive groundwater abstraction, zones without significant storage (brown zones) are extremely vulnerable to drought and depletion.
WHYMAP
Large differences between aquifers in
resilience to intensive abstraction, drought and climate change

Silent Revolution: benefits
• Spectacular improvement of food production, farmers’ income and local economy in many regions of the world (India, Pakistan, Yemen, etc…)
• Opportunities for making land and labour more productive and reducing water shortage risk in agricultural production
• Increased numbers of more or less drought-prone domestic water supplies (particularly in rural areas of developing countries)
• Reduced risk of famines and other food shortages
• Improved access to water for many people (GW is “democratic resource” - Shah).
INDIA 1970/1973 1990/1993
Agricultural output (billion US$/a ) 28.3 49.9
Contribution SW 15.5% 13.9%
Contribution GW 4.4% 14.5%
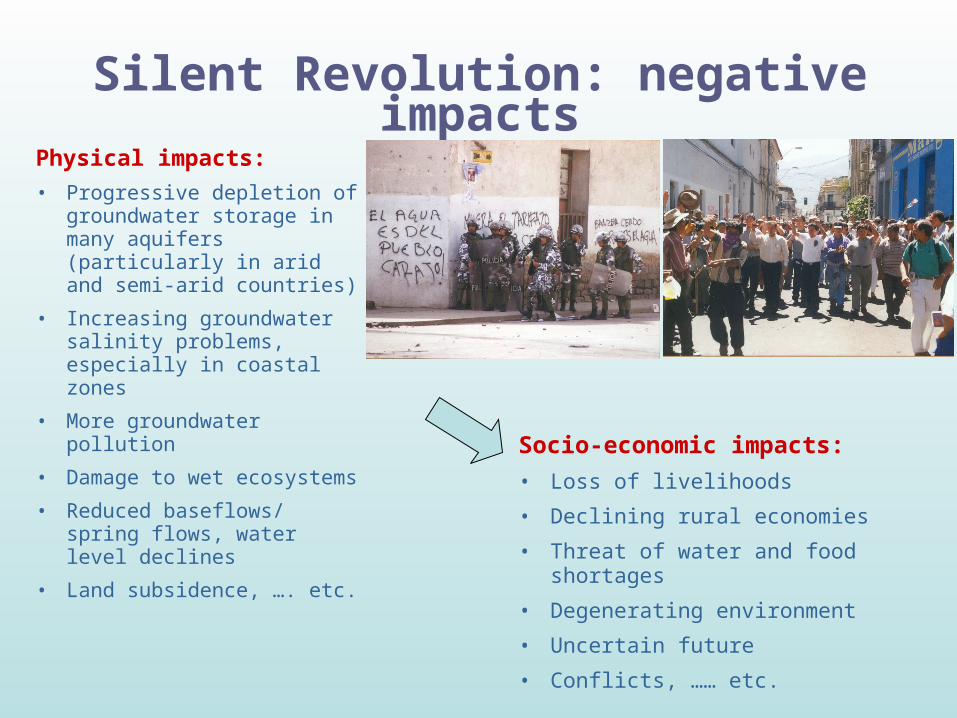
Silent Revolution: negative impactsPhysical impacts:
• Progressive depletion of groundwater storage in many aquifers (particularly in arid and semi-arid countries)
• Increasing groundwater salinity problems, especially in coastal zones
• More groundwater pollution
• Damage to wet ecosystems
• Reduced baseflows/ spring flows, water level declines
• Land subsidence, …. etc.
Socio-economic impacts:
• Loss of livelihoods
• Declining rural economies
• Threat of water and food shortages
• Degenerating environment
• Uncertain future
• Conflicts, …… etc.

Conclusions
• Intensive exploitation and use of groundwater can be viewed from different angles of view. All of them contribute to better understanding of the phenomenon and its impacts.
• It is remarkable that a very limited number of countries only is pumping the lion’s share of groundwater abstraction in the world.
• Worth noting as well is that intensive groundwater abstraction often occurs in regions of limited rate of groundwater renewal.
• The “Silent Revolution” has produced very significant benefits, especially in semi-arid and arid zones of developing countries.
• However, it is producing negative impacts as well, aggravated by climate change, to the extent that experts predict the evolution of groundwater use to end in a final phase of “social conflict” (Llamas, 2008) or “decline of socio-ecology” (Shah, 2007). This underlines the need for adequate groundwater resources management. Can these fatalistic predictions be challenged?

Thank you for your attention
United Nations Educational, Scientific and Cultural Organization
Government of The Netherlands
World Meteorological Organization
www.igrac.net
Deltares