INTENSIFICATION OF THE EDUCATIONAL PROCESS OF HIGHER ...
21
// Rev. Tempos Espaços Educ. v.13, n. 32, e-14955, jan./dez.2020 © 2020 - ISSN 2358-1425 Doi: http://dx.doi.org/10.20952/revtee.v13i32.14955 INTENSIFICATION OF THE EDUCATIONAL PROCESS OF HIGHER EDUCATIONAL INSTITUTIONS BY TOOLS OF INTERACTIVE TECHNOLOGIES INTENSIFICAÇÃO DO PROCESSO EDUCACIONAL DAS INSTITUIÇÕES DE ENSINO SUPERIOR POR MEIO DE FERRAMENTAS DE TECNOLOGIAS INTERATIVAS INTENSIFICACIÓN DEL PROCESO EDUCATIVO DE LAS INSTITUCIONES DE EDUCACIÓN SUPERIOR MEDIANTE HERRAMIENTAS DE TECNOLOGÍAS INTERACTIVAS Khmiliar Oleh 1 Krasnytska Olha 2 Vainola Renate 3 Xi Zechen 4 Kravchenko Iryna 5 Abstract: Intensification of the educational process of a higher educational institution by tools of interactive technologies (IT) is studied in terms of efficiency of distance learning platforms. A good deal more IT tools are integrated into the educational process than platforms, the main function of which is the exchange of materials, task supervision, registration of activity and attendance. Within the scope of on the survey and data analysis of the Moodle platform for the period from September to January 2019 (230 students and 8 educators of Ivan Franko National University of Lviv from the following faculties have been involved, namely: economic, financial and business management, international relations of the 2nd year of study). The scale of intensification of the educational process due to the integration of different types of IT has been estimated. The analysis of users’ activities of the distance learning platform has been carried out. An improvement of the communication level, self-monitoring, assessment, reducing time for preparation of materials, as well as increasing the efficiency of tasks’ performance has been revealed. Increasing the level of attendance and increasing the level of control and responsibility are the most common manifestations of the intensification of the educational process. The reduction in the time for obtaining and searching for materials and saving in the time for preparing materials by educators has been recorded. As a result, there was a significant reduction of time for the course’s organization. The educators have given higher assessment of the intensification of the educational process in terms of using IT tools compared to students’ assessment. However, students’ assessments of the processing of materials and tasks’ performance are higher compared 1 The National Defense University of Ukraine named after Ivan Cherniakhovskyi, Kiev, Ukraine. 2 The National Defense University of Ukraine named after Ivan Cherniakhovskyi, Kiev, Ukraine. 3 National Pedagogical Dragomanov University. Kiev, Ukraine. 4 National Pedagogical Dragomanov University. Kiev, Ukraine. 5 National Pedagogical Dragomanov University.Kiev, Ukraine.
Transcript of INTENSIFICATION OF THE EDUCATIONAL PROCESS OF HIGHER ...

//
Rev. Tempos Espaços Educ. v.13, n. 32, e-14955, jan./dez.2020 © 2020 - ISSN 2358-1425
Doi: http://dx.doi.org/10.20952/revtee.v13i32.14955
INTENSIFICATION OF THE EDUCATIONAL PROCESS OF HIGHER EDUCATIONAL INSTITUTIONS BY
TOOLS OF INTERACTIVE TECHNOLOGIES
INTENSIFICAÇÃO DO PROCESSO EDUCACIONAL DAS INSTITUIÇÕES DE ENSINO SUPERIOR POR
MEIO DE FERRAMENTAS DE TECNOLOGIAS INTERATIVAS
INTENSIFICACIÓN DEL PROCESO EDUCATIVO DE LAS INSTITUCIONES DE EDUCACIÓN SUPERIOR
MEDIANTE HERRAMIENTAS DE TECNOLOGÍAS INTERACTIVAS
Khmiliar Oleh1 Krasnytska Olha2 Vainola Renate3
Xi Zechen4 Kravchenko Iryna5
Abstract: Intensification of the educational process of a higher educational institution by tools of interactive
technologies (IT) is studied in terms of efficiency of distance learning platforms. A good deal more IT tools
are integrated into the educational process than platforms, the main function of which is the exchange of
materials, task supervision, registration of activity and attendance. Within the scope of on the survey and
data analysis of the Moodle platform for the period from September to January 2019 (230 students and 8
educators of Ivan Franko National University of Lviv from the following faculties have been involved, namely:
economic, financial and business management, international relations of the 2nd year of study). The scale of
intensification of the educational process due to the integration of different types of IT has been estimated.
The analysis of users’ activities of the distance learning platform has been carried out. An improvement of
the communication level, self-monitoring, assessment, reducing time for preparation of materials, as well as
increasing the efficiency of tasks’ performance has been revealed. Increasing the level of attendance and
increasing the level of control and responsibility are the most common manifestations of the intensification
of the educational process. The reduction in the time for obtaining and searching for materials and saving in
the time for preparing materials by educators has been recorded. As a result, there was a significant
reduction of time for the course’s organization. The educators have given higher assessment of the
intensification of the educational process in terms of using IT tools compared to students’ assessment.
However, students’ assessments of the processing of materials and tasks’ performance are higher compared
1 The National Defense University of Ukraine named after Ivan Cherniakhovskyi, Kiev, Ukraine. 2 The National Defense University of Ukraine named after Ivan Cherniakhovskyi, Kiev, Ukraine. 3 National Pedagogical Dragomanov University. Kiev, Ukraine. 4 National Pedagogical Dragomanov University. Kiev, Ukraine. 5 National Pedagogical Dragomanov University.Kiev, Ukraine.

to the assessments of educators; it characterizes a certain level of subjectivity of students in assessing their
own educational activities. The results obtained can be used to theorize the experience of using IT in the
organization of the educational process of higher educational institutions, as well as for further experimental
research in this area in order to reveal effective models of “teacher / student” interaction and search for
effective ways to intensify the educational process of higher educational institutions in the paradigm of
introducing distance education in the realities of the Covid-19 pandemic.
Keywords: Educational process, intensification of the educational process, the performance of the
educational process, interactivity, interactive technologies of HEI.
Resumen: A intensificação do processo educacional de uma instituição de ensino superior por meio de
ferramentas de tecnologias interativas (TI) é estudada em termos de eficiência de plataformas de ensino a
distância. No processo educacional estão integradas muito mais ferramentas de TI do que plataformas, cuja
função principal é a troca de materiais, supervisão de tarefas, registro de atividades e assiduidade. No âmbito
do levantamento e análise de dados da plataforma Moodle para o período de setembro a janeiro de 2019
(230 alunos e 8 educadores da Universidade Nacional Ivan Franko de Lviv das seguintes faculdades estão
envolvidos, nomeadamente: económica, financeira e empresarial gestão, relações internacionais do 2º ano
de estudo). A escala de intensificação do processo educacional devido à integração de diferentes tipos de TI
foi estimada. Foi realizada a análise das atividades dos usuários da plataforma de ensino a distância. Foi
revelada uma melhoria do nível de comunicação, automonitoramento, avaliação, redução do tempo de
preparação de materiais, bem como aumento da eficiência de desempenho das tarefas. Aumentar o nível de
frequência e aumentar o nível de controle e responsabilidade são as manifestações mais comuns da
intensificação do processo educacional. Registra-se a redução do tempo de obtenção e busca de materiais e
a economia de tempo de preparo de materiais pelos educadores. Como resultado, houve uma redução
significativa do tempo para a organização do curso. Os educadores deram uma avaliação superior da
intensificação do processo educacional em termos de uso de ferramentas de TI em comparação com a
avaliação dos alunos. No entanto, as avaliações dos alunos sobre o processamento de materiais e o
desempenho das tarefas são mais altas em comparação com as avaliações dos educadores; caracteriza um
certo nível de subjetividade dos alunos na avaliação de suas próprias atividades educacionais. Os resultados
obtidos podem ser utilizados para teorizar a experiência do uso de TI na organização do processo educacional
de instituições de ensino superior, bem como para futuras pesquisas experimentais nesta área, a fim de
revelar modelos eficazes de interação e pesquisa “professor / aluno”. por formas eficazes de intensificar o
processo educacional das instituições de ensino superior no paradigma de introdução da educação a
distância nas realidades da pandemia de Covid-19.
Palabras clave: Processo educativo, intensificação do processo educativo, desempenho do processo
educativo, interatividade, tecnologias interativas de IES.
Resumo: Se estudia la intensificación del proceso educativo de una institución de educación superior
mediante herramientas de tecnologías interactivas (TI) en términos de eficiencia de las plataformas de
educación a distancia. En el proceso educativo se integran muchas más herramientas informáticas que las
plataformas, cuya función principal es el intercambio de materiales, la supervisión de tareas, el registro de la
actividad y la asistencia. Dentro del alcance de la encuesta y el análisis de datos de la plataforma Moodle
para el período de septiembre a enero de 2019 (230 estudiantes y 8 educadores de la Universidad Nacional
Ivan Franko de Lviv de las siguientes facultades, a saber: economía, finanzas y negocios gestión, relaciones
internacionales del 2º año de estudios and undergraduates of the National Pedagogical University named
after MP Drahomanov, faculties of informatics and historical education (course "Pedagogy of higher school").
Se ha estimado la escala de intensificación del proceso educativo debido a la integración de diferentes tipos
de TI. Se ha realizado el análisis de las actividades de los usuarios de la plataforma de educación a distancia.
Se ha revelado una mejora en el nivel de comunicación, autocontrol, evaluación, reducción del tiempo de
preparación de materiales, así como aumento de la eficiencia del desempeño de las tareas. Incrementar el
nivel de asistencia y aumentar el nivel de control y responsabilidad son las manifestaciones más comunes de
la intensificación del proceso educativo. Se registra la reducción del tiempo de obtención y búsqueda de
materiales y el ahorro de tiempo de preparación de materiales por parte de los educadores. Como resultado,
hubo una reducción significativa del tiempo para la organización del curso. Los educadores han otorgado una
mayor evaluación de la intensificación del proceso educativo en términos de uso de herramientas
informáticas en comparación con la evaluación de los estudiantes. Sin embargo, las evaluaciones de los
estudiantes sobre el procesamiento de materiales y el desempeño de las tareas son más altas en
comparación con las evaluaciones de los educadores; caracteriza un cierto nivel de subjetividad de los
estudiantes a la hora de evaluar sus propias actividades educativas. Los resultados obtenidos se pueden
utilizar para teorizar la experiencia del uso de las TI en la organización del proceso educativo de las
instituciones de educación superior, así como para futuras investigaciones experimentales en esta área con
el fin de revelar modelos efectivos de interacción y búsqueda “profesor / alumno”. por formas efectivas de
intensificar el proceso educativo de las instituciones de educación superior en el paradigma de introducir la
educación a distancia en las realidades de la pandemia Covid-19.
Palavras-chave: Proceso educativo, intensificación del proceso educativo, el desempeño del proceso
educativo, interactividad, tecnologías interactivas de las IES.
1 INTRODUCTION
The intensification of the educational process of institutions of the higher educational institution
(HEI) is carried out due to the use of IT, which improve the flexibility of schedules and training formats (Zhu,
E., 2017). IT increase the level of students’ productivity (Benta, D., Bologa, G., Dzitac I., 2015), as well as
students’ self-efficacy (Moreno, V., et al, 2016). 100% availability of materials for students has been
experimentally proven (Chivu, R.-G. et al, 2018). As a result, higher educational institutions become adaptive
in terms of use of interactive pedagogy and digital technologies, providing a higher level of flexibility of the
educational process (Stewart, C., Wolodko, B., 2016). The flexibility of the educational process also involves
adaptation to the needs of students (Arrosagaray, M., et al, 2019), namely, the availability of educational
materials at any time, anywhere (Adams, S. et al, 2017). Intensification by IT tools is also carried out due to
improved communication between the educator and students (Keane, T., Keane, W. F., Blicblau, A. S., 2016).
As a result, a synergistic effect of IT is provided: pedagogical, professional, social, catalytic and technical
effects are integrated (Jain, M., Tyagi, R., 2017).
The purpose of the scientific investigation is to assess the intensification of the educational process
of higher educational institutions after the introduction of IT tools.
The basic hypotheses of the investigation are as follows:
Н1: Learning Management System (LMS) as an IT tool that provides an intensification of the
educational process through reducing time for organization (preparation of educational materials for
students, search for educational materials by students, automatic control of students’ tasks, automatic
control and assessment of attendance).
Н2: IT tools provide intensification of the educational process by reducing the time for
communication between the educator and students.
Н3: IT tools provide intensification of the educational process by increasing the motivation and self-
efficacy of students (study of course materials available in LMS, the need to download to LMS course tasks,
automatic control of downloaded tasks and control of attendance in LMS contributes to the overall increase
of motivation).

2 LITERATURE REVIEW
Intensification of the educational process is an increase in the performance level of an educator and
a student during educational activities. Factors of intensification are as follows: the high level of organization
of the educational process, the availability of materials in the learning process, taking account of the age and
individual characteristics of students, the use of interactive technologies (ІТ).
Interactivity is considered as a set of input actions and responses to provide two-way communication
by using a specific user interface. The term interactivity is considered as: 1) interaction between individuals;
2) interaction between the individual and the system; 3) interaction between systems (Georgieva-Tsaneva,
G., Bogdanova, G., Negoslav Subev, N., 2017). Interactive technologies are considered as real-time
applications used by individuals to exchange information, as well as knowledge, based on input data and
taking into account the perception of the environment. It is a set of real-time applications that contributes
to the interactivity of technologies (Kebble, P.G., 2017), which transform the educational process and
teaching systems, and training at HEI (Henderson, M., Selwyn, N. & Aston, R., 2017). IT provide integration
of pedagogical and technological skills of educators, obtaining continuous and coordinated technological
support (Zhu, E., 2017). “The combination of teaching and information technologies is at the origin of a more
embracing, flexible and accessible approach to learning” (Rolim, C. and Isaias, P., 2019).
The basic types of technologies used by HEI are as follows: e-mail, Web, Word Processing, Course
Management System, IM&MPJ, Multimedia, Presentation, spreadsheet, Graphics, electronic Publishing,
database and business intelligence tools, Web Learning Modules, Modeling or Simulation, Statistical Analysis,
Programming. Social media has also become part of the educational process (Rowan‐ Kenyon, H.T., et al,
(2016). These types of technologies can be considered as tools for obtaining information and knowledge,
processing of educational materials. The use of these technologies is effective due to the possibility of
including online learning materials in the educational process (Lytras, M., Sarirete, A., Damiani, E., 2020).
Properly chosen tools of e-interactive learning contribute to the growth of creativity and productivity of the
educational process (Al‐Zahrani, A. M., 2015). On the other hand, the proper integration of IT into the
educational process on the basis of a systematic dynamic approach provides more effective teaching and
course management practices (Serrano, D. R., et al, 2019), and “makes higher education more affordable, …
and increased focus on students’ success” (Drake, B. M.,Walz, A., 2018).
Little attention has been paid to the study of the level of intensification or performance of the
educational process at HEI by applying IT tools. Performance is considered through indicators of using of IT
tools (attendance of students on electronic platforms of distance learning, hours; users enroll (including
accounts creation) (Benta, D., Bologa, G., Dzitac I., 2015). “The group who have beneficiated the integration
of e-learning had many more improvements” (Benta, D., Bologa, G., Dzitac I., 2015).
Studies focus on identifying the effectiveness of learning management systems (LMS) (Moreno, V.,
et al, 2016). Scientific publications study the issue of users’ acceptance of new technologies, the Technology
Acceptance Model (TAM) (Moreno, V., et al, 2016). Perceptions and a positive attitude towards technology
in the educational process affect the efficiency of IT use (Moreno, V., et al, 2016). However, studies do not
reveal the effects of IT that have a positive effect on the intensification of the educational process, which can
be evaluated through such measurements, as: organization, accessibility of materials, communication,
motivation, self-efficacy, control, assessment.
As a matter of fact, LMS are distance learning platforms (for example, Moodle), which can be defined
as an interactive system of exchanging materials between the educator and the student, monitoring
students’ performance of course assignments, and assessing knowledge (Pino, S., et al, 2017; Subhash, S.,
Cudney, E. A.2018). Such system indirectly affects the intensification of learning through increasing the level
of organization of the educational process and the availability of materials (Sysoieva, S.O. and Osadcha, K.P.,
2019; Yang, G., Xiang, H., & Chun, L. (2018). In fact, downloading the course materials to the system
contributes to the student’s ability to both access and quickly find the information necessary for preparation.

The organization of the educational process is improved due to the higher level of students’ involvement
through automatic control of performance, attendance and assessment (Younie, S., & Leask, M., 2013;
Yaroshenko T., 2019).
3 DATA AND METHODS.
Conceptual Framework
This academic paper is based on the Technology Acceptance Model (Moreno, V., et al, 2016), which
makes it possible to measure indicators of the intensification of the educational process of higher educational
institutions. The model contains indicators that have been previously validated in the scientific literature and
the authors’ assessments of intensification. The three-dimensional virtual world is actively integrated into
the educational process of HEI (Ghanbarzadeh, R. and Ghapanchi, A.H., 2018), which, in general, indicates
the most common use of 13 IT tools.
Figure 1: Proposed Research model
Source: compiled by the author.
In order to assess the measurement of the intensification of the educational process of HEI, a system
of statements has been developed, which are grouped into a questionnaire. The questionnaire is composed
to assess the intensification of the process by students and teachers, taking into account the need to assess
all IT tools used in the educational process and ensuring its intensification.
Table 1. Characteristics of statements to assess the intensification of the educational process of HEI
Measurement of the intensification of the
educational process
Statement / essence
Organization Communication 1. The educator / student provided feedback within an hour.
2. The educator / student clearly formulated questions, gave
answers.
3. The educator / student felt confident and relaxed in
communication process.
Control 1. The student reviewed attendance control.
Intensification of the educational
process
Organization of the educational process
•Communication
•Control
•Assessment
•Preparation of materials
Motivation and self-efficacy
•Proccesing the materials
•Execution (performance) of tasks
Efficiency / Performance
2. The student reviewed materials, homework and independent
assignments, course materials.
Assessment 1. The student received a higher score per course compared to
the average score for the previous semester.
Preparation of
materials (for
educators)
1. Downloading of materials took from 1 to 2 hours and did not
require further preparation efforts.
2. Preparation of materials took from half an hour to 1 hour
before each session.
Motivation and self-
efficacy
Processing the
materials
1. The student downloaded all the materials.
2. The student processed the materials provided by the
educator at each session.
Execution of tasks 1. The student downloaded / sent all assignments (tasks).
Efficiency /
Performance
Of the educator 1. The time for the course and its organization has been
reduced.
Of the student 1. The materials were completely studied.
2. All tasks are completed during the course.
Source: compiled by the author.
Sampling and data collection process
The students of Ivan Franko National University of Lviv of the following faculties have been involved
in the survey, namely: economics, financial management and business, international relations, of the 2nd
year of study. The sample was formed taking into account the disciplines taught to students of these faculties,
namely: “Management”, “Marketing”, “Microeconomics”, “Macroeconomics”, “Accounting”, “Statistics”,
“International Relations”, “Political Economy”, “Law”.
In order to conduct the survey, 230 students and 8 educators of HEI of Ukraine have been involved.
The initial data for the study are interdependent. The figure of 8 courses, according to the authors’ viewpoint,
is sufficient to objectively reflect the results of data collection according to the survey criteria, taking into
account the further division of all participants into experimental and control groups. The number of 230
students is conditioned, in turn, by the total number of students attending the controlled 8 university
disciplines, taught, respectively, by 8 teachers involved in the experiment.
The number of 230 students is due, in turn, to the total number of students attending the controlled
8 university disciplines, taught, respectively, by 8 educators involved in the experiment. The duration of the
experiment is determined by the duration of teaching the selected training courses - one semester of the
academic year.
The university uses the following IT tools: e-mail, social media (Viber messenger), Presentation,
Spreadsheet, Graphics, distance learning platform Moodle, Microsoft Teams, Web (most used IT tools have
been selected). In order to assess the intensification of the educational process, two samples of educators
and students have been formed:
1) a control group that does not use IT tools or uses the most traditional ones (e-mail, Presentation,
Spreadsheet, Graphics, Web);
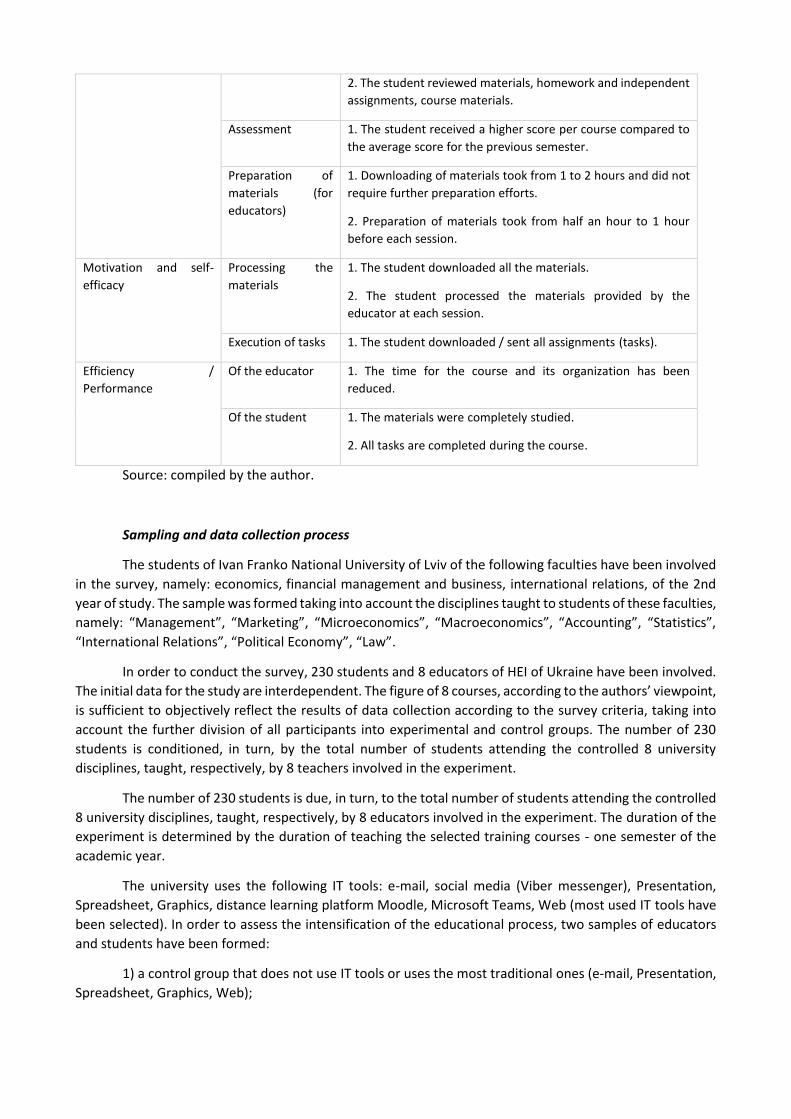
2) an experimental group that widely uses all the above IT in teaching and learning practice and has
relevant experience of interaction in this area (they understand the ways and models of interaction through
IT and, in particular, LMS): 4 educators; 115 students. The groups were formed in such a way that each
academic group was divided into 2 subgroups (experimental and control ones), which made it possible to
achieve maximum objectivity of the results. Each group attended the same subjects during the same
academic period.
The data collection process began after completion of the courses and assessments. All 8 training
courses were organized in the same format; the course folder was named after the course name. The
following electronic folders were placed in the structure of each course, namely: Announcements,
Preliminary Course Outline, Course Materials (Course Readings, Data sources, Lecture notes), Assignments,
Lecture videos, Course evaluation. For doing homework, an advanced function with the ability to download
files at a strictly defined time period has been used. For each day of delay, 1 point was deducted from the
assessment. All students were registered by the platform administrator and received access data (login,
password) via e-mail. The process of the experiment lasted from September 2019 to January 2020.
The questionnaire Questionnaire for further determination of the performance indicators of the
experiment was composed by using Google Form and sent to the control group via e-mail, the experimental
group received it via Viber messenger. The process of developing the questionnaire and data collection
continued in March - April 2020 after the completion of training courses that fell within the experiment.
4 METHODS
The questionnaire as a means of collecting data on the assessment of the level of intensification of
the educational process by students and educators is the most effective way of the investigation. The
questionnaire was the basic research tool. An additional tool was the analysis of logs of files from the Moodle
server platform after the courses’ completion. The data for analysis from the Moodle platform were collected
in February 2020. These data made it possible to determine such intensification indicators, as: users’ activities
on e-platform Moodle, homework tasks assignments, homework submitted, participation rate. The analysis
was an additional method of assessing the level of motivation and self-efficacy of students.
3.4. Statistical methods of processing results
The following statistical methods have been chosen to process the results of the questionnaire
survey:
1) Cronbach’s alpha to assess the reliability of the results.
2) Descriptive estimates: average value, minimum, maximum, standard deviation, trend.
Statistical analysis by using SPSS 22.0 has been applied to process the results of the questionnaire.
The significance level of the test results has been selected at the level of 5% and 10%.
5 RESULTS
Results of Moodle server file analysis: evaluation of performance of educational process
The most important result of the study can be considered change in attitudes towards learning
towards more conscious one and students’ perception of homework. Taking into consideration the need to
download tasks on time, the level of responsibility has increased. The activity log (Figures 2 and 3) has been
used to assess the level of students’ activity). Of all the activities, registered on Moodle, a high percentage
fell on students’ activity (72%). 25% of the activity has been taken by the educator’s actions in downloading

materials, updates, tasks, maintaining a register of attendance, course reports, viewing users. 3% of actions
have been performed by the administrator (course development, resource allocation, downloading accounts,
users’ registration).
Figure 2. Users’ activities on e-platform Moodle
Source: compiled by the author.
Figure 3. Homework tasks vs. other platform tasks
Source: compiled by the author.
Most of the tasks on the platform were related to homework 79% (Figure 2). Other tasks
(administrator and educator) accounted for 21% of all actions. There were also such records of actions on
the platform, as: viewing of materials, folders, attending classes and assessments. Therefore, the platform
as an IT tool is effective primarily for homework control.
The platform was an incentive for students to do homework and process the materials. This, in
general, increased interest in the courses. During the analysis, the number of homework tasks, sent in the
3%
25%
72%
Admin records Teacher records
Students record
79%
21%
Assignment tasks
other platform tasks
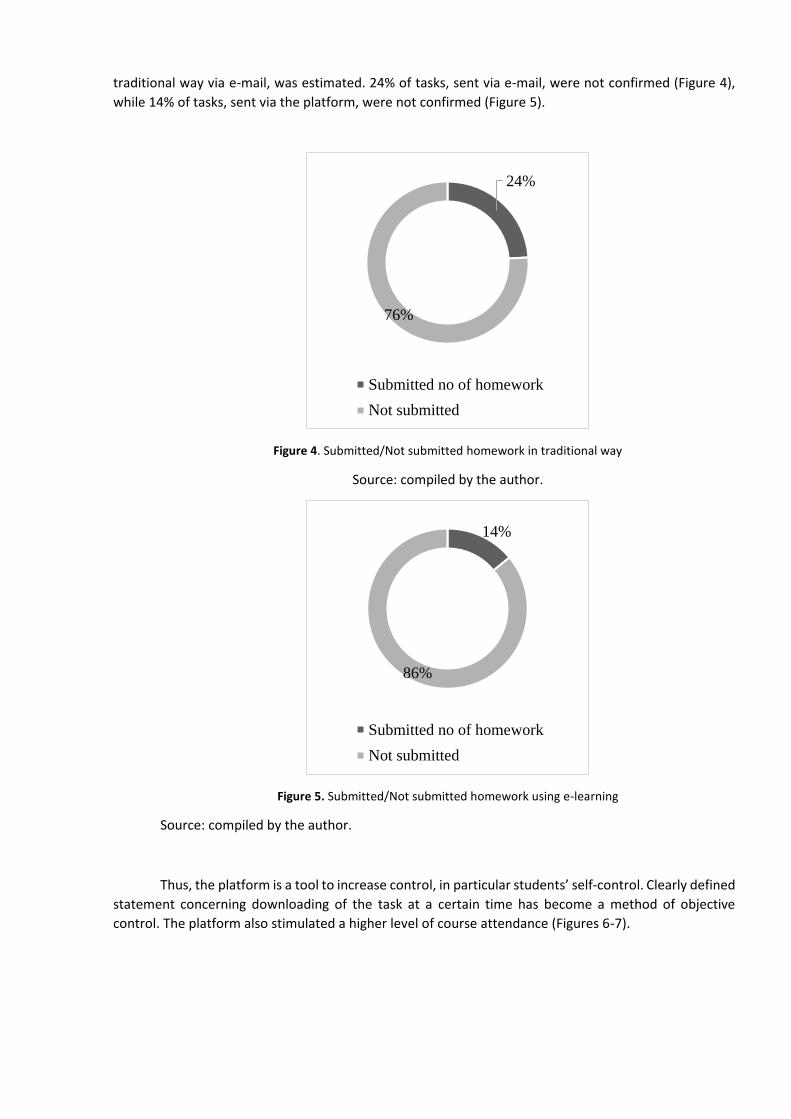
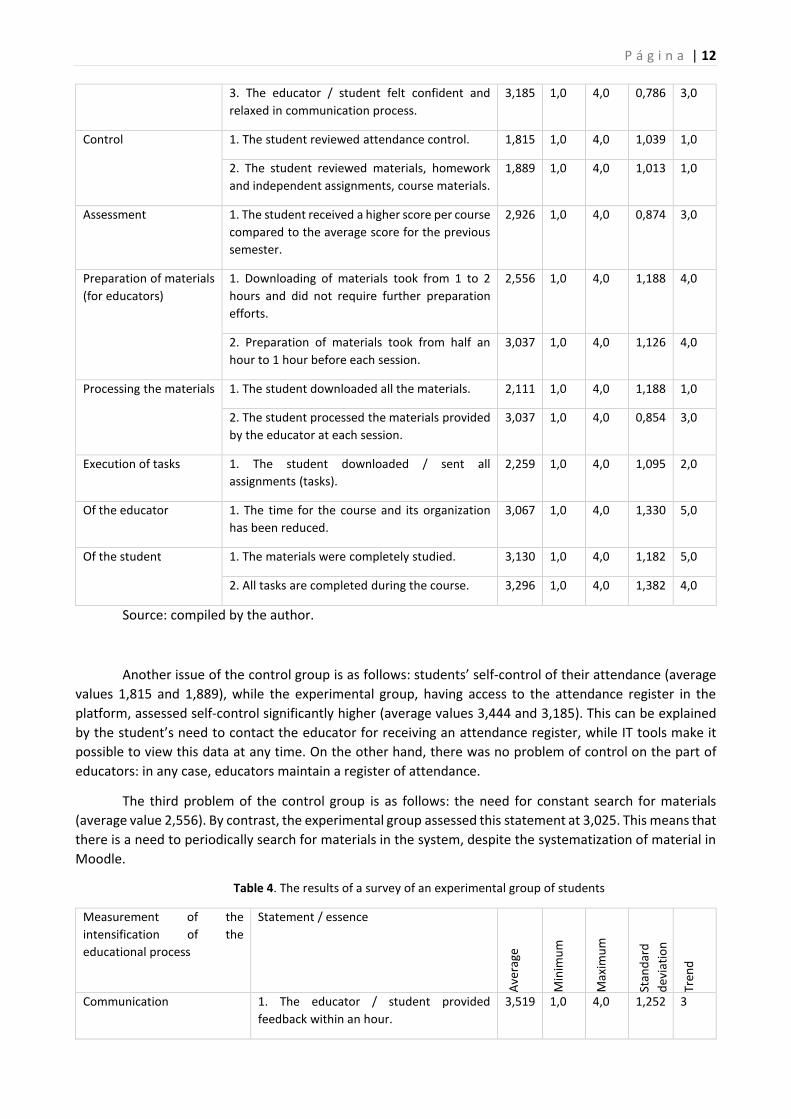
traditional way via e-mail, was estimated. 24% of tasks, sent via e-mail, were not confirmed (Figure 4),
while 14% of tasks, sent via the platform, were not confirmed (Figure 5).
Figure 4. Submitted/Not submitted homework in traditional way
Source: compiled by the author.
Figure 5. Submitted/Not submitted homework using e-learning
Source: compiled by the author.
Thus, the platform is a tool to increase control, in particular students’ self-control. Clearly defined
statement concerning downloading of the task at a certain time has become a method of objective
control. The platform also stimulated a higher level of course attendance (Figures 6-7).
24%
76%
Submitted no of homework
Not submitted
14%
86%
Submitted no of homework
Not submitted

Figure 6. Participation rate in traditional way
Source: compiled by the author.
Figure 7. Participation rate using e-learning platform
Source: compiled by the author.
18%
82%
N of students that attended courses
N of students that didn’t attended courses
5%
95%
N of students that attended courses
N of students that didn’t attended courses

One of the important elements for ensuring the growth of students’ attendance at courses was the
display of the number of visits by each student through an electronic platform: each student could see the
number of classes he missed and the score for attendance in Moodle. As a result, 82% of students attended
the course in the control group and 18% missed classes, while 95% of students attended courses in the
experimental group.
Survey results: assessment of the intensification of the educational process
Cronbach’s alpha has been calculated according to the questionnaires’ data of the control group,
experimental group and educators’ group in order to form the correct conclusions based on the analysis of
the questionnaire. The results of the survey are reliable and make it possible to draw correct conclusions
about the intensification of the educational process (see table 2).
Table 2. The Reliability statistics
Reliability statistics Cronbach’s alpha N of Items N of respondents Reliability level
Students
Control group 0,706 14 115 0.61 to 0.80 High
Experimental group 0,702 14 115 0.61 to 0.80 High
Educators
Control group 0,697 14 4 0.61 to 0.80 High
Experimental group 0.698 14 4 0.61 to 0.80 High
Source: compiled by the author.
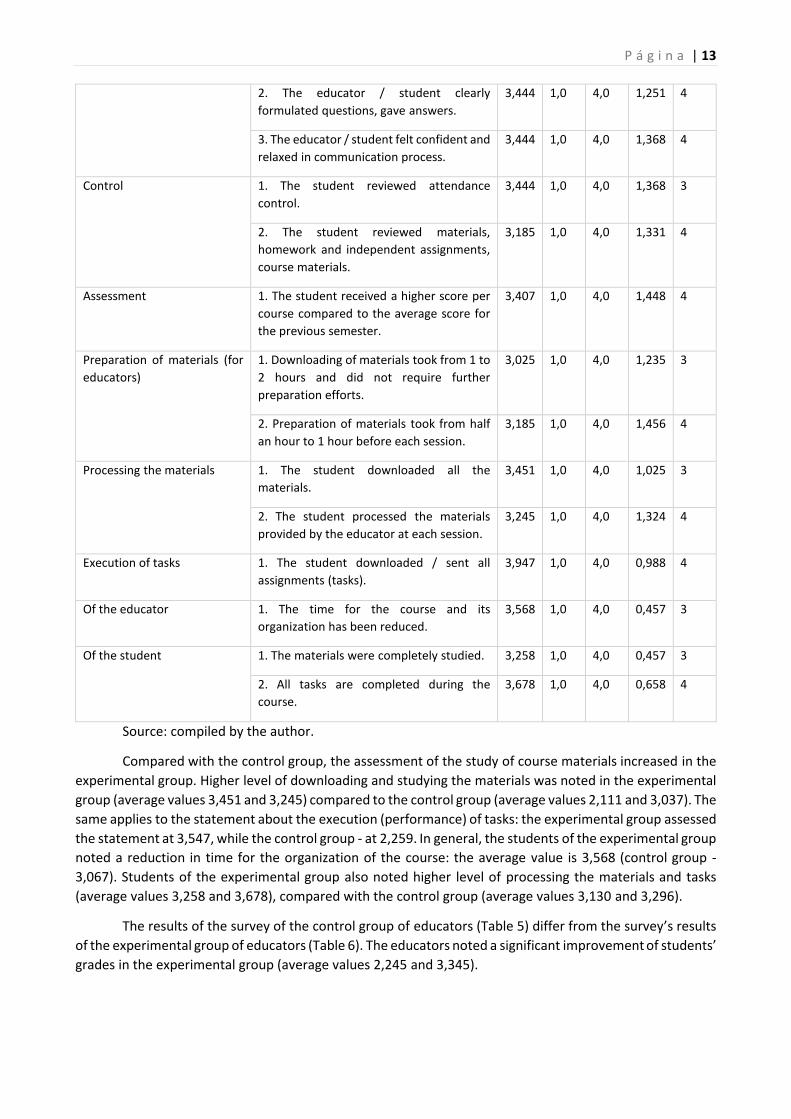
The results of the survey of the control group of students (Table 3) are on average lower than the
results of the survey of the experimental group (Table 4). The average value of all 14 statements in the first
case was 2,741, in the second - 3,372. The most problematic issue in the traditional form of training were the
clarity of the wording of the questions and answers by the educator (average 2,222, deviation 1,086), while
the educators assess this statement higher (to compare with a control and experimental group with average
3,213 and 3,323). Thus, in the process of communication, a problem of formulating questions by students
arises due to possible lack of effective communication skills. Whereas educators with communication and
teaching skills assess the communication process more effectively. At the same time, the assessment of the
clarity of the wording of the questions and answers is higher in the experimental group of educators, which
can be explained by the student’s need to form a question and the answer in writing through the platform
Moodle, Viber etc.
Table 3. The results of a survey of a control group of students
Measurement of the
intensification of the
educational process
Statement / essence
Ave
rage
Min
imu
m
Max
imu
m
Stan
dar
d
dev
iati
on
Tren
d
Communication
1. The educator / student provided feedback
within an hour.
2,741 1,0 4,0 1,130 4,0
2. The educator / student clearly formulated
questions, gave answers.
2,222 1,0 4,0 1,086 2,0
P á g i n a | 12
3. The educator / student felt confident and
relaxed in communication process.
3,185 1,0 4,0 0,786 3,0
Control 1. The student reviewed attendance control. 1,815 1,0 4,0 1,039 1,0
2. The student reviewed materials, homework
and independent assignments, course materials.
1,889 1,0 4,0 1,013 1,0
Assessment 1. The student received a higher score per course
compared to the average score for the previous
semester.
2,926 1,0 4,0 0,874 3,0
Preparation of materials
(for educators)
1. Downloading of materials took from 1 to 2
hours and did not require further preparation
efforts.
2,556 1,0 4,0 1,188 4,0
2. Preparation of materials took from half an
hour to 1 hour before each session.
3,037 1,0 4,0 1,126 4,0
Processing the materials 1. The student downloaded all the materials. 2,111 1,0 4,0 1,188 1,0
2. The student processed the materials provided
by the educator at each session.
3,037 1,0 4,0 0,854 3,0
Execution of tasks 1. The student downloaded / sent all
assignments (tasks).
2,259 1,0 4,0 1,095 2,0
Of the educator 1. The time for the course and its organization
has been reduced.
3,067 1,0 4,0 1,330 5,0
Of the student 1. The materials were completely studied. 3,130 1,0 4,0 1,182 5,0
2. All tasks are completed during the course. 3,296 1,0 4,0 1,382 4,0
Source: compiled by the author.
Another issue of the control group is as follows: students’ self-control of their attendance (average
values 1,815 and 1,889), while the experimental group, having access to the attendance register in the
platform, assessed self-control significantly higher (average values 3,444 and 3,185). This can be explained
by the student’s need to contact the educator for receiving an attendance register, while IT tools make it
possible to view this data at any time. On the other hand, there was no problem of control on the part of
educators: in any case, educators maintain a register of attendance.
The third problem of the control group is as follows: the need for constant search for materials
(average value 2,556). By contrast, the experimental group assessed this statement at 3,025. This means that
there is a need to periodically search for materials in the system, despite the systematization of material in
Moodle.
Table 4. The results of a survey of an experimental group of students
Measurement of the
intensification of the
educational process
Statement / essence
Ave
rage
Min
imu
m
Max
imu
m
Stan
dar
d
dev
iati
on
Tren
d
Communication 1. The educator / student provided
feedback within an hour.
3,519 1,0 4,0 1,252 3
P á g i n a | 13
2. The educator / student clearly
formulated questions, gave answers.
3,444 1,0 4,0 1,251 4
3. The educator / student felt confident and
relaxed in communication process.
3,444 1,0 4,0 1,368 4
Control 1. The student reviewed attendance
control.
3,444 1,0 4,0 1,368 3
2. The student reviewed materials,
homework and independent assignments,
course materials.
3,185 1,0 4,0 1,331 4
Assessment 1. The student received a higher score per
course compared to the average score for
the previous semester.
3,407 1,0 4,0 1,448 4
Preparation of materials (for
educators)
1. Downloading of materials took from 1 to
2 hours and did not require further
preparation efforts.
3,025 1,0 4,0 1,235 3
2. Preparation of materials took from half
an hour to 1 hour before each session.
3,185 1,0 4,0 1,456 4
Processing the materials 1. The student downloaded all the
materials.
3,451 1,0 4,0 1,025 3
2. The student processed the materials
provided by the educator at each session.
3,245 1,0 4,0 1,324 4
Execution of tasks 1. The student downloaded / sent all
assignments (tasks).
3,947 1,0 4,0 0,988 4
Of the educator 1. The time for the course and its
organization has been reduced.
3,568 1,0 4,0 0,457 3
Of the student 1. The materials were completely studied. 3,258 1,0 4,0 0,457 3
2. All tasks are completed during the
course.
3,678 1,0 4,0 0,658 4
Source: compiled by the author.
Compared with the control group, the assessment of the study of course materials increased in the
experimental group. Higher level of downloading and studying the materials was noted in the experimental
group (average values 3,451 and 3,245) compared to the control group (average values 2,111 and 3,037). The
same applies to the statement about the execution (performance) of tasks: the experimental group assessed
the statement at 3,547, while the control group - at 2,259. In general, the students of the experimental group
noted a reduction in time for the organization of the course: the average value is 3,568 (control group -
3,067). Students of the experimental group also noted higher level of processing the materials and tasks
(average values 3,258 and 3,678), compared with the control group (average values 3,130 and 3,296).
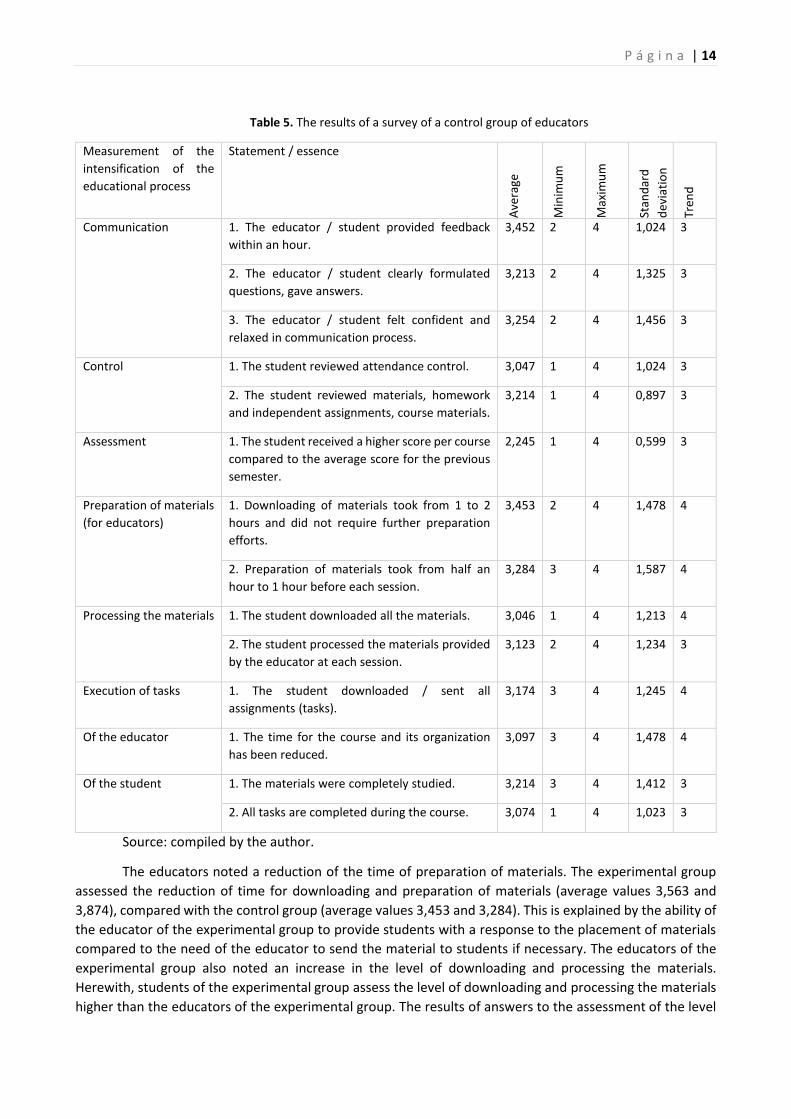
The results of the survey of the control group of educators (Table 5) differ from the survey’s results
of the experimental group of educators (Table 6). The educators noted a significant improvement of students’
grades in the experimental group (average values 2,245 and 3,345).
P á g i n a | 14
Table 5. The results of a survey of a control group of educators
Measurement of the
intensification of the
educational process
Statement / essence
Ave
rage
Min
imu
m
Max
imu
m
Stan
dar
d
dev
iati
on
Tren
d
Communication
1. The educator / student provided feedback
within an hour.
3,452 2 4 1,024 3
2. The educator / student clearly formulated
questions, gave answers.
3,213 2 4 1,325 3
3. The educator / student felt confident and
relaxed in communication process.
3,254 2 4 1,456 3
Control 1. The student reviewed attendance control. 3,047 1 4 1,024 3
2. The student reviewed materials, homework
and independent assignments, course materials.
3,214 1 4 0,897 3
Assessment 1. The student received a higher score per course
compared to the average score for the previous
semester.
2,245 1 4 0,599 3
Preparation of materials
(for educators)
1. Downloading of materials took from 1 to 2
hours and did not require further preparation
efforts.
3,453 2 4 1,478 4
2. Preparation of materials took from half an
hour to 1 hour before each session.
3,284 3 4 1,587 4
Processing the materials 1. The student downloaded all the materials. 3,046 1 4 1,213 4
2. The student processed the materials provided
by the educator at each session.
3,123 2 4 1,234 3
Execution of tasks 1. The student downloaded / sent all
assignments (tasks).
3,174 3 4 1,245 4
Of the educator 1. The time for the course and its organization
has been reduced.
3,097 3 4 1,478 4
Of the student 1. The materials were completely studied. 3,214 3 4 1,412 3
2. All tasks are completed during the course. 3,074 1 4 1,023 3
Source: compiled by the author.
The educators noted a reduction of the time of preparation of materials. The experimental group
assessed the reduction of time for downloading and preparation of materials (average values 3,563 and
3,874), compared with the control group (average values 3,453 and 3,284). This is explained by the ability of
the educator of the experimental group to provide students with a response to the placement of materials
compared to the need of the educator to send the material to students if necessary. The educators of the
experimental group also noted an increase in the level of downloading and processing the materials.
Herewith, students of the experimental group assess the level of downloading and processing the materials
higher than the educators of the experimental group. The results of answers to the assessment of the level
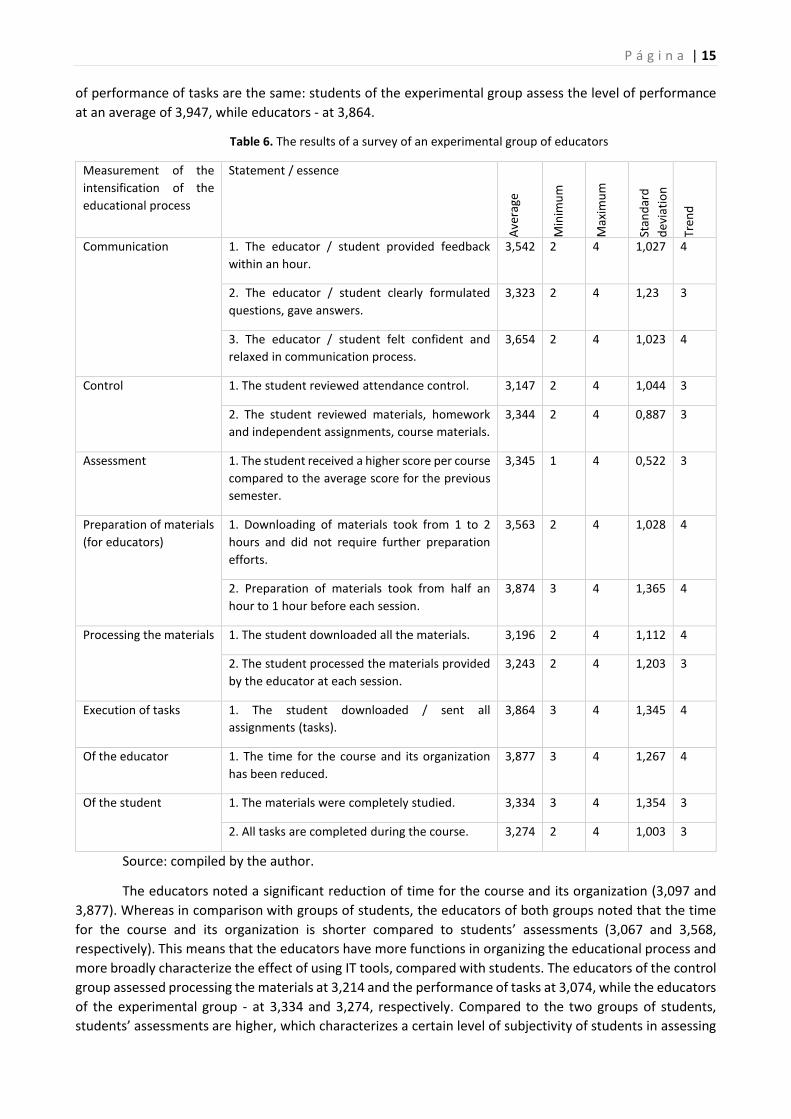
P á g i n a | 15
of performance of tasks are the same: students of the experimental group assess the level of performance
at an average of 3,947, while educators - at 3,864.
Table 6. The results of a survey of an experimental group of educators
Measurement of the
intensification of the
educational process
Statement / essence
Ave
rage
Min
imu
m
Max
imu
m
Stan
dar
d
dev
iati
on
Tren
d
Communication
1. The educator / student provided feedback
within an hour.
3,542 2 4 1,027 4
2. The educator / student clearly formulated
questions, gave answers.
3,323 2 4 1,23 3
3. The educator / student felt confident and
relaxed in communication process.
3,654 2 4 1,023 4
Control 1. The student reviewed attendance control. 3,147 2 4 1,044 3
2. The student reviewed materials, homework
and independent assignments, course materials.
3,344 2 4 0,887 3
Assessment 1. The student received a higher score per course
compared to the average score for the previous
semester.
3,345 1 4 0,522 3
Preparation of materials
(for educators)
1. Downloading of materials took from 1 to 2
hours and did not require further preparation
efforts.
3,563 2 4 1,028 4
2. Preparation of materials took from half an
hour to 1 hour before each session.
3,874 3 4 1,365 4
Processing the materials 1. The student downloaded all the materials. 3,196 2 4 1,112 4
2. The student processed the materials provided
by the educator at each session.
3,243 2 4 1,203 3
Execution of tasks 1. The student downloaded / sent all
assignments (tasks).
3,864 3 4 1,345 4
Of the educator 1. The time for the course and its organization
has been reduced.
3,877 3 4 1,267 4
Of the student 1. The materials were completely studied. 3,334 3 4 1,354 3
2. All tasks are completed during the course. 3,274 2 4 1,003 3
Source: compiled by the author.
The educators noted a significant reduction of time for the course and its organization (3,097 and
3,877). Whereas in comparison with groups of students, the educators of both groups noted that the time
for the course and its organization is shorter compared to students’ assessments (3,067 and 3,568,
respectively). This means that the educators have more functions in organizing the educational process and
more broadly characterize the effect of using IT tools, compared with students. The educators of the control
group assessed processing the materials at 3,214 and the performance of tasks at 3,074, while the educators
of the experimental group - at 3,334 and 3,274, respectively. Compared to the two groups of students,
students’ assessments are higher, which characterizes a certain level of subjectivity of students in assessing
P á g i n a | 16
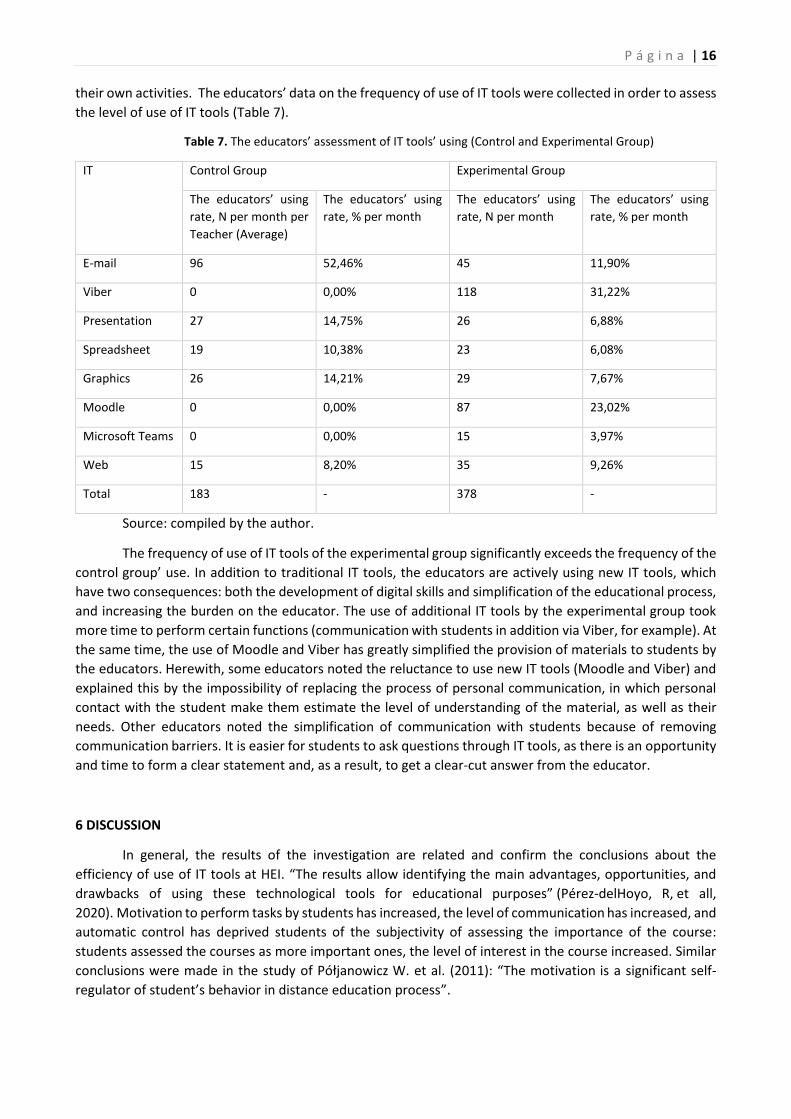
their own activities. The educators’ data on the frequency of use of IT tools were collected in order to assess
the level of use of IT tools (Table 7).
Table 7. The educators’ assessment of IT tools’ using (Control and Experimental Group)
IT Control Group Experimental Group
The educators’ using
rate, N per month per
Teacher (Average)
The educators’ using
rate, % per month
The educators’ using
rate, N per month
The educators’ using
rate, % per month
E-mail 96 52,46% 45 11,90%
Viber 0 0,00% 118 31,22%
Presentation 27 14,75% 26 6,88%
Spreadsheet 19 10,38% 23 6,08%
Graphics 26 14,21% 29 7,67%
Moodle 0 0,00% 87 23,02%
Microsoft Teams 0 0,00% 15 3,97%
Web 15 8,20% 35 9,26%
Total 183 - 378 -
Source: compiled by the author.
The frequency of use of IT tools of the experimental group significantly exceeds the frequency of the
control group’ use. In addition to traditional IT tools, the educators are actively using new IT tools, which
have two consequences: both the development of digital skills and simplification of the educational process,
and increasing the burden on the educator. The use of additional IT tools by the experimental group took
more time to perform certain functions (communication with students in addition via Viber, for example). At
the same time, the use of Moodle and Viber has greatly simplified the provision of materials to students by
the educators. Herewith, some educators noted the reluctance to use new IT tools (Moodle and Viber) and
explained this by the impossibility of replacing the process of personal communication, in which personal
contact with the student make them estimate the level of understanding of the material, as well as their
needs. Other educators noted the simplification of communication with students because of removing
communication barriers. It is easier for students to ask questions through IT tools, as there is an opportunity
and time to form a clear statement and, as a result, to get a clear-cut answer from the educator.
6 DISCUSSION
In general, the results of the investigation are related and confirm the conclusions about the
efficiency of use of IT tools at HEI. “The results allow identifying the main advantages, opportunities, and
drawbacks of using these technological tools for educational purposes” (Pérez‐delHoyo, R, et all,
2020). Motivation to perform tasks by students has increased, the level of communication has increased, and
automatic control has deprived students of the subjectivity of assessing the importance of the course:
students assessed the courses as more important ones, the level of interest in the course increased. Similar
conclusions were made in the study of Półjanowicz W. et al. (2011): “The motivation is a significant self-
regulator of student’s behavior in distance education process”.

P á g i n a | 17
Some studies have noted an increase in overall satisfaction of use of IT tools (Benta, D., Bologa, G.,
Dzitac I. (2014). However, our investigation is focused on a limited subject matter: expressness in
communication has been proven through IT tools, questioning, and simplicity in communication.
The most visible effects of IT tools include simplifying the preparation process, gaining access to
materials. The same conclusions are contained in the study of (Adams, S. et al, 2017). This enhances the level
of cooperation (Keane, T., Keane, W. F., Blicblau, A. S.2016): the educator does not spend time explaining the
resources of placement of materials, however, he has the opportunity to spend time explaining the essence
of the material.
Conclusions have been also confirmed regarding the increase of students’ performance due to the
growth in attendance rates of courses, the fulfillment of the objectives of the courses. “Distance learning
electronic systems have increased the level of intrinsic motivation” (Benta, D., Bologa, G., Dzitac I., 2015). In
fact, the understanding of the need for self-loading of tasks led to the emergence of an internal motive, which
centered around understanding the losses: the grade is reduced automatically, the educator will not be able
to adjust the grade due to the registration of all students’ actions in the system. A certain level of subjectivity
in the assessments has been revealed (Barteit, S. et al., 2020).
Herewith, while the study of Chivu, R.-G .; Turlacu, L.-M .; Stoica, I .; Radu, A.V. (2018) has proved the
effectiveness of the distance learning platform at HEI, we have identified a negative point in the use of IT
tools at HEI: an increase in the burden on the educator due to the need to use numerous IT tools at the same
time and the lack of direct contact. The latter often causes the lack of understanding by the educator of
students’ knowledge level. While Rahman, S, Ramakrishnan, T, Ngamassi, L. (2019), on the one hand, talk
about improving the teaching experience through social media at HEI and prove the positive effect of their
use (level of satisfaction), we, on the other hand, assess the negative effect of using social media - level of
understanding.
It is the integration of tools that gives a positive effect in the educational process (Jain, M. & Tyagi,
R., 2017). While Henderson, M., Selwyn, N. & Aston, R. (2017) talk about the lack of transformation, then, in
fact, we prove the existence of transformational changes, namely in such processes as communication. As a
matter of fact, these changes concern the level of understanding between the educator and the student.
Kebble, P.G., (2017) points at the development of communication forms, and he has a case here, because
communication becomes more clean-cut, understandable and simple. However, the level of understanding
in communication differs. Due to the fact that students often do not provide feedback on educators’
responses, educators do not have a clear understanding of how well a student understands the material.
7 CONCLUSION
The conducted study makes it possible to draw a number of conclusions about the intensification of
the educational process through the use of IT. The application of IT tools has a number of advantages;
however, at the same time it causes an increase in the burden on the educator due to the fact that there has
been no complete retreat from traditional ways of organizing the educational process to IT technologies,
forcing educators to balance between traditional and innovative teaching models, sometimes doing double
work (in order to ensure all forms of reporting and control over teaching the discipline). This is due to the
resistance of the majority of teachers, and partly of students concerning the transition to innovative ways of
teaching and attracting innovative forms of interaction “teacher / student”, due to the lack of direct contact
between participants in the pedagogical process.
The conducted experiment showed that the intensification of the educational process through IT
tools took place in such areas as: communication, self-monitoring, assessment, preparation of materials,
tasks. The most clearly observed improvements are such dimensions of intensification as an increase in the
P á g i n a | 18
level of involvement in training (through the attendance of the platform on which the training course is
placed); increasing the level of control and responsibility, perception of the importance of the course tasks
by students; reduction of time for receiving and searching for materials; reduction of time for preparation of
materials by educators; growth of the level of downloading and processing the materials; significant
reduction of time for the course and its organization. In the aggregate, the educators’ assessment of the
intensification of the educational process with application of IT tools was higher compared to students’
evaluation. It is noteworthy that the self-assessment of students in the processing of materials and tasks set
by educators are higher compared to educators’ assessments, which demonstrates a certain level of
subjectivity of students in assessing their own educational activities.
The obtained research results can be used in the theoretical generalization of data on the process of
enhanced use of IT technologies in higher educational institutions, which is relevant in general for the
organization of the modern educational process on a global scale. The relevance of the data obtained is
further enhanced by the need to develop effective models of interaction between students and educators in
light of spreading Covid-19 and its implications for the educational sector, in particular, the urgent need to
learn and teach in the distance learning paradigm, where traditional models of interaction between the
subjects of educational activities are completely ineffective. Forasmuch as the questionnaire survey and
analysis of data obtained on the basis of statistical indicators of the Moodle platform have confirmed the
effectiveness of interactive technologies in intensifying the educational process of higher educational
institutions, further experimental investigations and theorization of the results obtained in this area will be
appropriate and will contribute to the renewal of higher education, its adaptation to modern conditions of
the information globalized era.
REFERENCES
Adams, S., Cummins, M., Davis, A., Freeman, A., Hall, C., Ananthanarayanan, V. (2017). NMC Horizon
Report: 2017 Higher Education Edition. Austin, Texas: The New Media Consortium. Retrieved
from http://cdn.nmc.org/media/2017-nmc-horizon-report-he-EN.pdf
Al‐Zahrani, A. M. (2015). From passive to active. British Journal of Educational Technology, 46, 1133-1148.
doi:10.1111/bjet.12353
Arrosagaray, M., González-Peiteado, M., Pino-Juste, M., Rodríguez-López, B. (2019). A comparative study
of Spanish adult students’ attitudes to ICT in classroom, blended and distance language learning
modes, Computers & Education, 134, 31-40, ISSN 0360-1315,
https://doi.org/10.1016/j.compedu.2019.01.016
Barteit, S. et al., (2020). Evaluation of e-learning for medical education in low- and middle-income countries:
A systematic review, Computers & Education, 145, 103726,
https://doi.org/10.1016/j.compedu.2019.103726,
http://www.sciencedirect.com/science/article/pii/S0360131519302799
Benta, D., Bologa, G., Dzitac I. (2014). E-learning Platforms in Higher Education. Case Study, Procedia
Computer Science, 31, 1170-1176, ISSN 1877-0509, https://doi.org/10.1016/j.procs.2014.05.373
Benta, D., Bologa, G., Dzitac I. (2015). University Level Learning and Teaching via E-Learning Platforms,
Procedia Computer Science, 55, 1366-1373, ISSN 1877-0509,
https://doi.org/10.1016/j.procs.2015.07.123.
Brito, C. D. A., & Nunes, C. P. (2020). The intensification of teaching work in the context of the
commercialization of higher education in Brazil. Journal of Research and Knowledge Spreading,
1(1), 1-17.
P á g i n a | 19
Chivu, R.-G., Turlacu, L.-M., Stoica, I., Radu, A.V. (2018). Identifying the effectiveness of e-learning platforms
among students using Eye-Tracking technology. Fourth International Conference on Higher
Education Advances, 621-628. Available from:
https://www.researchgate.net/publication/326501573_Identifying_the_effectiveness_of_e-
learning_platforms_among_students_using_Eye-Tracking_technology [accessed May 02 2020].
Drake, B. M.,Walz, A. (2018). Evolving Business Intelligence and Data Analytics in Higher Education. New
Directions for Institutional Research, 39-52. doi:10.1002/ir.20266
Dias, A. F., Cardoso, H. de M., Santos, A. L. dos, Menezes, C. A. A., & Rios, P. P. S. (2017). Schooling and
subversions of gender. Revista Tempos e Espaços em Educação, 10(22), 83-92.
Ebrahimi, M. A. (2020). Cultural value of translation of proverbs and synopsis. Journal of Research and
Knowledge Spreading, 1(1), 1-10.
Fullagar, S. (2019). A physical cultural studies perspective on physical (in)activity and health inequalities:
the biopolitics of body practices and embodied movement. Revista Tempos e Espaços em
Educação, 12(28), 63-76.
Georgieva-Tsaneva, G., Bogdanova, G., Negoslav Subev, N. (2017). Characteristics of Interactivity and Using
the Interactive Technologies in System North+. Digital Presentation and Preservation of Cultural
and Scientific Heritage. Conference Proceedings. Vol. 7, Sofia, Bulgaria: Institute of Mathematics
and Informatics – BAS, 133-142.
Ghanbarzadeh, R. and Ghapanchi, A.H. (2018). Investigating various application areas of three‐dimensional
virtual worlds for higher education. British Journal of Educational Technology, 49: 370-384.
doi:10.1111/bjet.12538
Henderson, M., Selwyn, N., Aston, R. (2017). What works and why? Student perceptions of ‘useful’ digital
technology in university teaching and learning. Studies in Higher Education, 42(8), 1567-1579.
doi: https://dx.doi.org/10.1080/03075079.2015.1007946
Jain, M., Tyagi, R. (2017). Education standard can be improved by integrating. ICT in Education. International
Education & Research Journal, 3(10), 77-80. Available from:
http://ierj.in/journal/index.php/ierj/article/view/1452/1383
Keane, T., Keane, W. F., Blicblau, A. S. (2016). Beyond traditional literacy: Learning and transformative
practices using ICT. Education and Information Technologies, 21(4), 769-781. doi:
https://dx.doi.org.ezproxy.uned.es/10.1007/s10639-014-9353-5
Kebble, P.G. (2017). Assessing Online Asynchronous Communication Strategies Designed to Enhance Large
Student Cohort Engagement and Foster a Community of Learning. Journal of Education and
Training Studies, 5(8), 92-100. doi: https://doi.org/10.11114/jets.v5i8.2539
Lytras, M., Sarirete, A., Damiani, E. (2020). Technology-enhanced learning research in higher education: A
transformative education primer, Computers in Human Behavior, 109, 106350, ISSN 0747-5632,
https://doi.org/10.1016/j.chb.2020.106350
Moreno, V., Cavazotte F., Cavazotte, F., Alves I. (2016). Explaining university students’ effective use of e-
learning platforms: Effective use of e-learning platforms. British Journal of Educational
Technology, 48(4), DOI: 10.1111/bjet.12469
Pérez‐delHoyo, R, Mora, H, Martí‐Ciriquián, P, Pertegal‐Felices, ML, Mollá‐Sirvent, R. (2020). Introducing
innovative technologies in higher education: An experience in using geographic information
P á g i n a | 20
systems for the teaching‐learning process. Comput Appl Eng Educ,
1– 18. https://doi.org/10.1002/cae.22287
Pino, S., Mora, C., Diaz, A., Guarnizo, P., Jaimes, D. (2017). Improving skills in pediatric rheumatology in
Colombia: A combined educational strategy supported by ILAR. Clinical Rheumatology, 36 (7),
1631-1635, 10.1007/s10067-016-3294-x
Półjanowicz W. et al. (2011). The effectiveness of education with the use of e-learning platform at the
Faculty of Health Sciences, Medical University of Bialystok. Studies in logic, grammar and rhetoric,
25 (38), 159-172.
Rahman, S, Ramakrishnan, T, Ngamassi, L. (2019). Impact of social media use on student satisfaction in
Higher Education. Higher Education Quality, 00, 1– 16. https://doi.org/10.1111/hequ.12228
Rolim, C. and Isaias, P. (2019). Examining the use of e‐assessment in higher education: teachers and
students’ viewpoints. British Journal of Educational Technology, 50, 1785-1800.
doi:10.1111/bjet.12669
Rowan‐Kenyon, H.T., Martínez Alemán, A.M., Gin, K., Blakeley, B., Gismondi, A., Lewis, J., McCready, A.,
Zepp, D. and Knight, S. (2016). Social Media in Higher Education. ASHE High. Edu. Rept., 42, 7-
128. doi:10.1002/aehe.20103
Santos, I. T. R., Barreto, D. A. B., & Soares, C. V. C. O. (2020). Formative assessment in the classroom: the
dialogue between teachers and students. Journal of Research and Knowledge Spreading, 1(1), 1-
14.
Serrano, D. R., Dea‐Ayuela, M. A., Gonzalez‐Burgos, E., Serrano‐Gil, A., Lalatsa, A. (2019). Technology‐
enhanced learning in higher education: How to enhance student engagement through blended
learning. European Journal of Education, 54, 273– 286. https://doi.org/10.1111/ejed.12330
Stewart, C., Wolodko, B. (2016). University Educator Mindsets: How Might Adult Constructive‐
Developmental Theory Support Design of Adaptive Learning?. Mind, Brain, and Education, 10,
247-255. doi:10.1111/mbe.12126
Subhash, S., Cudney, E. A. (2018). Gamified learning in higher education: A systematic review of the
literature, Computers in Human Behavior, 87, 192-206, ISSN 0747-5632,
https://doi.org/10.1016/j.chb.2018.05.028.
Sysoieva, S., O., Osadcha, K. P. (2019). The state, technology and perspectives of distance learning in higher
education in Ukraine. Information Technology and Learning Tools: Specialized Electronic Scientific
Edition, 70 (2). 271-284. ISSN 2076-8184
Yang, G., Xiang, H., & Chun, L. (2018). CSL teachers’ cognition in teaching intercultural communicative
competence. System. doi:10.1016/j.system.2018.09.009
Yaroshenko T. (2019). Distance learning in higher education: current trends. Engineering and Educational
Technologies, 7 (4), 8-21.
Younie, S., & Leask, M. (2013). Implementing learning platforms in schools and universities: lessons from
England and Wales. Technology, Pedagogy and Education, 22(2), 247–266.
doi:10.1080/1475939x.2013.802118
Zhu, E. (2017), Breaking Down Barriers to the Use of Technology for Teaching in Higher Education. To
Improve the Academy, 26, 305-318. doi:10.1002/j.2334-4822.2008.tb00516.x
P á g i n a | 21
ABOUT THE AUTHORS
Khmiliar Oleh Doctor of Psychological Sciences, Associate Professor, Head of the Department of Social Sciences, The National Defense University of Ukraine named after Ivan Cherniakhovskyi, Kiev, Ukraine. Email: [email protected] ORCID: https://orcid.org/0000-0003-2693-1906
Krasnytska Olha
Сandidate of Pedagogical Sciences, Senior Lecturer of the Department of Social Sciences, The National Defense University of Ukraine named after Ivan Cherniakhovskyi, Kiev, Ukraine. Email: [email protected] ORCID: https://orcid.org/0000-0002-0417-3318
Vainola Renate
Doctor of Pedagogical Sciences, Professor, Head of the department, Faculty of Socioeconomic Education, Department of Social Pedagogics, National Pedagogical Dragomanov University. Kiev, Ukraine. Email: [email protected] ORCID: https://orcid.org/0000-0002-9754-6178
Xi Zechen
Doctor of Pedagogical Sciences, Professor, Head of the department, Faculty of Socioeconomic Education, Department of Social Pedagogics, National Pedagogical Dragomanov University. Kiev, Ukraine. Email: [email protected] ORCID: https://orcid.org/0000-0002-9754-6178
Kravchenko Iryna
Ph.D, Associate Professor, Faculty of Education and Research Management, Department of Pedagogy and Psychology of Higher School, National Pedagogical Dragomanov University. Kiev, Ukraine. Email: [email protected] ORCID: https://orcid.org/0000-0002-5178-3581
Received on: 08-07-2020 Approved on: 11-20-2020 Published on: 12-11-2020