Intel® JTAG Debugger 2.3 for Intel® Atom™ Processor€¦ · Intel® JTAG Debugger 2.3 for...
30
Intel® JTAG Debugger 2.3 for Intel® Atom™ Processor Installation Guide and Release Notes 1 Intel® JTAG Debugger 2.3 for Intel® Atom™ Processor Installation Guide and Release Notes Installation Guide and Release Notes Document number: 322074-009US 8 November 2011 Contents: Introduction What's New System Requirements Installation Notes Features Usage Notes Issues and Limitations Resolved Issues Known Issues and Limitations Attributions Disclaimer and Legal Information 1 Introduction The Intel® JTAG Debugger 2.3 for Intel® Atom™ Processor provides Linux* hosted cross- debug solutions for software developers to debug the Linux* kernel sources and dynamically loaded drivers and kernel modules on Intel® Atom™ Processor based devices. It does so using the In-Target Probe eXtended Debug Port (ITP-XDP) on Intel® Atom™ Processor (Z5xx, Z6xx, E6xx, CE4xxx) and Intel® Media Processor CE3100 based platforms. As JTAG communication device you have the choice between the Macraigor usb2Demon* and the Intel® ITP-XDP3. Beyond this the debugger also offers convenient and in-depth access to underlying hardware properties through a powerful graphical user interface (GUI). This makes it an ideal assistant for initial platform bringup and firmware and BIOS debugging. A set of features providing in-depth access to the development platform complete the offering for system developers: Execution trace support for identifying incorrect execution paths or memory accesses Bitfield editors for comprehensive and bit level access to silicon platform features Graphical representation of the page translation table with full access of the descriptor tables
Transcript of Intel® JTAG Debugger 2.3 for Intel® Atom™ Processor€¦ · Intel® JTAG Debugger 2.3 for...

Intel® JTAG Debugger 2.3 for Intel® Atom™ Processor Installation Guide and Release Notes
1
Intel® JTAG Debugger 2.3 for Intel® Atom™ Processor Installation Guide and Release Notes
Installation Guide and Release Notes
Document number: 322074-009US
8 November 2011
Contents:
Introduction What's New System Requirements Installation Notes Features Usage Notes Issues and Limitations
Resolved Issues Known Issues and Limitations
Attributions Disclaimer and Legal Information
1 Introduction
The Intel® JTAG Debugger 2.3 for Intel® Atom™ Processor provides Linux* hosted cross-debug solutions for software developers to debug the Linux* kernel sources and dynamically loaded drivers and kernel modules on Intel® Atom™ Processor based devices. It does so using the In-Target Probe eXtended Debug Port (ITP-XDP) on Intel® Atom™ Processor (Z5xx, Z6xx, E6xx, CE4xxx) and Intel® Media Processor CE3100 based platforms.
As JTAG communication device you have the choice between the Macraigor usb2Demon* and the Intel® ITP-XDP3. Beyond this the debugger also offers convenient and in-depth access to underlying hardware properties through a powerful graphical user interface (GUI). This makes it an ideal assistant for initial platform bringup and firmware and BIOS debugging. A set of features providing in-depth access to the development platform complete the offering for system developers:
Execution trace support for identifying incorrect execution paths or memory accesses
Bitfield editors for comprehensive and bit level access to silicon platform features
Graphical representation of the page translation table with full access of the descriptor
tables

Intel® JTAG Debugger 2.3 for Intel® Atom™ Processor Installation Guide and Release Notes
2
Flash writer plug-in that allows to update the BIOS or firmware as well as flash-resident
OS images
These debugger capabilities minimizes the time it takes to isolate and correct platform and system level problems.
This document provides system requirements, installation instructions, issues and limitations,
and legal information.
Technical Support and Documentation
The directory /opt/intel/atom/xdb/2.3.xxx/doc includes these release and installation
notes Release_Notes_JTAG.pdf, and a getting started guide Getting_Started.htm. In
addition, the Intel® JTAG Debugger for Intel® Atom™ Processor includes online help provided in form of the document titled "Intel® Debugger Online Help", which is available from the Help menu of the graphical user interface (GUI).
To submit issues related to this product please visit the Intel Premier Support webpage and submit issues under the product Intel(R) Embedded SW Dev Tools Atom.
For information on how to register for and purchase support for the Intel® Embedded Software Development Tool Suite Intel® Atom™ processor please visit the Intel® Software Development Products webpage.
Additional information on the Intel® Embedded Software Development Tool Suite for Intel® Atom™ Processor is available at the following web resources:
Product Page: http://www.intel.com/software/products/atomtools
User Forum: http://software.intel.com/en-us/forums/software-development-toolsuite-atom/
Knowledge Base Articles: http://software.intel.com/en-us/articles/software-development-toolsuite-atom-kb/all/1/
Please remember to register your product at https://registrationcenter.intel.com/ by providing your email address. This helps Intel recognize you as a valued customer in the support forum.
For information about how to find Technical Support, product documentation and samples,
please visit http://www.intel.com/software/products/atomtools

Intel® JTAG Debugger 2.3 for Intel® Atom™ Processor Installation Guide and Release Notes
3
Product Contents
Intel® JTAG Debugger 2.3 for Intel® Atom™ Processor, Build [76.xxx.x]
XFLASH – Intel® JTAG Debugger Flash Memory Tool 3.3.1
2 What's New Below are some of the new features in the Intel® JTAG Debugger 2.3 for Intel® Atom™
Processor
General Updates
Support for Yocto Project* 1.1 based Linux* on Intel® Atom™ Processor E6xx
Updated Eclipse* RCP based graphical user interface
Fixes of outstanding issues
Target Platform Support
Support for Yocto Project* 1.1 based Linux* on Intel® Atom™ Processor E6xx
The Intel® JTAG Debugger for Intel® Atom™ Processor has been tested against debugging the Yocto Project* 1.1 operating system software stack running on Intel® Atom™ Processor E6xx based platforms.
Support for GUI assisted Flash Writer Plug-in for Intel® Atom™ processor CE4xxx
The Intel® JTAG Debugger provides flashing support through its Flash Memory Tool plugin providing easy graphical user interface assisted access to reprogramming the NOR as well as NAND flashes on software development platforms based on the Intel® Atom™ Processor CE41xx or Intel® Atom™ Processor CE42xx
This includes the following flash types:
Intel® Atom™ Processor CE41xx:
FTL Lite NAND Flash
NOR Flash Intel® Atom™ Processor CE42xx:
NOR Flash
eMMC NAND Flash
eMMC Boot Partitions
eMMC User Partition

Intel® JTAG Debugger 2.3 for Intel® Atom™ Processor Installation Guide and Release Notes
4
Support for On-Chip Instruction Trace on Intel® Atom™ Processor CE4xxx
The Intel(R) JTAG Debugger now provides full On-Chip Instruction Trace support for the
Intel® Atom™ Processor CE4100 and Intel® Atom™ Processor CE4200
Support for Intel® Atom™ processor E6xx bitfield editor
The Intel(R) JTAG Debugger provides access to chipset registers on the application processor as well as the Intel I/O Hub. All public registers of the Intel(R) Atom(TM) processor E6xx are accessible through the bitfield editor views offered by the Intel(R) JTAG Debugger
Intel® JTAG Debugger 2.3 for Intel® Atom™ Processor Installation Guide and Release Notes
5
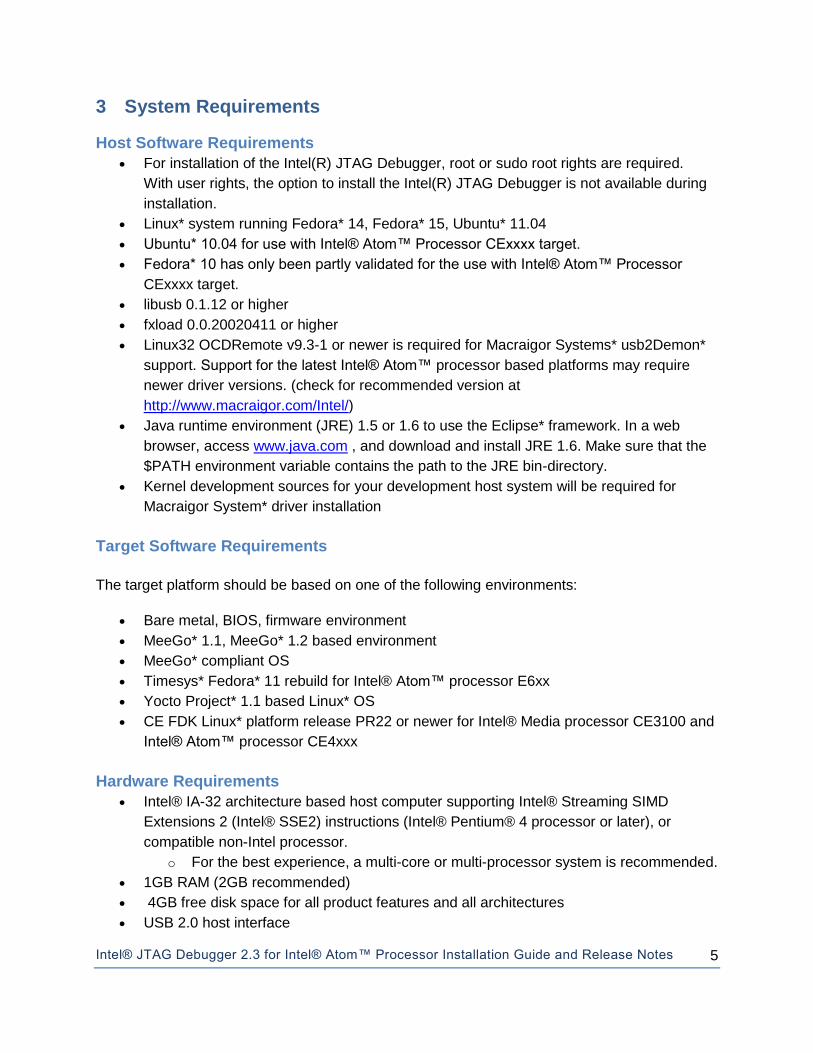
3 System Requirements
Host Software Requirements
For installation of the Intel(R) JTAG Debugger, root or sudo root rights are required.
With user rights, the option to install the Intel(R) JTAG Debugger is not available during
installation.
Linux* system running Fedora* 14, Fedora* 15, Ubuntu* 11.04
Ubuntu* 10.04 for use with Intel® Atom™ Processor CExxxx target.
Fedora* 10 has only been partly validated for the use with Intel® Atom™ Processor
CExxxx target.
libusb 0.1.12 or higher
fxload 0.0.20020411 or higher
Linux32 OCDRemote v9.3-1 or newer is required for Macraigor Systems* usb2Demon*
support. Support for the latest Intel® Atom™ processor based platforms may require
newer driver versions. (check for recommended version at
http://www.macraigor.com/Intel/)
Java runtime environment (JRE) 1.5 or 1.6 to use the Eclipse* framework. In a web
browser, access www.java.com , and download and install JRE 1.6. Make sure that the
$PATH environment variable contains the path to the JRE bin-directory.
Kernel development sources for your development host system will be required for
Macraigor System* driver installation
Target Software Requirements
The target platform should be based on one of the following environments:
Bare metal, BIOS, firmware environment
MeeGo* 1.1, MeeGo* 1.2 based environment
MeeGo* compliant OS
Timesys* Fedora* 11 rebuild for Intel® Atom™ processor E6xx
Yocto Project* 1.1 based Linux* OS
CE FDK Linux* platform release PR22 or newer for Intel® Media processor CE3100 and
Intel® Atom™ processor CE4xxx
Hardware Requirements
Intel® IA-32 architecture based host computer supporting Intel® Streaming SIMD
Extensions 2 (Intel® SSE2) instructions (Intel® Pentium® 4 processor or later), or
compatible non-Intel processor.
o For the best experience, a multi-core or multi-processor system is recommended.
1GB RAM (2GB recommended)
4GB free disk space for all product features and all architectures
USB 2.0 host interface

Intel® JTAG Debugger 2.3 for Intel® Atom™ Processor Installation Guide and Release Notes
6
In-Target Probe eXtended Debug Port on target platform
One of the following target platforms:
o Intel® development kit based on Intel® Atom™ processor Z5xx or Intel® Atom™
processor Z6xx
o Intel® development kit based on Intel® Media processor CE3100 or Intel®
Atom™ processor CE4xxx
o Intel® development kit based on the Intel® Atom™ processor E6xx
For Intel® Atom™ processor Z5xx,Z6xx, E6xx, CE4xxx the Macraigor Systems*
usb2Demon* (http://www.macraigor.com/usbDemon.htm) JTAG hardware adapter.
For all supported platforms alternatively Intel's XDP3 JTAG Hardware Adapter
Host-Target Platform Support Matrix
Table 1. Intel® JTAG Debugger
Host / Target
Z5xx
Z6xx E6xx
CE3100
CE4100 CE4200
Fedora* 10 McG,
XDP
McG,
XDP
McG,
XDP
XDP McG,
XDP
McG,
XDP
Fedora* 14 McG,
XDP
Fedora* 15 McG,
XDP
McG,
XDP
McG,
XDP
XDP McG,
XDP
McG,
XDP
Ubuntu*
11.04
McG,
XDP
McG,
XDP
McG,
XDP
XDP McG,
XDP
McG,
XDP
McG: Macraigor Systems* usb2Demon
XDP: Intel(R) ITP-XDP3

Intel® JTAG Debugger 2.3 for Intel® Atom™ Processor Installation Guide and Release Notes
7
4 Installation Notes
The default installation directory is /opt/intel/atom/xdb/2.3.xxx
For installation of the debugger update on the development host please follow the steps below:
1. Unpack the tool suite package in a directory to which you have write access.
> tar -zxvf l_MID_DBG_p_2.3.xxx.tgz
2. If you do not have a license file, please note the product serial number. You will need it
to complete the installation process. Otherwise copy the license file you may have
received via email from the Intel® Software Development Products Registration
Center to /opt/intel/licenses/.
3. It is recommended to register your product at https://registrationcenter.intel.com. If you
purchased support for this product you will need to register to take full advantage of Intel
Premier Support at https://premier.intel.com.
4. Change into the directory the tar file was extracted to ../l_MID_DBG_p_2.3.xxx
5. Run the installation script
Execute the install script in the directory where the tar file was extracted.
>./install.sh
6. If you are not logged in as root, you will be asked if you want to install as root, install as
root using sudo, or install without root privileges. Installing as root (using sudo if you
have that privilege) is recommended, as that will update the system RPM database. Use
the install as current user option if you want to install to a private area. To
be able to install the Intel® JTAG Debugger however it is necessary to select "install as
root" or "install as root using sudo". Without root privileges the option to install the Intel®
JTAG Debugger will not be offered during install.
7. The welcome message to the Intel® Embedded Software Development Tool Suite 2.3
for Intel® Atom™ Processor appears along with an outline of the installation process.
Press the Enter key to continue.
8. The installation routine checks for the availability of all product dependencies. Please
take care of these dependencies, if a warning message appears.
9. Afterwards you will be asked to read the end-user license agreement for the tool suite.
Press the Enter key to continue with reading the license agreement. Once done type
accept to continue with the installation.
10. When asked whether you would like to activate and install your product select one of the
options provided depending on whether you have a license file available or not. If there
is already a valid license file available and installed on your system, the installation
routine will recommend to simply use the existing license file. If you do not have access
to the internet at the time of installation, select the alternative activation option.

Intel® JTAG Debugger 2.3 for Intel® Atom™ Processor Installation Guide and Release Notes
8
11. The next screen let’s you review your installation options. If you would like to only install
the Intel® JTAG Debugger, select [3] and change the components settings. Else,
continue with the default choice [1] to start the installation.
Step no: 4 of 6 | Options
-----------------------------------------------------------------------------
You are now ready to begin installation. You can use all default installation
settings by simply choosing the "Start installation Now" option or you can
customize these settings by selecting any of the change options given below
first. You can view a summary of the settings by selecting
"Show pre-install summary".
-----------------------------------------------------------------------------
1. Start installation Now
2. Change install directory [ /opt/intel ]
3. Change components to install [ All ]
4. Show pre-install summary
h. Help
b. Back to the previous menu
q. Quit
-----------------------------------------------------------------------------
Please type a selection or press "Enter" to accept default choice [1]:
12. During the prerequisites check the presence of the Yocto Project* Application Development Toolkit 1.1 (ADT) will be checked. If it is not present on your installation you will get a warning message.
The Yocto Project* Application Development Toolkit is required if you want to use the
Intel® Composer XE for building Yocto Project* targeted applications. For automatic
Intel® Composer XE integration with the Application Development Toolkit during
installation, please install Toolkit first and re-check the prerequisites.
If you do not intend to develop applications targeting Yocto Project* builds, you can ignore this warning message.
13. The installation will be finalized and you will be informed when the installation has been completed successfully.
Step no: 6 of 6 | Complete
----------------------------------------------------------------------------
Thank you for installing and for using the
Intel(R) Embedded Software Development Tool Suite for Intel(R) Atom(TM)
processor version 2.3.
Support services start from the time you install or activate your product.
If you have not already done so, please create your support account now to
take full advantage of your product purchase.
Your support account gives you access to free product updates and upgrades
as well as interactive technical support at Intel(R) Premier Support.
To create your support account, please visit the Subscription Services web
site
https://registrationcenter.intel.com/RegCenter/registerexpress.aspx?media=WJP
-----------------------------------------------------------------------------
Intel® JTAG Debugger 2.3 for Intel® Atom™ Processor Installation Guide and Release Notes
9
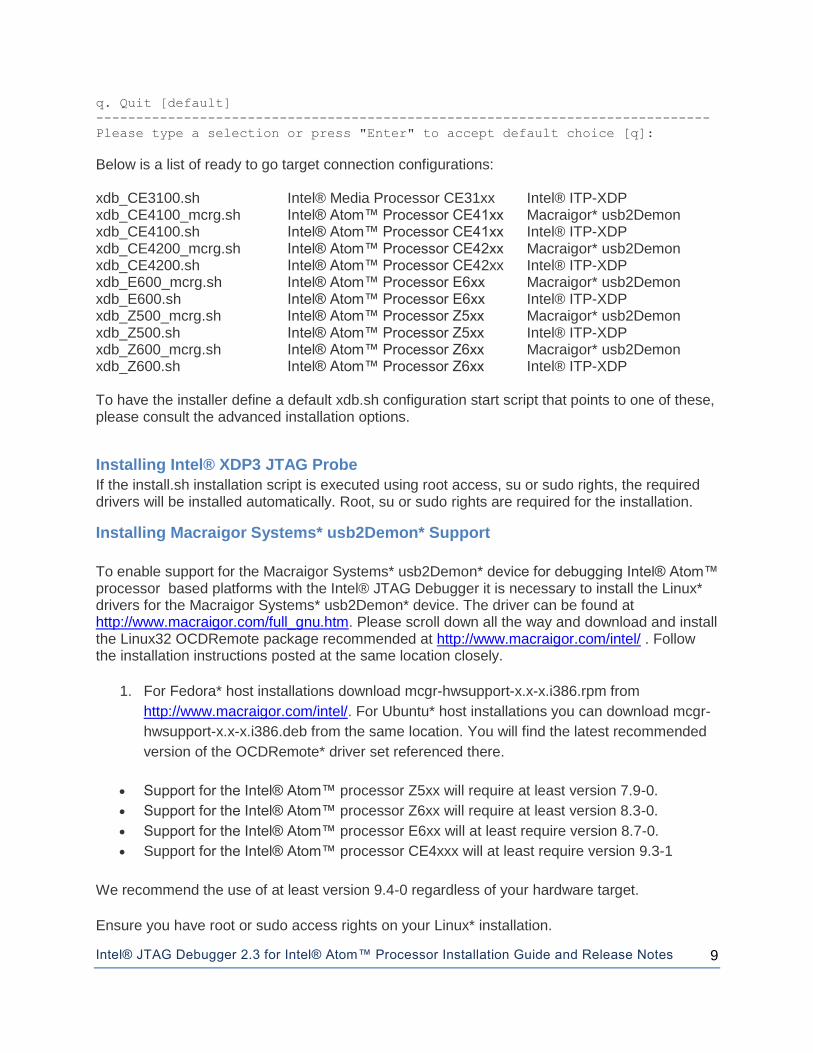
q. Quit [default]
-----------------------------------------------------------------------------
Please type a selection or press "Enter" to accept default choice [q]:
Below is a list of ready to go target connection configurations: xdb_CE3100.sh Intel® Media Processor CE31xx Intel® ITP-XDP xdb_CE4100_mcrg.sh Intel® Atom™ Processor CE41xx Macraigor* usb2Demon xdb_CE4100.sh Intel® Atom™ Processor CE41xx Intel® ITP-XDP xdb_CE4200_mcrg.sh Intel® Atom™ Processor CE42xx Macraigor* usb2Demon xdb_CE4200.sh Intel® Atom™ Processor CE42xx Intel® ITP-XDP xdb_E600_mcrg.sh Intel® Atom™ Processor E6xx Macraigor* usb2Demon xdb_E600.sh Intel® Atom™ Processor E6xx Intel® ITP-XDP xdb_Z500_mcrg.sh Intel® Atom™ Processor Z5xx Macraigor* usb2Demon xdb_Z500.sh Intel® Atom™ Processor Z5xx Intel® ITP-XDP xdb_Z600_mcrg.sh Intel® Atom™ Processor Z6xx Macraigor* usb2Demon xdb_Z600.sh Intel® Atom™ Processor Z6xx Intel® ITP-XDP To have the installer define a default xdb.sh configuration start script that points to one of these, please consult the advanced installation options.
Installing Intel® XDP3 JTAG Probe
If the install.sh installation script is executed using root access, su or sudo rights, the required drivers will be installed automatically. Root, su or sudo rights are required for the installation.
Installing Macraigor Systems* usb2Demon* Support
To enable support for the Macraigor Systems* usb2Demon* device for debugging Intel® Atom™ processor based platforms with the Intel® JTAG Debugger it is necessary to install the Linux* drivers for the Macraigor Systems* usb2Demon* device. The driver can be found at http://www.macraigor.com/full_gnu.htm. Please scroll down all the way and download and install the Linux32 OCDRemote package recommended at http://www.macraigor.com/intel/ . Follow the installation instructions posted at the same location closely.
1. For Fedora* host installations download mcgr-hwsupport-x.x-x.i386.rpm from
http://www.macraigor.com/intel/. For Ubuntu* host installations you can download mcgr-
hwsupport-x.x-x.i386.deb from the same location. You will find the latest recommended
version of the OCDRemote* driver set referenced there.
Support for the Intel® Atom™ processor Z5xx will require at least version 7.9-0.
Support for the Intel® Atom™ processor Z6xx will require at least version 8.3-0.
Support for the Intel® Atom™ processor E6xx will at least require version 8.7-0.
Support for the Intel® Atom™ processor CE4xxx will at least require version 9.3-1
We recommend the use of at least version 9.4-0 regardless of your hardware target.
Ensure you have root or sudo access rights on your Linux* installation.

Intel® JTAG Debugger 2.3 for Intel® Atom™ Processor Installation Guide and Release Notes
10
2. Install mcgr-hwsupport-x.x-x.i386.rpm using the rpm -i command or mcgr-hwsupport-
x.x-x.i386.deb using the dpkg –install command .
3. You should now be able to launch the Intel(R) JTAG Debugger using the respective
xdb_processorname_mcrg.sh startup script. These scripts are being put into the
/opt/intel/atom/xdb/2.3.xxx/bin directory by the tool suite installer as described in the
general installation section above.
For further details on how to configure the OCDRemote* driver set from Macraigor* Systems, please refer to the full installation instructions at http://www.macraigor.com/eclipse/eclipse_faq.htm.
Uninstalling the Debugger
To uninstall, simply go to the bin directory of the debugger component you would like to
uninstall /opt/intel/atom/xdb/2.3.xxx/bin and run the corresponding
uninstall_dbg.sh script you find there.

Intel® JTAG Debugger 2.3 for Intel® Atom™ Processor Installation Guide and Release Notes
11
5 Features
5.1.1 Full Intel LPIA Silicon & Chipset support
Provides an in-depth view into Intel® Atom™ Processor chipsets. Supports silicon specific features, including architectural registers, Intel® Streaming SIMD Extensions 3 (SSE3), as well as Graphics Chipset Register support through JTAG. Graphical representation of peripheral registers and bit fields with online documentation.
5.1.2 Execution Trace Support
Enables viewing of execution history and thus enhances understanding of the flow of an
executed program allowing the analysis of the execution path to find errors and identify the root
cause for exceptions.
5.1.3 OS Awareness / Kernel Module Debugging
The Linux* OS awareness pulldown menu allows visibility of all currently active kernel threads. It also provides the ability to view a list of all currently loaded kernel modules with status information and memory location of initialization methods and cleanup methods. Setting whether to stop the target and commence debugging a kernel module on module load, initialization or cleanup/exit allows to start debugging a kernel module and loading its symbolic information. You can then set your breakpoints at the function entry points of the kernel module you want to debug, release the target using the run command and trigger an event that will cause the breakpoint to be hit to start your actual debug session.
You do not need to select kernel modules that are already loaded, but can add additional kernel module names to the list of kernel modules that are monitored and have the debugger stop at load, initialization or cleanup just as it would with the kernel modules that are already populated in the OS awareness pulldown menu as they were loaded during the Linux* OS boot process.
To debug kernel modules the following steps additional to selecting or adding a kernel module in the module list are necessary.
In a debugger script or in the debugger console window enter the following commands:
SET DIRECTORY "<kernel module path>"
OS "SETDIR \"<kernel module source path>/\""
These two path settings are necessary to enable the automatic source and symbol info mapping upon kernel module load as described above. Please note that the corresponding functionality in the OS Awareness plug-in graphical user interface is currently broken. You will need to use the command window to inform the debugger of the kernel module source path.
To use this feature for runtime loaded kernel module debugging you will need to have the kernel module idbntf.ko running and installed on the target device. The folder

Intel® JTAG Debugger 2.3 for Intel® Atom™ Processor Installation Guide and Release Notes
12
/opt/intel/atom/xdb/2.3.xxx/kernel-modules/idbntf contains code to generate a Linux* kernel module that enables kernel module debugging with the Intel system debugger.
For generation simply transfer these files to your target system and invoke make. This will generate the kernel object idbntf.ko.
To enable module debugging this object has to be loaded prior to starting the debugger via the command insmod idbntf.ko. After finishing the debug session, the module can be unloaded with rmmod idbntf.
5.1.4 FTL Lite NAND Flash Programming on the Intel® Atom™ Processor CE4100
Note- Please see the Platform Support Guide that came with your development kit for more
detailed information about programming the FTL Lite partition in the Intel® Atom™ Processor
CE4100 NAND flash.
The first 66 blocks of the flash memory is reserved as the FTL Lite partition. In this space each
block is written redundantly 8 times per DHG’s spec. In order to minimize user complexity, our
implementation of the FTL Lite partition accounts for these extra copies. However, by doing so,
this requires a minimum read or write size to be 1 block (128 KB).
Addressing
The conversion from FTL Lite partition block number to address is simple however not
straightforward. Since the redundant blocks are not addressable you must divide the block
number by 8 (number of redundant copies) than multiply by block size (128KB). Below is a
formula and table that converts some frequently used block locations. (As described in the
Platform Support Guide)
address = block # / 8 * 0x20000
Data Block
#
Address
MBH and BBT 0 0x 0000
0000
CEFDK 8 0x 0002
0000
Redboot 40 0x 000A
0000
Platform parameters 48 0x 000C
0000
Intel® JTAG Debugger 2.3 for Intel® Atom™ Processor Installation Guide and Release Notes
13
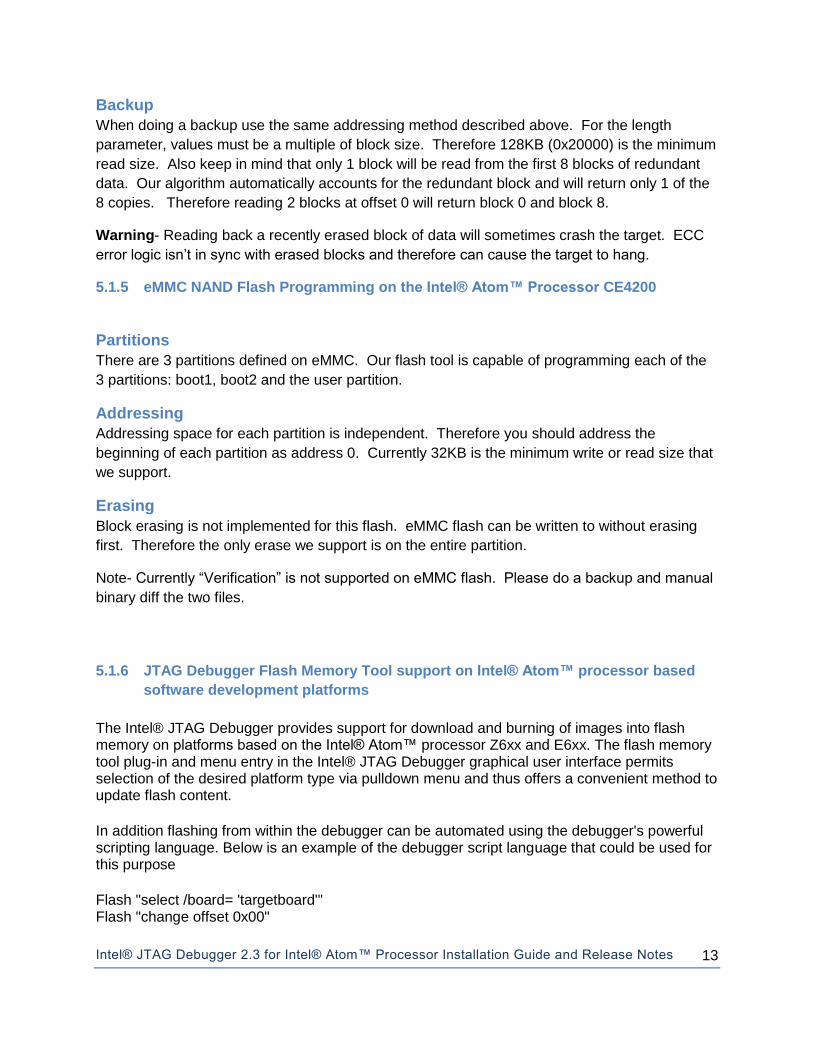
Backup
When doing a backup use the same addressing method described above. For the length
parameter, values must be a multiple of block size. Therefore 128KB (0x20000) is the minimum
read size. Also keep in mind that only 1 block will be read from the first 8 blocks of redundant
data. Our algorithm automatically accounts for the redundant block and will return only 1 of the
8 copies. Therefore reading 2 blocks at offset 0 will return block 0 and block 8.
Warning- Reading back a recently erased block of data will sometimes crash the target. ECC
error logic isn’t in sync with erased blocks and therefore can cause the target to hang.
5.1.5 eMMC NAND Flash Programming on the Intel® Atom™ Processor CE4200
Partitions
There are 3 partitions defined on eMMC. Our flash tool is capable of programming each of the
3 partitions: boot1, boot2 and the user partition.
Addressing
Addressing space for each partition is independent. Therefore you should address the
beginning of each partition as address 0. Currently 32KB is the minimum write or read size that
we support.
Erasing
Block erasing is not implemented for this flash. eMMC flash can be written to without erasing
first. Therefore the only erase we support is on the entire partition.
Note- Currently “Verification” is not supported on eMMC flash. Please do a backup and manual
binary diff the two files.
5.1.6 JTAG Debugger Flash Memory Tool support on Intel® Atom™ processor based
software development platforms
The Intel® JTAG Debugger provides support for download and burning of images into flash memory on platforms based on the Intel® Atom™ processor Z6xx and E6xx. The flash memory tool plug-in and menu entry in the Intel® JTAG Debugger graphical user interface permits selection of the desired platform type via pulldown menu and thus offers a convenient method to update flash content.
In addition flashing from within the debugger can be automated using the debugger's powerful scripting language. Below is an example of the debugger script language that could be used for this purpose
Flash "select /board= 'targetboard'" Flash "change offset 0x00"

Intel® JTAG Debugger 2.3 for Intel® Atom™ Processor Installation Guide and Release Notes
14
Flash "change datafile '/home/demo/BIOS50.bin'" Flash "burn flash false true true"
The same flashing support is also available in form of the command line XFLASH - Intel(R) JTAG Debugger Flash Memory Tool located at /opt/intel/atom/xdb/2.3.xxx/xflash-bin. Please refer to the ./xflash.sh -help option for details about the command line syntax.
XFLASH - Intel(R) JTAG Debugger Flash Memory Tool - Version: 3.3.1 Copyright (c) 2001 - 2010 Intel Corporation. All rights reserved. XFLASH [<options>] -platform <arg> [<image file>] [-(help|?)] print usage [-(platform|p) <arg>] specify the hardware platform [-(erase|e)] erase flash [-(lock|l)] lock flash [-(unlock|ul)] unlock flash [-(check|c)] check that the flash is erased [-(erasecheck|ec)] erase and check that flash is erased [-(verify|v)] verify flash memory after burning [-(verifyonly|vo)] verify flash memory WITHOUT burning [-(special|s) <num>] execute special flash function [-(overwrite|ow)] overwrite existing data [-(fileformat|ff) <arg>] specify image file format [-(offset|o) <num>] image offset [-(flashbase|fb) <num>] flash base address in the target [-(algorithmbase|ab) <num>] burn algorithm address in memory [-(flashname|n) <arg>] select the flash name [-(block|b) <arg>] specify blocks [-(blockdata|bd)] all data blocks [-(blockboot|bb)] all boot blocks
Usage examples: =============== xflash.sh test.bin -platform "target platform"
The "target platform" argument for the -platform option has the format BOARDNAME_FLASHNAME.
Below is a listing of the supported target platform types:
CE4100_NOR
CE4200_EMMC_BOOT1
CE4200_EMMC_BOOT2
CE4200_EMMC_USER
CE4200_NOR
E600_BIOS
MIDZ500_BIOS
MIDZ600_NAND

Intel® JTAG Debugger 2.3 for Intel® Atom™ Processor Installation Guide and Release Notes
15
Below is a brief description of the supported flash types for the specific target platforms:
Intel® Atom™ processor Z6xx
Unprotected NAND flash partition
When choosing an OS Image as data file in the Flash Memory Tool dialog, it automatically analyses the file and writes the OS and OS headers to the correct location in the NAND partition.
Intel® Atom™ procesor E6xx
SPI-FLASH .
Intel® Atom™ Processor CE41xx:
FTL Lite NAND Flash
NOR Flash
Intel® Atom™ Processor CE42xx:
NOR Flash
eMMC NAND Flash
eMMC Boot Partitions
eMMC User Partition
5.1.7 Support for Intel® Atom™ processor Z6xx OS images with the JTAG Debugger
Flash Memory Tool
The Flash Memory Tool for Intel(R) Atom(TM) processor Z6xx supports writing of OS Images to the unprotected NAND flash partition. When choosing an OS Image as data file in the Flash Memory Tool dialog, it automatically analyses the file and writes the OS and OS headers to the correct location in the NAND partition.
1. To use the Flash Memory Tool for the protected NAND partition, the platform must be
booted into the firmware 'shell':
2. Connect a serial cable to the IA SPI0 card
3. Setup HyperTerminal to the following COM settings: 115200 bits per second, 8 data bits,
no parity, 1 stop bit and no flow control
4. Power on the target - Firmware Development Kit (FDK) message and shell prompt
should be displayed in the HyperTerminal screen. If the firmware doesn't stop at the
shell prompt, please refer to your Software Developer Platform (SDP) User Guide:
a. VV platform: Jumper setting J1B1, pins 1-3 are BIOS Option 1 - Diagnostic
Mode - enter shell by default
b. CDK/KDK platform: SW1DB6 - SW1 DIAGNOSTIC ON - OFF = ENABLED: Enter
FDK shell

Intel® JTAG Debugger 2.3 for Intel® Atom™ Processor Installation Guide and Release Notes
16
5. Start the JTAG debugger and open the Flash Memory Tool dialog
5.1.6 Scripting Language Create a batch file based on a rich set of powerful debugging script language commands and execute it in non-interactive mode. Results can be logged and analyzed afterwards.
5.1.7 Page Translation Table Instant and simple resolution and translation between physical and virtual address space.
5.1.8 Unload of Symbol Information
To unload a symbol file, open the Load dialog. Click the “Unload Symbol File” tab and select the
symbol file to be unloaded. This will remove the symbol information from the debug session.
Removing symbol information is useful in order to load different or new symbol information.
5.1.9 Power Events Handling
The debugger can properly handle externally controlled power events without needing to close
the debugger. If a target is reset or powered-off the debugger will identify the “Target power
loss.” Once power is restored the debugger will attempt to halt the target at the reset vector.

Intel® JTAG Debugger 2.3 for Intel® Atom™ Processor Installation Guide and Release Notes
17
6 Usage Notes
6.1.1 Starting the Debugger
To start the Intel® JTAG Debugger for Intel® Atom™ Processor change into the
<install-dir>/atom/xdb/2.3.xxx/bin/ia32/ directory.
From there run the debugger launch shell script that best fits your host-target setup.
Below is a list of ready to go target connection configurations: xdb_CE3100.sh Intel® Media Processor CE31xx Intel® ITP-XDP xdb_CE4100_mcrg.sh Intel® Atom™ Processor CE41xx Macraigor* usb2Demon xdb_CE4100.sh Intel® Atom™ Processor CE41xx Intel® ITP-XDP xdb_CE4200_mcrg.sh Intel® Atom™ Processor CE42xx Macraigor* usb2Demon xdb_CE4200.sh Intel® Atom™ Processor CE42xx Intel® ITP-XDP xdb_E600_mcrg.sh Intel® Atom™ Processor E6xx Macraigor* usb2Demon xdb_E600.sh Intel® Atom™ Processor E6xx Intel® ITP-XDP xdb_Z500_mcrg.sh Intel® Atom™ Processor Z5xx Macraigor* usb2Demon xdb_Z500.sh Intel® Atom™ Processor Z5xx Intel® ITP-XDP xdb_Z600_mcrg.sh Intel® Atom™ Processor Z6xx Macraigor* usb2Demon xdb_Z600.sh Intel® Atom™ Processor Z6xx Intel® ITP-XDP To have the installer define a default xdb.sh configuration start script that points to one of these, please consult the advanced installation options.
The debugger is now running and will establish a debug connection to the powerd-on target device.
6.1.2 Enabling Run-Time Loaded Kernel Module Debugging
To use this feature for runtime loaded kernel module debugging you will need to have the kernel module idbntf.ko running and installed on the target device. The folder /opt/intel/atom/xdb/2.3.xxx/kernel-modules/idbntf contains code to generate a Linux kernel module that enables kernel module debugging with the Intel system debugger.
For generation simply transfer these files to your target system and invoke make. This will generate the kernel object idbntf.ko.
To enable module debugging this object has to be loaded prior to starting the debugger via the command insmod idbntf.ko. After finishing the debug session, the module can be unloaded with rmmod idbntf.
6.1.3 FTL Lite NAND Flash Programming on Intel® Atom™ Processor CE4100

Intel® JTAG Debugger 2.3 for Intel® Atom™ Processor Installation Guide and Release Notes
18
Note- Please see the Platform Support Guide that came with your development kit for more
detailed information about programming the FTL Lite partition in the Intel® Atom™ Processor
CE4100 NAND flash.
The first 66 blocks of the flash memory is reserved as the FTL Lite partition. In this space each
block is written redundantly 8 times per DHG’s spec. In order to minimize user complexity, our
implementation of the FTL Lite partition accounts for these extra copies. However, by doing so,
this requires a minimum read or write size to be 1 block (128 KB).

Intel® JTAG Debugger 2.3 for Intel® Atom™ Processor Installation Guide and Release Notes
19
Addressing
The conversion from FTL Lite partition block number to address is simple however not
straightforward. Since the redundant blocks are not addressable you must divide the block
number by 8 (number of redundant copies) than multiply by block size (128KB). Below is a
formula and table that converts some frequently used block locations. (As described in the
Platform Support Guide)
address = block # / 8 * 0x20000
Data Block
#
Address
MBH and BBT 0 0x 0000
0000
CEFDK 8 0x 0002
0000
Redboot 40 0x 000A
0000
Platform parameters 48 0x 000C
0000
Backup
When doing a backup use the same addressing method described above. For the length
parameter, values must be a multiple of block size. Therefore 128KB (0x20000) is the minimum
read size. Also keep in mind that only 1 block will be read from the first 8 blocks of redundant
data. Our algorithm automatically accounts for the redundant block and will return only 1 of the
8 copies. Therefore reading 2 blocks at offset 0 will return block 0 and block 8.
Warning- Reading back a recently erased block of data will sometimes crash the target. ECC
error logic isn’t in sync with erased blocks and therefore can cause the target to hang.
6.1.4 eMMC NAND Flash Programming on Intel® Atom™ Processor CE4200
Partitions
There are 3 partitions defined on eMMC. Our flash tool is capable of programming each of the
3 partitions: boot1, boot2 and the user partition.
Addressing
Addressing space for each partition is independent. Therefore you should address the
beginning of each partition as address 0. Currently 32KB is the minimum write or read size that
we support.
Intel® JTAG Debugger 2.3 for Intel® Atom™ Processor Installation Guide and Release Notes
20
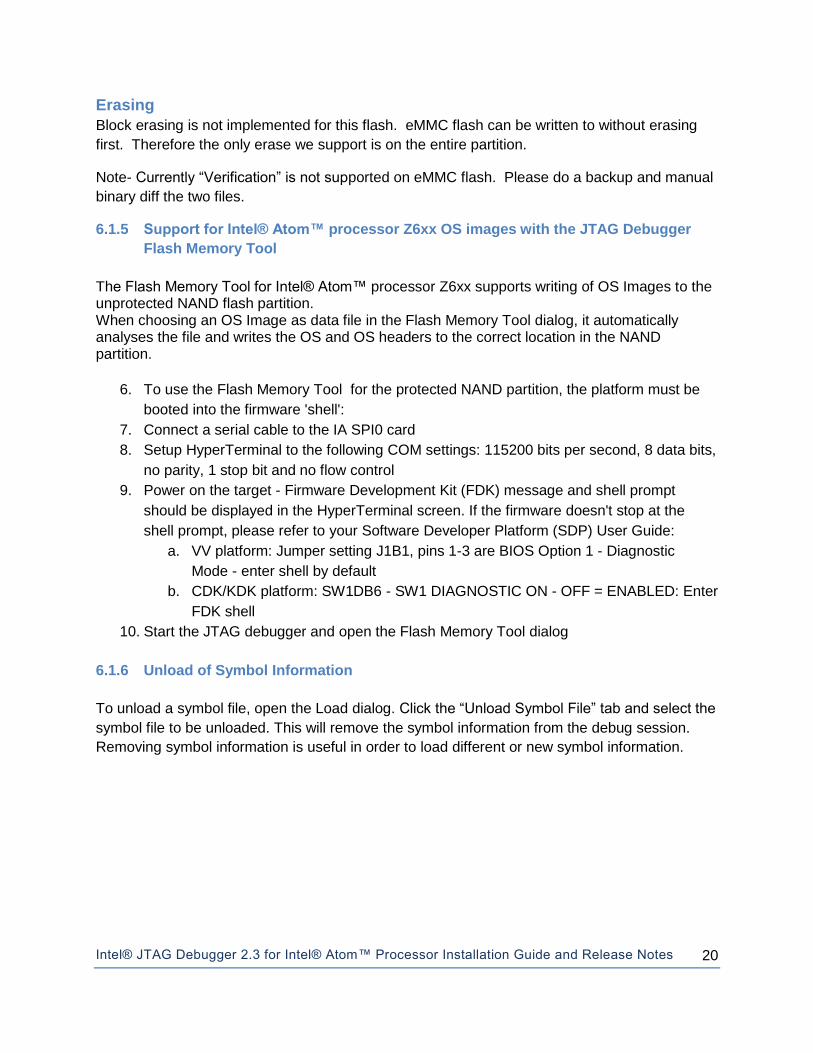
Erasing
Block erasing is not implemented for this flash. eMMC flash can be written to without erasing
first. Therefore the only erase we support is on the entire partition.
Note- Currently “Verification” is not supported on eMMC flash. Please do a backup and manual
binary diff the two files.
6.1.5 Support for Intel® Atom™ processor Z6xx OS images with the JTAG Debugger
Flash Memory Tool
The Flash Memory Tool for Intel® Atom™ processor Z6xx supports writing of OS Images to the unprotected NAND flash partition. When choosing an OS Image as data file in the Flash Memory Tool dialog, it automatically analyses the file and writes the OS and OS headers to the correct location in the NAND partition.
6. To use the Flash Memory Tool for the protected NAND partition, the platform must be
booted into the firmware 'shell':
7. Connect a serial cable to the IA SPI0 card
8. Setup HyperTerminal to the following COM settings: 115200 bits per second, 8 data bits,
no parity, 1 stop bit and no flow control
9. Power on the target - Firmware Development Kit (FDK) message and shell prompt
should be displayed in the HyperTerminal screen. If the firmware doesn't stop at the
shell prompt, please refer to your Software Developer Platform (SDP) User Guide:
a. VV platform: Jumper setting J1B1, pins 1-3 are BIOS Option 1 - Diagnostic
Mode - enter shell by default
b. CDK/KDK platform: SW1DB6 - SW1 DIAGNOSTIC ON - OFF = ENABLED: Enter
FDK shell
10. Start the JTAG debugger and open the Flash Memory Tool dialog
6.1.6 Unload of Symbol Information
To unload a symbol file, open the Load dialog. Click the “Unload Symbol File” tab and select the
symbol file to be unloaded. This will remove the symbol information from the debug session.
Removing symbol information is useful in order to load different or new symbol information.

Intel® JTAG Debugger 2.3 for Intel® Atom™ Processor Installation Guide and Release Notes
21
7 Issues and Limitations
Resolved Issues
7.1.1 Macraigor* usb2Demon now supports reset on Intel® Atom™ processor CE4200
reference platform
With Linux32 OCDRemote v9.0-6 driver it is now possible to trigger a board reset on the Intel®
Atom™ processor CE4200 reference platform from within the debugger. When the Macraigor*
usb2Demon device is connected to the reference board the board will reset.
7.1.2 Macraigor* usb2Demon no longer requires super user rights to establish debug
connection.
Establishing JTAG debug connection with the Intel® JTAG Debugger and the Macraigor* usb2Demon device no longer requires to launch the debugger with super user rights either in a sudo shell or an su shell. Use of the Intel® ITP-XDP device does however still require this.
7.1.3 Disassembly Window now fully support source level breakpoints
Only breakpoints set in the disassembly window are visible in the disassembly window. Active breakpoints set in the source window will not be indicated as such in the disassembly window.
7.1.4 Variable evaluation with DWARF3 and DWARF4 symbol information
The Intel® JTAG Debugger does now have support for debug information based on DWARF3
and DWARF4 standard extensions.
7.1.5 Symbol Browser usage within in dialog windows
When using the Symbol Browser from the Browse... button in dialogs, for example in the Set
Breakpoint dialog, the browser now correctly adds the symbol name into the selection field..
7.1.6 Target Release when Exiting the Debugger
When exiting and closing the debugger while the target platform is halted, the target platform
will be released and resume running mode.
7.1.7 C State handling
The C state of the Intel® Atom™ processor will temporarily disable parts of the processor
including JTAG. The Intel® JTAG Debugger is now able to handle processor C states correctly
and regain full run control as soon as JTAG is powered again.

Intel® JTAG Debugger 2.3 for Intel® Atom™ Processor Installation Guide and Release Notes
22
Known Issues and Limitations
7.1.8 Support for Intel® Atom™ processor bitfield editor register views
To receive information on how to access bitfield editor chipset register views for Intel® Atom™ Processors, please send an email to [email protected] for details.
7.1.9 Online Help for Intel® Debugger has not been updated for this release
The context sensitive help available from within the Intel® Debugger graphical user interface
reflects the status prior to the Intel® Embedded Software Development Tool Suite 2.3 release.
Please consult these release notes and the Getting Started Guide for the latest up-to-date
information.
7.1.10 Debugger puts a Windows file system lock on symbol files
Currently when a Symbol file is loaded in the debugger a file system lock is placed on this file to
prevent other processes from deleting or modifying this file. If this lock is preventing you from
recompiling your program, simply use the Unload feature found in the Load Dialog. Unloading a
symbol file will release the file system lock and allow you to modify or delete the symbol file
without exiting the debugger.
7.1.11 Frequently loading and unloading debug symbols
Reloading symbol information numerous times can cause an “Out of Memory” exception and
crash the debugger. Due to memory leaks, reloading symbol information numerous times
without exiting the debugger can cause the debugger to use more than the allotted 2GB of
memory. This will cause a fatal exception and will crash the debugger. A work around for this
issue is to exit the debugger if the memory usage becomes high.
7.1.12 Maximum number of symbol files
Currently a limitation has been placed on the debugger to only allow one piece of debug
information at a time. Loading multiple symbol files was causing unreliable results. These bugs
will be addressed and this limitation should be lifted in future versions.
7.1.13 Master Flash Header Read/Write not supported for Intel® Atom™ Processor
CE4200
On the Intel® Atom™ Processor CE4200 the Master Flash Header serves as a road map for the contents of flash that are processed by security and host firmware. It contains the location and size of each element in the flash, as well as a list of host firmware images that the security processor will attempt to boot. Currently the flash writer plug-in for the Intel® JTAG Debugger does not support writing or modifying the Master Flash Header.

Intel® JTAG Debugger 2.3 for Intel® Atom™ Processor Installation Guide and Release Notes
23
It is of course possible to use the terminal Master Flash Header commands mfhlist mfhinfo and mfhinit in conjunction with the Intel® JTAG Debugger flash writer plug-in.
mfhlist provides the location of the Master Flash Header entries and where the current platform boot configuration expects the various flash images to be put. It’s output can be used as a guidance for setting the start address when using the flash writer plug-in.
For NOR Non-Trusted Boot and NAND/eMMC Non-Trusted boot can be configured such that target boot is possible even if no Master Flash Header is present on the platform.
eMMC Trusted Boot does require the presence of a Master Flash Header and requires that the actual memory layout does match its contents.
Please read the Platform User Guide closely for further details on the Master Flash Header and its usage.
7.1.14 Intel® Atom™ Processor CE4xxx flashing only supported from GUI
The platform types for the various NAND and NOR flashes on Intel® Atom™ Processor CE4xxx
based platforms are currently not supported by the XFLASH - Intel(R) JTAG Debugger Flash
Memory Tool - Version: 3.3.1 command line flashing tool. Please use the debugger’s graphical
user interface to flash these platforms.
7.1.15 Flash programming with empty flash parts (CE4100, CE4200)
In order for the flash burning algorithm to execute the target must first be restarted and sitting at the reset vector. This is normally handled by the flash plugin. However, on CE4x00 boards that do not have programmed flash parts, the platform’s reset does not function. Therefore, when programming these boards, a manual reset is required. To successfully burn flash on platforms with blank flash, a user should follow these steps:
1) Connect the debugger, and verify that the target is halted 2) Manually reset the target by pressing the reset button on the target
3) Verify that the EIP is not pointing at 0xFFF0 4) Open the flash plugin dialog and resume normal steps to program the flash.
7.1.16 Use of Macraigor* usb2Demon to debug Intel® Atom™ processor CE4xxx based
platforms may require board changes
On some of the Intel reference platforms for Intel® Atom™ processor CE4100 the RefDes serial
resistor R6D20 may need to be replaced with a 0 Ohm resistor. On some of the Intel reference
platforms for Intel(R) Atom(TM) processor CE4200 the RefDes serial resistor R4E5 may need to
be replaced with a 0 Ohm resistor. Please refer to the board schematics and the platform design
guides for details.
7.1.17 Older Macraigor* usb2Demon 60pin connector headers
The reference voltage and signal voltage pins on Macraigor* usb2Demon 60pin connector
headers from prior to September 2010 are connected. Since those two voltages differ from each
other on the Intel® Atom™ Processor E600 reference platform it is strongly recommended to
only use recently purchased Macraigor* usb2Demon 60pin connector headers with these
platforms. Not following this recommendation can damage the reference platform.

Intel® JTAG Debugger 2.3 for Intel® Atom™ Processor Installation Guide and Release Notes
24
7.1.18 Backup of large flash partitions may fail
It is recommended to avoid using the flash writer plug-in to backup large flash partitions
(>200Mb) from the Intel® Atom™ Processor onto the workstation.
7.1.19 Verification of flash content on Intel® Atom™ processor E6xx based platform
Verifying flash content may only be possible immediately after writing it. When the system
boots, it might modify the flash content (e.g. saving changed settings). When the flash content
will be compared to the original file that got written to the flash, the verification will show
differences.
7.1.20 Intel® Media processor CE3100 Support Limitations
The XFLASH – Intel® JTAG Debugger Flash Memory Tool 3.3.2 does currently not support the
Intel® Media processor CE3100. Also On-chip Trace buffer support is not available for the
Intel® Media processor CE3100.
7.1.21 Memory Read using Macraigor* usb2Demon with OCDRemote 9.0-6 slow.
Memory Read access using the Macraigor* usb2Demon with OCDRemote 9.0-6 is slow. It is
recommended to avoid flash backup from within the flash writer GUI plug-in of the Intel® JTAG
Debugger when using this device driver version.
7.1.22 Function and file information not listed for watchpoints in breakpoint window
When setting a data breakpoint (watchpoint) the breakpoint listing in the breakpoint window
does not contain file and function information for the data breakpoint.
7.1.23 Stepping out of kernel module into statically linked code can lead to temporary
debugger stall
When stepping out of a function inside a kernel module into statically link OS kernel code) the
debugger can lose run-control of the target. Halting code execution or single stepping will not
work. Using Ctrl-C with focus on the console window or pressing the button “Send interrupt to
Debugger”will reestablish full target control if this occurs. The recommended workaround is to
use a breakpoint in the kernel source code instead of simply stepping out of a kernel module.
7.1.24 Target doesn't boot when Macraigor* usb2Demon* JTAG device is not initialized
If the Macraigor* probe is connected to the host system the first time, it doesn't get initialized
until a debugger is using the probe. Without initialization the probe, the JTAG pins are in an
undefined state and can prevent the target system from booting. The might lead to unstable
behavior on the target including failing boot sequence. After the debugger has initialized the
probe the target system should boot without problems.
This does not affect the XDP3 connection. XDP3 probe is automatically initialized when it gets
plugged into the host system.
7.1.25 Local variables and evaluation windows do not display multi-dimensional arrays
correctly
Multi-dimensional arrays are displayed as vectors in the debugger's local variables window and
evaluations window suppressing one dimension of the array.
Intel® JTAG Debugger 2.3 for Intel® Atom™ Processor Installation Guide and Release Notes
25
7.1.26 Evaluation window for global variables may be missing type information
When evaluating a global variable in a debugger evaluation window the variable name and it’s
value are displayed, but type information may not be displayed.
7.1.27 On-chip instruction trace window does not update after single step
When single stepping while having instruction trace enabled and the instruction trace window
open the content of the trace window will not be updated with the single step.
7.1.28 Writing to a non-writable vector registers may incorrectly update register value
display
In the vector register window it is possible that a write to a vector register seems to have been
successful, when a new value was entered from within said window, despite the register being
non-writable at the time and not actually having been updated.
7.1.29 Platform watchdog timer may trigger reset when debugging next generation Intel®
Atom™ processor for handset based platforms running release builds of MeeGo*.
After halting target platform execution during a JTAG debug session for several seconds the
platform may automatically enter reset. This may be due to a watchdog timer that needs to be
disabled before debugging the software stack. Please contact technical support for details on
disabling it.
7.1.30 With Intel® Hyper-Threading Technology disabled in BIOS debugger SMP
configuration must be disabled as well when using Macraigor Systems*
usb2Demon*
When Intel® Hyper-Threading Technology is disabled in the BIOS, the debugger SMP
configuration must be turned off as well. The Macraigor System* driver interface returns an
error condition on disabled processor cores that is indistinguishable from other error conditions
for the debugger. If SMP support is disabled, the debugger will not try to access the second
hyper-thread and thus the error condition will not occur.
To disable SMP support please edit xdb.sh in the /opt/intel/atom/xdb/2.x.xxx/bin directory and
change -tgttype 'JTAG IA SMP' to -tgttype 'JTAG IA' in the java launch command line.
With current Macraigor Systems* drivers the above mentioned error condition may rarely also
occur if on an SMP enabled system one hyper-thread is halted during debugger memory
read/write operations.
7.1.31 Root or Sudo Access required for JTAG Debugger Install
To be able to install the Intel(R) JTAG Debugger it is necessary to either launch the tool suite
installation script install.sh with root privileges or to select "install as root" or "install as root using
sudo" during the Intel(R) Embedded Software Development Tool Suite installation process.
Installation without root privileges will not be successful.

Intel® JTAG Debugger 2.3 for Intel® Atom™ Processor Installation Guide and Release Notes
26
7.1.32 Long Upload Time of Debug Information
Load of debug info from large applications or from system libraries (which need to be
transferred from the target to the host) may take a long time although the debugger seems to
have finished the symbol load. For example, in the Console window the debugger prompts quite
quickly that the breakpoint has been reached, in the Source window the source file is displayed
and the yellow arrow is seen at the current position of the breakpoint. However, the load of the
complete symbol info may not yet have finished and the debugger may not yet be ready to
accept new commands (on Console window or with the GUI).
To check whether the debugger has finished symbol load please click into the Console window
and hit the "Enter" key. Once the debugger issues the debugger prompt (idb) it's ready to accept
new commands.
7.1.33 Memory Writes to Un-Initialized Memory
Memory writes to un-initialized or read-only memory (this includes setting software breakpoints
or accessing memory mapped registers) can lead to a crash of the target or a loss of the target
control. The debugger will not prevent these memory accesses when requested by the user
(e.g. changing instructions in the disassembly window).
7.1.34 Kernel Module Source Path Selection Tool
To debug kernel modules the following steps additional to selecting or adding a kernel module
in the module list are necessary.
In a debugger script or in the debugger console window enter the following commands:
SET DIRECTORY "<kernel module path>"
OS "SETDIR \"<kernel module source path>/\""
These two path settings are necessary to enable the automatic source and symbol info mapping
upon kernel module load as described above. Alternatively you may use the corresponding
functionality in the OS Awareness plug-in graphical user interface.
7.1.35 Setting Software Breakpoints during OS Boot
Setting a breakpoint during OS boot without explicitly declaring it to be a hardware breakpoint
(for instants by double clicking on a line in the disassembly window) will lead to a loss of target
control. The debugger tries to modify memory, by setting a software breakpoint, reads it back
and realizes the software breakpoint cannot be set. It will then try to set a hardware breakpoint
instead, but the attempted write access to non-initialized memory may already have corrupted
the platform
The workaround is to force the use of hardware breakpoints for stepping as well by using the
debugger script command:
set option /hard=on

Intel® JTAG Debugger 2.3 for Intel® Atom™ Processor Installation Guide and Release Notes
27
7.1.36 Flash Writer disables pre-existing Breakpoints
Flashing the BIOS will disable all code breakpoints and data breakpoints you may have had set
prior to using the flash writer.

Intel® JTAG Debugger 2.3 for Intel® Atom™ Processor Installation Guide and Release Notes
28
8 Attributions
This product includes software developed at:
The Apache Software Foundation (http://www.apache.org/). Portions of this software were originally based on the following: - software copyright (c) 1999, IBM Corporation., http://www.ibm.com. - software copyright (c) 1999, Sun Microsystems., http://www.sun.com. - the W3C consortium (http://www.w3c.org) , - the SAX project (http://www.saxproject.org) - voluntary contributions made by Paul Eng on behalf of the Apache Software Foundation that were originally developed at iClick, Inc., software copyright (c) 1999. This product includes updcrc macro, Satchell Evaluations and Chuck Forsberg. Copyright (C) 1986 Stephen Satchell. This product includes software developed by the MX4J project (http://mx4j.sourceforge.net). This product includes ICU 1.8.1 and later. Copyright (c) 1995-2006 International Business Machines Corporation and others. Portions copyright (c) 1997-2007 Cypress Semiconductor Corporation. All rights reserved. This product includes XORP. Copyright (c) 2001-2004 International Computer Science Institute
This product includes software licensed from Macraigor Systems, LLC. Copyright (c) 2004-2009, Macraigor Systems LLC. All rights reserved.
This product includes software from the book "Linux Device Drivers" by Alessandro Rubini and Jonathan Corbet, published by O'Reilly & Associates. This product includes hashtab.c. Bob Jenkins, 1996.

Intel® JTAG Debugger 2.3 for Intel® Atom™ Processor Installation Guide and Release Notes
29
9 Disclaimer and Legal Information
INFORMATION IN THIS DOCUMENT IS PROVIDED IN CONNECTION WITH INTEL PRODUCTS. NO LICENSE, EXPRESS OR IMPLIED, BY ESTOPPEL OR OTHERWISE, TO ANY INTELLECTUAL PROPERTY RIGHTS IS GRANTED BY THIS DOCUMENT. EXCEPT AS PROVIDED IN INTEL'S TERMS AND CONDITIONS OF SALE FOR SUCH PRODUCTS, INTEL ASSUMES NO LIABILITY WHATSOEVER, AND INTEL DISCLAIMS ANY EXPRESS OR IMPLIED WARRANTY, RELATING TO SALE AND/OR USE OF INTEL PRODUCTS INCLUDING LIABILITY OR WARRANTIES RELATING TO FITNESS FOR A PARTICULAR PURPOSE, MERCHANTABILITY, OR INFRINGEMENT OF ANY PATENT, COPYRIGHT OR OTHER INTELLECTUAL PROPERTY RIGHT. UNLESS OTHERWISE AGREED IN WRITING BY INTEL, THE INTEL PRODUCTS ARE NOT DESIGNED NOR INTENDED FOR ANY APPLICATION IN WHICH THE FAILURE OF THE INTEL PRODUCT COULD CREATE A SITUATION WHERE PERSONAL INJURY OR DEATH MAY OCCUR. Intel may make changes to specifications and product descriptions at any time, without notice. Designers must not rely on the absence or characteristics of any features or instructions marked "reserved" or "undefined." Intel reserves these for future definition and shall have no responsibility whatsoever for conflicts or incompatibilities arising from future changes to them. The information here is subject to change without notice. Do not finalize a design with this information. The products described in this document may contain design defects or errors known as errata which may cause the product to deviate from published specifications. Current characterized errata are available on request. Contact your local Intel sales office or your distributor to obtain the latest specifications and before placing your product order. Copies of documents which have an order number and are referenced in this document, or other Intel literature, may be obtained by calling 1-800-548-4725, or go to: http://www.intel.com/design/literature.htm
Intel processor numbers are not a measure of performance. Processor numbers differentiate features within each processor family, not across different processor families. Go to: http://www.intel.com/products/processor_number/
MPEG-1, MPEG-2, MPEG-4, H.261, H.263, H.264, MP3, DV, VC-1, MJPEG, AC3, AAC, G.711, G.722, G.722.1, G.722.2, AMRWB, Extended AMRWB (AMRWB+), G.167, G.168, G.169, G.723.1, G.726, G.728, G.729, G.729.1, GSM AMR, GSM FR are international standards promoted by ISO, IEC, ITU, ETSI, 3GPP and other organizations. Implementations of these standards, or the standard enabled platforms may require licenses from various entities, including Intel Corporation.
BunnyPeople, Celeron, Celeron Inside, Centrino, Centrino Inside, Cilk, Core Inside, i960, Intel, the Intel logo, Intel AppUp, Intel Atom, Intel Atom Inside, Intel Core, Intel Inside, Intel Inside logo, Intel NetBurst, Intel NetMerge, Intel NetStructure, Intel SingleDriver, Intel SpeedStep, Intel Sponsors of Tomorrow., the Intel Sponsors of Tomorrow. logo, Intel StrataFlash, Intel Viiv, Intel vPro, Intel XScale, InTru, the InTru logo, InTru soundmark, Itanium, Itanium Inside, MCS, MMX, Moblin, Pentium, Pentium Inside, skoool, the skoool logo, Sound Mark, The Journey Inside, vPro Inside, VTune, Xeon, and Xeon Inside are trademarks of Intel Corporation in the U.S. and other countries.

Intel® JTAG Debugger 2.3 for Intel® Atom™ Processor Installation Guide and Release Notes
30
* Other names and brands may be claimed as the property of others.
Microsoft, Windows, Visual Studio, Visual C++, and the Windows logo are trademarks, or registered trademarks of Microsoft Corporation in the United States and/or other countries.
Java and all Java based trademarks and logos are trademarks or registered trademarks of
Sun Microsystems, Inc. in the U.S. and other countries.
Copyright (C) 2008–2011, Intel Corporation. All rights reserved.