Intel I/O Assessment Tool 2.0 for Windows* · PDF fileIntel® I/O Assessment Tool 2.0 for...
26
® Intel I/O Assessment Tool 2.0 for Windows* Administrator’s Guide February 2016
Transcript of Intel I/O Assessment Tool 2.0 for Windows* · PDF fileIntel® I/O Assessment Tool 2.0 for...
®
Intel I/O Assessment Tool 2.0 for Windows*
Administrator’s Guide
February 2016

Intel® I/O Assessment Tool 2.0 for Windows* Administrator’s Guide February 2016 2 Order Number: xxxxxx-002
Order Number: xxxxxx-002
Contents
INFORMATION IN THIS DOCUMENT IS PROVIDED IN CONNECTION WITH INTEL PRODUCTS. NO LICENSE, EXPRESS OR IMPLIED, BY ESTOPPEL OR OTHERWISE, TO ANY INTELLECTUAL PROPERTY RIGHTS IS GRANTED BY THIS DOCUMENT. EXCEPT AS PROVIDED IN INTEL'S TERMS AND CONDITIONS OF SALE FOR SUCH PRODUCTS, INTEL ASSUMES NO LIABILITY WHATSOEVER AND INTEL DISCLAIMS ANY EXPRESS OR IMPLIED WARRANTY, RELATING TO SALE AND/OR USE OF INTEL PRODUCTS
INCLUDING LIABILITY OR WARRANTIES RELATING TO FITNESS FOR A PARTICULAR PURPOSE, MERCHANTABILITY, OR
INFRINGEMENT OF ANY PATENT, COPYRIGHT OR OTHER INTELLECTUAL PROPERTY RIGHT.
A "Mission Critical Application" is any application in which failure of the Intel Product could result, directly or indirectl y, in personal
injury or death. SHOULD YOU PURCHASE OR USE INTEL'S PRODUCTS FOR ANY SUCH MISSION CRITICAL APPLICATION, YOU SHALL INDEMNIFY AND HOLD INTEL AND ITS SUBSIDIARIES, SUBCONTRACTORS AND AFFILIATES, AND THE DIRECTORS, OFFICERS, AND EMPLOYEES OF EACH, HARMLESS AGAINST ALL CLAIMS COSTS, DAMAGES, AND EXPENSES AND REASONABLE ATTORNEYS' FEES ARISING OUT OF, DIRECTLY OR INDIRECTLY, ANY CLAIM OF PRODUCT LIABILITY, PERSONAL INJURY, OR DEATH ARISING IN ANY WAY OUT OF SUCH MISSION CRITICAL APPLICATION, WHETHER OR NOT INTEL OR ITS
SUBCONTRACTOR WAS NEGLIGENT IN THE DESIGN, MANUFACTURE, OR WARNING OF THE INTEL PRODUCT OR ANY OF ITS
PARTS.
Intel may make changes to specifications and product descriptions at any time, without notice. Designers must not rely on th e
absence or characteristics of any features or instructions marked "reserved" or "undefined". Intel reserves these for future
definition and shall have no responsibility whatsoever for conflicts or incompatibilities arising from future changes to them. The
information here is subject to change without notice. Do not finalize a design with this information.
The products described in this document may contain design defects or errors known as errata which may cause the product to
deviate from published specifications. Current characterized errata are available on request.
Contact your local Intel sales office or your distributor to obtain the latest specifications and before placing your product order.
Copies of documents which have an order number and are referenced in this document, or other Intel literature, may be obtained
by calling 1-800-548-4725, or go to: http://www.intel.com/design/literature.htm
Intel and the Intel logo are trademarks or registered trademarks of Intel Corporation or its subsidiaries in the United States and
other countries.
*Other names and brands may be claimed as the property of others.
Copyright © 2016, Intel Corporation. All rights reserved.
Contents

Intel® I/O Assessment Tool 2.0 for Windows* February 2016 Administrator’s Guide Order Number: xxxxxx-002 3
Contents
1 About This Guide ............................................................................................................................ 5
1.1 Intel® I/O Assessment Tool Overview.................................................................................... 5
1.2 Documentation Conventions ................................................................................................ 5
1.3 Acquiring the Intel® I/O Assessment Tool ............................................................................. 6
1.4 Intel Cache Acceleration Software......................................................................................... 6
2 Product Specifications and System Requirements ............................................................................... 7
2.1 Supported Platforms ........................................................................................................... 7
2.2 System Requirements ......................................................................................................... 7
3 Installation .................................................................................................................................... 9
3.1 Installing the Software ........................................................................................................ 9
3.2 Uninstalling the Software ................................................................................................... 10
4 Using the Intel® I/O Assessment Tool Profiler ................................................................................. 11
5 Using the Intel® I/O Assessment Tool Analyzer ............................................................................... 16
6 Interpreting the Analyzer Results ................................................................................................... 18
Appendix A Glossary........................................................................................................................ 22
Appendix B Server-Side Caching........................................................................................................ 24
Appendix C Include List .................................................................................................................... 25
Appendix D Intel SSD Information ..................................................................................................... 25
Tables Table 1. Supported Platforms .......................................................................................... 7 Table 2. System Requirements ........................................................................................ 7
Revision History
Revision History
Date Revision Description
March 2014 001 Initial release of document.

Intel® I/O Assessment Tool 2.0 for Windows* Administrator’s Guide February 2016 4 Order Number: xxxxxx-002
May 2014 002 Updates for the 1.0 GA.
February 2016 003 Updates for the 2.0 GA.

Intel® I/O Assessment Tool 2.0 for Windows* February 2016 Administrator’s Guide Order Number: xxxxxx-002 5
About This Guide
1 About This Guide
This guide offers the quickest way to install and begin using Intel® I/O Assessment
Tool. This guide assumes users have a basic knowledge of storage and application
management, as well as knowledge of the Microsoft* Windows* Server environment.
1.1 Intel® I/O Assessment Tool Overview
The Intel® I/O Assessment Tool suite will help a user determine if they have an I/O
workload that can benefit from the performance capabilities of the Intel® Cache
Acceleration Software (Intel® CAS) for Windows or the Intel® Cache Acceleration
Software – Workstation (Intel® CAS-W) products. For the purposes of this document,
both products will be referred to as Intel CAS. The tool monitors and records the types
of I/O a system experiences during a user-selectable time period. The tool not only
uses this data to determine if the system can benefit from caching, but it also
determines which files would most benefit from it, thus providing a key piece of
information that can be used to take advantage of two of Intel CAS’s key advantages:
Selective Optimized Caching and Pinning.
Intel® I/O Assessment Tool contains 2 applications:
• The Profiler collects data on I/O that are executed on the system.
o The tool is easy to configure.
o Data is not sent outside of the system.
• The Analyzer takes data from the Profiler to establish if files on the system will benefit from Intel Cache Acceleration use.
o Provides an assessment of the cache-ability of data and determines
specific files to cache.
o Analysis data is not sent outside of the system.
The tool is designed to analyze HDD-based storage solutions. If your system has
already deployed SSDs for storage, you will most likely not realize any performance
benefit from SSD based caching solutions.
1.2 Documentation Conventions
The following conventions are used in this manual:
• Courier font - code examples, command line entries, filenames, directory
paths, and executables.
• Bold text - graphical user interface (GUI) entries and buttons.
About This Guide

Intel® I/O Assessment Tool 2.0 for Windows* Administrator’s Guide February 2016 6 Order Number: xxxxxx-002
1.3 Acquiring the Intel® I/O Assessment Tool
The Intel I/O Assessment Tool is available via the following Intel website:
https://registrationcenter.intel.com/RegCenter/ComForm.aspx?productid=2133
The Intel® I/O Assessment Tool is also available through direct contact with Intel
Corporation. Please contact your Intel Field Application Engineer or Intel Sales Team contacts to get information on how to access the tool.
1.4 Intel Cache Acceleration Software
To learn more about Intel® Cache Acceleration Software go to www.intel.com/cas .

Intel® I/O Assessment Tool 2.0 for Windows* February 2016 Administrator’s Guide Order Number: xxxxxx-002 7
Product Specifications and System Requirements
2 Product Specifications and
System Requirements
2.1 Supported Platforms
Intel® I/O Assessment Tool supports the platforms listed below for 64-bit processors.
Table 1. Supported Platforms
Platform Notes
Windows* Server 2012 R2 64-bit
Windows* Server 2008 R2 64-bit
Windows* 7 64-bit all variations.
Windows* 8.1 64-bit only
Windows* 10 64-bit only
Intel CAS is validated with Windows Server OSs. Intel CAS-W is validated with Windows* 7, 8 and 10.
2.2 System Requirements
The table below lists system requirements for Intel® I/O Assessment Tool.
NOTE: Please ensure that Intel® CAS is NOT installed on the system when running
the Intel® I/O Assessment Tool.
Table 2. System Requirements
Memory 4GB of memory minimum; 8GB or greater recommended
Flash/SSD No Flash Storage is required for this application.
Storage to assess
Primary storage device including SAN, local disk, RAID, iSCSI, or
Fiber Channel, etc.
NAS is currently not supported for the Intel I/O Assessment
Tool.
Drive Usage 10GB minimum drive space for application and data files.

Intel® I/O Assessment Tool 2.0 for Windows* Administrator’s Guide February 2016 8 Order Number: xxxxxx-002
Application Support
.NET Framework version 4.0 or higher is required.
Visual C++ Redistributable for Visual Studio 2012 Update 4 is
required.
.NET 4.0 or higher is required for the software to work properly. This package can be
found in the link below and installed on the system.
http://www.microsoft.com/en-us/download/details.aspx?id=17718
Product Specifications and System Requirements
NOTE: If the system is not able to connect to the internet:
• Download the Microsoft .NET Framework (Standalone Installer) from a system that
can access the Microsoft website.
• Copy the package to the system and install the package per Microsoft’s
instructions.
Visual C++ Redistributable for Visual Studio 2012 Update 4 package is required for the
software to work properly. This package can be found in the link below and installed on
the system.
http://www.microsoft.com/en-us/download/details.aspx?id=30679
NOTE: If the system is not able to connect to the internet:
Save the executable file from the link above.
• Copy it to the system and install the package per Microsoft’s instructions.

Intel® I/O Assessment Tool 2.0 for Windows* February 2016 Administrator’s Guide Order Number: xxxxxx-002 9
Installation
3 Installation
This installation guide describes how to invoke the automated installer and describes the default settings.
3.1 Installing the Software
1. Ensure that the Microsoft*software packages identified in the previous section
have been installed properly.
2. Make the installation file with the name format “ioat-02.xx.xx.xxxx.exe”
available to the system on which it is to be installed on.
3. Double click the file and follow the prompts.
4. Click Next to continue installation.
Installation
5. The terms of the license agreement must be accepted in order for the program to
install.

Intel® I/O Assessment Tool 2.0 for Windows* Administrator’s Guide February 2016 10 Order Number: xxxxxx-002
6. Once installation is complete, continue to Chapter 4 to configure and use the
software.
Installation
3.2 Uninstalling the Software
To uninstall the Intel® I/O Assessment Tool use the following steps:
1. Open “Control Panel” from the Windows Start menu.
2. Click on “Uninstall a Program”.
3. Select the Intel I/O Assessment Tool Application as shown below.

Intel® I/O Assessment Tool 2.0 for Windows* February 2016 Administrator’s Guide Order Number: xxxxxx-002 11
4. You may also uninstall the .NET Framework and the Visual C++
Redistributable for Visual Studio 2012 Update 4 package, if they are not
required in the system.
Using the Intel® I/O Assessment Tool Profiler
4 Using the Intel® I/O Assessment
Tool Profiler
Please read all instructions prior to running the assessment tool. The following
information will be useful to have prior to configuring the tool:
• Information on what drive, folder, and/or files are to be profiled to assess any
caching benefit.
• Information on the storage device to be used to log information the tool uses to
profile.
NOTE: The tool must be run with Administrator privileges. This can be done by:

Intel® I/O Assessment Tool 2.0 for Windows* Administrator’s Guide February 2016 12 Order Number: xxxxxx-002
• Pressing the “Shift” key while pressing the right mouse button over the icon
for the tool.
• Pressing the “Run as administrator” option with the left mouse button.
NOTE: For Windows 7 users pressing the “Shift” key is not required. Place, the
mouse pointer over the application and right click to show the option to “Run as
administrator”.
1. The Intel® I/O Assessment Tool Profiler can be found by following this path:
Start -> All Programs -> Intel Corporation -> Intel IO Assessment Tool -> Intel
IO Assessment Tool Profiler.
NOTE: Remember to select “Run as administrator” before launching the software.
Using the Intel® I/O Assessment Tool Profiler

Intel® I/O Assessment Tool 2.0 for Windows* February 2016 Administrator’s Guide Order Number: xxxxxx-002 13
2. Set directory for output file:
a. This the directory in which the tool will save the data
it collects on I/O. A default location has already
been specified. You may change this location as
needed.
3. Set the Duration for the tool to run:
a. Set the duration for a time length that will best represent the usage
you want to profile. You have a choice between 6, 12, and 24 hour
durations.
b. Ideally you’d like to run the application as long as possible, to get the
best profile of I/O traffic. The tool will collect up to 10 GB of data
regardless of run time.
NOTE: The output files for the Intel® IO Assessment Tool Profiler can grow rapidly
depending on amount of IO being run on the system and the length of time allowed for
the profiling. The tool will display a message and stop the service if drive space
becomes limited. The files used can be deleted by the user once the analysis has been
completed.
4. Update what files to monitor by updating the Include List.
The “Include List” is a key function that enables the Selective Optimized Caching
and Pinning features of Intel CAS. It allows a user to focus the cache space to
items important to accelerate. For more information on the “Include List” and
these key features of Intel CAS, please refer to Appendix C.
a. The tool requires that the user specify which drives, directories, or files
and any combination thereof to be profiled.
b. Press the “Include List” button to enter what is to be profiled.
Using the Intel® I/O Assessment Tool Profiler
c. There are 3 ways to add what files the tool will profile.
1. “Add directory” will allow a user to select a directory that the user wishes to profile. Please keep in mind that the tool
recursion of the directory structure. Automatically, any subdirectories will be included.
2. “Add file” will allow a user to select a specific file to be profiled.
A user can select only a single file with this option.
3. “Add wildcard” will allow a user to enter in free text that
specifies the types of files to be profiled. It is valid to specify a file that may not exist yet. It is valid to enter in a wild card
pattern without a drive letter. The use of the wildcard character “*” is allowed.
Examples of valid wildcard use:
c:\*, d:\*.*, d:\*.db, d:\hot*.db, *.db
d. Items can be removed from the include list by highlighting the line item
to be removed and pressing the “Remove Selected” button.

Intel® I/O Assessment Tool 2.0 for Windows* Administrator’s Guide February 2016 14 Order Number: xxxxxx-002
e. Once the include list has all the directories or files that a user wants to
profile, press the “Apply” button to save the list to the tool. If you wish not the save the list, press the “Cancel” button to exit this dialog box
without saving the latest changes.
NOTE: The include list will not profile any files in the Windows directory and
Intel I/O Assessment Tool Program Files directory. Additionally, the tool will
Using the Intel® I/O Assessment Tool Profiler
not profile any executable files and dynamically link libraries (DLLs) regardless
of file location.
5. Press the “Start” button and use the system as normal to get an accurate profile of the I/O workload.
6. If for any reason the profiling needs to be stopped, pressing the “Stop” button will
stop the data collection and save any data collected up to that point.

Intel® I/O Assessment Tool 2.0 for Windows* February 2016 Administrator’s Guide Order Number: xxxxxx-002 15

Intel® I/O Assessment Tool 2.0 for Windows* Administrator’s Guide February 2016 16 Order Number: xxxxxx-002
Using the Intel® I/O Assessment Tool Analyzer
5 Using the Intel® I/O Assessment
Tool Analyzer
The Intel® I/O Assessment Tool Analyzer takes log files saved by the Profile tool and
analyzes the information to assess if the data profiled would benefit from the Intel®
Cache Acceleration Software product.
1. The Intel® I/O Assessment Tool Analyzer can be found by following this path:
Start -> All Programs -> Intel Corporation -> Intel IO Assessment
Tool -> Intel IO Assessment Tool Analyzer.
2. In the box titled “SSD Configuration” you will need to select a potential SSD
that you may use for caching purposes. Pick the SSD most closely matches the
SSD device you’d be interested in using, as this selection will be used to
determine the amount of performance gain you can expect from that caching
device. Basic I/Os per Second (IOPS) for the possible selections are provided.
If more information on the Intel® SSDs is required, please refer to Appendix D.
NOTE: No caching SSD is required for the use of this tool.
The user interface will look like the picture below.
Intel® I/O Assessment Tool 2.0 for Windows* February 2016 Administrator’s Guide Order Number: xxxxxx-002 17
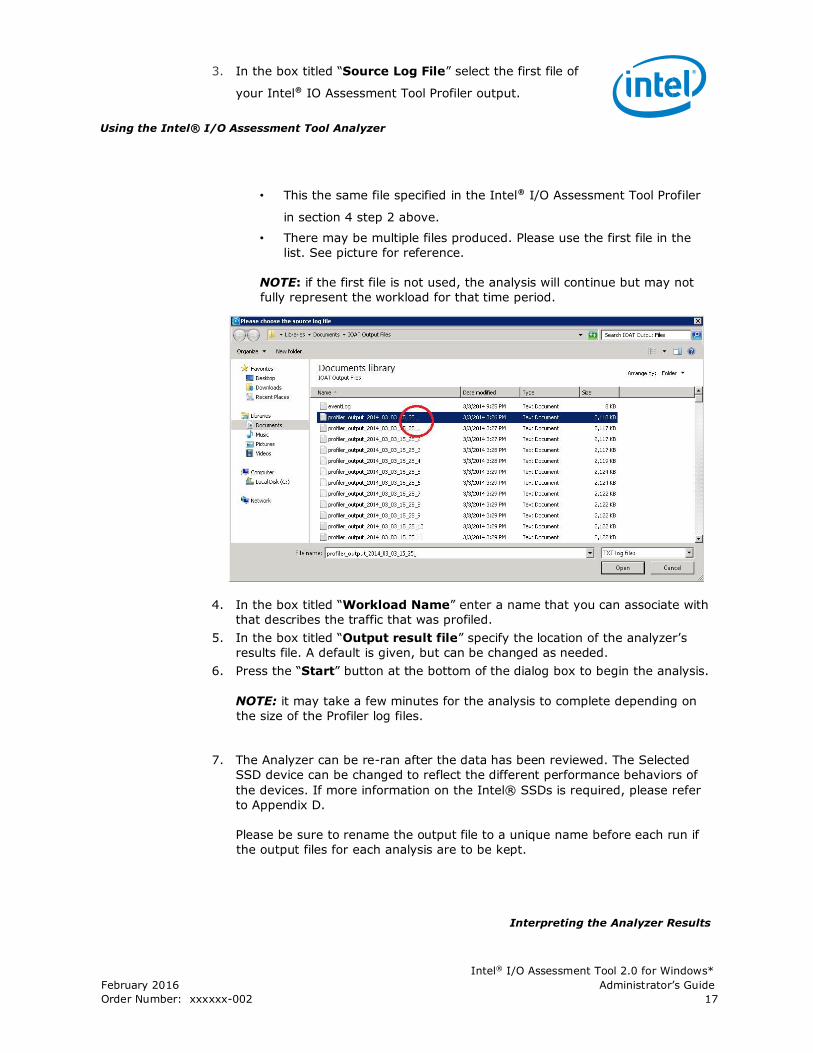
3. In the box titled “Source Log File” select the first file of
your Intel® IO Assessment Tool Profiler output.
Using the Intel® I/O Assessment Tool Analyzer
• This the same file specified in the Intel® I/O Assessment Tool Profiler
in section 4 step 2 above.
• There may be multiple files produced. Please use the first file in the
list. See picture for reference.
NOTE: if the first file is not used, the analysis will continue but may not
fully represent the workload for that time period.
4. In the box titled “Workload Name” enter a name that you can associate with
that describes the traffic that was profiled.
5. In the box titled “Output result file” specify the location of the analyzer’s
results file. A default is given, but can be changed as needed.
6. Press the “Start” button at the bottom of the dialog box to begin the analysis.
NOTE: it may take a few minutes for the analysis to complete depending on
the size of the Profiler log files.
7. The Analyzer can be re-ran after the data has been reviewed. The Selected
SSD device can be changed to reflect the different performance behaviors of
the devices. If more information on the Intel® SSDs is required, please refer
to Appendix D.
Please be sure to rename the output file to a unique name before each run if
the output files for each analysis are to be kept.
Interpreting the Analyzer Results
Intel® I/O Assessment Tool 2.0 for Windows* Administrator’s Guide February 2016 18 Order Number: xxxxxx-002
6 Interpreting the Analyzer Results
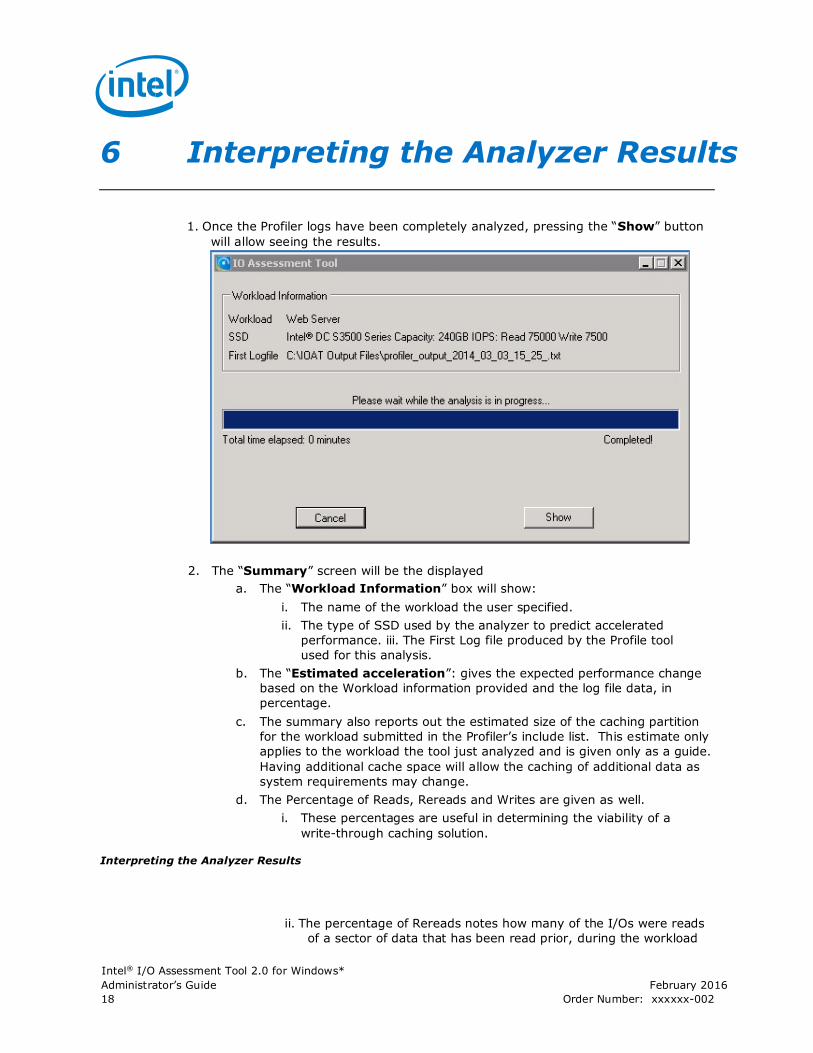
1. Once the Profiler logs have been completely analyzed, pressing the “Show” button
will allow seeing the results.
a. The “Workload Information” box will show:
i. The name of the workload the user specified.
ii. The type of SSD used by the analyzer to predict accelerated
performance. iii. The First Log file produced by the Profile tool
used for this analysis.
b. The “Estimated acceleration”: gives the expected performance change
based on the Workload information provided and the log file data, in
percentage.
c. The summary also reports out the estimated size of the caching partition
for the workload submitted in the Profiler’s include list. This estimate only
applies to the workload the tool just analyzed and is given only as a guide.
Having additional cache space will allow the caching of additional data as
system requirements may change.
d. The Percentage of Reads, Rereads and Writes are given as well.
i. These percentages are useful in determining the viability of a
write-through caching solution.
Interpreting the Analyzer Results
ii. The percentage of Rereads notes how many of the I/Os were reads
of a sector of data that has been read prior, during the workload
2. The “ Summary ” screen will be the displayed

Intel® I/O Assessment Tool 2.0 for Windows* February 2016 Administrator’s Guide Order Number: xxxxxx-002 19
profile time period. The higher this number is,
the greater the efficient use of a write-through
cache.
3. Pressing the “Detail” button in the summary screen will provide a greater
breakdown of the analysis.
a. The “Workload Information” box will show:
i. The name of the workload the user specified.
ii. The type of SSD used by the analyzer to predict accelerated
performance.
iii. The first log file produced by the Profile tool used for this
analysis.
b. The “Workload Summary” box will show the statistics for the complete
profile period.
NOTE: The following results can be affected by what files are specified in
the “include” list of the Profiler and the amount of time the Profiler is ran.
This box shows the following statistics:
i. System Read Time – the amount of time the host system spent reading files. ii. System Write Time – the amount of time the
host system spent writing files. iii. System Read Time % – the
percentage of total host system time spent reading files. Interpreting the Analyzer Results
iv. System Write Time % – the percentage of total host system time
spent writing files.
v. CAS Read Time – the amount of time estimated to be spent by CAS performing reads.

Intel® I/O Assessment Tool 2.0 for Windows* Administrator’s Guide February 2016 20 Order Number: xxxxxx-002
vi. CAS Write Time – the amount of time estimated to be spent by CAS performing writes. vii. CAS Reread Time – the amount of time
estimated to be spent by CAS reading information already on the
SSD.
NOTE: A Reread is the read of a sector of data that has been accessed
prior, during the workload profile time period.
c. The “Read Intensive Files” box will show the I/O breakdown of specific
files that could benefit from caching. This box shows the following
statistics:
i. “Reads” indicates the total reads performed on this file
ii. “Writes” indicates the total writes performed on this file
iii. “Rereads” shows the number of reads that were for the same data
from a previous I/O for this file.
iv. Read Time % – the percentage of total CAS IO time estimated to be spent performing reads.
v. Write Time % – the percentage of total CAS IO time estimated to be
spent performing writes. vi. Reread Time % – the percentage of total CAS IO time estimated to be spent reading information already
on the SSD. vii. “Recommended” indicates whether or not this file would benefit
from the use of Intel CAS.
viii. “Improvement” indicates what the expected acceleration benefit
would be, in %.
Interpreting the Analyzer Results

Intel® I/O Assessment Tool 2.0 for Windows* February 2016 Administrator’s Guide Order Number: xxxxxx-002 21
4. Clicking the “Detail” button in the “Read Intensive Files” box will display a histogram
that breaks down the I/O analysis for that specific file even further. In this view the
file broken up into separate units called chunks. It allows the tool to break down the file into small pieces that can show how reads and writes are distributed across the
file.
a. The first section of the dialog box will show what percentage of the chunks of
that file fit within four categories:
i. Cold – represents I/O which has 25% or less reads.
ii. Somewhat warm – represents I/O that has between 25% and 50% reads.
The “Cold” and “Somewhat warm” categories represent a workload
that will not benefit from a write-through cache.
iii. Warm – represents I/O that has between 50% and 75% reads. iv. Hot – Represents I/O that has over 75% reads.
The Warm and “Hot” categories represent a workload that may
benefit from a write-through cache.
b. The second section graphically represents the number of reads and writes for
the file across all the chunks of data that make up that file. Interpreting the Analyzer Results

Intel® I/O Assessment Tool 2.0 for Windows* Administrator’s Guide February 2016 22 Order Number: xxxxxx-002
c. The third section shows the number of reads and writes for each individual chunk. The heads for this table are described below:
1. The chuck length represents the size of the chunk that represents a
section of the file.
2. The number of reads for the specific chunk
3. The number of writes for the specific chunk.
4. A unique number representing a specific chuck.
Glossary
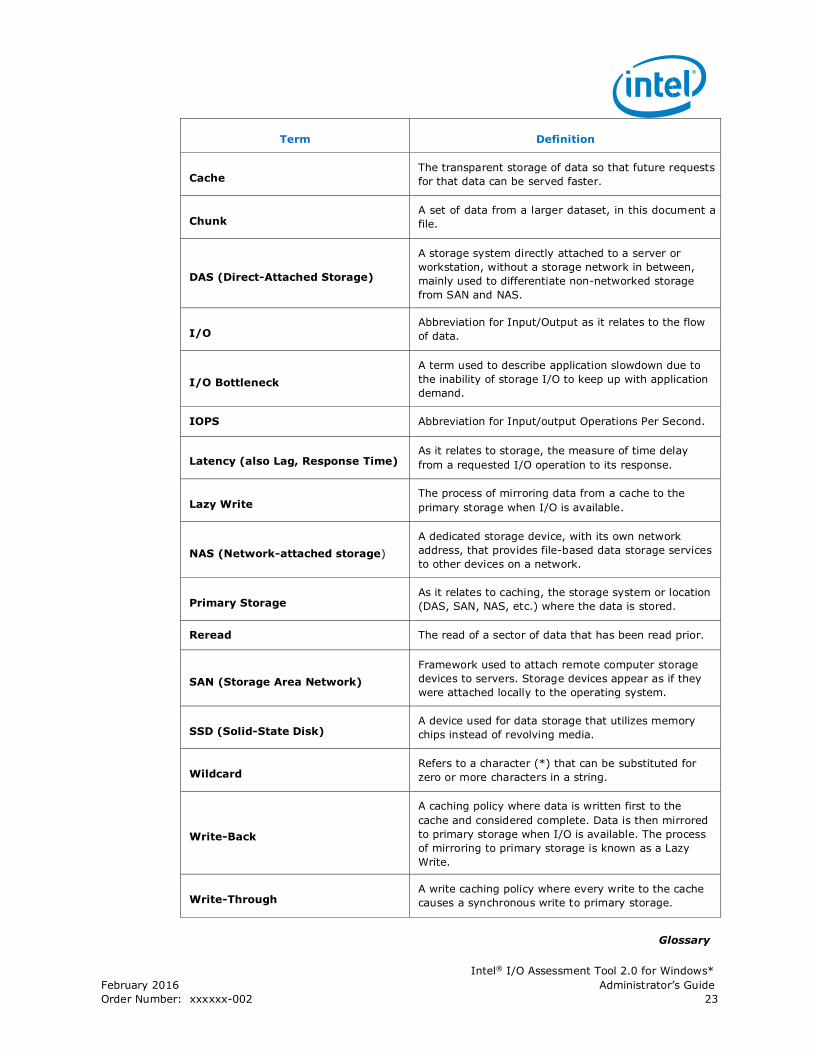
Appendix A Glossary
Intel® I/O Assessment Tool 2.0 for Windows* February 2016 Administrator’s Guide Order Number: xxxxxx-002 23
Term Definition
Cache The transparent storage of data so that future requests
for that data can be served faster.
Chunk A set of data from a larger dataset, in this document a
file.
DAS (Direct-Attached Storage)
A storage system directly attached to a server or
workstation, without a storage network in between,
mainly used to differentiate non-networked storage
from SAN and NAS.
I/O Abbreviation for Input/Output as it relates to the flow
of data.
I/O Bottleneck
A term used to describe application slowdown due to
the inability of storage I/O to keep up with application
demand.
IOPS Abbreviation for Input/output Operations Per Second.
Latency (also Lag, Response Time) As it relates to storage, the measure of time delay
from a requested I/O operation to its response.
Lazy Write The process of mirroring data from a cache to the
primary storage when I/O is available.
NAS (Network-attached storage)
A dedicated storage device, with its own network
address, that provides file-based data storage services
to other devices on a network.
Primary Storage As it relates to caching, the storage system or location
(DAS, SAN, NAS, etc.) where the data is stored.
Reread The read of a sector of data that has been read prior.
SAN (Storage Area Network)
Framework used to attach remote computer storage
devices to servers. Storage devices appear as if they
were attached locally to the operating system.
SSD (Solid-State Disk) A device used for data storage that utilizes memory
chips instead of revolving media.
Wildcard Refers to a character (*) that can be substituted for
zero or more characters in a string.
Write-Back
A caching policy where data is written first to the
cache and considered complete. Data is then mirrored
to primary storage when I/O is available. The process
of mirroring to primary storage is known as a Lazy
Write.
Write-Through A write caching policy where every write to the cache
causes a synchronous write to primary storage.
Glossary

Intel® I/O Assessment Tool 2.0 for Windows* Administrator’s Guide February 2016 24 Order Number: xxxxxx-002
Appendix B Server-Side Caching
Server-side caching involves creating a copy of frequently accessed data on fast
storage media (Flash/SSD) to improve application performance. Back-end data is not
moved or changed, so the enterprise data model (backups, snapshots, etc.) is
unaffected.
Caching can dramatically increase I/O performance. However, the effective application
performance gain depends on the following characteristics of the application workload:
Application must be I/O Bound
Database driven applications are typically restricted by the speed at which they can
access data (aka: the I/O Bottleneck). This shows up as low CPU utilization and high
disk access and/or increased disk queue. Conversely, if the application is held back
waiting for CPU time, then caching will not help.
Percentage of Read Operations
Intel® CAS for Windows is a read cache, meaning that only reads of data are
accelerated. Writes are done in tandem to the cache and to the data storage to assure
data integrity. Therefore, the higher the percentage of reads, the higher the maximum
performance gain from caching.
Transactional databases average about 65% reads, which makes the maximum
performance gain 3X. 80% reads can get 5X gain, 90% can get 10X.
Concentration of Active Data
The size of the active data set and how often the same data is re-read determines the
amount of benefit that Intel® CAS provides. The industry rule-of-thumb is that 10% of
data is active at any given time, meaning the cache device should be a tenth the size
of the back-end data set.
Important: The active data set must be larger than the amount of available
DRAM on the application server in order for server-side caching to provide benefit.
Most real-world application workloads have “hot spots” of data (also known as: data
locality), meaning that if a particular dataset is accessed, then it is likely to be
accessed again in the near future. Locality can be difficult to see with some I/O test
tools which perform purely random reads across the entire back-end dataset.
Glossary
Intel® I/O Assessment Tool 2.0 for Windows* February 2016 Administrator’s Guide Order Number: xxxxxx-002 25
Appendix C Include List
Two key features of Intel Cache Acceleration Software are Selective Optimized Caching
and Pinning, allowing administrators to target storage performance directly to the
applications and data that add the most value to the company. Both Selective
Optimized Caching and Pinning are managed through the Include List.
The Include List feature has been provided in the Intel I/O Assessment Tool to allow a
way to show the benefits of Selective Optimized Caching and Pinning without deploying
the caching software and installing an SSD. During the use of the Intel I/O
Assessment Tool, the user can specify what drives, directories, types of files, or
specific files they would cache. The tool will monitor the use of these entities and
provide an assessment of the possible performance improvements when using Intel
CAS and an SSD. The user can also use this information to take advantage of Intel
CAS’s Selective Optimized Caching and Pinning features. More details of these
features are provided below.
Selective Optimized Caching
• Industry unique policy management focuses performance to the applications
that directly impact the business
• Focusing the cache to just the important apps/data means the cache is more
aligned to the application, increasing performance through increased cache
hits.
• Protects the cache from I/O from other applications or system processes (such
as virus scans or indexing) that would otherwise evict data from cache that is
keeping your highest value applications performance at best speed.
Pinning
• Allows a portion of the cache space to keep important data resident in the
cache. Pinning over-rides normal promotion and eviction, placing the data
immediately in the cache and retaining it until it is un-pinned. The remaining
cache space is utilized normally.
• Data can be pinned permanently (for example, for master database tables) or
temporarily (for example, to accelerate upcoming projects).
Glossary
Appendix D Intel SSD
Information

Intel® I/O Assessment Tool 2.0 for Windows* Administrator’s Guide February 2016 26 Order Number: xxxxxx-002
Intel Cache Acceleration Software supports any flash/SSD device that is supported by
the operating system platform. Intel CAS is end-to-end validated with the Intel SSD
data center family (including Intel SSD DC S3700 and S3500 Series, and Intel SSD
910 Series):
Intel® 910 Series Intel® DC S3700
Series Intel® DC S3500
Series
IOPS 180K/75K Random R/W IOPS1
75K/36K Random R/W IOPS2
75K/11.5K Random R/W IOPS2
Endurance High Endurance (Up
to 14.6PB*) High Endurance (Up to 14.6PB*)
Standard Endurance (Up
to 450TB*)
Protection Power safe write cache saves data to SSD and prevents
data corruption during unsafe shutdown or unexpected
loss in power
For more information go to: www.intel.com/ssd
1Read and Write IOPS (Full LBA Range, Iometer* Queue Depth 32 per NAND module) Default/Max Performance mode: — Random
4 KB reads: Up to 180,000 IOPS; — Random 4 KB writes: Up to 75,000 IOPS
2 4K Random Reads As measured by Intel:100GB 4K Random Writes QD=1 at 99.9 %of the time across 100% span of the drive Configuration: Intel DH67CFB3; CPU i5 Sandy Bridge i5-2400S LGA1155 2.5GHz 6MB 65W 4 cores CM8062300835404; Heatsink: HS - DHA-B LGA1156 73W Intel E41997-002 and E97379-001; Memory: 2GB 1333 Unbuf non-ECC DDR3 ; 250GB HDD 2.5in SATA 7200RPM Seagate ST9250410AS Momentus 3Gb/s; Mini-ITX Slim Flex w/PS Black Sentey 2421; Ulink Power Hub;
SATA Data and Power Combo 24 in. Orange EndPCNoise Sata fp7lp4
*Based on 800GB SKU