Integration of Taxanes in the Management of Breast Cancer Jean-Marc A. Nabholtz, MD, MSc Professor...
46
Integration of Taxanes in the Management of Breast Cancer Jean-Marc A. Nabholtz, MD, MSc Professor of Medicine, Univ. of California at Los Angeles Director, Cancer Therapy Development Program Director, Solid Tumor Program, Jonsson Comprehensive Cancer Center, UCLA Chairman, CIRG and BCIRG
-
Upload
vanesa-nacke -
Category
Documents
-
view
229 -
download
5
Transcript of Integration of Taxanes in the Management of Breast Cancer Jean-Marc A. Nabholtz, MD, MSc Professor...

Integration of Taxanes in the Management of Breast Cancer
Jean-Marc A. Nabholtz, MD, MSc
Professor of Medicine, Univ. of California at Los AngelesDirector, Cancer Therapy Development Program
Director, Solid Tumor Program, Jonsson Comprehensive Cancer Center, UCLAChairman, CIRG and BCIRG

Development of Chemotherapy Breast Cancer
• Before anthracyclines• CMF, CMFVP
• With anthracyclines• Combinations: AC, FAC, AVCMF, FEC, CEF• Sequence and Alternating (Milan A & B)• Dose intensity,dose density, HDCT
• Taxanes (Paclitaxel/Docetaxel)• Sequential: A T C or AC T • Combinations: TA, TAC
• Biologic Modifiers (Herceptin)• Integration in chemotherapy strategies
1970s1970s
1980s1980s
1990s1990s
2000s2000s

Chemotherapy Drug Development
NEW SINGLE AGENTNEW SINGLE AGENT
2nd LINE
1st LINE
ADJUVANT
NEW COMBINATIONS
NEW COMBINATIONS

Drug Year of publication
CR + PR (%)
Taxotere (75-100mg/m²) 1993 - 95 48 - 68 Taxol (175 - 250 mg/m² : 3-24hr) 1991 - 95 29 - 63 Doxorubicin (60-75mg/m²) 1974 - 94 43 - 54 Capecitabine 1995 - 99 35 - 50 Navelbine 1992 - 94 30 - 41 Gemcitabine 1995 - 97 25 - 37 Carboplatin 1985 - 93 7 - 35 Cisplatin 1978 -88 9 - 50 Cyclophosphamide 1959 - 68 36 Fluorouracil 1961 - 81 28 Methotrexate 1952 - 81 26 Mitomycin C 1976 - 85 32
Single agents First-line breast cancer
Vogel CL, Nabholtz Oncologist 1999; 4: 17-33.Nabholtz et al. Exp. Opin Pharmacother 2000; 1: 187-206.

Adjuvant Chemotherapy Breast Cancer
1990s-2000s: Emergence of Taxanes
• Paclitaxel and Docetaxel
• Differences accounting for existing adjuvant strategies
• Ratio efficacy / toxicity / practicality
• Ability to integrate with anthracyclines
• Synergism with Herceptin

Paclitaxel Phase II Metastatic Breast Cancer
Studies Pts RR
• First-Line: • 3 Hour-infusion 6 273 46%
(175-250 mg/m2) (32-60)
• 24 Hour-infusion 3 59 50%(135-250 mg/m2) (32-62)
• Second-line:• 3 Hour-infusion 6 202 25%
(135-250 mg/m2) (6-42)
• 24 Hour-infusion 6 273 46%(175-250 mg/m2) (24-33)
• 96 Hour-infusion 2 53 39%(125-140 mg/m2) (30-48)

RANDOMIZED PHASE II TRIALS PACLITAXEL (P) METASTATIC BREAST CANCER
TTF or TTP Overall Survival
Patients ORR (%) Median Months Median Months
Study Design (nb) P value P value P value
Nabholtz et al P 135 mg/m2 471 22 3 10.5 1993/JCO 1996 vs
P 175 mg/m2 29 4.2 11.7 Schedule: 3 hr infusion NS .02 NS
Peretz et al P as 3-hr infusion 521 29 No difference NAECCO 95 vs P as 24-hr infusion 31 NA
NS Dose: 175 mg/m2
Winer et al P 175 mg/m2 475 21 3.8 9.8ASCO 98 vs
P 210 mg/m2 28 4.1 11.8 vs P 250 mg/m2 22 4.8 11.9 Schedule: 3-hr infusion NS .03 NS

RANDOMIZED PHASE II TRIALS PACLITAXEL (P) METASTATIC BREAST CANCER
TTF or TTP Overall Survival Patients ORR (%) Median Mos Median Mos
Study Design (nb) P value P value P value
Smith et al P as 3-hr infusion 563 40 NA No Difference
NSABP B26 vsJCO 1999 P as 24-hr infusion 50 Dose: 250 mg/m2 0.02
Holmes et al P as 3-hr infuson 179 23 NA 11ASCO 98 vs P as 96-hr infusion 29 10 Dose: 3-hr Arm: 250mg/m2 NS
NS 96-hr Arm: 140 mg/m2

Paclitaxel
Schedule and Dose are important• High Dose and Long Schedule (250 mg/m2,
24 Hours), : Efficacy (RR=50%) but Toxicity and Practicality…
• Low Dose and Short Schedule (175 mg/m2, 3 Hours): Low Efficacy (RR=25-30%), but good toxicity profile and practicality.
• Weekly: Phase II data

Paclitaxel Neoadjuvant StudiesPaclitaxel Neoadjuvant StudiesPaclitaxel Neoadjuvant StudiesPaclitaxel Neoadjuvant Studies
Nabholtz; May, 2002
MD Anderson Study DesignGreen et al, Proc. ASCO 2002 (Abst 135)
MD Anderson Study DesignMD Anderson Study DesignGreenGreen et al, Proc. ASCO 2002 (et al, Proc. ASCO 2002 (Abst Abst 135)135)
FAC x 4FAC x 4
N=236N=236
Pre and PostPre and Post--menopausal menopausal
RANDO MI
ZATION
Pac = Pac = PaclitaxelPaclitaxel
Pac weekly Pac weekly NN--: 80 mg : 80 mg / m2 x12/ m2 x12NN--: 150 mg: 150 mg/m2 x3 /m2 x3
q.4w: 4 cyclesq.4w: 4 cycles
Pac q.3w Pac q.3w 250250 mgmg/m2/24 h /m2/24 h
q.3w x 4q.3w x 4
SURGERY
236 pts236 pts evaluableevaluablepCRpCR: W N+: 28.0%: W N+: 28.0% NN--: 29.4%: 29.4%
3W N+: 13.7% N3W N+: 13.7% N--: 13.4%: 13.4%
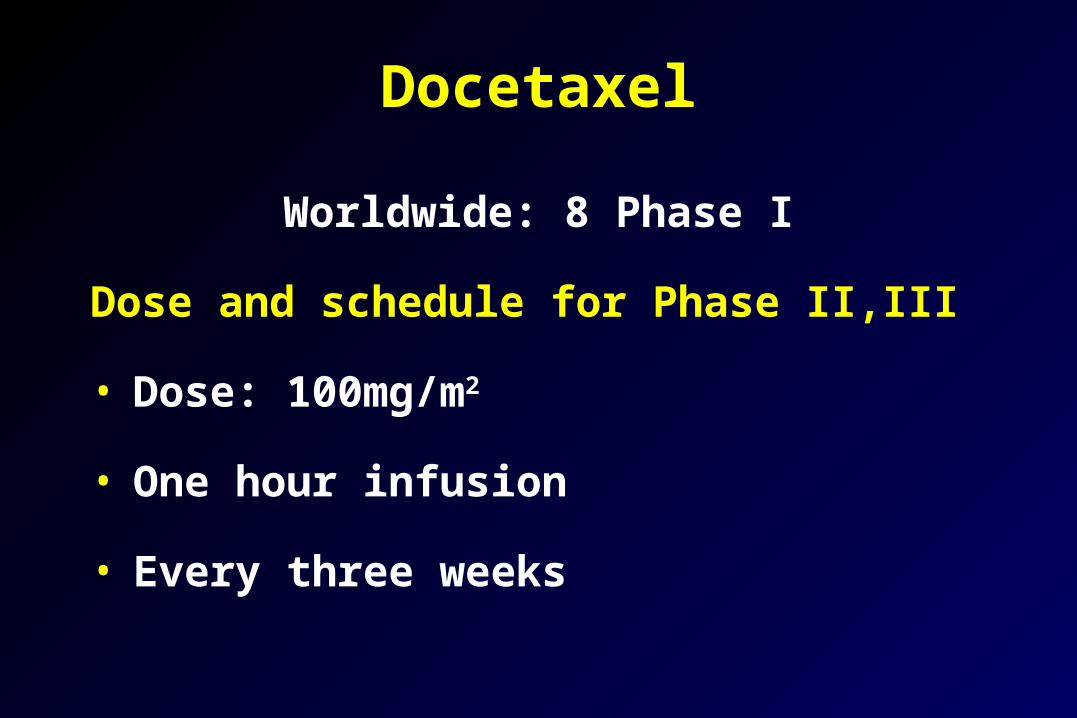
Docetaxel
Worldwide: 8 Phase I
Dose and schedule for Phase II,III
• Dose: 100mg/m2
• One hour infusion
• Every three weeks

Phase II Studies: Breast
Final Results – ITT
Type Authors Patients ResponseRate
First Line FumoleauTrudeauSeidman
117 56.4%(47.4-65.4%)
Second Line Ten BokkelValeroRavdin
111 48.6%(39.4-57.9%)
Anthracyclineresistant
ValeroRavdinBonneterre
105 41.7%(32.0-59.4%)

Pivotal Phase III Trials Monochemotherapy
Taxotere vs: RR TTP OS
Second Line after anthracycline
MV (Nabholtz JCO 99)
30 vs 12% p<.001
19 vs 11 wks p<.001
11.4 vs 8.7 mos p<.0097
MF (Sjostrom EJC 99)
42 vs 21% p<.0001
27 vs 13 wks p<.0001
NS
(crossover)
First and Second line after alkylating agent
Doxorubicin
(Chan JCO ‘99) 48 vs 33% p=.008
26 vs 21 wks NS
NS
Nabholtz, May, 2001.

Paclitaxel Phase III trial Monochemotherapy
• Second line chemotherapy after Failure of Doxorubicin • No self standing trial• Cross Over only
• Paclitaxel 3 Hours: RR: 13-14% (EORTC JCO 2000)• Paclitaxel 24 Hours: RR: 20% (Intergroup ASCO 97)
• First Line Chemotherapy• 3 Hours: Worse than Doxo 75 mg/m2
Gamucci, EORTC JCO 2000• 24 Hours: Equal to Doxo 60 mg/m2
Sledge,Intergroup ASCO 97

• Paclitaxel:• 3 hour schedule: efficacious, but pharmacokinetic
Interaction with potential cardiac toxicity• 16-24 interval between paclitaxel and doxorurubicin• Maximum cumulative dose of doxorubicin 360 mg/m2• 24 hour schedule: no cardiac toxicity, but low efficacy (ECOG)• Use of epirubicin in Europe: ITALY: EC vs ET, N+
• Docetaxel:• 1 hour infusion (AT/TAC):
• No added cardiac toxicity to doxorubicin (No pharmacokinetic interaction)
• Recommended doses: 75/50 or 60/60 mg/m2 • Efficacious
Ability to integrate Taxanes and Anthracyclines

Randomized Trials of Taxane-Anthracycline Combinations vs Polychemotherapy
Study Status AT vs AC Nabholtz et al, 1999
AT>AC
TAC vs FAC Nabholtz et al, 2001 Mackey et al, 2002***
TACFAC
ET vs FEC Bonneterre et al, 2001
ET>FEC
Docetaxel Paclitaxel
* ASCO 2000 in all pts. ** ASCO 2001 in HER2 positive pts. *** ASCO 2002

Development of Adjuvant Chemotherapy Breast Cancer
• Before anthracyclines• CMF, CMFVP
• With anthracyclines• Combinations: AC, FAC, AVCMF, FEC, CEF• Sequence and Alternating (Milan A & B)• Dose intensity,dose density, HDCT
• Taxanes (Paclitaxel/Docetaxel)• Sequential: A T C or AC T • Combinations: TA, TAC
• Biologic Modifiers (Herceptin)• Integration in chemotherapy strategies
1970s1970s
1980s1980s
1990s1990s
2000s2000s

Treatment of Adjuvant Breast Cancer
• First Generation Trials: comparing taxane / anthracycline to
non-taxane / anthracycline polychemotherapysequential
• Second Generation Trials: comparing taxanes in both arms
polychemotherapysequential
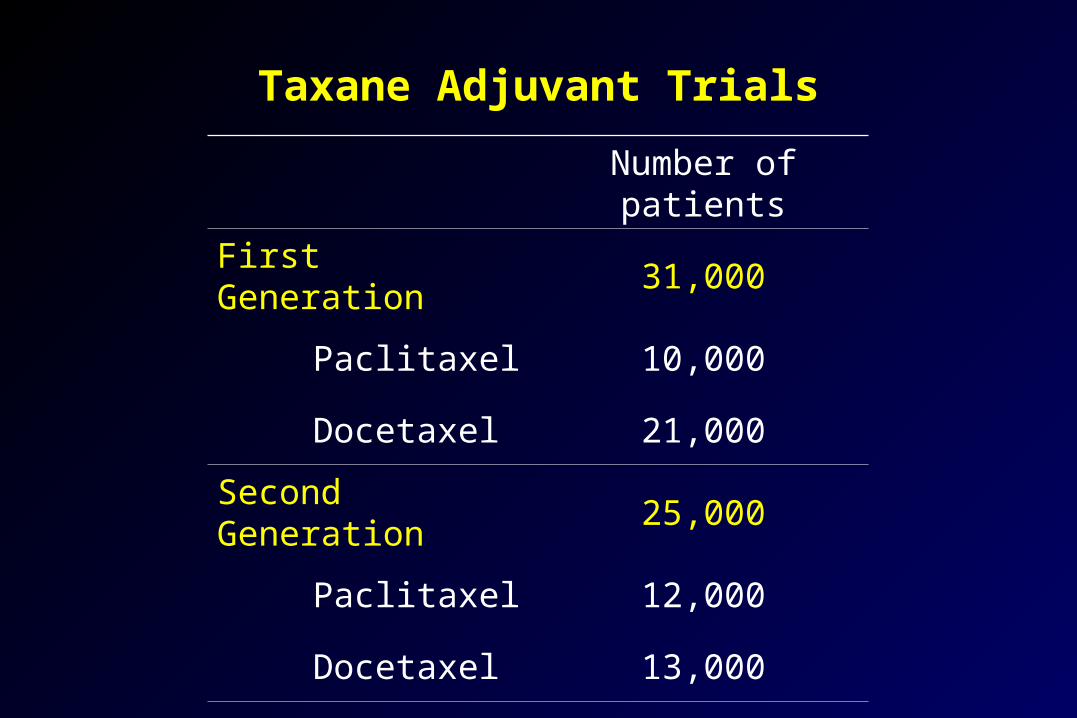
Taxane Adjuvant Trials
Number of patients
First Generation 31,000
Paclitaxel 10,000
Docetaxel 21,000
Second Generation
25,000
Paclitaxel 12,000
Docetaxel 13,000
Total 56,000

CALGB 9344 Study DesignCALGB 9344 Study DesignCALGB 9344 Study Design
PP175/3h175/3h x 4 x 4
NoneNone
N=3170N=3170
Node+Node+
Pre and Pre and PostPost--menopausal menopausal
ER+ or PR+ER+ or PR+
RANDO MI
ZATION
A =A = DoxorubicinDoxorubicinC = C = CylophosphamideCylophosphamideP = P = PaclitaxelPaclitaxel
AA6060C x 4 C x 4
AA7575C x 4C x 4
AA90+G90+G--CSFCSFC x 4C x 4
ER+ or PR+ patients received Tamoxifen x 5 yrs
NSABP B-28 Study DesignNSABP BNSABP B--28 28 Study DesignStudy Design
N=3060N=3060
Node+Node+
Pre and Pre and PostPost--menopausal menopausal
ER+ or PR+ER+ or PR+
A =A = DoxorubicinDoxorubicinC = C = CylophosphamideCylophosphamideP = P = PaclitaxelPaclitaxel
PP225/3h225/3h x 4 x 4 RANDO MIZATION
AC x 4 AC x 4
AC x 4AC x 4
All patients 50 years and those <50 with ER+ or PR+ tumors received Tamoxifen x 5 yrs
Paclitaxel Adjuvant StudiesPaclitaxel Adjuvant StudiesPaclitaxel Adjuvant StudiesPaclitaxel Adjuvant Studies
Nabholtz; May, 2002

CALGB 9344 Update
ASCO sNDA NIH CDC5/98 4/99 11/00
Median F/U (mos) 18 30 52
Number of Events Recurrences 453 624 901 Deaths 200 342 589
Reduction in Hazard of recurrence 22%* 22%* 13%* Hazard of death 26%* 26%* 14%*p<0.05

CALGB 9344:Disease Free Survival by Subgroup
Receptor Status Positive
Receptor Status Negative / Unknown
0.50
0
Pro
po
rtio
n D
ise
as
e-F
ree
AC T
AC
Years
AC T
AC
Adapted from the 2000 NIH Consensus Development Conference on Adjuvant Therapy for Breast Cancer.
0.75
1.00
0.50
0.75
1.00
1 2 3 4 5 6

NSABP B-28 Disease-free Survival and Survival All Patients
AC ACT RR* Pn=1525 n=1528 (95%CI) value
Events 282 269 0.93 0.38(0.78-1.10)
Deaths 133 136 1.00 0.98(0.78-1.27)
*RR adjusted for # (+) nodes, operation, and TAM use

Large Taxane Trials Reported as of 11/2000Large Taxane Trials Reported as of 11/2000
CALGB 9344 NSABP-B28
T x 4
Nil
4 N+ 1-3 N+ 4 N+ 1-3 N+
A (↑ doses) C x 4
N=3170 N=3060
Premenopausal: 62 %ER+: 58%
< 50 y of age: 51 %ER+: 66 %
54 % 30 %
± Tamoxifen X 5 Y (given to 70%)Delayed Administration
± Tamoxifen X 5 Y (given to 85%)Concomitant Administration
A (fixed dose) C x 4 T x 4
Nil
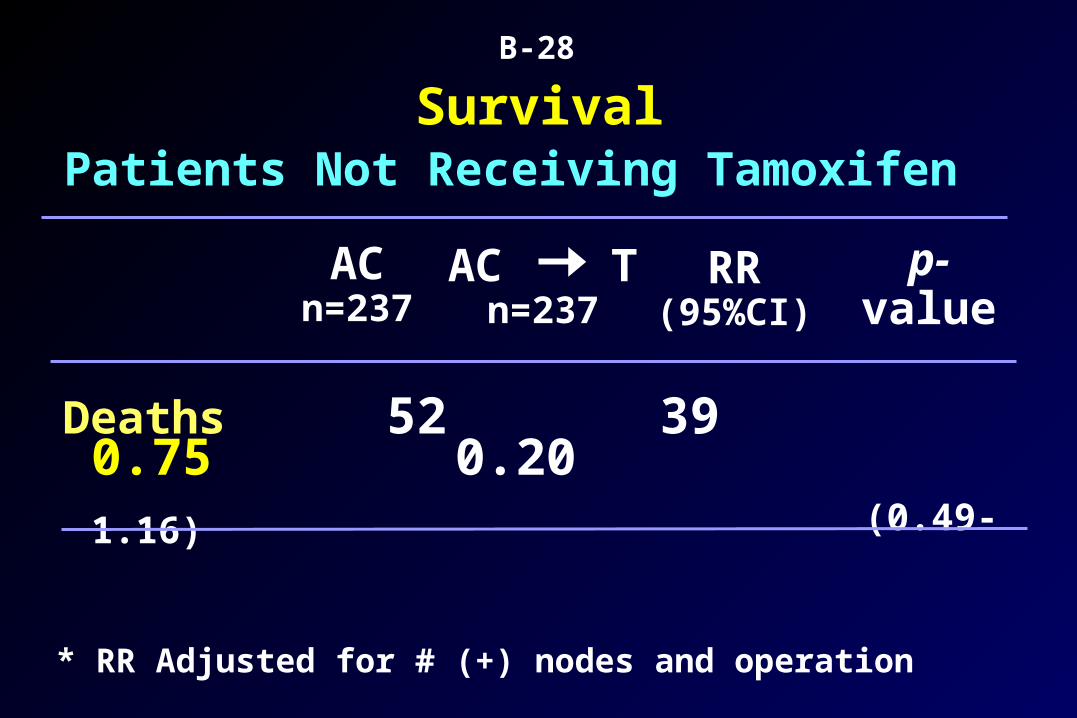
Deaths 52 39 0.75 0.20 (0.49-1.16)
ACn=237
SurvivalPatients Not Receiving Tamoxifen
AC Tn=237
RR(95%CI)
p-value
* RR Adjusted for # (+) nodes and operation
B-28
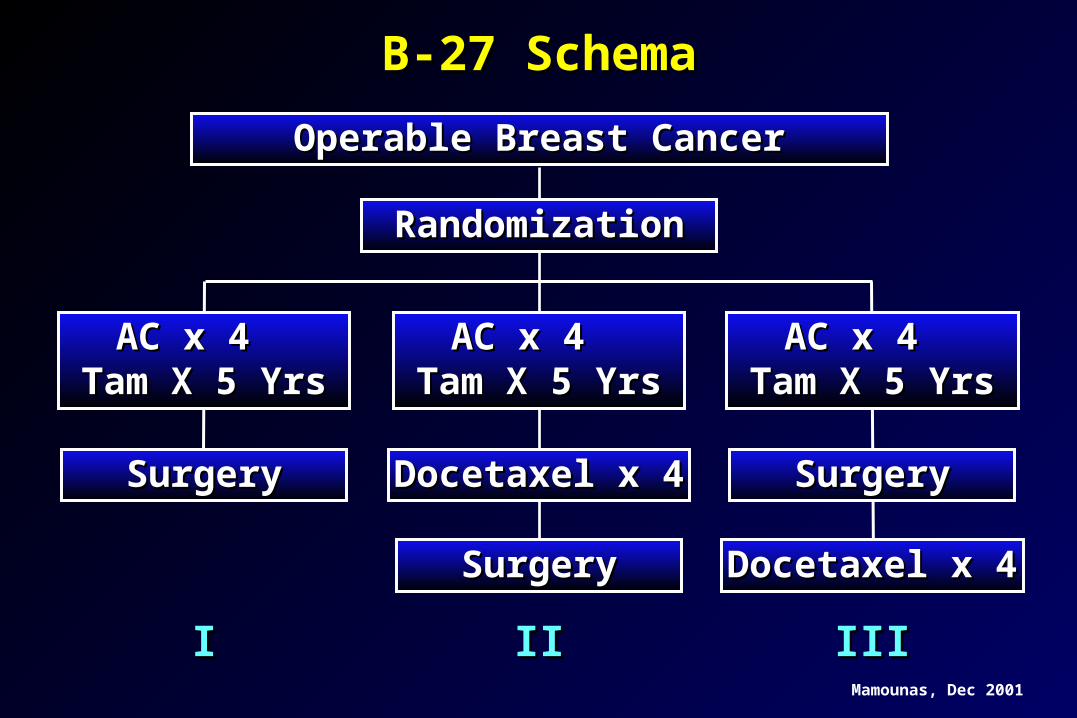
B-27 SchemaB-27 Schema
Operable Breast CancerOperable Breast Cancer
RandomizationRandomization
II IIII IIIIII
AC x 4 AC x 4 Tam X 5 YrsTam X 5 Yrs
AC x 4 AC x 4 Tam X 5 YrsTam X 5 Yrs
AC x 4 AC x 4 Tam X 5 YrsTam X 5 Yrs
SurgerySurgery Docetaxel x 4Docetaxel x 4 SurgerySurgery
SurgerySurgery Docetaxel x 4Docetaxel x 4
Mamounas, Dec 2001

B-27B-27Pathologic Response (pCR) in BreastPathologic Response (pCR) in Breast
P < 0.001P < 0.001
AC TaxotereAC Taxotere(718 pts)(718 pts)
ACAC(1,492 pts)(1,492 pts)
3.9%
9.8%
No TumorNo Tumor Non-InvasiveNon-Invasive
6.9%
18.7%
13.7%13.7% 25.6%25.6%
20%20%
10%10%
00
30%30%
Mamounas, Dec 2001

All Patients
4 cycles of CVAP
4 cycles of docetaxel4 cycles of docetaxel
4 cycles of docetaxel4 cycles of docetaxel
4 cycles of CVAP4 cycles of CVAP
No Response
ResponseR
and
om
ise
First Phase Second Phase
Fin
al Assessm
ent / S
urg
eryTax301 Study
Conducted by the Aberdeen Breast Group F
inal A
ssessmen
t / Su
rgery
Hutcheon et al. SABCS 2001, abs 506

34%18% 2%5
19%16%13%4
23%26%29%3
20%18%31%2
4%22%25%1
Docetaxeln = 47
CVAPn = 50
No Initial Response Docetaxel
n = 45
Miller & Payne Grade of
Pathological Response
Initial Response
pNR
pCR
Tax301Tax301Pathological Response RatesPathological Response Rates
Hutcheon et al. SABCS 2001, abs 506

Taxotere First Generation Trials: Polychemotherapy
BCIRG 001N+ 6 x FAC
6 x TAC
North AmericanIntergroup N+ 1-3/N0
4 x AC
4 x AT
(75,50,500)
(500,50,500)
(60,600)
(60,60)
1500 patients
3200 patients

Design
Docetaxel 75 mg/m2 Doxorubicin 50 mg/m2
Cyclophosphamide500 mg/m2
5-FU 500 mg/m2
Doxorubicin 50 mg/m2
Cyclophosphamide500 mg/m2
FAC
TAC
R
Dexamethasone premedication, 8 mg bid, 3 days Prophylactic Cipro 500 mg bid, day 5-14
Every 3 weeks x 6 cycles
Stratification:• Nodes:
1-3 4+
• Center
Nabholtz et al, ASCO 2002 (Abs 141)
BCIRG 001

TAC
FAC
0 6 12 18 24 30 36 42 48Months
Number at RiskTACFAC
745 736 710 678 654 373 152 23 1746 729 699 656 605 334 150 31 0
50
60
70
80
90
100
% A
live
and
Dis
ease
Fre
e
# Events RR p-value
TAC 1190.68 0.001
FAC 170
Total 289
Disease Free Survival (ITT)BCIRG 001
Median follow-up: 33 months / n=1,491
82%
74%
Nabholtz et al, ASCO 2002 (Abs 141)

Confirmatory Analyses: DFS
Analysis Cohort RR p
Main Analysis(Stratified by nodes)
ITT0.68
(0.54 – 0.86)0.001
Unadjusted ITT0.67
(0.53 – 0.85)0.0008
Cox Model* ITT0.64
(0.50 – 0.81)0.0002
*Controls for nodes, age, tumor size, histology, ER/PR, HER2
Nabholtz et al, ASCO 2002 (Abs 141)
BCIRG 001

Sites of First Events
TACn= 745
FACn= 746
number of events
Metastatic 80 119
Local/Regional 23 31
Contralateral 3 6
Other 2nd Primary 6 10
Death NED 7 4
119 170
Nabholtz et al, ASCO 2002 (Abs 141)
BCIRG 001

Planned Additional Analyses Disease Free Survival and Overall Survival
• Prospectively defined and powered at 5 years
• By nodal status
• Prospectively defined but not powered
• By Hormonal Receptor
• By HER2 status (FISH)
Nabholtz et al, ASCO 2002 (Abs 141)
BCIRG 001
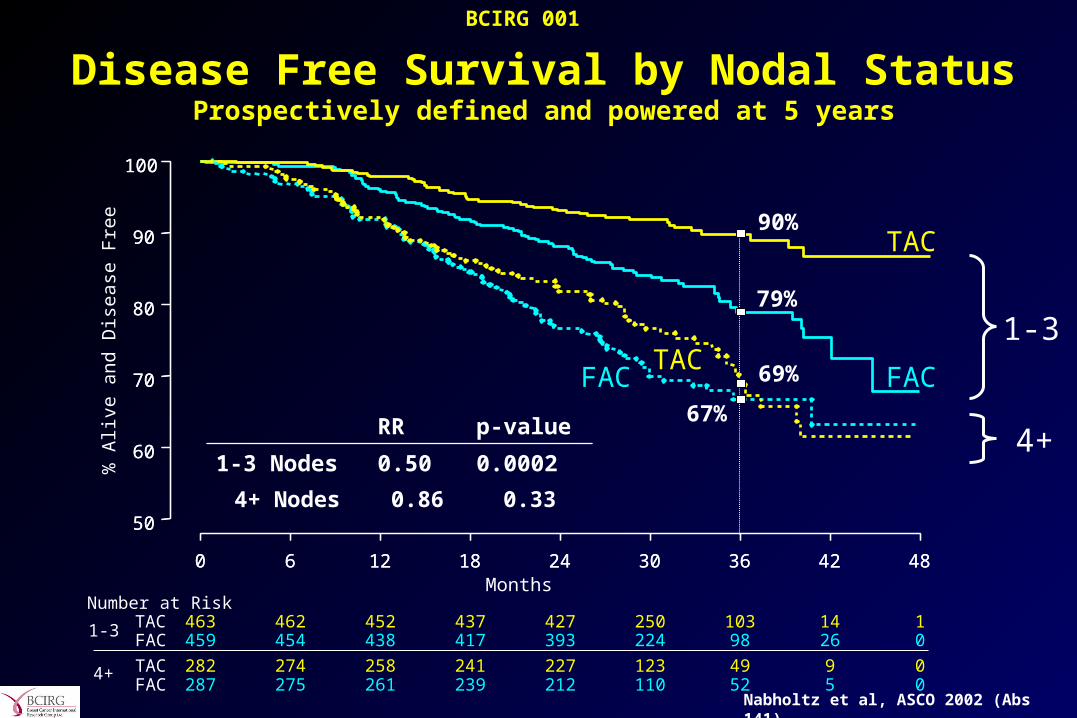
Disease Free Survival by Nodal StatusProspectively defined and powered at 5 years
RR p-value
1-3 Nodes 0.50 0.0002
TAC
FAC
0 6 12 18 24 30 36 42 48Months
Number at RiskTACFAC
463 462 452 437 427 250 103 14 1459 454 438 417 393 224 98 26 0
50
60
70
80
90
100
% A
live
and
Dis
ease
Fre
e
1-3
1-3
90%
79%
TACFAC
0 6 12 18 24 30 36 42 48
4+ TACFAC
282 274 258 241 227 123 49 9 0287 275 261 239 212 110 52 5 0
50
60
70
80
90
100
0.330.864+ Nodes
4+
69%
67%
Nabholtz et al, ASCO 2002 (Abs 141)
BCIRG 001

TAC
FAC
0 6 12 18 24 30 36 42 48MonthsNumber at Risk
TACFAC
463 462 459 453 449 261 112 14 1459 457 453 444 422 243 107 28 1
50
60
70
80
90
100
% A
live
Overall Survival by Nodal Status Prospectively defined and powered at 5 years
96%
89%
RR p-value
1-3 Nodes 0.46 0.006
1-3
1-3
TAC
0 6 12 18 24 30 36 42 48
4+ TACFAC
282 279 273 265 251 132 59 10 0287 281 275 269 256 132 64 5 0
50
60
70
80
90
100
0.751.084+ Nodes
4+
86%84%
Nabholtz et al, ASCO 2002 (Abs 141)
BCIRG 001

0.2 0.4 0.6 0.8 1.0 1.2 1.4 1.6 1.8 2.0
Hazard Ratio
TAC Better FAC Better
10+
4-9
1-3
All
Number of Positive Nodes
(N=149)
(N=420)
(N=922)
(N=1491)
BCIRG001 - DFS: Comparison by Nodal StatusOriginal Analysis: 1-3 versus 4+ Nodes
DFS Relative Risk Reduction by Nodal Status

5 Year Recurrence and Survival by number of Lymph Nodes
Number of Pathologically Positive Axillary Lymph Nodes
0%
20%
40%
60%
80%
100%
0 1 2 3 4 5 6-10 16-20 >2011-15
= survival
= recurrence
Results of a national survey by the ACS. Cancer 1980;45:2917 Nabholtz; May, 2002

Disease Free Survival by Hormonal Status
TAC
FAC
0 12 24 36 48Months
N at RiskTACFAC
231 217 188 47 0228 202 158 34 0
50
60
70
80
90
100
% A
live
and
Dis
ease
Fre
e
TAC
FAC
0 12 24 36 48Months
N at RiskTACFAC
514 493 466 105 1518 497 447 116 0
50
60
70
80
90
100
Negative Positive
RR = 0.62p = 0.005
RR = 0.68p = 0.02
Nabholtz et al, ASCO 2002 (Abs 141)
BCIRG 001

TAC
FAC
0 12 24 36 48Months
N at RiskTACFAC
485 467 433 102 1478 455 402 108 0
40
50
60
70
80
90
100
% A
live
and
Dis
ease
Fre
e
TAC
FAC
0 12 24 36 48Months
N at RiskTACFAC
138 131 118 32 0148 135 107 26 0
40
50
60
70
80
90
100
Disease Free Survival by HER2 status
Negative (FISH) Positive (FISH)
RR = 0.74p = 0.06
RR = 0.59p = 0.02
Nabholtz et al, ASCO 2002 (Abs 141)
BCIRG 001

Study Design
Intergroup(led by ECOG)
AC (x4) P 175/3h/d1 q3wks (x4) vsAC (x4) P 90 weekly (x12) vsAC (x4) T 100/1h/d1 q3wks (x4) vsAC (x4) T 35 weekly (x12)
NSABP-B30AC (x4) T 100 (x4) vsAT 50/75* (x4) vs TAC 75/50/500* (x4)
BCIRG 005AC (x4) T 100 (x4) vsTAC 75/50/500 (x6)
Taxanes Second Generation Pivotal Adjuvant Trials
A = Adriamycin; C = Cyclophosphamide; T = Taxotere; P = paclitaxel; A = Adriamycin; C = Cyclophosphamide; T = Taxotere; P = paclitaxel; *recent change
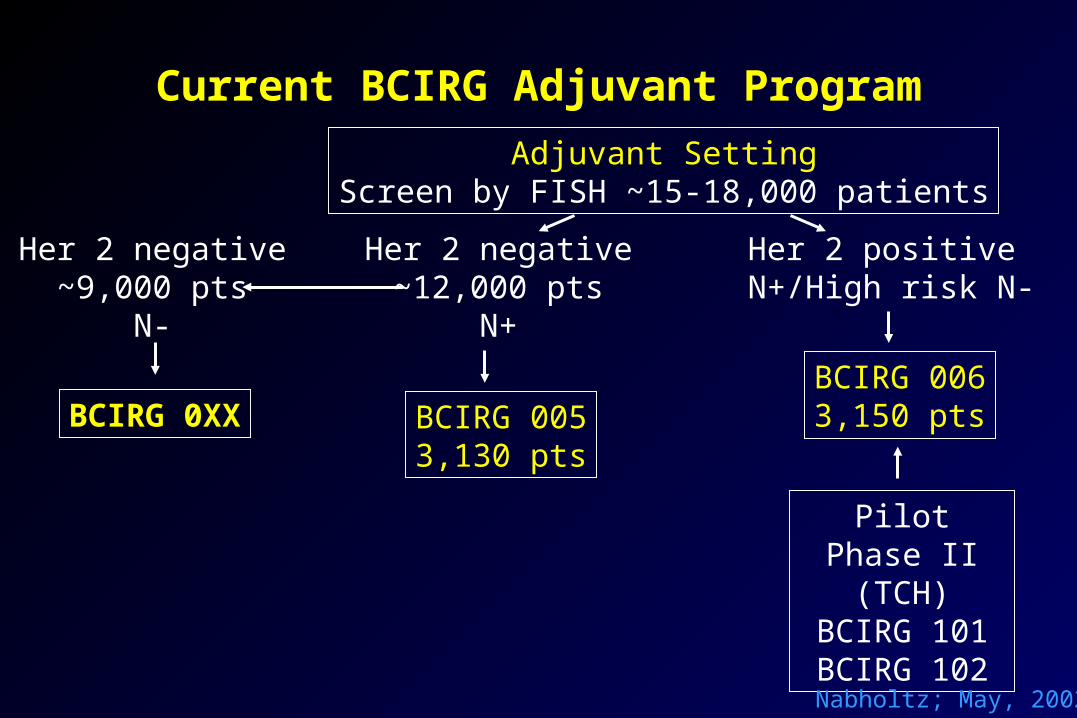
Current BCIRG Adjuvant Program
Adjuvant SettingScreen by FISH ~15-18,000 patients
Her 2 negative~12,000 pts
N+
Her 2 positive N+/High risk N-
BCIRG 0063,150 ptsBCIRG 005
3,130 pts
Her 2 negative~9,000 pts
N-
Pilot Phase II (TCH)
BCIRG 101BCIRG 102
BCIRG 0XX
Nabholtz; May, 2002

BCIRG 005Adjuvant Breast Cancer
Node Positive
Her2 –FISH
4 x AC 60/600 mg/m2 4 x Docetaxel 100 mg/m2
6 x TAC 75 75/50/500 mg/m2
N=3150345 centres

BCIRG 006Adjuvant Breast Cancer
Node Positive and High Risk Node Negative
HER2 +FISH
4 x AC60/600 mg/m2
4 x Docetaxel100 mg/m2
6 x Docetaxel and Platinum salts75 mg/m2 75 mg/m2 or AUC 6
1 Year Trastuzumab
N=3150480
centres
1 Year Trastuzumab
ACT
ACTH
TCH

Conclusion
Taxanes: chemotherapies of the 1990’s for breast cancer
• Established role in advanced breast cancer
• Entering adjuvant setting…


![Response to Eribulin in a Difficult-To-Treat Triple ... · treatment of advanced breast cancer in patients who received anthracyclines and taxanes [4]. ... 2014 she underwent conservative](https://static.fdocuments.net/doc/165x107/5fb0cc597600150585710c7b/response-to-eribulin-in-a-difficult-to-treat-triple-treatment-of-advanced-breast.jpg)
![Review Open Access … · laulimalide, taxanes & epothilones, and vinca alkaloids (B) A B. The vinca binding site on microtubules[40] is different from that of other anti-tubulin](https://static.fdocuments.net/doc/165x107/5fa466c5caeba7406a2ca276/review-open-access-laulimalide-taxanes-epothilones-and-vinca-alkaloids.jpg)