Integration of micro-gravity and geodetic data to constrain shallow
12
Bull Volcanol (2006) 68: 420–431 DOI 10.1007/s00445-005-0018-5 RESEARCH ARTICLE Elske de Zeeuw-van Dalfsen · Hazel Rymer · Glyn Williams-Jones · Erik Sturkell · Freysteinn Sigmundsson Integration of micro-gravity and geodetic data to constrain shallow system mass changes at Krafla Volcano, N Iceland Received: 27 August 2004 / Accepted: 7 July 2005 / Published online: 8 February 2006 C Springer-Verlag 2005 Abstract New and previously published micro-gravity data are combined with InSAR data, precise levelling and GPS measurements to produce a model for the processes operating at Krafla volcano, 20 years after its most recent eruption. The data have been divided into two periods: from 1990 to 1995 and from 1996 to 2003 and show that the rate of deflation at Krafla is decaying exponentially. The net micro-gravity change at the centre of the caldera is shown, using the measured free air gradient, to be −85 µGal for the first and −100 µGal for the second period. After consider- ation of the effects of water extraction by the geothermal power station within the caldera, the net gravity decreases are −73±17 µGal for the first and −65±17 µGal for the second period. These decreases are interpreted in terms of magma drainage. Following a Mogi point source model, we calculate the mass decrease to be ∼2×10 10 kg/year reflect- ing a drainage rate of ∼0.23 m 3 /s, similar to the ∼0.13 m 3 /s drainage rate previously found at Askja volcano, N. Iceland. Based on the evidence for deeper magma reservoirs and the similarity between the two volcanic systems, we suggest a pressure-link between Askja and Krafla at deeper levels (at the lower crust or the crust-mantle boundary). After the Editorial responsibility: A. Harris E. de Zeeuw-van Dalfsen () · H. Rymer Volcano Dynamics Group, Department of Earth Sciences, The Open University, Walton Hall, Milton Keynes, MK7 6AA, UK e-mail: [email protected] Tel.: +44-1908659775 Fax: +44-1908655151 G. Williams-Jones Department of Earth Sciences, Simon Fraser University, Burnaby, British Columbia, Canada E. Sturkell The Icelandic Meteorological Office, Reykjavik, Iceland F. Sigmundsson Nordic Volcanological Centre, Institute of Earth Sciences, University of Iceland, 101 Reykjavik, Iceland Krafla fires, co-rifting pressure decrease of a deep source at Krafla stimulated the subsequent inflow of magma, even- tually affecting conditions along the plate boundary in N. Iceland, as far away as Askja. We anticipate that the pres- sure of the deeper reservoir at Krafla will reach a critical value and eventually magma will rise from there to the shallow magma chamber, possibly initiating a new rifting episode. We have demonstrated that by examining micro- gravity and geodetic data, our knowledge of active volcanic systems can be significantly improved. Keywords Micro-gravity . Deformation . Krafla . Askja . Magma drainage . InSAR . Reservoir Introduction The Northern Volcanic Zone north of the Vatnaj¨ okull ice cap in Iceland, consists of five NNE–SSW elongated vol- canic systems: Theistareykir, Krafla, Fremri-Namur, Askja, and Kverkfj¨ oll, (Fig. 1-inset). They are arranged en echelon along the plate boundary which is ∼50–80 km wide. Each volcanic system consists of a fissure swarm transecting a central volcano. The Krafla Volcanic System comprises a fissure swarm, which is 100 km long and ∼10 km wide, more than 1,000 tectonic fractures, and a central volcano (Fig. 1). The Krafla central volcano forms a low, broad shield some 20 km in diameter with a caldera in the centre. The topographically indistinct caldera has an elliptical shape and stretches 10 km in the E–W direction and 8 km N–S. It formed during an explosive eruption in the last interglacial period about 0.1 Ma ago and has since been filled almost completely with lavas and ash (Brandsd´ ottir et al. 1997). Two geothermal areas, Krafla and N´ amafjall (Fig. 1) are located in the Krafla Volcanic System. N´ amafjall is located just south of the Krafla caldera on the eastern part of the Krafla fissure swarm. Its 3–4 km 2 surface expression is characterized by mud pools and fumaroles and three active
Transcript of Integration of micro-gravity and geodetic data to constrain shallow

Bull Volcanol (2006) 68: 420–431DOI 10.1007/s00445-005-0018-5
RESEARCH ARTICLE
Elske de Zeeuw-van Dalfsen · Hazel Rymer ·Glyn Williams-Jones · Erik Sturkell ·Freysteinn Sigmundsson
Integration of micro-gravity and geodetic data to constrain shallowsystem mass changes at Krafla Volcano, N Iceland
Received: 27 August 2004 / Accepted: 7 July 2005 / Published online: 8 February 2006C© Springer-Verlag 2005
Abstract New and previously published micro-gravitydata are combined with InSAR data, precise levelling andGPS measurements to produce a model for the processesoperating at Krafla volcano, 20 years after its most recenteruption. The data have been divided into two periods: from1990 to 1995 and from 1996 to 2003 and show that the rateof deflation at Krafla is decaying exponentially. The netmicro-gravity change at the centre of the caldera is shown,using the measured free air gradient, to be −85 µGal for thefirst and −100 µGal for the second period. After consider-ation of the effects of water extraction by the geothermalpower station within the caldera, the net gravity decreasesare −73±17 µGal for the first and −65±17 µGal for thesecond period. These decreases are interpreted in terms ofmagma drainage. Following a Mogi point source model, wecalculate the mass decrease to be ∼2×10¹⁰ kg/year reflect-ing a drainage rate of ∼0.23 m3/s, similar to the ∼0.13 m3/sdrainage rate previously found at Askja volcano, N. Iceland.Based on the evidence for deeper magma reservoirs and thesimilarity between the two volcanic systems, we suggest apressure-link between Askja and Krafla at deeper levels(at the lower crust or the crust-mantle boundary). After the
Editorial responsibility: A. Harris
E. de Zeeuw-van Dalfsen (�) · H. RymerVolcano Dynamics Group, Department of Earth Sciences, TheOpen University,Walton Hall, Milton Keynes, MK7 6AA, UKe-mail: [email protected].: +44-1908659775Fax: +44-1908655151
G. Williams-JonesDepartment of Earth Sciences, Simon Fraser University,Burnaby, British Columbia, Canada
E. SturkellThe Icelandic Meteorological Office,Reykjavik, Iceland
F. SigmundssonNordic Volcanological Centre, Institute of Earth Sciences,University of Iceland,101 Reykjavik, Iceland
Krafla fires, co-rifting pressure decrease of a deep source atKrafla stimulated the subsequent inflow of magma, even-tually affecting conditions along the plate boundary in N.Iceland, as far away as Askja. We anticipate that the pres-sure of the deeper reservoir at Krafla will reach a criticalvalue and eventually magma will rise from there to theshallow magma chamber, possibly initiating a new riftingepisode. We have demonstrated that by examining micro-gravity and geodetic data, our knowledge of active volcanicsystems can be significantly improved.
Keywords Micro-gravity . Deformation . Krafla . Askja .Magma drainage . InSAR . Reservoir
Introduction
The Northern Volcanic Zone north of the Vatnajokull icecap in Iceland, consists of five NNE–SSW elongated vol-canic systems: Theistareykir, Krafla, Fremri-Namur, Askja,and Kverkfjoll, (Fig. 1-inset). They are arranged en echelonalong the plate boundary which is ∼50–80 km wide. Eachvolcanic system consists of a fissure swarm transecting acentral volcano.
The Krafla Volcanic System comprises a fissure swarm,which is 100 km long and ∼10 km wide, more than1,000 tectonic fractures, and a central volcano (Fig. 1).The Krafla central volcano forms a low, broad shieldsome 20 km in diameter with a caldera in the centre.The topographically indistinct caldera has an ellipticalshape and stretches 10 km in the E–W direction and8 km N–S. It formed during an explosive eruption inthe last interglacial period about 0.1 Ma ago and hassince been filled almost completely with lavas and ash(Brandsdottir et al. 1997).
Two geothermal areas, Krafla and Namafjall (Fig. 1) arelocated in the Krafla Volcanic System. Namafjall is locatedjust south of the Krafla caldera on the eastern part of theKrafla fissure swarm. Its 3–4 km2 surface expression ischaracterized by mud pools and fumaroles and three active

421
H
L
G
16W
66N
10 km
21˚ 17˚
65˚
64˚
NHotel
KNámafjall
Gjástykki
Krafla
100 km
Reykjavík
Tr
Kr
AsKv
Fr
FM115
Fig. 1 Overview of the Krafla volcanic System, inset shows locationof Krafla in Iceland. The locations of the main ice caps are depictedwith light grey and the volcanic zones are depicted with dark grey. Theinset also shows the five NNE–SSW elongated volcanic systems ofthe Northern Volcanic Zone, Tr Theystareykir, Kr Krafla, Fr Fremri-Namure, As Askja and Kv Kverkfjoll (Einarsson 1991). The blackbox marked on the inset shows the area covered by the enlargementgiven in the main figure. The larger figure shows the Krafla Rift Zone(dotted), the outline of the Krafla central volcano (solid white line),the caldera (white dashed line), the geothermal areas (blocked), thetown of Husavik (H), lake Myvatn (L) and Krafla mountain (K) witha SAR amplitude image for reference in the background. Note thelocation of micro-gravity stations Hotel and FM115. White dashedbox shows outline of Fig. 1
wells, with a maximum temperature of 320◦C, whichsupply a 3 MW back-pressure turbine unit. The largerKrafla geothermal area, ∼7 km2, is located in the centreof the caldera and is elongated in the NW–SE direction.At present, 18 wells are used to operate a 60-MW powergenerator and geothermal fluid temperatures reach 350◦C(Gudmundsson and Arnorsson 2002).
The activity at the Krafla volcanic system is charac-terised by rifting episodes separated by long periods ofdormancy (e.g., Arnadottir et al. 1998). Two historical rift-ing episodes, the so called Myvatn and Krafla fires, oc-curred from 1724 to 1729 and 1975 to 1984, respectively.During the Myvatn fires, the crater Vıti was formed (Fig. 2),although most of the other activity manifested itself southof the Krafla caldera (Ewart et al. 1991). Activity resumedin 1975, when seismicity increased and deformation datasuggested inflow of magma to the shallow Krafla reservoir,causing inflation followed by rapid deflation and an initialdiking event (Tryggvason 1994). A rifting episode from1975 to 1984 was then characterised by 21 such cycles ofwhich 9 culminated in basaltic fissure eruptions (Bjornsson1985; Brandsdottir et al. 1997). During each cycle, thereservoir pressure exceeded a critical value, reservoir wallsfailed, dykes were injected into the fissure swarm and rift-ing occurred. The largest and most voluminous eruption ofthis period occurred over two weeks in September 1984during which an 8.5-km-long volcanic fissure erupted apahoehoe lava field with a total area of 24 km2 (Rossi1997).
65 45' N
65 40' N
16 45' W16 50' W
11
9
7
6
5
23
24 2526 27
29
3
14 12
Hreindyraholl
Krafla
hlidar
Hvíthólaklif
S. H
lidar
dalu
r
N
Viti
Fissureswarm
road to Reykjahlid
Leirhnjukur
road to Grimsstadir
Levelling
GPS
Gravity
Mountain top
Caldera rim
Road/track
1 km
Fig. 2 Sketch of the location of the main micro-gravity, levellingand GPS stations at Krafla. Numbers refer to station names: 3 FM115,5 OS5595, 6 5596, 7 OS5596, 9 5599A, 11 5672, 12 OS5684, 14OS5688, 23 A001, 24 A002, 25 A003, 26 A004, 27 A005 and 29A012
Krafla is one of the few calderas in the world—othersinclude Askja in Iceland (Rymer and Tryggvason 1993),Masaya in Nicaragua (Williams-Jones et al. 2003), Poas inCosta Rica (Rymer et al. 2000) and Campi Flegrei in Italy(Gottsmann et al. 2003)—with a long-term micro-gravitydata set. The area has also been studied extensively us-ing a variety of geophysical techniques (Tryggvason 1986;Arnadottir et al. 1998; Sigmundsson et al. 1997). Herewe present Interferometric Synthetic Aperture Radar data(InSAR; 1993–1999) and micro-gravity data (1997–2003).Results of these techniques are combined to produce an in-tegrated model for the processes operating at Krafla today,20 years after the most recent eruption.
Methods
Geodetic methods
Previously published and new precise levelling, Global Po-sitioning System (GPS) and InSAR data were combined tocalculate the height change at each gravity station. InSARallows the measurement of change in range from ground tosatellite at a high spatial resolution by combining pairs ofSynthetic Aperture Radar (SAR) images acquired at differ-ent acquisition times (Massonnet and Feigl 1995; Masson-net and Feigl 1998). Interferograms were produced with theuse of the DIAPASON software (CNES 2000) following anapproach similar to that used by Sigmundsson et al. (1997).Topographic fringes were removed with the help of adigital elevation model (DEM) from the Icelandic GeodeticSurvey and orbital corrections were performed utilising

422
post-computed orbits from the European Space Agency(ESA). Residual orbital effects were removed by sub-tracting a linear range-change gradient. The remainderof the processing was done using sub-sections of thecomplete interferograms covering the Krafla area. Thesesections were filtered using an algorithm developed byZ. Lu (personal communication 2002) and unwrappedusing deformation tools developed by Gudmundsson et al.(2002). After unwrapping, the interferograms provide anunambiguous measure of the change in range whereasthe original interferograms show deformation as fringes,each corresponding to a vertical displacement of 28 mm.The precise levelling technique measures the verticaldeformation, with respect to reference station FM115,with millimetre precision (Fig. 1). Differential GPSmeasurements are referred to station NE9301 and have anaccuracy in the vertical component of ∼1–2 cm.
Micro-gravity methods
All the micro-gravity measurements discussed in this pa-per were acquired with the use of LaCoste & Romberginstruments following standard techniques as described byRymer (1996). Meter G-513 has been used for all surveyssince 1990 and its calibration characteristics are well known(Carbone and Rymer 1999); meter G-403 has been used inaddition since 1997. The micro-gravity network tradition-ally uses station Hotel (Fig. 1) as reference, because it islocated outside the main zone of deformation (Rymer et al.1998). Station FM115 has also been measured on a regularbasis. Although its location near the central axis of the plateboundary is not ideal, it has been used here as an alternativereference station to better coordinate with the deformationnetwork. The uncertainty expected for this type of micro-gravity survey considering the climate, time delay betweenreadings, and jolting of the instruments during transportis 10–20 µGal (Rymer 1989). Repeat measurements havebeen made during this study and the uncertainties for thenewly acquired data are displayed in Table#x00A0;2. Be-fore we can interpret the micro-gravity data in terms ofmass movements, they need to be corrected for height withthe use of geodetic data. The free air gradient (FAG) is thechange of gravity with elevation and is used to calculate theexpected gravity change at each station due to the heightchanges alone. The FAG varies depending on the localsub-surface mass distribution. The local value of the FAGcan be determined in the field following the methodologyof Rymer (1996) and is used here to calculate net gravitychanges.
Data and results
Deformation data
The Krafla system is subject to deformation because ofthe stresses associated with the divergent plate bound-ary, the effects of magma movements and geothermal
processes. The recent extensive geothermal exploitationand production at the Krafla power station also influencesthe system. Any deformation data collected will neces-sarily reflect the complex interaction between all theseprocesses.
Previous results
No significant ground deformation changes were observedin data from the 1938 to 1965 period (Bjornsson et al.1979). Between 1965 and 1971, apparent contraction tookplace followed by extension and uplift between 1970 and1975 (Moller and Ritter 1980; Rymer et al. 1998). TheKrafla power plant was under construction at that time andgeodetic surveys and exploration drillings had started in1974. Levelling profiles crossing the caldera region wereavailable from the very beginning of the 1975–1984 riftingepisode. Ground deformation was monitored extensivelyduring the episode (Ewart et al. 1991), using a wide rangeof techniques such as electronic distance measurements(EDM; Tryggvason 1994), precise levelling (Bjornsson1985) and tilt and lake level measurements (Tryggvason1986; Tryggvason 1994). Deformation during the riftingepisode was characterised by steady inflation interrupted byrapid subsidence (Tryggvason 1994). After the last eruptionin September 1984, slow inflation was observed from 1985to 1989. This was followed by subsidence, initially at a rateof ∼5 cm/year, declining to ∼2.5 cm/year in 1992–1995(Tryggvason 1994; Sigmundsson et al. 1997; Arnadottiret al. 1998; Rymer et al. 1998).
Radar interferometry (InSAR) has also been used suc-cessfully in the Krafla region to monitor deformation (Sig-mundsson et al. 1997; Henriot et al. 2001; de Zeeuw-vanDalfsen et al. 2004a). Analysing interferograms coveringthe 1992–1995 period, Sigmundsson et al. (1997) observed2.4 cm/year of subsidence in the centre of the Krafla areaand ∼0.7 mm/year along axis subsidence of the spreadingsegment. Henriot et al. (2001) analysed interferogramsfrom the 1992–1998 period and found steady subsidence atKrafla and the fissure swarm of 1.9 cm/year (2.1 cm/year inthe ground to satellite direction). Based on interferometricdata from 1993 to 1999, de Zeeuw-van Dalfsen et al.(2004a) showed the existence of a wide inflating area inaddition to the already suggested subsiding zones.
New data
Integration of the new GPS and InSAR data with previ-ously published geodetic data is complicated by the factthat different groups acquired the data, using differentreference stations and with several temporal gaps in thedata set. To alleviate this problem, all data are first nor-malised to the same base station (FM115; Figs. 1 and 2)and yearly height changes are calculated for each grav-ity station (Table 1), interpolating and extrapolating wherenecessary.

423
Table 1 Total height change data for 1990 to 2003 based on the pre-cise levelling surveys reported by Bjornsson and Eysteinsson (1998)and Agustsson (2001). Numbers refer to location of station, for co-ordinates see Table 2 (also partly displayed on Fig. 2). An ‘a’ in thefirst column means the levelling station is close to but not identicalto the gravity station with that number, but height change data from
the a-station are used to correct for height changes at the correspond-ing gravity station. Method of estimation is described in text. Notethat the negative numbers here reflect deflation. These should notbe confused with the decreasing rate of deflation shown in Fig. 3.The standard deviation on the data is 1.5 cm which corresponds to∼5 µGal (based on the average FAG ∼310±12 µGal/m)
No Levelling station Estimated height change Levelling 1995–2000 Estimated height change Total height change1990–1995 (m) Agustsson (m) 2000–2003 (m) 1990–2003 (m)
3 FM115 0.000 0.000 0.000 0.0005 OS5595 −0.074 −0.019 −0.005 −0.0976 5596 −0.086 −0.041 0.001 −0.1267 OS5597 −0.061 −0.022 0.001 −0.0838 5599 −0.013 −0.003 0.000 −0.0159 5599A −0.013 −0.003 0.000 −0.01510 OS5600 −0.002 0.004 0.000 0.00211 5672 0.013 0.037 0.000 0.04912 OS5684 −0.052 −0.000 0.001 −0.05213 OS5685 −0.054 0.007 0.001 −0.04615 OS5697 −0.000 0.004 0.000 0.00416 OS5698 0.002 0.003 0.000 0.00517 OS5699 0.001 0.003 0.000 0.0041a KONGSP 0.017 0.014 0.000 0.03214a KB08 −0.075 −0.032 0.001 −0.10614a KB11 −0.088 −0.030 0.001 −0.11723a KV08 −0.079 −0.007 0.001 −0.08524a KV12 −0.097 −0.025 0.001 −0.12025a KV02 −0.111 −0.028 0.002 −0.13726a LV956104 −0.085 −0.028 0.001 −0.11227a FM5670 −0.054 −0.011 0.001 −0.06429a LV956107 0.108 0.035 −0.001 0.141
First order levelling surveys conducted in the Krafla areain 1989, 1995 and 2000 (Bjornsson and Eysteinsson 1998;Magnusson 2003) form the basis of our deformation model.The data exceed the requirements for height correction ofthe gravity data as they have a standard deviation of lessthan 1.5 cm and the levelling stations are equivalent or closeto the micro-gravity stations (Rymer 1996). We considertwo distinct periods, 1990–1995 and 1996–2003, in order totake into account change in productivity of the geothermalpower plant from 30 to 60 MW between 1995 and 1996(Hauksson and Benjamınsson 2003).
Twelve SAR images from the European Remote Sensing(ERS) satellites 1 and 2 (track 9, frame 2277), acquiredduring the 1993–2000 period, allowed the formation oftwelve interferograms, with reasonable coherence. The fourwith the best coherence were selected for modelling andthe average subsidence rate over the time period (spanningfrom 2 to 6 years) was inferred. Overall, the subsidencerate calculated from these data decays from ∼1.5 cm/yearin late 1996 to ∼1.1 cm/year in late 1997.
Previous work indicates that the deformation rate atKrafla has been decaying rapidly since 1989 (Tryggvason1994). In order to extrapolate the deformation data atKrafla from 2000 to 2003, it is important to know thetrend of this decay. The vertical change over a time periodobtained from different measurements by several authors isexpressed as a rate (cm/year) in Fig. 3. The points may be
Exponential decay of deflation in the Krafla area
y = 2E+196e-0.23x
R2 = 0.96
0.0
1.0
2.0
3.0
4.0
5.0
6.0
7.0
1989 1994 1999 2004
1
2
3
4
56 7
8
Def
latio
n ra
te (
cm/y
r)
Fig. 3 Exponential decay of deflation in cm in the area of maximumdeflation at Krafla. Numbers refer to publications: 1 (Tryggvason1994), 2 (Bjornsson and Eysteinsson 1998), 3 (Sigmundsson et al.1997), 4–6 and 8 (this paper) and 7 (Agustsson 2001)
fitted by two straight lines or by an exponential curve. Weprefer an exponential fit because the subsidence is expectedto show exponential behaviour like the subsidence at otherIcelandic volcanoes (Sturkell and Sigmundsson 2000). Agood fit through the data with a root mean square of 0.96,is found using estimates for average maximum subsidencefrom published data (Tryggvason 1994; Sigmundsson et al.1997; Bjornsson and Eysteinsson 1998; Agustsson 2001;Henriot et al. 2001) together with the newly acquired
424
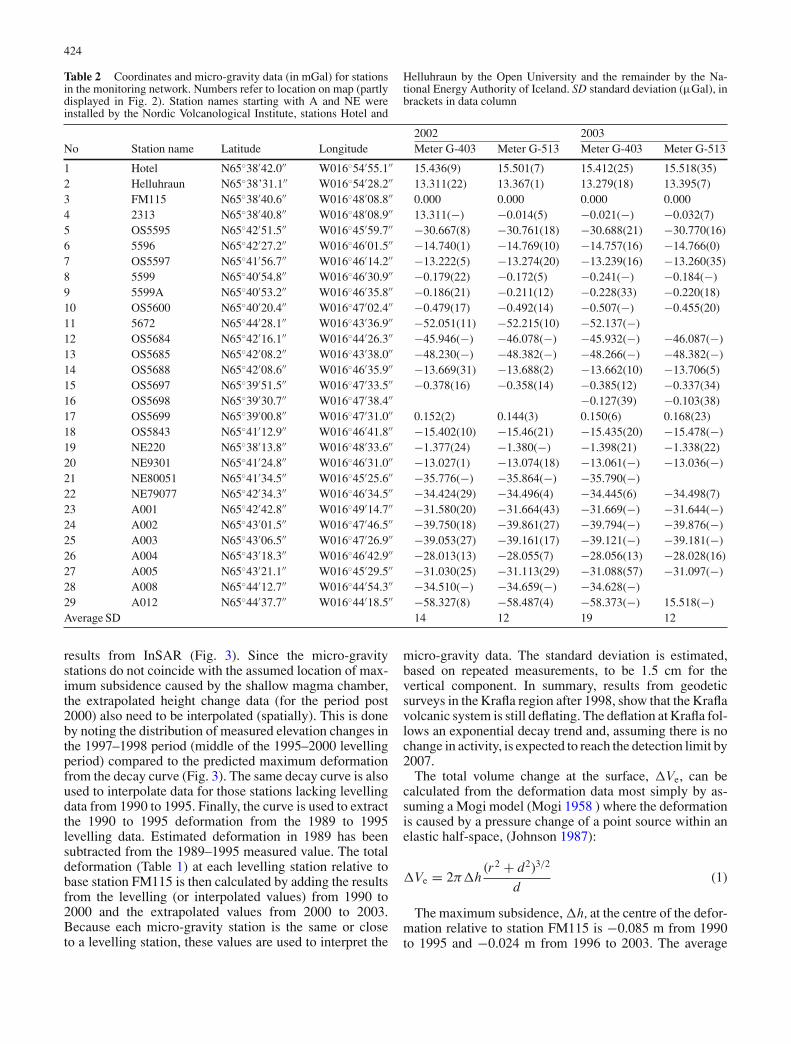
Table 2 Coordinates and micro-gravity data (in mGal) for stationsin the monitoring network. Numbers refer to location on map (partlydisplayed in Fig. 2). Station names starting with A and NE wereinstalled by the Nordic Volcanological Institute, stations Hotel and
Helluhraun by the Open University and the remainder by the Na-tional Energy Authority of Iceland. SD standard deviation (µGal), inbrackets in data column
2002 2003No Station name Latitude Longitude Meter G-403 Meter G-513 Meter G-403 Meter G-513
1 Hotel N65◦38′42.0′′ W016◦54′55.1′′ 15.436(9) 15.501(7) 15.412(25) 15.518(35)2 Helluhraun N65◦38’31.1′′ W016◦54′28.2′′ 13.311(22) 13.367(1) 13.279(18) 13.395(7)3 FM115 N65◦38′40.6′′ W016◦48′08.8′′ 0.000 0.000 0.000 0.0004 2313 N65◦38′40.8′′ W016◦48′08.9′′ 13.311(−) −0.014(5) −0.021(−) −0.032(7)5 OS5595 N65◦42′51.5′′ W016◦45′59.7′′ −30.667(8) −30.761(18) −30.688(21) −30.770(16)6 5596 N65◦42′27.2′′ W016◦46′01.5′′ −14.740(1) −14.769(10) −14.757(16) −14.766(0)7 OS5597 N65◦41′56.7′′ W016◦46′14.2′′ −13.222(5) −13.274(20) −13.239(16) −13.260(35)8 5599 N65◦40′54.8′′ W016◦46′30.9′′ −0.179(22) −0.172(5) −0.241(−) −0.184(−)9 5599A N65◦40′53.2′′ W016◦46′35.8′′ −0.186(21) −0.211(12) −0.228(33) −0.220(18)10 OS5600 N65◦40′20.4′′ W016◦47′02.4′′ −0.479(17) −0.492(14) −0.507(−) −0.455(20)11 5672 N65◦44′28.1′′ W016◦43′36.9′′ −52.051(11) −52.215(10) −52.137(−)12 OS5684 N65◦42′16.1′′ W016◦44′26.3′′ −45.946(−) −46.078(−) −45.932(−) −46.087(−)13 OS5685 N65◦42′08.2′′ W016◦43′38.0′′ −48.230(−) −48.382(−) −48.266(−) −48.382(−)14 OS5688 N65◦42′08.6′′ W016◦46′35.9′′ −13.669(31) −13.688(2) −13.662(10) −13.706(5)15 OS5697 N65◦39′51.5′′ W016◦47′33.5′′ −0.378(16) −0.358(14) −0.385(12) −0.337(34)16 OS5698 N65◦39′30.7′′ W016◦47′38.4′′ −0.127(39) −0.103(38)17 OS5699 N65◦39′00.8′′ W016◦47′31.0′′ 0.152(2) 0.144(3) 0.150(6) 0.168(23)18 OS5843 N65◦41′12.9′′ W016◦46′41.8′′ −15.402(10) −15.46(21) −15.435(20) −15.478(−)19 NE220 N65◦38′13.8′′ W016◦48′33.6′′ −1.377(24) −1.380(−) −1.398(21) −1.338(22)20 NE9301 N65◦41′24.8′′ W016◦46′31.0′′ −13.027(1) −13.074(18) −13.061(−) −13.036(−)21 NE80051 N65◦41′34.5′′ W016◦45′25.6′′ −35.776(−) −35.864(−) −35.790(−)22 NE79077 N65◦42′34.3′′ W016◦46′34.5′′ −34.424(29) −34.496(4) −34.445(6) −34.498(7)23 A001 N65◦42′42.8′′ W016◦49′14.7′′ −31.580(20) −31.664(43) −31.669(−) −31.644(−)24 A002 N65◦43′01.5′′ W016◦47′46.5′′ −39.750(18) −39.861(27) −39.794(−) −39.876(−)25 A003 N65◦43′06.5′′ W016◦47′26.9′′ −39.053(27) −39.161(17) −39.121(−) −39.181(−)26 A004 N65◦43′18.3′′ W016◦46′42.9′′ −28.013(13) −28.055(7) −28.056(13) −28.028(16)27 A005 N65◦43′21.1′′ W016◦45′29.5′′ −31.030(25) −31.113(29) −31.088(57) −31.097(−)28 A008 N65◦44′12.7′′ W016◦44′54.3′′ −34.510(−) −34.659(−) −34.628(−)29 A012 N65◦44′37.7′′ W016◦44′18.5′′ −58.327(8) −58.487(4) −58.373(−) 15.518(−)Average SD 14 12 19 12
results from InSAR (Fig. 3). Since the micro-gravitystations do not coincide with the assumed location of max-imum subsidence caused by the shallow magma chamber,the extrapolated height change data (for the period post2000) also need to be interpolated (spatially). This is doneby noting the distribution of measured elevation changes inthe 1997–1998 period (middle of the 1995–2000 levellingperiod) compared to the predicted maximum deformationfrom the decay curve (Fig. 3). The same decay curve is alsoused to interpolate data for those stations lacking levellingdata from 1990 to 1995. Finally, the curve is used to extractthe 1990 to 1995 deformation from the 1989 to 1995levelling data. Estimated deformation in 1989 has beensubtracted from the 1989–1995 measured value. The totaldeformation (Table 1) at each levelling station relative tobase station FM115 is then calculated by adding the resultsfrom the levelling (or interpolated values) from 1990 to2000 and the extrapolated values from 2000 to 2003.Because each micro-gravity station is the same or closeto a levelling station, these values are used to interpret the
micro-gravity data. The standard deviation is estimated,based on repeated measurements, to be 1.5 cm for thevertical component. In summary, results from geodeticsurveys in the Krafla region after 1998, show that the Kraflavolcanic system is still deflating. The deflation at Krafla fol-lows an exponential decay trend and, assuming there is nochange in activity, is expected to reach the detection limit by2007.
The total volume change at the surface, �Ve, can becalculated from the deformation data most simply by as-suming a Mogi model (Mogi 1958 ) where the deformationis caused by a pressure change of a point source within anelastic half-space, (Johnson 1987):
�Ve = 2π�h(r2 + d2)3/2
d(1)
The maximum subsidence, �h, at the centre of the defor-mation relative to station FM115 is −0.085 m from 1990to 1995 and −0.024 m from 1996 to 2003. The average
425
depth to the source, d, is 2,800 m as inferred from previousgeodetic modelling (Sigmundsson et al. 1997; Arnadottiret al. 1998; Rymer et al. 1998). The horizontal distancefrom the centre of deformation to this source, r, is 1,300 min the 1990–1995 period and 2,000 m in the 1996–2003 pe-riod. FM115 is located within the deformation zone and anyestimates for �Ve are therefore minimum values. InSARdata covering most of this period (de Zeeuw-van Dalfsenet al. 2004a ) indicate that the subsidence does not extendbeyond this region and therefore the volume calculated for�Ve is considered to be realistic.�Ve is calculated to be−0.006 km3 for the 1990 to 1995 period and −0.002 km3
for the 1996 to 2003 period.
Micro-gravity
The first micro-gravity measurements in the Krafla regionwere made in 1965 (Bjornsson et al. 1979) and extensivework was done during the beginning of the 1975–1984rifting episode (Johnsen et al. 1980). Since then, micro-gravity measurements have been made yearly at Kraflafrom 1990 to 1997, with the exception of 1993 (Rymeret al. 1998), and again in 2002 and 2003.
The 29 main micro-gravity stations (partly displayed inFig. 2 and Table 2) at Krafla can be grouped according to lo-cation: Hreindyraholl (5672, A008 and A012), Leirhnjukur(A001, A002, A003 and A004), Hlıdar Krafla (OS5595,5596, 5597, OS5688, NE79077 and A005), Hvıtholaklif(5599, 5599a, OS5843, NE9301 and NE80051) andSouth Hlıdardalur (NE220, OS5697, OS5698, OS5699 andOS5600). There are four control or base stations (Hotel,FM115, Helluhraun and 2313) and two stations that falloutside these groups (OS5684 and OS5685).
Previous results
Rymer et al. (1998) investigated post-eruptive gravitychanges from 1990 to 1996 inclusively. After correctionsfor elevation change, significant net gravity decreases onthe order of –50 µGal, were observed over the modelledMogi-type deflation source. Net gravity increases up to60 µGal were observed 1–3 km from the centre of de-formation. In addition to this, here the effect of water ex-traction has been taken into account for the 1990–1996period.
Gottsmann and Rymer (2002) analysed �g/�h gradientsfor all available data from 1977 to 1996. Their theory sug-gests that the relationship between the measured gradient,the free air gradient (FAG) and the Bouguer corrected freeair gradient (BCFAG) predicts which process is responsiblefor caldera unrest.
New results
The micro-gravity network at Krafla (Fig. 2, Table 2)was re-measured during the summers of 1997, 2002 and
-80
-60
-40
-20
0
20
40
60
1990 1992 1994 1996 1998 2000 2002
Gra
vity
cha
nge
[µG
al]
0
4,000
8,000
12,000
Wa
ter e
xtractio
n [kT
on
]
Hreindýrahóll
Leirhnúkur
Hvíthólarklif
South Hlídardalur
Hlídar Krafla
Average gravity
No data
Water extraction
Micro-gravity and water extraction data at Krafla from 1990-2003
15 µGal uncertainty
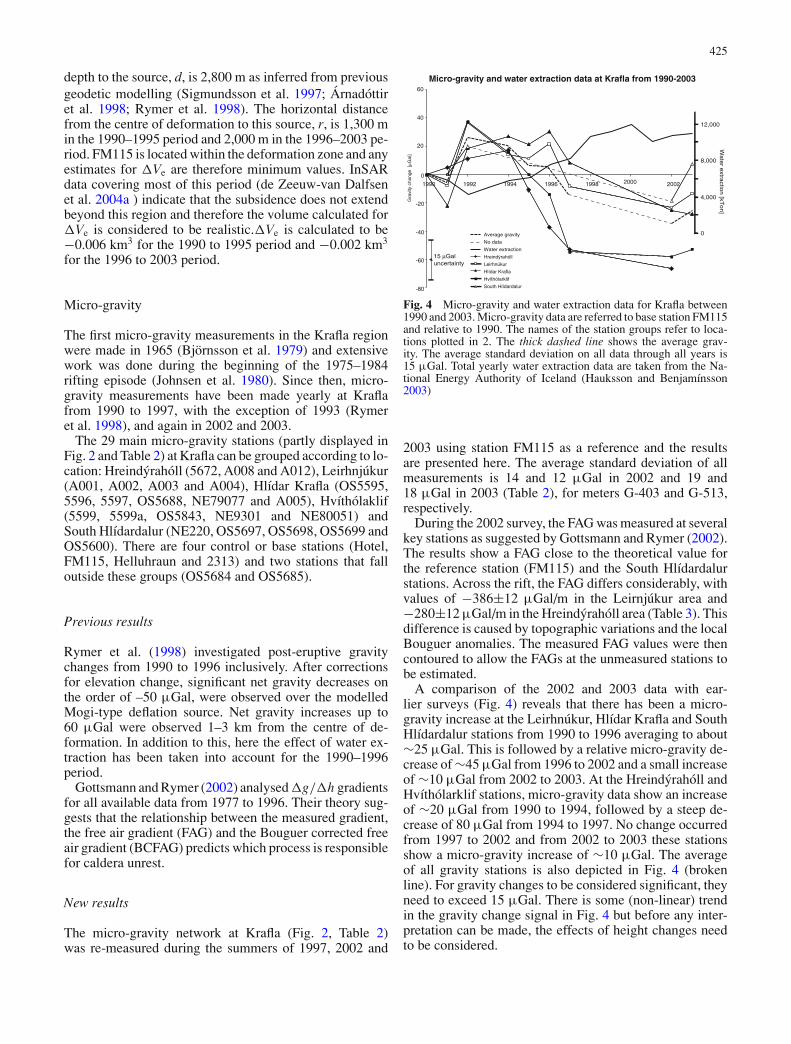
Fig. 4 Micro-gravity and water extraction data for Krafla between1990 and 2003. Micro-gravity data are referred to base station FM115and relative to 1990. The names of the station groups refer to loca-tions plotted in 2. The thick dashed line shows the average grav-ity. The average standard deviation on all data through all years is15 µGal. Total yearly water extraction data are taken from the Na-tional Energy Authority of Iceland (Hauksson and Benjamınsson2003)
2003 using station FM115 as a reference and the resultsare presented here. The average standard deviation of allmeasurements is 14 and 12 µGal in 2002 and 19 and18 µGal in 2003 (Table 2), for meters G-403 and G-513,respectively.
During the 2002 survey, the FAG was measured at severalkey stations as suggested by Gottsmann and Rymer (2002).The results show a FAG close to the theoretical value forthe reference station (FM115) and the South Hlıdardalurstations. Across the rift, the FAG differs considerably, withvalues of −386±12 µGal/m in the Leirnjukur area and−280±12 µGal/m in the Hreindyraholl area (Table 3). Thisdifference is caused by topographic variations and the localBouguer anomalies. The measured FAG values were thencontoured to allow the FAGs at the unmeasured stations tobe estimated.
A comparison of the 2002 and 2003 data with ear-lier surveys (Fig. 4) reveals that there has been a micro-gravity increase at the Leirhnukur, Hlıdar Krafla and SouthHlıdardalur stations from 1990 to 1996 averaging to about∼25 µGal. This is followed by a relative micro-gravity de-crease of ∼45 µGal from 1996 to 2002 and a small increaseof ∼10 µGal from 2002 to 2003. At the Hreindyraholl andHvıtholarklif stations, micro-gravity data show an increaseof ∼20 µGal from 1990 to 1994, followed by a steep de-crease of 80 µGal from 1994 to 1997. No change occurredfrom 1997 to 2002 and from 2002 to 2003 these stationsshow a micro-gravity increase of ∼10 µGal. The averageof all gravity stations is also depicted in Fig. 4 (brokenline). For gravity changes to be considered significant, theyneed to exceed 15 µGal. There is some (non-linear) trendin the gravity change signal in Fig. 4 but before any inter-pretation can be made, the effects of height changes needto be considered.

426
Tabl
e3
Cal
cula
tion
ofth
ene
tmic
ro-g
ravi
tych
ange
for
the
1990
–199
5an
d19
96–2
003
peri
ods.
Num
bers
refe
rto
loca
tion
onm
ap(F
ig.2
).FA
Gva
lues
with
outs
uper
scri
pted
are
valu
esm
easu
red
atth
atst
atio
n(±
12µ
Gal
/m)
Stat
ion
nam
esin
brac
kets
are
the
near
estl
evel
ling
stat
ion
ifdi
ffer
entf
rom
grav
ityst
atio
n.
1990
–199
519
96–2
003
No
Nam
eFA
G[µ
Gal
/m]
Hei
ghtc
hang
e[c
m]
Exp
ecte
d�
g[µ
Gal
]M
easu
red
�g
[µG
al]
Net
�g
[µG
al]
Hei
ght
chan
ge[c
m]
Exp
ecte
d�
g[µ
Gal
]M
easu
red
�g
[µG
al]
Net
�g
[µG
al]
1H
otel
(KO
NG
SP)
−0.3
104.
482
−14
3549
1.72
0−5
1925
3FM
115
−0.3
000.
000
00
00.
000
00
05
OS5
595
−0.3
14−6
.082
19−1
−20
−2.3
347
−73
−81
655
96−0
.322
a−1
3.12
542
35−7
−5.0
3616
−3−2
07
OS5
597
−0.3
22a
−7.0
4323
7249
−2.7
029
−62
−71
955
99A
−0.3
04−0
.960
330
27−0
.369
1−5
5−5
611
5672
−0.2
90a
11.8
44−3
4−5
294.
545
−13
−33
−20
12O
S568
4−0
.347
0.48
0−2
1517
0.18
4−1
−104
−104
14O
S568
8(K
B08
&11
)−0
.330
a−1
0.24
434
5219
−3.9
3113
−48
−61
23A
001
(KV
08)
−0.3
65a
7.68
3−2
841
692.
948
−11
−42
−31
24A
002
(KV
12)
−0.3
75a
1.92
1−7
1522
0.73
7−3
−61
−58
25A
003
(KV
02)
−0.3
860.
960
−412
160.
369
−1−7
7−7
526
A00
4(L
V95
6104
)−0
.348
a−8
.963
31−5
5−8
6−3
.439
125
−727
A00
5(F
M56
70)
−0.3
15a
−3.5
2111
−23
−34
−1.3
514
−14
−19
29A
012
(LV
9561
07)
−0.2
8011
.204
−31
−13
194.
299
−12
−53
−41
a Val
ues
have
been
estim
ated
from
cont
ours
Bol
dnu
mbe
rsre
pres
entn
etgr
avity
decr
ease
s
Calculation of net micro-gravity
The net micro-gravity changes were calculated using themeasured values of the FAG where possible (Table 3), orwith estimates derived from the contoured FAG values. Thevertical motion at each station is multiplied by the FAG tocalculate the expected micro-gravity change. Subtraction ofthe expected changes due to vertical motion from the mea-sured micro-gravity changes yields the net micro-gravitychange due to changes in sub-surface mass. The net micro-gravity changes for the two periods under considerationare most easily visualised on contour maps (Fig. 5). Station5596 was excluded from the contouring during the 1996–2003 period because the net gravity decrease found at thislocation is small (−20 µGal) compared to that found atnearby gravity stations (∼−75 µGal). A reason for this
40
60
40
20
20
20
0
0
-20
-40
0
-20
-40
-40
-60-80-100
-60
Leirbotnar Sudurhlídar
Hvíthólaklif
Vesturhlídar Krafla
Leirbotnar
Sudurhlídar
Hvíthólaklif
Vesturhlídar Krafla
65 40' N
65 45' N
16 50' W 16 45' W
16 50' W 16 45' W
65 40' N
65 45' N
27
29
1769
22 16 -86 -34
19
19
0
-20
-7
49
-56
-20
-104-31-58
-75
-7 -19
-61
-41
0
-81-20
-71
1 km
N
N1 km
a) 1990-1995
b) 1996-2003
ab
c d
Fig. 5 a Net micro-gravity contours (in µGal) at Krafla from 1990 to1995 following data from Table 3. Gravity stations are represented bya cross and numbers refer to values as in Table 3. Diamonds representdrill holes for water extraction. Positive contours are dashed whilenegative contours are solid lines. The thick dashed line shows thecaldera rim. The area of net gravity decrease is located in the centre ofthe caldera. Suggested locations of possible shallow magma chamber(see Table 4) are depicted with black stars a, b, c and d. b Net micro-gravity contours (in µGal) at Krafla from 1996 to 2003 following datafrom Table 3 and same symbols as a. Note that the anomalous datapoints FM5596 and A012 have not been taken into account duringthe contouring. Area of net gravity decrease is concentrated aroundthe drill hole sites

427
Fig. 6 Water extraction from drill holes in the Krafla area from 1990to 2003 (Hauksson and Benjamınsson 2003). Note that extraction hasdoubled since 1998 compared to the 1990–1996 period. Names referto locations of drill sites as used in Fig. 5 Leirbotnar; Hvıtholaklif;
Bjarnarflag; Sudurhlıdar; Vesturhlıdar
could be that this gravity station is closest to the drill-holesite where, in 2002, 1,400 kt of water was injected into thesystem.
There is an important contrast between the 1990–1995and 1996–2003 data. During the 1990 to 1995 period, anet gravity decrease of −85 µGal was concentrated aroundthe Leirhnukur stations. This coincides with the locationof the latest activity during the Krafla fires and suggestsit may have been caused by magmatic processes. Duringthe 1996 to 2003 period, almost all stations show a netmicro-gravity decrease. An E–W elongated feature witha maximum net gravity decrease of −100 µGal can beidentified. This area correlates well with the location of thedrill-hole sites. Processes responsible for the observationscould include (1) influences of the geothermal power plant:water mass extraction and the increased cooling rate ofthe shallow magma body (causing contraction) caused bythe increased water circulation and (2) drainage of magmafrom a shallow magma body.
Influence of the geothermal power plant
Water extraction (dotted line in Fig. 4) has been increasingsteadily since 1992 (Hauksson and Benjamınsson 2003).The average yearly water extraction of ∼6,000 kt for the1990–1996 period, increased to ∼11,000 kt for the 1998–2003 period (Fig. 6). There is a clear inverse correlation be-tween the average gravity and the water extraction (Fig. 4).
The fact that there are net micro-gravity changes suggeststhat sub-surface mass changes are occurring. Sub-surfacemass decrease could be caused by movement of the steam-water interface, drainage of magma from a reservoir orextraction of geothermal water at the Krafla power plant.Movement of the steam-water interface can not be excludedbut its influence will be too small to explain the observedmass changes (Gottsmann and Rymer 2002). We suggestthe two alternative explanations are more likely causes. Inorder to better understand the non-magmatic influence onthe gravity signal, we consider in more detail the extractionof water at the geothermal power plant (Fig. 6).
From 1990 to 2002, a total of 7.94×10³ kt (7.94×10¹⁰ kg)water was extracted at the various drill holes (Hauksson andBenjamınsson 2003). The drill holes are co-located withthe micro-gravity network (Fig. 5) and are concentrated atfive sites located (1) south of the caldera in Bjarnarflag,(2) at Hvıtholaklif, (3) in the centre of the caldera (nearthe power plant), (4) at Leirbotnar, and (5) south of theKrafla mountain at Sudurhlıdar Krafla. The extraction ofwater was more or less constant from 1981 to 1996, butsubsequently almost doubled due to the increased demandcaused by the installation of the second turbine in 1996.To complicate the mass balance picture even further, injec-tion of water into the system was initiated in 1999. Thisdid not contribute considerably until 2002 when injectionamounted to 1,400 kt/year. This may account for the smallincrease in raw gravity observed from 2002 to 2003.
The Krafla geothermal system consists of two separategeothermal zones at different depths (Stefansson 1981).The shallower of the two is avoided during exploitation ofthe field because of its lower temperature and associationwith calcite deposition. The top of the ∼1,000-m-thickdeeper zone is located around 1,100–1,300 m.
The gravitational effect of the water extraction in theKrafla area can be simulated by a cylinder with changingdensity in the same way as used by Hunt (1970) for theWairakei geothermal field in New Zealand. The densitychange, σ , can be calculated as follows:
σ = �m
(πr2h)(2)
The mass change in kg, �m, in the centre of the caldera(excluding Bjarnarflag), is −2.28×10¹⁰ kg from 1990 to1995 and −6.57×10¹⁰ kg from 1996 to 2003. The radiusof the cylinder or the effected area, r, varies from 100 to10,000 m. The height of the cylinder or the thickness of theaquifer, h, is 100 m.
The gravitational effect, �g, on the surface above thecentre of this cylinder can then be calculated as follows(Parasnis 1979):
�g = 2πGσ[h2 − z +
√r2 + z2 −
√r2 + h2
2
](3)
where G, is the gravitational constant, of6.67×10−11 Nkg2/m2. The depth of the cylinder, z,from the surface to the top of the aquifer, varies from 100to 1,300 m. h2 is the depth to the bottom of the cylinder, inmetres. Equation 3 is empirical and variations in g will becaused by variations in z, h2 and r.
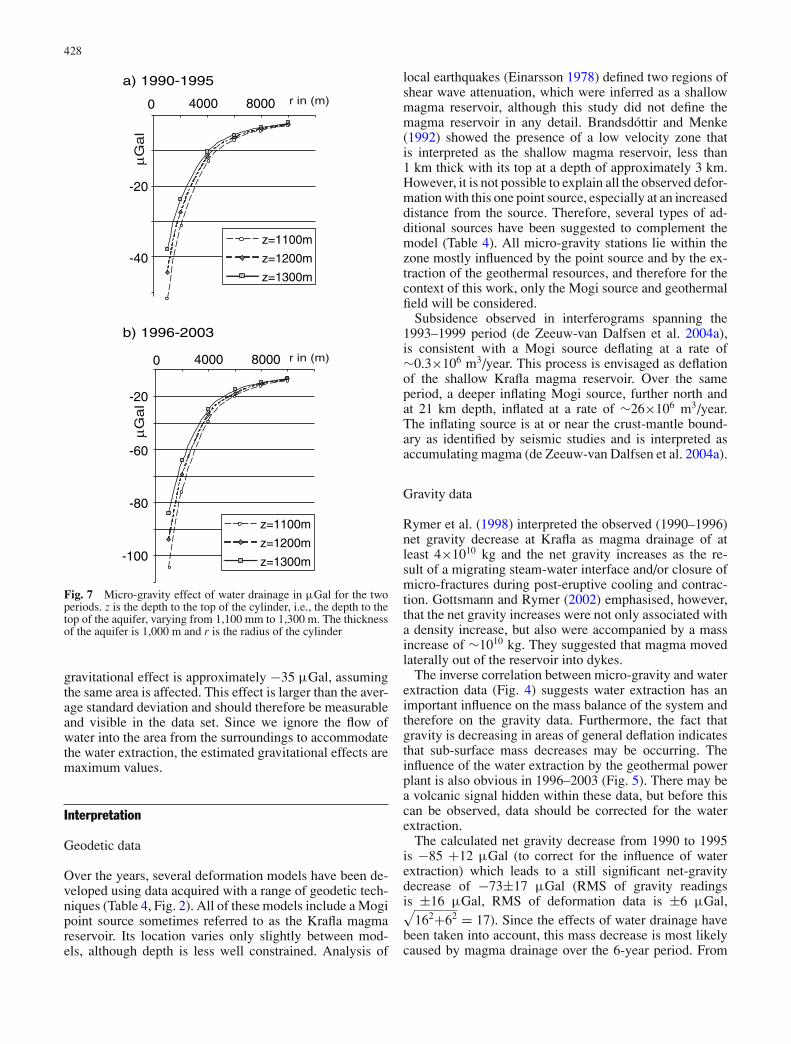
The results of the calculations are shown in Fig. 7. Theaverage estimate of the gravitational effect of the waterextraction from 90 to 1995 is approximately −12 µGal,assuming the extraction affects an area with a radius of4 km. This is the approximate radius of the caldera and theaquifer is known to exist as a broad layer within this region(Stefanson 1981). This effect is smaller than the averagestandard deviation on the data set and may therefore notbe detectable. For the period of 1996–2003, the estimated
428
b) 1996-2003
z=1100m
z=1200m
z=1300m
0 4000 8000
-20
-40
0 4000 8000
-20
-80
µG
al
-60
-100
a) 1990-1995
µG
al
r in (m)
r in (m)
z=1100m
z=1200m
z=1300m
Fig. 7 Micro-gravity effect of water drainage in µGal for the twoperiods. z is the depth to the top of the cylinder, i.e., the depth to thetop of the aquifer, varying from 1,100 mm to 1,300 m. The thicknessof the aquifer is 1,000 m and r is the radius of the cylinder
gravitational effect is approximately −35 µGal, assumingthe same area is affected. This effect is larger than the aver-age standard deviation and should therefore be measurableand visible in the data set. Since we ignore the flow ofwater into the area from the surroundings to accommodatethe water extraction, the estimated gravitational effects aremaximum values.
Interpretation
Geodetic data
Over the years, several deformation models have been de-veloped using data acquired with a range of geodetic tech-niques (Table 4, Fig. 2). All of these models include a Mogipoint source sometimes referred to as the Krafla magmareservoir. Its location varies only slightly between mod-els, although depth is less well constrained. Analysis of
local earthquakes (Einarsson 1978) defined two regions ofshear wave attenuation, which were inferred as a shallowmagma reservoir, although this study did not define themagma reservoir in any detail. Brandsdottir and Menke(1992) showed the presence of a low velocity zone thatis interpreted as the shallow magma reservoir, less than1 km thick with its top at a depth of approximately 3 km.However, it is not possible to explain all the observed defor-mation with this one point source, especially at an increaseddistance from the source. Therefore, several types of ad-ditional sources have been suggested to complement themodel (Table 4). All micro-gravity stations lie within thezone mostly influenced by the point source and by the ex-traction of the geothermal resources, and therefore for thecontext of this work, only the Mogi source and geothermalfield will be considered.
Subsidence observed in interferograms spanning the1993–1999 period (de Zeeuw-van Dalfsen et al. 2004a),is consistent with a Mogi source deflating at a rate of∼0.3×10⁶ m3/year. This process is envisaged as deflationof the shallow Krafla magma reservoir. Over the sameperiod, a deeper inflating Mogi source, further north andat 21 km depth, inflated at a rate of ∼26×106 m3/year.The inflating source is at or near the crust-mantle bound-ary as identified by seismic studies and is interpreted asaccumulating magma (de Zeeuw-van Dalfsen et al. 2004a).
Gravity data
Rymer et al. (1998) interpreted the observed (1990–1996)net gravity decrease at Krafla as magma drainage of atleast 4×10¹⁰ kg and the net gravity increases as the re-sult of a migrating steam-water interface and/or closure ofmicro-fractures during post-eruptive cooling and contrac-tion. Gottsmann and Rymer (2002) emphasised, however,that the net gravity increases were not only associated witha density increase, but also were accompanied by a massincrease of ∼1010 kg. They suggested that magma movedlaterally out of the reservoir into dykes.
The inverse correlation between micro-gravity and waterextraction data (Fig. 4) suggests water extraction has animportant influence on the mass balance of the system andtherefore on the gravity data. Furthermore, the fact thatgravity is decreasing in areas of general deflation indicatesthat sub-surface mass decreases may be occurring. Theinfluence of the water extraction by the geothermal powerplant is also obvious in 1996–2003 (Fig. 5). There may bea volcanic signal hidden within these data, but before thiscan be observed, data should be corrected for the waterextraction.
The calculated net gravity decrease from 1990 to 1995is −85 +12 µGal (to correct for the influence of waterextraction) which leads to a still significant net-gravitydecrease of −73±17 µGal (RMS of gravity readingsis ±16 µGal, RMS of deformation data is ±6 µGal,√
162+62 = 17). Since the effects of water drainage havebeen taken into account, this mass decrease is most likelycaused by magma drainage over the 6-year period. From

429
Table 4 Model data for a Mogi point source as reported by various authors throughout the years. EDM Electronic Distance Measurements;InSAR Interferometric Synthetic Aperture Radar
Parameters of Mogi sourceReference Latitude(◦) Longitude(◦) Depth (km) Additional source Input data
Bjornsson (1985) − − − Molten layer 5–7 km feedingshallow reservoir
Magneto-telluric
Trygvasson (1986) see star a,Fig. 5
65.715 16.797 2.6 Three more stacked reservoirs, at5–10 km, >20 km and deeper
EDM, lake level, tilt
Rymer et al. (1996) same asstar a, Fig. 5
65.715 16.797 ∼2.5 EDM, lake level, tilt
Sigmundsson et al. (1997) seestar b, Fig. 5
65.71 16.79 3 Line source InSAR
Arnadottir et al. (1998) see starc, Fig. 5
65.715 16.806 ∼3 Dike EDM, tilt, heightdifferences
De Zeeuw-van Dalfsen et al.(2004a) see star d, Fig. 5
65.72 16.78 ∼2.4 Mogi 2 at 65.83 ◦N, 16.73 ◦W,line source
InSAR
1996 to 2003 the calculated net gravity decrease is −100+35 µGal (to correct for the influence of water extraction)which culminates in a significant net gravity decrease of−65±17 µGal over the 8-year period.
The mass change (�M) within a spherical (point source)body, whose depth is much greater than its radius, causesa gravitational effect on the surface (�g) that is related toits mass change (�M) by (Dzurisin et al. 1980; Johnson1987; Rymer and Tryggvason 1993):
�M = �g(r2 + d2)3/2
Gd(4)
where G is the Universal gravitational constant of6.67×10−11 Nm2/kg2. The depth to the point source, d, is2,800 m as estimated by geodetic modelling (Tryggvason1986 ; Sigmundsson et al. 1997; Arnadottir et al. 1998;Rymer et al. 1998). The horizontal distance to thissource, r, is 1,300 m from 1990–1995 and 2,000 m from1996–2003 (i.e. the horizontal distance from the pointsource to the area with maximum net gravity change).
In the following text, we refer to edifice volume changes(�Ve) and relate them to sub-surface magma volumechanges (�Vm) and magma chamber volume changes(�Vch). Following Eq. 4, a mass decrease of 1.1×10¹¹ kgoccurred from 1990–1995, followed by a decrease of1.4×1011 kg from 1996 to 2003. This is equivalent tomagma drainage of ∼2×10¹⁰ kg/year visualised as a con-tinuous ongoing process. After correction for the waterextraction, the two periods show very similar drainagerates and, because drainage is visualized as a continu-ous process, we prefer to interpret the data in terms ofvolume changes for the whole period at once. Assum-ing a density of 2,700 kg/m3 for the sub-surface magmabody, the total mass decrease represents a minimum changein magma outflow volume (�Vm) of −0.09 km3 from1990 to 2003.
Earlier (see section Deformation data, Previous results),we calculated the total volume change at the surface (�Ve)from 1990 to 2003 to be −0.008 km3. This volume changecomprises a combination of volume change caused by wa-
ter extraction, cooling/contraction of the magma reservoirand/or magma drainage from the magma reservoir. Because�Ve is dependent on the maximum subsidence at the centreof the caldera (h in Eq. 1), the curve following the decay ofdeformation is also representative for �Ve. This suggeststhat �Ve was not significantly influenced by water extrac-tion, as data would not follow a smooth line if influenced bya significant change in water extraction between 1995 and1996. Therefore, we argue that there is no need to correct�Ve for water extraction. Following Johnson et al. (2000),the corresponding sub-surface volume change of the Mogisource (�Vch) is two thirds of the surface deflation volumeor −0.005 km3. InSAR modelling (de Zeeuw-van Dalfsenet al. 2004a) at Krafla suggests a total volume change ofthe deflating Mogi source of the same order of magnitude(−0.002 km3 for the 1993–1999 period).
Comparing this value with the calculated total changein Mogi source volume (�Vm) we find that the magmadrainage volume is actually 17 times larger than the Mogisource volume. It has been suggested that volumetric de-compression of stored magma may be caused by the vari-ation in reservoir pressure accompanying magma drainage(Johnson 1992; Johnson et al. 2000). The net volumechange of the stored magma, �Vc, changes because of thisdecompression. A combination of reduction of the reser-voir size, �Vch, and decompression of the stored magma,�Vc would accommodate the magma drainage. Althoughnot our preferred explanation, part of the volume discrep-ancy could also be explained by boiling in the geothermalsystem and density decrease in excess of that suggestedonly from extracted water.
Discussion and conclusions
The results from this work show significant mass decreasesat the Krafla caldera which we interpret in terms of magmadrainage. The Krafla caldera is located on the NorthernVolcanic Zone in Iceland and as such is part of a largervolcanic system. It is therefore important to extend our in-terpretation and discussion beyond the Krafla area. In the

430
past three years, more and more data covering the North-ern Volcanic Zone have been analysed. To advance ourknowledge of volcanic processes, it is important to use allavailable information.
The Askja volcanic centre in the Dyngjufjoll central vol-cano (Sigvaldason 2002) hosts three calderas, the largestone being the circular Askja caldera. Askja volcano is lo-cated 80 km south of the Krafla volcanic system but isalso located on the divergent spreading plate boundary inN. Iceland. The most recent eruption began there in Octo-ber 1961 and continued into early December of the sameyear. de Zeeuw-van Dalfsen et al. (2004b) found a netmicro-gravity decrease of 115 µGal at Askja caldera, cor-responding to a sub-surface mass decrease of 1.6×10¹¹ kgbetween 1988 and 2003. They suggested the mass decreaseof 0.125 m3 s−1 was due to magma drainage from a shal-low reservoir. They suggest that extensional tectonic forcesgenerate space in the ductile lower crust to accommodatedrainage (of degassed magma) from the shallow magmachamber to deeper levels. The work presented here sug-gests a mass decrease of 2.5×10¹¹ kg, implying a drainagerate of 0.23 m3 s−1 at Krafla from 1990 to 2003, which isof the same order of magnitude as that at Askja. We sug-gest that pressure reduction along the plate boundary due tothe plate spreading process can accommodate this ongoingmagma drainage from the shallow magma chamber. Linksbetween the two volcanoes have been suggested by severalauthors (Tryggvason 1986; Rymer and Tryggvason 1993;Sturkell et al. 2004–accepted).
Deflation at both the Askja and Krafla volcanoes is decay-ing through time. However, while Askja has been deflatingwith an average rate of 5 cm/year between 1988 and 2003,Krafla deflated at only 1 cm/year between 1990 and 2003.Also, the �Vm/�Vch ratio at Askja for the 1988–2003 pe-riod is 3, roughly five times smaller then the ratio estimatedfor Krafla (17) for the 1990–2003 period. A possible ex-planation for this difference might be the existence of theextensive geothermal system at Krafla, cooling the volcanicsystem more rapidly.
Recently, re-evaluation of new and previously publishedgeodetic data at both volcanoes suggests a best fit for mod-els with two stacked magma reservoirs. For Askja, Sturkellet al. (2004-accepted) suggested two magma reservoirs at3 and 16 km depth; while at Krafla, de Zeeuw-van Dalf-sen et al. (2004a) suggested the existence of deep magmaaccumulation at 21 km depth in addition to a magma reser-voir at 2.8 km depth. It is possible that a pressure-link be-tween these volcanoes exists along the ductile lower crustin Iceland. We suggest that after the Krafla fires, co-riftingpressure decrease of the deeper source stimulated the sub-sequent inflow of magma. This inflow might influence con-ditions along the plate boundary as far away as Askja,70 km to the south. The pressure of the deeper reservoirat Krafla will reach a critical value and eventually magmawill rise to the shallow magma chamber, possibly initiatinga new rifting episode. The last significant eruptive periodat Krafla before 1974 was in 1724–1729 and this may in-dicate the timescale for replenishment of the upper magmachamber.
It is possible that not only Icelandic but also other vol-canoes located on a constructive plate boundary are inter-connected at depth. Several authors have suggested con-nections between volcanoes in other parts of the world inall types of tectonic settings, but the suggested connectionsare mostly shallow in nature. At Mauna Loa and Kilaueain Hawaii, the possible connection between the two volca-noes remains controversial. Recently, Miklius and Cervelli(2003) suggested a crustal-level interaction between thetwo magma systems based on a short timescale correlationfound in continuous deformation data.
This paper has demonstrated the power of using a rangeof techniques simultaneously to study volcanoes. We haveshown it can improve the understanding of the ongoing pro-cesses at the studied volcano as well as offering constraintson the dynamics of, and linkages through, the volcanic sys-tem at a broader scale. We anticipate that using a rangeof techniques concurrently will considerably increase ourknowledge of volcanic systems in the future.
Acknowledgements This work was supported by The GeologicalSociety, London and an Open University studentship. H.R.’s workon this project (1990–2003) was supported by the Royal Society. Wewould like to thank all the people that have participated in collectionof the data at Krafla, especially Ton de Zeeuw, Andrew J. Balland Halldor Olafsson who helped during the most recent surveys.The geodetic work on this project was supported by a grant fromthe Icelandic Research Council RANNlS and F.S.’s work on thisproject has been supported by the Retina project (EVG1-CT-00046).An earlier version of the manuscript was greatly improved bydiscussion with Dave Rothery and reviews by J.T. Freymueller andan anonymous reviewer.
References
Agustsson SM (2001) Landhædarbreytingar a Kroflusvædinu:hædarmælingar 2000: samanburdur vid mælingar 1995. (inIcelandic). Haskoli islands, Reykjavık, 30 pp
Arnadottir T, Sigmundsson F, Delaney PT (1998) Sources of crustaldeformation associated with the Krafla, Iceland, eruption ofSeptember 1984. Geophys Res Lett 25(7):1043–1046
Bjornsson A (1985) Dynamics of crustal rifting in NE Iceland. JGeophys Res 90:10151–10162
Bjornsson A, Eysteinsson H (1998) Breytingar a landhæd vid Kroflu1974–1995. Samantekt a landhæardmælingum. (in Icelandic).Nat. Energy Auth., Reykjavık OS-98002
Bjornsson A, Johnsen G, Sigurdsson S, Thorbergsson G (1979)Rifting of the plate boundary in north Iceland 1975–1978. JGeophys Res 84(B6):3029–3038
Brandsdottir B, Menke W (1992) Thin low-velocity zone withinthe Krafla caldera, NE Iceland attributed to a small magmachamber. Geophys Res Lett 19:2381–2384
Brandsdottir B, Menke W, Einarsson P, White RS, Stapels RK(1997) Faroe-Iceland ridge experiment 2: crustal structure ofthe Krafla central volcano. J Geophys Res 102(B4):7867–7886
Carbone D, Rymer H (1999) Calibration shifts in a LaCoste-and-Romberg gravimeter: comparison with a Scintrex CG-3M.Geophys Prospect 47(1):73–83
CNES (2000) Installation guide for DIAPASON. Centre Nationald’etudes spatial, Toulouse
de Zeeuw-van Dalfsen E, Pedersen R, Sigmundsson F, Pagli C(2004a) Satellite Radar Interferometry 1993–1999 suggestsdeep accumulation of magma near the crust-mantle boundaryat the Krafla volcanic system, Iceland. Geophys Res Lett31(13):L13611, doi:10.1029/2004GL020059

431
de Zeeuw-van Dalfsen E, Rymer H, Sigmundsson F, SturkellE (2004b) Net gravity decrease at Askja volcano, Iceland:constraints on processes responsible for continuous calderadeflation, 1988–2003. J Volcanol Geotherm Res 139:227–239
Dzurisin D, Anderson LA, Eaton GP, Koyanagi RY, LipmanPW, Lockwood JP, Okamura RT, Puniwai GS, Sako MK,Yamashita KM (1980) Geophysical observations of KilaueaVolcano, Hawaii, 2: constraints on the magma supply duringNovember 1975–September 1977. J Volcanol Geotherm Res7(3–4):241–269
Einarsson P (1978) S-wave shadows in the Krafla caldera inNE-Iceland, evidence for a magma chamber in the crust. BullVolcanol 41:1–9
Einarsson P (1991) Earthquakes and present day tectonism inIceland. Tectonophysics 189:261–279
Ewart JA, Voight B, Bjornsson A (1991) Elastic deformation modelsof Krafla Volcano, Iceland, for the decade 1975 through 1985.Bull Volcanol 53:436–459
Gottsmann J, Berrino G, Rymer H, Williams-Jones G (2003) Hazardassessment during caldera unrest at the Campi Flegrei, Italy:a contribution from gravity-height gradients. Earth Planet SciLett 211:295–309
Gottsmann J, Rymer H (2002) Deflation during caldera unrest:constraints on subsurface processes and hazard prediction fromgravity-height data. Bull Volcanol 64(5):338–348
Gudmundsson BT, Arnorsson S (2002) Geochemical monitoringof the Krafla and Namafjall geothermal areas, N. Iceland.Geothermics 31:195–243
Gudmundsson S, Carstensen JM, Sigmundsson F (2002) Un-wrapping ground displacement signals in satellite radarinterferograms with aid of GPS data and MRF regularization.IEEE Transact Geosci Remote Sensing 40(8):1743–1754
Hauksson T, Benjamınsson J (2003) Krafla og Bjarnarflag Afkostborhola og efnainnihald vatns og gufu ı borholum og vinnslurasari 2002 (in Icelandic). Rep. Landsvirkjun, Kroflusto, pp 1–70
Henriot O, Villemin T, Jouanne F (2001) Long period interferogramsreveal 1992–1998 steady rate of deformation at Krafla volcano(North Iceland). Geophys Res Lett 28(6):1067–1070.
Hunt TM (1970) Net mass loss from the Wairakei geothermal field,New Zealand. Geothermics 2(1):487–491
Johnsen GV, Bjornsson A, Sigurdsson S (1980) Gravity andelevation changes caused by magma movement beneath Kraflacaldera, northeast Iceland. J Geophysics 47:132–140
Johnson D (1987) Elastic and inelastic magma storage at Kilaueavolcano. In: Volcanism in Hawaii, vol 2, United StatesGovernment printing Office, Washington, pp. 1297–1306
Johnson DJ (1992) Dynamics of magma storage in the sum-mit reservoir of Kilauea volcano, Hawaii. J Geophys Res97(B2):1807–1820
Johnson DJ, Sigmundsson F, Delaney PT (2000) Comment on’Volume of magma accumulation or withdrawal estimatedfrom surface uplift or subsidence, with application to the 1960collapse of Kilauea volcano’ by P.T. Delaney and D.F. McTigue.Bull Volcanol 61:491–493
Magnusson Ifi (2003) fiyngdarmælingar vid Kroflu arid 2000 (in ice-landic). Internal report Landsvirkjun, Orkustofnun, OS-2003/06
Massonnet D, Feigl K (1995) Discrimination of geophysicalphenomena in satellite radar interferograms. Geophys Res Lett22(12):1537–1540
Massonnet D, Feigl K (1998) Radar interferometry and its applicationto changes in earth’s surface. Rev Geophys 36(4):441–500
Miklius A, Cervelli P (2003) Interaction between Kilauea andMauna Loa. Nature 421:229
Mogi K (1958) Relations between the eruptions of various volcanoesand the deformations of the ground surfaces around them. BullEarthquake Res Inst 36:99–134
Moller D, Ritter B (1980) Geodetic measurements and horizontalcrustal movements in the rift zone of NE Iceland. J Geophys47(1–3):110–119
Rossi MJ (1997) Morphology of the 1984 open-channel lava flowat Krafla volcano, northern Iceland. Geomorphology 20:95–112
Rymer H (1989) A contribution to precision microgravity data-analysis using Lacoste and Romberg gravity meters. GeophysJ 97(2):311–322
Rymer H (1996) Microgravity monitoring. In: Monitoring andmitigation of volcano hazards, Springer, Berlin Heidelberg NewYork, pp. 169–198
Rymer H, Cassidy J, Locke CA, Barboza MV, Barquero J, BrenesJ, Van der Laat R (2000) Geophysical studies of the recent15-year eruptive cycle at Poas Volcano, Costa Rica. J VolcanolGeotherm Res 97(1–4):425–442
Rymer H, Cassidy J, Locke CA, Sigmundsson F (1998) Post-eruptivegravity changes from 1990 to 1996 at Krafla volcano, Iceland.J Volcanol Geotherm Res 87(1–4):141–149
Rymer H, Tryggvason E (1993) Gravity and elevation changes atAskja, Iceland. Bull Volcanol 55(5):362–371
Sigmundsson F, Vadon H, Massonnet D (1997) Readjustment ofthe Krafla spreading segment to crustal rifting measured bysatellite radar interferometry. Geophys Res Lett 24(15):1843–1846
Sigvaldason GE (2002) Volcanic and tectonic processes coincid-ing with glaciation and crustal rebound: an early Holocenerhyolitic eruption in the Dyngjufjoll volcanic centre and theformation of the Askja caldera, north Iceland. Bull Volcanol64(3–4):192–205
Stefansson V (1981) The Krafla geothermal field, northeast Iceland.In: Geothermal systems: principles and case histories. Wiley,New York, pp. 273–294
Sturkell E, Sigmundsson F (2000) Continuous deflation of the Askjacaldera, Iceland, during the 1983–1998 noneruptive period. JGeophys Res 105(B11):25671–25684
Sturkell E, Sigmundsson F, Slunga R (2004) 1983–2003 decayingrate of deflation at Askja caldera: pressure decrease in an ex-tensive magma plumbing system at a spreading plate boundary.Bull Volcanol
Tryggvason E (1986) Multiple magma reservoirs in a rift-zonevolcano: ground deformation and magma transport duringthe September 1984 eruption of Krafla, Iceland. J VolcanolGeotherm Res 28(1–2):1–44
Tryggvason E (1994) Surface deformation at the Krafla volcano,North Iceland, 1982–1992. Bull Volcanol 56:98–107
Williams-Jones G, Rymer H, Rothery DA (2003) Gravity changesand passive SO2 degassing at the Masaya caldera complex,Nicaragua. J Volcanol Geotherm Res 123:137–160