Integration of H2 Separation Membranes with CO2 … · integration of h 2 separation membranes with...
116
Integration of H 2 Separation Membranes with CO 2 Capture and Compression November 30, 2009 DOE/NETL- 401/113009
Transcript of Integration of H2 Separation Membranes with CO2 … · integration of h 2 separation membranes with...

Integration of H2 Separation Membranes with CO2 Capture and Compression November 30, 2009
DOE/NETL- 401/113009

INTEGRATION OF H2 SEPARATION
MEMBRANES WITH CO2 CAPTURE AND
COMPRESSION
DOE/NETL-401/113009
FINAL REPORT
November 30, 2009
NETL Contact:
Eric Grol
Chemical Engineer
Office of Systems, Analysis, and Planning
National Energy Technology Laboratory
www.netl.doe.gov
ii
ACKNOWLEDGEMENTS
This report was prepared by JM Energy Consulting, Inc. for Technology & Management
Services, Inc. (TMS), at the request of the U.S. DOE National Energy Technology
Laboratory (NETL). This study was conducted over a forty-three month period
beginning in April 2006.
Project Managers
Mr. Eric Grol (Dec. 2008 - Nov. 2009) Mr. Steven Ostheim
Mr. Jared Ciferno (Apr. 2006 - Nov. 2008) Technology & Management Services, Inc.
U.S. Department of Energy National Energy Technology Laboratory
National Energy Technology Laboratory Pittsburgh, PA
Pittsburgh, PA
The author would like to express his appreciation Mr. Jared Ciferno, who developed
many of the IGCC simulation and economic models and data used for this analysis, and
was instrumental in the development of the framework used for this assessment.
Others who contributed their reviews, comments, and suggestions include:
Mr. Jim Acquaviva Pall Corp. Mr. Nicholas Means Parsons/NETL
Dr. Kathyrn Berchthold LANL Dr. Bryan Morreale DOE/NETL/ORD
Dr. Richard Ciora Media & Process Technology Dr. Kevin O‟Brien SRI International
Mr. Jose Figueroa DOE/NETL/SCC Mr. Ron Schoff Parsons/NETL
Mr. Eric Grol DOE/NETL/OSAP Mr. Brian Sylcott TMS/NETL
Dr. David Luebke DOE/NETL/ORD Mr. Tom Tarka DOE/NETL/OSAP
Mr. Michael Matuszewski DOE/NETL/OSAP Ms. Jenny Tennant DOE/NETL/SCC
Your help was invaluable.
DISCLAIMER
Any conclusions, comments or opinions expressed in this report are solely those of the
author and do not represent any official position held by TMS, NETL, DOE, or the U.S.
Government. Information contained herein was based on the best data available to the
author at the time of the report‟s preparation. In many cases, it was necessary to
interpolate, extrapolate, estimate, and use engineering judgment to fill in gaps in these
data. Therefore, all results presented here should be interpreted in the context of the
specific requirements for accuracy dictated by any intended end use application of these
data.

iii
EXECUTIVE SUMMARY
A core mission of the U.S. Department of Energy‟s (DOE) Carbon Sequestration
Program is to foster the development of commercially-ready technologies for CO2
capture and sequestration. R&D goals have been established for electric power
generation from next-generation Integrated Gasification Combined Cycle (IGCC) plants
and for future coal-to-hydrogen fuel plants.
Currently for carbon capture, the best available coal gasification system employs a two-
stage physical-absorption system for H2S removal and CO2 capture. Coal is fed to a
high-efficiency gasifier, and the conversion of CO in the raw syngas to H2 is maximized
in a water-gas shift (WGS) reactor. For IGCC applications, the acid gas removal (AGR)
system located downstream of the WGS produces a hydrogen-rich fuel gas that is
combusted in a gas turbine (GT) topping cycle. H2S removed in the AGR is sent to a
Claus sulfur plant; while the CO2 recovered is dehydrated and compressed for transport
to an appropriate sequestration site. When hydrogen is the desired product, the optimal
design is slightly different; less shifting of the raw syngas is required and the AGR is
followed by a pressure swing adsorption (PSA) system to recover high-purity hydrogen
for compression and sale. The by-product gas from the PSA, which contains H2, CO and
CO2, is combusted with oxygen in a combined-cycle power system to generate electric
power for plant use. The CO2 from the AGR and the exhaust from the combined-cycle is
dehydrated and compressed for transport and sequestration.
R&D supported by the U.S. DOE is investigating alternatives to absorption for capturing
CO2 that may exceed the performance of existing technologies and achieve the DOE
program goals. Membrane gas separation has been touted as one possible approach.
Membranes have a number of advantages, in that they are usually compact, have no
moving parts, have low maintenance, and are highly reliable. In this assessment,
alternative flowsheets incorporating membranes that may out-perform current
technologies for CO2 capture were investigated. An initial screening study identified
several novel integrations of membranes for IGCC applications. For IGCC, the use of a
N2 sweep gas along with integration of the membrane within the CO2 compression train
is particularly attractive since high-purity hydrogen is not required for power generation.
Potential advantages of this approach in addition to the elimination of the two-stage
absorption unit are:
The hydrogen membranes operate at a high feed pressure with a large partial-pressure
differential across the membrane
The use of a sweep gas improves the driving force across the membrane and also
serves as the GT diluent
Hydrogen re-compression is eliminated and the hydrogen fuel and sales gas are
delivered at the required pipeline and turbine pressures, respectively.
The membrane is placed well downstream of the gasifier at a location where most of
the contaminants in the raw syngas have been removed
iv
The option described above can be coupled with bulk H2 recovery from the syngas after
the WGS. This enables a high-purity side stream to be produced for use in other
applications. PSA can be used for bulk separation with H2 recoveries in the range of 50%
to 80%. This plant configuration allows for maximum flexibility in either the production
of hydrogen for sale, or of power generation and sale, or both.
Membranes may also be integrated with the WGS reactors to enhance reaction
equilibrium and improve the yield of hydrogen. Screening of various alternatives
indicated the best approach here is to eliminate the low-temperature WGS reactor and
place membranes before and after the second-stage reactor.
Based on the configurations discussed above membrane selectivity and cost targets were
developed to provide guidance in the selection of new and the evaluation of existing CCS
Program R&D projects. Permselectivities for H2 relative to CO2 will need to exceed 40
for the IGCC system to achieve the 90% CO2 capture goal. The integration of gas
separation membranes by itself cannot achieve the R&D cost goal for a maximum
increase in COE of 10% for CCS. However, membrane technologies do hold promise of
achieving costs less than current state-of-the-art CO2 absorption technologies, when
coupled with new technologies for lowering the cost and efficiency penalty associated
with CO2 compression and for improving the overall efficiency of IGCC electric power
generation.
A major challenge for implementing these CO2 capture strategies is the development of
membrane materials with high selectivities for H2 relative to CO2. The IGCC process
with CO2 capture using gas separation membranes, along with a similar process co-
producing hydrogen and power, have been modeled with the Aspen process flowsheet
simulator. Cases were developed for both warm and cold gas clean-up, and for no gas
clean-up, where both CO2 and H2S are co-sequestered. Based on the results of this
modeling, membrane development performance and cost targets are being developed.

v
TABLE OF CONTENTS
ACKNOWLEDGEMENTS ................................................................................................ ii
DISCLAIMER .................................................................................................................... ii
EXECUTIVE SUMMARY ............................................................................................... iii
LIST OF FIGURES .......................................................................................................... vii
LIST OF TABLES ........................................................................................................... viii
LIST OF ACRONYMS ..................................................................................................... ix
I. INTRODUCTION ........................................................................................................ 1
II. GAS SEPARATION MEMBRANE PLACEMENT.................................................... 2
A. Placement Options ............................................................................................. 4
B. Temperature & Pressure Considerations ............................................................ 8
C. Materials Considerations .................................................................................. 10
D. Summary .......................................................................................................... 13
III. SYSTEM DEVELOPMENT & EVALUATION ....................................................... 15
A. Membrane Assessment Methodology .............................................................. 15
B. Conceptual Design Basis and Data Sources ..................................................... 18
a. Membrane Screening Analysis ............................................................. 18
b. IGCC System Analysis ......................................................................... 19
IV. SCREENING & FLOWSHEET DEVELOPMENT ................................................... 23
A. Screening Analysis ........................................................................................... 23
a. Post-WGS H2 recovery ......................................................................... 24
b. CO2 Compressor Interstage H2 recovery .............................................. 26
c. WGS Interstage H2 Recovery................................................................ 29
B. Membrane / IGCC Integration ......................................................................... 30
V. DETAILED MODELING & ECONOMIC ANALYSIS .......................................... 32
A. Configuration Ia – Membrane integration post-WGS with ........................... 32
H2 re-compression
B. Configuration Ib – Membrane integration post-WGS with ........................... 34
permeate sweep
C. Configuration IIa – Membrane integration with CO2 compression ................ 36
and permeate sweep
D. Configuration IIb – PSA & membrane integration with CO2 compression .... 37
and permeate sweep
E. Configuration III – Membrane integration with WGS ................................... 38
VI. GAS SEPARATION MEMBRANE R&D TARGETS .............................................. 41
VII. CONCLUSIONS ....................................................................................................... 43

vi
NOMENCLATURE ......................................................................................................... 44
REFERENCES ................................................................................................................. 45
PROJECT-RELATED TECHNIAL PAPERS & PRESENTATIONS ............................ 47
APPENDIX A – Tutorial on Gas Separation Membranes ................................................ 48
APPENDIX B – Membrane Screening Methodology ...................................................... 65
APPENDIX C – Derivation of Theoretical Membrane Recovery (no WGS Activity) .... 73
APPENDIX D – Derivation of Theoretical CO Conversion (no Separation) .................. 78
APPENDIX E – Derivation of Theoretical Membrane Productivity (WGS Activity) ..... 83
APPENDIX F – Finite-Difference Based Membrane Separator/Reactor Model ............. 89
APPENDIX G – IGCC System Analysis Methodology ................................................... 97
APPENDIX H – Economic Analysis Methodology ....................................................... 101
APPENDIX I – Primer on Targeting Membrane Cost & Performance ........................ 103

vii
LIST OF FIGURES
Figure 1. Integration of Membrane-Based Gas Separations with IGCC ....................... 5
Figure 2. Gas Separation Membrane Integrations ......................................................... 6
Figure 3. WGS Membrane Reactor ............................................................................... 7
Figure 4. Mechanisms for Membrane-Based Gas Separations ................................... 10
Figure 5. Temperature Match for Membrane/IGCC Integration ................................ 13
Figure 6. Membrane Assessment Methodology .......................................................... 16
Figure 7. IGCC Flowsheet Changes Required for CCS .............................................. 19
Figure 8. Post-WGS H2 Recovery Schematic ............................................................. 25
Figure 9. CO2 Compressor Interstage H2 Recovery Schematic .................................. 26
Figure 10. WGS Reactor Interstage H2 Recovery Schematic ....................................... 29
Figure 11. Configuration Ia - Membrane integration post-WGS with .......................... 33
H2 re-compression
Figure 12. Configuration Ib - Membrane integration post-WGS with .......................... 35
permeate sweep
Figure 13. Configuration IIa - Membrane integration with CO2 compression ............. 36
and permeate sweep
Figure 14. Configuration IIb - PSA & membrane integration with CO2 compression . 37
and permeate sweep
Figure 15. Cost Curves for Configuration Ia2 ............................................................... 42
viii
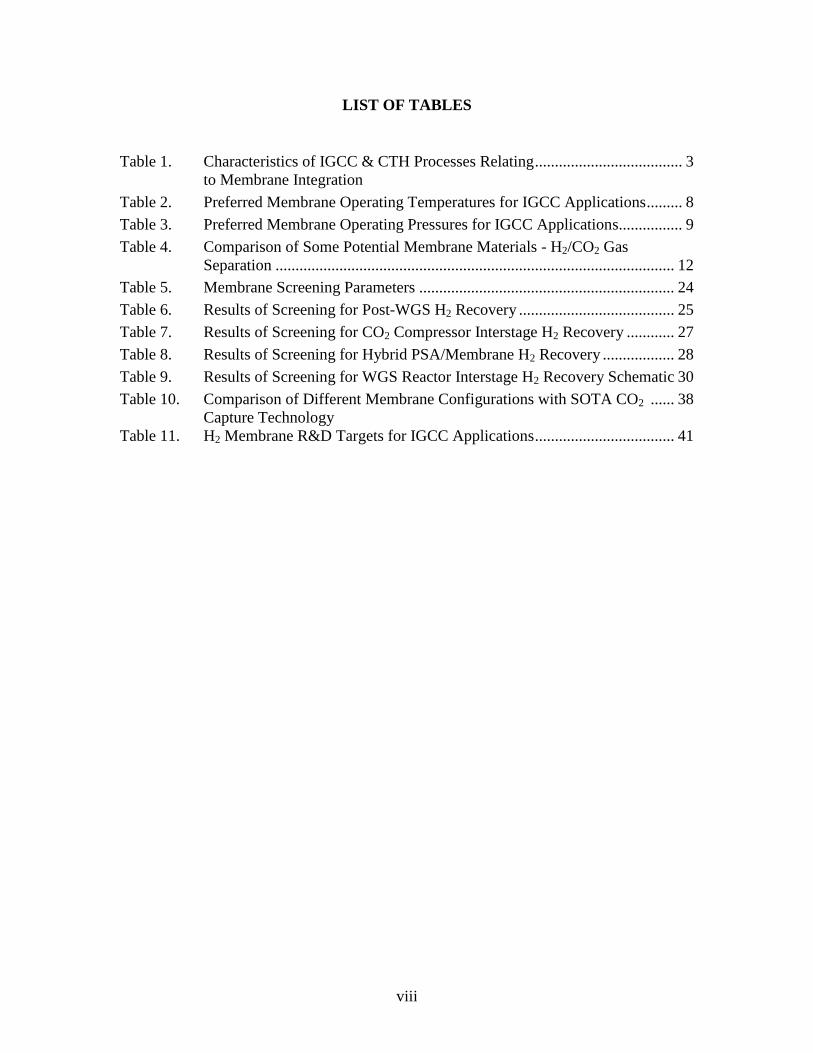
LIST OF TABLES
Table 1. Characteristics of IGCC & CTH Processes Relating ..................................... 3
to Membrane Integration
Table 2. Preferred Membrane Operating Temperatures for IGCC Applications ......... 8
Table 3. Preferred Membrane Operating Pressures for IGCC Applications................ 9
Table 4. Comparison of Some Potential Membrane Materials - H2/CO2 Gas
Separation .................................................................................................... 12
Table 5. Membrane Screening Parameters ................................................................ 24
Table 6. Results of Screening for Post-WGS H2 Recovery ....................................... 25
Table 7. Results of Screening for CO2 Compressor Interstage H2 Recovery ............ 27
Table 8. Results of Screening for Hybrid PSA/Membrane H2 Recovery .................. 28
Table 9. Results of Screening for WGS Reactor Interstage H2 Recovery Schematic 30
Table 10. Comparison of Different Membrane Configurations with SOTA CO2 ...... 38
Capture Technology
Table 11. H2 Membrane R&D Targets for IGCC Applications ................................... 41

ix
LIST OF ACRONYMS
AGR - Acid Gas Removal
ASU - Air Separation Unit
BFD - Block Flow Diagram
CC - Combined Cycle
CCS - Carbon Capture and Sequestration
CTH - Coal-To-Hydrogen
DOE - Department of Energy
EOR - Enhanced Oil Recovery
EPRI - Electric Power Research Institute
GE - General Electric
GPU - Gas Permeation Units
GT - Gas Turbine
HF - Hollow Fibers
HHV - Higher Heating Value
HPS - High Pressure Steam
HRSG - Heat Recovery Steam Generator
HTS - High Temperature Shift
IEA - International Energy Agency
IGCC - Integrated Gasification Combined Cycle
LANL - Los Alamos National Laboratory
LHV - Lower Heating Value
LPS - Low Pressure Steam
LTS - Low Temperature Shift
M - 1,000
MDEA - Methyl-Diethanol Amine
MF - Moisture Free
MM - 1,000,000
MTS - Medium Temperature Shift
MW - Megawatt
NETL - National Energy Technology Laboratory
OSAP - Office of System Analysis and Planning (NETL)
ORD - Office of Research and Development (NETL)
PBI - Polybenzimidazole
PEI - Princeton Environnemental Institute
PM - Particulate Matter
PRB - Powder River Basin
PSA - Pressure Swing Adsorption
SCC - Strategic Center for Coal (DOE)
SCF - Standard Cubic Feet (60oF, 1 atm)
SCFD - Standard Cubic Feet per Day
SI - Système International
SOTA - State Of The Art
SRU - Sulfur Recovery Unit
ST - Steam Turbine

x
STP - Standard Pressure and Temperature (0oC, 1 atm)
SWS - Spiral-Wound Sheets
TGT - Tail Gas Treating
tPD - tonnes (1,000 kg) per day
TPD - Tons Per Day
WGS - Water Gas Shift
JMEC for TMS/NETL 11/30/09 03/13/06
1
I. INTRODUCTION
A number of technical and economic evaluations have been performed on H2/CO2
separation membranes in recent years. These include studies sponsored by the U.S. DOE
National Energy Technology Laboratory (NETL) [1-7]. The focus of these studies was
the production of high-purity hydrogen from coal-derived syngas (i.e. coal-to-hydrogen,
CTH). These evaluations estimated the performance of conceptually advanced
membrane systems (i.e. so called water-gas-shift (WGS) membrane reactors), but did not
address the performance of more near-term membrane separation options.
The Princeton Environmental Institute (PEI) has investigated hydrogen production from
coal as well as the use of membranes to capture CO2 from integrated-gasification
combined-cycle (IGCC) power plants [8,9]. PEI identified a number of key factors that
could significantly improve the performance and economics of pre-combustion CO2
capture using gas separation membranes. It is advantageous that the H2 be produced at
the gas turbine (GT) inlet pressure to eliminate the need for re-compression and that
nitrogen, available from the air separation unit (ASU), be used both as a sweep gas for
the membrane to increase H2 recovery, and as a diluent for the gas GT feed to increase
power output. PEI and others have also considered the sequestration of “dirty” CO2 (CO2
containing H2S) as a low-cost alternative to H2S removal and sulfur recovery.
In all of the studies cited above, the question of where in the process flowsheet the
membrane might best perform its function of separating H2 and CO2 was not considered.
How membrane technologies can be coupled with other existing or advanced separation
technologies to improve the performance of the total system has also not been examined
in any detail. In the analysis reported on here, a scoping study was performed to pre-
screen process flowsheet configurations prior to the initiation of more detailed analyses.
The most attractive options were then used to develop detailed plant material and energy
balances, followed by equipment sizing and costing, and economic evaluation. Based on
this analysis, gas separation membrane process and economic performance targets were
developed to guide future research relating to the development of hydrogen separation
membranes for CO2 capture from future IGCC power plants.

JMEC for TMS/NETL 11/30/09 03/13/06
2
II. GAS SEPARATION MEMBRANE PLACEMENT
Gas separation membranes are used for hydrogen recovery in petroleum refineries and
ammonia plants, and for CO2 removal in natural gas processing. These large-scale
commercial applications share a number of distinct characteristics, which result in
competitive advantages for membranes versus other gas separation technologies. These
characteristics are:
1) The feed gas contains moderate to high concentrations of the more
permeable gas
2) The feed gas is at moderate to high pressure
3) The gas species being separated display moderate to high selectivities
4) Absolute purity of the product gas is not required
5) High recovery of the product gas is not required
6) The feed gas is at moderate temperature
7) The feed gas is relatively clean, requiring little or no pretreatment
8) Low to moderate volumes of gas are being processed
The transport mechanism employed in most gas separation membranes is favored in
situations where characteristics 1 - 5 hold. Large partial pressure differences across the
membrane are desirable to facilitate gas transport, this implies high feed gas pressures,
low permeate gas pressures, and high feed concentrations of the more permeable gas.
However, without high selectivity, membrane transport may be rapid, but gas separation
will be poor.
Characteristics 6 and 7 allow membranes to be manufactured from relatively inexpensive
materials, such as polymers. This significantly reduces material and manufacturing costs.
Many polymers can be fabricated into hollow fibers (HF) or spiral-wound sheets (SWS),
allowing extremely large area-to-volume packing densities per module1. Commercial
polymer membranes used for gas separations are limited to temperatures less than the
glass transition temperature of the polymer2. While many materials are resistant to
exposure to water and particulates, coalescing filters for entrained liquids and particulate
removal, may be required upstream of the membrane module. It is critical that no liquids
be present on the feed-side of the membrane, since this will degrade membrane
performance. Therefore, this stream should also remain above the dew point of all gas
components to ensure no condensation occurs within the module. Performance of a
membrane may also be reversibly or irreversibly damaged by the presence of trace
amounts of fouling or otherwise corrosive compounds3.
1 Greater than 1,000 ft
2/ft
3 [3,000 m
2/m
3] for HF and 300 ft
2/ft
3 [1,000 m
2/m
3] for SWS membrane modules.
2 On the order of 120
oC (250
oF), and no greater than 150
oC (300
oF) for commercial polymer membranes.
3 Hydrogen sulfide (H2S) and aromatic compounds, if present at significant levels, may permanently
damage many polymer membrane materials.
JMEC for TMS/NETL 11/30/09 03/13/06
3
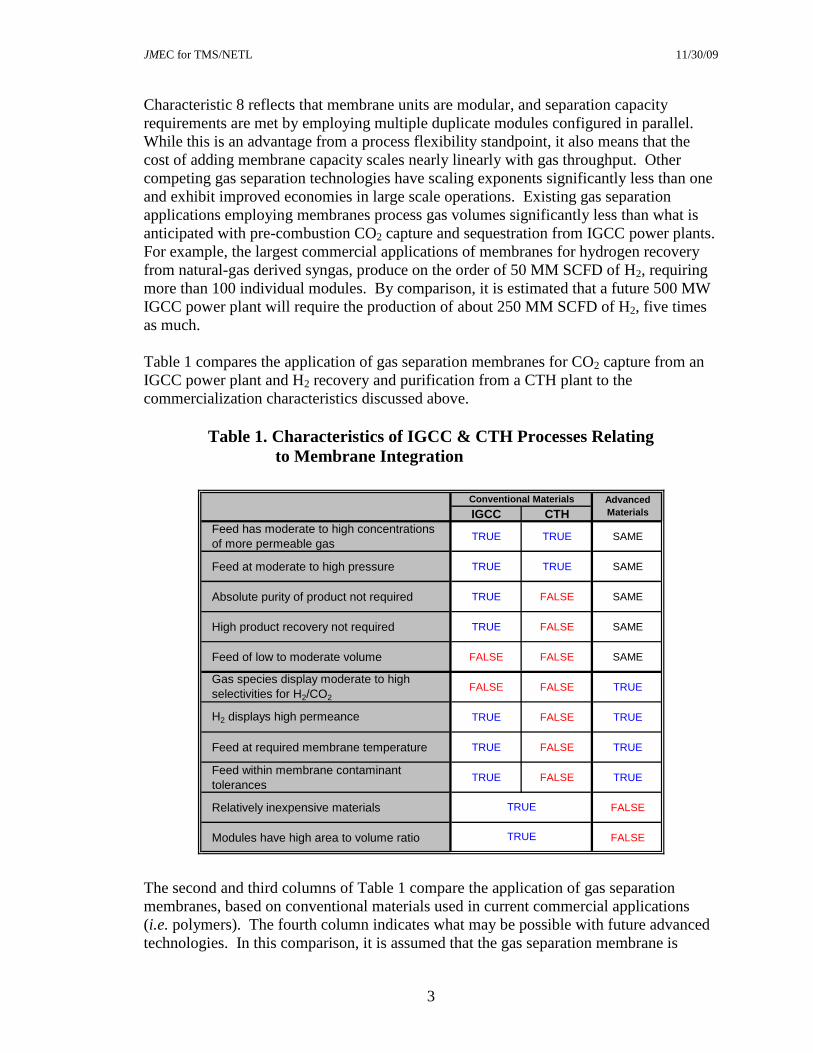
Characteristic 8 reflects that membrane units are modular, and separation capacity
requirements are met by employing multiple duplicate modules configured in parallel.
While this is an advantage from a process flexibility standpoint, it also means that the
cost of adding membrane capacity scales nearly linearly with gas throughput. Other
competing gas separation technologies have scaling exponents significantly less than one
and exhibit improved economies in large scale operations. Existing gas separation
applications employing membranes process gas volumes significantly less than what is
anticipated with pre-combustion CO2 capture and sequestration from IGCC power plants.
For example, the largest commercial applications of membranes for hydrogen recovery
from natural-gas derived syngas, produce on the order of 50 MM SCFD of H2, requiring
more than 100 individual modules. By comparison, it is estimated that a future 500 MW
IGCC power plant will require the production of about 250 MM SCFD of H2, five times
as much.
Table 1 compares the application of gas separation membranes for CO2 capture from an
IGCC power plant and H2 recovery and purification from a CTH plant to the
commercialization characteristics discussed above.
Table 1. Characteristics of IGCC & CTH Processes Relating
to Membrane Integration
The second and third columns of Table 1 compare the application of gas separation
membranes, based on conventional materials used in current commercial applications
(i.e. polymers). The fourth column indicates what may be possible with future advanced
technologies. In this comparison, it is assumed that the gas separation membrane is
IGCC CTH
Feed has moderate to high concentrations
of more permeable gasTRUE TRUE SAME
Feed at moderate to high pressure TRUE TRUE SAME
Absolute purity of product not required TRUE FALSE SAME
High product recovery not required TRUE FALSE SAME
Feed of low to moderate volume FALSE FALSE SAME
Gas species display moderate to high
selectivities for H2/CO2
FALSE FALSE TRUE
H2 displays high permeance TRUE FALSE TRUE
Feed at required membrane temperature TRUE FALSE TRUE
Feed within membrane contaminant
tolerances TRUE FALSE TRUE
Relatively inexpensive materials FALSE
Modules have high area to volume ratio FALSETRUE
Advanced
Materials
Conventional Materials
TRUE

JMEC for TMS/NETL 11/30/09 03/13/06
4
placed at the same location in the IGCC process currently occupied by the AGR system,
which is downstream of the WGS reactors, and is integrated with the WGS for the CTH
process. The top section of Table 1 lists process characteristics particular to these
locations, and the bottom section lists characteristic that relate directly to specific
material properties of membranes.
It can be seen that polymer membranes are more applicable to CO2 capture from IGCC
plants, than to H2 recovery and purification from CTH plants, based on today‟s
technology. However, both applications face two major obstacles, the H2 selectivity
relative to CO2 of current polymers (and most other materials) is poor, and the processing
volumes are very large for these applications. The potential cost disadvantage relative to
competing technologies can only be overcome by the development of cheaper and more
permeable materials of construction with lower costs of fabrication. Unfortunately,
advanced materials with high selectivities are likely to be manufactured from more
expensive and less versatile materials than polymers.
Most existing and potential uses for H2 produced from coal beyond power generation,
require the H2 to be delivered at high purities (greater than 95-98%) and high pressures
(greater than ~450 psia [31 bar]). This makes high H2 selectivity and permeability a
prerequisite. Most materials, other than Pd and similar precious metals, exhibit an
inverse relationship between permeability and selectivity, making it difficult to achieve
high levels of H2 recovery and purity simultaneously.
For IGCC applications, the challenge is to achieve high H2 recoveries; purity of the H2 is
less critical. CO2 purity is a greater concern, since it is to be transported by pipeline to a
suitable sequestration site. Low H2 recoveries result in a CO2 stream containing
undesirable levels of H2, a potentially flammable component, and in the loss of valuable
H2 fuel for power generation. Temperature and contaminant tolerances are also bigger
issues for CTH than for IGCC. These are discussed in more detail in the next section.
The last column in Table 1 indicates that materials are available or are currently being
investigated that can solve many of the remaining technical issues for the use of H2
separation membranes in IGCC and CTH plants. However, no single material has yet
been identified that can simultaneously meet all of these challenging and sometimes
conflicting process and economic requirements.
A. Placement Options
Unlike other gas separation technologies (e.g., absorption and adsorption), membranes
are compact and modular, and can be placed at more than one location to separate H2
from CO2 and other gas components. Figure 1 identifies areas where membranes might
be effectively integrated into the IGCC process. Each area has potential benefits and
drawbacks that must be considered for any proposed CO2 removal technology.
Currently, the best available technology is a two-stage physical absorption technology
employing a solvent such as Selexol™. H2S is removed in the first stage and CO2 in the
second.
JMEC for TMS/NETL 11/30/09 03/13/06
5
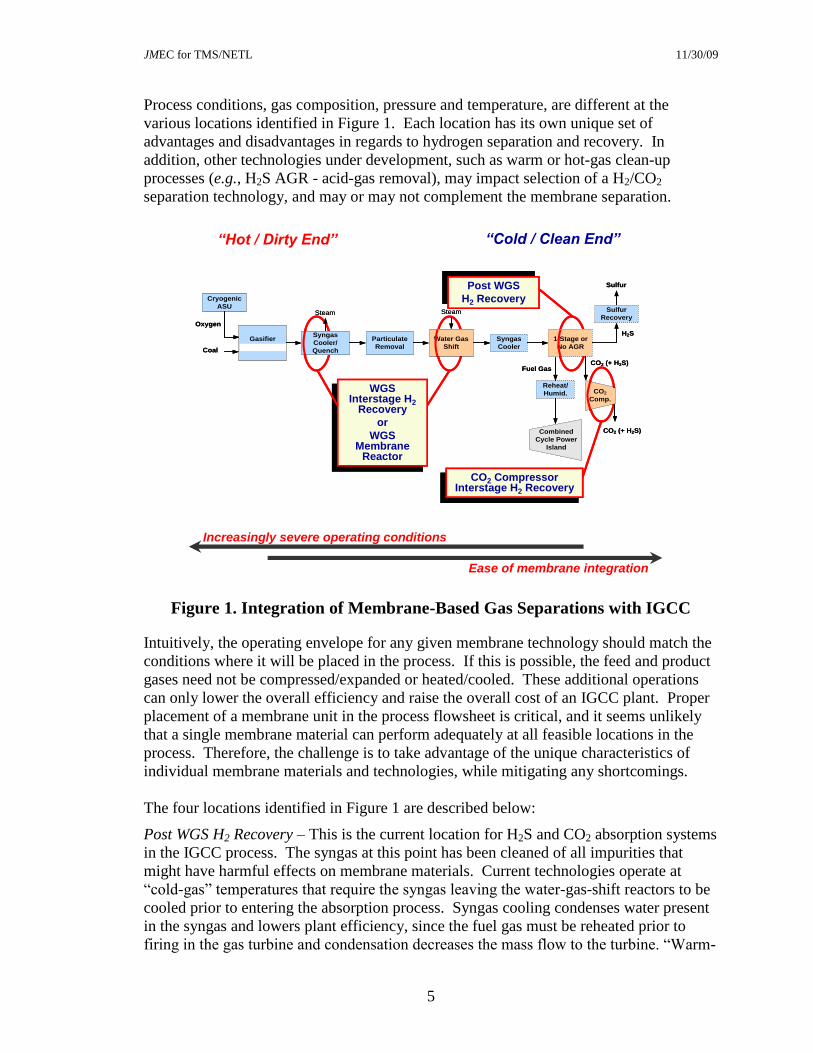
Process conditions, gas composition, pressure and temperature, are different at the
various locations identified in Figure 1. Each location has its own unique set of
advantages and disadvantages in regards to hydrogen separation and recovery. In
addition, other technologies under development, such as warm or hot-gas clean-up
processes (e.g., H2S AGR - acid-gas removal), may impact selection of a H2/CO2
separation technology, and may or may not complement the membrane separation.
Figure 1. Integration of Membrane-Based Gas Separations with IGCC
Intuitively, the operating envelope for any given membrane technology should match the
conditions where it will be placed in the process. If this is possible, the feed and product
gases need not be compressed/expanded or heated/cooled. These additional operations
can only lower the overall efficiency and raise the overall cost of an IGCC plant. Proper
placement of a membrane unit in the process flowsheet is critical, and it seems unlikely
that a single membrane material can perform adequately at all feasible locations in the
process. Therefore, the challenge is to take advantage of the unique characteristics of
individual membrane materials and technologies, while mitigating any shortcomings.
The four locations identified in Figure 1 are described below:
Post WGS H2 Recovery – This is the current location for H2S and CO2 absorption systems
in the IGCC process. The syngas at this point has been cleaned of all impurities that
might have harmful effects on membrane materials. Current technologies operate at
“cold-gas” temperatures that require the syngas leaving the water-gas-shift reactors to be
cooled prior to entering the absorption process. Syngas cooling condenses water present
in the syngas and lowers plant efficiency, since the fuel gas must be reheated prior to
firing in the gas turbine and condensation decreases the mass flow to the turbine. “Warm-
Coal
Oxygen
Gasifier
*GE Energy
Water Gas
Shift
Combined
Cycle Power
Island
Cryogenic
ASU
Syngas
Cooler
Steam
1-Stage or
No AGR
Sulfur
Recovery
Sulfur
CO2
Comp.
CO2 (+ H2S)
Steam
Reheat/
Humid.
Fuel Gas
Syngas
Cooler/
Quench
Particulate
Removal
H2S
CO2 (+ H2S)
WGS Interstage H2
Recovery
or
WGS Membrane
Reactor
WGS Interstage H2
Recovery
or
WGS Membrane
Reactor
CO2 Compressor Interstage H2 Recovery
CO2 Compressor Interstage H2 Recovery
Post WGS
H2 RecoveryPost WGS
H2 Recovery
“Hot / Dirty End” “Cold / Clean End”
Increasingly severe operating conditions
Ease of membrane integration

JMEC for TMS/NETL 11/30/09 03/13/06
6
gas” H2S removal systems are being developed to improve efficiency; however, they will
be ineffective if the syngas must be cooled anyway to remove CO2.
Current two-stage absorption processes produce CO2 at relatively low pressures (45-150
psia [3-10 bar]), maximizing the compression required to deliver the CO2 for
sequestration. Gas separation membranes located here would replace the second-stage of
the absorption process, and also the first stage, if H2S and CO2 can be co-sequestered.
The CO2 is delivered to the compression train at a high pressure; however, the recovered
H2 must be re-compressed unless a diluent such as N2 is used as a sweep gas to lower the
H2 partial pressure on the permeate side of the membrane. The diluent will also increase
the mass flow to the gas turbine. If warm-gas H2S removal is employed, it is desirable
that the membrane be permeable to H2O to avoid later condensation of this water in the
CO2 compression train. This integration is shown in Figure 2a.
CO2 Compressor Interstage H2 Recovery – Placement of membranes here has the
advantage that the high feed gas pressures will improve the driving force for H2 transport
across the membrane; thus, maximizing H2 recovery or minimizing membrane area
requirements. Use of a sweep gas is still advantageous. For this option, CO2
compression is minimized, and H2 can be delivered at the required service pressure
without re-compression. Though, some H2 will be over compressed as it passes through
the CO2 compression train prior to recovery. The process can be optimized by locating
multiple membrane units prior to compression, between stages, and post compression.
As with post WGS H2 recovery, the feed gas to the membrane has been cleaned to
remove contaminants. This type of integration is shown in Figure 2b.
Figure 2. Gas Separation Membrane Integrations
a) After WGS b) Between Compression Stages
c) Between WGS Stages d) Between Syngas Coolers
WGS Interstage H2 Recovery – Removing H2 between reactor stages drives the water-
gas-shift reaction:
H2O + CO H2 + CO2
H2
Selective
Membranes
Sour
Shift(Max)
Cold/Warm
AGR
CO2
System Pressure
to Compression
Hydrogen Fuel Gasto Gas Turbine
Steam
H2S to Sulfur
Recovery
Need to maximize shift
lowers system temperatureSingle Stage
Syngas
Sweep Gas
cooling may be required here
may be optional optional
H2
Selective
Membranes
Hydrogen Fuel Gasto Gas Turbine
CO2
containing H2Sweep Gas
Compression
Compression
H2 depleted
CO2
cooling can go here or here
optional
H2
Selective
Membranes
Hydrogen Fuel Gasto Gas Turbine
Syngas
Sweep Gas
H2 & CO
Depleted
Syngas
Syngas
Cooler
optional
Syngas
Cooler
Steam
Steam
H2
Selective
Membranes
Hydrogen Fuel Gasto Gas Turbine
Syngas
Sweep Gas
WGS
Reactor
H2 & CO
Depleted
Syngas
WGS
Reactorcooling can go here or here
may be optional
optional
JMEC for TMS/NETL 11/30/09 03/13/06
7
toward completion by shifting equilibrium in favor of H2 production. The membrane
must be sufficiently impermeable to water for this approach to be advantageous.
Interstage H2 recovery allows the catalyst volume to be minimized, and possibly
decreases the number of shift reactors required. It also enables any excess steam co-fed
to the reactor and the amount of interstage cooling to be reduced, possibly improving the
efficiency of the process. One drawback, however, is that any unconverted water vapor
left may be lost to the fuel gas, decreasing the mass flow to the turbine.
Normally, a sulfur-tolerant shift catalyst is employed with H2S removed downstream of
the WGS via absorption-based, cold-gas AGR. As mentioned above, warm-gas removal
technologies are still under development. A membrane integrated here would need to be
resistant to sulfur compounds. Alternatively, hot-gas H2S removal could be performed
upstream of the WGS. In this case, iron and copper-based shift catalysts would be
employed. This integration is shown in Figure 2c.
If the membrane unit is integrated within the syngas cooling step, the homogeneous WGS
reaction will occur at the elevated temperatures found here. This location is the most
severe, and any membrane placed here would need to have a high tolerance for a wide
range of impurities, including particulates, sulfur and nitrogen compounds, and trace
metals present in the raw syngas leaving the gasifier. Use of a sweep gas is even more
advantageous when coupled with the WGS reaction, since it will enhance H2 removal and
improve the WGS equilibrium further in favor of H2 production. This is shown in Figure
2d.
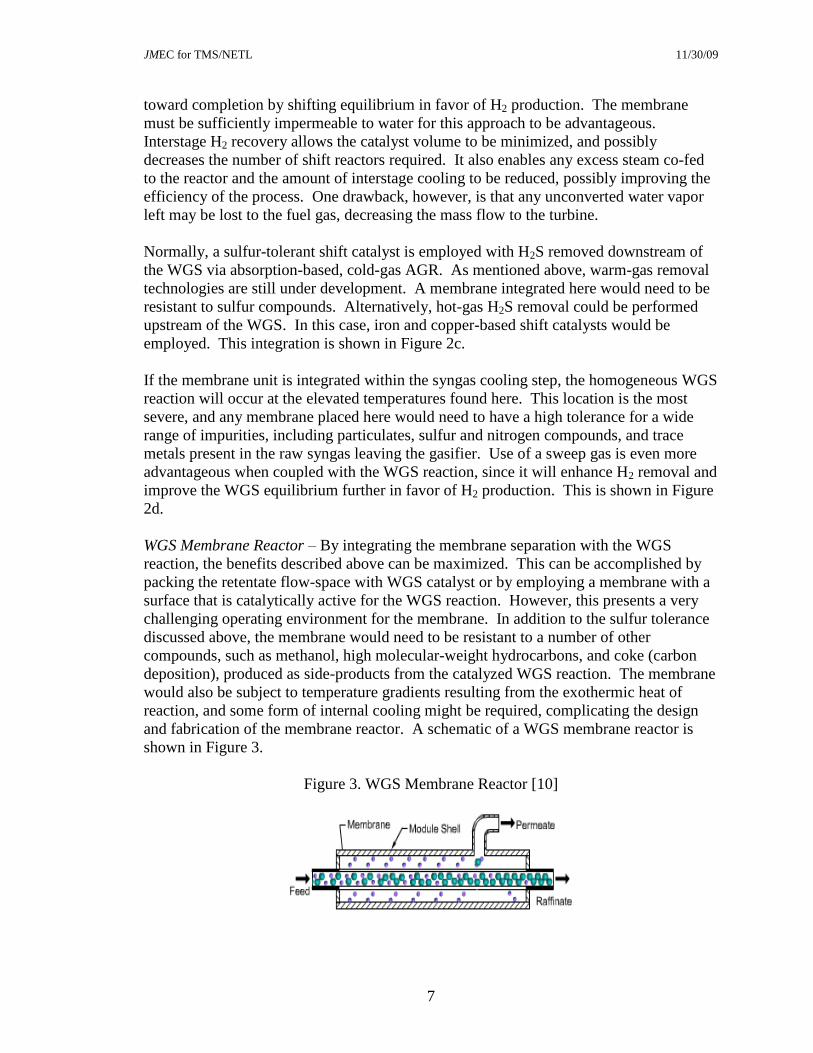
WGS Membrane Reactor – By integrating the membrane separation with the WGS
reaction, the benefits described above can be maximized. This can be accomplished by
packing the retentate flow-space with WGS catalyst or by employing a membrane with a
surface that is catalytically active for the WGS reaction. However, this presents a very
challenging operating environment for the membrane. In addition to the sulfur tolerance
discussed above, the membrane would need to be resistant to a number of other
compounds, such as methanol, high molecular-weight hydrocarbons, and coke (carbon
deposition), produced as side-products from the catalyzed WGS reaction. The membrane
would also be subject to temperature gradients resulting from the exothermic heat of
reaction, and some form of internal cooling might be required, complicating the design
and fabrication of the membrane reactor. A schematic of a WGS membrane reactor is
shown in Figure 3.
Figure 3. WGS Membrane Reactor [10]

JMEC for TMS/NETL 11/30/09 03/13/06
8
B. Temperature & Pressure Considerations
Table 2 lists the operating temperatures for the locations in the IGCC flowsheet shown in
Figure 1. The low and high ranges given for interstage cooling are based on whether the
gasifier employs a syngas quench or radiant cooler, respectively. Similarly for the WGS,
the low range corresponds to conditions after the interstage coolers and the high range to
the outlet temperatures of the reactors. AGR systems under development may operate in
a number of different temperature regimes. For interstage compression, the low value is
after cooling, upstream of the next stage of compression, and the high range corresponds
to possible compressor discharge temperatures.
Table 2. Preferred Membrane Operating Temperatures
for IGCC Applications
Gas separation membranes integrated with WGS will be required to operate in a
significantly higher temperature regime than encountered in current polymeric membrane
applications, which are limited to about 120oC. The operating temperatures of existing
cold-gas AGR systems, or between compressor stages, are within the range of existing
polymeric membrane materials.
Table 3 lists IGCC operating pressures. The ranges given are indicative of two common
modes of gasifier operation. Lower pressures are normally employed in systems using
amine-based AGR, while higher pressures are more representative of a system employing
a physical solvent for absorption. For membrane-based gas separation, the high pressure
mode is more desirable. At the CO2 compressor inlet, the ranges given correspond to
possible pressures exiting any upstream H2S/CO2 AGR process. The compressor outlet
is the desired delivery pressure to the CO2 transport pipeline. The preferred permeate
pressure is set by the gas turbine design employed in the IGCC topping-cycle.
Location
Water Quench / Convective Cooler
Radiant Cooling / Gas Quench
inlet outlet
WGS Reactor - HTS 300 - 350 400 - 500
- LTS 200 - 260 240 - 320
Post Cold-Gas AGR
Post Warm-Gas AGR
Post Hot-Gas AGR
Compressor inlet outlet
CO2 Compressor Interstage ~40 65 - 200
WGS - Water-Gas-Shift LTS - Low-Temperature Shift
HTS - High-Temperature Shift AGR - Acid-Gas Removal
40 - 100
100 - 450
> 450
Temperature Range, oC
interstage syngas cooling
200 - 425
700 - 900

JMEC for TMS/NETL 11/30/09 03/13/06
9
Table 3. Preferred Membrane Operating Pressures
for IGCC Applications
Location
low high
Syngas Cooling ~28 (400) ~70 (1,000)
Water Gas Shift
Gas Clean-Up ~21 (300) ~45 (650)
cold-gas warm/hot gas
CO2 Compression - Inlet3.4 - 10
(50-100)
21 - 45
(300-650)
CO2 Compression - Outlet
for power for chemicals for power for chemicals
H2 Permeate24 - 31
(350-450)
>31
(>450)44 - 80% > 99%
aBased on gasification of typical Eastern U.S. bituminous coal.
Pressure Range
bar (psia)
H2 Concentrationa
(wet)
gasifier
-
110-150 (1,600-2,200) < 2%
16 - 29%
~42%
~54%
The low range reported in Table 3 is typical for IGCC power plant applications designed
without CO2 capture. The lower CO2 outlet pressure corresponds to the requirements for
geological sequestration at or near the IGCC plant; whereas, the high pressure
corresponds to requirements for pipeline transport to a sequestration site remote from the
plant. It should be kept in mind that the H2 partial pressure difference is the true driving
force for membrane separation, not the total pressure differential across the membrane
(total differential does, however, have direct bearing on membrane structural integrity).
Approximate molar H2 concentrations are also listed in Table 3. The potential benefit of
operating the gasifier at high pressure can be seen by examining the pressures and
concentrations for the syngas prior to gas clean-up. For instance, the H2 partial pressure
after the WGS is roughly 11 (0.54 21) bar for low-pressure operation, versus 24
(0.54 45) bar for high-pressure operation (a pressure ratio of 24/11 or 2.2). Depending
on the desired H2 delivery pressure, operating at high pressures can significantly improve
the driving force for separation. For example, if the H2 delivery pressure is 5 bar, then
the partial pressure differential is 19.3 (0.54 45 – 1.00 5) bar versus 6.3 (0.54 21 –
1.00 5) bar, for high and low-pressure operation, respectively. Thus, the partial pressure
driving force is 3.1 (19.3/6.3) times higher when operating at the higher pressure. Note
that this ratio is greater than the ratio of feed gas pressures. The higher the delivery
pressure the greater the benefit of operating at a higher pressure.
The use of a sweep gas is also desirable; however, this is limited by the operating
parameters of the gas turbine, and availability and pressure of the diluent employed.
Advanced turbines are being designed for a fuel gas with a lower heating value of
approximately 4.3 kJ/Nl (120 Btu/scf). This corresponds to a minimum H2 concentration
in the fuel gas of about 44%. For existing gas turbines, the heating value may be as high
as about 8 kJ/Nl (220 Btu/scf). The benefits of the sweep gas can be illustrated using the
JMEC for TMS/NETL 11/30/09 03/13/06
10
example described above. For high-pressure operation the partial pressure driving force
with the use of a sweep is 22.1 (0.54 45 – 0.44 5), 1.15 (22.1/19.3) and 3.5 (22.1/6.3)
times higher for the high-pressure and low-pressure operations, respectively.
Alternatively, the sweep gas allows the H2 delivery pressure to be raised to better match
the requirement of the gas turbine.
C. Materials Considerations
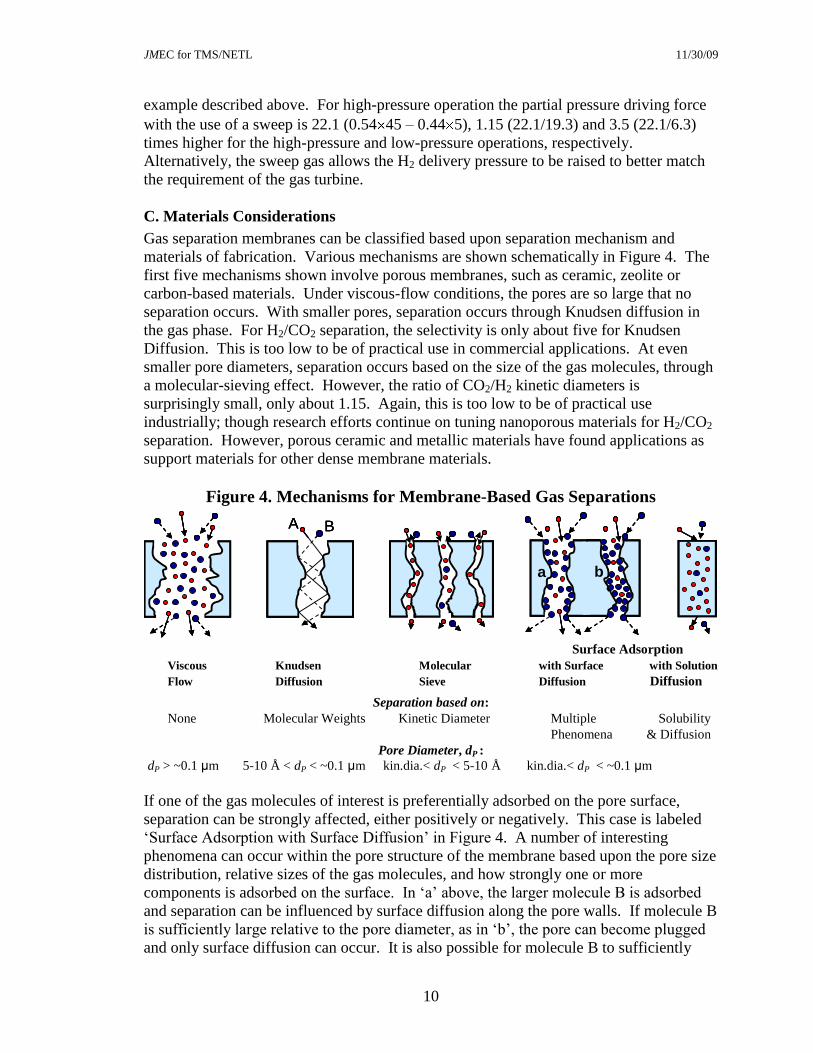
Gas separation membranes can be classified based upon separation mechanism and
materials of fabrication. Various mechanisms are shown schematically in Figure 4. The
first five mechanisms shown involve porous membranes, such as ceramic, zeolite or
carbon-based materials. Under viscous-flow conditions, the pores are so large that no
separation occurs. With smaller pores, separation occurs through Knudsen diffusion in
the gas phase. For H2/CO2 separation, the selectivity is only about five for Knudsen
Diffusion. This is too low to be of practical use in commercial applications. At even
smaller pore diameters, separation occurs based on the size of the gas molecules, through
a molecular-sieving effect. However, the ratio of CO2/H2 kinetic diameters is
surprisingly small, only about 1.15. Again, this is too low to be of practical use
industrially; though research efforts continue on tuning nanoporous materials for H2/CO2
separation. However, porous ceramic and metallic materials have found applications as
support materials for other dense membrane materials.
Figure 4. Mechanisms for Membrane-Based Gas Separations
Surface Adsorption
Viscous Knudsen Molecular with Surface with Solution
Flow Diffusion Sieve Diffusion Diffusion
Separation based on:
None Molecular Weights Kinetic Diameter Multiple Solubility
Phenomena & Diffusion
Pore Diameter, dP :
dP > ~0.1 μm 5-10 Å < dP < ~0.1 μm kin.dia.< dP < 5-10 Å kin.dia.< dP < ~0.1 μm
If one of the gas molecules of interest is preferentially adsorbed on the pore surface,
separation can be strongly affected, either positively or negatively. This case is labeled
„Surface Adsorption with Surface Diffusion‟ in Figure 4. A number of interesting
phenomena can occur within the pore structure of the membrane based upon the pore size
distribution, relative sizes of the gas molecules, and how strongly one or more
components is adsorbed on the surface. In „a‟ above, the larger molecule B is adsorbed
and separation can be influenced by surface diffusion along the pore walls. If molecule B
is sufficiently large relative to the pore diameter, as in „b‟, the pore can become plugged
and only surface diffusion can occur. It is also possible for molecule B to sufficiently
A B
a b
A BA B
a b
JMEC for TMS/NETL 11/30/09 03/13/06
11
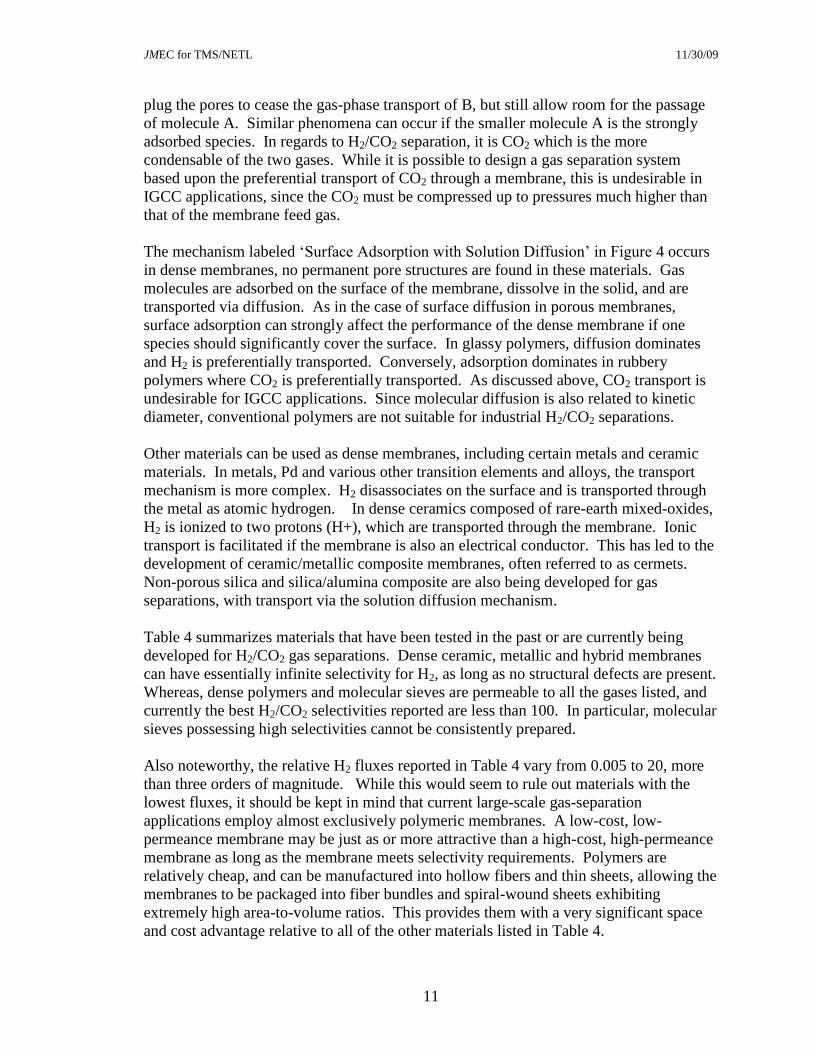
plug the pores to cease the gas-phase transport of B, but still allow room for the passage
of molecule A. Similar phenomena can occur if the smaller molecule A is the strongly
adsorbed species. In regards to H2/CO2 separation, it is CO2 which is the more
condensable of the two gases. While it is possible to design a gas separation system
based upon the preferential transport of CO2 through a membrane, this is undesirable in
IGCC applications, since the CO2 must be compressed up to pressures much higher than
that of the membrane feed gas.
The mechanism labeled „Surface Adsorption with Solution Diffusion‟ in Figure 4 occurs
in dense membranes, no permanent pore structures are found in these materials. Gas
molecules are adsorbed on the surface of the membrane, dissolve in the solid, and are
transported via diffusion. As in the case of surface diffusion in porous membranes,
surface adsorption can strongly affect the performance of the dense membrane if one
species should significantly cover the surface. In glassy polymers, diffusion dominates
and H2 is preferentially transported. Conversely, adsorption dominates in rubbery
polymers where CO2 is preferentially transported. As discussed above, CO2 transport is
undesirable for IGCC applications. Since molecular diffusion is also related to kinetic
diameter, conventional polymers are not suitable for industrial H2/CO2 separations.
Other materials can be used as dense membranes, including certain metals and ceramic
materials. In metals, Pd and various other transition elements and alloys, the transport
mechanism is more complex. H2 disassociates on the surface and is transported through
the metal as atomic hydrogen. In dense ceramics composed of rare-earth mixed-oxides,
H2 is ionized to two protons (H+), which are transported through the membrane. Ionic
transport is facilitated if the membrane is also an electrical conductor. This has led to the
development of ceramic/metallic composite membranes, often referred to as cermets.
Non-porous silica and silica/alumina composite are also being developed for gas
separations, with transport via the solution diffusion mechanism.
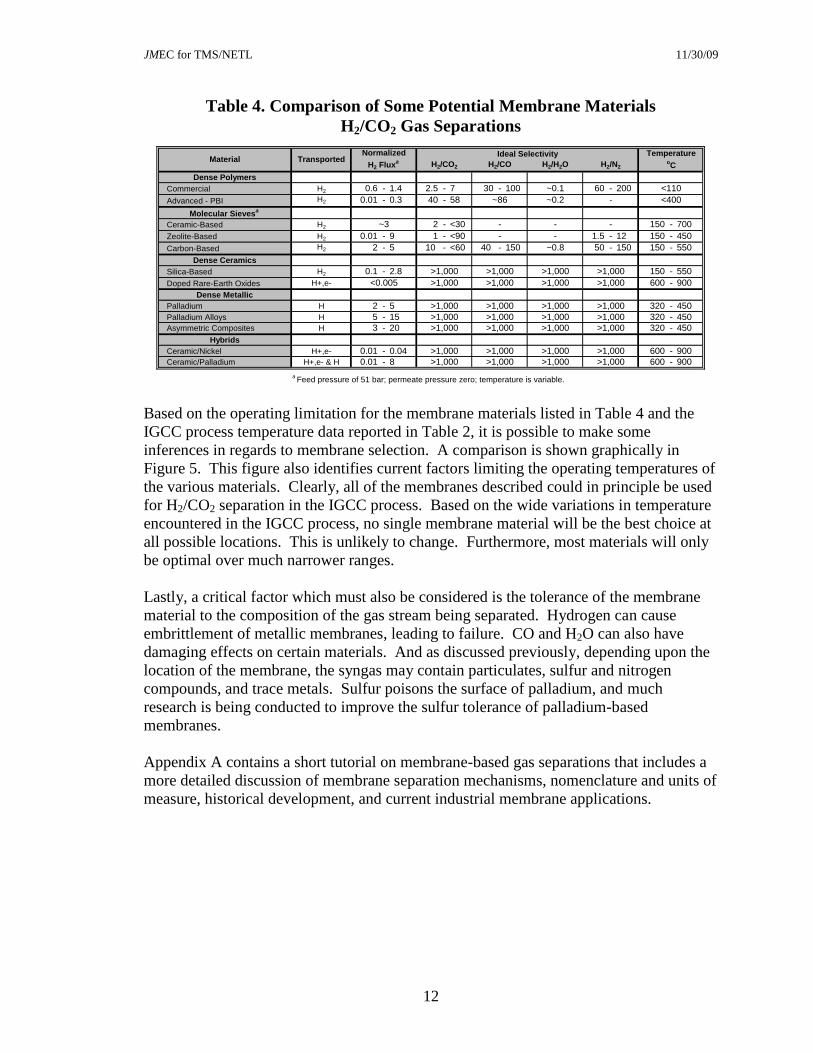
Table 4 summarizes materials that have been tested in the past or are currently being
developed for H2/CO2 gas separations. Dense ceramic, metallic and hybrid membranes
can have essentially infinite selectivity for H2, as long as no structural defects are present.
Whereas, dense polymers and molecular sieves are permeable to all the gases listed, and
currently the best H2/CO2 selectivities reported are less than 100. In particular, molecular
sieves possessing high selectivities cannot be consistently prepared.
Also noteworthy, the relative H2 fluxes reported in Table 4 vary from 0.005 to 20, more
than three orders of magnitude. While this would seem to rule out materials with the
lowest fluxes, it should be kept in mind that current large-scale gas-separation
applications employ almost exclusively polymeric membranes. A low-cost, low-
permeance membrane may be just as or more attractive than a high-cost, high-permeance
membrane as long as the membrane meets selectivity requirements. Polymers are
relatively cheap, and can be manufactured into hollow fibers and thin sheets, allowing the
membranes to be packaged into fiber bundles and spiral-wound sheets exhibiting
extremely high area-to-volume ratios. This provides them with a very significant space
and cost advantage relative to all of the other materials listed in Table 4.
JMEC for TMS/NETL 11/30/09 03/13/06
12
Table 4. Comparison of Some Potential Membrane Materials
H2/CO2 Gas Separations
Dense Polymers
Commercial H2 0.6 - 1.4 2.5 - 7 30 - 100 ~0.1 60 - 200 <110
Advanced - PBI H2 0.01 - 0.3 40 - 58 ~86 ~0.2 - <400
Molecular Sievesa
Ceramic-Based H2 ~3 2 - <30 - - - 150 - 700
Zeolite-Based H2 0.01 - 9 1 - <90 - - 1.5 - 12 150 - 450
Carbon-Based H2 2 - 5 10 - <60 40 - 150 ~0.8 50 - 150 150 - 550
Dense Ceramics
Silica-Based H2 0.1 - 2.8 >1,000 >1,000 >1,000 >1,000 150 - 550
Doped Rare-Earth Oxides H+,e- <0.005 >1,000 >1,000 >1,000 >1,000 600 - 900
Dense Metallic
Palladium H 2 - 5 >1,000 >1,000 >1,000 >1,000 320 - 450
Palladium Alloys H 5 - 15 >1,000 >1,000 >1,000 >1,000 320 - 450
Asymmetric Composites H 3 - 20 >1,000 >1,000 >1,000 >1,000 320 - 450
Hybrids
Ceramic/Nickel H+,e- 0.01 - 0.04 >1,000 >1,000 >1,000 >1,000 600 - 900
Ceramic/Palladium H+,e- & H 0.01 - 8 >1,000 >1,000 >1,000 >1,000 600 - 900
aFeed pressure of 51 bar; permeate pressure zero; temperature is variable.
TemperatureoCH2/CO2 H2/CO H2/H2O H2/N2
Material TransportedNormalized
H2 Fluxa
Ideal Selectivity
Based on the operating limitation for the membrane materials listed in Table 4 and the
IGCC process temperature data reported in Table 2, it is possible to make some
inferences in regards to membrane selection. A comparison is shown graphically in
Figure 5. This figure also identifies current factors limiting the operating temperatures of
the various materials. Clearly, all of the membranes described could in principle be used
for H2/CO2 separation in the IGCC process. Based on the wide variations in temperature
encountered in the IGCC process, no single membrane material will be the best choice at
all possible locations. This is unlikely to change. Furthermore, most materials will only
be optimal over much narrower ranges.
Lastly, a critical factor which must also be considered is the tolerance of the membrane
material to the composition of the gas stream being separated. Hydrogen can cause
embrittlement of metallic membranes, leading to failure. CO and H2O can also have
damaging effects on certain materials. And as discussed previously, depending upon the
location of the membrane, the syngas may contain particulates, sulfur and nitrogen
compounds, and trace metals. Sulfur poisons the surface of palladium, and much
research is being conducted to improve the sulfur tolerance of palladium-based
membranes.
Appendix A contains a short tutorial on membrane-based gas separations that includes a
more detailed discussion of membrane separation mechanisms, nomenclature and units of
measure, historical development, and current industrial membrane applications.

JMEC for TMS/NETL 11/30/09 03/13/06
13
Figure 5. Temperature Match for Membrane/IGCC Integration
D. Summary
Membranes are modular and may be attractively integrated into a number of locations in
the IGCC process. Since CO2 will need to be further compressed to 150 bar (2,200 psia),
it is desirable to recover CO2 at high pressures; therefore, a H2 selective membrane is
preferred. By the same token, it is also desirable to minimize recompression of the H2
permeate. Since the required H2 purity of the fuel gas may be as low as 44%, a sweep
gas (preferably N2 to minimize cycle efficiency losses) can be used both as a fuel-gas
diluent and to increase H2 recovery.
In order to maximize H2 recovery, gas separation membranes should be placed at
locations with high H2 partial pressures (high total pressure and/or high H2
0 100 200 300 400 500 600 700 800 900 1000
Temperature, oC
CO2 Compressor Interstage
Cold Gas Warm Gas Clean-Up Hot Gas Clean-Up
Catalytic WGS Homogeneous WGS
Syngas Cooling
Water Quench
Convenctive Cooler
Gas Quench
Radiant Cooler
0 100 200 300 400 500 600 700 800 900 1000
Commercial
Polymers
Advanced
Polymers
Molecular Sieves - Ceramic / Zeolite / Carbon
Glass Transition
Conventional Dense Cermaics
Dense Metallic
Cermet Dense Ceramic
Surface
Adsorption
Embrittlement Deactivation
Low Conductivity
Surface
Adsorption
Me
mb
ran
e M
ate
ria
lsIG
CC
Pro
ces
ses
0 100 200 300 400 500 600 700 800 900 1000
Temperature, oC
CO2 Compressor Interstage
Cold Gas Warm Gas Clean-Up Hot Gas Clean-Up
Catalytic WGS Homogeneous WGS
Syngas Cooling
Water Quench
Convenctive Cooler
Gas Quench
Radiant Cooler
0 100 200 300 400 500 600 700 800 900 1000
Commercial
Polymers
Advanced
Polymers
Molecular Sieves - Ceramic / Zeolite / Carbon
Glass Transition
Conventional Dense Cermaics
Dense Metallic
Cermet Dense Ceramic
Surface
Adsorption
Embrittlement Deactivation
Low Conductivity
Surface
Adsorption
Me
mb
ran
e M
ate
ria
lsIG
CC
Pro
ces
ses
JMEC for TMS/NETL 11/30/09 03/13/06
14
concentration). Prior to the first-stage WGS reactor, the H2 partial pressure driving force
for separation is relatively low, after the WGS it can be significantly higher. A likely
operating range is 28-50 bar H2 (100-400 psia). Syngas quality also improves the farther
downstream a gas separation membrane is placed from the gasifier. At a minimum,
particulate matter will need to be removed prior to gas separation. For the most part, the
effect of other syngas impurities will be dependent on specific membrane materials of
construction.
Pinch analysis could prove quite useful for optimal placement of H2/CO2 separation
membranes within the IGCC process.
High selectivity is a prerequisite for successful process integration, since the required
selectivity is directly related to the 90% CO2 capture goal. Low-cost, low-permeance
membranes may be more attractive than high-cost, high-permeance membranes as long as
the selectivity requirement is met. High selectivity is still an issue for many H2/CO2
separation membranes under development. H2 and CO2 molecules are similar in size, and
this poses an obstacle for the development of molecular sieve and dense polymer
membranes. However, these materials are permeable to H2O, and would be ideal for
cold-gas integration.
JMEC for TMS/NETL 11/30/09 03/13/06
15
III. SYSTEM DEVELOPMENT & EVALUATION
The synthesis of IGCC processes employing membranes for CO2 capture presents some
significant design challenges. Most membrane separation systems of interest are only
now at bench-scale development. Key parameters are un-optimized or may be unknown,
and process scale-up involves a great deal of uncertainty. In addition, technologies
upstream and/or downstream of the membrane may or may not complement membrane-
based gas separation. Other technologies under development may impact selection of
H2/CO2 separation technology; examples include upstream, warm-gas clean-up processes
for H2S removal, and downstream, advanced H2-combustion turbines for heat and power
generation4. Also of importance specifically to gas separation membranes, are limitations
resulting from trade-offs between product purity, recovery and delivery pressure.
Placement of the membrane system within the process flowsheet is critical. Many
previous studies have tried to interchange solvent-based CO2 capture with membrane-
based processes. This is not the best approach. Since it is not feasible to consider all
combinations of parameters and configurations, the design strategy taken here is
evolutionary. Some simplistic alternatives are formulated that take advantage of unique
characteristics of membrane-based gas separations while mitigating their shortcomings.
These are analyzed and are accepted or rejected. The best alternatives are used to
synthesize improved membrane configurations, which are evaluated in more detail to
determine membrane process and economic performance targets satisfying DOE R&D
Program Goals.
Finally, this assessment is not aimed at determining what might be achievable with a
particular membrane material (i.e. material science issues) or how this might be
accomplished (i.e. module design issues). Experts in the field of membrane gas
separation are in the best position to make such determinations. Rather, by formulating
membrane process and economic performance targets, this assessment provides
qualitative guidance to membrane researchers useful for formulating R&D strategies to
move gas-separation membrane technology toward commercialization for CO2 capture
applications5.
A. Membrane Assessment Methodology
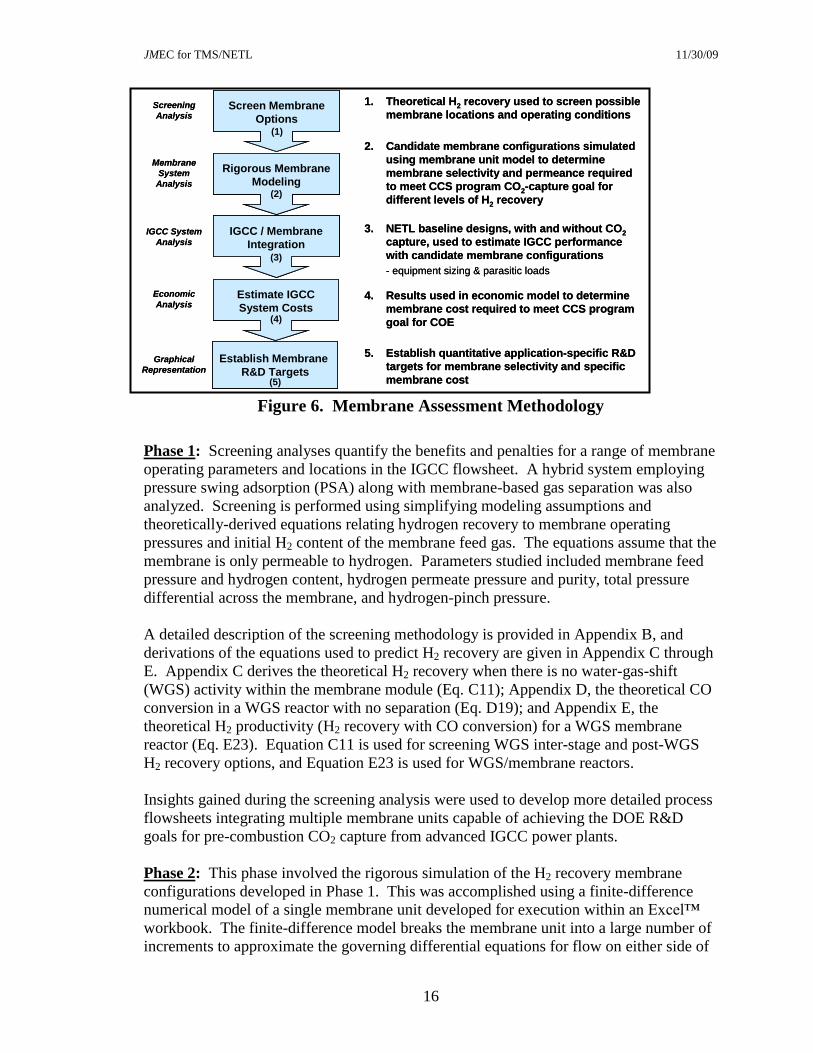
The methodology used in this evaluation is summarized in Figure 6. It consisted of five
phases.
4 Detailed analysis of these other technologies is not considered explicitly here; rather sensitivity cases are
analyzed to quantify their impact on gas separation membrane requirements related to process and cost
performance targets. 5 Depending on the current state of development for a given membrane, the results of this assessment
provide guidance as to which membrane parameters are critical for meeting the DOE R&D Program Goals.
For example, should further efforts be focused on improving selectivity, permeance, or cost? The
researcher can decide how this is to be accomplished, such as by reducing membrane thickness, changing
materials formulations, alternative module designs, etc. The relative importance of these parameters is
strongly dependent on the specific membrane and its current state of development.
JMEC for TMS/NETL 11/30/09 03/13/06
16
Figure 6. Membrane Assessment Methodology
Phase 1: Screening analyses quantify the benefits and penalties for a range of membrane
operating parameters and locations in the IGCC flowsheet. A hybrid system employing
pressure swing adsorption (PSA) along with membrane-based gas separation was also
analyzed. Screening is performed using simplifying modeling assumptions and
theoretically-derived equations relating hydrogen recovery to membrane operating
pressures and initial H2 content of the membrane feed gas. The equations assume that the
membrane is only permeable to hydrogen. Parameters studied included membrane feed
pressure and hydrogen content, hydrogen permeate pressure and purity, total pressure
differential across the membrane, and hydrogen-pinch pressure.
A detailed description of the screening methodology is provided in Appendix B, and
derivations of the equations used to predict H2 recovery are given in Appendix C through
E. Appendix C derives the theoretical H2 recovery when there is no water-gas-shift
(WGS) activity within the membrane module (Eq. C11); Appendix D, the theoretical CO
conversion in a WGS reactor with no separation (Eq. D19); and Appendix E, the
theoretical H2 productivity (H2 recovery with CO conversion) for a WGS membrane
reactor (Eq. E23). Equation C11 is used for screening WGS inter-stage and post-WGS
H2 recovery options, and Equation E23 is used for WGS/membrane reactors.
Insights gained during the screening analysis were used to develop more detailed process
flowsheets integrating multiple membrane units capable of achieving the DOE R&D
goals for pre-combustion CO2 capture from advanced IGCC power plants.
Phase 2: This phase involved the rigorous simulation of the H2 recovery membrane
configurations developed in Phase 1. This was accomplished using a finite-difference
numerical model of a single membrane unit developed for execution within an Excel™
workbook. The finite-difference model breaks the membrane unit into a large number of
increments to approximate the governing differential equations for flow on either side of
IGCC System
Analysis
Screen Membrane
Options
Establish Membrane
R&D Targets
Rigorous Membrane
Modeling
IGCC / Membrane
Integration
Estimate IGCC
System Costs
Screening
Analysis
Membrane
System
Analysis
Economic
Analysis
1. Theoretical H2 recovery used to screen possible
membrane locations and operating conditions
2. Candidate membrane configurations simulated
using membrane unit model to determine
membrane selectivity and permeance required
to meet CCS program CO2-capture goal for
different levels of H2 recovery
3. NETL baseline designs, with and without CO2
capture, used to estimate IGCC performance
with candidate membrane configurations
- equipment sizing & parasitic loads
4. Results used in economic model to determine
membrane cost required to meet CCS program
goal for COE
5. Establish quantitative application-specific R&D
targets for membrane selectivity and specific
membrane cost
(1)
(2)
(3)
(4)
(5)
Graphical
Representation
IGCC System
Analysis
Screen Membrane
Options
Establish Membrane
R&D Targets
Rigorous Membrane
Modeling
IGCC / Membrane
Integration
Estimate IGCC
System Costs
Screen Membrane
Options
Establish Membrane
R&D Targets
Rigorous Membrane
Modeling
IGCC / Membrane
Integration
Estimate IGCC
System Costs
Screening
Analysis
Membrane
System
Analysis
Economic
Analysis
1. Theoretical H2 recovery used to screen possible
membrane locations and operating conditions
2. Candidate membrane configurations simulated
using membrane unit model to determine
membrane selectivity and permeance required
to meet CCS program CO2-capture goal for
different levels of H2 recovery
3. NETL baseline designs, with and without CO2
capture, used to estimate IGCC performance
with candidate membrane configurations
- equipment sizing & parasitic loads
4. Results used in economic model to determine
membrane cost required to meet CCS program
goal for COE
5. Establish quantitative application-specific R&D
targets for membrane selectivity and specific
membrane cost
(1)
(2)
(3)
(4)
(5)
Graphical
Representation

JMEC for TMS/NETL 11/30/09 03/13/06
17
the membrane, and transport of all permeable species across the membrane barrier. For
this assessment, it was assumed that the retentate and permeate streams flow co-currently
along the length of the membrane6. It was also assumed that other mass-transfer
resistances between the bulk retentate and permeate streams can be ignored. These
resistances will be minimized for successful membrane technologies during rigorous
module design.
The membrane networks of interest involve multiple interconnected membrane units. In
order to simulate the performance of a network of membrane units, individual membrane
workbooks are linked together within Excel to enable the flowrates and compositions of
individual streams predicted by the membrane model to be transferred between the
specified membrane units. The system equations thus modeled are solved to determine
the H2 permeance, membrane area and H2/CO2 selectivity necessary to achieve varying
degrees of H2 recovery. This information is used later in the IGCC system design and
economic analysis.
Appendix F contains a more detailed description of the membrane model used for this
assessment. Input data for the model are described in Appendix G.
Phase 3: The simulated results from the second step must be integrated with the IGCC
power plant. The National Energy Technology Laboratory (NETL) has developed
rigorous baseline designs for IGCC power plants, with and without CO2 capture, using
the Aspen Plus™ simulator. These baseline designs are described in more detail in the
next section.
It is not practical to develop and run the multitude of process simulations required for all
of the cases considered in this analysis. Therefore, the results from the rigorous
membrane simulations discussed in Phase 2 were used to adjust the material and energy
balances for the NETL baseline design for IGCC with capture. In most cases, tuning of
results was straightforward and exact7; however, some approximations were required
when making adjustments to the power plant steam balance. Appendix G describes in
greater deal the procedures used to make these adjustments.
To ensure that the above described procedure is accurate, several rigorous process
simulations were set up and executed, and the results compared. The comparisons were
reasonable, and well within the accuracy desired for developing membrane technology
R&D targets.
6 Actual membrane modules can be designed for co-current, counter-current, cross-flow or some
combination of these arrangements. Counter-current is the most efficient orientation, but is more difficult
to model. For developing membrane performance targets, the simplest configuration, co-current, was used.
Development of optimal membrane module designs is outside the scope of this analysis, and should only be
considered for those membrane technologies that exceed or come close to meeting the targets developed
here, and after adequate membrane data have been collected for use in detailed module design. 7 For example, if a membrane capture case uses more power internally than was used in the baseline, this
incremental power is subtracted from the baseline plant net power output, and vice versa if less power is
required.

JMEC for TMS/NETL 11/30/09 03/13/06
18
Phase 4: The material and energy balances generated in Phase 3 allow the IGCC plant
equipment to be re-sized and re-costed. Costs for equipment present in both the original
NETL baseline and the membrane-integrated IGCC designs are scaled based on changes
in capacity. Costs for new equipment, other than the added membrane units, were
developed using other sources.
The adjustments discussed above are made within the NETL IGCC economics model
[11]. The model then computes the levelized-cost of electricity (LCOE) for the
membrane-integrated design. The LCOE is calculated for two different, assumed values
for installed cost of membrane area, 0 and $100/ft2. These values are used in the fifth
phase of the assessment.
Appendix H contains a complete description of the economic analysis.
Phase 5: Membrane cost curves are developed using the selectivity versus H2 recovery
data generated in Phase 2, along with the COE estimates from Phase 4. The cost curves
relate the change in LCOE between the membrane-integrated IGCC design and the NETL
baseline without CCS to the specific cost of the membrane per unit area per unit H2
permeance with H2/CO2 selectivty as a parameter. Development of the membrane cost
curves and R&D targets are described in Appendix I.
B. Conceptual Design Basis and Data Sources
a. Membrane Screening Analysis. The screening analysis was performed in late 2005
and early 2006. It used a different basis than the detailed system analyses that followed,
since the NETL IGCC baseline designs described below were not completed until 2007.
However, the number of differences is small, and these differences are not considered
significant with respect to the conclusions drawn from the screening analysis.
The screening analysis only considered the performance of the membrane. Therefore,
only a few process conditions needed to be specified; stream compositions, pressures and
temperatures for possible feed streams to the membrane unit, and hydrogen delivery
pressure and purity. The WGS feed stream composition was obtained from a coal-to-
hydrogen study conducted by Parsons Corp. for NETL published in 2003 [12]. This was
supplemented with additional information on three-stage WGS reactor performance
obtained from Parsons [13]. Pressure and purity requirements were based on an earlier
IGCC CO2-capture study performed by Parsons for the Electric Power Research Institute
(EPRI) and DOE published in 2000 [14].
This 2003 Parsons design produces hydrogen as a product and does not capture CO2 for
sequestration. Other elements of the design relevant to the screening analysis include:
Syngas is generated from high-efficiency two-stage gasifiers based on E-Gas™
technology fed Pittsburgh No.8 bituminous coal with 2.9% sulfur. Raw syngas
cooling is performed using waste heat boilers, followed by convective shell-and-tube
gas coolers. Cooling is followed by particulate removal using metal candle filters.
JMEC for TMS/NETL 11/30/09 03/13/06
19
Only high-temperature, sulfur-tolerant, WGS reactors are required to convert about
80% of the CO in the syngas to CO2. This was accomplished in two fixed-bed WGS
reactors in series with inter-cooling. A low-temperature shift is not used since the
downstream PSA unit will produce a tail gas containing residual hydrogen that is
consumed as plant fuel.
A single-stage acid-gas removal (AGR) system captures H2S using the amine solvent
MDEA, and a PSA is used to produce high-purity (99%) hydrogen from the clean
syngas leaving the AGR.
This design was modified using information from the other sources to add a third-stage,
low-temperature WGS reactor capable of boosting overall CO conversion to about 98%,
as required for IGCC operation with CO2 capture. The 2000 IGCC CO2-capture study
also replaces the single-stage MDEA-based AGR system with a two-stage Selexol™
system capable of removing both H2S and CO2, and adds CO2 drying and compression to
1,200-2,200 psia (82-150 bar). PSA to separate and purify hydrogen is replaced by
combined-cycle power production employing General Electric‟s H-type advanced gas
turbine.
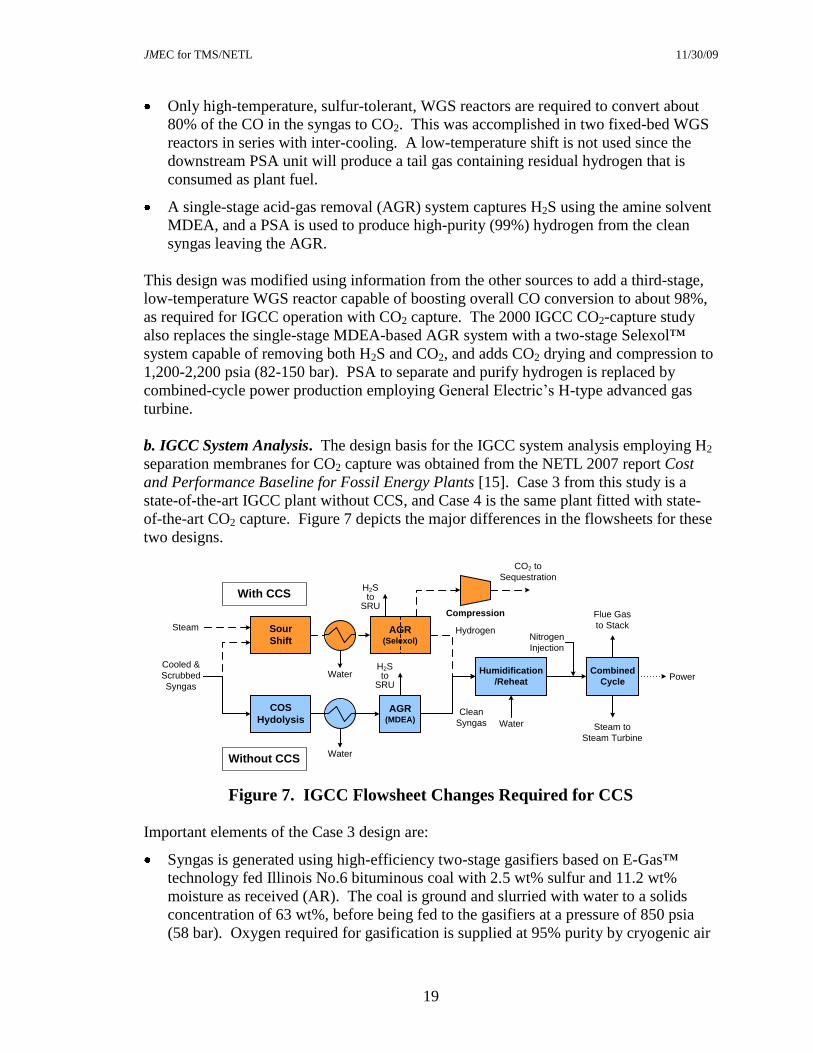
b. IGCC System Analysis. The design basis for the IGCC system analysis employing H2
separation membranes for CO2 capture was obtained from the NETL 2007 report Cost
and Performance Baseline for Fossil Energy Plants [15]. Case 3 from this study is a
state-of-the-art IGCC plant without CCS, and Case 4 is the same plant fitted with state-
of-the-art CO2 capture. Figure 7 depicts the major differences in the flowsheets for these
two designs.
Sour
ShiftAGR
(Selexol)
COS
HydolysisAGR
(MDEA)
Humidification
/Reheat
Combined
Cycle
Compression
H2Sto
SRU
H2Sto
SRU
CO2 to
Sequestration
Hydrogen
Clean
Syngas
Power
Steam to
Steam Turbine
Flue Gas
to Stack
Cooled &
Scrubbed
Syngas
With CCS
Without CCS
Nitrogen
Injection
Water
Water
Water
Steam
Figure 7. IGCC Flowsheet Changes Required for CCS
Important elements of the Case 3 design are:
Syngas is generated using high-efficiency two-stage gasifiers based on E-Gas™
technology fed Illinois No.6 bituminous coal with 2.5 wt% sulfur and 11.2 wt%
moisture as received (AR). The coal is ground and slurried with water to a solids
concentration of 63 wt%, before being fed to the gasifiers at a pressure of 850 psia
(58 bar). Oxygen required for gasification is supplied at 95% purity by cryogenic air
JMEC for TMS/NETL 11/30/09 03/13/06
20
separation units (ASU). Two gasification trains, with a combined feed of 5,567 TPD
AR (5,050 tPD) of coal, are required for an IGCC plant producing 623.4 MW of
electricity (net).
Raw syngas leaves the second-stage of gasification at a temperature of 1,850oF
(1050oC), and is cooled to 700
oF (371
oC) within a heat-recovery, steam generator
(HRSG). Particulates are removed from the cooled gas via a cyclone followed by a
ceramic candle filter. Following particulate removal, the syngas is cooled to 330°F
(166oC) prior to entering a syngas scrubber, where a water wash is used to remove
chlorides and any remaining particulate. The syngas exits the scrubber saturated at
305°F (152°C) and 555 psia (37.8 bar). It is then reheated to 400°F (205oC) and
enters a COS hydrolysis reactor, where about 99.5% of the COS is converted to CO2
and H2O. The exiting gas passes through a series of condensers to lower the syngas
temperature to 39°C (103°F) and to separate entrained water, and is then treated in a
carbon bed to remove 95% of the Hg present in the gas.
Cool, particulate-free syngas is fed to an absorber at 103oF (39
oC) and 495 psia (33.8
bar), where H2S is preferentially removed from the gas stream by contact with the
chemical solvent MDEA. The absorber column is operated at 80°F (27°C) by
refrigerating the lean MDEA solvent. The acid-gas stream recovered from the
solvent stripper, containing of 29% H2S and 70% CO2, is sent to a Claus unit.
Overall sulfur recovery is 99.5%. Tail gas from the Claus unit is recycled to
gasification.
Clean syngas exits the MDEA absorber at 99oF (37
oC) and 494 psia (33.7 bar) and is
partially humidified, diluted with nitrogen, and then reheated before being fed to the
combustion turbine at a temperature of 385oF (196
oC) and pressure of 479 psia (32.7
bar). Humidification is used rather than nitrogen because there is insufficient
nitrogen produced in the ASU to provide the level of dilution required to reach the
target syngas heating value of 120 Btu/scf (4.3 kJ/Nl) (LHV basis).
The GE advanced F Class combustion turbines produce 464 MWe. Heat is recovered
from the hot exhaust from the turbine in the heat-recovery steam generator. The
steam raised in the HRSG is used to power an advanced, commercially available
steam turbine using a steam cycle operated at 1800 psig/1,050°F/1,050°F (123 barg
MP/566°C/566°C). The steam turbine produces 278.5 MWe for an IGCC plant
output of 742.5 MWe gross and 623.4 MWe net. Net plant efficiency is 39.3% (HHV
basis).
The levelized cost of electricity for this IGCC plant is 7.80 ¢/kWh.
The modifications required for CO2 capture shown in Figure 7 result in the following
changes for Case 4:
The total coal feed to gasification is increased to 5,735 TPD (5,203 tPD).
COS hydrolysis is replaced by two parallel sets of fixed-bed WGS reactors; each set
consisting of three reactors (high, low, and medium temperature shift) in series. In
addition to shifting the syngas, the sour-gas shift reactors also perform the dual
function of hydrolyzing COS. Steam is injected upstream of the first WGS reactor to

JMEC for TMS/NETL 11/30/09 03/13/06
21
adjust the syngas H2O-to-CO molar ratio to 2:1 on a molar basis. Cooling is provided
between the WGS reactors to control the exothermic temperature rise. The
temperature and pressure of the shifted syngas leaving the last WGS reactor are 457oF
(236oC) and 516 psia (35.2 bar), respectively.
Following cooling and Hg removal, the shifted syngas is fed to the first stage of a
two-stage Selexol absorption unit at 93oF (34
oC) and 471 psia (32.1 bar), where H2S
is removed and sent to the sulfur recovery unit (SRU) as before. The second stage
removes CO2 at three pressure levels: 22, 160, and 300 psia (1.5, 10.9 and 20.5 bar).
The low and medium pressure CO2 streams are compressed, and then combined with
the high pressure stream. The combined CO2 is further compressed to a supercritical
state of 2,215 psia (150 bar), consistent with pipeline transmission requirements.
During compression, the CO2 stream is dehydrated to a dew point of -40ºF (-40°C).
The raw CO2 stream from the Selexol process contains over 93% CO2 with the
balance primarily nitrogen. Further purification of this stream is required prior to
transport and storage.
Clean syngas exits the Selexol unit at 99oF (37
oC) and 469 psia (32 bar); and as in
Case 3, is partially humidified, diluted with nitrogen, and then reheated before being
fed to the combustion turbine at a temperature of 385oF (196
oC) and pressure of 453.5
psia (31 bar). The advanced F Class combustion turbines produce 464 MWe as in
Case 3; however, the steam turbine output is lower, 229.8 MWe. In this case, the
steam cycle is operated at 1800 psig/1,000°F/1,000°F (123 barg MP/538°C/538°C).
The IGCC plant output is 693.8 MWe gross and 518.2 MWe net. The net output is
significantly reduced relative to Case 3, since the gross power plant output is
constrained by the capacity of the two combustion turbines, and since the CO2 capture
and compression process increases the auxiliary load on the plant. The net plant
efficiency drops to 31.7% (HHV basis).
The levelized cost of electricity for this IGCC plant is 10.29 ¢/kWh.
A major difference between the Case 4 design from the 2007 NETL baseline and the
earlier IGCC CO2-capture study design from 2000 is the operating pressure in the syngas
clean-up section of the plant. The 2000 study has a pressure of 825 psia (55.6 bar) for the
syngas entering the AGR, versus 471 psia (32.1 bar) from the 2007 study. As a result,
additional power can be generated by expanding the fuel gas prior to combustion. The
expander is located after humidification, before nitrogen is injected. As will be seen
later, a higher pressure for the syngas is necessary when considering gas separation
membranes as an alternative to absorption for CO2 capture.
It should be noted that the GE advanced F Class turbine selected for the baseline designs
was assumed to be available by 2010 for both conventional and high H2 content syngas
representative of the CO2 capture Case 4. High H2-content fuel combustion issues like
flame stability, flashback and NOx formation were assumed to be solved in the time
frame considered by this study. In addition, the minimum, fuel-gas LHV specification
for the F Class turbine is 100 Btu/scf (3.6 kJ/Nl), less than the 120 Btu/scf (4.3 kJ/Nl)
used in Cases 3 and 4. Permeate dilution is also beneficial for improving H2 recovery
using membrane-based separation. However, this change to the NETL design has
JMEC for TMS/NETL 11/30/09 03/13/06
22
implications for the overall performance and efficiency of the IGCC plant, which are
outside the scope of this assessment. Therefore, this modification was not considered.
The Case 4 baseline design provides few details on the design used for the second stage
of the Selexol system. The system achieves 99.4% recovery of hydrogen. In addition,
only 93% CO2 purity is obtained directly by the Selexol system as designed. As a result,
it is assumed that a secondary, but unidentified, process will be employed to boost CO2
purity to 100%. In the open literature on Selexol absorption technology, nitrogen is often
employed to strip CO2 from the solvent.
In addition to the cases discussed above based on the ConocoPhillips E-Gas gasifier, the
2007 NETL baseline study included cases employing the GE and Shell gasifiers.
Without CO2 capture, the net plant HHV efficiency was highest with the Shell gasifier at
41.1%, followed by E-Gas at 39.3%, and GE at 38.2%. With CO2 capture, all the
gasifiers produced the same IGCC net efficiency of about 32%. However, all of the CO2
capture cases do not manage carbon with the same proficiency. Emissions on a lb-CO2
per MWh basis were 253 with E-Gas, 206 with GE, and only 199 with Shell. This
ordering is also reflected in the maximum theoretical amount of hydrogen produced after
complete shifting of the raw syngas. E-Gas has the lowest content at 53.70%, followed
by GE at 57.88% and Shell at 58.18%. One of the implications of this ordering is that for
a given system pressure, membrane-based H2 recovery will be easier with the Shell and
GE gasifiers than with E-Gas, at least based on these current designs. On the other hand,
the levelized cost of electricity is also the highest of the IGCC plant designs employing
the Shell gasifier. With regards to the present study, membrane integration into the E-
Gas based IGCC plant is more challenging.

JMEC for TMS/NETL 11/30/09 03/13/06
23
IV. SCREENING & FLOWSHEET DEVELOPMENT
The screening analysis was undertaken to examine where in the IGCC process flowsheet
the membrane might be located to best perform its function of separating H2 from CO2.
Also examined was a hybrid system that couples pressure swing adsorption (PSA) with
membrane-based gas separation. The screening results were used to develop membrane
system configurations involving multiple membranes strategically distributed throughout
the IGCC process, which were then analyzed using more detailed models. Results of the
detailed analyses are the topic of Section V of this report.
A. Screening Analysis
The screening analysis considered the performance of a single ideal membrane, which
was modeled using theoretically-derived equations given in Appendices C through D.
These equations enable the maximum H2 recovery to be predicted; however, they do not
provide information on equipment size or cost, nor on impacts to the IGCC system as a
whole. Maximum H2 recovery is used solely as a metric to compare the performance of
various sets of membrane operating conditions and locations. High recoveries are a
prerequisite for the development of a cost-competitive CO2 capture process, since the loss
of H2 fuel gas results in the direct loss of IGCC power output.
The steps involved in estimating H2 recoveries for the different H2/CO2 separation
options are: determination of permeate dilution based on fuel-gas heating-value
requirements; selection of membrane/PSA unit inlet and outlet pressures; selection of
membrane H2 partial-pressure approach and/or WGS reaction temperature approach to
equilibrium; and estimation of H2 recovery and purity for the H2-rich fuel-gas and CO2-
rich capture stream. It is also assumed that the membrane is only permeable to hydrogen
(i.e. H2 selectivity relative to all other gas components is infinite). Any effects of an
acid-gas removal (AGR) unit, if present, on H2 recovery are ignored. Effects of these
assumptions will be examined more carefully for the membrane configurations selected
for detailed modeling.
A complete description of the screening methodology is provided in Appendix B. Three
membrane placement options were considered for screening: post-WGS H2 recovery,
CO2 compressor-interstage H2 recovery (with and without post-WGS PSA), and H2
recovery integrated with WGS. Parameters considered in the screening analysis are
reported in Table 5.
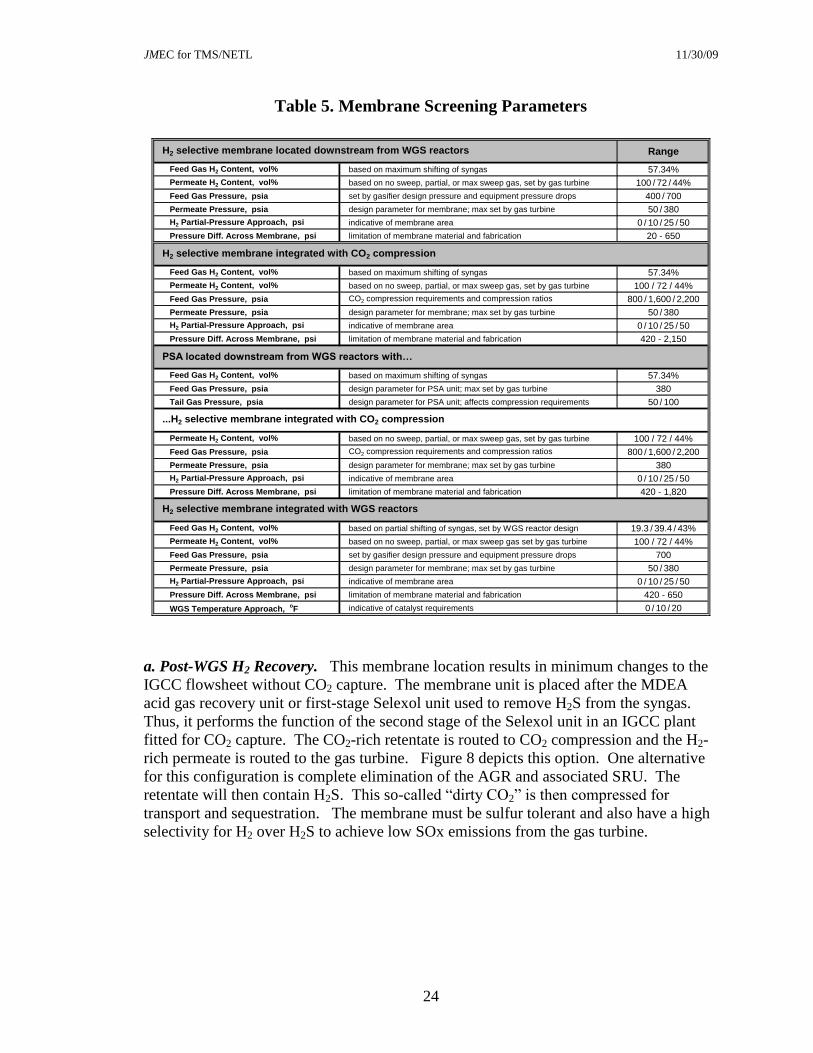
JMEC for TMS/NETL 11/30/09 03/13/06
24
Table 5. Membrane Screening Parameters
Range
Feed Gas H2 Content, vol% based on maximum shifting of syngas 57.34%
Permeate H2 Content, vol% based on no sweep, partial, or max sweep gas, set by gas turbine 100 / 72 / 44%
Feed Gas Pressure, psia set by gasifier design pressure and equipment pressure drops 400 / 700
Permeate Pressure, psia design parameter for membrane; max set by gas turbine 50 / 380
H2 Partial-Pressure Approach, psi indicative of membrane area 0 / 10 / 25 / 50
Pressure Diff. Across Membrane, psi limitation of membrane material and fabrication 20 - 650
Feed Gas H2 Content, vol% based on maximum shifting of syngas 57.34%
Permeate H2 Content, vol% based on no sweep, partial, or max sweep gas, set by gas turbine 100 / 72 / 44%
Feed Gas Pressure, psia CO2 compression requirements and compression ratios 800 / 1,600 / 2,200
Permeate Pressure, psia design parameter for membrane; max set by gas turbine 50 / 380
H2 Partial-Pressure Approach, psi indicative of membrane area 0 / 10 / 25 / 50
Pressure Diff. Across Membrane, psi limitation of membrane material and fabrication 420 - 2,150
Feed Gas H2 Content, vol% based on maximum shifting of syngas 57.34%
Feed Gas Pressure, psia design parameter for PSA unit; max set by gas turbine 380
Tail Gas Pressure, psia design parameter for PSA unit; affects compression requirements 50 / 100
Permeate H2 Content, vol% based on no sweep, partial, or max sweep gas, set by gas turbine 100 / 72 / 44%
Feed Gas Pressure, psia CO2 compression requirements and compression ratios 800 / 1,600 / 2,200
Permeate Pressure, psia design parameter for membrane; max set by gas turbine 380
H2 Partial-Pressure Approach, psi indicative of membrane area 0 / 10 / 25 / 50
Pressure Diff. Across Membrane, psi limitation of membrane material and fabrication 420 - 1,820
Feed Gas H2 Content, vol% based on partial shifting of syngas, set by WGS reactor design 19.3 / 39.4 / 43%
Permeate H2 Content, vol% based on no sweep, partial, or max sweep gas set by gas turbine 100 / 72 / 44%
Feed Gas Pressure, psia set by gasifier design pressure and equipment pressure drops 700
Permeate Pressure, psia design parameter for membrane; max set by gas turbine 50 / 380
H2 Partial-Pressure Approach, psi indicative of membrane area 0 / 10 / 25 / 50
Pressure Diff. Across Membrane, psi limitation of membrane material and fabrication 420 - 650
WGS Temperature Approach, oF indicative of catalyst requirements 0 / 10 / 20
H2 selective membrane located downstream from WGS reactors
H2 selective membrane integrated with WGS reactors
PSA located downstream from WGS reactors with…
H2 selective membrane integrated with CO2 compression
...H2 selective membrane integrated with CO2 compression
a. Post-WGS H2 Recovery. This membrane location results in minimum changes to the
IGCC flowsheet without CO2 capture. The membrane unit is placed after the MDEA
acid gas recovery unit or first-stage Selexol unit used to remove H2S from the syngas.
Thus, it performs the function of the second stage of the Selexol unit in an IGCC plant
fitted for CO2 capture. The CO2-rich retentate is routed to CO2 compression and the H2-
rich permeate is routed to the gas turbine. Figure 8 depicts this option. One alternative
for this configuration is complete elimination of the AGR and associated SRU. The
retentate will then contain H2S. This so-called “dirty CO2” is then compressed for
transport and sequestration. The membrane must be sulfur tolerant and also have a high
selectivity for H2 over H2S to achieve low SOx emissions from the gas turbine.

JMEC for TMS/NETL 11/30/09 03/13/06
25
AGR(MDEA)
H2S to SRU/TGT
HTS / LTS(max)
Steam
Sour
Syngas
CO2 to
Sequestration
Gas Turbine
Feed
H2
Membrane
Sweep Gas/
GT Fuel Diluent
( optional )
( optional )
( optional )
Figure 8. Post-WGS H2 Recovery Schematic
The results of the post-WGS hydrogen recovery analysis are reported in Table 6. The
baseline Case 1a assumes a membrane feed pressure of 400 psia (27 bar), which is a
typical pressure used in some IGCC designs. It is desirable to recover hydrogen at the
required GT feed pressure of 380 psia (26 bar). Case 1a shows that this pressure is
infeasible. The total pressure differential across the membrane is too small and results in
a negative H2 partial-pressure approach for the membrane. If the permeate pressure is
lowered to 50 psia (3.4 bar) as in Case 1b, recoveries up to 89.4% would be possible;
however, hydrogen re-compression will be required. Case 1c maintains the desired
permeate pressure of 380 psia, but uses a sweep gas to lower the H2 partial-pressure of
the permeate; achieving a modest recovery of 46.9%. Combining a low permeate
pressure with the use of a sweep gas as in Case 1d can recover up to 95.7% of the feed
hydrogen.
Table 6. Results of Screening for Post-WGS H2 Recovery
Description
Feed
Pressure
Permeate
Pressure
H2 Press.
Approach
Retentate
(CO2-rich)
Permeate
(H2-rich)
Hydrogen
Recovery
Case psia psia psi mol% H2 mol% H2%
1a Baseline 400 380 0 57.3% 100.0% 0.0%
1b 1a + Low Permeate Pressure 400 50 0 12.5% 100.0% 89.4% -3.7 P P/ %H2 Rec
1c 1a + Max Sweep 400 380 0 41.6% 43.8% 46.9% -1.2 % H2 P/ %H2 Rec
1d 1b + Max Sweep 400 50 0 5.5% 43.8% 95.7% -8.9 % H2 P/ %H2 Rec
1e 1a + High Feed Pressure 700 380 0 54.3% 100.0% 11.7% 25.7 P R/ %H2 Rec
1f 1e + Low Permeate Pressure 700 50 0 7.1% 100.0% 94.3% -4.0 P P/ %H2 Rec
1g 1e + Max Sweep 700 380 0 23.8% 43.8% 76.8% -0.9 % H2 P/ %H2 Rec
1h 1f + Max Sweep 700 50 0 3.1% 43.8% 97.6% -16.9 % H2 P/ %H2 Rec
1i 1f + 1/2 Sweep 700 50 0 5.1% 71.9% 96.0% -16.6 % H2 P/ %H2 Rec
1j 1h + 10 psi Approach 700 50 10 4.6% 43.8% 96.4% -8.7 P APP/ %H2 Rec
1k 1h + 20 psi Approach 700 50 25 6.7% 43.8% 94.7% -8.5 P APP/ %H2 Rec
1l 1h + 40 psi Approach 700 50 50 10.3% 43.8% 91.5% -8.2 P APP/ %H2 Rec
1 atm = 1.013 bar = 14.696 psi
(see Nomenclature)
H2 Recovery
Sensitivity
-
Case 1e employs a high feed pressure of 700 psia (48 bar), more typical of high-pressure
gasification operations, and a permeate pressure of 380 psia. While this case is feasible,
the recovery is only about 12%. If the permeate pressure is lowered to 50 psia as in Case
1f, the recovery is 94.3%; however, if sweep gas is employed as in Case 1g, the recovery
is only 76.8%. Combining these two approaches for lowering the H2 partial pressure in

JMEC for TMS/NETL 11/30/09 03/13/06
26
Case 1h, results in the highest recovery at 97.6%. Case 1i shows the impact of cutting the
sweep flowrate in half. This results a drop in a slight drop in H2 recovery to 96%.
Comparing Case 1h to Cases 1j through 1l shows how the H2 recovery is affected by the
assumed partial-pressure approach across the membrane. The smaller the approach, the
more membrane area required, and near the pinch point (i.e. an approach of zero), the
amount of area increases exponentially. Changing the pinch from the limit of zero to 50
psi lowers the maximum recovery from 97.6% to 91.5%.
It can be seen from Table 6 that the lowest H2 residual concentration in the retentate
correlates with hydrogen recovery. For Scenario 1h, the CO2-rich stream contains 3.1
vol% H2.
The last column of Table 6 shows the relative changes to the various membrane process
parameters required to improve H2 recovery by one percent.
b. CO2 Compressor Interstage H2 Recovery. This process integration results in a H2
recovery system which can include both a membrane and a PSA unit. It takes full
advantage of the high pressures required for CO2 transport and sequestration to drive the
H2/CO2 separation. Figure 9 depicts this option. With PSA, it is very similar to the
configuration previously studied by Parsons for the production of hydrogen from coal
when hydrogen, and not power, is the primary product [12]. The CO2-enriched tail gas
from the PSA unit is compressed as required for sequestration. The membrane unit may
be located between any of the compressor stages, after the last compressor, or in multiple
locations. As was the case with post WGS hydrogen recovery, the alternative of
eliminating the AGR and SRU entirely is possible.
AGR(MDEA)
H2S to SRU/TGT
Sour
Shift(max)
Steam
PSA
H2
Membrane
Sweep Gas/
GT Fuel Diluent
CO2 to
Sequestration
Sour
Syngas Gas Turbine
Feed
( optional )
( optional )
( optional )
Figure 9. CO2 Compressor Interstage H2 Recovery Schematic
First, a series of cases were developed with interstage H2 recovery, but without the use of
PSA. These results are reported in Table 7. The baseline Scenario 2a assumes a
membrane feed pressure of 800 psia, which is a typical interstage design pressure used

JMEC for TMS/NETL 11/30/09 03/13/06
27
for CO2 compression. Glycol dehydration of the CO2 is performed at this pressure. For
Scenario 2a, the required GT feed pressure of 380 psia was used. Scenario 2a is feasible;
however, the H2 recovery is only about 31%. Scenarios 2b and 2c raise the membrane
feed pressure to 1,600 and 2,200 psia respectively. These pressures are typical of what
might be required for the transport of CO2 by pipeline for very short to long distances,
respectively. The corresponding H2 recoveries are 76.4 and 84.2%. These configurations
have the serious drawback that all of the syngas is being compressed to very high
pressures. Scenario 2d is a repeat of the baseline Scenario 2a, using a low permeate
pressure of 50 psia. As was seen with Scenario 1d, the use of 50 psia for the permeate
pressure raises the H2 recovery into the mid nineties. Scenario 2e combines the low
permeate pressure with the use of a sweep gas. The recoveries for Scenarios 2d and 2e
are 94.5% and 97.7%, respectively. Note that these are very similar to the recoveries
obtained in Scenarios 1d and 1e as might be expected. If the membrane separation is to
be carried out on the entire syngas stream at pressures less than about 800 psia, it is
preferable to produce the syngas at pressure rather than compress the entire syngas from
400 to 800 psia. Finally, Scenario 2f shows the impact of compressing all the syngas to
2,200 psia and using a permeate recovery pressure of 380 psia and a sweep gas. Again,
the recovery is in the mid nineties.
Table 7. Results of Screening for CO2 Compressor Interstage H2 Recovery
None of the Scenarios 2a - 2f are particularly attractive; however, they do suggest an
opportunity to combine membrane separation with some other H2 recovery technology.
PSA is complimentary to membrane separation for this application. PSA can separate H2
from CO2 at the desired gas turbine inlet pressure of 380 psia, producing a tail-gas with
reduced H2 that can be compressed and run through a polymer membrane unit. Table 7
gives results for Scenarios 2g - 2r which employ a hybrid recovery system with post-
WGS PSA and CO2 compressor interstage membrane.
Scenarios 2g - 2i assume a PSA feed pressure of 400 psia and tail gas pressure of 50 psia.
The tail gas pressure is the same CO2 battery-limits pressure as obtained using the
Selexol process. The PSA unit recovers about 70% of the feed H2 with this tail gas
pressure. The purity of the PSA H2 product is greater than 99%. The tail gas, which
contains the remaining 30% of the H2 is compressed as part of preparing the CO2 for
pipeline transport. Scenario 2g assumes the membrane is placed in at an intermediate
point in the compression train where the pressure is 800 psia. Scenario 2h assumes an
interstage pressure of 1,600 psia, and Scenario 2i assumes the membrane is placed at the
final compression delivery pressure of 2,200 psia. For all of the scenarios, the hydrogen
Membrane Only
Feed
Pressure
Permeate
Pressure
Pressure
Pinch
Retentate
(CO2-rich)
Permeate
(H2-rich)
Hydrogen
Recovery
psia psia psi mol% H2 mol% H2%
2a Baseline 800 380 5 48.1% 100.0% 31.0%
2b 2a + 1,600 psia 1600 380 5 24.1% 100.0% 76.4%
2c 2a + 2,200 psia 2200 380 5 17.5% 100.0% 84.2%
2d 2a + Low Permeate Pressure 800 50 5 6.9% 100.0% 94.5%
2e 2d + Max Sweep 800 50 5 2.9% 37.0% 97.7%
2f 2c + Max Sweep 2200 380 5 6.6% 37.0% 94.7%
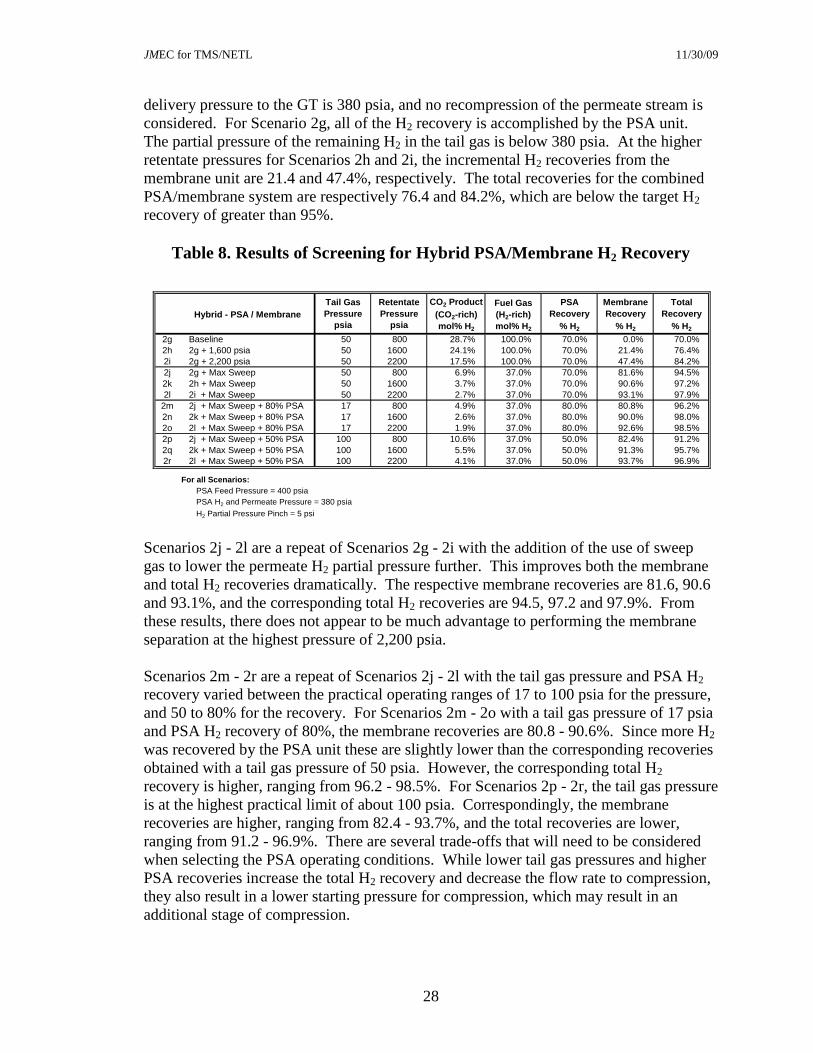
JMEC for TMS/NETL 11/30/09 03/13/06
28
delivery pressure to the GT is 380 psia, and no recompression of the permeate stream is
considered. For Scenario 2g, all of the H2 recovery is accomplished by the PSA unit.
The partial pressure of the remaining H2 in the tail gas is below 380 psia. At the higher
retentate pressures for Scenarios 2h and 2i, the incremental H2 recoveries from the
membrane unit are 21.4 and 47.4%, respectively. The total recoveries for the combined
PSA/membrane system are respectively 76.4 and 84.2%, which are below the target H2
recovery of greater than 95%.
Table 8. Results of Screening for Hybrid PSA/Membrane H2 Recovery
Scenarios 2j - 2l are a repeat of Scenarios 2g - 2i with the addition of the use of sweep
gas to lower the permeate H2 partial pressure further. This improves both the membrane
and total H2 recoveries dramatically. The respective membrane recoveries are 81.6, 90.6
and 93.1%, and the corresponding total H2 recoveries are 94.5, 97.2 and 97.9%. From
these results, there does not appear to be much advantage to performing the membrane
separation at the highest pressure of 2,200 psia.
Scenarios 2m - 2r are a repeat of Scenarios 2j - 2l with the tail gas pressure and PSA H2
recovery varied between the practical operating ranges of 17 to 100 psia for the pressure,
and 50 to 80% for the recovery. For Scenarios 2m - 2o with a tail gas pressure of 17 psia
and PSA H2 recovery of 80%, the membrane recoveries are 80.8 - 90.6%. Since more H2
was recovered by the PSA unit these are slightly lower than the corresponding recoveries
obtained with a tail gas pressure of 50 psia. However, the corresponding total H2
recovery is higher, ranging from 96.2 - 98.5%. For Scenarios 2p - 2r, the tail gas pressure
is at the highest practical limit of about 100 psia. Correspondingly, the membrane
recoveries are higher, ranging from 82.4 - 93.7%, and the total recoveries are lower,
ranging from 91.2 - 96.9%. There are several trade-offs that will need to be considered
when selecting the PSA operating conditions. While lower tail gas pressures and higher
PSA recoveries increase the total H2 recovery and decrease the flow rate to compression,
they also result in a lower starting pressure for compression, which may result in an
additional stage of compression.
Hybrid - PSA / Membrane
Tail Gas
Pressure
Retentate
Pressure
CO2 Product
(CO2-rich)
Fuel Gas
(H2-rich)
PSA
Recovery
Membrane
Recovery
Total
Recovery
psia psia mol% H2 mol% H2 % H2 % H2 % H2
2g Baseline 50 800 28.7% 100.0% 70.0% 0.0% 70.0%
2h 2g + 1,600 psia 50 1600 24.1% 100.0% 70.0% 21.4% 76.4%
2i 2g + 2,200 psia 50 2200 17.5% 100.0% 70.0% 47.4% 84.2%
2j 2g + Max Sweep 50 800 6.9% 37.0% 70.0% 81.6% 94.5%
2k 2h + Max Sweep 50 1600 3.7% 37.0% 70.0% 90.6% 97.2%
2l 2i + Max Sweep 50 2200 2.7% 37.0% 70.0% 93.1% 97.9%
2m 2j + Max Sweep + 80% PSA 17 800 4.9% 37.0% 80.0% 80.8% 96.2%
2n 2k + Max Sweep + 80% PSA 17 1600 2.6% 37.0% 80.0% 90.0% 98.0%
2o 2l + Max Sweep + 80% PSA 17 2200 1.9% 37.0% 80.0% 92.6% 98.5%
2p 2j + Max Sweep + 50% PSA 100 800 10.6% 37.0% 50.0% 82.4% 91.2%
2q 2k + Max Sweep + 50% PSA 100 1600 5.5% 37.0% 50.0% 91.3% 95.7%
2r 2l + Max Sweep + 50% PSA 100 2200 4.1% 37.0% 50.0% 93.7% 96.9%
For all Scenarios:
PSA Feed Pressure = 400 psia
PSA H2 and Permeate Pressure = 380 psia
H2 Partial Pressure Pinch = 5 psi

JMEC for TMS/NETL 11/30/09 03/13/06
29
Finally, it can be noted that for the highest recoveries, 98.0 and 98.5%, the residual H2
concentration in the CO2 is 2.6 and 1.9%, respectively.
c. WGS Interstage H2 Recovery. This process scheme results in a system which
integrates the hydrogen recovery with the water-gas shift section of the IGCC plant. The
IGCC baseline plant equipped with CO2 capture utilizes WGS reactors to convert CO and
H2O in the syngas to CO2 and H2 by the reaction:
CO + H2O CO2 + H2
This maximizes the amount of CO2 that can be captured. The resulting H2 can then be
combusted in the GT without the generation of additional CO2. The yield of H2 from the
WGS reaction is equilibrium controlled and the production of H2 is favored by low
reaction temperatures. Typically, three trains of reactors are used to produce high
conversion to hydrogen. The first two reactors are operated at high temperature to
improve the rate of the exothermic WGS reaction, and the third reactor is operated at a
lower temperature to maximize total conversion. Inter-reactor cooling is required to
remove the heat of reaction. In addition, excess steam is injected with the syngas to both
improve the equilibrium hydrogen yield and to prevent coking of the WGS catalyst.
Gas Turbine
Feed
( optional )
Gas Turbine
Feed
( optional )
Sour
SyngasH2
MembraneSweep Gas/
GT Fuel Diluent
( optional )
WGS(stage n)
H2
Membrane
( optional )
Sweep Gas/
GT Fuel Diluent
( optional )
( optional )
Sour
Syngas
Figure 10. WGS Reactor Interstage H2 Recovery Schematic
The results of the WGS interstage hydrogen recovery analysis are reported in Table 9

JMEC for TMS/NETL 11/30/09 03/13/06
30
Table 9. Results of Screening for WGS Reactor Interstage H2 Recovery
Schematic
Description*
Permeate
Pressure
H2 Press.
Approach
Retentate
(CO2-rich)
Permeate
(H2-rich)
Hydrogen
Recovery
WGS Exit
Temp
Total CO
Conversion
Case psia psi mol% H2 mol% H2%
oC %
3a Baseline (exit 3rd
WGS reactor) 380 0 43.2% 100.0% 0.0% 235 97.7%
3b 3a + Low Permeate Pressure 50 0 7.1% 100.0% 89.9% 235 97.7%
3c 3a + Max Sweep 380 0 23.8% 43.8% 59.0% 235 97.7%
3d Baseline (exit 2nd
WGS reactor) 380 0 42.5% 100.0% 0.0% 295 94.6%
3e 3d + Low Permeate Pressure 50 0 7.1% 100.0% 89.6% 295 94.6%
3h 3d + Max Sweep 380 0 23.8% 43.8% 57.7% 295 94.6%
3k Baseline (exit 1st WGS reactor) 380 0 39.4% 100.0% 0.0% 430 82.1%
3l 3k + Low Permeate Pressure 50 0 7.1% 100.0% 88.2% 430 82.1%
3o 3k + Max Sweep 380 0 23.8% 43.8% 52.0% 430 82.1%
3r Baseline (enter 1st WGS reactor) 380 0 19.3% 100.0% 0.0% 250 0.0%
3s 3r + Low Permeate Pressure 50 0 7.1% 100.0% 67.9% 250 0.0%
3v 3r + Max Sweep 380 0 19.3% 43.8% 0.0% 250 0.0%
*Feed Pressure = 700 psia, all cases; 1 atm = 1.013 bar = 14.696 psi
Feed H2 Conc. = 43.20%, cases a-c; 42.45%, d-g; 39.40%, h-k; 19.33%, l-o;
H2 Approach = 0 psi; except where noted;
WGS Approach = 10 Co (18 F
o), except where noted.
The low initial H2-content of the syngas makes it unattractive to locate gas separation
membranes upstream of the first WGS reactor. Enhancement to CO conversion resulting
from integration after the first high-temperature reactor enables the low-temperature third
reactor to be eliminated. However, significant hydrogen is still present in the syngas
exiting the second reactor, requiring further downstream gas separation.
B. Membrane / IGCC Integration
The results from the screening analysis were used to develop more-detailed membrane
system configurations and processing specifications for integrating membrane-based
separations into the IGCC process. These configurations are assessed in the sections of
this report that follow, using rigorous membrane modeling, detailed IGCC system design,
and complete equipment sizing and costing. Six configurations, combining various
features identified during screening were considered worthy of further analysis. These
are described below:
Configuration Ia: This configuration is based on screening Case 1f. Membranes are
integrated into the IGCC flowsheet downstream of the WGS reactors and upstream of the
combustion turbine and CO2 compression. A high gasification pressure and low
permeate pressure are used to maximize the driving force for H2 recovery.
Several options for H2S removal prior to membrane separation are considered with this
configuration: warm-gas, cold-gas and no clean-up. A sensitivity case is performed to
determine the impact of having to pre-heat the membrane feed gas.
Configuration Ib: This configuration is based on screening Case 1g. As with
Configuration Ia, membranes are integrated into the IGCC flowsheet downstream of the
WGS reactors and upstream of the combustion turbine and CO2 compression. The
permeate pressure is considerably higher than in Ia, and matches the requirements of the
gas turbine. A high gasification pressure and permeate sweep gas are used to achieve an

JMEC for TMS/NETL 11/30/09 03/13/06
31
acceptable driving force for H2 recovery. The sweep gas is also the diluent for the fuel-
gas fed to the turbine. Note that the performance of this configuration will be superior to
that estimated in the screening analysis, since the driving force will be calculated
rigorously along the length of the membrane, in contrast to the screening assumption that
the permeate side of the membrane is well-mixed.
As with Ia, warm-gas, cold-gas and no clean-up options for H2S removal are considered
for this configuration. Sensitivity cases are performed to determine the impact of
different levels of CO2 capture from the IGCC plant.
Configuration IIa: As the screening Cases 2d-2f indicate, Configuration Ib can be
improved upon by integrating additional membranes between CO2 compression stages,
along with the use of a sweep gas. This maximizes H2 recovery while minimizing the
amount of additional compression required for any residual H2 left in the retentate prior
to compression.
As with the previous configurations, warm-gas, cold-gas and no clean-up options for H2S
removal are considered for Configuration IIa.
Configuration IIb: Based upon screening Cases 2p-2r, a hybrid Case was considered
that combines PSA with membrane separation. Operation of the upstream PSA unit
requires a lower pressure gas clean-up and WGS operation. However, it produces a high-
purity H2 stream that can be either used for power generation or be sold.
Configuration III: Screening Cases 3r and 3v indicate that both CO conversion and H2
recovery suffer, if the membrane is integrated too far upstream. Therefore, a
configuration based upon combining Cases 3c and 3h, and eliminating the low-
temperature, third WGS reactor was developed.

JMEC for TMS/NETL 11/30/09 03/13/06
32
V. DETAILED MODELING & ECONOMIC ANALYSIS
Based on the results from the screening analysis, a series of five process flowsheet
configurations were developed for more detailed modeling and assessment.
Configurations Ia, Ib, IIa, and IIb, all involve integration of the gas separation
membranes after the WGS reactor section of the IGCC plant. Configuration IIb is a
hybrid system employing both membranes and pressure swing adsorption (PSA).
Configuration III integrates membranes within the water-gas-shift (WGS) reactor train.
Modeling of the membrane was performed using the finite-difference mathematical
model described in Appendix F. This model is spreadsheet based. Since many of the
membrane system configurations studied involved multiple membrane units, each unit
was modeled in a separate spreadsheet. These spreadsheets were then linked together to
simulate the entire membrane system, including the effects of any gas compression, heat
exchange, or syngas shift. The membrane model also incorporates simplified WGS
kinetics. Therefore, it can be used to model both a WGS membrane reactor and stand-
alone fixed-bed WGS reactor configurations.
Multiple cases were analyzed for each configuration. These cases considered flowsheet
variations, such as cold versus warm-gas clean-up for H2S removal, CO2/H2S co-
sequestration with no H2S removal, and the effects of having to re-heat the membrane
feed gas due to possible membrane operating limitations. Sensitivity cases were also run
to examine the impact of relaxing or tightening the 90% CO2 capture requirement. The
individual cases simulated for each configuration are described in more detail below.
The material and energy balances for each case were then integrated with those for the
IGCC power plant. The IGCC power plant balances were obtained from the NETL 2007
report Cost and Performance Baseline for Fossil Energy Plants [15]. Appendix G
describes how this integration was performed. The resulting material and energy
balances were used to estimate the size and cost of any new or altered equipment within
the IGCC flowsheet. NETL‟s IGCC Economics Model was used to re-scale equipment
costs, and is also described in Appendix G.
A. Configuration Ia – Membrane integration post-WGS with H2 re-compression
This configuration is depicted in Figure 11. Four different cases are analyzed based on
downstream processing of the shifted syngas:
Case Ia1: The shifted syngas is cooled, condensing residual water present in this stream,
and then fed to a single-stage, cold-gas AGR unit. Unlike the IGCC plant designs that
employ MDEA-based H2S removal, this case uses a single-stage Selexol unit, which is
preferred at these higher operating pressures. The clean syngas leaves the cold-gas unit
at a temperature of 117oF (47
oC) and a pressure of 760 psia (51.8 bar).

JMEC for TMS/NETL 11/30/09 03/13/06
33
H2
Membrane
WG
AGR
H2S to SRU/TGT
H2
Membrane
CO2 to Dehydration,
Compression
(1 or 2 stages)
& Sequestration
Shifted
Syngas
Gas Turbine
Feed
~56% H2 (dry basis)
~44% H2
450 psia
760 psia
260oC
H2
Membrane
P = 5 psi
H2 Re-Compression
(3 stages)
216 psia
104 psia
50 psia
770 psia
240oC
N2 Diluent
from ASUCG
AGR
H2S Removal
Options
CASE 1
CASE 2
CASE 3
CASE 4
Feed Gas Heater
No AGR
No AGR
760 psia
47oC
770 psia
240oC
765 psia
350oC
A
B
C
P = 5 psi
P = 5 psi
H2O
H2O
H2O
Figure 11. Configuration Ia - Membrane integration post-WGS with
H2 re-compression
Case Ia2: The shifted syngas is not cooled and no residual water is condensed. This is
advantageous since it will increase the overall efficiency of the IGCC process. The
shifted-syngas is fed directly to a single-stage, warm-gas AGR unit. Processes for warm-
gas removal of H2S are currently only in an early stage of development, so it has been
assumed that these processes when commercialized will be able to achieve the same
performance as Selexol, but at an elevated temperature. Ideally, the feed temperature to
this process will match the outlet temperature of the LTS reactor. Most of the processes
under development employ a solid sorbent to scavenge H2S contained in the sour syngas.
The clean syngas leaves the warm-gas unit at a slightly-elevated temperature of 500oF
(260oC) due to the heat of adsorption, and a pressure of 760 psia (51.8 bar).
Case Ia3: H2S is not removed from the syngas, but is co-sequestered with the captured
CO2. This option requires the downstream membranes to be highly impermeable to H2S.
Otherwise, H2S that permeates the membranes will be combusted in the gas turbine
resulting in unacceptable air emissions of SOx. The syngas is fed directly to the first
membrane unit at a temperature of 464oF (240
oC) and a pressure of 770 psia (52.5 bar).
Case Ia4: This case is similar to Ia3; accept that it is assumed the membrane cannot be
operated below a temperature of 350oC. A number of membrane material considerations
can result in such a limitation (see Section II). For this case, the sour syngas is pre-
heated to 662oF (350
oC) before being fed to the first membrane unit at a pressure of 765
psia (52.2 bar). Heating the syngas will result in some loss in IGCC plant efficiency.
For the cases involving the feeding of warm syngas to the membrane separator, it is
assumed that the membrane material is highly permeable to water vapor. Otherwise, the
water vapor will remain with the retentate and eventually be condensed and removed
JMEC for TMS/NETL 11/30/09 03/13/06
34
from the CO2 prior to sequestration. This would negate any efficiency benefits obtained
from warm-gas clean-up.
The recovery of H2 from the syngas is accomplished using three membrane units in series
with the retentate from one unit being fed to the next. Three units were selected in order
to minimize the parasitic power needed to compress the H2 permeate up to the
combustion turbine feed pressure of 450 psia (30.7 bar). By staging the permeate
recovery pressures such that the first membrane sees the highest pressure and the last sees
the lowest pressure, it is possible to minimize compression without significantly
increasing membrane area requirements. The N2 fuel-gas diluent can also be compressed
along with the permeate. This dilution has the added benefit of reducing the partial
pressure of water present in the permeate from the warm-gas cases, preventing
condensation at the compressor discharge.
Performance of this system is comparable with conventional technology. When
compared to IGCC designs employing Selexol for CO2 capture, the post-WGS membrane
design cases described above have one major advantage:
CO2 is available for compression at a much higher pressure, ~750 vs. 22 to 300
psia (1.5 to 20.5 bar); thus, reducing equipment and the parasitic power required
for CO2 transportation and storage
However, the post-WGS membrane design cases also have some significant
disadvantages:
Hydrogen is recovered at pressures ranging from 50 to 216 psia (3.4 to 14.7 bar)
and will require re-compression to the desired fuel-gas pressure of 450 psia (bar),
introducing an additional parasitic power load on the IGCC plant
There is also a loss of power production, since the fuel-gas expander employed in
the Selexol-based design has been eliminated
H2 recovery is likely to be lower than with Selexol
The CO2 stream may contain significant amounts of un-recovered H2, as well as
residual CO from WGS conversion and other impurities
B. Configuration Ib – Membrane integration post-WGS with permeate sweep
Configurations eliminate H2 re-compression by strategic placement of multiple
membrane units. A sweep gas is used to enhance the recovery of H2 without lowering the
total pressure of the H2-rich stream leaving the membrane system. Nitrogen from the air
separation unit is used as the sweep gas, and also serves as the diluent for the gas turbine
fuel gas. This configuration is depicted in Figure 12. Five different cases are analyzed
based on downstream processing of the shifted syngas:
Case Ib1: The shifted syngas is cooled, condensing residual water present in this stream,
and then fed to a single-stage, cold-gas AGR unit. Unlike the IGCC plant designs that
employ MDEA-based H2S removal, this case uses a single-stage Selexol unit, which is
preferred at these higher operating pressures. The clean syngas leaves the cold-gas unit
at a temperature of 117oF (47
oC) and a pressure of 760 psia (51.8 bar).

JMEC for TMS/NETL 11/30/09 03/13/06
35
CO2 to Sequestration
(1 or 2 stages)
50 psia
H2
Membrane
WG
AGR
H2S to SRU/TGT
H2
Membrane
Shifted
Syngas
Gas Turbine
Feed
~56% H2 (dry basis)
~44% H2
450 psia
760 psia
260oC
H2
Membrane
P = 5 psi
N2 Compression
(3 stages)
& Pre-Heat/Cooling
455 psia
770 psia
240oC
N2 Diluent/
Sweep
from ASU
CG
AGR
H2S Removal
Options
CASE 1
CASE 2
CASE 3
CASE 4
Feed Gas Heater
No AGR
No AGR
760 psia
47oC
770 psia
240oC
765 psia
350oC
A
B
C
P = 5 psi
P = 5 psi
2200 psia
Figure 12. Configuration Ib - Membrane integration post-WGS with
permeate sweep
Case Ib3: H2S is not removed from the syngas, but is co-sequestered with the captured
CO2. This option requires the downstream membranes to be highly impermeable to H2S.
Otherwise, H2S that permeates the membranes will be combusted in the gas turbine
resulting in unacceptable air emissions of SOx. The syngas is fed directly to the first
membrane unit at a temperature of 464oF (240
oC) and a pressure of 770 psia (52.5 bar).
Case Ib4: This case is similar to Ib3, except that it is assumed the membrane cannot be
operated below a temperature of 350oC. A number of membrane material considerations
can result in such a limitation (see Section II). For this case, the sour syngas is pre-
heated to 662oF (350
oC) before being fed to the first membrane unit at a pressure of 765
psia (52.2 bar). Heating the syngas will result in some loss in IGCC plant efficiency.
In all of these cases, nitrogen from the ASU is employed as a sweep gas. As with Case
Ia, the recovery of H2 from the syngas is accomplished using three membrane units in
series with the retentate from one unit being fed to the next. Three units were selected in
order to minimize the parasitic power needed to compress the H2 permeate up to the
combustion turbine feed pressure of 450 psia (30.7 bar). By staging the permeate
recovery pressures such that the first membrane sees the highest pressure and the last sees
the lowest pressure, it is possible to minimize compression without significantly
increasing membrane area requirements. The N2 fuel-gas diluent can also be compressed
along with the permeate. This dilution has the added benefit of reducing the partial
pressure of water present in the permeate from the warm-gas cases, preventing
condensation at the compressor discharge.
When compared to IGCC designs employing Selexol for CO2 capture, the post-WGS
membrane design cases with sweep gas described above have the major advantages:
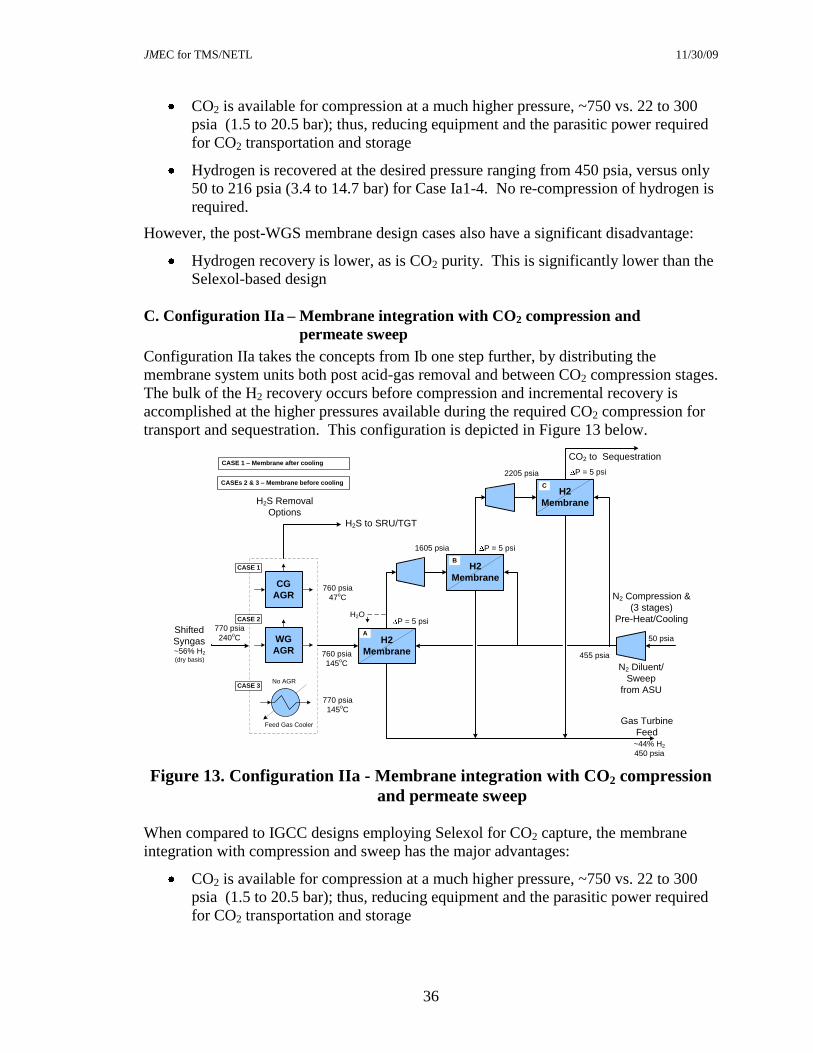
JMEC for TMS/NETL 11/30/09 03/13/06
36
CO2 is available for compression at a much higher pressure, ~750 vs. 22 to 300
psia (1.5 to 20.5 bar); thus, reducing equipment and the parasitic power required
for CO2 transportation and storage
Hydrogen is recovered at the desired pressure ranging from 450 psia, versus only
50 to 216 psia (3.4 to 14.7 bar) for Case Ia1-4. No re-compression of hydrogen is
required.
However, the post-WGS membrane design cases also have a significant disadvantage:
Hydrogen recovery is lower, as is CO2 purity. This is significantly lower than the
Selexol-based design
C. Configuration IIa – Membrane integration with CO2 compression and
permeate sweep
Configuration IIa takes the concepts from Ib one step further, by distributing the
membrane system units both post acid-gas removal and between CO2 compression stages.
The bulk of the H2 recovery occurs before compression and incremental recovery is
accomplished at the higher pressures available during the required CO2 compression for
transport and sequestration. This configuration is depicted in Figure 13 below.
Feed Gas Cooler
No AGR
H2
Membrane
50 psia
C
P = 5 psi
WG
AGR
H2S to SRU/TGT
H2
Membrane
CO2 to Sequestration
Shifted
Syngas
Gas Turbine
Feed
~56% H2 (dry basis)
~44% H2
450 psia
760 psia
145oC
H2
Membrane
P = 5 psi
455 psia
770 psia
240oC
N2 Diluent/
Sweep
from ASU
CG
AGR
H2S Removal
Options
CASE 1
CASE 2
CASE 3
760 psia
47oC
770 psia
145oC
A
B
P = 5 psi
H2O
CASE 1 – Membrane after cooling
CASEs 2 & 3 – Membrane before cooling
N2 Compression &
(3 stages)
Pre-Heat/Cooling
1605 psia
2205 psia
Figure 13. Configuration IIa - Membrane integration with CO2 compression
and permeate sweep
When compared to IGCC designs employing Selexol for CO2 capture, the membrane
integration with compression and sweep has the major advantages:
CO2 is available for compression at a much higher pressure, ~750 vs. 22 to 300
psia (1.5 to 20.5 bar); thus, reducing equipment and the parasitic power required
for CO2 transportation and storage
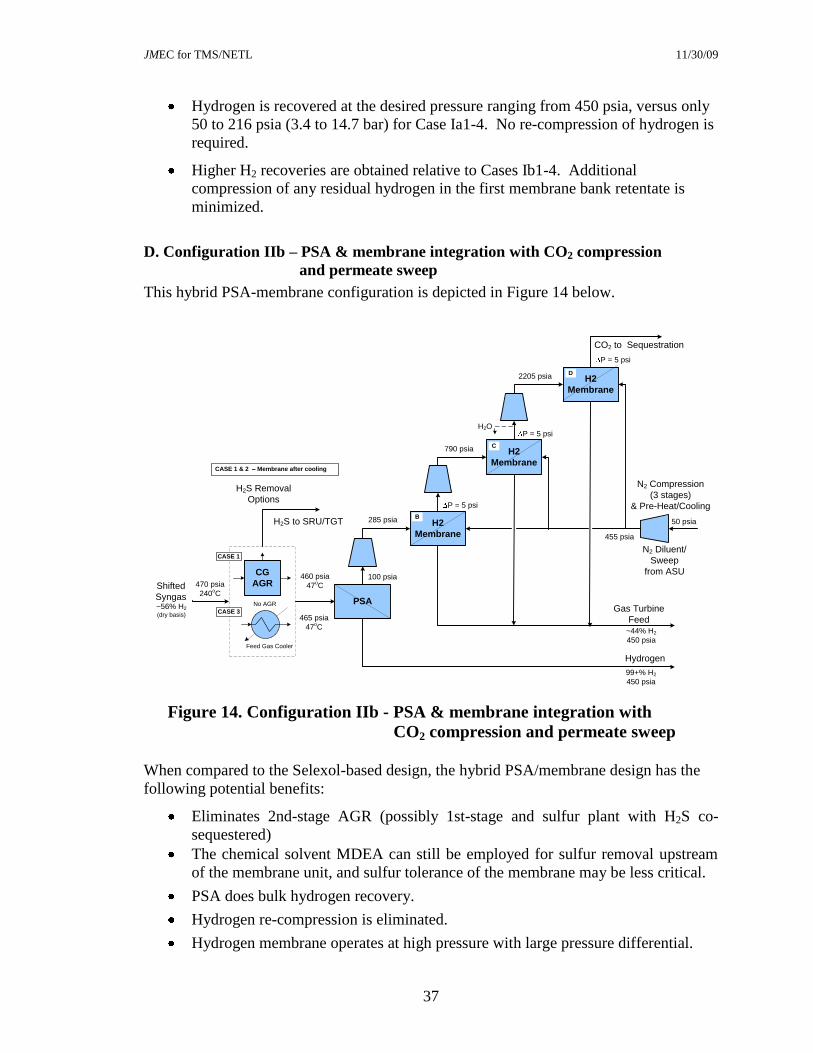
JMEC for TMS/NETL 11/30/09 03/13/06
37
Hydrogen is recovered at the desired pressure ranging from 450 psia, versus only
50 to 216 psia (3.4 to 14.7 bar) for Case Ia1-4. No re-compression of hydrogen is
required.
Higher H2 recoveries are obtained relative to Cases Ib1-4. Additional
compression of any residual hydrogen in the first membrane bank retentate is
minimized.
D. Configuration IIb – PSA & membrane integration with CO2 compression
and permeate sweep
This hybrid PSA-membrane configuration is depicted in Figure 14 below.
Feed Gas Cooler
No AGR
H2
Membrane
50 psia
D
P = 5 psi
H2
Membrane
H2S to SRU/TGT
PSA
CO2 to Sequestration
Shifted
Syngas
Gas Turbine
Feed
~56% H2 (dry basis)
~44% H2
450 psia
465 psia
47oC
H2
Membrane
455 psia
470 psia
240oC
N2 Diluent/
Sweep
from ASUCG
AGR
H2S Removal
Options
CASE 1
460 psia
47oC
B
C
P = 5 psi
P = 5 psiH2O
N2 Compression
(3 stages)
& Pre-Heat/Cooling
CASE 3
Hydrogen
99+% H2
450 psia
2205 psia
790 psia
285 psia
100 psia
CASE 1 & 2 – Membrane after cooling
Figure 14. Configuration IIb - PSA & membrane integration with
CO2 compression and permeate sweep
When compared to the Selexol-based design, the hybrid PSA/membrane design has the
following potential benefits:
Eliminates 2nd-stage AGR (possibly 1st-stage and sulfur plant with H2S co-
sequestered)
The chemical solvent MDEA can still be employed for sulfur removal upstream
of the membrane unit, and sulfur tolerance of the membrane may be less critical.
PSA does bulk hydrogen recovery.
Hydrogen re-compression is eliminated.
Hydrogen membrane operates at high pressure with large pressure differential.
JMEC for TMS/NETL 11/30/09 03/13/06
38
Sweep gas improves driving force and serves as GT diluent, and may also provide
some compressor inter-cooling.
Multiple membrane stages between compression steps are possible.
Low temperature in front of PSA allows use of current Hg control technologies.
It is possible to co-produce a high-purity hydrogen stream for sale from the PSA
unit.
The hybrid PSA/membrane design also faces some challenges:
High membrane selectivity for H2 vs. CO2 (and possibly H2S).
Additional requirements placed on ASU including N2 purity and delivery
pressure.
There is a loss of power production, since a fuel gas expander is not used and the
sweep gas must be compressed.
Desorption of H2S from PSA could be a potential problem.
There is a loss of gross power production, since a fuel gas expander is not used.
Hydrogen recovery is lower than with Selexol (possibly 98% vs. 99.5%).
The CO2 stream contains significant amounts of H2 (possibly 2-3%).
The integration of the above design introduces some additional constraints. PSA
requires low temperatures. Therefore warm-gas clean-up does not provide any
advantages.
E. Configuration IIIa – Membrane integration with WGS
The integration of hydrogen-selective membranes with WGS provides for some unique
advantages. The removal of H2 between reactor stages shifts equilibrium for the WGS to
the right in the same fashion as does steam injection, improving overall yield of
hydrogen. This provides potential process advantages:
Reduced injection steam requirements
Higher temperature operation with improved kinetics
Elimination of one of the reactor stages
However, the integrated WGS-membrane design also has some disadvantages:
Hydrogen recoveries are lower and it may be necessary to recover additional
hydrogen using CO2 compressor interstage membranes.
The membrane must be sulfur tolerant and impermeable to water. Lack of sulfur
tolerance could be addressed if a hot-gas clean-up technology were available that
would remove sulfur upstream of the first reactor. This would allow the CoMo
catalyst currently employed in the sour gas shift to be replaced with a higher
activity iron catalyst.
In addition, this integration could be improved by combining the reaction and separation
in one process (i.e. process intensification). This could result in incremental

JMEC for TMS/NETL 11/30/09 03/13/06
39
improvements in CO conversion and H2 recovery and a reduction in the amount of
process equipment. However, this compact device will be more complex, possibly
leading to higher equipment costs and operability and reliability issues.
Note on CO2 Purity. It is essential that the hydrogen content of the CO2 leaving the
IGCC power plant be as low as possible. The transportation of CO2 containing high
concentrations of H2 may pose an additional risk [16]. Two percent appears to be a
reasonable upper limit. This is less than the lower flammability limit of hydrogen in air,
which is 4%. Even at these low concentrations, it may be necessary to catalytically
combust the remaining H2, CO and any trace hydrocarbons prior to transportation. This
may also pose a difficulty for other capture technologies such as absorption.
System Performance Comparison. Key performance metrics from the analysis of
Configurations Ia, Ib, and IIa are reported in Table 10. The state-of-the-art (SOTA)
absorption technology can achieve almost complete H2 recovery; however, CO2 recovery
is at relatively low pressure. The membrane-based systems at best can only achieve
about 98% H2 recovery. A recovery of 95% is probably a practical upper limit.
However, Configuration Ib is only able to achieve 90% H2 recovery at the design
conditions considered in the analysis. All of the membrane configurations recover CO2 at
a much higher pressure than possible in the SOTA case. However, for Configuration Ia,
H2 recovery is achieved at much lower pressures, off-setting this advantage.
Table 10. Comparison of Different Membrane Configurations
with SOTA CO2 Capture Technology
Configurations Ib and IIa are able to recover the H2 at the desired pressure.
Configuration IIa requires the smallest membrane area. Membrane selectivity
requirements vary from 49 to 68, with lower selectivities (and smaller areas) required for
systems incorporating warm-gas clean-up.
Configuration IIb is a hybrid system which combines membranes with pressure-swing
adsorption (PSA). Each of these gas separation technologies has its own distinct
advantages and disadvantages, and they can be used together to improve the performance
of the overall gas separation system. In particular, Configuration IIb is advantageous in
situations where the gasification plant co-produces high-purity H2 for sale. The PSA
unit performs the bulk of the hydrogen separation upstream of the membranes, producing
SOTA
CGCU CGCU WGCU CGCU WGCU CGCU WGCU
H2 Recovery 99+% 95% 95% 90% N/A 95% N/A
H2 Purity 75% 93% 61% 43% N/A 44% N/A
H2 Recovery Pressure, psia 725 50-216 50-216 450 450 450 450
CO2 Recovery 90% 90% 90% 90% 90% 90% 90%
CO2 Purity 99+% 89% 87% 82% N/A 88% N/A
CO2 Recovery Pressure, psia 50/150 745 745 745 745 745 745
Required H2/CO2 Selectivity - 68 49 68 N/A 56 N/A
Relative Membrane Area - 1.00 0.82 1.04 N/A 0.56 N/A
SOTA - State-Of-The-Art CGCU - Cold-Gas Clean-Up
WGCU - Warm-Gas Clean-Up
Configuration Ia Configuration Ib Configuration Iia

JMEC for TMS/NETL 11/30/09 03/13/06
40
high-purity hydrogen. Results of the analysis of Configuration IIb indicate that between
50 and 80% of the total hydrogen produced at the plant could be produced at purities
exceeding 99%. While hydrogen re-compression is still not required for the fuel gas, use
of PSA limits the operating pressure of the upstream gasifier and results in an additional
stage of CO2 compression. Total H2 recovery for this process configuration is similar to
that achieved in Configuration IIa.
The results of this analysis were used to generate performance and cost targets for DOE-
sponsored membrane R&D. These targets, which relate directly back to the CCS
Program goals, are discussed in the next section of this report.
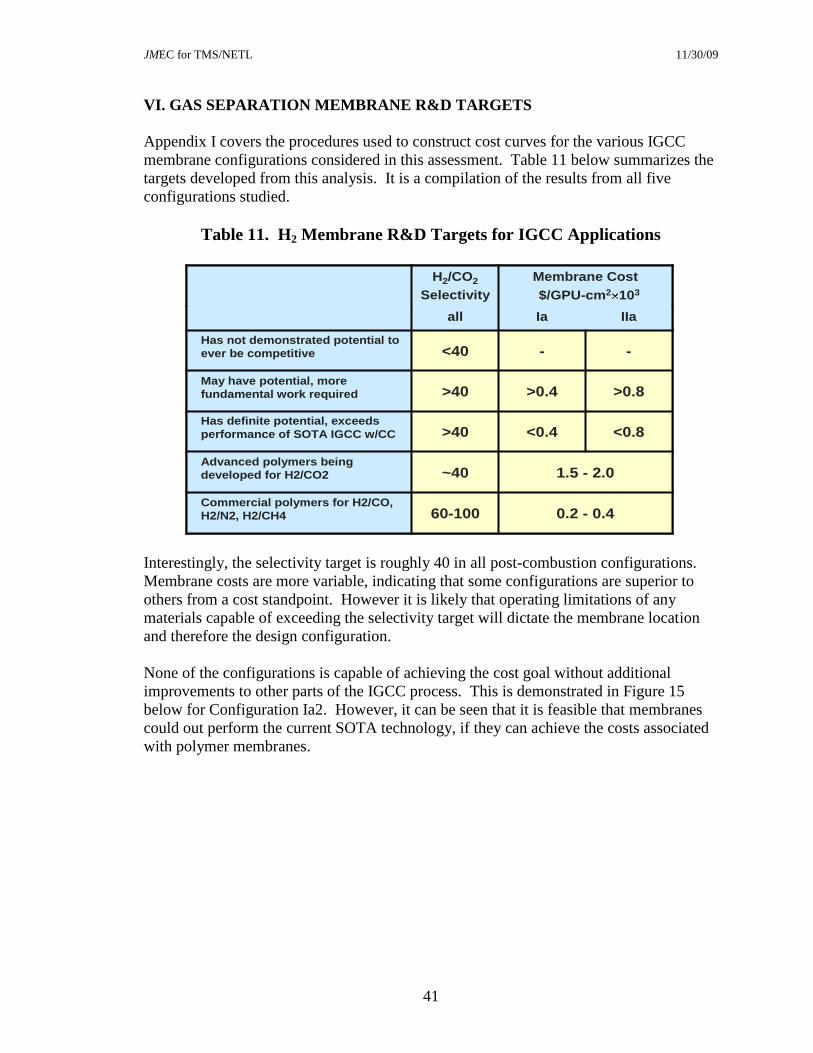
JMEC for TMS/NETL 11/30/09 03/13/06
41
VI. GAS SEPARATION MEMBRANE R&D TARGETS
Appendix I covers the procedures used to construct cost curves for the various IGCC
membrane configurations considered in this assessment. Table 11 below summarizes the
targets developed from this analysis. It is a compilation of the results from all five
configurations studied.
Table 11. H2 Membrane R&D Targets for IGCC Applications
Interestingly, the selectivity target is roughly 40 in all post-combustion configurations.
Membrane costs are more variable, indicating that some configurations are superior to
others from a cost standpoint. However it is likely that operating limitations of any
materials capable of exceeding the selectivity target will dictate the membrane location
and therefore the design configuration.
None of the configurations is capable of achieving the cost goal without additional
improvements to other parts of the IGCC process. This is demonstrated in Figure 15
below for Configuration Ia2. However, it can be seen that it is feasible that membranes
could out perform the current SOTA technology, if they can achieve the costs associated
with polymer membranes.
IIaIaall
0.2 - 0.460-100Commercial polymers for H2/CO,
H2/N2, H2/CH4
1.5 - 2.0~40Advanced polymers being
developed for H2/CO2
<0.8<0.4>40Has definite potential, exceeds
performance of SOTA IGCC w/CC
>0.8>0.4>40May have potential, more
fundamental work required
--<40Has not demonstrated potential to
ever be competitive
Membrane Cost
$/GPU-cm2 103
H2/CO2
Selectivity

JMEC for TMS/NETL 11/30/09 03/13/06
42
Figure 15. Cost Curves for Configuration Ia2
Carbon Sequestration Peer Review, September 17 - 20, 2007 32
Membrane Cost Curves for Process Design Ia2
$0.00
$10.00
$20.00
$30.00
$40.00
$50.00
$60.00
$70.00
$80.00
$0.00 $0.50 $1.00 $1.50 $2.00 $2.50 $3.00 $3.50 $4.00 $4.50 $5.00
Membrane Cost, $/GPU-cm2
CO
E,
$/M
Wh
H2/CO2 Selectivity = 100
40
50 20
30
104 500 30010
3200 150
90
80
70
60
10
15
12
commercial
PolymersCO,N2,CH4
experimental
PolymersCO2
Improved integration
Cost Curve for Configuration Ia2
SOTA w/Selexol
CSP COE Goal
×103

JMEC for TMS/NETL 11/30/09 03/13/06
43
VII. CONCLUSIONS
This assessment has shown that modular gas separation membranes may be attractively
integrated into a number of locations in an IGCC process to separate CO2 from H2. More
than one type of membrane material will likely be needed, if membranes are to be placed
in multiple locations in the process. Syngas cooling, water-gas-shift conversion, syngas
clean-up, and CO2 capture for sequestration operate over a wide range of temperatures
(40-1,000oC). The desired operating temperature for the membrane is a key factor in
screening membrane materials for IGCC and hydrogen production applications. Low-
temperature membrane applications should not be ruled out for CO2 capture and may be
more achievable in the short term.
High membrane selectivity is a prerequisite for successful process integration. H2/CO2
selectivity is directly related to the 90% CO2 capture goal of the DOE R&D Program, and
is still a major hurdle for most gas separation membranes under development. Based on
this analysis, the minimum H2/CO2 selectivity appears to be on the order of 50. Other
issues also remain to be resolved for membranes currently under development.
Compared to commercial polymer membranes, cost and foot print will be issues with
advanced membranes, and the cost of selective membrane materials and porous supports
may be critical. An economic trade-off exists between total membrane area and
membrane permeance. A low-cost, low-permeance membrane may be just as, or more
attractive than, a high-cost, high-permeance membrane as long as the membrane meets
selectivity requirements.
Integrating gas separation membranes into the CO2 compression train (Configuration IIa)
has many benefits, since H2 and recycle gas re-compression are undesirable for IGCC
applications. Major advantages of this integration are the elimination of the 2nd-stage of
AGR (and the 1st-stage if H2S is co-sequestered), chemical solvents can be used for
absorption of H2S, CO2 is delivered to compression at a much higher pressure, no H2 re-
compression is required, the H2 separation membranes operate at very high pressures
with large membrane pressure differentials, and the sweep gas further improves the
pressure driving force and serves as a gas turbine fuel-gas diluent. With further
integration of a PSA unit with gas separation membranes, the coal gasification plant can
also co-produce high-purity hydrogen for application in fuel cells. Between 50 and 80%
of the hydrogen could be produced at high-purity in this hybrid gas-separation system
(Configuration IIb).
Finally, membrane integration with the water-gas-shift reaction, up-stream of the acid gas
removal system has a number of advantages. Most notably, removal of hydrogen from
the syngas before and during the water-gas-shift improves the conversion of CO and H2O
to H2 and CO2.
JMEC for TMS/NETL 11/30/09 03/13/06
44
NOMENCLATURE
PAPP - Change in membrane partial-pressure approach in psi
PP - Change in membrane permeate pressure in psi
PR - Change in membrane retentate (feed gas) pressure in psi
PTG - Change in PSA unit tail-gas pressure in psi
%H2 P - Change in permeate H2 concentration, with concentrations expressed in
percentages
%H2 Rec - Change in H2 recovery, with recoveries expressed in percentages

JMEC for TMS/NETL 11/30/09 03/13/06
45
REFERENCES
1. Klett, M.G.; White, J.S., Schoff, R.L.; Buchanan, T.L., Hydrogen Production
Facilities Plant Performance and Cost Comparison, Final Report, Parsons Corp./NETL Contract No. DE-AM26-99FT40465, March 2002.
2. Klett, M.G.; Rutkowski, M.D.; Schoff, R.L., Cost and Performance of Hydrogen Separation Membranes (DRAFT), Parsons Corp./NETL Contract No. DE-AM26-99FT40465, May 2003.
3. Rutkowski, M.D., “Hydrogen Production from Fully Advanced Coal Gasification Plants,” Presentation – DOE NETL Hydrogen Program Planning Meeting, Oct. 22, 2003.
4. Gray, D.; Tomlinson, G., Hydrogen from Coal, Mitretek Systems, Inc./NETL Contract No. DE-AM26-99FT40465, July 2002.
5. Gray, D.; Tomlinson, G.; Salerno, S., “Coal Hydrogen & Power: Current & Future Configurations,” Presentation at NETL Hydrogen Program Planning Meeting, Oct. 22, 2002.
6. Gray, D.; Tomlinson, G.; Salerno, S., Presentation at NETL Hydrogen Program Planning Meeting (untitled), Oct. 22, 2003.
7. Choi, G.N. (Nexant, Inc.), Novel Composite Membranes for hydrogen Separation in Gasification Processes in Vision 21 Energy Plants, Final Technical Progress Report, 5/26/01-9/30/04, ITN Energy Systems, Inc./NETL Contract No. DE-FC26-01NT40973, Dec. 2004.
8. Chiesa, P.; Kreutz, T.; Lozza, G., “CO2 Sequestration from IGCC Power Plants by Means of Metallic Membranes,” Proceedings of GT2005 ASME Turbo Expo 2005, Reno-Tahoe, NV, June 6-9, 2005.
9. De Lorenzo, L.; Kreutz, T.G.; Chiesa, O.; Williams, R.H., “Carbon-Free Hydrogen and Electricity from Coal: Options for Syngas Cooling in Systems Using a Hydrogen Separation Membrane Reactor,” Proceedings of GT2005 ASME Turbo Expo 2005, Reno-Tahoe, NV, June 6-9, 2005.
10. Drawing courtesy of B.L. Bischoff, Oak Ridge National Laboratory, 2006.
11. IGCC Economics Model.xls, NETL, updated by J.P. Ciferno, June 5, 2007.
12. Buchanan, T.L.; Klett, M.G.; Schoff, R.L., Capital and Operating Cost of Hydrogen Production from Coal Gasification, Parsons Corp./NETL Contract No. DE-AM26-99FT40465, April 2003.
13. Personal communication from R.L. Schoff (Parsons Corp.) and J. Ciferno (U.S. DOE), September 2005.
14. Buchanan, T.L.; Delallo, M.; Schoff, R.L.; White, J.S., Evaluation of Innovative
Fossil Fuel Power Plants with CO2 Removal Interim Report, Parsons Corp. for
EPRI/U.S. DOE, NETL Report No. 1000316, Dec. 2000.
15. Cost and Performance Baseline for Fossil Energy Plants, Volume 1: Bituminous Coal and Natural Gas to Electricity Final Report (Original Issue Date, May 2007), Report No. DOE/NETL-2007/1281, Revision 1, August 2007.
16. Ciferno, J.; Newby, R., “Recommended Pressure and Composition for CO2 Pipeline Transport and Geological Storage for Use in Energy System Studies,” Carbon

JMEC for TMS/NETL 11/30/09 03/13/06
46
Sequestration System Analysis Technical Note No.2, U.S. DOE National Energy Technology Laboratory, May 2006.

JMEC for TMS/NETL 11/30/09 03/13/06
47
PROJECT-RELATED TECHNICAL PAPERS & PRESENTATIONS
“Integration of Gas Separation Membranes with IGCC,” Marano, J.J. and Ciferno, J.P,
9th International Conference on Greenhouse Gas Control Technologies, Washington,
DC, November 16-20, 2008. Published in Energy Procedia I, pp.361-368, Elsevier,
2009, available on-line at: www.sciencedirect.com.
“Gas Separation Membrane R&D Targets for CO2 Capture from IGCC Power Plants,”
Ciferno, J.P. and Marano, J.J., Seventh Annual Conference on Carbon Capture &
Sequestration, Pittsburgh, PA, May 5-8, 2008.
“Novel Integration of Gas Separation Membranes for CO2 Capture from IGCC Power
Plants,” Ciferno, J.P. and Marano, J.J., 2008 AIChE Spring National Meeting, New
Orleans, LA, April 6-8, 2008.
“Membrane Selection & Placement for Optimal CO2 Capture from IGCC Power Plants
(Project Review),” Ciferno, J.P. and Marano, J.J., ASME Carbon Sequestration Peer
Review, Pittsburgh, PA, Sept. 2007.
“Gas Separation Membrane Systems Analysis,” Ciferno, J.P., Marano, J.J. and Grol, E.,
NETL Project Status Review, Pittsburgh, PA, Oct. 18, 2007.
“Membrane Selection and Placement for Optimal CO2-Capture from IGCC Power
Plants,” Marano, J.J. and Ciferno, J.P., Fifth Annual Conference on Carbon Capture &
Sequestration, Alexandria, VA, May 8-11, 2006.
JMEC for TMS/NETL 11/30/09 03/13/06
48
APPENDIX A
Tutorial on Gas Separation Membranes
JMEC for TMS/NETL Appendix A 11/30/09 03/13/06
49
Tutorial on Gas Separation Membranes
Membrane separation takes advantage of differences in the relative transfer rates of
various gases through a membrane barrier, which is influenced by both the relative
diffusivity and surface adsorption of the various gases present. The exact mechanisms
for transport and adsorption vary for different membrane materials, such as polymers,
metals, and ceramics.
History – The earliest experimental studies of gas separation were conducted in the 1850s
by Thomas Graham, who measured permeation rates for a large number of gases through
a wide assortment of materials. Based on the results of his experiments, Graham
developed the solution-diffusion model for permeation and Graham‟s law of diffusion.
The solution-diffusion model is still used today to describe permeation through dense
materials, such as polymers. Graham‟s work was first exploited in the early 1940s as part
of the Manhattan project as a means of separating isotopes of uranium. Also in the 1940s
and 1950s, gas permeation theory was further developed by Barrer, van Amerongen,
Stern, Meares, and others leading to improvements to the solution-diffusion model.
Commercial application, however, would not emerge for another twenty years1.
The development of high flux membranes and large surface area membrane modules for
reverse osmosis applications in the late 1960s and early 1970s catalyzed the development
of membrane-based gas separation technology. Monsanto was first to commercialize
polymer-based gas separation membranes with the introduction of the PRISM™
membrane in 1980. Since then, the application of polymer membranes for hydrogen
separations has grown significantly. The success of PRISM resulted in the introduction
of other gas separation membrane technologies by companies such as Cynara, Separex,
Grace, Dow, Ube, and DuPont/AirLiquide.
Following the successful application of H2 separation membranes for industrial
processes, membranes were introduced for the removal of carbon dioxide from natural
gas and for nitrogen separation from air. Since the 1980s, continuous improvements have
been made in flux and selectivity through the introduction of advanced polymer materials
and improved membrane fabrication technologies, and the cost of gas separation
membrane systems have steadily declined. In addition to PRISM membranes currently
produced by Air Products, other examples of commercial membranes are MEDAL™
membranes produced by Air Liquide and PolySep™ membranes produced by UOP.
Nomenclature & Units of Measure – Before beginning a discussion of membranes, it is
useful to define some of the more important terminology used in describing membrane
separation. In membrane-based gas separations, the feed gas is introduced into a
membrane unit or module, and comes in contact with the membrane surface. The
penetrant or permeant is the molecular species in contact with the membrane surface that
passes through the membrane. The permeate is the stream containing penetrants that
leaves the membrane module. The non-permeate or retentate is the stream that has been
1 Baker, R.W., Membrane Technology and Applications, Second Edition, Wiley, 2004.
JMEC for TMS/NETL Appendix A 11/30/09 03/13/06
50
depleted of one or more penetrants that leaves the membrane module without passing
through the membrane. Other important definitions include2:
Permeability - transport flux per unit trans-membrane driving force per unit
membrane thickness. SI units: [kmol-m/m2-s-kPa]
Permeance - transport flux per unit trans-membrane driving force; permeance
equals permeability divided by membrane thickness. SI units:
[kmol/m2-s-kPa]
Pressure Ratio - ratio of the feed pressure to the permeate pressure
Selectivity - ratio of the permeability or permeance of one pure component to
another for a given membrane material at stated conditions
Separation Factor - ratio of the compositions of two components in the permeate
relative to the composition ratio of these components in the
retentate
Stage Cut - the fractional amount of the total feed entering a membrane module
that passes through the membrane as permeate
It should be noted that many investigators employ the above terms haphazardly; for
example, selectivity as defined above is sometimes referred to as separation factor (see
discussion below). Care must be taken in interpreting reported data for permeability,
permeance and selectivity.
The following units of measure are frequently employed for permeability:
1 Barrer = 10-10
cm3(STP)-cm / cm
2-s-cmHg
= 3.3464×10⁻¹⁴
g mol-cm / cm2-s-Pa
= 3.3464×10⁻¹²
kg mol-m / m2-s-kPa [SI units]
and for permeance:
1 GPU = 10-6
cm3(STP) / cm
2-s-cmHg
= 3.3464×10⁻¹⁰
g mol / cm2-s-Pa
= 3.3464×10⁻⁶
kg mol / m2-s-kPa [SI units]
where standard pressure and temperature (STP) are 0oC and 1 atmosphere, and GPU
stands for Gas Permeation Unit. Barrer and GPU are compound units based on the units
of measure selected for quantity transported, membrane thickness, membrane surface
area and partial pressure (i.e. component fugacity), respectively:
1 kg mol = 1,000 g mol = 76.0 cm3(STP) = 2.205 lb mol = 836.6 SCF(60
oF)
1 hr = 60 min = 3,600 sec
2 IUPAC Working Party on Membrane Nomenclature.

JMEC for TMS/NETL Appendix A 11/30/09 03/13/06
51
1 m = 100 cm = 39.37 in = 3.281 ft
1 m2 = 10
4 cm
2 = 1,550 in
2 = 10.764 ft
2
1 atm = 1.013 bar = 76.0 cmHg = 14.696 psi = 1.013×10⁵ Pa
Anatomy of a Membrane Separation Factor – For most perm-selective membrane
materials, the flux Ji of component i through the membrane will be proportional to the
difference in partial pressures on either side of the membrane barrier:
Ji = (P i / l )Δpi (A1)
where P i is the permeability of gas component i, l is the thickness of the membrane
barrier, and Δpi is the partial pressure driving force across the membrane. Equation A1 is
the basis for the definition of permeability given above. Also, the quantity P i / l can be
viewed as the pressure normalized flux; and is the basis for the definition of membrane
permeance:
Pi P i / l (A2)
Permeability is a property of the membrane material; whereas, permeance also depends
on the thickness of the membrane. Obviously, it is desirable to minimize the membrane
thickness to achieve the highest permeance and flux. The minimum thickness is limited
by material properties and membrane fabrication technique, and also depends on
mechanical strength requirements for any gas separation application.
Separation Factor is defined as:
SFij (Xi/Xj)permeate / (Xi/Xj)retentate (A3)
where Xi and Xj are mole fractions of components i and j on either side of the membrane.
It can be shown for a differential membrane element that3:
lim SFij = (Pi/Pj) (Δpi/pi permeate) / (Δpj/pj permeate) (A4)
Clearly, the separation factor is a function of material properties, membrane thickness
and partial pressure driving force. It is useful because it can be directly calculated from
experimental data; but is not a good indicator of a membrane‟s ability to separate gas
pairs because it is a function of operating conditions (i.e. Δp/p).
3 Derivation of equation A4 involves the substitution of A1 for the terms in the numerator, and the ideal gas
law for the terms in the denominator. A4 is only applicable for a differential membrane. The true
relationship between selectivity and separation factor is more complex and depends on actual geometry of
the membrane contactor. For more details see: Koros, W.J.; Fleming, G.K., “Membrane-based gas
separation,” Journal of Membrane Science, 83, pp.1-80, 1993.
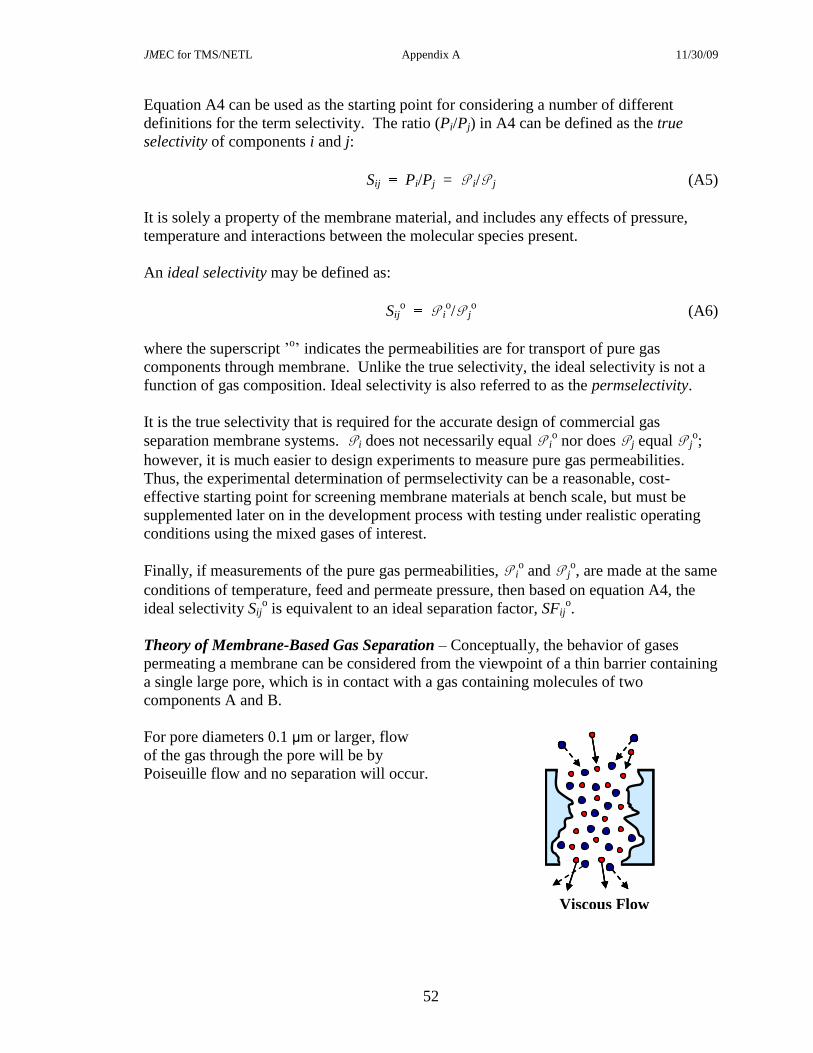
JMEC for TMS/NETL Appendix A 11/30/09 03/13/06
52
Equation A4 can be used as the starting point for considering a number of different
definitions for the term selectivity. The ratio (Pi/Pj) in A4 can be defined as the true
selectivity of components i and j:
Sij Pi/Pj = P i/P j (A5)
It is solely a property of the membrane material, and includes any effects of pressure,
temperature and interactions between the molecular species present.
An ideal selectivity may be defined as:
Sijo P i
o/P j
o (A6)
where the superscript ‟o‟ indicates the permeabilities are for transport of pure gas
components through membrane. Unlike the true selectivity, the ideal selectivity is not a
function of gas composition. Ideal selectivity is also referred to as the permselectivity.
It is the true selectivity that is required for the accurate design of commercial gas
separation membrane systems. P i does not necessarily equal P io nor does P j equal P j
o;
however, it is much easier to design experiments to measure pure gas permeabilities.
Thus, the experimental determination of permselectivity can be a reasonable, cost-
effective starting point for screening membrane materials at bench scale, but must be
supplemented later on in the development process with testing under realistic operating
conditions using the mixed gases of interest.
Finally, if measurements of the pure gas permeabilities, P io and P j
o, are made at the same
conditions of temperature, feed and permeate pressure, then based on equation A4, the
ideal selectivity Sijo is equivalent to an ideal separation factor, SFij
o.
Theory of Membrane-Based Gas Separation – Conceptually, the behavior of gases
permeating a membrane can be considered from the viewpoint of a thin barrier containing
a single large pore, which is in contact with a gas containing molecules of two
components A and B.
For pore diameters 0.1 μm or larger, flow
of the gas through the pore will be by
Poiseuille flow and no separation will occur.
Viscous Flow

JMEC for TMS/NETL Appendix A 11/30/09 03/13/06
53
As the pore diameter is decreased; a point is reached where the radius of the pore is of the
same magnitude as the mean free path of the gas molecules (λ/r 1).
For λ/r less than one, a gas molecule will
experience more collisions with the pore
walls than with other gas molecules. Since
molecule-to-molecule collisions are rare
each molecule moves independently through
the micropore. Therefore, for gas mixtures
containing components with different
average velocities, a gas separation is
possible.
This pore flow regime is known as Knudsen diffusion and for an ideal cylindrical pore;
the molecular flux of each component is governed by the equation:
lRT
pp
M
RTrJ LiHi
i
i
21
2
3
4 (A7)
where Ji is the flux of component i in units of kg-mol/m2-s, r is the pore radius in meters,
is the porosity of the membrane, R is the ideal gas constant in kg-m2/s
2-kg-mol-K, T is
absolute temperature in Kelvin, Mi is the molecular weight of the gas in kg/kg-mol, l is
the pore length in meters, pHi is the partial pressure at the entrance of the pore in Pascals,
and pLi is the partial pressure at the exit of the pore in Pascals. The subscripts H and L
designate the high and low partial pressure sides of the pore, respectively.
Based on Equation A7, the gas permeance is defined as:
21
2
3
4
i
iM
RT
lRT
rP (A8)
Equation A8 illustrates that for Knudsen diffusion, the permeance is inversely
proportional to the square root of the molecular weight of the gas and also to the square
root of the absolute temperature. The former relationship is the basis for Graham‟s law
for predicting the ideal selectivity of Knudsen diffusion membranes:
i
j
j
iij
M
MS
P
P (A9)
where i and j designate different molecular species present in the gas.
Knudsen Diffusion
A BA B

JMEC for TMS/NETL Appendix A 11/30/09 03/13/06
54
When the pore diameter decreases to
between 5 and 10 Å, the nanoporous
membrane begins to separate gas species
via a molecular sieving mechanism.
Ideally, for molecular sieving, the flux is related to the ratio of the area of the pore
available for transport to the total area of the pore. This is given by:
2
2
ki
kip
id
ddJ (A10)
where dp is the diameter of the pore and dki is the kinetic diameter of the gas molecule.
The ideal selectivity is then given by:
2
,
,
jkp
ikp
ijdd
ddS (A11)
In addition to the phenomena described above, Knudsen diffusion and molecular sieving,
surface adsorption and diffusion can contribute to molecular transport through membrane
pores.
Table A-1 lists molecular parameters for gases typically used in evaluating membrane
performance. Also presented are ideal selectivities calculated from these parameters for
both molecular sieving and Knudsen diffusion.
Table A-1. Molecular Parameters for Various Gases
Compiled from: Baker, R.W., Membrane Technology and Applications, Second Edition, Wiley, 2004;
Molecular Sieving
Mean Free Path Mol. Sieve Mol. Sieve Mol. Sieve Knudsen
(20oC, 1 bar) (7 Å pore dia.) (3.7 Å pore dia.) (3.32 Å pore dia.) Diffusion
Å Å PH2 / Px PH2 / Px PH2 / Px PH2 / Px
He 2.55 - 4.003 0.85 0.50 0.32 1.41
H2O 2.65 - 18.015 0.89 0.60 0.41 2.99
H2 2.89 1,744 2.016 1.00 1.00 1.00 1.00
CO2 3.30 615 44.010 1.23 4.10 330.00 4.67
O2 3.47 - 31.999 1.35 12.09 3.98
H2S 3.52 - 34.080 1.40 20.92 4.11
Ar 3.54 - 39.948 1.41 26.28 4.45
N2 3.64 929 28.013 1.50 182.25 3.73
CO 3.76 923 28.010 1.61 3.73
CH4 3.80 - 16.043 1.65 2.82
CF4 4.66 - 88.005 3.09 6.61
C3H8 5.12 - 44.097 4.77 4.68
SF6 5.13 - 146.054 4.82 8.51
Gas
Molecule
Kinetic
Diameter
Molecular
Weight
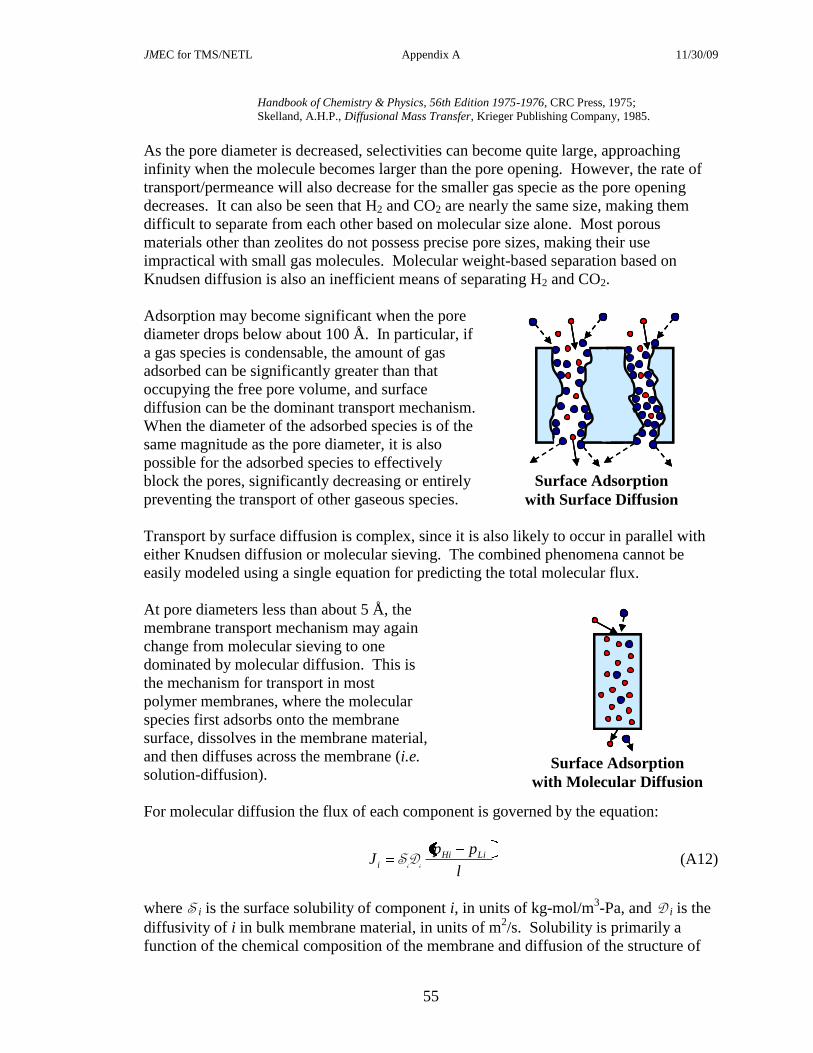
JMEC for TMS/NETL Appendix A 11/30/09 03/13/06
55
Handbook of Chemistry & Physics, 56th Edition 1975-1976, CRC Press, 1975;
Skelland, A.H.P., Diffusional Mass Transfer, Krieger Publishing Company, 1985.
As the pore diameter is decreased, selectivities can become quite large, approaching
infinity when the molecule becomes larger than the pore opening. However, the rate of
transport/permeance will also decrease for the smaller gas specie as the pore opening
decreases. It can also be seen that H2 and CO2 are nearly the same size, making them
difficult to separate from each other based on molecular size alone. Most porous
materials other than zeolites do not possess precise pore sizes, making their use
impractical with small gas molecules. Molecular weight-based separation based on
Knudsen diffusion is also an inefficient means of separating H2 and CO2.
Adsorption may become significant when the pore
diameter drops below about 100 Å. In particular, if
a gas species is condensable, the amount of gas
adsorbed can be significantly greater than that
occupying the free pore volume, and surface
diffusion can be the dominant transport mechanism.
When the diameter of the adsorbed species is of the
same magnitude as the pore diameter, it is also
possible for the adsorbed species to effectively
block the pores, significantly decreasing or entirely
preventing the transport of other gaseous species.
Transport by surface diffusion is complex, since it is also likely to occur in parallel with
either Knudsen diffusion or molecular sieving. The combined phenomena cannot be
easily modeled using a single equation for predicting the total molecular flux.
At pore diameters less than about 5 Å, the
membrane transport mechanism may again
change from molecular sieving to one
dominated by molecular diffusion. This is
the mechanism for transport in most
polymer membranes, where the molecular
species first adsorbs onto the membrane
surface, dissolves in the membrane material,
and then diffuses across the membrane (i.e.
solution-diffusion).
For molecular diffusion the flux of each component is governed by the equation:
l
ppJ LiHi
i iiDS (A12)
where S i is the surface solubility of component i, in units of kg-mol/m3-Pa, and D i is the
diffusivity of i in bulk membrane material, in units of m2/s. Solubility is primarily a
function of the chemical composition of the membrane and diffusion of the structure of
Surface Adsorption
with Surface Diffusion
Surface Adsorption
with Molecular Diffusion
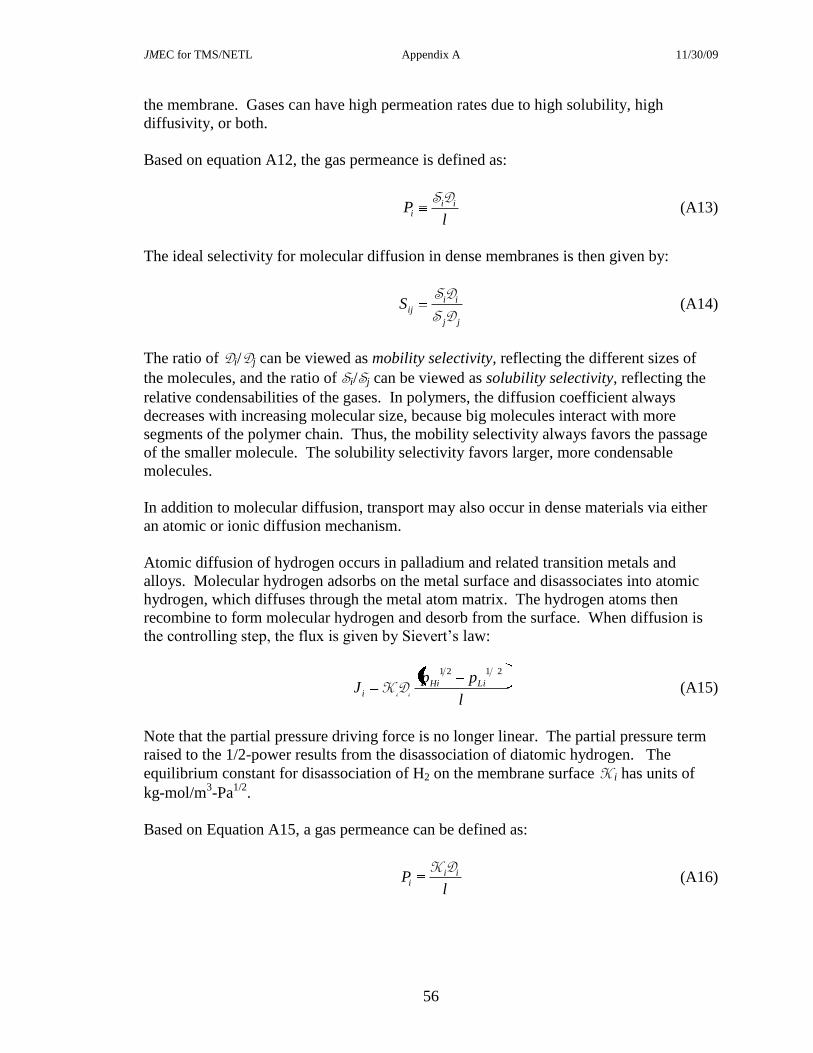
JMEC for TMS/NETL Appendix A 11/30/09 03/13/06
56
the membrane. Gases can have high permeation rates due to high solubility, high
diffusivity, or both.
Based on equation A12, the gas permeance is defined as:
l
P iii
DS (A13)
The ideal selectivity for molecular diffusion in dense membranes is then given by:
jj
iiijS
DS
DS (A14)
The ratio of Di/Dj can be viewed as mobility selectivity, reflecting the different sizes of
the molecules, and the ratio of Si/Sj can be viewed as solubility selectivity, reflecting the
relative condensabilities of the gases. In polymers, the diffusion coefficient always
decreases with increasing molecular size, because big molecules interact with more
segments of the polymer chain. Thus, the mobility selectivity always favors the passage
of the smaller molecule. The solubility selectivity favors larger, more condensable
molecules.
In addition to molecular diffusion, transport may also occur in dense materials via either
an atomic or ionic diffusion mechanism.
Atomic diffusion of hydrogen occurs in palladium and related transition metals and
alloys. Molecular hydrogen adsorbs on the metal surface and disassociates into atomic
hydrogen, which diffuses through the metal atom matrix. The hydrogen atoms then
recombine to form molecular hydrogen and desorb from the surface. When diffusion is
the controlling step, the flux is given by Sievert‟s law:
l
ppJ LiHi
i
2121
iiDK (A15)
Note that the partial pressure driving force is no longer linear. The partial pressure term
raised to the 1/2-power results from the disassociation of diatomic hydrogen. The
equilibrium constant for disassociation of H2 on the membrane surface K i has units of
kg-mol/m3-Pa
1/2.
Based on Equation A15, a gas permeance can be defined as:
l
P iii
DK (A16)

JMEC for TMS/NETL Appendix A 11/30/09 03/13/06
57
However, permeance as defined above for atomic diffusion is not directly comparable to
that for all the other transport mechanisms previously discussed, which take the form of
the general flux equation given in Equation A1.
The selectivity of metallic membranes for hydrogen separations is essentially infinite due
to the disassociation on the membrane surface of diatomic hydrogen, with a molecular
diameter of ~2.9 Å, into atomic hydrogen, with an atomic diameter of less than 1 Å.
While size loses much of its meaning on these scales as the wave nature of matter begins
to noticeably manifest itself, atomic hydrogen is so small that it can easily diffuse
through the dense metal phase.
Ionic diffusion can occur in high-temperature dense ceramics, such as doped rare-earth
oxides. In this case, hydrogen adsorbs on the ceramic surface, disassociates, and diffuses
as hydrogen ions (protons) through the membrane. The hydrogen ions then recombine to
form molecular hydrogen and desorb from the surface. The flow of protons across the
membrane must be balanced by an equivalent flow of negatively charged electrons in the
same direction to maintain neutrality. The hydrogen flux for this transport mechanism at
elevated temperature is given by the equation:
Li
Hii
p
p
l
RTJ ln
4 2
amb
F (A17)
where R is the ideal gas constant in units of J/kg-mol-K, T is the absolute temperature in
Kelvin, F is the Faraday constant in Coulomb/kg-mole, and σamb is the ambipolar
conductivity of the material in units of 1/Ohm-m, defined as:
-eH
-eHamb (A18)
where σamb and σamb are the protonic and electronic conductivities.
Based on Equation A17, a gas permeance can be defined as:
l
RTPi 2
amb
F4 (A19)
Again, permeance as defined above for ionic diffusion is not directly comparable to that
for all the other transport mechanisms previously discussed.
Based on A18, the flux will be high when σamb is large. This requires both the protonic
and electronic conductivities to be large. Conductivity can be raised by operating the
membrane at high temperatures and by doping the membrane material. Ceramic
materials normally do not possess high electronic conductivity. Therefore,
ceramic/metallic composites, referred to as cermets, are being researched to enhance this
conductivity.

JMEC for TMS/NETL Appendix A 11/30/09 03/13/06
58
In general, permeability, and thus permeance, is a function of temperature; however, this
dependence will vary based on the exact mechanism of membrane transport. Knudsen
diffusion is proportional to the square root of temperature. Molecular sieving in principle
does not possess a temperature dependence; but, in real systems an effect is observed due
to other interacting phenomena. All mechanisms involving surface adsorption and/or
diffusion will show an exponential-type temperature dependence, which can be modeled
using an Arrhenius Law expression:
RT
iiiKP T
Ee)( (A20)
where Ki and Ei are constants for any given component, and Ei is the activation energy.
The quantity R is the ideal gas constant expressed in energy units and the temperature T is
in absolute units. In general, gas adsorption decreases with increasing temperatures;
whereas, diffusion increases. These interactions can result in quite complex temperature
behavior in systems involving both adsorption and diffusion. Based upon Equation A19,
it might appear that permeance is only proportional to temperature. However, ionic
conductivity also exhibits an exponential temperature dependence, increasing with
increased temperatures.
For membrane systems involving molecular diffusion, most notably polymers, an inverse
relationship exists between selectivity and permeability; as the selectivity is increased,
the permeability decreases, and vice versa. It has also been shown experimentally that a
log-log plot of the permselectivity of a binary gas pair versus the permeability of the
“faster” gas molecule, results in a clearly defined upper limit on selectivity for any given
value of permeability. Such a plot is referred to a Robeson plot after the membrane
researcher to first describe this phenomenon in polymer-based membranes. This
relationship is depicted in Figure A-1 for H2 and CO2 for a wide range of polymeric
membrane materials.
Figure A-1. Robeson Plot for H2/CO2 Permselectivity in Polymers
H2 Permeability, Barrer
H2
/ C
O2
Se
lec
tivit
y
H2 Permeability, Barrer
H2
/ C
O2
Se
lec
tivit
y

JMEC for TMS/NETL Appendix A 11/30/09 03/13/06
59
From: Robeson, L.M., “Correlation of Separation Factor Versus Permeability for
Polymeric Membranes,” Journal of Membrane Science, 62, 1991.
No completely theoretical explanation has been identified for the Robeson limit, and
many researchers have investigated modified materials with the hope of pushing this
limit. However, these efforts have so far only had limited success.
Figure A-2 shows the Robeson limits for H2/CO2, H2/N2, and H2/CH4. These plots
clearly demonstrate the difficulty of separating H2 from CO2 using purely a solution-
diffusion mechanism, relative to H2/N2 and H2/CH4 membrane-based separations which
have been commercialized. As discussed above, both solubility and diffusion are
molecular size dependent phenomena, and as can be seen from Table A-1, H2 and CO2
molecules have very similar sizes.
Figure A-2. Robeson Limits for H2 Permselective Membranes Based on parameters from: Robeson, L.M., Polymer, 35, p.4970, 1994.
Membrane Module Designs – Schematics of the four most common membrane module
designs are shown in Figure A-3. Tubular and plate-and-frame designs are common in
filtration and water treatment applications. Multiple tubes are often packed into a single
cylindrical vessel. This is referred to as a shell-and-tube design. Currently, all industrial,
gas separation membrane applications employ polymer membrane technology based on
hollow fibers or flat sheets, and these designs will be discussed in more detail below.
0.1
1
10
100
1000
10000
100000
1000000
0.01 0.1 1 10 100 1000 10000
H2 Permeability, Barrer
H2 /
X S
ele
cti
vit
y
H2/CO2
H2/N2
H2/CH4
x 100
x 10
For a given permeability, the selectivity of H 2 is
between
10 and 100+ times lower for CO 2 relative to other
industrial gas separations
demonstrated
demonstrated
demonstrated

JMEC for TMS/NETL Appendix A 11/30/09 03/13/06
60
Figure A-3. Common Membrane Module Designs From: Torzewski, K. (Ed.),“Facts at your Fingertips – Membrane
Configuration,” Chem. Eng., Mar.1, 2009
In hollow fiber (HF) based modules, the outside layer of the fiber is composed of a dense
polymer on the order of 0.05-0.10 μm thick. The separation occurs across this thin layer.
The porous sub-layer provides structural support to the fiber so that it can withstand large
pressure gradients. Individual fibers are about three times the diameter of a human hair
(~125 μm). In a typical membrane module, thousands of fibers are bundled together in a
cylindrical arrangement around a central core consisting of perforated tube known as the
bore. An epoxy resin seals each end of the cylindrical fiber bundle to a tubesheet, thus
separating the feed gas from the permeate. The fiber bundle and bore are enclosed in a
shell similar to that used with shell-and-tube heat exchange equipment. Feed gas flows
into the shell through the bundle and around the tubes. The retentate, that is the depleted
feed gas, exits the membrane module through the bore. If a sweep gas is employed, it is
routed through a shell head and distributed to one end of the hollow fiber bundle, exiting
at the other end of the module enriched with permeate. If no sweep is used, one end of
the fiber bundle may be completely sealed. Flow in this arrangement is predominantly
cross flow, though co-current and counter-current arrangements are possible.
An alternative design for polymer membrane equipment uses thin sheets of polymer
arranged in spiral wound (SW) modules. The feed gas enters the module and flows
between the membrane leaves. Components of the feed gas permeate the membrane and
spiral inward toward a central collection pipe. The depleted feed flows across the
membrane surface and exits at the other end of the module. The leaves of the membrane
alternate between porous membrane sheets and non-porous spacer sheets providing
passage for both the retentate and permeate. This arrangement results in cross flow. A
less commonly used arrangement involves the use of flat sheets in a plate-and-frame (PF)
design.
JMEC for TMS/NETL Appendix A 11/30/09 03/13/06
61
HF and SW membrane-based systems are typically smaller than other types of gas
separation plants, such as absorption and adsorption systems, and have high surface area-
to-volume ratios (packing density). Achievable packing densities are much greater for
hollow fibers (HF; ~6,000 m2/m
3 or ~1,800 ft
2/ft
3) versus either spiral-wound sheets
(SW; ~650 m2/m
3 or ~200 ft
2/ft
3) or plate-and-frame sheet arrangements (PF; ~325 m
2/m
3
or ~100 ft2/ft
3). All of these are greater than what is achievable in for example an
absorption column (~260 m2/m
3 or ~80 ft
2/ft
3). Since membrane units are modular, there
is no limit to maximum capacity and plants consisting of over 100 individual modules,
with H2 delivery rates of greater than 50 MM scfd have been built. However, modularity
has the drawback that plant costs essentially scale linearly with plant capacity and the
economic advantages of membranes versus other processes can be lost at high
throughputs. Almost 400 hydrogen gas-separation membrane systems are operating
worldwide.
The cost of H2 recovery systems is proprietary, but may be estimated. Typical costs for
hollow fiber and spiral wound sheet membranes are $45-55 and $375 per m2 ($4-5 and
$35 per ft2), respectively
4. Housing can be an additional 20% of the surface area cost and
final assembly an additional 1%. Installation of the system at the plant site can be
assumed to be 20% of the equipment cost due to the modular nature of the equipment.
Installed costs of plate-and-frame or shell-and-tube modules utilizing metallic plates or
tubes to support the active membrane layer are at least an order of magnitude greater due
to higher materials and fabrication costs.
In addition to permeance and selectivity, the useful life of the membrane and module is a
critical parameter in evaluating the economic performance of a membrane-based gas
separation process. A shortened lifetime results in higher maintenance and replacement
costs. Membrane life for H2 recovery systems with proper operation and maintenance is
reported to be high, exceeding 15 years. However, operation in harsh chemical
environments can shorten this lifetime to as little as 3-5 years. Reliability can also be
extremely high, with on-stream factors exceeding 99%. Modularity coupled with proper
valve placement allows individual modules to be taken off-line without shutting down the
entire system. This feature also provides large swings in throughput. Individual module
turn-down/up ratios as low as 30% and greater than 100% are possible; however,
recovery will be compromised. Additional modules may be brought on-stream if
additional capacity is required.
Commercial Membrane-Based Gas Separation – Currently, gas separation membranes
are used industrially for hydrogen separation within ammonia plants (H2/N2 separation)
and petrochemical plants (H2/hydrocarbons); and for separating nitrogen from air,
removing CO2 and water from natural gas, and recovering organic vapors from air or
nitrogen. The most widely used membrane materials for gas separation are polymers.
Polymers are attractive because they can be processed into hollow fibers or thin sheets
with high surface areas per unit volume. Each membrane unit can contain thousands of
fibers. As discussed above, this results in compact, modular membrane units having
relatively low costs, even when permeance and selectivity are not extremely high.
4 From Baker, R.W., op.cit., 2004; adjusted for inflation.

JMEC for TMS/NETL Appendix A 11/30/09 03/13/06
62
The three major providers of membrane technologies for gas separation applications are
Air products & Chemicals, Inc. (APCI), Air Liquide and UOP. The APCI PRISM™
membrane is based on the original Monsanto technology commercialized back in 1980.
Air Liquide‟s MEDAL™ membrane was developed by a joint venture between DuPont
and Air Liquide. The UOP membrane technology is named PolySep™, and also has its
roots in technology developed earlier. The relative permeance of these commercial
membranes, based on the open literature, is:
MEDAL PRISM PolySep
High H2O He H2 NH3 CO2 H2S H2O H2 He H2 H2 H2O H2S CO2
Intermediate O2 Ar CO N2 CH4 H2S CO2 CH4 O2
Low C2H4 C3H6 O2 Ar CO C2+ CH4 N2 C2+ N2
Profiles of these three technologies are described in Table A-2.
Table A-2. Process Profiles for Commercial Polymer Membrane Technologies
Commercial experience with polymer membranes is summarized below5.
5 MacLean, D.L.; Stookey, D.J.; Metzger, T.R., “Fundamentals of gas permeation,” Hydrocarbon
Processing, pp.47-51, Aug. 1983.
Mazur, W.H.; Chan, M.C., “Membranes for Natural Gas Sweetening and CO2 Enrichment,” Chem. Eng.
Prog., pp.38-43, Oct. 1984.
Hogsett, J.E.; Mazur, W.H., “Estimate membrane system area,” Hydrocarbon Processing, pp.52-54,
Aug., 1983.
Whysall, M.; Picioccio, K.W., “Selection and revamp of Hydrogen Purification Processes,” 1999 AIChE
Spring Meeting, Houston, TX, March 13-18, 1999. continued, next page…
Air Liquide APCI UOP Generic
MEDAL™ PRISM™ Membrane PolySep™
(from literature)
(polyaramide) (Monsanto technology)
Feed H2 Content (wide range) - >25% - -
(optimal) - 40% - 80% 75% - 90% -
Feed Temperaturea,
oF - <230 Preheated 20
oF above retentate dewpoint
LP Steam Cons., lb/M scf Feed 2.0 - - -
Pretreatmentb
No liquids in feed or retentate; coalescing filter for particulate & entrained liquid removal; must ensure no condensation
H2 Recovery (wide range) 80% - 98% 80% - 98+% 70% - 95+% >85%
(typical) 95+% 90% - 95% - 90% - 95%
(one-stage) - 70% - 90% - -
(two-stage) - <98% - -
H2 Purity (wide range) <99.9% 80% - 99+% 70% - 99% >70%
(typical) - 90% - 95+% 90% - 98% >90%
H2 Contaminants (CO & CO2) - - - will be at >ppmv levels
Feed Pressure, psia (wide range)c
- <2500 - -
psia (H2 purge gas) <1741 300 - 1850 1000+ 300 - 2300
Pressure Drop, psi Typically small, but may become significant at high recoveries or low permeate pressures
Pressure Differential, psi - <1650 @ 105oF - -
Unit Capacity, M scfd H2 - - unlimited (modular) 1,000 - 50,000+
No.of Modules - - 3 - 100+ -
Membrane Life, years - >15 - 3 - 5d
Reliability (On-Stream Factor) - - 99.8% 99.8%
Unit Turndown / upe
- 30% 30% - 100+% 30%
Revamp Capacity - - unlimited (modular) -
No.of Operating Units Worldwide >60 (circa. 1998) >270 (circa. 2004) >50 (circa. 2004) -
aFeed heater usually required to maintain constant operating temperature and constant membrane performance
bSome resistence to water exposure & particulates; H2S or aromatics may damage mebrane
cMaximum feed pressure only limited by mechanical design pressure of ANSI flanges on pressure vessel
dUnder harsh chemical environment

JMEC for TMS/NETL Appendix A 11/30/09 03/13/06
63
Gases with high permeabilities such as hydrogen enrich the permeate side of the
membrane, and gases with lower permeabilities enrich the retentate side of the membrane
because of the depletion of components with high permeability. The first fraction of the
gas to permeate the membrane consists primarily of the components with the highest
permeability. As a larger fraction of the feed gas is allowed to permeate, the relative
amount of the components with lower permeability increases in the permeate stream.
Polymer membranes can be used to process gases containing a wide variation in H2
content. Feed pretreatment requirements are typically minimal, and are primarily
associated with feeding a dry, clean gas to the unit. Since the water and hydrocarbon
content of the feed will be increased as hydrogen is removed, it is necessary that the feed
gas be heated to above the dew point of the retentate exiting the module to prevent
condensation of a liquid phase within the module. Exposure to liquid water or
hydrocarbons, particulates and high concentrations of H2S may permanently damage the
polymer material. Polymers in commercial use are limited to temperatures not much
greater than the boiling point of water.
For any given membrane, hydrogen recovery is a strong function of the feed H2 content
and pressure, and product requirements in regards to H2 purity and delivery pressure.
Feed compression or permeate re-compression requirements can add significantly to the
cost of a H2 recovery plant. A doubling of the feed pressure can cut H2 delivery costs by
as much as a fourth. Higher purity hydrogen is associated with lower recovery, with this
effect much more dramatic with membrane systems versus competing PSA technology.
For a membrane with a H2 selectivity of 30, a 3% increase in product purity results in a
25% decrease in recovery. Higher H2 recoveries also require more membrane area. For
specified feed composition and system pressure levels, the amount of area required
increases exponentially at high hydrogen recovery. For a specific membrane system, the
recovery versus purity is primarily dependent on the ratio of the retentate to permeate
pressure and is largely independent of absolute pressure levels. However, area
requirements are inversely proportional to the feed pressure. Therefore, compressing the
feed gas rather than the permeate, even though the permeate flow is smaller, is often
preferable when the objective is to achieve a required pressure ratio.
For properly designed and operated membrane systems, pressure drops are typically
small. The pressure differential across the membrane is set by the upstream pressure and
the desired H2 delivery pressure, unless feed compression or permeate re-compression is
included. Feed pressures as high as 2,500 psia (170 bar) have been demonstrated. More
significantly, cross membrane differentials as high as 1,650 psia (112 bar) can be
achieved. However, very high pressure differentials can cause compression of the
membrane, detrimentally affecting performance. This effect is temperature dependent,
Air Products Product Brochure, Advanced Prism® Membrane Systems for Cost Effective Gas
Separations, available at www.airproducts.com.
Picioccio, K.; Reyes, E., “Breaking the Hydrogen Barrier with PSA Revamps – Increasing Hydrogen
Production of PSA Units,” UOP webpage, 2000.
Haggin, J., “Membrane Technology Developments Aim at Variety of Applications,” Chem. & Eng.
News, pp.25-26, April 4, 1994.

JMEC for TMS/NETL Appendix A 11/30/09 03/13/06
64
and the maximum allowable pressure differential will be lower than 1,650 psia as the
operating temperature approaches the maximum allowable operating temperature for the
membrane.
Bibliography:
Li, N.N.; Fane, A.G.; Ho, W.S.W; Matsuura, T. (editors), Advanced Membrane Technology and Application, Wiley, 2008.
Noble, R.D.; Stern, S.A. (editors), Membrane Separations Technology, Principles and Applications, Elsevier Science, 1995.
Ho, W.S.W.; Sirkar, K.K. (editors), Membrane Handbook, Chapman & Hall, 19

JMEC for TMS/NETL 11/30/09 03/13/06
65
APPENDIX B
Membrane Screening Methodology
JMEC for TMS/NETL Appendix B 11/30/09 03/13/06
66
Membrane Screening Methodology
Screening Assumptions – The screening analysis presented in the main body of this
report only considers the performance of a single ideal membrane, with a number of other
assumptions used to further simplify the analysis:
1) The ideal membrane is only permeable to hydrogen. This allows the following
equation derived in Appendix C to be used to estimate H2 recovery:
oPR
oP
Ri
Ri
PPP
PP
y
y
)(H
)(H
)(H
)(HRecoveryH
2
2
2
22
11 (B1)
where y(H2)Ri is the hydrogen mole fraction at the inlet, PR is the pressure of the
retentate, PP is the pressure of the permeate, and P(H2)o is the specified hydrogen
partial-pressure pinch. Equation B1 was developed for membrane separators only,
and is not applicable to WGS membrane reactors.
2) When considering membrane reactors, Equation B1 is replaced by the following
equation derived in Appendix E and used to estimate H2 productivity:
oPRRiRi
oPRiRi
RiRi
RiRi
PPPyy
PPyy
yy
yy
)(H(CO))(H
)(H)(H
(CO))(H
)(HtyProductiviH
22
2,2
2
,2
2
1 (B2)
where y(CO)Ri is the mole fraction of CO at the reactor inlet, and y ,Ri is the molar
extent of reaction, which is calculated based upon an assumed approach to WGS
reaction equilibrium as described in Appendices D and E. H2 productivity is defined
as the molar ratio of hydrogen recovered in the permeate to the combined H2 and CO
at the reactor inlet. All other variables in Equation B2 are defined the same as given
above.
3) Equations B1 and B2 assume that the permeate is pure hydrogen, and therefore, no H2
concentration gradient exists on the permeate side of the membrane. It follows that
the direction of flow of the permeate relative to the retentate is irrelevant. This is not
the case when a sweep gas is introduced to reduce the H2 partial pressure on the
permeate side of the membrane. When considering the use of a sweep gas, it is
assumed for simplicity that the permeate side is well mixed; that is, the partial
pressure of hydrogen is constant.
4) For a hybrid system employing both a membrane and a PSA unit, the H2 recovery of
the PSA unit must be estimated. Public information reported by UOP on their
PolySep™ PSA technology was used to develop a performance curve for PSA1.
Figure B-1 shows the effect of tail gas pressure on H2 recovery for a syngas with the
composition given below in Table B-1.
1 UOP Hydrogen Recovery Equipment at: www.uop.com/refining/1101.html .

JMEC for TMS/NETL Appendix B 11/30/09 03/13/06
67
50, 62.08%
2, 80.53%
83.75, 49.10%y = -0.0038x + 0.8129
R2 = 1
30.00%
40.00%
50.00%
60.00%
70.00%
80.00%
90.00%
100.00%
0 10 20 30 40 50 60 70 80 90 100
Tail Gas Pressure (psig)
Hyd
rog
en
Re
co
ve
ry
discharge
to LP burners
discharge
to fuel header
Feed Pressure = 380 psig
y H2,feed = 57.34%
recommended
min P ratio = 4
Figure B-1. Common Membrane Module Designs
The PSA performance curve in Figure B-1 can be fit to a linear equation:
TGP0038.08129.0RecoveryH2
(B3)
where PTG is the PSA tail-gas pressure, in psig. Equation B3 is only applicable for
feed gas pressures near 380 psig and H2 contents of about 57 vol%, and is valid over a
range of tail-gas pressure from 2 to 84 psig.
Note that Equations B1-B3 above do not provide information on equipment size
requirements for the membrane separator, WGS reactor or PSA unit. Membrane area,
WGS catalyst loading, and PSA sorbent loading can only be determined by formulating
and solving more complex models for these systems. What Equations B1-B3 do provide
is a means of estimating the best achievable system performance, which can be used to
screen alternative H2/CO2 separator locations and operating conditions.
Screening Parameters and Inlet Conditions – In addition to the equations given above,
stream compositions and conditions, before and after syngas shifting, must be specified
for possible feeds to the membrane unit. The flowsheet used for the screening analysis is
from a 2000 IGCC conceptual design study performed by Parsons for EPRI and DOE2.
Unfortunately, this study did not provide compositions for any process streams in the
flowsheet. Therefore, stream compositions and specifications from a similar design study
2 Buchanan, T.L.; Delallo, M.; Schoff, R.L.; White, J.S., Evaluation of Innovative Fossil Fuel Power Plants
with CO2 Removal Interim Report, Parsons Corp. for EPRI/U.S. DOE, NETL Report No. 1000316, Dec.
2000.

JMEC for TMS/NETL Appendix B 11/30/09 03/13/06
68
conducted by Parsons for DOE were used3. The WGS exit stream compositions were
estimated using additional data provide by Parsons4, assuming a 10 C
o approach to WGS
equilibrium. Overall conversion of CO to hydrogen is about 98%.
Figure B-2 is a simple schematic showing locations of possible membrane feed streams
downstream of the gasifier and before acid gas removal. Table B-1 reports the
corresponding compositions estimated for these streams.
HT WGS(stage 1)
Steam
Injection
Syngas(from gasifier)
1 3 4 52 MT WGS(stage 2)
LT WGS(stage 3)
Water
Saturation
Water
Condensation
(to H2S
removal)
Tin = 250oC (482
oF)
Tout = 430oC (806
oF)
Tin = 270oC (518
oF)
Tout = 295oC (563
oF)
Tin = 230oC (446
oF)
Tout = 235oC (455
oF)
*Source of cooling not shown
Figure B-2. Location of Streams Considered in Screening Analysis
Based on Parsons‟ 2000 IGCC conceptual design, the desired gas-turbine fuel-gas
conditions are assumed to be 380 psia (26 bar) with a LHV of 120 Btu/scf (4.3 kJ/Nl).
These conditions correspond to the estimated performance of a GE “H” turbine at the
time the screening study was performed.
Table B-1. Syngas Composition Used in Screening Analysis
Composition, vol% Stream 1 Stream 2 Stream 3 Stream 4 Stream 5
H2 19.33% 39.40% 42.45% 43.20% 57.34%
CO 24.43% 4.36% 1.31% 0.56% 0.75%
CO2 5.68% 25.75% 28.80% 29.55% 39.22%
H2S+COS 0.48% 0.48% 0.48% 0.48% 0.64%
NH3 0.16% 0.16% 0.16% 0.16% 0.21%
CH4+C2H6 0.24% 0.24% 0.24% 0.24% 0.32%
N2+Ar 0.81% 0.81% 0.81% 0.81% 1.08%
H2O 48.86% 28.79% 25.75% 25.00% 0.45%
Total 100.00% 100.00% 100.00% 100.00% 100.00%
H2O/CO Ratio 2.00 6.60 19.61 44.28 0.61
K WGS(P ) = K WGS(T ) 0.09 8.08 36.16 90.46 6612.36
Temperature, oC 250 430 295 235 105
WGS Approach, Co
- 10 10 10 -
3 Buchanan, T.L.; Klett, M.G.; Schoff, R.L., Capital and Operating Cost of Hydrogen Production from
Coal Gasification, Parsons Corp./NETL Contract No. DE-AM26-99FT40465, April 2003. 4 Personal communication from R.L. Schoff (Parsons Corp.) and J. Ciferno (U.S. DOE), September 2005.

JMEC for TMS/NETL Appendix B 11/30/09 03/13/06
69
Three membrane placement options were considered for screening: post-WGS H2
recovery, CO2 compressor-interstage H2 recovery, and H2 recovery integrated with WGS.
Parameters considered in the screening analysis are reported in Table B-2.
Table B-2. Membrane Screening Parameters
Range
Feed Gas H2 Content, vol% based on maximum shifting of syngas 57.34%
Permeate H2 Content, vol% based on no sweep, partial, or max sweep gas, set by gas turbine 100 / 72 / 44%
Feed Gas Pressure, psia set by gasifier design pressure and equipment pressure drops 400 / 700
Permeate Pressure, psia design parameter for membrane; max set by gas turbine 50 / 380
H2 Partial-Pressure Approach, psi indicative of membrane area 0 / 10 / 25 / 50
Pressure Diff. Across Membrane, psi limitation of membrane material and fabrication 20 - 650
Feed Gas H2 Content, vol% based on maximum shifting of syngas 57.34%
Permeate H2 Content, vol% based on no sweep, partial, or max sweep gas, set by gas turbine 100 / 72 / 44%
Feed Gas Pressure, psia CO2 compression requirements and compression ratios 800 / 1,600 / 2,200
Permeate Pressure, psia design parameter for membrane; max set by gas turbine 50 / 380
H2 Partial-Pressure Approach, psi indicative of membrane area 0 / 10 / 25 / 50
Pressure Diff. Across Membrane, psi limitation of membrane material and fabrication 420 - 2,150
Feed Gas H2 Content, vol% based on maximum shifting of syngas 57.34%
Feed Gas Pressure, psia design parameter for PSA unit; max set by gas turbine 380
Tail Gas Pressure, psia design parameter for PSA unit; affects compression requirements 17 / 50 / 100
Permeate H2 Content, vol% based on no sweep, partial, or max sweep gas, set by gas turbine 100 / 44%
Feed Gas Pressure, psia CO2 compression requirements and compression ratios 800 / 1,600 / 2,200
Permeate Pressure, psia design parameter for membrane; max set by gas turbine 380
H2 Partial-Pressure Approach, psi indicative of membrane area 0 / 10 / 25 / 50
Pressure Diff. Across Membrane, psi limitation of membrane material and fabrication 420 - 1,820
Feed Gas H2 Content, vol% based on partial shifting of syngas, set by WGS reactor design 19.3 / 39.4 / 43%
Permeate H2 Content, vol% based on no sweep, partial, or max sweep gas set by gas turbine 100 / 44%
Feed Gas Pressure, psia set by gasifier design pressure and equipment pressure drops 700
Permeate Pressure, psia design parameter for membrane; max set by gas turbine 50 / 380
H2 Partial-Pressure Approach, psi indicative of membrane area 0 / 10 / 25 / 50
Pressure Diff. Across Membrane, psi limitation of membrane material and fabrication 420 - 650
LTS Exit Temperature, oC design parameter for LTS WGS; set by inter-cooling 235 / 300
MTS Exit Temperature, oC design parameter for MTS WGS; set by inter-cooling 270 / 455
HTS Exit Temperature, oC design parameter for HTS WGS; set by inter-cooling 430 / 550
WGS Temperature Approach, Co indicative of catalyst requirements 0 / 10 / 20
H2 selective membrane located downstream from WGS reactors
H2 selective membrane integrated with WGS reactors
PSA located downstream from WGS reactors with…
H2 selective membrane integrated with CO2 compression
...H2 selective membrane integrated with CO2 compression
Screening Methodology – The following steps were utilized to estimate H2 recoveries for
the different membrane locations considered:
Step 1: Select membrane/PSA inlet pressure
Feed gas hydrogen content and pressure depend on where the membrane or PSA unit is
placed in the IGCC process. Membrane performance is related to the H2 partial pressure
across the membrane, which in turn is related to hydrogen concentration and total
pressure. Locations within the IGCC flowsheet with high total pressure and/or high H2
concentrations are preferred. Optimal performance of PSA units for H2 recovery is
achieved over a pressure range between 200 and 435 psig (14 and 30 bar gauge). In

JMEC for TMS/NETL Appendix B 11/30/09 03/13/06
70
particular, PSA is well suited to deliver high-purity hydrogen at pressures consistent with
gas turbine and petroleum refining applications.
Pressures upstream of the combustion turbine and CO2 compressors are set by the gasifier
design pressure and cumulative pressure drop across any intervening process equipment.
For an IGCC plant without CO2 capture, the gasifier pressure will be set such that the
fuel-gas is delivered at the desired inlet pressure of the combustion turbine. The gasifier
may also be designed to operate at a higher pressure; in which case, an expander is used
to generate power from the fuel gas prior to combustion. If CO2 capture is included,
high-pressure operation of the gasifier may be desirable if the CO2 can be separated from
the fuel gas at elevated pressures, minimizing CO2 compression requirements.
For a membrane placed between CO2 compression stages, the feed pressure is based on
the CO2 pipeline inlet pressure, approximately 2,200 psia (150 bar) and the compression
ratios of the individual compressor stages.
Step 2: Select membrane/PSA outlet pressure
It is preferred to produce the H2 fuel gas at the desired combustion-turbine inlet pressure
(i.e. 380 psia). However for membrane separation, the H2 permeate pressure must be low
enough to obtain a reasonable H2 partial pressure driving force across the membrane.
This may be as low as 5 to10 psi (0.35 to 0.7 bar), which would require re-compression
of the hydrogen prior to combustion.
Since the permeate from the membrane unit will be fired in a combustion turbine to
produce power and heat, the partial pressure of the permeate can be further lowered by
using a sweep gas. As specified above, the desired fuel-gas conditions are to be 380 psia
(26 bar) and a LHV of 120 Btu/scf (4.3 kJ/Nl). If the permeate is pure hydrogen with a
LHV of 273.87 Btu/scf (9.8 kJ/Nl), it will must be diluted to meet the heating value
specification. By also using the diluent as the membrane sweep gas, the minimum
allowable H2 concentration of the permeate is 120/273.87 = 43.82 vol%. Sensitivity
cases were run for permeate H2 concentrations of 36.51% and 80.33%, corresponding to
LHVs of 100 and 220 Btu/scf (3.6 and 7.9 kJ/Nl), respectively.
Nitrogen or steam can be used as diluents. Nitrogen is a by-product from the ASU and
would require compression to the GT feed pressure of 380 psia. This is an additional
parasitic power loss for the IGCC power plant. Medium pressure steam could be used
instead of, or as a supplement to nitrogen. Medium pressure steam would be diverted
from the steam turbine to provide diluent. This would result in reduction in gross power
output from the IGCC power plant.
Typical PSA tail-gas discharge pressures are 2 psig (0.1 bar) when discharging to low-
pressure burners used in modern hydrogen plants, or 50 psig (3.4 bar) when recovering
H2 from refinery gas and discharging tail gas to a refinery fuel header. PSA
manufacturers recommend a minimum feed-to-tail gas pressure ratio of about four. For
the syngas of interest, this sets the minimum hydrogen recovery at 49.1% with a tail-gas
pressure of 83.75 psig (5.7 bar). Producing the tail gas at higher pressures is
advantageous from a sequestration standpoint, since it reduces CO2 compression
requirements. However, as Figure B-1 shows, there is a trade-off with lower PSA H2
recovery.

JMEC for TMS/NETL Appendix B 11/30/09 03/13/06
71
Existing applications for PSA typically involve the purification of relatively high H2
content streams. Feed H2 content exceeds 75%, and bulk H2 recoveries on the order of 70
to 90% are usually acceptable. In the current application, the feed H2 content will be less
than 60%. This limits bulk recoveries to less than about 80%. However, this is not a
significant concern, if the PSA is to be primarily used for bulk H2 recovery and a
membrane is to be used to recover the remaining H2 from the PSA tail gas at high
pressures5.
Step 3: Select membrane and reactor performance parameters
The maximum recovery of hydrogen occurs when the partial-pressure driving force at
some point along the membrane unit approaches zero. Theoretically, this point will occur
at the retentate end of the membrane, when the membrane is only permeable to hydrogen.
As the pinch point approaches zero, the membrane area required to achieve the maximum
H2 recovery approaches infinity. Therefore, any real membrane separation must have a
H2 partial-pressure approach, PH2, greater than zero. A good indication that the
practical limits of membrane performance have been reached is evident from an abrupt
slowing of the increase in H2 recovery as the partial-pressure approach is further reduced.
The WGS reaction approaches equilibrium as the reactor catalyst volume is increased,
but can never quite reach equilibrium in a fixed-bed tubular reactor of finite length.
Similar to the membrane partial-pressure approach, a temperature approach can be
defined for the WGS reaction. The WGS-reaction temperature approach, TWGS, is
defined as the difference between the theoretical equilibrium temperature, TEQ, and the
actual reactor outlet temperature, TR. When the WGS pinch equals zero, the
thermodynamic equilibrium constant KWGS(P) (defined as PH2 PCO2 / PCO PH2O) equals
the equilibrium constant KWGS(TEQ) calculated from temperature. For exothermic
reactions, such as the WGS, the temperature approach to equilibrium will always be
greater than zero. When screening configurations involving WGS membrane reactors, an
approach of 10oC is used, consistent with the estimated base data given in Table B-1
Step 4: Estimate H2 & CO2 recoveries and purities
For post-WGS, CO2 compressor-interstage, and WGS interstage membranes, H2 recovery
is calculated using Equation B-1 above, based on a specified minimum H2 partial-
pressure approach, the feed-gas H2 content and pressure, and the permeate pressure (see
Table B-2 above). If a PSA unit is employed upstream of a compressor-interstage
membrane, Equation B3 is used to estimate the H2 recovery from the PSA unit, which
establishes the membrane feed-gas H2 content. When a sweep gas is used, a pseudo
permeate pressure is calculated based upon the specified H2 content for the combined
sweep gas and H2 permeate.
For predicting the performance of a WGS membrane reactor, a H2 productivity is
calculated using Equation B-2 above, based on a specified minimum H2 partial-pressure
approach, the feed-gas H2 content and pressure, the permeate pressure, and the WGS
5 A similar application of PSA was proposed for recovering H2 from Fischer-Tropsch reactor off-gas in the
indirect liquefaction of coal: Bechtel/AMOCO, Baseline Design/Economics for Advanced Fischer-Tropsch
Technology, Topical Report Volume 1 (Process Design), DOE Contract No. DEAC22 91PC90027, October
1994.

JMEC for TMS/NETL Appendix B 11/30/09 03/13/06
72
reaction temperature and specified approach. A pseudo permeate pressure can also be
used if the membrane reactor employs a sweep gas.
A negative H2 recovery/productivity is an indication that the specified parameters result
in a negative H2 partial-pressure approach. Therefore, the selected operating conditions
are infeasible.

JMEC for TMS/NETL 11/30/09 03/13/06
73
APPENDIX C
Derivation of Theoretical Membrane Recovery
(no WGS Activity)

JMEC for TMS/NETL Appendix C 11/30/09 03/13/06
74
Theoretical Limit for Hydrogen Recovery from Membrane Separation
(no WGS Activity)
Nomenclature:
FRi - total molar flowrate of retentate at inlet
FRo - total molar flowrate of retentate at outlet
FPo - total molar flowrate of permeate at outlet
PR - pressure of retentate stream
PP - pressure of permeate stream
y(H2)Ri - mole fraction H2 in retentate at inlet (feed gas)
y(H2)Ro - mole fraction H2 in retentate at outlet
P(H2)o - hydrogen partial pressure pinch at outlet
Assumptions:
1) No inlet flow to permeate side of membrane unit
2) Pressure drop is negligible in direction of flow for both retentate and permeate
3) Membrane is impermeable to all species other than hydrogen
4) Permeate is pure hydrogen
5) No reactions occur within membrane unit
6) Isothermal conditions maintained within membrane unit
7) Ideal gas behavior, fugacities are equal to partial pressures
The last assumption is justified at higher temperature range of membrane
operation (~900oC) and reasonably accurate at lower temperatures (200-250
oC)
Material Balances:
Overall: PoRoRi FFF (C1)
Hydrogen: PoRoRoRiRi FFyFy )(H)(H 22
(C2)
Substitution of C1 into C2 and rearrangement yields:
H2 Flux
Feed Gas Retentate
Permeate
PR
PP
FRo
FPo
FRi
FPi = 0

JMEC for TMS/NETL Appendix C 11/30/09 03/13/06
75
RoRoRiRi FyFy )(H)(H 22 11 (C3)
Ro
Ri
Ri
Ro
y
y
F
F
)(H
)(H
2
2
1
1 (C4)
Pinch Specification:
oPRRo PPPy )(H)(H 22
(C5)
R
oPRo
P
PPy
)(H)(H
22 (C6)
Hydrogen Recovery:
RiRi
Po
Fy
F
)(HRecoveryH
2
2 (C7)
Substitution of C2 into C7:
RiRi
RoRo
RiRi
RoRoRiRi
Fy
Fy
Fy
FyFy
)(H
)(H
)(H
)(H)(HRecoveryH
2
2
2
222 1 (C8)
Substitution of C4 into C8 and rearrangement yields:
Ro
Ri
Ri
Ro
y
y
y
y
)(H
)(H
)(H
)(HRecoveryH
2
2
2
22
1
11 (C9)
Ro
Ro
Ri
Ri
y
y
y
y
)(H
)(H
)(H
)(HRecoveryH
2
2
2
22
1
11 (C10)
Substitution of C6 into C10:
oPR
oP
Ri
Ri
PPP
PP
y
y
)(H
)(H
)(H
)(HRecoveryH
2
2
2
22
11 (C11)
Thus, given the hydrogen mole fraction at the inlet, the membrane operating
pressures, and a specified hydrogen partial pressure pinch, the hydrogen recovery
can be calculated. However, the membrane area required for this level of
recovery is still unknown and can only be determined by solving the ordinary
differential equation governing this system.
In the limit as the hydrogen partial pressure pinch approaches zero (i.e. the area
approaches infinity), the hydrogen recovery approaches:

JMEC for TMS/NETL Appendix C 11/30/09 03/13/06
76
PR
P
Ri
Ri
PP
P
y
y
)(H
)(HRecoveryH
2
22
11 (C12)
This is the maximum hydrogen recovery achievable by membrane separation
without reaction.
Example Calculation #1 (no sweep):
Input Values - blue
Calc. Values - black
psia
700 P R
50 P P
10 P (H2)o
Feed Gas
mole
fraction
partial
press
H2 0.5734 y (H2)Ri 401.35
CO 0.0075 5.24
CO2 0.3922 274.52
H2O 0.0045 3.18
Other 0.0224 15.70
Total 1.0000 700.00
Permeate
mole
fraction
partial
press
H2 1.0000 y (H2)Po 50.00
H2 Recovery 0.9302 from Eq. C11:
Retentate 0.4666
Permeate 0.5334
Total 1.0000
Retentate
mole
fraction
partial
press
H2 0.0857 y (H2)Ro 60.00
CO 0.0161 11.24
CO2 0.8404 588.30
H2O 0.0097 6.81
Other 0.0481 33.65
Total 1.0000 700.00
H2 Partial-Pressure Approach
Permeate Pressure
Retentate Pressure
oPR
oP
Ri
Ri
PPP
PP
y
y
)(H
)(H
)(H
)(HRecoveryH
2
2
2
22
11

JMEC for TMS/NETL Appendix C 11/30/09 03/13/06
77
Example Calculation #2 (with sweep approximation):
Input Values - blue
Calc. Values - black
psia mole
700 P R fraction
380 Sweep 0.5618
167 P P =mol.frac. Sweep True Permeate Pres.
0 P (H2)o
Feed Gas
mole
fraction
partial
press
H2 0.5734 y (H2)Ri 401.35
CO 0.0075 5.24
CO2 0.3922 274.52
H2O 0.0045 3.18
Other 0.0224 15.70
Total 1.0000 700.00
Pseudo
Permeate
mole
fraction
partial
press
H2 1.0000 y (H2)Po 166.52
H2 Recovery 0.7677 from Eq. C11:
Retentate 0.5598
Permeate 0.4402 Pseudo
Total 1.0000
Retentate
mole
fraction
partial
press
H2 0.2379 y (H2)Ro 166.52
CO 0.0134 9.37
CO2 0.7006 490.39
H2O 0.0081 5.68
Other 0.0401 28.05
Total 1.0000 700.00
Ture
Permeate
mole
fraction
partial
press
H2 0.4382 166.52
Sweep 0.5618 213.48
Total 1.0000 380.00
Retentate 0.5598
Permeate 1.0046 True
Sweep -0.5644
Total 1.0000
Retentate Pressure
Pseudo Permeate Pressure
H2 Partial-Pressure Approach
True Permeate Pressure
oPR
oP
Ri
Ri
PPP
PP
y
y
)(H
)(H
)(H
)(HRecoveryH
2
2
2
22
11
JMEC for TMS/NETL 11/30/09 03/13/06
78
APPENDIX D
Derivation of Theoretical Membrane Productivity
(with WGS Activity)

JMEC for TMS/NETL Appendix D 11/30/09 03/13/06
79
Theoretical Limit for Hydrogen Productivity from Membrane
Separation with Reaction
Nomenclature:
F - total molar flowrate
n - component molar flowrate
P - pressure
P - pressure pinch
T - temperature
T - approach temperature
y - mole fraction
- molar reaction coordinate or extent of reaction
Subscripts:
eq - at equilibrium
i - at inlet
o - at outlet
P - permeate
R - retentate
T - total
Assumptions:
1) No inlet flow to permeate side of membrane unit
2) Pressure drop is negligible in direction of flow for both retentate and permeate
3) Membrane is impermeable to all species other than hydrogen
4) Permeate is pure hydrogen
5) WGS reaction approaches equilibrium within membrane unit
6) Isothermal conditions maintained within membrane unit
7) Ideal gas behavior, fugacities are equal to partial pressures
The last assumption is justified at higher temperature range of membrane
operation (~900oC) and reasonably accurate at lower temperatures (200-250
oC)
Water-Gas-Shift Reaction:
CO + H2O CO2 + H2
Stoichiometric Relationships:
RoTRiRo nny ,(CO)(CO) (E1)

JMEC for TMS/NETL Appendix D 11/30/09 03/13/06
80
RoTRiRo nny ,22 O)(HO)(H (E2)
RoTRiRo nny ,22 )(CO)(CO (E3)
R
oP
RoT
RoRo
P
PPy
n
n )(H)(H)(H
2
,
22 (E4)
Equations E1-E3 are the same as D1-D3; D4 has been replaced with C6, the pinch
specification for H2.
Total molar flowrate at inlet:
RiRiRiRiRiT nnnn n )(H)(COO)(H(CO) 222,
(E5)
Total molar flowrate at outlet:
RoRoRoRoRoT nnnn n )(H)(COO)(H(CO) 222,
(E6)
And, based on E1-E4:
RoTRoRiRiT
RoTRoRiRiRiRoT
nynn
nynnnn
,22,
,222,
)(H)(H
)(H)(COO)(H(CO) (E7)
Rearranging:
Ro
RiRi
RiT
RoT
y
yy
n
n
)(H
)(H
2
,2
,
,
1
1 (E8)
Where y ,Ri is defined by:
RiTRi ny ,,
(E9)
Reaction Equilibrium:
As before, the concentration dependence of the equilibrium constant:
O)(H(CO)
)(H)(CO
2
22
yy
yyKeq (E10)
Substitution of E1-D3 into E10 and rearrangement yields:
RiRi
RoTRoRi
eqnn
nnK
y
O)(H(CO)
)(H)(CO
2
,22 (E11)
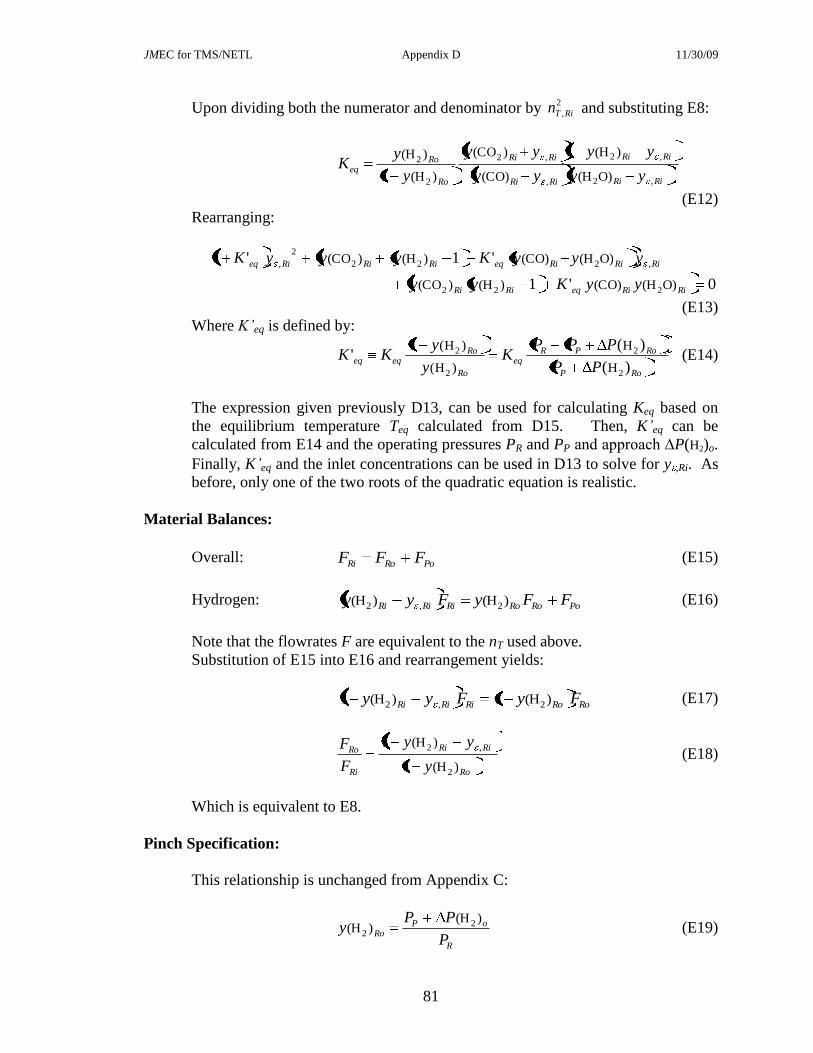
JMEC for TMS/NETL Appendix D 11/30/09 03/13/06
81
Upon dividing both the numerator and denominator by 2
,RiTn and substituting E8:
RiRiRiRi
RiRiRiRi
Ro
Roeq
yyyy
yyyy
y
yK
,2,
,2,2
2
2
O)(H(CO)
)(H)(CO
)(H
)(H 1
1
(E12)
Rearranging:
0'1
'1'1
O)(H(CO))(H)(CO
O)(H(CO))(H)(CO
222
,222
2
,
RiRieqRiRi
RiRiRieqRiRiRieq
yyKyy
yyyKyyyK
(E13)
Where K’eq is defined by:
RoP
RoPReq
Ro
Roeqeq
PP
PPPK
y
yKK
)(
)(1'
2
2
2
2
H
H
)H(
)H( (E14)
The expression given previously D13, can be used for calculating Keq based on
the equilibrium temperature Teq calculated from D15. Then, K’eq can be
calculated from E14 and the operating pressures PR and PP and approach ∆P(H2)o.
Finally, K’eq and the inlet concentrations can be used in D13 to solve for y ,Ri. As
before, only one of the two roots of the quadratic equation is realistic.
Material Balances:
Overall: PoRoRi FFF (E15)
Hydrogen: PoRoRoRiRiRi FFyFyy )(H)(H 2,2
(E16)
Note that the flowrates F are equivalent to the nT used above.
Substitution of E15 into E16 and rearrangement yields:
RoRoRiRiRi FyFyy )(H)(H 2,2 11 (E17)
Ro
RiRi
Ri
Ro
y
yy
F
F
)(H
)(H
2
,2
1
1 (E18)
Which is equivalent to E8.
Pinch Specification:
This relationship is unchanged from Appendix C:
R
oPRo
P
PPy
)(H)(H
22 (E19)

JMEC for TMS/NETL Appendix D 11/30/09 03/13/06
82
Hydrogen Productivity:
RiRiRi
Po
Fyy
F
(CO))(HtyProductiviH
2
2 (E20)
Substitution of E16 into E20:
RiRiRi
RoRo
RiRi
RiRi
RiRiRi
RoRoRiRiRi
Fyy
Fy
yy
yy
Fyy
FyFyy
(CO))(H
)(H
(CO))(H
)(H
(CO))(H
)(H)(HtyProductiviH
2
2
2
,2
2
2,2
2
(E21)
Substitution of E18 into E21 and rearrangement yields:
RoRiRi
RoRiRi
RiRi
RiRi
yyy
yyy
yy
yy
)(H(CO))(H
)(H)(H
(CO))(H
)(HtyProductiviH
22
2,2
2
,2
21
1 (E22)
Substitution of E19 into E22:
oPRRiRi
oPRiRi
RiRi
RiRi
PPPyy
PPyy
yy
yy
)(H(CO))(H
)(H)(H
(CO))(H
)(HtyProductiviH
22
2,2
2
,2
2
1
(E23)
Thus, given the mole fractions of hydrogen, water, carbon dioxide, and carbon
monoxide at the inlet of the membrane reactor, the fractional extent of reaction
(from the solution of E13 using K’eq(T+ T)), the membrane operating pressures,
and a specified hydrogen partial pressure pinch, the hydrogen productivity can be
calculated. However, the membrane area required for this productivity is still
unknown and can only be determined by solving the ordinary differential
equations governing this system.
In the limit as the hydrogen partial pressure pinch and the temperature approach
to equilibrium approach zero (i.e. the membrane area approaches infinity), the
hydrogen productivity approaches:
PR
P
RiRi
RiRi
RiRi
RiRi
PP
P
yy
yy
yy
yy
(CO))(H
)(H
(CO))(H
)(HtyProductiviH
2
,2
2
,2
2
1 (E24)
where y ,Ri is determined from E13 using K’eq(T). This is the maximum hydrogen
productivity achievable in a membrane reactor.

JMEC for TMS/NETL Appendix D 11/30/09 03/13/06
83
Example Calculation:
Input Values - blue
Calc. Values - black
psia
700 P R
50 P P
10 P (H2)o
Feed Gas
mole
fractionoC K
H2 0.1933 y (H2)Ri WGS Outlet Temperature 430 703 T
CO 0.2443 y (CO)Ri WGS Temperature Approach 10 10 T
CO2 0.0568 y (CO2)Ri WGS Equilibrium Temperature 440 713 T eq
H2O 0.4886 y (H2O)Ri
Other 0.0169
Total 1.0000 K eq = 8.08 from Eq. D13:
K' eq = 86.16 from Eq. E14:
Eq. E13:
a b c
8.7164E+01
root 1 0.4965 Eq. D14:
root 2 0.2366
y ,Ri 0.2366 -0.4886 < y ,Ri < 0.0169
Permeate
mole
fraction
H2 1.0000 y (H2)Po
H2
Productivity0.8603 from Eq. E23:
Retentate 0.6235
Permeate 0.3765
Total 1.0000
Retentate
mole
fraction
H2 0.0857 y (H2)Ro
CO 0.0124 y (CO)Ro
CO2 0.4706 y (CO2)Ro
H2O 0.4042 y (H2O)Ro
Other 0.0271
Total 1.0000
-6.3906E+01 1.0241E+01
Retentate Pressure
Permeate Pressure
H2 Partial-Pressure Approach
Quadratic Coefficients
33.48.4577exp)( eqeqeq TTK
RoP
RoPR
eqeqPP
PPPKK
)(
)('
2
2
H
H
RiRiRiRiRi yyyyy O)(H(CO))(H)(CO 2,22 ,min,min
0'1'1'1 O)(H(CO))(H)(COO)(H(CO))(H)(CO 222,222
2
, RiRieqRiRiRiRiRieqRiRiRieq yyKyyyyyKyyyK
oPRRiRi
oPRiRi
RiRi
RiRi
PPPyy
PPyy
yy
yy
)(H(CO))(H
)(H)(H
(CO))(H
)(HtyProductiviH
22
2,2
2
,2
2
1

JMEC for TMS/NETL 11/30/09 03/13/06
84
APPENDIX E
Finite-Difference Based Membrane Separator/Reactor Model

JMEC for TMS/NETL Appendix E 11/30/09 03/13/06
85
Finite-Difference Based Membrane Separator/Reactor Model
A spreadsheet-based model was developed to describe a hydrogen separation membrane.
This model has been used to set the design basis for the membrane unit in the system
modeling for this project.
The overall objective of the membrane assessment is to quantify which membrane
properties and design variables are most critical for the successful commercialization of
this technology when integrated with coal-fed gasification systems for either the co-
production of hydrogen or power. This information will provide guidance to the
Department of Energy as they strive to improve the performance and lower the cost of
dense-ceramic hydrogen-separation membranes.
a. Membrane Model The governing differential equations for hydrogen permeation
through a polymer membrane is:
222
22
2
2
HHHHH
HH "'
"'"PP
l
PP
dA
dnPp (4-1)
dA
dn
dA
dn22 HH "'
(4-2)
where: n‟ - molar flowrate of feed gas or retentate
n” - molar flowrate of permeate
A - membrane area
l - membrane thickness
p - membrane permeability
P - membrane permeance
P‟ - partial pressure of retentate
P” - partial pressure of permeate
Similar material balances can be written for all other gases that may permeate across the
membrane, CO2, H2O, CO, H2S, etc. In Equation (4-2), the negative sign is used for co-
current flow of retentate and permeate, and the positive sign for counter-current flow.
To solve Equations (4-1) and (4-2) for the H2 composition of the permeate and retentate,
the differential equations must be integrated along the length of the membrane unit.
Unfortunately, an analytic solution to this problem is only possible under certain
restrictive assumptions (e.g., linear partial pressure driving force and constant properties),
and the solution is algebraically quite complex. For the general case involving multi-
component permeation, it is simpler to numerically integrate equations in the form of (1)
and (2). This can be performed using standard spreadsheet software such as Excel™. A
backward finite difference formulation is used to represent the governing differential
equations (4-1) and (4-2) in the spreadsheet model. The solution is represented as a table,
with the rows representing different points along the length of the membrane. The values

JMEC for TMS/NETL Appendix E 11/30/09 03/13/06
86
calculated in any given row of the table for concentration and flowrate are dependent on
values in the preceding row. Therefore, iteration is not required to achieve convergence
at each point in the grid for co-current flow. For counter-current flow the exit flowrate
and composition of the permeate must be assumed, the grid computed, and the assumed
conditions updated and iterated to find a solution. The model is particularly convenient
in spreadsheet format, since it allows the grid to be expanded by clicking on a row and
dragging it downward; thus, copying all cell formulae and updating all cell references.
Purpose:
A schematic of an ion transport membrane is shown in Figure 1.
Figure 1. Ion Transport Membrane Unit Schematic
Model Description: The Excel workbook H2M.xls contains two permanent
worksheets. These are H2-ITM and CONSTANTS. The latter contains predefined
constants as Excel Named Cells, which can be accessed throughout the workbook (e.g.
the molecular weight of H2, MW_H2, one million, MM, and the conversion factor for psi
to atm units, psi_to_atm). The former worksheet, H2-ITM, contains the actual membrane
unit mathematical model. Neither of these sheets should be deleted, since this would
make the model inoperable. In addition, it is recommend that once a feasible solution to
a given membrane simulation is complete, it be saved separately, either as a new
workbook or as a copy of the H2-ITM sheet. Most of the information provided in H2-
ITM is presented in several different sets of dimensional units.
Worksheet H2-ITM is broken into several functionally different sections. Working from
the top to the bottom of the active area of the worksheet, Block A5:M35 summarizes the
Membrane 50 µ m
Retentate
H2 Permeate Syngas
Porous Supports 3 mm
Retentate Channel 1 mm
Permeate Channel 1 mm
Surface Catalyst 10 µm

JMEC for TMS/NETL Appendix E 11/30/09 03/13/06
87
inlet and outlet temperatures, pressures, flowrates, and stream compositions, and the
membrane performance parameters: CO conversion, hydrogen recovery, flux, and H2
partial pressure approach. The model assumes a planar membrane geometry consisting
of a stack of alternating membrane, membrane supports and flow channels. Block
A37:L59 contains geometry-related parameters for the membrane unit: overall plate
dimensions, membrane layer and channel thicknesses, segment size to be used for
numerical integration, feed superficial velocity, and computed size characteristics of the
complete membrane stack.
Block A61:H70 contains simplified hydraulic calculations for flow through a single
retentate flow channel. Based on a specified feed superficial velocity, the actual flow
velocity, pressure drop, and residence time through the unit are estimated. These
calculations are used to verify that the conditions specified result in laminar flow with a
reasonable pressure drop. Block A72:J97 contains calculations for estimating the
economic performance of the membrane unit. The membrane unit capital investment and
annual capital charge are estimated and compared to the relative values of the feed and
product streams. The unit profitability is contained in cell I97. Excel Solver can be
used to adjust the superficial velocity to maximize membrane unit profitability by
adjusting the number of plates per unit. Other unit profitability maximizations are also
possible.
Block A93:I110 contains membrane specific properties, such as conductivity, activation
energy, and technology improvement factor. The technology improvement factor allows
the user to easily adjust membrane performance. For example, Excel GoalSeek can be
used to adjust this parameter to match either experimental results or R&D performance
targets. A flag can also be set here to turn the water-gas-shift (WGS) reaction on or off.
This flag has been provided because of uncertainty in the kinetic parameters for the WGS
reaction at the operating conditions of the ITN membrane. It is also possible that the ITN
membrane, currently or with future modifications, may possess catalytic activity. The
flag allows sensitivity cases involving the WGS reaction to be modeled.
Finally, the worksheet rows 116 through 1163 contain the actual numerical grid used to
integrate and solve the membrane model. The hydrogen partial pressures and flux, and
the flowrates and concentrations of all molecular species contained in the retentate are
reported for each point along the membrane. The grid has been made larger than the
actual dimensions of the membrane, so that the user can change the dimensions of the
membrane or the step size of the grid without adding to or modifying the cells and rows
in the grid. This region of the worksheet is named PROFILES, and built-in Excel
Lookup functions are used to extract information from this region that is used in the
calculation of some of the model output discussed above. Information reported in the
grid cells outside of the physical dimensions of the membrane are ignored in calculating
performance parameters. Additional columns of information are calculated when the
water-gas-shift reaction is considered. This includes the net rate of production or
consumption of H2 by the water-gas-shift reaction.

JMEC for TMS/NETL Appendix E 11/30/09 03/13/06
88
Formulas used in the H2-ITM worksheet, refer to several Visual Basic for Applications
coded functions provided with the workbook. These are RateWGS, KeqWGS, and
TeqWGS, which are used to calculate the net rate of reaction, and the equilibrium
constant and temperature, respectively, for the water-gas-shift reaction.
Input Data: These data fall into several categories,
Stream Properties
1) Feed Pressure (psia)
2) Feed Temperature (oC)
3) Feed Flowrate (lb mol/hr)
4) Feed Composition for H2, CO, CO2, H2O, other gases (mole %)
5) Permeate Pressure (psia)
6) Steam Addition ratio to the feed flow (mol/mol)
Membrane Assembly Dimensions
1) Plate Width (cm)
2) Plate Length (cm, assumed equal to plate length)
3) Length of segment used for numerical calculations (cm)
4) Thicknesses ( m) of individual components making up membrane: Feed
Channel, Surface Catalyst, Ion Transport Membrane, Porous Support, and
Permeate Channel
The assembly can be easily programmed for other stack arrangements.
Hydrodynamics
1) Feed Superficial Velocity per channel (cm/sec)
2) Viscosity of feed stream (cP)
Economic Parameters
1) Equipment manufacturing cost per unit of membrane area ($/sq.ft.)
2) Cost of installation as percentage of inside-battery limit (ISBL) installed
cost
3) Outside-Battery Limit (OSBL) cost as percentage of total ISBL cost
4) Other One-Time Costs (OTC) as percentage of total installed costs (ISBL
+ OSBL)
5) Annual capital recovery factor as percentage of total investment (ISBL +
OSBL + OTC)
6) Other fixed costs as percentage of total investment
7) Feed and product values (shadow prices): feed value ($/MM Btu),
assumed same as fuel value of waste gas, feed temperature penalty ($/M
lb) steam value ($/M lb), permeate value ($/MM Btu), and permeate
pressure penalty ($/MM Btu)
Membrane Properties
1) Membrane Conductivity (Ohm-1
-cm-1
) at 900oC
2) Energy of Activation (electron-Volts)

JMEC for TMS/NETL Appendix E 11/30/09 03/13/06
89
3) Technology Improvement Factor
4) Flag for turning on/off Water-Gas-Shift (WGS) reaction
Output: The output is generally reported in several sets of dimensional units.
The following information is predicted by the model,
Permeate and Retentate Molar Flowrates and Compositions
CO Conversion and H2 Recovery
Average Flux across membrane and H2 Partial Pressure Pinch at outlet
Membrane Unit Mechanical Design
1) Number of Flow Channels
2) Total Stack Height
3) Total Stack Area
4) Total Stack Volume
5) Stack Area-to-Volume Ratio
Hydraulics
1) Average velocity at flowing conditions
2) Reynolds Number
3) Pressure Drop
4) Average Residence Time
Unit Economics
1) Membrane Unit Cost
2) Cost of Installation
3) OSBL Costs
4) Other One-Time Costs
5) Capital Charge
6) Other Fixed Costs
7) Feed Costs
8) Product Revenues
9) Unit Profitability
Profiles through Membrane Unit (per channel)
1) H2 Partial Pressure in Retentate (psia)
2) H2 Partial Pressure in Permeate (psia)
3) H2 Flux across membrane (g-mole/cm2-s)
4) Incremental H2 transport across membrane (g-mole/cm2)
5) Incremental H2 production from WGS reaction (g-mole/cm2)
6) H2 Flow in retentate (g-mole/-s)
7) CO Flow in retentate (g-mole/-s)
8) CO2 Flow in retentate (g-mole/-s)
9) H2O Flow in retentate (g-mole/-s)
10) Flow of Inerts in retentate (g-mole/-s)
11) Total Retentate Flow (g-mole/-s)

JMEC for TMS/NETL Appendix E 11/30/09 03/13/06
90
12) Mole Fraction H2 in Retentate
13) H2 Flow in Permeate (g-mole/-s)
14) Cumulative H2 Productivity, H2 recovered / H2+CO in feed
15) Total Concentration in Retentate, (g-mole/liter)
16) H2 Concentration in Retentate, (g-mole/liter)
17) CO Concentration in Retentate, (g-mole/liter)
18) CO2 Concentration in Retentate, (g-mole/liter)
19) H2O Concentration in Retentate, (g-mole/liter)
20) Inerts Concentration in Retentate, (g-mole/liter)
21) Net Rate of Production of H2 from WGS reaction , (g-mole/liter-s)
Equations & Theory: The following assumptions have been used in the development of
the hydrogen separation membrane model:
Steady-state, 1-dimensional, finite-difference model
o H2 flux calculated from ∆P across membrane
o Ion transport step rate controlling
o Flux proportional to ln(PH2(retentate))/ln(PH2(permeate))
o No leakage of other gases (CO, CO2, H2O & Inerts) across membrane
Homogeneous WGS reaction kinetics are included, but may be turned „on‟ or
„off‟
Deactivation and other side reactions are ignored, including
o Effect of contaminants
o FT synthesis, coking, etc.
Governing differential equation1:
2
22
H
H
2
H
"
'ln
4 P
P
lF
RT
dA
dn (1)
where: n - molar flowrate of feed gas
A - membrane area
- membrane conductivity
R - ideal gas constant
T - absolute temperature
F - Faraday‟s constant
l - thickness of ion transport membrane
P‟ - partial pressure of retentate
1 See “Ceramics for Advanced Power Generation,” by Sarah Benson, IEA Coal Research 2000 (ISBN 92-
9029-349-7), August 2000.

JMEC for TMS/NETL Appendix E 11/30/09 03/13/06
91
P” - partial pressure of permeate
The spreadsheet model can be easily recoded to consider other mechanisms for
membrane transport using other flux relationships (by recoding the right-hand side of (1)
which appears in Column E of the cell block named PROFILES).
A backward finite difference formulation is used to represent the governing differential
equation (1) in the spreadsheet model. The values calculated in any given row are only
dependent on values in the preceding row. Therefore, iteration is not required to achieve
convergence at each point in the grid. This is particularly convenient in the spreadsheet
format, since it allows the grid to be expanded by clicking on a row and dragging it
downward; thus, copying all cell formulae and updating all cell references.
example output from the H2M.xls spreadsheet.

JMEC for TMS/NETL 11/30/09 03/13/06
92
APPENDIX F
IGCC System Analysis Methodology
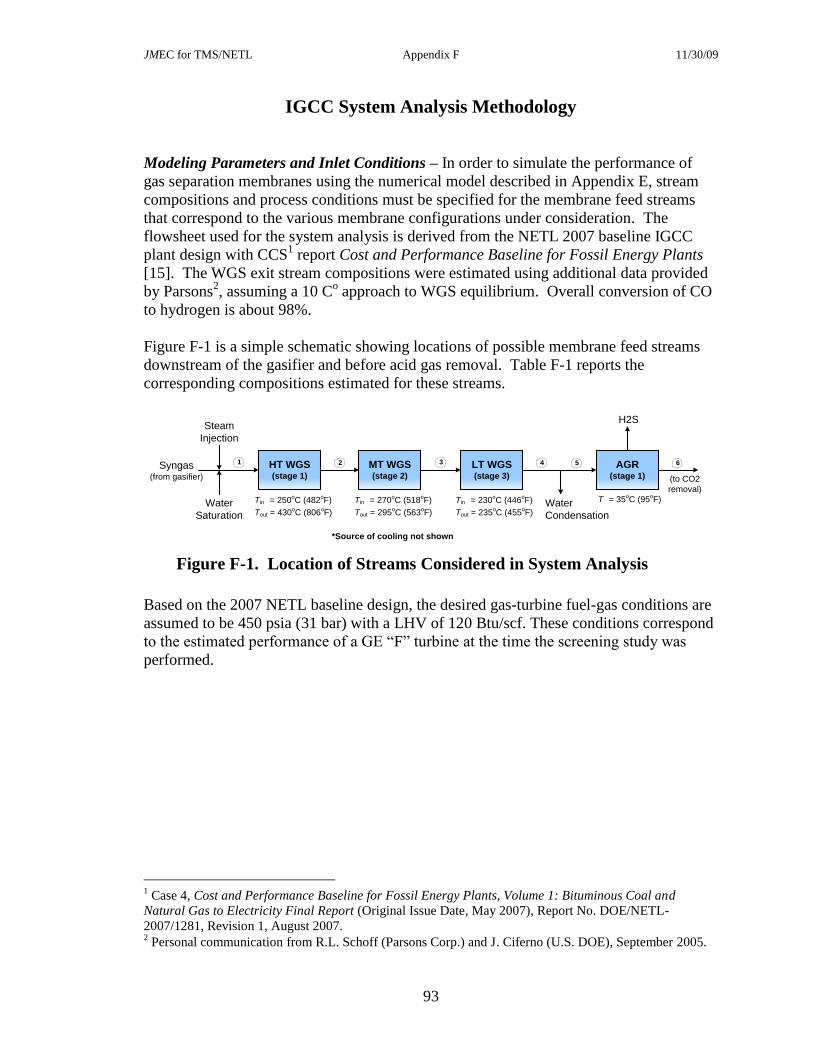
JMEC for TMS/NETL Appendix F 11/30/09 03/13/06
93
IGCC System Analysis Methodology
Modeling Parameters and Inlet Conditions – In order to simulate the performance of
gas separation membranes using the numerical model described in Appendix E, stream
compositions and process conditions must be specified for the membrane feed streams
that correspond to the various membrane configurations under consideration. The
flowsheet used for the system analysis is derived from the NETL 2007 baseline IGCC
plant design with CCS1 report Cost and Performance Baseline for Fossil Energy Plants
[15]. The WGS exit stream compositions were estimated using additional data provided
by Parsons2, assuming a 10 C
o approach to WGS equilibrium. Overall conversion of CO
to hydrogen is about 98%.
Figure F-1 is a simple schematic showing locations of possible membrane feed streams
downstream of the gasifier and before acid gas removal. Table F-1 reports the
corresponding compositions estimated for these streams.
HT WGS(stage 1)
Steam
Injection
Syngas(from gasifier)
1 3 4 52 MT WGS(stage 2)
LT WGS(stage 3)
Water
Saturation
Water
Condensation
(to CO2
removal)
Tin = 250oC (482
oF)
Tout = 430oC (806
oF)
Tin = 270oC (518
oF)
Tout = 295oC (563
oF)
Tin = 230oC (446
oF)
Tout = 235oC (455
oF)
*Source of cooling not shown
AGR(stage 1)
6
H2S
T = 35oC (95
oF)
Figure F-1. Location of Streams Considered in System Analysis
Based on the 2007 NETL baseline design, the desired gas-turbine fuel-gas conditions are
assumed to be 450 psia (31 bar) with a LHV of 120 Btu/scf. These conditions correspond
to the estimated performance of a GE “F” turbine at the time the screening study was
performed.
1 Case 4, Cost and Performance Baseline for Fossil Energy Plants, Volume 1: Bituminous Coal and
Natural Gas to Electricity Final Report (Original Issue Date, May 2007), Report No. DOE/NETL-
2007/1281, Revision 1, August 2007. 2 Personal communication from R.L. Schoff (Parsons Corp.) and J. Ciferno (U.S. DOE), September 2005.

JMEC for TMS/NETL Appendix F 11/30/09 03/13/06
94
Table F-1. Syngas Composition Used in Screening Analysis
Composition, vol% Stream 1 Stream 2 Stream 3 Stream 4 Stream 5
H2 19.33% 39.40% 42.45% 43.20% 57.34%
CO 24.43% 4.36% 1.31% 0.56% 0.75%
CO2 5.68% 25.75% 28.80% 29.55% 39.22%
H2S+COS 0.48% 0.48% 0.48% 0.48% 0.64%
NH3 0.16% 0.16% 0.16% 0.16% 0.21%
CH4+C2H6 0.24% 0.24% 0.24% 0.24% 0.32%
N2+Ar 0.81% 0.81% 0.81% 0.81% 1.08%
H2O 48.86% 28.79% 25.75% 25.00% 0.45%
Total 100.00% 100.00% 100.00% 100.00% 100.00%
H2O/CO Ratio 2.00 6.60 19.61 44.28 0.61
K WGS(P ) = K WGS(T ) 0.09 8.08 36.16 90.46 6612.36
Temperature, oC 250 430 295 235 105
WGS Approach, Co
- 10 10 10 -
Three membrane placement options were considered for screening: post-WGS H2
recovery, CO2 compressor-interstage H2 recovery, and H2 recovery integrated with WGS.
Parameters considered in the screening analysis are reported in Table F-2.
Screening Methodology – The following steps were utilized to estimate changes in
equipment capacity due to the different membrane configurations considered:
1) Remove 2nd
-stage of Selexol unit
2) Add membranes and determine area requirements
3) Determine new CO2 compression requirements: number of stages and flow
4) Remove humidification if not needed
5) Add hydrogen compression if necessary
6) Determine changes to auxiliary power load
7) Determine changes to auxiliary steam load and estimate power loss

JMEC for TMS/NETL Appendix F 11/30/09 03/13/06
95
Table F-2. Membrane Screening Parameters
Range
Feed Gas H2 Content, vol% based on maximum shifting of syngas 57.34%
Permeate H2 Content, vol% based on no sweep, partial, or max sweep gas, set by gas turbine 100 / 72 / 44%
Feed Gas Pressure, psia set by gasifier design pressure and equipment pressure drops 400 / 700
Permeate Pressure, psia design parameter for membrane; max set by gas turbine 50 / 380
H2 Partial-Pressure Approach, psi indicative of membrane area 0 / 10 / 25 / 50
Pressure Diff. Across Membrane, psi limitation of membrane material and fabrication 20 - 650
Feed Gas H2 Content, vol% based on maximum shifting of syngas 57.34%
Permeate H2 Content, vol% based on no sweep, partial, or max sweep gas, set by gas turbine 100 / 72 / 44%
Feed Gas Pressure, psia CO2 compression requirements and compression ratios 800 / 1,600 / 2,200
Permeate Pressure, psia design parameter for membrane; max set by gas turbine 50 / 380
H2 Partial-Pressure Approach, psi indicative of membrane area 0 / 10 / 25 / 50
Pressure Diff. Across Membrane, psi limitation of membrane material and fabrication 420 - 2,150
Feed Gas H2 Content, vol% based on maximum shifting of syngas 57.34%
Feed Gas Pressure, psia design parameter for PSA unit; max set by gas turbine 380
Tail Gas Pressure, psia design parameter for PSA unit; affects compression requirements 17 / 50 / 100
Permeate H2 Content, vol% based on no sweep, partial, or max sweep gas, set by gas turbine 100 / 44%
Feed Gas Pressure, psia CO2 compression requirements and compression ratios 800 / 1,600 / 2,200
Permeate Pressure, psia design parameter for membrane; max set by gas turbine 380
H2 Partial-Pressure Approach, psi indicative of membrane area 0 / 10 / 25 / 50
Pressure Diff. Across Membrane, psi limitation of membrane material and fabrication 420 - 1,820
Feed Gas H2 Content, vol% based on partial shifting of syngas, set by WGS reactor design 19.3 / 39.4 / 43%
Permeate H2 Content, vol% based on no sweep, partial, or max sweep gas set by gas turbine 100 / 44%
Feed Gas Pressure, psia set by gasifier design pressure and equipment pressure drops 700
Permeate Pressure, psia design parameter for membrane; max set by gas turbine 50 / 380
H2 Partial-Pressure Approach, psi indicative of membrane area 0 / 10 / 25 / 50
Pressure Diff. Across Membrane, psi limitation of membrane material and fabrication 420 - 650
LTS Exit Temperature, oC design parameter for LTS WGS; set by inter-cooling 235 / 300
MTS Exit Temperature, oC design parameter for MTS WGS; set by inter-cooling 270 / 455
HTS Exit Temperature, oC design parameter for HTS WGS; set by inter-cooling 430 / 550
WGS Temperature Approach, Co indicative of catalyst requirements 0 / 10 / 20
H2 selective membrane located downstream from WGS reactors
H2 selective membrane integrated with WGS reactors
PSA located downstream from WGS reactors with…
H2 selective membrane integrated with CO2 compression
...H2 selective membrane integrated with CO2 compression
JMEC for TMS/NETL 11/30/09 03/13/06
96
APPENDIX G
Economic Analysis Methodology

JMEC for TMS/NETL 11/30/09 03/13/06
97
Economic Analysis Methodology
Costing Methodology – The following steps were utilized to estimate changes to the cost
of electricity for the different membrane configurations considered:
1) Adjust costs for WGS due to changes in operating pressure
2) Remove costs associated with 2nd
-stage of Selexol unit
3) Add assumed membrane cost for membranes
4) Determine new costs for CO2 compression
5) Remove costs associated with humidification if not needed
6) Add costs for hydrogen compression if necessary
7) Adjust plant to auxiliary power load due to power losses
JMEC for TMS/NETL 11/30/09 03/13/06
98
APPENDIX H
Primer on Targeting Membrane Cost & Performance
JJM for TMS/NETL Appendix H 11/30/09 03/13/06
99
Primer on Targeting Membrane Cost & Performance
This primer provides details on the approach used in establishing R&D targets for gas
separation membrane technologies being applied to pre-combustion removal of CO2 from
coal-derived syngas for Integrated-Gasification Combined-Cycle (IGCC) power
generation.
Why Set R&D Goals? – The primary purpose of applied R&D is the solution of current
and future societal, environmental, and economic problems based on the discovery and
application of new technologies. In contrast, pure R&D is focused on a search for
knowledge and truth for their own merit. Pure R&D by its nature can and should wander
into new and exciting areas. Applied R&D, however, must remain focused on the
problem at hand, or risk not fulfilling its mission of solving the problem identified in a
timely and cost-effective manner1. Therefore, it is appropriate to set goals and targets for
applied R&D programs and projects. This is especially true when society as a whole (i.e.
the tax-payer) is asked to fund these programs and projects.
A well thought-out applied R&D program will have well-defined goals. These goals will
relate directly to the problem at hand. For example, and of direct bearing to this
discussion, is the problem of anthropologically-driven global climate change. This
problem is so large and complex that some cannot accept the current evidence for its
existence. To address this problem, the U.S. DOE, and other organization that sponsor
R&D worldwide, have identified and developed R&D programs to specifically address
certain critical aspects of the problem.
CCS Program IGCC R&D Goals –The DOE‟s CCS (Carbon Capture and Sequestration)
R&D Program has established a goal of developing and demonstrating by 2020,
technologies that can capture and sequester 90% of the CO2 generated by future IGCC
plants, at a cost of electricity (COE) increase of less than 10% above current technology
without CCS.
The CCS Program goal is relative to the performance of current state-of-the-art (SOTA)
IGCC technology. A reference plant design for making comparisons has been
established based on analysis conducted at DOE‟s National Energy Technology
Laboratory (NETL)2. As a part of this baseline, NETL has also estimated the increase in
the COE for 90% CO2 capture from a SOTA IGCC plant fitted with the best available
CO2 capture technology, currently considered to be a physical absorption system
employing the commercial solvent Selexol™.
1 It is often the case that pure and applied R&D alike often inadvertently result in the discovery of new
technologies (or ones different from those intended) that have direct application to existing or future
problems. 2 Cost and Performance Baseline for Fossil Energy Plants: Volume 1 - Bituminous Coal and Natural Gas
to Electricity (Original Issue Date, May 2007), Report No. DOE/NETL-2007/1281, Revision 1, August
2007.
JJM for TMS/NETL Appendix H 11/30/09 03/13/06
100
The COE from the DOE baseline design report, with and without CCS are:
Reference IGCC plant with CCS 10.29 ¢/kWh
Reference IGCC plant without CCS 7.80
Reference IGCC plant increase in COE 2.49 ¢/kWh
The COE for the reference plant with SOTA CCS is 32% above that for the same plant
without CCS. This increase in COE is the result of a number of factors:
Addition of water-gas-shift (WGS) reactors to convert CO in the syngas to H2 and
CO2.
Replacement of the single-stage MDEA acid gas removal (AGR) unit used for
H2S removal with a two-stage Selexol system for H2S and CO2 removal.
Addition of CO2 compression, transport, injection and CCS site monitoring.
The DOE Program R&D goal for COE is:
Reference IGCC plant without CCS 7.80 ¢/kWh
Goal for future IGCC plants with CCS +0.78
Maximum incremental increase in COE 8.58 ¢/kWh
The above goal corresponds to a 17% reduction in COE relative to the best currently
available CCS technology for IGCC. The goal is not meant to establish future policy or
regulations, especially since R&D success cannot be guaranteed. Nor is it meant to be
applied generally to determine the economic feasibility of any new real-world IGCC
project. Rather, the 10% COE goal for 90% capture is solely intended for use in
measuring the progress of pre-combustion CCS technology development under the DOE
CCS R&D Program.
Other DOE Fossil-Energy R&D Programs have their own goals relating to CCS. In
particular, alternative-fuels programs, such as coal-to-liquids and coal-to-hydrogen that
employ coal gasification, have adopted the 90% capture target, but are subject to
economic metrics tied to existing technologies for producing hydrogen and conventional
liquid fuels. In addition, specific capture technologies, such and gas separation
membranes, will in general have different numerical targets for their key performance
parameters based on the application.
In addition to chemical and physical absorption, other pre-combustion capture
technologies being investigated by the DOE R&D Program include gas-solid adsorption
and membrane separation. Outside of the CO2 capture component, next-generation and
future technologies relating to gasification, syngas clean-up, water-gas-shift, CO2
compression and gas turbines can also contribute to achieving the COE goal established
by the DOE CCS R&D Program.
Establishing Membrane R&D Targets – An R&D program goal by itself does not
provide much guidance to researchers and technology developers. The goal must be

JJM for TMS/NETL Appendix H 11/30/09 03/13/06
101
translated into meaningful numerical targets related to the type of technology being
investigated. Specific to H2-separation membranes, the DOE CCS goal must be related
to process and cost parameters that are meaningful in membrane-based gas separations.
These parameters are H2 permeance, H2 selectivity, and membrane cost.
The conversion of the COE goal for CCS into membrane R&D targets is an exercise in
reverse engineering. One imbeds the technology under consideration into the IGCC
process, assumes the technology can attain 90% CO2 capture, and then back calculates
the range of membrane parameters satisfying the COE goal. While in principle simple,
the procedure requires a parametric study to determine H2 recovery as a function of the
unique set of membrane permeances/selectivities that result in 90% CO2 capture. This
data set is used to construct a cost curves for the membrane system being investigated.
The cost curves are then used to establish targets for H2 permeance, H2 selectivity, and
membrane cost. Figure H-1 shows example cost curves for illustrative purposes.
Figure H-1. Illustrative Membrane Cost Curves for IGCC with CCS
The following steps are used in construction of the cost curves depicted above:
Step 1: Select membrane configuration
Each membrane configuration integrated into the IGCC process design will result in a
unique set of membrane targets, requiring each system to be analyzed individually. In
this assessment five unique configurations were considered:
Configuration Ia – Membrane integration post-WGS with H2 re-compression
Configuration Ib – Membrane integration post-WGS with permeate sweep
Configuration IIa – Membrane integration with CO2 compression and permeate sweep
Membrane Cost Curves for Process Design Ia2
$10.00
$20.00
$30.00
$40.00
$50.00
$60.00
$70.00
$80.00
$0.00 $0.50 $1.00 $1.50 $2.00 $2.50 $3.00 $3.50 $4.00 $4.50 $5.00
Membrane Cost, $/GPU-cm2
CO
E,
$/M
Wh
H2/CO2 Selectivity = 100
40
5020
30
104 500 30010
3 200 150
90
80
70
60
10
0
15
12
CSP COE Goal
COE w/o CC
JJM for TMS/NETL Appendix H 11/30/09 03/13/06
102
Configuration IIb – PSA and membrane integration with CO2 compression and permeate
sweep
Configuration III – Membrane integration with medium-temperature WGS
In addition, each configuration considered a number of flowsheet variations, such as cold
versus warm-gas clean-up for H2S removal, CO2/H2S co-sequestration with no H2S
removal, and the effects of having to re-heat the membrane feed gas due to possible
membrane operating limitations. Sensitivities were also run to examine the impact of
relaxing or tightening the 90% CO2 capture requirement.
Step 2: Predict Membrane Performance
The key components for the gas separation are H2 and CO2. For size-selective
membranes, H2 is the more permeable of these two gases, and the ideal selectivity (i.e.
permselectivity) of H2 relative to CO2 is greater than one. With the exception of H2O, all
of the other syngas components possess H2 permselectivities which are greater than that
of CO2. If the gas separation is solely based on molecular size, then the permselectivity
of H2 relative to H2O is less than one. However, for certain materials such a silica glass
and certain zeolites, the permselectivity of H2 relative to H2O can be greater than one;
and for palladium, permselectivity is essentially infinite.
In order to develop unique permselectivity targets for the key gas components, H2 and
CO2, it is necessary to make assumptions regarding the selectivities of the other syngas
components. The permselectivity of H2 relative to the gases: H2S, CO, N2 and CH4, will
be assumed to be large. For H2O, the H2 permselectivity will be assumed to be 0.25 for
post-WGS membrane configurations, and large for integrated membrane-WGS
configurations. The former value is typical of many polymer-based gas separation
membranes; whereas, the latter is required for WGS interstage membranes, since loss of
reaction water has a negative impact on WGS equilibrium.
The numerical values assumed for the selectivities of all non-key components of the
syngas are listed in Table I-1. The assumed selectivities constitute additional
performance targets for membrane R&D (thus the „<‟ and „>‟ signs used in the table).
In regards to the permselectivity of H2 relative to CO2, that is SH2,CO2, specifying the
membrane system total H2 and CO2 recoveries results in a unique set of values for SH2,CO2
and PA, which minimize PA. Where, PA is the product of the H2 permeance PH2 and the
membrane area A. For any fixed CO2 recovery (in this case 90%), an increase in H2
recovery will require both an increase in SH2,CO2 and in PA.
The membrane numerical model described in Appendix F is used to construct a table of
values for H2 recovery as a function of SH2,CO2 and PA. Typically, H2 recovery values of
80, 85, 90, and 95% were used. Above about 95%, selectivity and PA requirements
increase rapidly, approaching a limiting asymptote for H2 recovery that is unique for any
given membrane configuration. A series model runs were also made above 95% in order
to estimate the maximum achievable H2 recovery.

JJM for TMS/NETL Appendix H 11/30/09 03/13/06
103
It is impractical to minimize PA within the membrane model. Therefore, heuristic
arguments where used to avoid rigorous optimization. All configurations considered the
integration of three banks of membrane modules. Membrane areas of the first two banks
were kept equal, %recovery was kept equal, sweep gas when considered was distributed.
While these assumptions do not gareetee the true minimum PA, they do seem to produce
a low value .
Step 3: Predict Membrane Cost
The procedure outlined in Appendix G is used to analyze the performance of the IGCC
plant incorporating H2 selective membranes for CO2 capture. This analysis provides
changes to plant parasitic energy requirements (i.e. steam and electric power) and to plant
equipment capacity requirements, for each of the H2 recovery levels considered in Step 2.
In turn, the procedure from Appendix F is used to convert this information into a
lelvelized-cost of electricity (COE), using the NETL IGCC economics model.
The change in COE relative to the baseline IGCC plant without CCS is related to the cost
of the membrane per unit area per unit permeance, CPA, by a straight line:
PcPAbaPAPcbaAcbaCOE AAAAAA (C1)
or
PAPACbaCOE (C2)
where a and b are constants, and cA is the cost of the membrane per unit area only. The
subscripts A and PA refer to quantities either on a per unit area or a per unit area per unit
permeance basis, respectively.
A plot of COE versus CPA results in a family of lines with SH2,CO2 as a parameter. By
assuming two vales for CPA, the IGCC economics workship can be used to determine two
values for COE, from which the constants a and bPA can be determined. Plotting of
these data results in membrane cost curves, such as those shown in Figure H-2.
Step 4: Establish Membrane R&D Targets
By examining the cost curves established in Step 3, a number of membrane cost and
performance regimes may be identified.

JJM for TMS/NETL Appendix H 11/30/09 03/13/06
104
Figure H-2. Membrane Performance Regimes for IGCC with CCS
Interpreting Membrane R&D Targets – Figure H-3 depicts the performance three
hypothetical membranes. The point labeled S1, does not meet the membrane goals.
Researchers developing this membrane have three distinct options for improvement.
They can try to maintain selectivity and either lower the cost per unit area or increase the
permeance, or they can try to increase selectivity while maintaining cost and permeance
(thus, shifting the line labeled Selectivity 1 down). Interestingly, the point labeled S2, can
never meet the goal without improving selectivity.
Since membrane technology will be employed with other advanced technologies, it will
not be required to achieve all of the cost reduction alone. The red dashed-line labeled
“Membrane Goal” lies between the baseline IGCC plant retrofitted with a currently
available carbon capture system (green-dashed line) and the program goal (blue dashed-
line). For a membrane technology to achieve the program‟s membrane goal for a given
selectivity (e.g., the line labeled Selectivity 1), its cost in units of dollars per membrane
area per unit of membrane permeance must lie to the left of the vertical orange dashed-
line. Note that a trade-off thus exists between permeance and cost per unit of area. A
membrane could achieve the target with either a “low” cost per unit area or a “high”
permeance.
Membrane Cost Curves for Process Design Ia2
$10.00
$20.00
$30.00
$40.00
$50.00
$60.00
$70.00
$80.00
$0.00 $0.50 $1.00 $1.50 $2.00 $2.50 $3.00 $3.50 $4.00 $4.50 $5.00
Membrane Cost, $/GPU-cm2
CO
E,
$/M
Wh
H2/CO2 Selectivity = 100
40
5020
30
104 500 30010
3 200 150
90
80
70
60
10
0
15
12
CSP COE Goal
min
membrane
selectivity
min increase
in COEmax cost
of membrane
Infeasible Region
Beats COE
Goal
Exceeds COE Goal,
lower cost and/or increase selectivity
Increase CO2 Capture
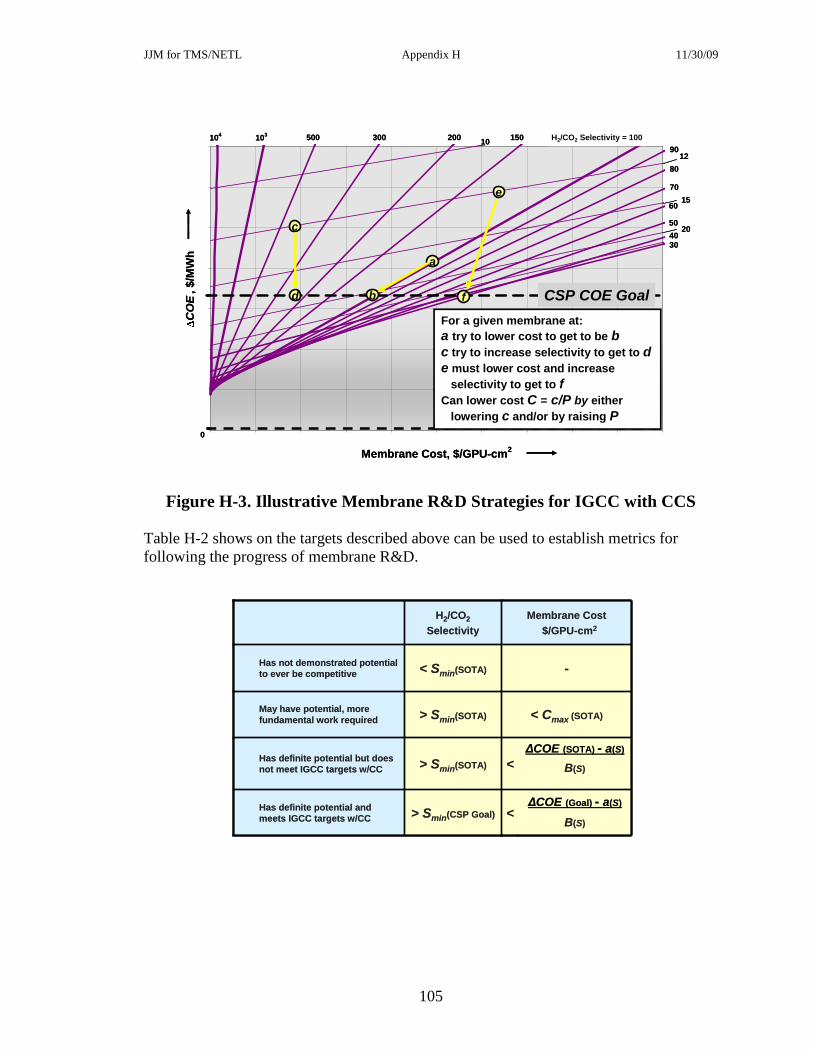
JJM for TMS/NETL Appendix H 11/30/09 03/13/06
105
Figure H-3. Illustrative Membrane R&D Strategies for IGCC with CCS
Table H-2 shows on the targets described above can be used to establish metrics for
following the progress of membrane R&D.
Membrane R&D Targets
ΔCOE (Goal) - a(S)
B(S)
ΔCOE (SOTA) - a(S)
B(S)
> Smin(CSP Goal)Has definite potential and
meets IGCC targets w/CC
May have potential, more
fundamental work required < Cmax (SOTA)> Smin(SOTA)
-< Smin(SOTA)Has not demonstrated potential
to ever be competitive
<
<> Smin(SOTA)
Membrane Cost
$/GPU-cm2
Has definite potential but does
not meet IGCC targets w/CC
H2/CO2
Selectivity
Membrane Cost Curves for Process Design Ia2
$10.00
$20.00
$30.00
$40.00
$50.00
$60.00
$70.00
$80.00
$0.00 $0.50 $1.00 $1.50 $2.00 $2.50 $3.00 $3.50 $4.00 $4.50 $5.00
Membrane Cost, $/GPU-cm2
CO
E,
$/M
Wh
H2/CO2 Selectivity = 100
40
5020
30
104 500 30010
3 200 150
90
80
70
60
10
0
15
12
CSP COE Goal
a
b
c
d f
e
For a given membrane at:
a try to lower cost to get to be b
c try to increase selectivity to get to d
e must lower cost and increase
selectivity to get to f
Can lower cost C = c/P by either
lowering c and/or by raising P