Integration of commodity and bioenergy crops
18
Integration of Commodity and Bioenergy Crops to Boost Conservation and Environmental Sustainability Herbert Ssegane and M. Cristina Negri 69 th SWCS International Annual Conference Making Waves in Conservation July 27-30, 2014 Lombard, IL [email protected] , [email protected] 630-252-7051 Work funded by the Bioenergy Technologies Office, US DOE-EERE
-
Upload
soil-and-water-conservation-society -
Category
Environment
-
view
78 -
download
7
Transcript of Integration of commodity and bioenergy crops

Integration of Commodity and Bioenergy Crops to Boost Conservation and Environmental Sustainability
Herbert Ssegane and M. Cristina Negri
69th SWCS International Annual ConferenceMaking Waves in ConservationJuly 27-30, 2014 Lombard, IL
[email protected], [email protected] 630-252-7051Work funded by the Bioenergy Technologies Office, US DOE-EERE
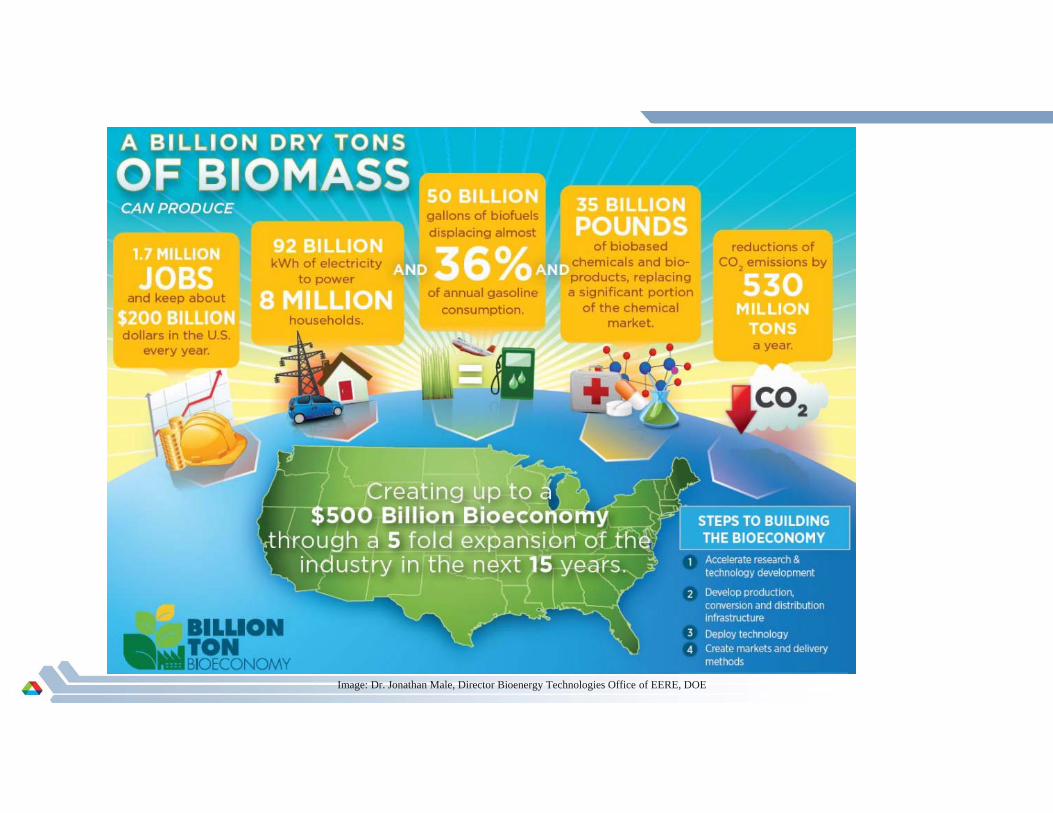
Image: Dr. Jonathan Male, Director Bioenergy Technologies Office of EERE, DOE

Pathways to sustainable expansion of biomass production
Iastate.edu
Bioenergycrops.com
biomassmagazine.com Biochar.org
aquanetviet.org
Use of marginal lands Corn stoverForest residues and
wood chips
Cover crops Algae

Integration of energy crops into current agricultural production system

Site characterization: Monitoring vs. modeling
OBJECTIVE CRITERIAATTRIBUTE AND
DATA
Soil analysis
Terrain analysis
Hydrogeological analysis
Nutrient leaching
Intra-field crop variability
Site-specific intra-field
assessment for marginal lands
Soil map from soil cores
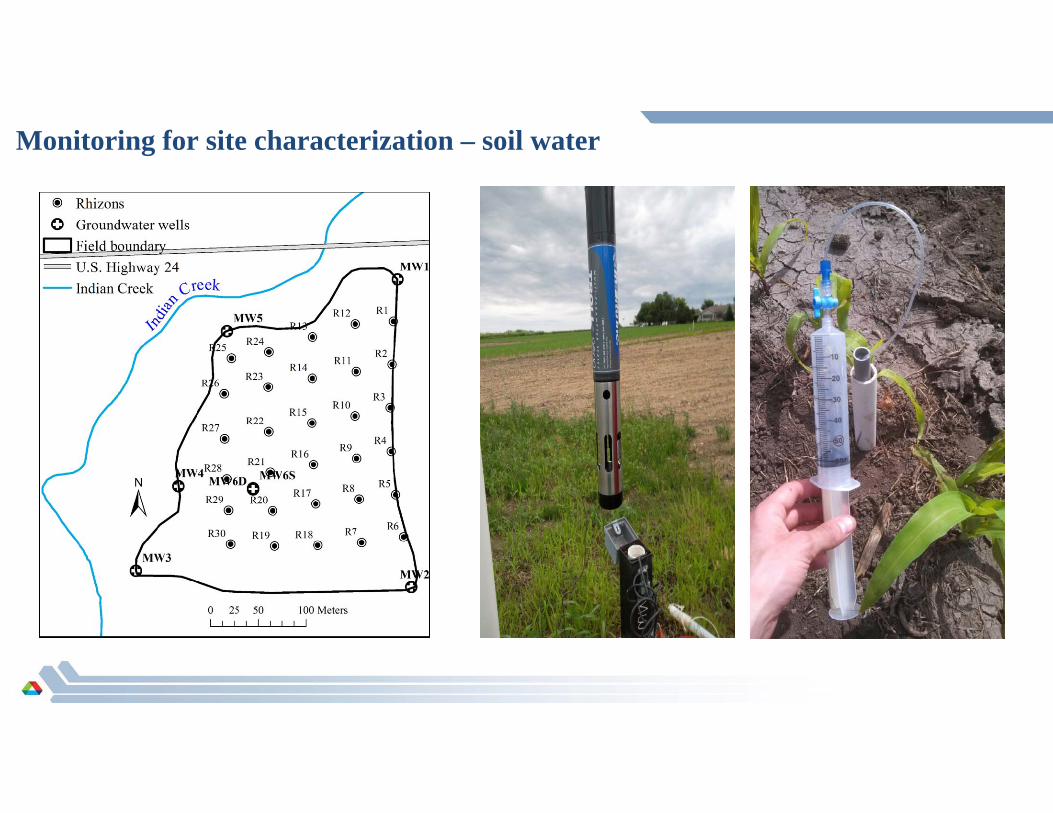
Longest flow pathso DEM from elevation
point cloud
MODFLOW conceptual modelo Water table elevation
Soil water analyzed for NO3, TOC, TP, and N2O
o Rhizon sampling
Yield map

Watershed scale
Field scale
Study location
Monitoring for site characterization – soil water

Soils: Monitoring vs. SSURGO data
3776A
294C2
294B
294B
294B
294B
!.
!.
!.
!.
!.
!.!.
!.
!.
!.
!.
!.!.
!.
!.
!.
!.
!.!.
!.
!.
!.
!.
!.!.
!.
!.
!.
!.
3776
294B
294C2
294C2
Contours!. Soil core locations
Field boundaryComfrey loam, 0 - 2 % slopes, frequently floodedSymerton silt loam, 2 - 5 % slopesSymerton silt loam, 5 - 10 % slopes, eroded
±
0 50 10025 Meters
b)a)
Topography and corn yield data
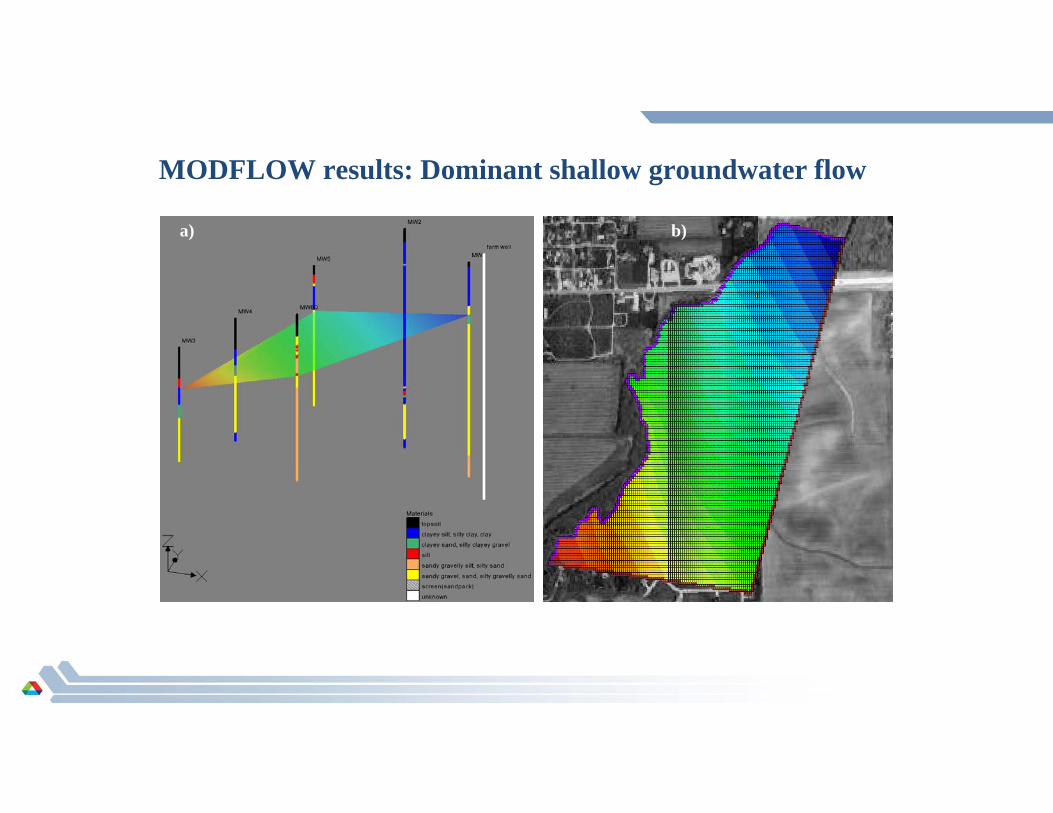
MODFLOW results: Dominant shallow groundwater flow
b)a)
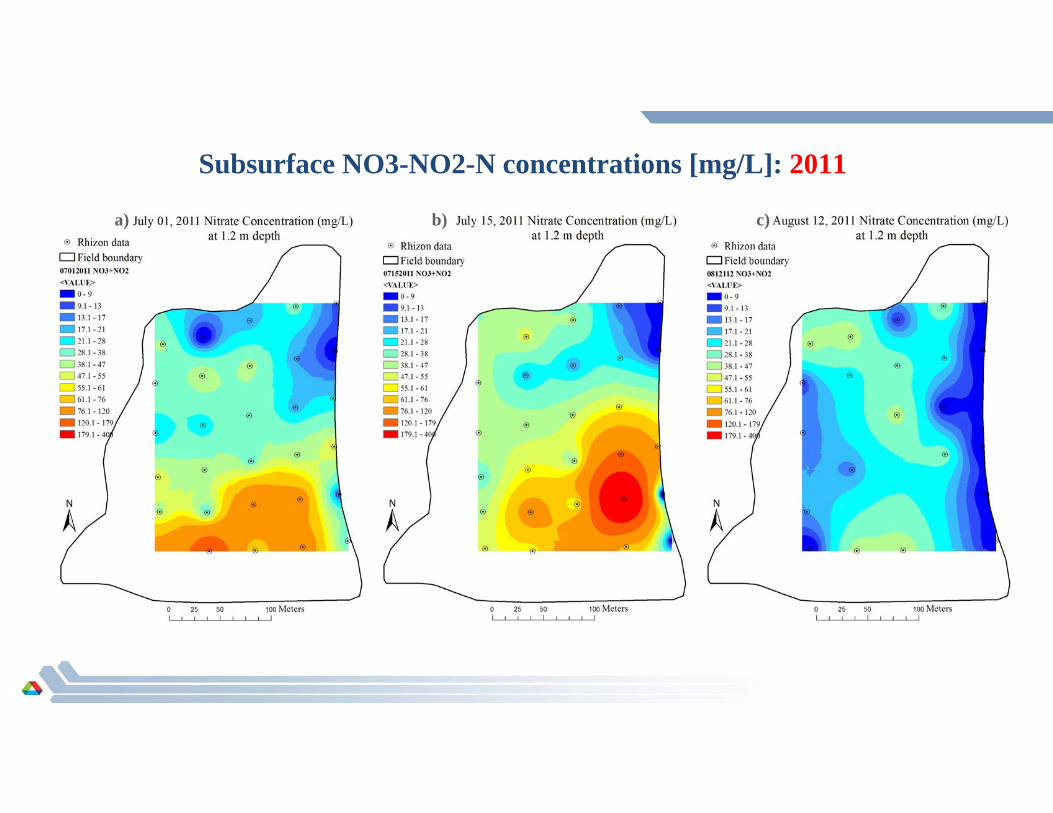
Subsurface NO3-NO2-N concentrations [mg/L]: 2011
a) b) c)

NO3-NO2-N concentrations [mg/L] at 1.2 m depth

Design of a contour strip buffer

DNDC scenario modeling
Scenarioa Yield Leached NO3 N2O flux
Mg ha-1 yr-1 kgN ha-1 yr-1 kgN ha-1 yr-1
Corn 10.4 ± 1.7 31.9 ± 4.4 2.2 ± 0.3
Corn/switchgrass 8.7 ± 1.0 11.6 ± 1.6 2.0 ± 0.2
Corn/willow 9.7 ± 0.6 12.5 ± 1.6 1.9 ± 0.2
% reductionb --- 61.0 ± 6.2 5.5 ± 3.1 --- 59.3 ± 4.0 10.8 ± 2.6
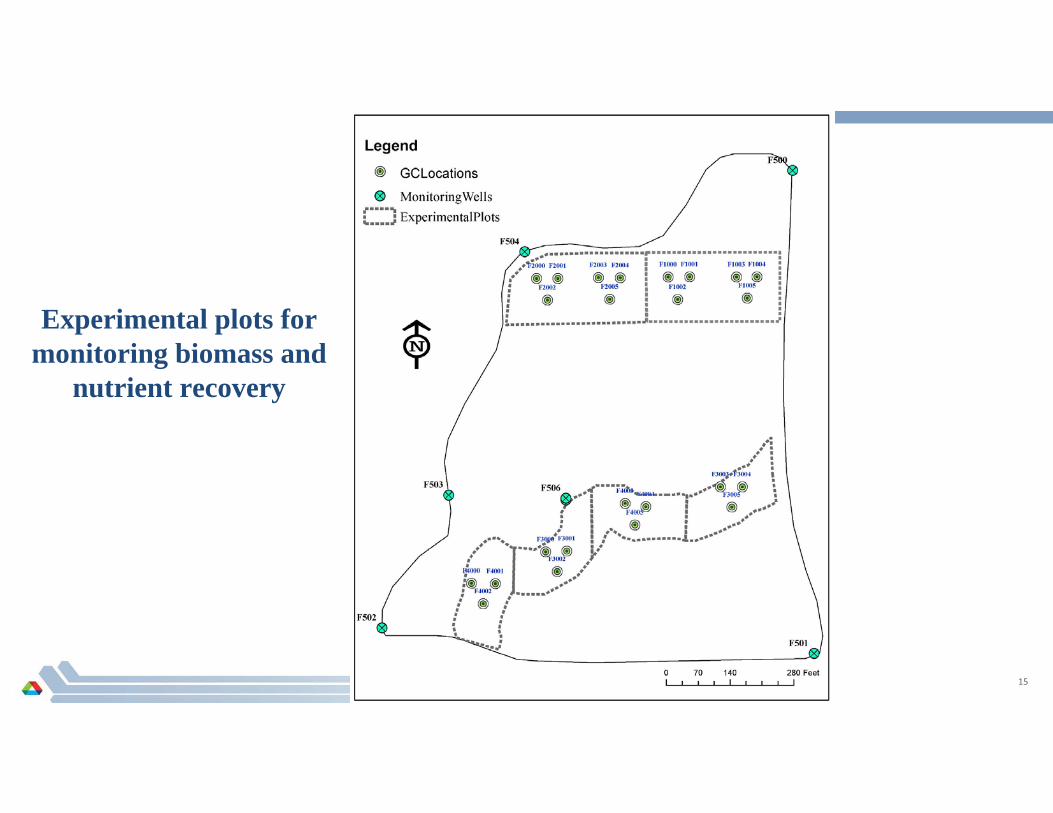
Experimental plots for monitoring biomass and
nutrient recovery
15

Willow Re-planting – May 14, 2013
16

Flux Chamber Analysis
17

Collaborators DOE-BETO office Terry Bachtold –Livingston County SWCD Eric McTaggart, USDA-NRCS Gayathri Gopalakrishnan Paul Benda CTIC The Indian Creek Watershed Project Leadership and Sponsors
Comments and Questions?
Thank you


![Bioenergy Production on Degraded Land: Landowner ...bioenergy crops. Nurlaila et al. [32] assert that traditional cultures of landowners have impacts on their decisions to produce](https://static.fdocuments.net/doc/165x107/5f2d2fea0f7241196f4d176e/bioenergy-production-on-degraded-land-landowner-bioenergy-crops-nurlaila-et.jpg)