Integration in Global Value Chains— The Role of Service Inputs
22
Policy Research Working Paper 9813 Integration in Global Value Chains— e Role of Service Inputs Evidence from India Ruchita Manghnani Birgit Meyer Sebastian Saez Erik van Der Marel Finance, Competitiveness and Innovation Global Practice & Macroeconomics, Trade and Investment Global Practice October 2021 Public Disclosure Authorized Public Disclosure Authorized Public Disclosure Authorized Public Disclosure Authorized
Transcript of Integration in Global Value Chains— The Role of Service Inputs

Policy Research Working Paper 9813
Integration in Global Value Chains— The Role of Service Inputs
Evidence from India
Ruchita Manghnani Birgit Meyer
Sebastian Saez Erik van Der Marel
Finance, Competitiveness and Innovation Global Practice &Macroeconomics, Trade and Investment Global PracticeOctober 2021
Pub
lic D
iscl
osur
e A
utho
rized
Pub
lic D
iscl
osur
e A
utho
rized
Pub
lic D
iscl
osur
e A
utho
rized
Pub
lic D
iscl
osur
e A
utho
rized

Produced by the Research Support Team
Abstract
The Policy Research Working Paper Series disseminates the findings of work in progress to encourage the exchange of ideas about development issues. An objective of the series is to get the findings out quickly, even if the presentations are less than fully polished. The papers carry the names of the authors and should be cited accordingly. The findings, interpretations, and conclusions expressed in this paper are entirely those of the authors. They do not necessarily represent the views of the International Bank for Reconstruction and Development/World Bank and its affiliated organizations, or those of the Executive Directors of the World Bank or the governments they represent.
Policy Research Working Paper 9813
This paper investigates the relationship between the use of service inputs and integration in global value chains. Using macro and detailed firm-level data (for 1990–2017), the study documents the extent of India’s integration into global value chains. Older, larger, and more productive firms and firms with a higher leverage ratio are more likely to be deeply integrated into global value chains. Firms in the information technology services and electronics indus-try are more deeply integrated into global value chains,
compared with textiles. Services are the engine for many global value chain industries as they help coordinate the different stages of production across geographical loca-tions. The findings suggest that both the intensity of service usage as well as the composition or type of service used are important. Firms using service inputs, particularly com-plex services and information technology and information technology–enabling services intensively are typically more deeply integrated into global value chains.
This paper is a product of the Finance, Competitiveness and Innovation Global Practice and the Macroeconomics, Trade and Investment Global Practice. It is part of a larger effort by the World Bank to provide open access to its research and make a contribution to development policy discussions around the world. Policy Research Working Papers are also posted on the Web at http://www.worldbank.org/prwp. The authors may be contacted at [email protected].

Integration in Global Value Chains - The Role of Service Inputs: Evidence
from India*
Ruchita Manghnani a+
Birgit Meyer b+
Sebastian Saez a
Erik van Der Marel c
Keywords: GVC integration, service inputs, firm productivity, complex services, exports
JEL Codes: F14, F61, F23, D24, L80
_____________________________________________________________________________________
* The paper is part of a larger report on GVCs and Services in India. The research was partially supported by the Umbrella Facility for Trade. Michael Ferrantino and Robert Carl Michael Beyer reviewed a first draft of the report and provided valuable comments and suggestions.a World Bankb Austrian Institute of Economic Research, Vienna University of Economics and Business and Kiel Center for Globalizationc Université Libre de Bruxelles and the European Center for International Political Economy+ Corresponding email: [email protected]; [email protected]
2
1. Introduction
Global value chains (GVCs) have become one of the defining characteristics of today’s patterns of
international trade and production. Services have a prominent place in GVCs as they provide a “dual”
function, namely as an intermediate input in production as well as coordination facilitator. In the
“coordination role,” they "glue" together the different stages of production across countries and allow
companies to specialize further and coordinate production and trade in GVCs. Ever since the early work
by Francois (1990a, 1990b) and Jones and Kierzkowski (1990), the role of services in the economy and
international trade has been emphasized. With the rapid expansion of supply chain networks in recent
years, services such as transport, logistics and supply chain services and ICT services have become crucial
for coordinating the production spread across geographical boundaries.
Although the growth of GVC trade globally was mainly found in machinery, electronics and transportation
to begin with, value addition in the services sectors has also now become increasingly fragmented and
organized across borders. Improvements in transport, digital infrastructure and the dismantling of existing
trade barriers in goods and services have greatly contributed to the expanding reach of GVCs in all sectors.
Moreover, the fragmentation of manufacturing production has also been associated with increased
outsourcing activities of not only manufacturing tasks but also services. The back office and ICT services
of several EU and US firms is now done in India. Such services linkages, including consultancy services,
financial services, maintenance, and repair services, are essential.
As companies specialize and grow, they tend to dedicate even more time to the coordination and
organization of their core business (see among others Antrás and Chor 2012). Miroudot and Cadestin
(2017) estimate that service inputs, whether domestic or foreign sourced, account for about 37 percent
of the value of manufacturing exports. This number increases substantially to 53 percent when adding
service activities that take place within manufacturing firms. Facilitating provision of services and thereby
increasing GVC participation through backward linkages enables firms, particularly downstream
manufacturing firms, to access a greater variety and quality of services at competitive prices, which in turn
improves their participation in GVCs and overall productivity.
Hence, the role of services as input into production is substantial. They are the engine for many firms to
integrate into GVCs. Transport, logistics, ICT services, marketing, consultancy and professional services
play an important coordinating role in GVCs. Empirical evidence suggests that effective provision of
services is important for downstream firm performance, including in India (Arnold et al., 2015; Arnold et
al., 2011) and that imported services contribute to the export intensity of manufacturing in India (Goldar
et.al 2018). Effective provision of high-quality services through removing policy barriers related to supply
of services; strengthening the institutional framework and investing in human capital will support the
integration of India and other developing countries into GVCs and help them reap the associated economic
benefits of specialization, scale and productivity growth.
This paper explores the relationship between the use of service inputs and GVC participation and
contributes to the emerging empirical literature in this area. India provides an interesting setting to study
this as a fast-emerging economy where the services sector plays an important role. We document the
extent of integration of India in global value chains using both macro and micro firm-level data (for the

3
period 1990-2017). The study finds that access to and use of service inputs seems to be an important
driver for GVC integration. The depth of GVC integration depends on the intensity of services inputs. Firms
which are highly productive, larger in size, pay a higher wage per value added, have a higher leverage ratio
and are older are more likely to be more deeply integrated into GVCs. Firms with low service input
intensities are unlikely to be integrated in GVCs. If firms not participating in GVCs increase their service
input intensity, the likelihood that they begin participating in GVCs increases substantially. The probability
to integrate at different levels (limited, low, medium, high) increases with the service input intensity.
Moreover, the composition of services matters for GVC integration. Indian firms using complex services
and IT and IT-enabling services are typically more deeply integrated into GVCs.
This paper is structured as follows. Section 2 provides an overview of the extent of India’s integration in
GVCs using macro data. In section 3, we describe our data and the empirical approach to analyze the
relationship between GVC participation and service input use at the firm level. Section 4 presents
descriptive analysis on GVC integration and service input use by firms. Section 5 presents the results of
our estimation on the probability of integrating into GVCs in any mode and service input usage. Section 6
concludes.
2. Background
The GVC participation index as proposed by Koopman et al. (2014; 2010) and subsequently used in
empirical studies is used to measure the GVC participation of India in comparison to other economies. The
cross-country data used to construct the index is from the Trade in Value Added and exports database of
OECD. The participation index considers two sides of GVC -backward participation or the ‘sourcing’ side
and forward participation or the ‘supply’ side. GVC backward participation captures the foreign inputs a
country sources into its production process for exports and is expressed as a ratio of foreign value added
in gross exports to gross exports. The GVC forward participation captures the domestic inputs a country
produces and used in its own production processes and exports, which are in turn not fully absorbed in
the importing country but are embodied in the exports of the importing countries. This is expressed as a
ratio of domestic value added in third country exports to gross exports. Countries place themselves
naturally across these two types of GVC participation. For instance, countries with greater levels of natural
resources are often positioned upstream in GVCs and are likely to develop strong forward linkages as input
providers. Countries with larger market sizes are less likely to import intermediate goods and services
because of their capacity to produce the same, while smaller countries that lack market size usually have
higher backward participation rates. Similarly, countries with an abundance of low-skilled labor generally
have higher backward GVC participation for producing low-skill-intense manufacturing (and services)
activities. See World Bank (2020) for a more in-depth exposition.
India’s participation in manufacturing GVCs is lower than several countries such as Mexico, Malaysia,
Vietnam, the Republic of Korea, Germany, and others. The left panel of Figure 1 shows the GVC
participation in manufacturing on the y-axis, and the scale of exports in natural log scale (of million dollars)
on the x-axis. The extent of GVC trade by a country is determined both by the intensity or participation
index as well as by the scale of participation. While India has a slightly higher manufacturing GVC
participation index compared to China and the United States, the two countries participate in GVCs at a

4
much larger volume, as is evidenced by the value of their gross exports. The manufacturing exports of
China are almost nine times India’s exports while those of the United States are over four times India’s
exports. The right panel of the Figure 1 breaks down the participation index into forward and backward
participation. The forward participation of India in manufacturing GVCs is lower than all comparator
countries with the exception of Mexico (right panel of Figure 1). Manufacturing inputs from India are not
used much by countries in their production processes and exports.
The GVC participation of India in services is lower than that of Korea, Malaysia, the United Kingdom, and
Germany (left panel of Figure 2). While this may seem surprising at first, given the importance of services
exports in India’s exports basket, the decomposition of GVC participation into forward and backward
participation sheds some light on this (right panel of Figure 2).1 The high GVC participation in services of
countries such as Korea and Malaysia is explained by their relatively high backward participation, i.e., the
use of imported inputs in their service exports. On the other hand, the forward GVC participation in India
is higher than most comparator countries with the exception of the United Kingdom, the United States
and Germany. This relatively high forward participation in services GVCs is because of the use of Indian
services including IT and back office services in exports of third countries. Figure 3 depicts the GVC
participation (backward and forward) of the IT and information services industry. India’s specialization in
these IT and information services explains to some extent India’s relatively higher forward linkages.
Figure 1: Manufacturing GVC participation, Gross Exports and Manufacturing GVC participation by Type
Source: OECD; own calculations
1 Business services, particularly IT and other information exports constitute a large share of India’s export basket (Annex Error! Reference source not found.). Business services includes distribution, transport, accommodation, IT-related services, financial services, real estate and other business services such as administration services. Over 40 percent of India’s total gross exports takes place in business services, with IT and other information services accounting for the bulk of the exports. The share of business service exports in total exports is around 46 percent when measured in value-added terms. The IT and information services sector constitute around 22 percent of India’s value-added exports. Value-added shares of business services exports are higher than observed in gross exports of services, which is in line with worldwide patterns of value-added trade. This is because services are an important input provider used by downstream industries. Services are often domestically produced and then exported indirectly into other goods (or services) at the final stages of the value chain or exported as a final good.
ARG
AUS
AUT
BEL
BGR
CANCHE
CHL
COL
CRI
CYP
CZE
DNK
ESP
EST
FIN
FRA
GRC
HKG
HRV
HUN
IDN
IRL
ISL ISR
ITA
JPNKAZ
KHM
LTU
LUX
LVA
MAR
MLT
NLD
NOR
NZL
PER
PHL
POLPRT
ROU
ROW
RUS
SAU
SGP
SVK
SVN
SWE
THA
TUN
TUR
TWNVNM
ZAF
IND
DEUGBR
BRA
MEX
USA
MYS
CHN
KOR
.2.3
.4.5
.6.7
GV
C p
art
icip
ation
(2
01
5)
6 8 10 12 14Gross exports log (2015)
GVC participation and gross exports MANUFACTURING
0.5
0.1
0.4
0.1
0.4
0.2
0.3
0.1
0.3
0.2
0.3
0.1
0.2
0.10.2
0.2 0.2 0.2
0.1
.2.3
.4.5
GV
C p
art
icip
ation
MEX MYS KOR IND DEU GBR CHN BRA USA
Manufacturing
Backward Forward

5
Figure 2: Services GVC participation, Gross Exports and Services GVC participation by Type
Source: OECD; own calculations
Figure 3: GVC Participation for IT and Information Services
Source: OECD TiVA, Own calculations
Outward-oriented economic reforms that took place in India during the 1990s increased service imports
and helped firms access the best available services inputs from abroad. India eased several equity FDI
restrictions in manufacturing and services. Backward GVC participation is positively associated with FDI.
This is one of the conclusions that emerges from the World Development Report (World Bank 2020).
Generally, inward FDI is accompanied by knowledge spill-overs and this facilitates participation in GVCs
(where new knowledge is acquired). FDI also allows for upgrading of existing activities in GVCs. As can be
seen in Figure 4, firms that have foreign ownership import a higher share of their inputs and export a
higher share of their output than wholly domestic owned firms. While foreign ownership restrictions have
been eliminated in several sectors over the years, they remain important for banking, insurance, retail
ARGAUS
AUT
BEL
BGR
CAN
CHE
CHLCOL CRI
CYP
CZE
DNK
ESP
EST
FIN
FRA
GRC
HKG
HRV
HUN
IDN
IRL
ISL
ISR
ITA
JPNKAZ
KHM LTULVA MAR
NLD
NOR
NZLPER
PHL
POL
PRT
ROU
ROWRUSSAU
SGP
SVK
SVN
SWE
THA
TUN
TUR
TWN
VNM
ZAFIND
DEUGBR
BRAMEX USA
MYS
CHN
KOR
0.2
.4.6
GV
C p
art
icip
ation
(2
01
5)
6 8 10 12 14Gross exports log (2015)
GVC participation and gross exports SERVICES
0.2
0.0
0.2
0.0
0.1
0.1
0.1
0.0
0.1 0.1
0.1
0.0
0.1
0.0
0.1
0.0
0.0
0.1
0
.05
.1.1
5.2
GV
C p
art
icip
ation
MYS KOR DEU IND GBR BRA MEX CHN USA
Services
Backward Forward
ARGAUS
AUT
BEL
BGRBRN
CAN
CHE
CHLCOL
CRI
CYP
CZEDNKESP
EST FIN
FRAGRC
HKGHRV
HUN
IDN
IRL
ISL
ISR
ITA
JPNKAZ
KHMLTU
LUX
LVAMAR
MLT
NLD
NOR
NZLPER
PHL POLPRT ROU ROW
RUS
SAU
SGP
SVK
SVNSWE
THA
TUN
TUR
TWN
VNMZAF
INDDEU
GBRBRA
MEX
USA
MYS
CHN
KOR
0.2
.4.6
.8
GV
C p
articip
ation
(2
01
5)
0 5 10Gross exports log (2015)
GVC participation and gross exports IT AND INFO
ARGAUS
AUT
BEL
BGRBRN
CAN
CHE
CHLCOL
CRI
CYP
CZEDNK
ESP
EST FIN
FRA
GRCHKG
HRV
HUN
IDN
IRL
ISL
ISR
ITA
JPNKAZ
KHMLTU
LUX
LVAMAR
MLT
NLD
NOR
NZLPER
PHL POLPRT ROU ROW
RUS
SAU
SGP
SVK
SVNSWE
THA
TUN
TUR
TWN
VNMZAF
INDDEU
GBRBRA
MEX
USA
MYS
CHN
KOR
02
04
06
08
0
Ba
ckw
ard G
VC
pa
rticip
ation
(2
01
5)
0 5 10Gross exports log (2015)
Backward GVC participation and gross exports IT AND INFO
ARGAUS
AUT
BEL
BGRBRN CAN
CHE
CHL
COL
CRI
CYP
CZE
DNK
ESP
EST
FIN
FRA
GRC
HKG
HRV HUNIDN
IRL
ISL
ISR
ITAJPN
KAZKHM
LTU
LUX
LVA
MAR
MLT
NLD
NOR
NZLPER
PHL
POL
PRT
ROUROW
RUSSAU
SGP
SVKSVN
SWE
THATUN
TUR
TWN
VNM
ZAF
INDDEU
GBR
BRA
MEX
USA
MYSCHNKOR
0.5
11
.52
Forw
ard
GV
C p
articip
ation
(20
15
)
0 5 10Gross exports log (2015)
Forward GVC participation and gross exports IT AND INFO

6
distribution, and rail transport services.2 In line with many OECD countries, India has reformed its
manufacturing sectors to allow for more FDI, but restrictions on foreign investments in services have
remained relatively high compared to the OECD average (OECD Service Trade Restrictiveness Index).3
The liberalization of trade and FDI increased the imports of services by the manufacturing sector. The
import service intensity increased from around 5 percent in 1990 up to a high of 21 percent in 2017.
Imports became particularly important for the Automotive and Electronics sectors, as can be seen in the
right panel of Figure 5. In 2017, imports constituted nearly one-third of all services used in the electronics
industry and more than a quarter of all services used in the automobile industry. These two industries
have driven a large part of the upward trend in service imports in manufacturing. In Europe, Transport
equipment is also a high user of imported services, in addition to Textiles and Coke and Chemicals
(Veugelers, et al. 2017). Textiles firms in India on the other hand, import relatively few services compared
to other sectors.
Figure 4: Imports and Exports by Domestic Firms and Foreign owned Firms
Source: Prowess; Own calculations
The general trend across the world is that GVC trade increased rapidly until 2008 and has been declining
since (World Bank 2020; Boris and Mancini 2019). Several macroeconomic reasons have been put forward
to explain this. such as, lower output growth across the world, a plateau effect of the extent to which
production chains can be broken up, the decelerating impact of China and Eastern European countries for
2 However, foreign entry is also limited by other measures which affect foreign investors. For example, there are limits/conditions to the proportion of shares that can be acquired by foreign investors in publicly controlled firms. Also, there are specific requirements for cross-border merger conditions in several sectors. Moreover, in several sectors, there are residency requirements for at least one member of the board and the manager. 3 As per the OECD Services Trade Restrictiveness Index, India is relatively restricted in services trade compared to other OECD and emerging economies. FDI restrictions in services in India are mainly related to equity restrictions, particularly for professional and business services, such as legal services, accounting services, real estate services, and insurance services. Several other services sectors still have some equity restrictions in place, such as retail, media services, as well as engineering and financial services. For all the services sectors in India, limitations on foreign entry, remain significantly higher than the OECD average. The sectors for which foreign entry is still somewhat burdensome include accounting, architecture; legal services; telecommunication; all types of transport services; logistics services; courier (due to postal services limitations); commercial banking; and insurance. Transparency-related barriers in services are the third most important category that explain India’s relatively high STRIs.
0.00
5.00
10.00
15.00
20.00
25.00
domestic minorityforeign
majorityforeign
whollyforeignowned
Import Share (by Ownership Status)
mean median
0.00
5.00
10.00
15.00
20.00
25.00
domestic minorityforeign
majorityforeign
whollyforeignowned
Export Share (by Ownership status)
mean median

7
outsourcing destinations, as well as structural factors such as a lower intense relationship between trade
and output itself (Timmer et al. 2016; Constantinescu et al. 2015).
Figure 5: Increased services import (input) intensity in India after reforms took place (1990-2017)
Source: Prowess; Own calculations. Note: Service import input intensity is measured as share of imported services on total service inputs
3. Data and Empirical Strategy at the Firm Level
To systematically investigate the link between the use of service inputs in the production and a firms’
involvement in GVCs, we use detailed firm-level information from the Prowess database collected by the
Centre for the Monitoring of the Indian Economy (CMIE). Prowess is a panel of large and medium Indian
firms and has information primarily from income statements and annual reports of publicly listed
companies in India. We use data from 1990 to 2017. This data set has been used in several papers (see
Goldberg et al., 2010a, 2010b) and covers approximately around 70 percent of economic activity in India’s
formal industrial sector. Besides financial information for each firm, the data contains information on trade
activities (exports and imports of goods and services), ownership, revenue, expenditure on various inputs
including the different service inputs. The wage bill is measured in relative to the size of a firm. Access to
finance is proxied by financial leverage measured as the ratio of external liabilities to equity. Productivity
is estimated using Ackerberg, Caves and Frazer (2015). Table 1 reports average values for some key
variables.
Table 1: Summary Statistics
Variable Average Unit
Output 2.157 in million Indian Rupees (logged and deflated)
Wage 0.544 in million Indian Rupees (logged and deflated)
Age 24.839 years
Leverage 1.473 liabilities to equity ratio
Productivity 0.002 total factor productivity
Service Intensity 15.230 relative to total expenditures
IT related service intensity 1.360 relative to total expenditures
Complex service inputs 6.590 relative to total expenditures
010
20
30
Serv
ice Im
port
Inte
nsity, in
%
1990 1995 2000 2005 2010 2015year
Automobile Industry Electronic Industry
Textiles and Apparel Chemicals and Pharmaceuticals
8
Identifying the extent of firm integration in GVCs
The detailed firm-level information allows us to measure the depth of GVC integration. A firm’s
involvement in GVCs is identified by looking at the intensity of a firm’s internationalization strategy as
reflected by how many international activities they use in combination, similar to the definition of
Veugelers et al. (2013). The identification is based on three criteria:(1) whether a firm imports at least one-
third of its total intermediate inputs (intensive importer); 4 (2) whether a firm exports at least two-thirds
of total output (intensive exporter); and (3) whether the firm is majority foreign owned or has a majority
stake in companies abroad, or belongs to an international oriented business group, i.e., total exports of
the group is greater than two-thirds of total output or total imported inputs of the group is greater than
one-third of total inputs (has access to international networks).
Several Indian firms belong to international business groups.5 Within such business groups, technological
transfers and knowledge spill-overs facilitate innovation activities, particularly if they also operate
internationally. While remaining an independent enterprise, member firms of business groups have
several horizontal connections such as cross-shareholding, interlocking directorates and social ties, and
vertical connections through shared ownership and control. Members in such business groups are usually
more deeply connected via regional or global value chains than members outside the group. Even if a firm
in a business group exports or imports a small share directly, it may do so much more intensively indirectly
at arm’s length. Often firms form a conglomerate in which one member is a trade agency through which
the firms in the respective group take part in the international market. 6
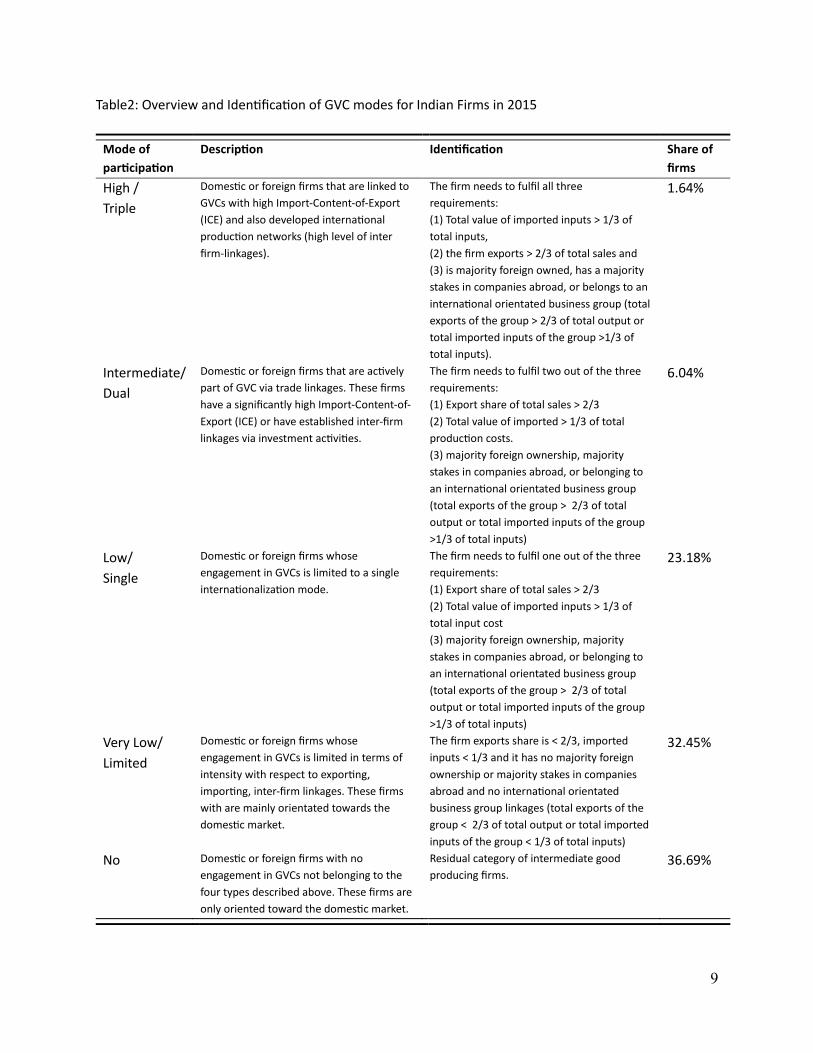
Table 2 provides details on the definitions and identification strategies to categorize firms based on the
depth of their GVC integration. We follow Veugelers et al (2013) and Gereffi and Fernances-Stark (2016)
to define the categories and threshold values. If a firm is purely domestically owned and does not engage
in exporting or importing activities, it is considered as a firm not participating in a GVC. If a firm exports
only a small share of its output (exports < 2/3 of output), its intermediated imports account only for a
limited fraction of total inputs (intermediate imports <1/3 inputs) or if the firm has only limited linkages
to international networks, it is defined as a firm with very low/limited access to GVCs. Firms that fulfill one
of these three criteria (intensively exporting, intensively importing or being well linked internationally) are
considered to be integrated into GVCs at a low depth (single mode). Firms that fulfill two of these three
conditions are regarded as participating in GVCs at an intermediate depth (dual mode). Firms that export
intensively, import intensively and have well established global linkages are considered as highly integrated
into GVCs (triple mode of GVC integration). This implies that foreign content is used in the production,
management linkages are established, and the majority of output is produced for the foreign market.
4 Intermediate inputs include material inputs and as well service inputs. 5 A business group is defined by promoter stake holding, equity ownership holding of a particular individual or family or management control. However, one should note that there is no strict rule to classify a business group. 6 A trade agency is defined as firm operating in the wholesale and retail sector (NIC code 45, 46 and 47) and exports more than 80 percent of its sales.
9
Table2: Overview and Identification of GVC modes for Indian Firms in 2015
Mode of
participation
Description Identification Share of
firms
High /
Triple
Domestic or foreign firms that are linked to
GVCs with high Import-Content-of-Export
(ICE) and also developed international
production networks (high level of inter
firm-linkages).
The firm needs to fulfil all three
requirements:
(1) Total value of imported inputs > 1/3 of
total inputs,
(2) the firm exports > 2/3 of total sales and
(3) is majority foreign owned, has a majority
stakes in companies abroad, or belongs to an
international orientated business group (total
exports of the group > 2/3 of total output or
total imported inputs of the group >1/3 of
total inputs).
1.64%
Intermediate/
Dual
Domestic or foreign firms that are actively
part of GVC via trade linkages. These firms
have a significantly high Import-Content-of-
Export (ICE) or have established inter-firm
linkages via investment activities.
The firm needs to fulfil two out of the three
requirements:
(1) Export share of total sales > 2/3
(2) Total value of imported > 1/3 of total
production costs.
(3) majority foreign ownership, majority
stakes in companies abroad, or belonging to
an international orientated business group
(total exports of the group > 2/3 of total
output or total imported inputs of the group
>1/3 of total inputs)
6.04%
Low/
Single
Domestic or foreign firms whose
engagement in GVCs is limited to a single
internationalization mode.
The firm needs to fulfil one out of the three
requirements:
(1) Export share of total sales > 2/3
(2) Total value of imported inputs > 1/3 of
total input cost
(3) majority foreign ownership, majority
stakes in companies abroad, or belonging to
an international orientated business group
(total exports of the group > 2/3 of total
output or total imported inputs of the group
>1/3 of total inputs)
23.18%
Very Low/
Limited
Domestic or foreign firms whose
engagement in GVCs is limited in terms of
intensity with respect to exporting,
importing, inter-firm linkages. These firms
with are mainly orientated towards the
domestic market.
The firm exports share is < 2/3, imported
inputs < 1/3 and it has no majority foreign
ownership or majority stakes in companies
abroad and no international orientated
business group linkages (total exports of the
group < 2/3 of total output or total imported
inputs of the group < 1/3 of total inputs)
32.45%
No Domestic or foreign firms with no
engagement in GVCs not belonging to the
four types described above. These firms are
only oriented toward the domestic market.
Residual category of intermediate good
producing firms.
36.69%

10
Drivers of GVC Participation
We estimate the probability that a firm chooses a certain mode of internationalization as a function of a
set of firm characteristics, including services usage, and fixed industry and time characteristics. The
intensity of service input usage as well as the composition of services is likely to influence the depth of
integration into GVCs Thus, the probability of choosing a certain depth of GVC integration is estimated by:
𝑃𝑟(𝐺𝑉𝐶 𝑚𝑜𝑑𝑒𝑖𝑠𝑡) = 𝜙(𝛽0 + 𝛾1𝑠𝑒𝑟𝑣𝑖𝑐𝑒 𝑖𝑛𝑝𝑢𝑡 𝑖𝑛𝑡𝑒𝑛𝑠𝑖𝑡𝑦𝑖𝑠𝑡−1 + 𝛤1(𝑍𝑖𝑠𝑡−1) + +𝛿𝑡 + 𝛿𝑠) (1)
where 𝐺𝑉𝐶 𝑚𝑜𝑑𝑒𝑖𝑠𝑡 is the chosen depth of GVC integration of firm 𝑖 operating in sector 𝑠 at time 𝑡.
The mode of GVC integration is a function of firm characteristics 𝑍 including a firms’ size measured by its
(log) output level, age, the (log) wage per value added, (log) total factor productivity and (log) financial
leverage as a proxy for access to finance. With the help of these control variables, we take into account
that larger, more established, more productive firms are usually more deeply engaged in GVCs. Further,
we take into account the degree of servicification of the firm by including the expenditures on service
inputs.
To account for potential reverse causality and endogeneity issues, we use the lag values of the respective
service inputs and control variables to identify the correlation between the use of service inputs and the
likelihood to integrate in a specific depth in GVCs. Moreover, sector fixed effects (𝛿𝑠) are included to
account for sector-specific heterogeneity and year fixed effects (𝛿𝑡) to capture unobserved aggregated
shocks. This selection equation is estimated using an ordered logit model. Since fixed effects controlling
for time invariant firm characteristics cannot be directly included in this type of nonlinear estimation, an
alternative specification included a demeaned version, following Mundlak (1978) and Chamberlain (1980),
and a differenced version of the equation is estimated.7
4. Descriptive Analysis of GVC Participation and Service Usage
We present a brief descriptive analysis of the characteristics of firms in India focusing, in particular, on
their GVC integration and their use of service inputs.
GVC participation at the firm level
In our sample, only a small share (1.6 percent) of firms are triple mode firms (high GVC involvement) and
around 6 percent are dual (intermediate) mode firms. Single (low) mode firms make up 23.18 percent of
the total firms. The largest shares of firms belong to the category of limited GVC participation (32.45
percent) and no GVC participation (36.69 percent).
The extent to which firms are integrated into international markets and GVCs varies across sectors and
locations.8 Figure 6 and Figure 7 show the distribution of firms across sectors and industries for different
7Differentiating reveals underlying trends. Age and dummy variables are used in levels. 8 One should note that firms tend to cluster in economic centers in India. Large and medium sized firms can mainly be found in Gujarat, Maharashtra, NCT of Delhi, Tamil Nadu, West Bengal, Telangana, and Karnataka.

11
levels of international market integration and GVC participation for the year 2015. In general, the share of
firms, which are active in exporting and importing, is higher in the manufacturing sector than in the service
sector.9 Electronics and IT-services are two industries which are deeply integrated into GVCs, i.e., these
two sectors have a relatively larger share of double and triple mode firms (firms integrated at an
intermediate and high level).
The automobile industry is highly engaged in regional and global value chains. More than three-quarters
of all firms in the automobile industry engage at least with a single mode in international markets. Around
half of all firms in the automobile sector are exporters only. However, many of them export only a smaller
fraction of their total sales and are as such only integrated at a limited degree in GVCs. In contrast, in the
electronics industry, nearly half of all firms are exporters and importers, and 15 percent of them are deeply
integrated into GVC (intermediate and high GVC integration). More than two-thirds of the firms in the
industry participate in international markets by exporting or importing, or both. The industry is also well
connected in international distribution networks. Firms in the textile and apparel industry are highly active
in exporting activities and typically export a substantial share of their sales, directly or at arms-length.
However, less than 5 percent of the firms are deeply integrated into GVCs. Nearly half of all firms in the
chemical and pharmaceutical industry both export and import. However, since only a small fraction of
these firms are foreign owned or own foreign affiliates abroad, only around 10 percent of these firms are
deeply integrated into GVCs.
In the service sector, around 54 percent of all firms participate in international markets, half of them export
and import some of their services and are deeply integrated into GVCs. One-quarter of all firms in the
Business Service Sector are active exporters and importers, while one-quarter of all firms in the Business
Service Sector only engages in importing activities.10 In particular, firms in the IT service industry engage
heavily in export and import activities.11 Around 50 percent of all firms in the IT service sector export and
import and more than 15 percent of them are deeply integrated into GVCs.
Table 3 presents the average values of some key variables by the mode of GVC integration. As can be seen
from the table, firms deeper integrated in GVCs (intermediate and high GVC participation) are typically
larger (as measured in terms of output and wage bills) and more productive. They are generally older and
more established in terms of having more years of experience in the market. Moreover, they have a higher
financial leverage ratio, i.e., they have a relatively higher share of loans or credit purchases from external
sources.
9 Note that in general many firms in the service sector drop out of the sample due to the lack of information on many essential variables, in particular for approximating productivity. In particular, many smaller service firms, which potentially operate only domestically drop out of the sample, leading to a potential overestimation of GVC participation/ international market integration. The reporting is particularly good for firms in the business service sector, including the IT service sector such that the shares in these sectors seem to be reliable. 10 Firms in the Business Service sector include firms in the telecom, information service, finance and insurance, real estate, renting of machinery, computer and related activities, IT services, auditing activities, legal, accounting book-keeping and auditing services, tax consultancy, market research, advertising and marketing activities, and management services. 11 The IT service sector includes computer, programming and related services, IT services and information services.

12
Figure 6: Different stages of GVC involvement for Indian firms in 2015 (in %), by sector
Figure 7: Different types of international market integration for Indian firms in 2015 (in %), by sector
Table3: Average Output, wage, age, productivity, financial leverage by GVC mode
GVC Mode Output Wage Age Productivity Leverage
No 1.187 0.159 20.713 -0.149 1.271
Very Low 2.277 0.550 22.609 0.040 1.562
Low 2.585 0.739 25.525 0.059 1.502
Intermediate 3.087 0.989 25.947 0.094 1.616
High 3.019 0.867 25.931 0.189 1.656
No of observations 73098 73098 72836 73098 72411
Note: Calculation based on all years. Output and wage are in million Indian Rupees (logged and deflated). Productivity is measured by TFP constructed following the methodology of Ackerberg, Caves and Frazer (2015). Financial leverage is measured as liabilities to equity ratio
27.2310.57
18.4428.45
20.9833.39
25.411.69
37.53
49.43 39.11
45.0747.33
38.5937.62
31.17
25.29 32.8324.58
22.2521.97 20.53
28.3
36.36
7.86 7.1714.53
3.66 8.7 6.58 6.4314.29
2.1 0 3.35 0.56 1.02 0.91 2.25 6.49
0
10
20
30
40
50
60
70
80
90
100
Manufacturing Automobile Electronics Textiles Chemical Services Business IT-services
No GVC participation Limited Low Intermediate High
29.8
8.322.91
30.7 26.03
45.97 41.48
18.18
4.24 50.19
2.23
3.945.43
2.633.22
9.09
17.77
30.57
26.82 9.3 18.66
26.47 31.19
23.38
48.19
10.94
48.0456.06
49.88
24.93 24.12
49.35
0
10
20
30
40
50
60
70
80
90
100
Manufacturing Automobile Electronics Textiles Chemical Services Business IT-services
Domestic Market Only Exporter Only Importer Only Exporter and Importer

13
Service usage
Table 4 shows the share of services in the total expenses of Indian firms. Service inputs include
expenditures incurred for royalties, technical know-how, license fees, research and development, rent &
lease rent, selling & distribution, finance and insurance, outsourced manufacturing and outsourced
professional jobs, travel and communication expenses, and repair and maintenance. The service intensity
measures the intensity of services used in the production, i.e., the share of expenditures on service inputs
relative to total expenditures.
On average, firms only focusing on the Indian domestic market, spend 14.7 percent of their total
expenditures on services, while firms highly integrated into GVCs spend, on average, 16.4 percent of their
expenditure on services. Complex service inputs, in particular, expenditures on outsourced professional
jobs and financial services make up nearly half of the average spending on service inputs for firms. The use
of complex services, which are services that are considered as having a greater level of production
complexity because of its higher fixed training costs (Costinot, 2009), are much greater for firms with high
levels of GVC participation or triple mode firms, although the relationship is less strong for the other GVC
types. An independent t-test (accounting for different variances across firms participating in GVCs) was
run to determine if there are statistically differences in the respective service intensities between firms
not participating in GVCs and firms participating in GVCs in different stages of integration, and among firms
participating in GVCs at different stages of integration. The results show that firms deeper integrated into
GVCs have statistically significant higher shares of expenditures on services, have a significant higher share
of spending on R & D, use higher IT related services and have a significant higher import service intensity.
Considering that firms participating in GVCs dominate the manufacturing output in India, this statistically
significant difference, even if it seems small, has economic significance.
Firms deeply integrated in GVCs have a higher intensity of use of IT service inputs. IT and IT enabling
services include services related to technical knowhow and licenses, outsourced professional IT jobs and
IT related research and development. On average, the intensity of IT services is 1.19 for firms with no GVC
participation. This increases to 1.52 for firms with low GVC participation, 1.86 for firms with intermediate
GVC participation and is the highest for the high GVC integrated firms at 2.33. The composition of service
expenditure also confirms the pattern on the importance of IT service inputs for GVC integration. While
considering the share of IT service expenditure in total services expenditure, the data reveals that IT
services make up 6.33 % of the total expenses on services for firms not participating in GVCs. This share
of IT expenses in total services expenses becomes 8.50% for firms with low GVC participation and 10.78%
for intermediate GVC integrated firms. Firms highly integrated into GVCs spend on average, 11.7% of their
expenditure of services on IT services. Note that this pattern is not driven by IT firms. See Table A.2 in the
Annex for more details on sectoral differences in the use of IT services.
Similar patterns are observed for the R & D intensity of service use. Firms not participating in GVCs have
an average R & D intensity of 0.31. This doubles to 0.62 for intermediate GVC integrated firms and is 1.13
for firms that are highly integrated into GVCs. This finding is also in line with the findings for European
firms. In Veugelers et al. (2013), the authors find that their indicator of product innovation is positively
associated with higher levels of GVC participation of firms across the different modes. Therefore,

14
consistent with European firms, in India, firms that are more involved in GVCs are also most likely to be
active in innovative activities. The overall share of imported services in total expenses also increases with
the depth of integration into GVCs as can be seen in the last column of the table.
Table 4: Services as Share of Total Expenses (in %) for Indian Firms
Service
Intensity
R & D
intensity
IT related
service
intensity
Complex
service
inputs
Imported
service
intensity
No GVC participation 14.68 0.31 1.19 7.00 0.00
Very Low 15.16 0.4 1.28 6.28 12.94
Low 15.81 0.45 1.52 6.53 14.74
Intermediate 16.00 0.62 1.86 6.39 21.3
High 16.36 1.13 2.33 7.33 26.42
Average 15.23 0.4 1.36 6.59 9.96
Note: Service intensity is defined as service inputs relative to total expenditures.
There are differences across sectors in the intensity with which they use service inputs, as can be seen in
Annex Table A.2. The electronics industry uses service inputs (as well more complex service inputs) more
intensively compared to other manufacturing industries. The electronics industry imports more than 16
percent of their service inputs. The Sector not only heavily sources service inputs from international
markets (around 43 percent of total service inputs), it also earns mainly from their services exports to
international markets. Around 53.22 percent of total income are earned from service exports and 97
percent of exports are services. The automobile sector also imports a larger fraction of their service inputs
compared to other manufacturing industries. The chemical and pharmaceutical industry uses a large share
of complex services (6.35% of all service are complex services) like the electronics and car industry, but
predominantly sources its service inputs domestically. The industry however provides services along with
goods. Nearly a quarter of the exports of the chemical and pharmaceutical industry are service exports.
The relatively low share of imported services for textiles is notable and is consistent with the low share of
“importers only” firms in this sector. This sector also has the lowest use of IT-related services as well as
R&D services.
5. Service Inputs and the Extent of GVC Integration
The intensity of service input usage as well as the composition of services determine the depth of
integration into GVCs. The probability that a firm chooses a certain mode of internationalization is a
function of a set of firm characteristics, including services usage, and fixed industry and time
characteristics. The results from estimating Equation 1 are presented in Table 5. The baseline is presented
in column (1), the demeaned version in Column (2) and the differenced version in Column (3). Firms that
are highly productive, larger in size, pay a higher wage per value added, and are older are more deeply
integrated into GVCs. Further, firms that are financially more open and less restricted in obtaining external
finance, which is reflected in a higher external debt to equity ratio, are more deeply integrated into GVCs.
15
Moreover, the estimation reveals that Indian firms using service inputs intensively are typically more
deeply integrated into GVCs. The results in Columns (4), (5) and (6) suggest that this seems to be driven
by complex and IT and IT-enabling services. Thus, the use of more sophisticated service inputs is
associated with a higher probability of being integrated into GVCs at a deeper mode.
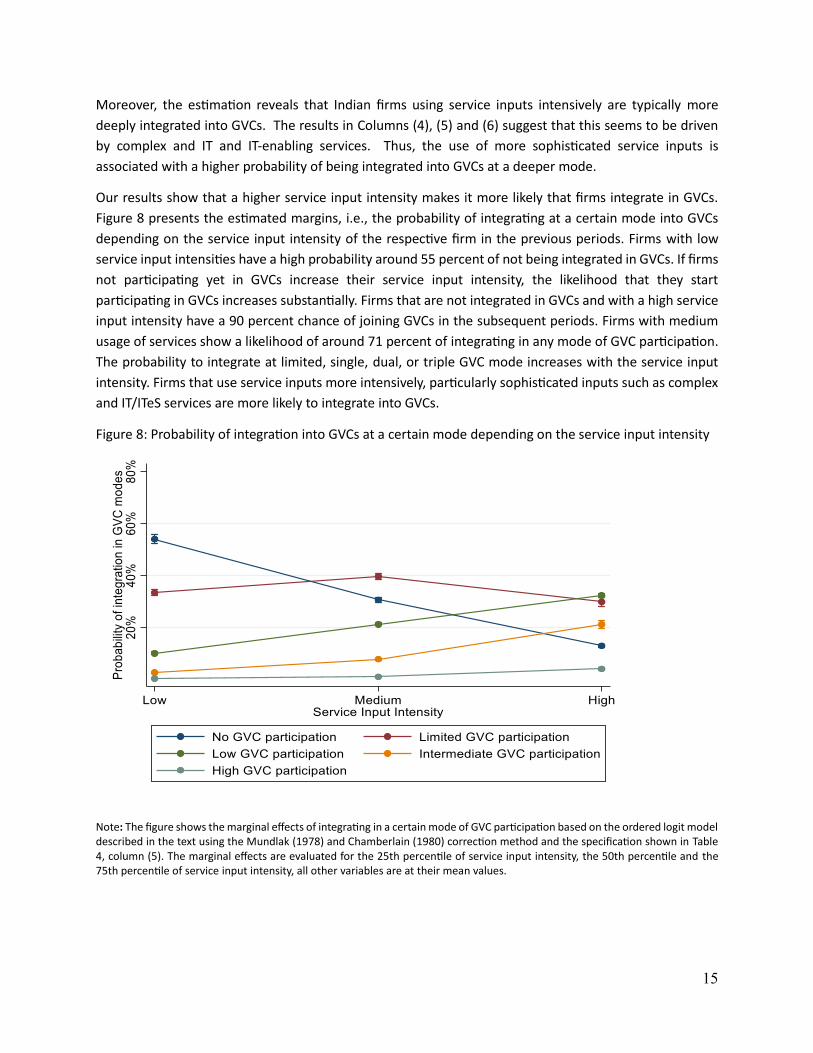
Our results show that a higher service input intensity makes it more likely that firms integrate in GVCs.
Figure 8 presents the estimated margins, i.e., the probability of integrating at a certain mode into GVCs
depending on the service input intensity of the respective firm in the previous periods. Firms with low
service input intensities have a high probability around 55 percent of not being integrated in GVCs. If firms
not participating yet in GVCs increase their service input intensity, the likelihood that they start
participating in GVCs increases substantially. Firms that are not integrated in GVCs and with a high service
input intensity have a 90 percent chance of joining GVCs in the subsequent periods. Firms with medium
usage of services show a likelihood of around 71 percent of integrating in any mode of GVC participation.
The probability to integrate at limited, single, dual, or triple GVC mode increases with the service input
intensity. Firms that use service inputs more intensively, particularly sophisticated inputs such as complex
and IT/ITeS services are more likely to integrate into GVCs.
Figure 8: Probability of integration into GVCs at a certain mode depending on the service input intensity
Note: The figure shows the marginal effects of integrating in a certain mode of GVC participation based on the ordered logit model described in the text using the Mundlak (1978) and Chamberlain (1980) correction method and the specification shown in Table 4, column (5). The marginal effects are evaluated for the 25th percentile of service input intensity, the 50th percentile and the 75th percentile of service input intensity, all other variables are at their mean values.

16
Table 5: Selection into GVC participation
(1) (2) (3) (4) (5) (6)
VARIABLES
Demeaned
(Mundlak- Chamberlain
correction) Differenced
Demeaned
(Mundlak-
Chamberlain
correction) Differenced
TFP 0.2030*** 0.0774*** 0.0128 0.1503*** 0.0065 0.0139
(0.0240) (0.0228) (0.0173) (0.0243) (0.0209) (0.0172)
Size 0.5443*** 0.4659*** 0.1167*** 0.6176*** 0.4650*** 0.1201***
(0.0219) (0.0284) (0.0291) (0.0227) (0.0294) (0.0292)
Wage Per Value Added 0.1591*** 0.1224*** 0.2068*** 0.0282 0.1111** 0.2991***
(0.0435) (0.0470) (0.0693) (0.0451) (0.0484) (0.0693)
Financial Leverage 0.0093 0.0345* 0.0744*** 0.0067 0.0663*** 0.0739***
(0.0191) (0.0199) (0.0216) (0.0192) (0.0233) (0.0216)
Age 0.0027*** 0.0713*** 0.0135*** 0.0031*** 0.0745*** 0.0135***
(0.0009) (0.0045) (0.0009) (0.0009) (0.0046) (0.0009)
Service Input Intensity 0.6054*** 0.1243*** 0.0786*** 0.0942*** 0.1169*** 0.0806***
(0.0229) (0.0215) (0.0183) (0.0230) (0.0231) (0.0186)
Complex Service Intensity 0.0776*** 0.0810*** 0.0015
(0.0178) (0.0166) (0.0137)
IT Service Intensity 0.2238*** 0.0480*** 0.0172**
(0.0138) (0.0126) (0.009)
Observations 106,102 106,102 84,135 106,012 106,012 84,053
R-squared 0.1323 0.1407 0.0363 0.1368 0.1458 0.0364
Number of company_code 16,417 16,417 13,695 16,114 16,114 13,952
Note: The dependent variable is the depth of GVC integration. All variables are lagged by one year. The size of a firm is measured by log annual sales. Complex services intensity is measured as log share of expenditures of complex services on total service expenditures. Industry and year fixed effects are included in all specifications. The sample includes all manufacturing and service firms and spans the years from 1995 to 2016. In column (2) all variables are demeaned at firm level to take out firm heterogeneity, column (3) accounts for firm heterogeneity by differencing the variables. Standard errors clustered at firm level in parentheses. *** p<0.01, ** p<0.05, * p<0.1.

17
6. Concluding Remarks
Indian firms in GVCs play an important role in the economy. They account for a disproportionate share of
total output and exports and have a significant productivity premium over firms that do not participate in
GVCs (Manghnani et. al 2021). However, there is potential to further increase the integration of Indian
firms in GVCs so they may reap the benefits of specialization, scale, and access to global markets.
The intensity of service input use as well as the composition of services determine the depth of integration
into GVCs. Firms that are highly productive, larger in size, pay a higher wage per value added, have a higher
leverage ratio and are older are more likely to be more deeply integrated into GVCs. Firms with low service
input intensities have a high probability of not being integrated in GVCs. If firms not participating in GVCs
increase their service input intensity, the likelihood that they begin participating in GVCs increases
substantially. The probability to integrate at limited, single, dual, or triple GVC mode increases with the
service input intensity. Moreover, the composition of services matters for GVC integration. Indian firms
using service inputs intensively, particularly complex and IT and IT-enabling services, are typically more
deeply integrated into GVCs. Thus, the more sophisticated are the service inputs used, the more likely
firms will integrate at a deeper mode into GVCs.
As services play a crucial role in GVCs, both as an input in the production process as well as a coordination
facilitator, the findings in the paper point to a clear role for policy makers. Facilitating the use of high-
quality services, liberalizing the service sector, removing various types of policy barriers related to services,
strengthening the institutional framework including contract enforcement mechanisms, and enhancing
human capital, which is crucial for the provision of more sophisticated services, will enable India to
strengthen GVC participation and profit from the associated economic benefits.
18
References
Ackerberg, D., K. Caves and G. Frazer (2015) “Identification Properties of Recent Production Function
Estimators”, Econometrica, Vol. 83, Issue 6, pages 2411-2451.
Antràs, P and D. Chor (2012) “Organizing the Global Value Chain”, NBER Working Paper No. 18163,
Cambridge MA: National Bureau of Economic Analysis.
Arnold, J., B. Javorcik and A. Mattoo (2011) “The Productivity Effects of Services Liberalization: Evidence
from the Czech Republic”, Journal of International Economics, Vol. 85, No. 1, pages 136-146.
Arnold, J., B. Javorcik, M. Lipscomb and A. Mattoo (2015) “Services Reform and Manufacturing
Performance: Evidence from India”, The Economic Journal, Vol. 126, Issue 590, pages 1-39.
Chamberlain, G. (1980) “Analysis of Covariance with Qualitative Data”, The Review of Economic Studies,
Vol. 47, No. 1, pages 225-238.
Constantinescu, C, A Mattoo and M Ruta (2015) “The Global Trade Slowdown: Cyclical or Structural?”,
World Bank Policy Research Working Paper No. 7158, Washington DC: The World Bank.
Costinot, A. (2009). “On the Origins of Comparative Advantage.” Journal of International Economics 77
(2): 255–64.
Francois, J. (1990a) “Producer Services, Scale and the Division of Labor”, Oxford Economic Papers, Vol. 42,
No. 2, pages 715-29.
Francois, J. (1990b) “Trade in Producer Services and Returns Due to Specialization under Monopolistic
Competition,” Canadian Journal of Economics, Vol. 23, No. 1, pages 109-24.Gereffi, G. and K.
Fernances-Stark (2016) “Global Value Chain Analysis: A Primer”, Duke University, North Carolina,
USA: Center on Globalization, Governance & Competitiveness (CGGC).
Goldar, B., R Banga, Banga, K. (2018) “India’s Linkage into Global Value Chains: The Role of Imported
Services”, India Policy forum
Goldberg, P. K., Khandelwal, A., Pavcnik, N. and Topalova, P. (2010a) “Imported Intermediate Inputs and
Domestic Product Growth: Evidence from India”, The Quarterly Journal of Economics, Vol. 125, Issue,
4, pages 1727-1767.
Goldberg, P. K., Khandelwal, A., Pavcnik, N. and Topalova, P. (2010b) “Multiproduct Firms and Product
Turnover in the Developing World: Evidence from India”, The Review of Economics and Statistics, Vol.
92, No. 4, pages 1042-1049.
Jones, R.W. and H. Kierzkowski (1990) “The Role of Services in Production and International Trade: A
Theoretical Framework” in R. Jones and A. Kruger (eds.), The Political Economy of International Trade
(pp. 31–48). Oxford, UK: Blackwell
Koopman, R., W. Powers, Z. Wang and S. Wei, 2010. ‘Give Credit Where Credit is Due: Tracing Value-added
in Global Production Chains.’ NBER Working Paper, No. 16426.
Koopman, R., Z. Wang and S. Wei, (2014). ‘Tracing Value-Added and Double Counting in Gross Exports.’
American Economic Review, 104(2): 459-94.

19
Manghnani, R., B. Meyer., S. Saez., E. van Der Marel (2021) “Firm Performance, Participation in Global
Value Chains and Service Inputs: Evidence from India”, World Bank
Miroudot, S. and C. Cadestin (2017), “Services in Global Value Chains: From Inputs to Value-Creating
Activities”, OECD Trade Policy Papers, No. 197, OECD Publishing, Paris.
Mundlak, Y. (1978) “On the Pooling of Time Series and Cross Section Data”, Econometrica, Vol. 46, No. 1,
pages 69-85.
Timmer, M P, B Los, R Stehrer and G J de Vries (2016) “An Anatomy of the Global Trade Slowdown based
on the WIOD 2016 Release”, GGDC research memorandum number 162, University of Groningen.
Veugelers, R., F. Barbiero and M. Blanga-Gubbay (2013) “Meeting the Manufacturing Firms Involved in
GVCs”, in Veugelers, R. (ed), Manufacturing Europe's future. Brussels: Bruegel.
World Bank (2020) “Global Value Chains Trading for Development”, World Bank World Development
Report 2020, Washington DC: World Bank.

20
Annex
Table A.1: India Gross and (Domestic) Value-Added Exports
Gross Exports Value Added Exports
Industry Share of
total
Mean
growth
Share of
total
Mean
growth
Total economy 100 8.7 100 9
Total manufacturing 54.8 8.8 50.3 9
Total business sector services 41.6 8.8 45.8 9.1
Chemicals and non-metallic mineral products 16.3 9.5 14 10
Textiles, wearing apparel, leather and related products 9.1 6.2 9.4 6.3
Motor vehicles and other transport 4.4 15.3 4.1 15.7
Computers, electronic and electrical equipment 3.2 11.2 2.6 11.6
IT and other information services 19.6 11 22.1 11.3
Professional services 5.2 7.1 5.7 7.3
Source: OECD TiVA, Note - average annual growth rate between 2005 and 2016; Business services includes distribution, transport, accommodation, IT-related services, financial services, real estate and other business services such as administration services.
Table A.2: Services as share of total expenses (in %) by industry
Service
Intensity
R & D
input
intensity
IT related
service
input
intensity
Complex
service
input
intensity
Imported
service
intensity
Export
service
intensity
Automobile Industry 12.91 0.44 1.41 5.15 14.52 12.91
Electronics Industry 15.31 0.72 1.93 6.94 16.60 15.31
Textiles & Apparel Industry 13.27 0.05 0.44 6.33 6.20 13.27
Chemicals & Pharmaceuticals 14.94 1.00 1.69 6.35 9.17 23.24
Business Service Sector 25.67 0.35 4.19 13.16 21.80 94.09
IT Service Sector 24.57 0.93 5.85 11.22 42.97 97.32
Source: Prowess; Own calculations.