INTEGRATED REPORT - Foskor - Home Reports/Integrated Report 2016.pdfThis integrated annual report is...
92
INTEGRATED REPORT 2016
-
Upload
nguyencong -
Category
Documents
-
view
229 -
download
0
Transcript of INTEGRATED REPORT - Foskor - Home Reports/Integrated Report 2016.pdfThis integrated annual report is...
INTEGRATED REPORT 2016
INT
EG
RA
TE
D R
EP
OR
T 2016
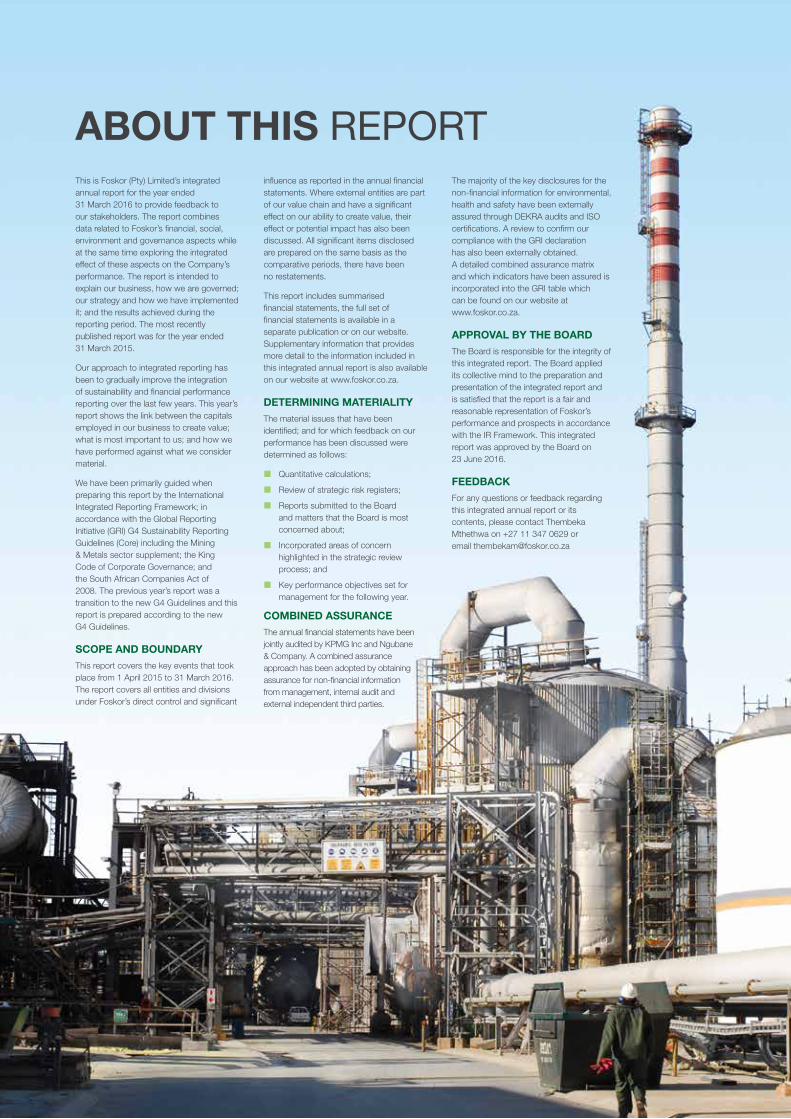
This is Foskor (Pty) Limited’s integrated annual report for the year ended 31 March 2016 to provide feedback to our stakeholders. The report combines data related to Foskor’s financial, social, environment and governance aspects while at the same time exploring the integrated effect of these aspects on the Company’s performance. The report is intended to explain our business, how we are governed; our strategy and how we have implemented it; and the results achieved during the reporting period. The most recently published report was for the year ended 31 March 2015.
Our approach to integrated reporting has been to gradually improve the integration of sustainability and financial performance reporting over the last few years. This year’s report shows the link between the capitals employed in our business to create value; what is most important to us; and how we have performed against what we consider material.
We have been primarily guided when preparing this report by the International Integrated Reporting Framework; in accordance with the Global Reporting Initiative (GRI) G4 Sustainability Reporting Guidelines (Core) including the Mining & Metals sector supplement; the King Code of Corporate Governance; and the South African Companies Act of 2008. The previous year’s report was a transition to the new G4 Guidelines and this report is prepared according to the new G4 Guidelines.
ScOPE AND bOuNDARyThis report covers the key events that took place from 1 April 2015 to 31 March 2016. The report covers all entities and divisions under Foskor’s direct control and significant
influence as reported in the annual financial statements. Where external entities are part of our value chain and have a significant effect on our ability to create value, their effect or potential impact has also been discussed. All significant items disclosed are prepared on the same basis as the comparative periods, there have been no restatements.
This report includes summarised financial statements, the full set of financial statements is available in a separate publication or on our website. Supplementary information that provides more detail to the information included in this integrated annual report is also available on our website at www.foskor.co.za.
DETERmINING mATERIAlITy The material issues that have been identified; and for which feedback on our performance has been discussed were determined as follows:
¢¢ Quantitative calculations;
¢¢ Review of strategic risk registers;
¢¢ Reports submitted to the Board and matters that the Board is most concerned about;
¢¢ Incorporated areas of concern highlighted in the strategic review process; and
¢¢ Key performance objectives set for management for the following year.
cOmbINED ASSuRANcE The annual financial statements have been jointly audited by KPMG Inc and Ngubane & Company. A combined assurance approach has been adopted by obtaining assurance for non-financial information from management, internal audit and external independent third parties.
The majority of the key disclosures for the non-financial information for environmental, health and safety have been externally assured through DEKRA audits and ISO certifications. A review to confirm our compliance with the GRI declaration has also been externally obtained. A detailed combined assurance matrix and which indicators have been assured is incorporated into the GRI table which can be found on our website at www.foskor.co.za.
APPROvAl by ThE bOARD The Board is responsible for the integrity of this integrated report. The Board applied its collective mind to the preparation and presentation of the integrated report and is satisfied that the report is a fair and reasonable representation of Foskor’s performance and prospects in accordance with the IR Framework. This integrated report was approved by the Board on 23 June 2016.
FEEDbAckFor any questions or feedback regarding this integrated annual report or its contents, please contact Thembeka Mthethwa on +27 11 347 0629 or email [email protected]
AbOuT ThIS report
FOSKOR INTEGRATED REPORT 2016
ABOUT THIS REPORT 1
hOw wE PERFORmED
whO wE ARE
whERE wE OPERATE
hOw wE OPERATEHOW WE ARE STRUCTURED 9WHO LEADS US 10
hOw wE cREATE vAluE
OuR kEy STAkEhOlDERSVALUE ADDED STATEMENT 20
OuR STRATEGIc REvIEwCHAIRMAN’S STATEMENT 24CEO’S REVIEW 26
hOw wE mANAGE RISkOUR RISK MANAGEMENT PROCESS 33OUR MATERIAL ISSUES 38OUR STRATEGIC RESPONSE 38
cONTENTS2
GOvERNANcE AND REmuNERATION42 GOVERNANCE
48 REMUNERATION
FINANcIAl REvIEw53 CFO’S REPORT
58 SUMMARY FINANCIAL STATEMENTS
OPERATIONAl PERFORmANcE65 MINING DIVISION
71 MINE RESOURCES AND ORE RESERVES73 ACID DIVISION81 OUR PEOPLE
84 SOCIAL
GlOSSARy
6
9
4
This integrated annual report is cross-referenced with other sources of information.
12
16
22
33
42
53
65
87
More information about Foskor and its activities can be found on the Company’s website, www.foskor.co.za
Refer to page numbers elsewhere in the integrated annual report

FOSKOR INTEGRATED REPORT 2016
2
AcID PRODucTIONbelow target by
44%
GRANulATION PRODucTION below target by
50%
mAGNETITE SEllING PRIcES reduced by (year-on-year)
14%
PhOSPhORIc AcID sales volumes reduced by (year-on-year)
41%
chAllENGESkEy AchIEvEmENTS
hOw wE performed
ZERO FATAlITIES in both divisions
lOST TImE INjuRy rate improved to 0.17
retention of ISO cERTIFIcATIONS
EbIDTA improved by 148%
SEcuRED FuNDING for the Asset replacement programme
Certified TOP EmPlOyER for the 6th time in a row
Continued reduction in FRESh wATER cONSumPTION

FOSKOR INTEGRATED REPORT 2016
3hOw wE PERFORmED
for the year ended 31 March 2016 % change 2015 2014
Financial Revenue (Rm) 5 918 12 5 297 5 086
EBIT (Rm) (296) 29 (419) 118
EBITDA (Rm) 54 148 (113) 389
Cash (utilised by)/generated from operations (Rm) (51) 57 (118) 346
Free cash flow (Rm) (449) (25) (360) (445)
Production Phosphate rock (k tons) 1 876 (5) 1 983 2 164
Phosphoric acid (k tons) 307 (22) 393 510
Granulation (k tons) 198 (33) 297 307
People Number of employees 2 003 5 1 913 1 997
Employee turnover (%) 6 – 6 10
Women representation in senior management (%) 14 – 14 14
Total training spend (Rm) 8 (20) 10 12
Safety Fatalities – – – 1
Lost Time Injury Rate 0.17 (53) 0.36 0.29
Occupational diseases 3 (70) 10 18
Environment Fresh water consumption (‘000 m3) 14 692 (3) 15 108 16 455
communities CSI spend (Rm) 7 – 7 5

FOSKOR INTEGRATED REPORT 2016
4
To deliver on our customer prom
ise we show resolve, act responsibly, earn respect and sh
ow re
cogn
ition
thro
ugh
shar
ed re
war
ds.
whO wE Are
Foskor is a producer and exporter of phosphate rock, phosphate-based fertilisers and phosphoric acid.
We are based in South Africa and employ a total of 2 003 people spread across the phalaborwa mining division, the richards Bay Acid division and the head office in midrand.
whAT wE PRODucEWe mine phosphate rock in Phalaborwa and transfer it by rail to our Richards Bay facility, where we use it to produce phosphoric acid and granular fertilisers – MAP (mono-ammonium phosphates); DAP (di-ammonium phosphates); and MAPz (MAP with zinc). We also produce sulphuric acid, which is used in the production of phosphoric acid, and sell it in limited quantities. Foskor also have magnetite, a by-product of phosphate beneficiation which was produced in the past and stored in the form of a stock pile. Currently, there is no magnetite produced in the process. We also have a facility for blending a variety of additional nitrogen phosphate and potassium (NPK) bulk products.
OuR mARkETSWe are the leading domestic producer and supplier of phosphate-based granular fertilisers. Beyond serving the local market, we supply phosphoric acid and fertilisers to international markets, particularly India, the world’s largest market for phosphoric acid. While the bulk of our phosphate rock concentrate is used in our phosphoric acid manufacturing plant, we export and sell limited amounts to other fertiliser producers worldwide. We also sell magnetite and sulphuric acid domestically and abroad.
to be a globally recognised and efficient beneficiator of phosphates in a responsible manner for the benefit of all our stakeholders
We will create value and profit by converting opportunities with determination, responsibility and sustainability
We openly declare that any business dealings with foskor will be: ¢¢ Conducted with foskor’s competitive advantage always in mind;¢¢ Conducted responsibly and according to the highest standards; and ¢¢ Show recognition fairly and consistently
vISION
mISSION
vAluES

FOSKOR INTEGRATED REPORT 2016
ABOUT THIS REPORT 5
FOSkOR INTEGRATED REPORT 2016
whO wE ARE 5
Showing
recognition means we believe in shared reward
To deliver on our customer prom
ise we show resolve, act responsibly, earn respect and sh
ow re
cogn
ition
thro
ugh
shar
ed re
war
ds.
Showing resolve means we are determined to continually improve in everything we do.
Acting responsibly means that we believe in being held responsible to ourselves, our shareholders, our communities and our environment.
earning respect means we believe that we will excel as a team by respecting diversity.

FOSKOR INTEGRATED REPORT 2016
whERE wE OPERATE AND SELL TO
121% increase y-o-y13.57% share in revenue
495% increase y-o-y 66.33% share in revenue
139% increase y-o-y2.93% share in revenue
mIDDlE EASTR244m REvENuE
(phosphoric acid)
EuROPE R1 126m REvENuE (rock, phosphoric acid)
SOuTh AFRIcAR5 561m REvENuE
(phosphoric and sulphuric acid, NpK, granulation)
cORPORATE hEAD OFFIcEMidrand, Gauteng
22
OThER AFRIcA cOuNTRIESR81m REvENuE
(Granulation)
100% increase y-o-y 0.97% share in revenue
SOuTh AmERIcA R227m* REvENuE
(phosphoric acid, granulation)
100% increase y-o-y 2.73% share in revenue
6

FOSKOR INTEGRATED REPORT 2016
7whERE wE OPERATE
FAR EASTR535m REvENuE
(magnetite, rock)
10% decrease y-o-y5.41% share in revenue
INDIAR473m REvENuE
(phosphoric acid)
57% increase y-o-y5.70% share in revenue
Phosphert Marine 100%
Phosphate Shipping 100%
FOSkOR ZIRcONIAPhalaborwa, Limpopo
96
AcID DIvISIONRichards Bay, KZN
665
mINING DIvISIONPhalaborwa, Limpopo
1 220
¢¢ phosphate rock 2.6mt* (46.90% contribution)#
¢¢ magnetite (4.77% contribution)#
¢¢ electro-fused zirconia ¢¢ phosphoric acid 690kt* (25.96% contribution)#
¢¢ Granulation 400kt* (21.53% contribution)#
¢¢ NpK 35kt* (0.01% contribution)#
¢¢ Sulphuric acid 2.2mt* (0.42% contribution)#
People * Production capacity # Contribution of product to revenue
100% 29% 100%
AuSTRAlASIAR110m REvENuE
(phosphoric acid, rock)
20% increase y-o-y1.32% share in revenue

8
FOSkOR INTEGRATED REPORT 2016
FOSKOR INTEGRATED REPORT 2016
9hOw wE OPERATE
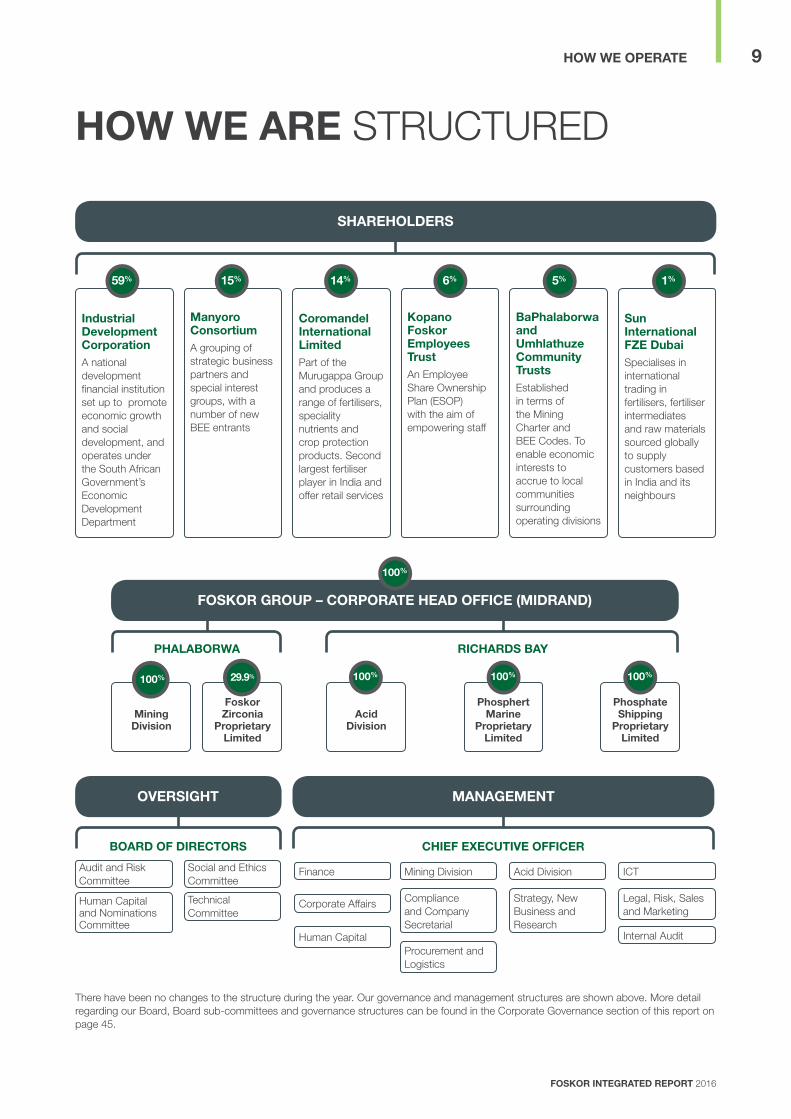
Industrial Development corporation A national development financial institution set up to promote economic growth and social development, and operates under the South African Government’s Economic Development Department
manyoro consortiumA grouping of strategic business partners and special interest groups, with a number of new BEE entrants
coromandel International limited Part of the Murugappa Group and produces a range of fertilisers, speciality nutrients and crop protection products. Second largest fertiliser player in India and offer retail services
kopano Foskor Employees Trust An Employee Share Ownership Plan (ESOP) with the aim of empowering staff
baPhalaborwa and umhlathuze community Trusts Established in terms of the Mining Charter and BEE Codes. To enable economic interests to accrue to local communities surrounding operating divisions
Sun International FZE Dubai Specialises in international trading in fertilisers, fertiliser intermediates and raw materials sourced globally to supply customers based in India and its neighbours
59% 15% 14% 6% 5% 1%
hOw wE ARE STRUCTURED
There have been no changes to the structure during the year. Our governance and management structures are shown above. More detail regarding our Board, Board sub-committees and governance structures can be found in the Corporate Governance section of this report on page 45.
ShAREhOlDERS
bOARD OF DIREcTORS
Audit and Risk Committee
Social and Ethics Committee
Human Capital and Nominations Committee
TechnicalCommittee
chIEF ExEcuTIvE OFFIcER
Finance ICT
Human Capital
Compliance and Company Secretarial
Mining Division
Legal, Risk, Sales and Marketing
Strategy, New Business and Research
Corporate Affairs
Procurement and Logistics
Acid Division
Internal Audit
OvERSIGhT mANAGEmENT
RIchARDS bAy
100% 100% 100%
FOSkOR GROuP – cORPORATE hEAD OFFIcE (mIDRAND)
100%
mining Division
Foskor Zirconia
Proprietary limited
PhAlAbORwA
100% 29.9%
Acid Division
Phosphert marine
Proprietary limited
Phosphate Shipping
Proprietary limited
FOSKOR INTEGRATED REPORT 2016
1010
whO LEADS US
NON-ExEcuTIvE DIREcTOR AND chAIRmANmvuleni Geoffrey Qhena (50)BCompt (Hons), CA(SA), SEP, Adv Tax CertificateAppointed: 19 June 2006 board committees: HC, S&E
ExEcuTIvE DIREcTORSGerrit van wyk (56)Acting Executive DirectorBCom (Hons), MCom, MBL, AMP (INSEAD)Appointed: 1 July 2015 – 31 March 2016
ufikile khumalo (50)Executive Director and Chief Executive OfficerBScEng, MScEng, AMP (INSEAD), MAP (WBS), EDP (Harvard)Appointed: 1 April 2016
NON-ExEcuTIvE DIREcTORS
josephine Gaveni (44)BAdmin (Hons), MSc (HR Management)Appointed: 7 February 2013 board committees: HC, S&E
Gerrit van wyk (56)BCom (Hons), MCom, MBL, AMP (INSEAD)Appointed: 17 August 2004 board committees: HC, S&E, A&R, TC1
1. In an acting capacity
Arunachalam vellayan (63)BCom, Ind Admin, MBSAppointed: 22 June 2005 board committees: HC, S&E
lesego Sennelo (38)Bcom (Hons), CA (SA), Hdip Auditing Appointed: 18 June 2015board committees: A&R
vusi mazibuko (59)Bcom (Hons), AMP (Harvard)Appointed: 18 June 2015board committees: TC
vikramjit Sahney (54)MA, MBAAppointed: 18 June 2015board committees: HC, S&E
venkatachalam Ravichandran (59)B.E. (Hons), AICWA, PGDM, ACSAppointed: 18 June 2015board committees: TC
INDEPENDENT NON-ExEcuTIvE DIREcTORS
Nkosemntu Nika (58)BCompt (Hons)/CTA, CA(SA), AMP (INSEAD)Appointed: 3 February 2012 board committees: A&R
john barton (68)FCMA, CGMA, AMP (Harvard)Appointed: 3 February 2012 board committees: TC
Dr David Phaho (48)BSc (Hons), MSc, PhD, Certificate: Finance and Accounting, MAP, SEDPAppointed: 12 July 2005 board committees: TC
Nondumiso medupe (45)BCom (Hons), CA(SA)Appointed: 23 April 2014 board committees: A&R
bOARD OF DIREcTORS
A&R: Audit and Risk Committee
HC: Human Capital and Nominations Committee
S&E: Social and Ethics Committee
TC: Technical Committee
For detailed biographies of the Board go to www.foskor.co.za
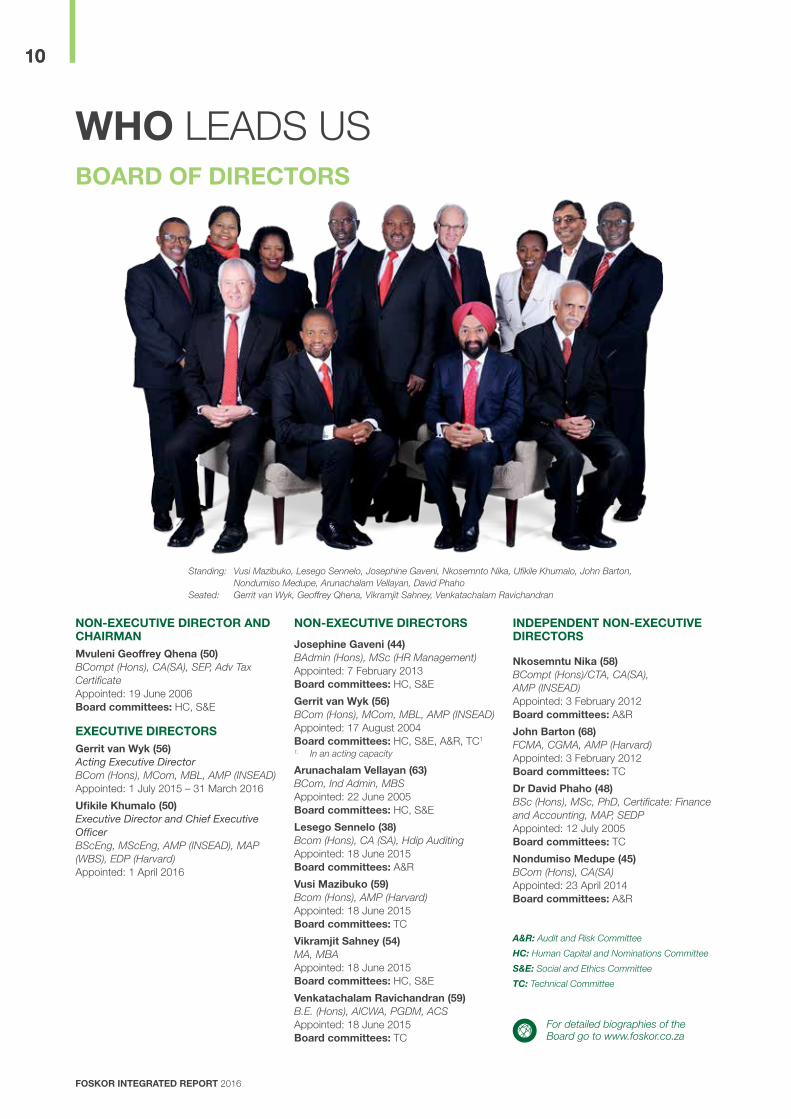
Standing: Vusi Mazibuko, Lesego Sennelo, Josephine Gaveni, Nkosemnto Nika, Ufikile Khumalo, John Barton, Nondumiso Medupe, Arunachalam Vellayan, David Phaho
Seated: Gerrit van Wyk, Geoffrey Qhena, Vikramjit Sahney, Venkatachalam Ravichandran
FOSKOR INTEGRATED REPORT 2016
11hOw wE OPERATE 11
ufikile khumalo (50)Executive Director and Chief Executive OfficerBScEng, MScEng, AMP (INSEAD), MAP (WBS), EDP (Harvard)
Ashraf Dindar (46)Chief Financial OfficerBCom, B Acc, CA(SA), GEDP (GIBS)
khumbulani cele (44)
Vice President: Logistics and ProcurementBCom (Hons), IEP (INSEAD)
Sarah luthuli (42)Vice President: Corporate Affairs and Human CapitalBSocSci, PDPM, HPL (IMD), IEP (INSEAD), MBA
james morotoba (46)Vice President: MiningBSc Eng (Min), MMC, MDP, AMP, MBA
Similo Sibisi (51)Vice President: Legal, Risk, and MarketingBA, LLB, AMP (INSEAD)
Dinesh Singh (47)Vice President: Acid BE Chemical, MBA, MA Economics
Amagugu khanyile (40)Company Secretary BProc
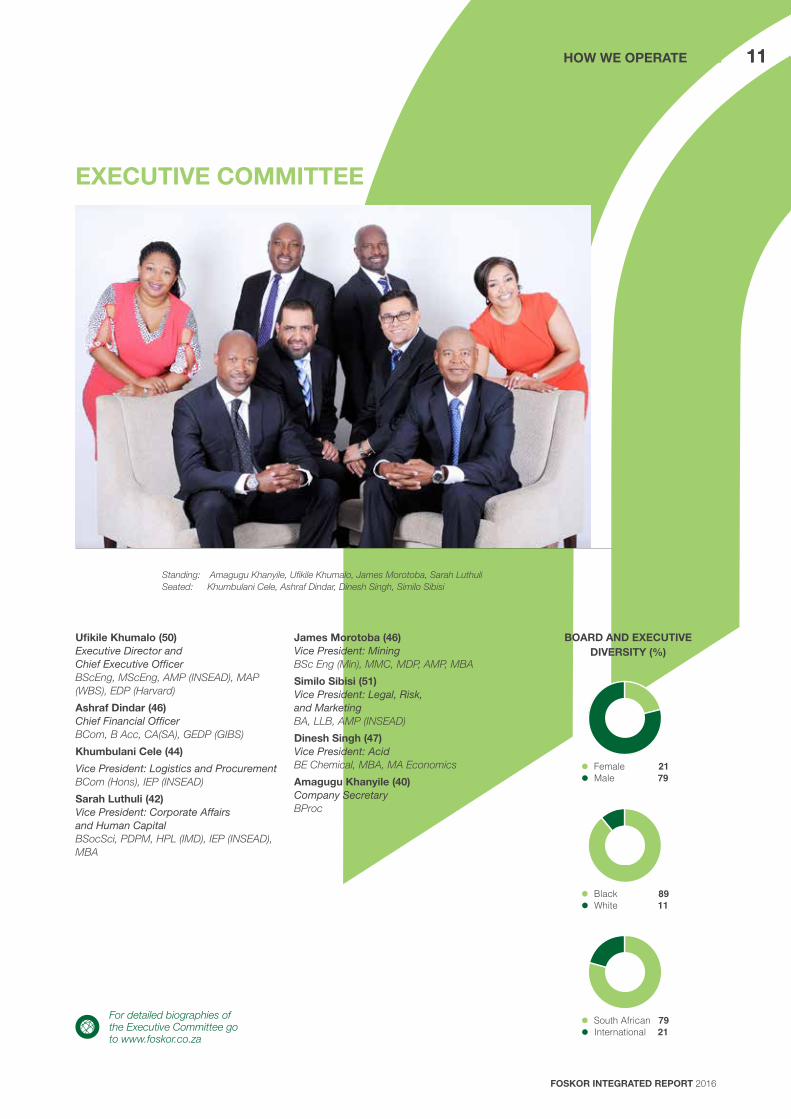
bOARD AND ExEcuTIvE DIvERSITy (%)
For detailed biographies of the Executive Committee go to www.foskor.co.za
FemaleMale
2179
WhiteBlack 89
11
South AfricanInternational
7921
ExEcuTIvE cOmmITTEE
Standing: Amagugu Khanyile, Ufikile Khumalo, James Morotoba, Sarah LuthuliSeated: Khumbulani Cele, Ashraf Dindar, Dinesh Singh, Similo Sibisi

FOSKOR INTEGRATED REPORT 2016
12
hOw wE cREATE vAlue
we create and sustain value through mining phosphate ore, converting it into rock that forms an input to phosphoric acid and granular fertiliser products. The manner in which we create value is in terms of our values and our governance structures. The relationships with our stakeholders (internal and external) also have an impact on our ability to create and sustain value.
The key stakeholders that are part of our value chain are suppliers of rail transport (Transnet Freight Rail) for our rock to Richards Bay and Maputo; as well as utility providers (municipalities) who provide us with electricity and water that is critical for our production process. Also there are other stakeholders which are important like our suppliers/contractors, communities, government departments, financial institutions, etc.
The tolling agreement that we had with Palabora Copper was suspended at the end of the financial year 2013/14.
In 2017/18 we will consider commencing the tolling agreement depending on business requirements. The agreement accounted for 20 – 25% of our crushing and milling capacity. The agreement is suspended pending the improvement of our operations and the commodity markets.
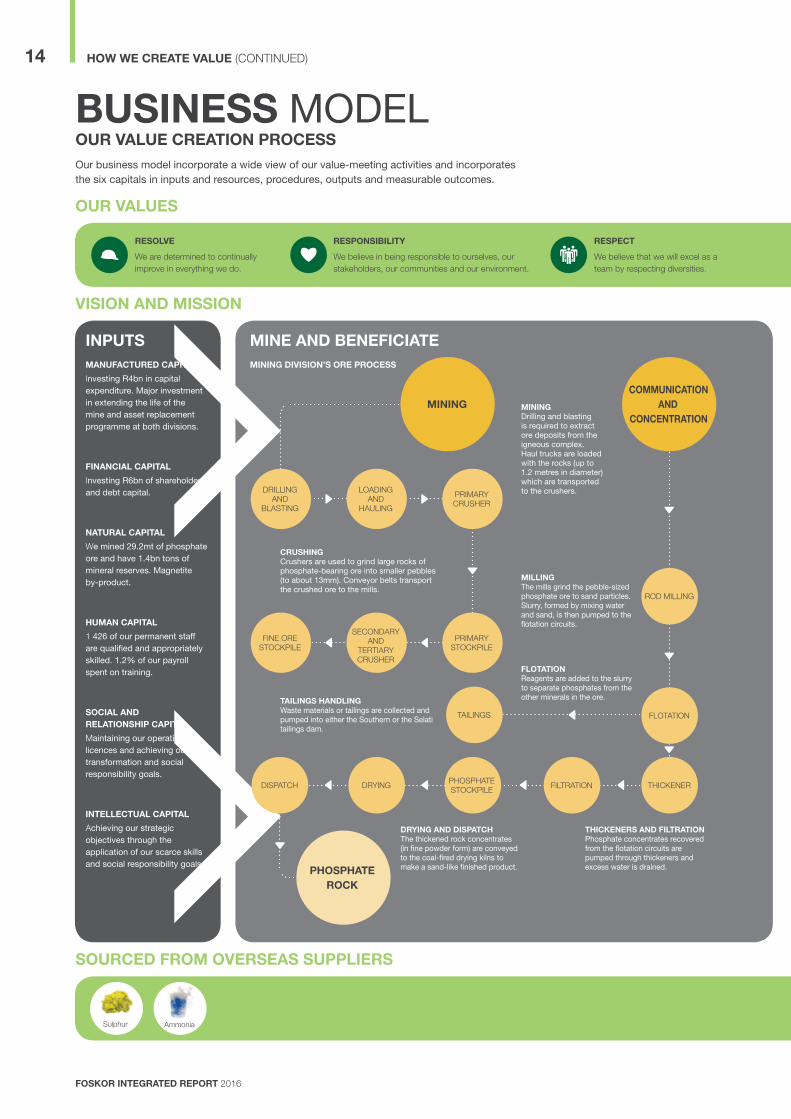
Our business model incorporates a wider view of our value-creating activities and incorporates the six capitals in inputs and resources, processes, outputs and measurable outcomes.
FOSKOR INTEGRATED REPORT 2016
13hOw wE cREATE vAluE
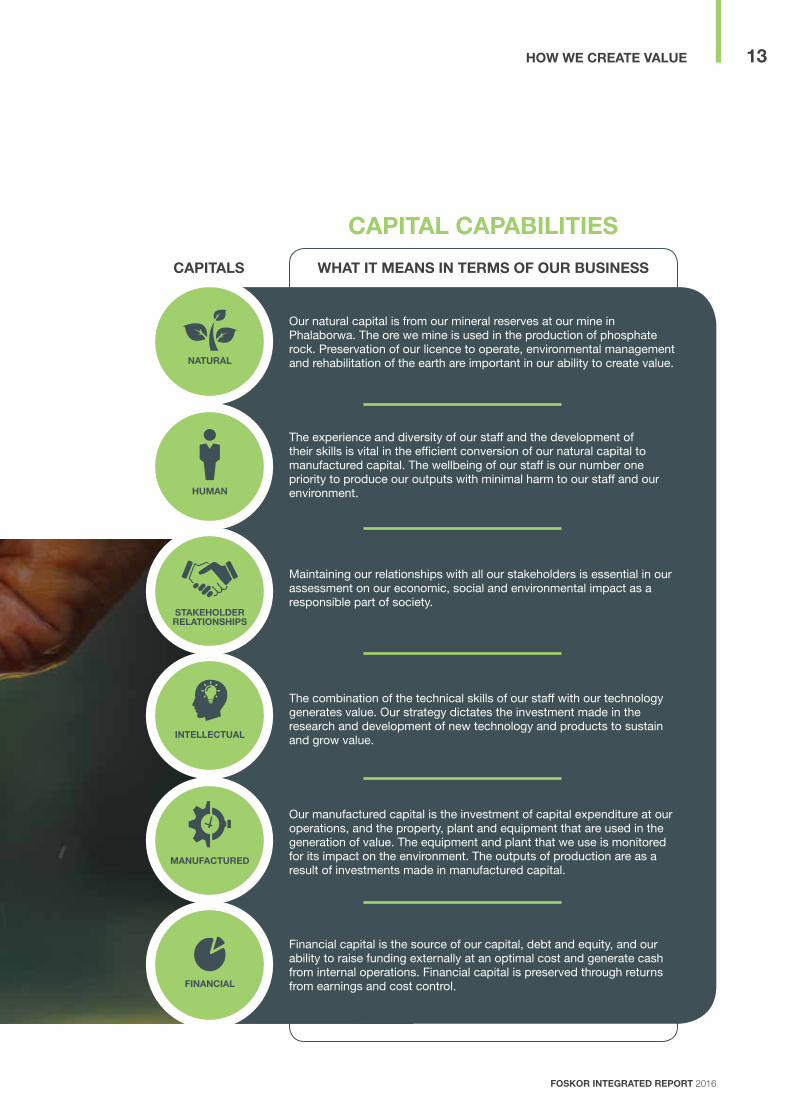
our natural capital is from our mineral reserves at our mine in phalaborwa. the ore we mine is used in the production of phosphate rock. preservation of our licence to operate, environmental management and rehabilitation of the earth are important in our ability to create value.
the experience and diversity of our staff and the development of their skills is vital in the efficient conversion of our natural capital to manufactured capital. the wellbeing of our staff is our number one priority to produce our outputs with minimal harm to our staff and our environment.
maintaining our relationships with all our stakeholders is essential in our assessment on our economic, social and environmental impact as a responsible part of society.
financial capital is the source of our capital, debt and equity, and our ability to raise funding externally at an optimal cost and generate cash from internal operations. financial capital is preserved through returns from earnings and cost control.
cAPITAl cAPAbIlITIES
cAPITAlS whAT IT mEANS IN TERmS OF OuR buSINESS
NATuRAl
humAN
STAkEhOlDER RElATIONShIPS
the combination of the technical skills of our staff with our technology generates value. our strategy dictates the investment made in the research and development of new technology and products to sustain and grow value.INTEllEcTuAl
FINANcIAl
our manufactured capital is the investment of capital expenditure at our operations, and the property, plant and equipment that are used in the generation of value. the equipment and plant that we use is monitored for its impact on the environment. the outputs of production are as a result of investments made in manufactured capital.
mANuFAcTuRED
FOSKOR INTEGRATED REPORT 2016
14
buSINESS model
vISION AND mISSION
INPuTSmANuFAcTuRED cAPITAl
Investing r4bn in capital expenditure. major investment in extending the life of the mine and asset replacement programme at both divisions.
FINANcIAl cAPITAl
Investing r6bn of shareholder and debt capital.
NATuRAl cAPITAl
We mined 29.2mt of phosphate ore and have 1.4bn tons of mineral reserves. magnetite by-product.
humAN cAPITAl
1 426 of our permanent staff are qualified and appropriately skilled. 1.2% of our payroll spent on training.
SOcIAl AND RElATIONShIP cAPITAl
Maintaining our operating licences and achieving our transformation and social responsibility goals.
INTEllEcTuAl cAPITAl
Achieving our strategic objectives through the application of our scarce skills and social responsibility goals.
Sulphur Ammonia
DRILLING AND
BLASTING
LOADING AND
HAULING
PRIMARYCRUSHER
PRIMARY STOCKPILE
SECONDARY AND
TERTIARY CRUSHER
FINE ORE STOCKPILE
cOmmuNIcATION AND
cONcENTRATION
ROD MILLING
FLOTATIONTAILINGS
THICKENERFILTRATIONPHOSPHATESTOCKPILEDRYINGDISPATCH
PhOSPhATEROck
mINING
OuR vAluES
RESOlvE
We are determined to continually improve in everything we do.
RESPONSIbIlITy
We believe in being responsible to ourselves, our stakeholders, our communities and our environment.
RESPEcT
We believe that we will excel as a team by respecting diversities.
our business model incorporate a wide view of our value-meeting activities and incorporates the six capitals in inputs and resources, procedures, outputs and measurable outcomes.
mINE AND bENEFIcIATE
OuR vAluE cREATION PROcESS
cRuShINGCrushers are used to grind large rocks of phosphate-bearing ore into smaller pebbles (to about 13mm). Conveyor belts transport the crushed ore to the mills.
TAIlINGS hANDlINGWaste materials or tailings are collected and pumped into either the Southern or the Selati tailings dam.
DRyING AND DISPATchthe thickened rock concentrates (in fine powder form) are conveyed to the coal-fired drying kilns to make a sand-like finished product.
ThIckENERS AND FIlTRATIONphosphate concentrates recovered from the flotation circuits are pumped through thickeners and excess water is drained.
FlOTATION reagents are added to the slurry to separate phosphates from the other minerals in the ore.
mIllINGthe mills grind the pebble-sized phosphate ore to sand particles. Slurry, formed by mixing water and sand, is then pumped to the flotation circuits.
mININGdrilling and blasting is required to extract ore deposits from the igneous complex. Haul trucks are loaded with the rocks (up to 1.2 metres in diameter) which are transported to the crushers.
mINING DIvISION’S ORE PROcESS
SOuRcED FROm OvERSEAS SuPPlIERS
hOw wE cREATE vAluE (CONTINUED)

FOSKOR INTEGRATED REPORT 2016
15
REAcT AND cONcENTRATE
mAGNETITE
PhOSPhATE ROck
PhOSPhORIc AcID
SulPhuRIc AcID
mAP/DAP/mAPZ
uREA
POTASh
SulPhuR is burnt to form sulphur dioxide. this gas is converted to sulphur trioxide in a steam boiler and is then mixed with water to form sulphuric acid.
PhOSPhATE ROck concentrate from the mining division is treated with sulphuric acid and recycled phosphoric acid to form weak phosphoric acid in slurry form. this is then filtered to remove gypsum particles as a waste product. After filtration, concentrated high-grade phosphoric acid is produced by boiling off excess water.
AmmONIA AND SulPhuRIc AcID are mixed with phosphate under controlled conditions to produce either mAp or dAp slurry, which is then granulated and dried to deliver the desired product.
By adding zinc to the mAp reaction, mAp zinc is produced.
BURNING SULPHUR DIOxIDE
CATALYTIC CONVERSION
REACTED WITH
SULPHURIC ACID
SLURRY P205FILTRATION CONCEN-
TRATION
SulPhuRIc AcID
PhOSPhATEROck
HIGH GRADE P205
AMMONIA AND PHOSPHORIC
ACID REACTORS
GRANULATION AND ROTARY
DRYING
GRANULAR FERTILISER
mAP/DAP
GO
vE
RN
AN
cE
SulPhuR
STRATEGy AND RISk mANAGEmENT
OuTcOmESmANuFAcTuRED cAPITAl ¢¢rock production 1.876mt
(3% below target) ¢¢Acid production 307kt
(44% below target) ¢¢Granulation production 198kt
(50% below target)¢¢Acid production efficiency
(12% below target)
FINANcIAl cAPITAl ¢¢Cost of borrowings r290m
(82% higher than 2015) ¢¢Cash utilised by operations r51m
(57% lower than 2015)¢¢free cash flows r449m
(25% more than 2015) ¢¢r273m opex savings to budget¢¢eBIt loss r296m
(29% lower than 2015)¢¢debt facilities reduced from
r2.7bn to r1.3bn
NATuRAl cAPITAl ¢¢mined 29.2m tons of ore
(2015: 30.5m tons)¢¢energy consumption increased
by 30% ¢¢fresh water consumption reduced
by 3%¢¢focus on Co2 green house gas
emissions
humAN cAPITAl ¢¢Staff turnover remained at 6% ¢¢ltIfr down to 0.17 from 0.36 in
2015 ¢¢Zero fatalities¢¢occupational diseases down to
3 from 10¢¢Good relationship with trade unions
maintained
SOcIAl AND RElATIONShIP cAPITAl¢¢maintained our licence to operate¢¢mining Charter and Bee compliance¢¢value added to stakeholders r1.3bn
INTEllEcTuAl cAPITAl¢¢Continued focus on skills
development and retention
REcOGNITION
We believe in shared reward
OuR mARkETS
OuTPuTAcID DIvISION’S PROcESS
ExPORTPhosphoric acid and granulation
Material Issues Scorecards
hOw wE cREATE vAluE
EuROPE
mIDDlE EAST
SOuTh AFRIcA
INDIA
FAR EAST
AuSTRAlIA
SOuTh AmERIcA
AFRIcA
Urea Potash
TRANSPORT
RAIl TRANSPORTRock to richards Bay and maputo
NPk blENDING AND bAGGINGroAd – Granular fertiliser and phosphoric acid
ShIPPINGrock, p2o5 and granular exports
FOSKOR INTEGRATED REPORT 2016
16
OuR kEy StAKeHolderS
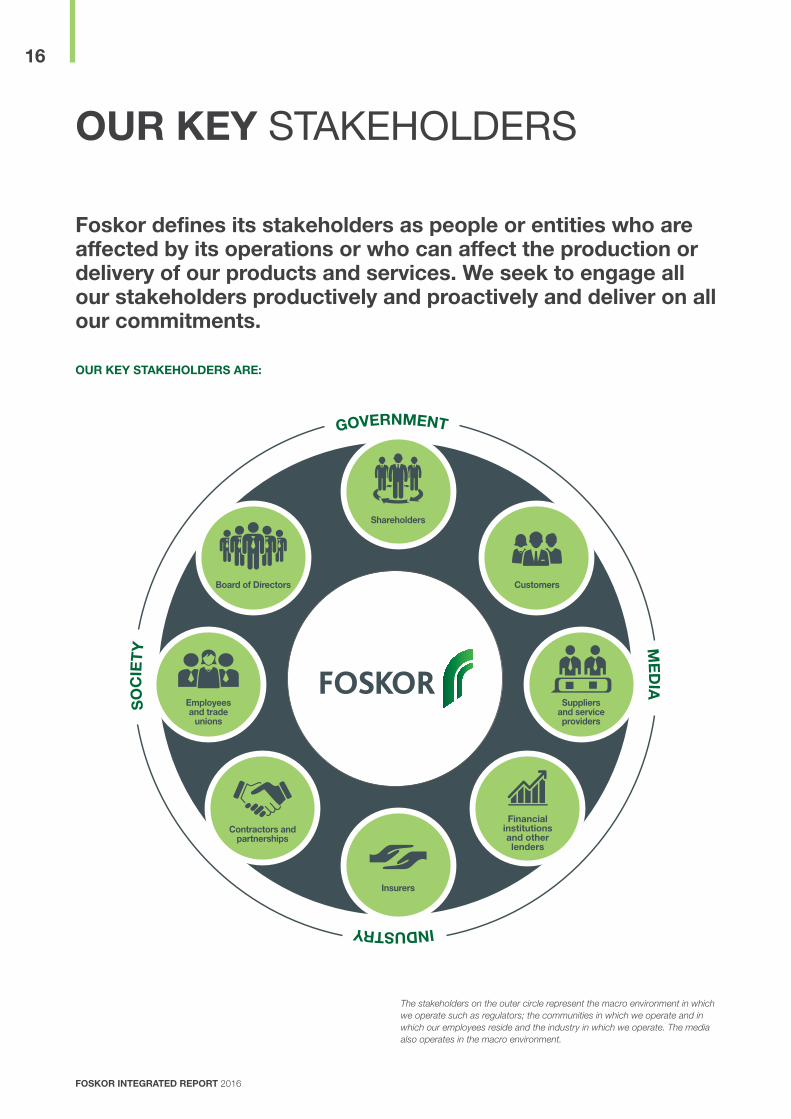
Foskor defines its stakeholders as people or entities who are affected by its operations or who can affect the production or delivery of our products and services. we seek to engage all our stakeholders productively and proactively and deliver on all our commitments.
The stakeholders on the outer circle represent the macro environment in which we operate such as regulators; the communities in which we operate and in which our employees reside and the industry in which we operate. The media also operates in the macro environment.
OuR kEy STAkEhOlDERS ARE:
SO
cIE
Ty
GOvERNmENT
mE
DIA
INDuSTRy
Shareholders
customers
Financial institutions and other lenders
Insurers
contractors and partnerships
Employees and trade
unions
board of Directors
Suppliers and service providers
FOSKOR INTEGRATED REPORT 2016
17OuR kEy STAkEhOlDERS
ENGAGING wITh STAkEhOlDERSOpportunities for dialogue are created through meetings, forums, surveys, briefings, interviews and our website. Other internal and external communication channels are also available for stakeholders to engage with the Company. We use these channels to inform stakeholders of the Company’s activities and get feedback from them.
Our stakeholder engagement programme has been specifically designed to:
¢¢ continually update our understanding of our operating environment, to better identify and define the risks facing the Company and allocate resources to seeking solutions;
¢¢ learn about market developments and social dynamics and feed this knowledge into product enhancements;
¢¢ build trusting relationships and educate the public as to the importance of our business; and
¢¢ give Corporate Social Investment (CSI) recipients a voice in the decision-making processes and tailor initiatives to their needs.
Feedback from our stakeholders is collected through our Corporate Affairs department for employees, communities, environmental interest groups, directors and shareholders. The Marketing department receives feedback from customers, the Procurement department from suppliers,
and the Finance department from insurers and financial institutions. The heads of the various departments would then prioritise the feedback and present to the Board.
We have good relations with our stakeholders. We try our utmost best to meet the basic expectations of our stakeholders. In instances where we cannot meet their expectations, we communicate efficiently and make our position clear.
The activities undertaken as part of stakeholder engagement were not specifically undertaken as part of the report preparation process, these activities occur through the normal course of business throughout the period.
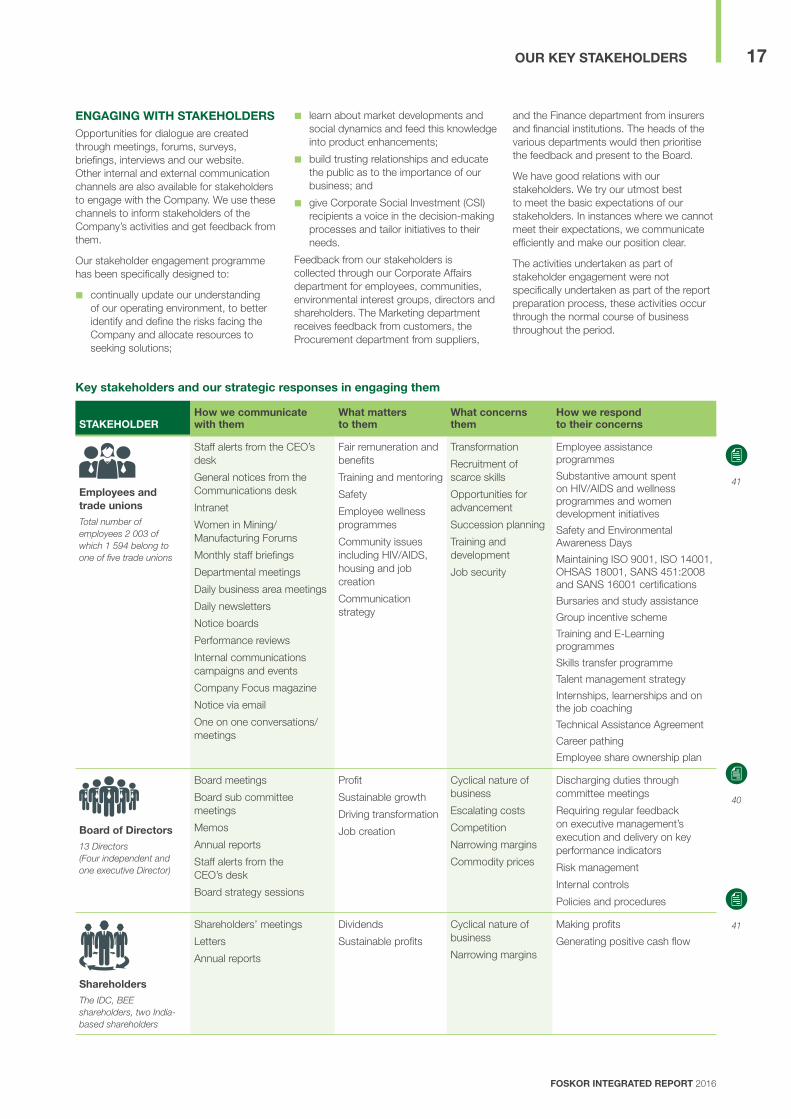
key stakeholders and our strategic responses in engaging them
STAkEhOlDERhow we communicate with them
what matters to them
what concerns them
how we respond to their concerns
Employees and trade unionsTotal number of employees 2 003 of which 1 594 belong to one of five trade unions
Staff alerts from the CEO’s desk
General notices from the Communications desk
Intranet
Women in Mining/ Manufacturing Forums
Monthly staff briefings
Departmental meetings
Daily business area meetings
Daily newsletters
Notice boards
Performance reviews
Internal communications campaigns and events
Company Focus magazine
Notice via email
One on one conversations/meetings
Fair remuneration and benefits
Training and mentoring
Safety
Employee wellness programmes
Community issues including HIV/AIDS, housing and job creation
Communication strategy
Transformation
Recruitment of scarce skills
Opportunities for advancement
Succession planning
Training and development
Job security
Employee assistance programmes
Substantive amount spent on HIV/AIDS and wellness programmes and women development initiatives
Safety and Environmental Awareness Days
Maintaining ISO 9001, ISO 14001, OHSAS 18001, SANS 451:2008 and SANS 16001 certifications
Bursaries and study assistance
Group incentive scheme
Training and E-Learning programmes
Skills transfer programme
Talent management strategy
Internships, learnerships and on the job coaching
Technical Assistance Agreement
Career pathing
Employee share ownership plan
board of Directors13 Directors (Four independent and one executive Director)
Board meetings
Board sub committee meetings
Memos
Annual reports
Staff alerts from the CEO’s desk
Board strategy sessions
Profit
Sustainable growth
Driving transformation
Job creation
Cyclical nature of business
Escalating costs
Competition
Narrowing margins
Commodity prices
Discharging duties through committee meetings
Requiring regular feedback on executive management’s execution and delivery on key performance indicators
Risk management
Internal controls
Policies and procedures
ShareholdersThe IDC, BEE shareholders, two India-based shareholders
Shareholders’ meetings
Letters
Annual reports
Dividends
Sustainable profits
Cyclical nature of business
Narrowing margins
Making profits
Generating positive cash flow
41
41
40

FOSKOR INTEGRATED REPORT 2016
18
STAkEhOlDERhow we communicate with them
what matters to them
what concerns them
how we respond to their concerns
customersSixty percent of revenue from local customers and 40% from foreign customers
Meetings
Site visits
Business associations
Conferences and seminars
Value
Customer service
Quality products
Competitive prices
Timely deliveries
Reliability of supplies
Availability of stock
Logistics
Sustainability of customer relationships
Stockpiling rock
Alternative rail logistics routes
Improving operational efficiency and output
Improve customer relations
Maintain competitive pricing
contractors, partnerships and sharing agreementsIncludes key third parties
Meetings
Written communications
Contact on operational issues
Reports
Contract negotiations
Equitable income distribution
Key safety, health, environment and quality strategies
Work stoppages
Industrial action
Continued partnerships
Contractor safety, health and environmental management plans
Safety agreements
Suppliers and service providersApproximately 2 700 suppliers on our supplier database and 85% of our procurement spend is with BEE suppliers
Meetings
Site visits
Tenders and supply contracts
Company website
Business associations
Performance reviews and audits
Conferences and seminars
Input costs
Payment terms
Duration of contracts
Vendor information and training
Enterprise development
Preferential procurement terms
BEE ratings
Foskor has more than 2 700 vendors in its supplier database. The following services are offered to them:
¢¢ Vendor training
¢¢ Favourable supplier payment terms
¢¢ R3.2 billion spent on BEE suppliers
¢¢ Focus on providing opportunities for local SMMEs
communities and community leadersCommunities around Phalaborwa and Richards Bay
Public and personal meetings
CSI initiatives through the operational budget and the Community Trust
Quarterly meetings with local authorities
Community open days
Integrated development plan and economic development forums
Social and Labour Plans to direct the spending on Local Economic Development
Grievance and conflict resolution processes
Ad hoc communications such as letters and meetings
Community trust meetings
Sustainable socio-economic development
Transformation
Developing a talent pool of locals through learnerships
Corporate social investment initiatives
Pollution, safety and health matters
Consultation on proposed new projects and significant changes to existing operations
Employment of local labourers
Land claims and cultural heritage
Inability to source scarce skills
Enterprise development and local procurement
R7 million spent on CSI initiatives, including Social labour plans and local economic development
Community trusts
Monthly sessions with stakeholders
Community events, namely, F21 marathon
Community upliftment initiatives
Upgrading roads
Government and regulatory bodiesDepartments of Mineral Resources; Environmental Affairs; and Water and Sanitation National Nuclear Regulator Competition Commission
Meetings
Written communications
Presentations
Audits
Business associations
Attending workshops
Statutory and legal compliance
Transparent and full disclosures of Group’s structures and activities
Safety
Local Economic Development
Transformation
Safety
Legal compliance to all relevant pieces of regulation
Statutory compliance enforced through the Legal and Compliance Department
Regular meetings and presentations to departments and government bodies
The estimated costs for scheduled and unscheduled mine closure is estimated at R526 million and R616 million respectively)
42
42
42
43
43
OuR kEy STAkEhOlDERS (CONTINUED)

FOSKOR INTEGRATED REPORT 2016
19OuR kEy STAkEhOlDERS
STAkEhOlDERhow we communicate with them
what matters to them
what concerns them
how we respond to their concerns
mediaMainly media in Limpopo and KZN
Networking and briefing sessions
Press releases
Telephonic and other interviews
CSI/LED project handover invitations
Event invitations
Company news
New developments
Safety incidents
Job advertisements
Tenders
Work stoppages
Stability of operations
Environmental or any other impact due to accidents
Regular face-to-face contact, briefings and networking
Written communications to answer queries based on facts and integrity
Financial institutions and other lendersTransactional bankers and providers of debt capital and trade facilities
Meetings
Letters
Emails
Liquidity position
Risk management and exposure
Gearing ratio
Interest cover
Negative cash flows
Other debt obligations
Ability to service debt
Prudent liquidity risk management, maintaining sufficient cash and marketable securities, managing cash flows and raising adequate borrowing facilities
InsurersMachinery breakdown and business interruption Credit insurance providers
Meetings
Site visits
Reports
Adequate risk management
Internal controls
Ageing equipment and technology
Rigorous maintenance and regular inspections limit insurance claims
Special interest groups and peer groups
Business body memberships
Meetings
Industry initiatives
Conferences and seminars
Safety and health
Environmental matters
Regulatory changes
Economic drivers
Environmental management
Safety
Nationalisation
Member of the following forums and associations:
¢¢ International Fertiliser Association
¢¢ Fertiliser Society of Southern Africa
¢¢ KZN Growth Coalition
¢¢ Zululand Chamber of Commerce and Industry
¢¢ Richards Bay Clean Air Association
¢¢ Umhlathuze Pipeline Forum
¢¢ Umhlathuze Emergency Planning Forum
¢¢ Olifants River Water Catchment Forum
¢¢ Transnet’s Environmental Forum Meeting in accordance with the Environmental Management Plan for Port Operations
¢¢ Kruger National Park Environmental Management Forum
41
43
41
43

FOSKOR INTEGRATED REPORT 2016
20
vAluE ADDED StAtemeNtfor the year ended 31 March 2016
2015
wEAlTh DISTRIbuTION (Rm)
2016
Value added is defined as a measure of the wealth created by the Group and its employees. This statement shows the total value created and how it was distributed.
2016 2015
Notes Rm % Rm %
Revenue 5 918 5 297Paid to suppliers for products, materials and services (4 748) (4 669)
value added from trading operations 1 170 91 628 67Income from Investmentsa 0 4 0Finance income 18 1 30 3Other income 106 8 279 30
Total value created 1 294 100 941 100
wealth distribution:Employees 1 839 65 825 88Capital providers 307 24 189 20Government 2 100 8 27 3Communities (corporate social investment) 7 0 7 1Reinvested in the Group to maintain and develop operations 41 3 (107) (12)
Depreciation and amortisation 331 306Retained profit (146) (221)Deferred taxation (144) (192)
1 294 100 941 100
vAluE ADDED RATIOSNumber of employeesb 1 859 1 767Revenue created per employee (R’000)c 3 183 2 998Value created per employee (R’000)c 696 532
NOTES1. Employees
Salaries, wages, overtime payments, commissions, bonuses and allowances, employer contributions 839 825
839 825
2. GovernmentTax – normal, royalties, dividend withholding 85 13Rates and Taxes paid to Local Authorities 7 6Skills Development Levy 8 8
100 27
a Dividend incomeb Number of employees at the end of the yearc Based on the number of employees at the end of the year
0 200 400 600 800 1 000
839
41
307
100
7Communities
Government
Capitalproviders
Employees
Reinvestedin group
7
27
189
825
-107
Communities
Government
Capitalproviders
Employees
Divestedfrom group
-200 0 200 400 600 800 1 000
Fy 2016 EvA distribution: R1 294m Fy 2015 EvA distribution: R941m
21
FOSkOR INTEGRATED REPORT 2016
OuR kEy STAkEhOlDERS 21OuR kEy STAkEhOlDERS

22
OuR STRATEGIc revIeW
In 2016, the commodity prices were under pressure in the international market after fairly stabilised prices in 2015.
It is expected that the downward pressure on prices will continue during the 2017 financial year.
TO AchIEvE OPERATIONAl STAbIlITy AND FINANcIAl SuSTAINAbIlITy
ST
RA
TE
GIc
FO
cu
S A
RE
AS
DEvElOP mARkET
POSITION
ENhANcE STAkEhOlDER
RElATIONShIPS
AlIGN SuPPORT SERvIcES
OPERATIONAl ExcEllENcE
STRATEGIc PROjEcTS/
OPPORTuNITIES
DEvElOP AND GROw PEOPlE
2 3
ShEQ cOmPlIANcE
cASh GENERATION
1 4
67
SyNchRONISE SuPPly chAIN
cAPAbIlITIES
STRENGThEN GOvERNANcE
8 5
9 10
FOSkOR INTEGRATED REPORT 2016
In 2016, our strategy was to achieve operational excellence and financial sustainability which led to major maintenance programmes in the Acid Division, asset replacement programmes, reprioritisation of strategic projects and arranging funding for asset replacement and operational continuity in order to ensure the long-term sustainability of the core phosphates business (Refer to page 12).
Some of the critical initiatives identified in achieving operational excellence were successfully implemented during the year which resulted in improvement of plant efficiency in the acid plant as well as reduction in production cost in the mining division. However, due to the ageing acid plant, efficiency and availability remains a major challenge and severely affects production volumes and cost of production.

FOSKOR INTEGRATED REPORT 2016
23OuR STRATEGIc REvIEw
“We are on our way to operational stability and financial sustainability.”
Funding was received from our majority shareholder for the major asset replacement program and operational continuity. The asset replacement programme has commenced. It is expected to achieve the desired full results after the completion of the asset replacement programme which will take another two to three years.
We are going to continue with the optimised production at current capacity. There is plan to restart the PMC tolling agreement (which was stopped two years back) to support the production requirements. It is envisaged that the achievement of our strategic priorities will enable us to be a mid-size, integrated and efficient producer of phosphate rock, phosphoric acid and granular fertiliser at maximum capacity. The majority of efforts of management in the coming period will focus on the turnaround of the Acid Division, mostly through achieving operational excellence to enable us to have sustainable production and growth.
OuR STRATEGy AT OPERATIONAl lEvElThe Acid Division will continue improving efficiency and availability of the plant. It will be achieved mainly through the asset replacement programme and a continued focus on maintenance. Major focus will be on innovation, leadership, performance driven culture, deputation of suitable resources, enhancing project management capabilities, talent attraction, development of skills, implementing standard industry practices in operation and maintenance, planning and effective utilisation of the Technical Assistance Agreement (TAA).
The Mining division will continue to improve utilisation of plant and equipment, improve efficiency and implement cost saving initiatives to reduce cost of production. The mine fleet replacement programme which has been commenced will continue.
While implementing our strategy SHEQ will remain a priority. Distinct efforts will be taken to ensure SHEQ compliance. We believe that our staff are critical to the success of the operational excellence objective, and a values-driven performance culture will be instilled in the Company going forward. We plan to add value to our customers by investigating beneficiation opportunities, strengthening our Market development team; and exploring new niche markets.
Cash generation is vital to the continued sustainability of the operations and this has been, and will continue to be, a focus area going forward, not only for sustaining operations but also with the objective of reducing the amount of debt on the balance sheet.
We will ensure that all the support services will be aligned to our strategy and focus on accomplishing our transformation goals. Enhancing governance, compliance and risk management will be an integral part of strategy. Community development, implementation of BBBEE initiatives and enterprise development will remain a vital part of our agenda.
mEDIum- AND lONG-TERm ObjEcTIvES
Production Our primary focus is to improve operational performance and achieve operational excellence in order to get our mine and acid plant to efficiently produce at their name-plate capacity in the medium-term.
Diversification While operating excellence is being achieved, we aim to continue to diversify our product range into high value products. Three beneficiation projects have been identified and will be progressed in the coming years.
cAPITAl RESOuRcES REQuIRED TO ExEcuTE STRATEGy We have secured sufficient funding from our shareholders to enable us to complete the identified capex projects for the next five years.
FOSKOR INTEGRATED REPORT 2016
2424
mvuleni Geoffrey Qhena chairman
FOSkOR INTEGRATED REPORT 2016
FOSKOR INTEGRATED REPORT 2016
25OuR STRATEGIc REvIEw
chAIRmAN’S StAtemeNt
The financial year being reported on saw the world growth still very sluggish. The slow down by China being the previous driver of the world growth contributed modestly to world growth. Most of the commodity dependent countries have been suffering with prices still very low and this affected their growth as well. The African continent which has been previously reporting impressive growth saw its projections being revised downward, due to the reduced revenue especially from the oil producing countries and those who are heavily reliant on commodities.
This global condition also affected South Africa, where the country’s growth has been significantly revised down from 3.2% in 2013 to just under 1%. This lack of growth and the high level of unemployment put a strain on the country with a possibility of a downgrade of the country to a sub-investment grade by some rating agencies. This is a matter which private sector, labour and public sector are still collaborating on to ensure it does not materialise.
This environment has also contributed to Foskor’s performance, as the prices of its products continued to be very soft (especially that of phosphoric acid). The weakening South African exchange rate has contributed both positively and negatively where in terms of the revenue, it has increased revenue, where else in the case of imported raw materials made them expensive. The drought conditions which were being experienced during this period in the country did not also assist the situation and the Company had to contend with lower volumes as a result thereof.
OPERATIONAl chAllENGESThe Company saw the continuation of operational challenges which resulted in the lowest production of phosphoric acid in years. This resulted in more attention being focused on the Richards Bay plant (phosphoric acid plant), to ensure that it is brought back to its ability to produce close to its name plate capacity. A month long industrial action in Richards Bay did not also help the cause as production came to a complete halt during that period.
The mining operations in Phalaborwa were in a relatively good state of operation. They were, however, impacted by the work stoppages which were mainly due to incidents where the community was not happy with some factors involving the neighbouring Company. This affected
Foskor as they are in close proximity and the staff uses predominately the same mode of transport. The continued closure of the adjacent phosphoric plant deprived Foskor an opportunity to supply more rock production to it, thus limiting the ability to generate more revenue from rock sales and creating more employment opportunities from the restart of the operations.
FINANcIAl PERFORmANcEThe reduced level of performance and the factors mentioned above from the operational challenges resulted in the Company having one of its worst performance financially. This saw the majority shareholder stepping in and providing new funding and restructuring existing facilities, to ensure the Company is adequately capitalised to be able to upgrade the Richards Bay plant and also upgrade the mining fleet, whilst ensuring that there is also enough rock for production in the new area. Management had to engage with the banks periodically during this period to assist especially before the majority shareholder approved additional funding. Management also engaged with some of its service providers to have some leniency on their terms during this period.
mANAGEmENT chANGES During this period we saw the Company taking longer than planned to replace the previous chief executive officer (CEO) and as result a non-executive director Mr Gerrit van Wyk was requested by the shareholders to be an acting CEO for 9 months until the new CEO (Mr Ufikile Khumalo) was appointed effective 1 April 2016. This period also saw the resignation of the chief financial officer (Mr Graham Ferns) and he has been replaced by Mr Ashraf Dindar who has been seconded by the IDC for a three-year period, to ensure that there is stability in the Company especially at executive level.
FuTuRE PROSPEcTSThe Company is operating in a changed environment, where new low cost producing operations are coming into the market. Furthermore, India, the largest consumer of phosphoric acid is also continually managing its level of subsidies to the agricultural farmers thus putting pressure on the phosphoric acid prices. Opportunities however are present in the fastest growing continent (Africa) where the level of use of phosphate as fertiliser is still very low. The proximity of Foskor makes it possible for
the Company to take advantage of this situation, whilst maximising the supply and demand in South Africa.
The performance of the Richards Bay plant, after this significant investment should put the Company in good state to respond to these opportunities. The Company, to stay competitive will have to continue managing its cost structure, at the back of this new investment.
The Company will continue to explore various uses of some of its by-product to ensure that the Company take advantage of the value addition and unlock value on what has previously been seen as waste.
AckNOwlEDGEmENTI would like to thank Mr Gerrit van Wyk for accepting to assisting the Company whilst the process of identifying a new permanent CEO was underway. I would like to welcome both the new CFO (Mr Ashraf Dindar) and the new CEO (Mr Ufikile Khumalo). I would also like to thank Foskor management who even during the challenging time continue to show commitment in the management of the Company. Thank you to the rest of the Foskor staff and the board members for their continued support during what was a very challenging period. Foskor is a very strategic company as the only integrated Phosphate Company in South Africa and therefore it is incumbent upon all of us to ensure that it is sustainable into the future. This will be achieved when there is corporation amongst all the stakeholders.
mvuleni Geoffrey Qhena Chairman
23 June 2016

FOSKOR INTEGRATED REPORT 2016
26
FOSkOR INTEGRATED REPORT 2016
ufikile khumalochief Executive Officer

FOSKOR INTEGRATED REPORT 2016
27
cEO’S revIeW
Despite the accelerated decline in magnetite prices globally with the weakening of the Chinese economy and imbalances in supply and demand, proactive actions by management in terms of timing of our magnetite sales, yielded increase volumes in magnetite sales.
We have engaged extensively with all our key stakeholders including Technical Advisors to ramp up the production volumes and overcome the technical challenges of the phosphoric acid plant. The divisions’ management continue to realign their operating teams and reprioritised the strategic projects to overcome these challenges. We are actively exploring with our shareholders and other internal and external stakeholders our ability to develop a sustainable standalone core phosphates business.
PERFORmANcE hIGhlIGhTS
Despite challenges that Foskor faced during the year, revenue increased by 12% to R5.9 billion (2015: R5.3 billion) largely due to the weakening of the exchange rate and a marginal increase in selling prices. However, EBIT decreased to a loss of R296 million during the year compared to the loss of R419 million in 2015 mainly due to a drop in magnetite prices and non-achievement of budgeted volumes of phosphoric acid production. With regard to operational performance, the Mining Division produced
1.876 million tons (2015:1.982 million tons) of phosphate rock which is 106 000 tons lower than the previous year. Production was negatively impacted by community unrest and Eskom load-shedding. Overall production efficiencies (product recovery) improved by 3%.
Compared to last year, phosphoric acid production decreased by 22% whilst granular fertiliser production decreased by 33%. This occurred during improved international prices resulting in missed opportunities for Foskor. The average phosphoric acid CFR price for the year was US$782 (2015: US$732) per ton and the FOB price of granular fertiliser decreased to an average price of US$469 (2015: US$500) per ton. The US Dollar average exchange rate increased from R10.95 in 2015 to R13.58 for the year. This helped mitigate some of the impact of declining market prices.
STRATEGIc INITIATIvES
The EBIDTA Upliftment Programme initiated in 2014 was successfully implemented by management. One of the factors mentioned in the our Restructuring Consultant’s report was the Company’s inability to achieve full production at the Acid Division due to unscheduled stoppages in the form of the reactor failure; and shortages in power and water.
During the year, in an effort to restructure our balance sheet, we secured a R6 billion funding from the IDC to enable us to have a better capital structure and provide funding facilities for replacement capital.
We have renewed our Technical Assistance Agreement with our Technical Advisor which, when fully leveraged, will add significant value when compared to the agreement in FY2016.
We have successfully engaged with the local competition regulatory authorities to ensure that our products can be sold at a fair price in the domestic market. The positive impact of this new arrangement came into effect in the latter part of FY2015 and will be an important contributor to better margins going forward, given that our intention is to strengthen supply in the SADC region.
FOcuS ON EFFIcIENcIES AND ThROuGhPuT
There will a renewed thrust to turnaround the core phosphates business. Our short-term strategy will be to focus on efficiencies and throughput improvement at the Mining and Acid Divisions. At the Acid Division, the focus will also be on effective plant maintenance and asset replacement.
This will ensure that there is a significant improvement in the uptime and asset utilisation levels which in turn will have a very positive effect on the operating efficiency.
Foskor operated in very challenging phosphate market conditions during the year. Our strategy, in response to the challenges we faced, called for an all-out effort to execute the strategy for optimised production. This specifically entails improving the throughput of production volumes and efficiencies at the Acid Division which had a major setback in the third quarter with plant shutdown as well as strike. Needless to say, all divisions, especially the Mining Division will focus on achieving the next level of throughput potential including improving their cost competitiveness. We continue to evaluate beneficial opportunities to beneficiate granular fertiliser to create value for our customers while exploring improving our operating margins through new opportunities in the downstream value chain.
OuR STRATEGIc REvIEw
FOSKOR INTEGRATED REPORT 2016
28
During the financial year 2015-2016 effort has been put to improve the efficiency and complete all the projects which directly affected production volumes and efficiencies. The initiative under project Makukhanye was launched with focus to improve efficiency and dilute acid production. Most of the activities are completed and targeted efficiency has improved by 3% and dilute acid production has been established.
A number of initiatives to improve the performance of the Acid Division to a sustainable business level have been identified and approved by our board of directors. These initiatives will ensure financial sustainability of business in years to come.
At the Mining Division the focus will also be on:
¢¢ replacement of the aging mining fleet and the optimal use of mining contractors to supplement the aging mining fleet.
PROcuREmENT AND lOGISTIcS
Strategic Procurement of sulphur and ammonia has gone as planned for the period under review (2015/16). The Richards Bay plant was well supplied with the required raw material during this period. We continue to be flexible and able to play in the markets where competitive prices are offered. Ammonia procurement was well under control. A long-term supply agreement with Qatar Fertilizer Corporation (Qafco) is in place.
Our success this year has been being able to secure two export rock facilities (Richards Bay and Maputo) facilities which have resulted in being able to export over 50% more than budget. These facilities are secured for 2016/17 and will provide the base for export swing volumes.
Magnetite has fared well for the 2015/16 financial year. Although the market has played a tremendous role in volume movement, our excellent relationship with Transnet Freight Rail has ensured us having capacity available for as and how Sales were able to commit to volume.
2015/2016 financial year report indicates that Richards Bay has achieved an average of 25% spend on black ownership; Phalaborwa has achieved an average of 18% spend on black ownership and the Foskor Group has achieved an average of 21% spend on black ownership. Special nature of Foskor’s operation which is hazardous manufacturing operation and remote mining operations results in certain services only sourced from certain suppliers such as OEM’s and these are mainly not BBBEE certificated.
2015/2016 financial year report indicates that Richards Bay has achieved an average of 10% on black women-owned suppliers; Phalaborwa has achieved an average of 7% on black woman owned suppliers and the Foskor Group has achieved an average of 8%. This area of focus is critical to achieve in the medium to long-term going forward, as it directly talks to the Mining charter.
In Phalaborwa Foskor has spent at least 63% with suppliers in the province where the company operates and in Richards Bay Foskor has spent at least 93% with suppliers in the province where the company operates which is a good reflection on the efforts on preferential procurement.
2015/2016 financial report indicates that Foskor has achieved an average of 20% on SMMEs for the Group and our new target for 2016/2017 financial year is to achieve at least 30% spent on EMEs & QSEs. Supplier/Enterprise development programmes are in place to assist SMMEs with capacity building.
The Logistics Department will ensure availability of input materials such as rock, sulphur and ammonia through improved coordination with suppliers and users to eliminate downtime. The Procurement Department was able to negotiate better freight rates with Transnet Freight Rail for FY2016, including the export of rock through the Richards Bay Port. This is expected to have a significant positive impact on the margins in the next year. The securing of the Rock Export facility in Maputo has assisted us greatly in exceeding our rock export targets. This relationship continues and we look to make full use of this 300 000 ton facility in 2016/17. We remain concerned that there still appears to be discriminatory freight pricing between destinations to Richards Bay and Maputo.
These initiatives will remain the main anchor for a sustained standalone viability of the core phosphates business in the coming years.
bENEFIcIATION
In our efforts to capture more value from our resources, we initiated a plan for increasing the production capacity of granular fertiliser. We are also exploring the potential to beneficiate directly or indirectly, various NPK blends that will meet the specific needs of farmers in South Africa and other SADC countries. This will help consolidate market share in the domestic market, enable the creation of new markets and also improve operating margins. In this regard, we are also working with various regulatory bodies and key influencers such as Grain SA.
We have delayed work on the magnetite beneficiation plant due to the steep decline in the price of magnetite. It is expected that this work will be accelerated once the Company is able to see an upturn in the global commodity prices for magnetite.
PRuDENT mANAGEmENT OF FINANcES
On account of the sharp decline in magnetite prices, we continue to curtail all discretionary expenses during the financial year. Capital expenditure programmes were postponed to conserve cash. Initiatives ranged from restructuring to postponement of long-term strategic projects. There is a substantial reduction in expense budgets for each of the operating divisions. During FY2016, management also explored numerous options for reducing its stockpile of rock at the Mining Division. These efforts yielded positive results.
Having restructured our balance sheet, we have now approached numerous financial institutions for additional funding facilities. We are also evaluating all the non-core assets for possible sale. As a result of these initiatives, our headroom has improved significantly and we continue to monitor cash as part of our day-to-day business operations.
ENvIRONmENT, hEAlTh AND SAFETy
mining Division
Consultation with regards to safety and health with organised labour is an ongoing process through the agreed Safety Committee structures. There were Zero fatalities were recorded in the Mining Division during the year. The DMR conducted eleven (11) SHEQ audits of which NONE resulted in section 54 site specific stoppages. Our strategy remains to reduce injuries and incidents through building sound relationships with the DMR.
Four lost-time injuries were recorded during the year which is a 60% reduction compared to the previous period. None resulted in long absenteeism or permanent or partial disability. Other minor injuries decreased by 29%. Other leading safety indicators support the improved safety performance during the year. The division retained the OSHAS 18001 Safety Management certification. The health of our employees remains a high priority and therefore the focus on annual medical surveillance. A hearing conservation programme has been rolled out during the year to reduce the highest occupational medical risk on the mine.
cEO’S REvIEw (CONTINUED)

FOSKOR INTEGRATED REPORT 2016
29OuR STRATEGIc REvIEw
No major environmental incidents were reported in year. The division retained the ISO 9001 Quality and ISO 14001 Environmental certifications. During the year various environmental projects were initiated and completed in order to further reduce our impact on the environment and comply with legislation. The Division operates with a valid and up to date Air Emission Licence. No directives were issued by the relevant regulatory bodies during the year.
The Mining Division operates with a water use licence; an application was submitted to the Department of Water and Sanitation to amend some of the conditions of the water use licence for reducing Foskor’s impact on groundwater. Capital has been approved for the new financial year and construction work will commence in the second quarter of the year.
The mine operates with a certificate issued by the National Nuclear Regulator and there were no major findings or directives issued during audit and inspections performed by the by the regulator.
The Mining Division remains committed to reducing its carbon footprint and has initiated and implemented various initiatives to support this. A task team has been set up to investigate alternate energy sources and energy saving initiatives. Foskor will continue to demonstrate responsible mining to ensure biodiversity is protected and our impact on the environment is kept to the minimum.
Acid Division
The annual DEKRA audit was performed at the Acid Division and they received the Five Star Shield Award and were also recommended for certification in terms ISO 9001, ISO 14001, and OHSAS 18001. Monthly SHREQ system training, awareness campaigns, inspections and audits are performed in maintaining standards. Both business and task base risks are considered to assess worker and plant safety. Our employees are provided with free annual medical examinations at the on-site clinic (CLINIx) to detect, prevent and treat any ailments resulting from occupational health risks and exposure to the work environment. Occupational surveys and monitoring are conducted to determine employee risk exposure to hazards such as chemicals, dust and other. Verification of plant compliance to in terms of permits and licences are conducted and checked monthly by our environmental personnel.
The lost-time injury frequency rate (LTIFR) for the year was 0.24 as compared to 0.34 last year. We are confident that the safety programmes and the systems we have in place, will further reduce our health and safety risks and reduce our LTIFR.
There were two section 24 incidents reportable to Department of Labour in terms of the OHS Act, 85 of 1993. All care will be taken to ensure that there is no repeat of such incidents.
We used the PAS 2050 standard to establish a carbon footprint and the calculations are then fed into the overall company-wide carbon footprint on monthly basis. We have an on-site turbine generator for electricity generation which is driven by excess steam and this operation significantly reduces our carbon footprint.
The Acid Division will endeavour to reuse and recycle water from within the site and from other industries wherever practically possible and we are working with the authorities to monitor and reduce water usage as part of the water allocation reduction plan instituted as per the drought plan by the Department of Water and Sanitation (DWS). During the year we re-assessed the strategies we currently have in place to prevent groundwater pollution and pollution of the surrounding environment. The study proposed various mitigation measures as set out in our Groundwater Remediation Concept Designs Report. The proposed measures have been approved for implementation in the new financial year. The hydraulic barriers were installed and the secondary dam upgrade is planned for the new financial year.
We operate with an air quality licence issued by the Uthungulu District Municipality. We are currently fully compliant with the current permit. There was one section 30 reportable incident in terms of National Environmental Management Act, which was the overflow of the Storm water Dam. This incident was reported to the regulatory authorities and the Department of Environmental Affairs.
humAN cAPITAl
The Acid Division has achieved its overall percentage EE target of 91 %. There is still a challenge with the employment of physically challenged individuals and currently we are at five against at target of 12 employees. Our labour turnover for the period of 2015/2016 is 4.53 and is less than the target of 5%. Employee health and wellness remains a priority in the division, thus the annual wellness days that are conducted successfully. The industrial relations climate at both divisions can be described as calm and satisfactory. The trade union and the entire workforce are aware of the challenges and are determined to make every effort to support the Company. The Acid Division trade unions have pledged their support to ensure a turnaround in the division. The current relationship between management and NUM is very sound.
There is an achievement of 100% at the Mining Division for the skills priorities on Workplace Skills Plan and Annual Training Report. At the Acid Division 74% of the skills priorities were achieved on Workplace Skills Plan and Annual Training Report. The successful meeting of the targets at the Acid Division were hampered by austerity measures introduced in the division.
cORPORATE SOcIAl INvESTmENT
The Corporate Social Investment teams in both divisions continue to be part of different initiatives in the communities where we can make a positive impact. Our programmes are aimed at the improvement of quality of life of the recipients and promoting education, rural development and poverty alleviation. The Community Trusts in Phalaborwa and Richards Bay have implemented the identified community projects with the available dividends.
TRANSFORmATION
Our current BBBEE status is level 3 and we have plans in place to improve it to at least level 2. The annual employment equity plans and reports were successfully submitted to the Department of Labour. The new employment equity plan from 2015 to 2018 has been agreed to by both unions at the Mining and Acid Divisions. The Employment Equity forums meet monthly as scheduled and the suggested proposals are taken up with management for implementation. The BBBEE turnaround plan strategy has been approved for implementation in an attempt to improve the current level.
The Company continues to put interventions in place to ensure that we recruit more women in our operations and we currently have 16% of women employed in the Group. There are attempts to bring people with disabilities on board and we are now at 1% and gradually working towards exceeding the legislated 2% target. We are in the process of making structural changes to accommodate people living with disabilities at our workplace.
We have a learner pipe that feeds into the Foskor main employment which empowers local community members with the relevant workplace skills and all lower level vacancies are filled through this pipe line.
We have geared our procurement systems to support the local SMMEs through our preferential procurement policy to ensure that we have a positive impact in our local host communities in both divisions.

FOSKOR INTEGRATED REPORT 2016
30
OuTlOOk
Over the long-term, there will be continued demand for phosphates. The industry is expected to grow on a continued basis. While we see a positive movement in phosphoric acid prices, there are significant competitive challenges from large global players in Morocco and Saudi Arabia. Moreover, during the medium-term forecast, large-scale companies will be increasing their capacity for phosphoric acid. The anticipated increase in available product is likely to put downward pressure on prices. There may not be much pricing pressure in 2016 on sulphur. However, the overriding theme for the next five years is that supply growth will exceed the demand growth for sulphur. This will further increase the pressure on phosphoric acid prices. Granulation MAP prices are forecast to underperform relative to DAP
due to a stronger focus of sales into South America by all major export-oriented producers. Meanwhile as new capacity gets commissioned in Brazil, the market will become increasingly more competitive.
The management team is committed to navigate the Company through all negative market externalities and will work with all our employees and other stakeholders to achieve this objective.
AckNOwlEDGEmENTS
I am grateful to our executive team and staff for their continued commitment in these difficult times. I extend my gratitude to the Chairperson and the Board of Directors for their leadership and support. I would also like to extend my appreciation to Mr Gerrit van Wyk (one of our Board members) who took over as acting CEO from July 2015 until year-end (31 March 2016).
I also extend my appreciation to all our staff for their contribution during this difficult year. Together we will make progress.
u khumaloChief Executive Officer
23 June 2016
cEO’S REvIEw (CONTINUED)
FOSKOR INTEGRATED REPORT 2016
31
FOSkOR INTEGRATED REPORT 2016
31OuR STRATEGIc REvIEw
FOSKOR INTEGRATED REPORT 2016
32
cONTENT AND bOuNDARy The content of this report covers our operations based in South Africa, including our subsidiaries and investments where we have significant influence as listed in the annual financial statements. We have no operations outside of South Africa. An overview of our operations can be found in the “where we operate and sell” to section on pages 6 to 7, and a review of our operational performance from pages 68 to 69. The process of defining the report content has been informed by, amongst other things, expectations and consultation of our key stakeholders, our risk management process, and the governance and reporting standards disclosure requirements.
DETERmINING OuR MATERIAL ITEMS
PROcESS OF DEFINING mATERIAl ISSuESWe define our material issues as those that could substantially affect our ability to create value in the short-, medium- and long-term. An issue is considered material is it could substantially influence our stakeholder’s assessment of our ability to create value. In determining whether an issue is material, we consider the following:
¢¢ We identify relevant matters that could be material when we conduct our strategic review, update our strategic risk registers, and we also consider matters discussed at and reported to the Board.
¢¢ The importance of the matters identified is determined based on its known and potential effect on value during the risk management process where matters are evaluated for likelihood and impact.
¢¢ As part of the evaluation we consider qualitative and quantitative factors.
¢¢ We then prioritise the matters as can be seen in or risk map, and the prioritisation and inclusion of matters in the risk map is done in consultation with the Board.
¢¢ We then disclose those matters that we consider to materially affect Foskor’s performance, and are also considered material for readers to understand how we create value.
The material issues identified after following the process above have been presented in the “our material issues” section of this report on page 40 and their context has been added in order for readers to understand their potential impact. The material issues are prioritised in terms of the strategic risk registers approved by the executive management and the Board. We manage the material issues through the mitigation strategies on pages 40 to 43 and monitoring of previously determined outcomes and key performance indicators. Not all the risks in the strategic risk register are reported as material items, only the risks in the top 10 as they represent the material issues. We continuously manage these material issues to ensure we achieve our strategic objectives. The results of how we have managed the material issues are included in the Material Issues Scorecards on page 40.
The Board will then validate the material issues by assessing whether the integrated report provides a reasonable and balanced view of our performance. The material issues are material within Foskor (Pty) Limited, and not the subsidiaries or associate investments. After the report is published, we will then review it in preparation for the next reporting cycle, taking into account feedback received from our stakeholders, and these findings are incorporated into the next reporting cycle.
“We continuously manage these material items to ensure we achieve our strategic objectives.”

FOSKOR INTEGRATED REPORT 2016
hOw wE mANAGE RISk
hOw wE MANAGE RISK
Acceptrisks
Evaluate risks
¢¢ Identify treatment options
¢¢ Evaluate treatment options
¢¢ Select treatment options
¢¢ Prepare treatment plans
¢¢ Implement plans
Treat risks
Identify risks
¢¢ What can happen?
¢¢ How can it happen?
cOmmuNIcATE AND
cONSulT
Analyse risks
determine existing controls
Establish the
context
¢¢ The strategic context
¢¢ The organisational context
¢¢ The risk management context
¢¢ Develop criteria
¢¢ Decide the structure
estimate level
of risk
determine likelihood
determine impact
No
Yes
¢¢ Compare against criteria
¢¢ Set risk priorities
mONITOR AND
REvIEw
OuR RISk mANAGEmENT PROcESS
In order to achieve our strategic objectives we continuously analyse and manage business threats that could negatively affect our ability to achieve our objectives, whilst continuously identifying opportunities to enhance our objectives.
Our risk management strategy aims to provide an early warning system to avoid or mitigate any potential business losses.
33

FOSKOR INTEGRATED REPORT 2016
34
Our risk management process is based on our Enterprise-wide Risk Management (ERM) framework which provides a structured approach to effectively and proactively identify, analyse, evaluate and mitigate such events, providing us with reasonable assurance that our objectives will be met. Our ERM framework is aligned with ISO 31000, Committee of Sponsoring Organisations (COSO), King III and generally accepted good practice. All Group business units, divisions, subsidiaries and processes are subject to our ERM policies.
We have developed strategic, operational, process and project risk profiles. We assess and update each profile and its possible related actions on a quarterly basis. Divisional and operational, process and project risks are reported up to Group level to ensure they are managed in line with the Group’s strategic objectives.
The Risk Appetite and Tolerance Framework approved by the Board of Directors provide the basis for determining the levels of risk appetite and tolerance thresholds in the mitigation and monitoring of the High Significance Strategic risks. An annual strategic risk assessment has been conducted with members of the Executive Management team for the 2016/17 financial year. Any new High Significance Strategic risks identified are reviewed and approved by the Board. Key Risk Indicators for the High Significance Strategic risks have been developed and aligned to the risk appetite and tolerance levels. The High Significance Strategic Risks Appetite and Tolerance dashboard will be executed in the 2016/17 financial year to ensure appropriate risk monitoring and mitigation plans are implemented by Executive Management.
We have secured appropriate property damage, business interruption and liability insurance cover at commercial premiums and terms. Regular reviews of our insurance strategy are fed back into the ERM framework.
We have made substantial progress in achieving the objectives outlined above and will continue to refine our ERM processes, systems and reporting to ensure risk management can achieve and sustain its desired value as a business enabler.
The revised ERM Policy and ERM Framework were approved by the Board of Directors during September 2015. ERM best practice, standards and recommendations made by Internal Audit that suit the business environment have been incorporated in Foskor’s ERM policy and ERM Framework. The policy and framework will help enable Foskor to achieve the desired risk culture and risk maturity level.
Our risk maturity within the organisation is on an upward trend as we further embed the ERM processes and initiatives within the organisation. We are aspiring to achieve
further improvements from a Level 3 risk maturity rating to that of a Level 4 rating within the 2016/17 financial year. We are striving to ensure that our ERM processes and activities are aligned and integrated with Foskor’s strategy, operations and business processes.
management considers the risk appetite of both the Group and divisions, as determined by the Board, in evaluating alternatives, setting objectives, and developing mechanisms to manage risks.
Aligning risk appetite and
strategy
A framework is provided for management to identify and select alternative responses to risk.
Enhancing risk response
decisions
the framework has enhanced management’s ability to identify potential risks, establish appropriate responses by implementing effective controls and reduce associated costs and losses.
Reducing operational
losses
regular consideration of a full range of potential events helps management identify and capitalise on opportunities.
capitalising on opportunities
reliable risk information allows management to assess overall capital needs, enhancing capital allocation.
Improving allocation of
capital
regular regulatory forecasting, impact assessments and reviews of applicable laws and regulatory changes reduce compliance risks.
Ensuring compliance
with laws and regulations
ObjEcTIvES AchIEvED ThROuGh OuR FRAmEwORk
OuR RISk mANAGEmENT PROcESS (CONTINUED)
Risk Management’s focus is to enable the achievement of our strategic objectives through:
¢¢ monitoring of our strategic risk appetite and tolerance levels to enable effective management decision making by seeking further opportunities as well as ensure effective risk mitigation;

FOSKOR INTEGRATED REPORT 2016
35hOw wE mANAGE RISk
¢¢ further development and implementation of Strategic Key Risk Indicators (KRI’S) to enable effective monitoring by management;
¢¢ monitoring and reporting on critical risks mitigation plans and effective control monitoring; and the
¢¢ effective utilisation of the CURA ERM system and risk management tools by the dedicated risk champions.
OuR kEy RISkS AND OPPORTuNITIES The key opportunities identified for our business are:
¢¢ an upturn in the commodity cycle will have a positive impact on our
ThIS IS A PIcTuREcONTENT TO bE SuPPlED
AND DESIGN TO bE APPlIEDLIK
ELI
HO
OD
IMPACT
20
1917
15
12
3
4
85
7
610
613
9
11
12
3
2 1
7
6 4
8
16
18
14
13
12
119
10
2016 Risk Rating2015 Risk RatingNot previously included
1. Global phosphoric acid market volatility
2. Liquidity risk 3. Volatile industrial relations
climate4. Production inefficiencies 5. Plant breakdown6. Dependency on Transnet
Freight Rail for rail logistics 7. High input costs8. Feasibility of Maputo corridor9. Health and safety legislation
non-compliance 10. Environmental legislation non-
compliance 11. Forex volatility12. Unavailability of PC facilities13. Reputational damage14. Loss of institutional memory15. Dependence on magnetite
sales16. Attraction and retention of skills17. Carbon footprint non-
compliance18. Availability of skills for project
resources19. MPRDA non-compliance20. Competition non-compliance
RISk hEAT mAP
performance as the selling prices of our products will increase;
¢¢ cost containment and improvement of production efficiencies will reduce our cost per ton thereby improving our profits and cash flow;
¢¢ the restructuring of the balance sheet to reduce debt will mitigate the burden on the Company to repay and service debt; and
¢¢ the expansion of current markets and sourcing of new markets will ensure sustained demand for our products thus ensuring profitable revenue streams are maintained or generated.
RISk GOvERNANcE PROcESS
OvERSIGhT
bOARD AuDIT AND RISk
ExcO
INTERNAl AuDIT AND RISk
DIvISION RISk
bOARD
mANAGEmENT
¢¢ Considers the risk management framework and policy
¢¢ Continuously monitors the risk process
¢¢ Design, implement and monitor risk management plan
¢¢ On-going and effective assessment of risk
¢¢ Review of risk registers
¢¢ Assurance on risk management plan and controls
¢¢ Incorporates risk in day-to-day activities
¢¢ Identifies risks
¢¢ Implements system of internal controls to manage risk
¢¢ Incorporates risks identified through stakeholder consultation
¢¢ Approves risk management framework and policy
¢¢ Approves and monitors risk management plan
¢¢ Sets rand monitors risk tolerance and appetite limits
¢¢ Identifies and monitors strategic risks
Our key risks are the strategic risks that have been identified in our risk management process, and have been approved by the Board as the Company’s strategic risks. The strategic risks are presented in the heat map above, and a comparison of their ratings in the previous year as well as new risks not included in the previous year is presented.
The top 10 strategic risks have then been prioritised as the top priority material issues and form the thread of the report.
4 5

FOSKOR INTEGRATED REPORT 2016
36
RISk DEScRIPTION context
mitigating strategies
material issue link
Strategic priority
Outcome managed
1
Global phosphoric acid volatility
Foskor is a price taker in the global phosphoric acid market. The commodity selling prices are set by the market. The sensitivities to movements in these prices are significant for our business and can cause major fluctuations in performance.
¢¢ Minimise dependency on phosphoric acid market, products and customers
¢¢ Grow local market presence and granular fertiliser sales
¢¢ Further downstream beneficiation, for example NPK blending
¢¢ Magnetite sales and beneficiation projects
Sustainability of phosphates business
Customer value and cash generation
¢¢ EBITDA upliftment
¢¢ Development of new markets
¢¢ Development of new products
2
liquidity risk
Our sustained existence and growth is highly dependent on our ability to generate funds internally and externally. The volatility of the market and fluctuation in performance requires us to have sufficient funds to sustain operations in the downward cycle.
¢¢ Sourcing additional funding
¢¢ EBITDA upliftment – restructuring to improve profits and cash
¢¢ Cash flow management – cash generation
Funding and liquidity Cash generation ¢¢ EBITDA upliftment
¢¢ Sourcing funding
¢¢ Cash flow and liquidity
¢¢ Cost control
3
volatile industrial relations climate
The local mining industry is prone to industrial action and organised labour protests. Management needs to manage the relationship with the employees and their representation, as well as proactively deal with employee issues that could lead to industrial action.
¢¢ Improving engagement with labour unions and their members
¢¢ Regular assessment of remuneration and employee benefits
¢¢ Improved employee wellbeing
Employee wellbeing People ¢¢ Staff turnover
¢¢ Safety and health performance
¢¢ Industrial relations
4
Production inefficiencies
Production inefficiencies are caused by a number of factors including plant down time and inefficient use of resources to produce the finished product.
¢¢ Investment in capital replacement programme at Acid Division to replace ageing machinery
¢¢ Improving production efficiency ratios (production output and use of input raw materials)
¢¢ Meeting production targets
Improved operational performance
Operational excellence
¢¢ Production performance
¢¢ Production efficiency
¢¢ Movement of raw materials
¢¢ Minimise plant downtime
5
Plant breakdown
Availability and reliability of mining and manufacturing equipment is key to successful operation of the production facilities.
¢¢ Minimising unplanned plant stoppages
¢¢ Meeting production targets
¢¢ Asset replacement programme
Improved operational performance
Operational excellence
¢¢ Production performance
¢¢ Minimise plant downtime
OuR RISk mANAGEmENT PROcESS (CONTINUED)

FOSKOR INTEGRATED REPORT 2016
37hOw wE mANAGE RISk
RISk DEScRIPTION context
mitigating strategies
material issue link
Strategic priority
Outcome managed
6
Dependency on Transnet Freight Rail for rail logistics
We are overly reliant on TFR’s Phalaborwa – Richards Bay railway line for the transport of our rock. The line suffers from capacity constraints, resulting in performance variability and high prices.
¢¢ Having more than one rail corridor
¢¢ Improved relationship with Transnet
Improved operational performance
Liquidity
Cost control
Operational excellence
¢¢ Movement of raw materials
7
high input costs
In order for us to remain competitive in the market we need to produce at a competitive cost. Some of the inputs such as sulphur and ammonia are commodities and their prices are dictated by the market.
¢¢ EBITDA upliftment – operational cost reduction
¢¢ Improvement of cost per ton of production costs
Cost control Operational excellence
¢¢ Operational cost savings
¢¢ Production efficiency
8
Feasibility of maputo corridor
Rock is currently exported from Phalaborwa through Maputo. This corridor’s railing; storage and handling costs are expensive compared to other corridors.
¢¢ Developing alternatives to export rock through Richards Bay
¢¢ Reducing cost of exporting through Maputo
Cost control Operational excellence
¢¢ Movement of raw materials
¢¢ Cost control
9
health & Safety legislation non-compliance
Due to the nature of our business our staff is exposed to a variety of hazardous materials and operational hazards. The health and safety of our employees is a key concern. We are also required to comply with stringent health and safety legislation for our Mining and Acid production facilities.
¢¢ Improving health and safety target ratios and performance
¢¢ Reducing the occurrence of occupational diseases
¢¢ Zero fatalities
¢¢ Retaining ISO certifications
Employee wellbeing
People ¢¢ Occupational health and safety targets
¢¢ Compliance to laws and regulations
¢¢ Maintaining licence to operate
10
Environmental legislation compliance
Both our Mining and Acid productions have the potential to negatively impact the environment. The financial and reputational risk associated with legislative non-compliance is high. The introduction of carbon tax legislation to encourages the reduction of greenhouse gas emissions makes high energy consumption a risk to cost efficiency.
¢¢ Reducing energy consumption and greenhouse gas emissions
¢¢ Reducing fresh water consumption
¢¢ Complying with environmental operating licences (air quality, gypsum disposal, mining rehabilitation)
Social licence to operate
Operational excellence and people
¢¢ Environmental compliance
¢¢ Maintaining licence to operate
¢¢ Operating responsibility to the environment, community and staff
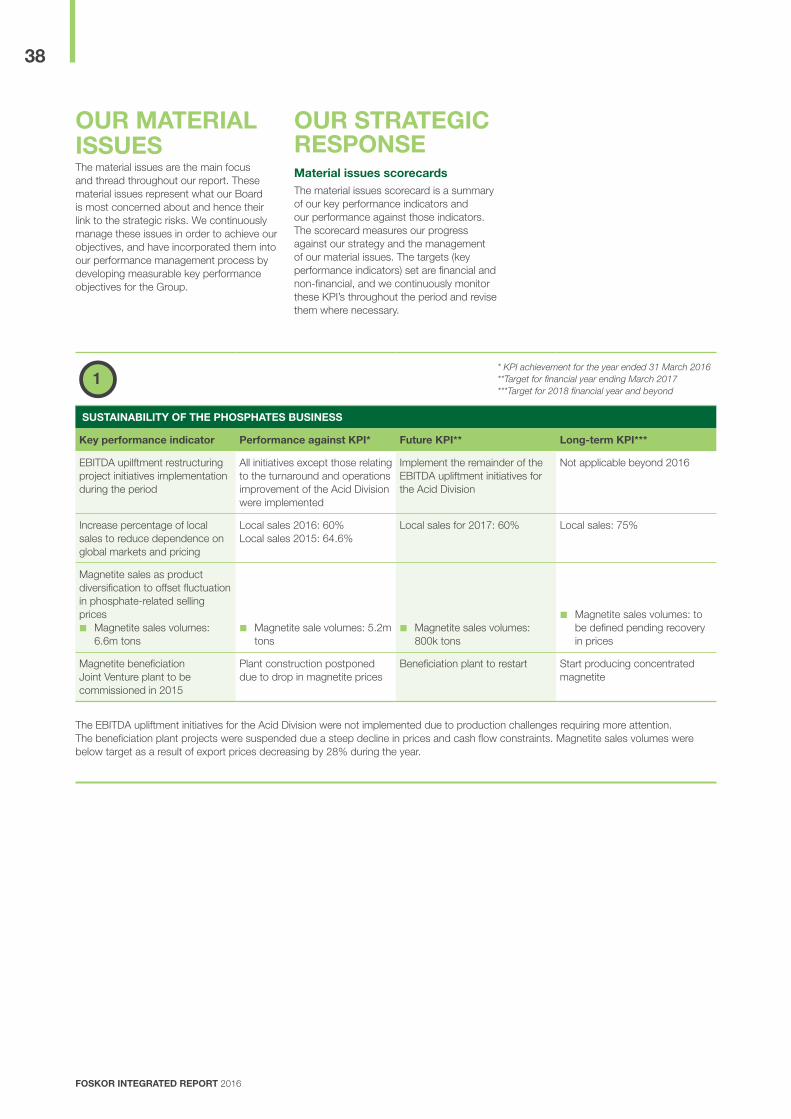
FOSKOR INTEGRATED REPORT 2016
38
OuR mATERIAl ISSuESThe material issues are the main focus and thread throughout our report. These material issues represent what our Board is most concerned about and hence their link to the strategic risks. We continuously manage these issues in order to achieve our objectives, and have incorporated them into our performance management process by developing measurable key performance objectives for the Group.
1
SuSTAINAbIlITy OF ThE PhOSPhATES buSINESS
key performance indicator Performance against kPI* Future kPI** long-term kPI***
EBITDA upilftment restructuring project initiatives implementation during the period
All initiatives except those relating to the turnaround and operations improvement of the Acid Division were implemented
Implement the remainder of the EBITDA upliftment initiatives for the Acid Division
Not applicable beyond 2016
Increase percentage of local sales to reduce dependence on global markets and pricing
Local sales 2016: 60% Local sales 2015: 64.6%
Local sales for 2017: 60% Local sales: 75%
Magnetite sales as product diversification to offset fluctuation in phosphate-related selling prices¢¢ Magnetite sales volumes:
6.6m tons¢¢ Magnetite sale volumes: 5.2m
tons¢¢ Magnetite sales volumes:
800k tons
¢¢ Magnetite sales volumes: to be defined pending recovery in prices
Magnetite beneficiation Joint Venture plant to be commissioned in 2015
Plant construction postponed due to drop in magnetite prices
Beneficiation plant to restart Start producing concentrated magnetite
The EBITDA upliftment initiatives for the Acid Division were not implemented due to production challenges requiring more attention. The beneficiation plant projects were suspended due a steep decline in prices and cash flow constraints. Magnetite sales volumes were below target as a result of export prices decreasing by 28% during the year.
OuR STRATEGIc RESPONSE material issues scorecards The material issues scorecard is a summary of our key performance indicators and our performance against those indicators. The scorecard measures our progress against our strategy and the management of our material issues. The targets (key performance indicators) set are financial and non-financial, and we continuously monitor these KPI’s throughout the period and revise them where necessary.
* KPI achievement for the year ended 31 March 2016**Target for financial year ending March 2017 ***Target for 2018 financial year and beyond

FOSKOR INTEGRATED REPORT 2016
39hOw wE mANAGE RISk
2
FuNDING AND lIQuIDITy
key performance indicator Performance against kPI* Future kPI** long-term kPI***
Appointment of external consultants to prioritise capital projects and future capital needs
Consultants appointed and report issued
Not applicable Not applicable
Review suspension of PC production stream
Suspension still effective Not applicable Not applicable
Replace short-term funding with long-term facilities
Short-term funds decreased from R800m to R400m Long-term funding decreased from R1.7bn to R700m
Recapitalisation of the balance sheet:
¢¢ Debt to equity: 46%
Recapitalisation of the balance sheet:
¢¢ Debt to equity: 60%
Cash flow management targets¢¢ Generated from operations:
R65m
¢¢ Free cash flow: R425m negative
¢¢ Cash flow management targets
¢¢ Cash utilised by operations: R51m
¢¢ Free cash flow: R449m negative
Cash flow management targets
¢¢ Generated from operations: R916m
¢¢ Free cash flow: R198m
Cash flow management targets
¢¢ Generated from operations: R1.2bn
¢¢ Free cash flow: R618m
Net debt by March 2016: R1bn Net debt at March 2016 R1bn Net debt at March 2017 R226m Net debt R775m
The cash flow management targets were worse than target as a result of the EBIT performance stemming from production challenges at the Acid Division and lower than expected magnetite earnings due to the fall in export prices.
3
EmPlOyEE wEllbEING
key performance indicator Performance against kPI* Future kPI** long-term kPI***
Safety indicators:¢¢ Fatalities: 0 ¢¢ Fatalities: 0 ¢¢ Fatalities: 0 ¢¢ Fatalities: 0
¢¢ LTIFR: <1 ¢¢ LTIFR: 0.36 ¢¢ LTIFR: <1 ¢¢ LTIFR: <1
¢¢ Reduction in occurrence of occupational diseases
¢¢ Occupational diseases reduced from 10 to 3
¢¢ Occupational diseases: 0 ¢¢ Occupational diseases: 0
Retain: Retained: Retain: Retain: ¢¢ OHSAS 18001 ¢¢ OHSAS 18001 ¢¢ OHSAS 18001 ¢¢ OHSAS 18001
¢¢ SANS 16001 ¢¢ SANS 16001 ¢¢ SANS 16001 ¢¢ SANS 16001
Staff turnover: 5% Staff turnover: 6% Staff turnover: less than 5% of headcount
Staff turnover: less than 5% of headcount
Salary scales review Salary scales review conducted Not applicable Not applicable
Zero strikes/industrial action Zero strikes/industrial action Zero strikes/industrial action Zero strikes/industrial action
The safety targets for Acid Division improved significantly – occupational diseases reported were nil – whereas the occupational diseases reported at the Mining Division were 10 and an increase in lost-time injuries from 10 to 10.
* KPI achievement for the year ended 31 March 2016**Target for financial year ending March 2017 ***Target for 2018 financial year and beyond

FOSKOR INTEGRATED REPORT 2016
40
4
ImPROvED OPERATIONAl PERFORmANcE
key performance indicator Performance against kPI* Future kPI** long-term kPI***
Asset replacement programme capital expenditure budget: R1.66bn for 2016 FY
Asset replacement programme capital expenditure to date: R62m
Asset replacement programme: R1.2bn
Asset replacement programme: R1.1bn
Phosphoric acid production efficiency: 89.36%
Efficiency: 78.75% Efficiency: 86% Efficiency: 92%
Plant breakdown indicators: Unplanned downtime hours: 7 129 hours
Unplanned downtime hours: 0
Unplanned downtime hours: 0
¢¢ Number of unplanned downtime hours (Acid Division): 0
¢¢ Duration of planned shutdown: 35 days
¢¢ Duration of planned shutdown: 40 (25 and 15) days
¢¢ Duration of planned shutdown: 30 days
¢¢ Duration of planned shutdowns: 25 days
¢¢ Number of shutdowns: 3 (second one unplanned)
¢¢ Number of shutdowns: 2 ¢¢ Number of shutdowns: 1
Rock logistics moved: ¢¢ 11 rock trains to Richards
Bay a week¢¢ Trains to Richards Bay per
week: 8.2¢¢ 11 rock trains to Richards
Bay a week¢¢ 11 rock trains to Richards
Bay a week
¢¢ Railed to Richards Bay: 1.78m tons
¢¢ Railed to Richards Bay: 1.53m tons
¢¢ Railed to Richards Bay: 1.78m tons
¢¢ Exported through Maputo: 300k tons
¢¢ Exported rock tons: 307k tons
¢¢ Export rock thorough Maputo (300k tons) and Richards Bay (250k tons)
Planned production output:¢¢ Rock: 1.96m tons
¢¢ Phosphoric acid: 500k tons
¢¢ Granular fertiliser: 370k tons
Production¢¢ Rock: 1.98m tons
¢¢ Phosphoric acid: 307 tons
¢¢ Granular fertiliser: 198k tons
Production¢¢ Rock: 1.96m tons
¢¢ Phosphoric acid: 550k tons
¢¢ Granular fertiliser: 400k tons
Production¢¢ Rock: 2.3m tons
¢¢ Phosphoric acid: 700k tons
¢¢ Granular fertiliser: 450k tons
The phosphoric acid efficiency target is linked to the worse than targeted production performance. The production performance at the Acid Division was due to the reactor failure, tank availability shortages, water and power supply shortages. Due to the production problems at the Acid plant, rock was railed to Maputo instead, hence the export sales tons were above budget.
* KPI achievement for the year ended 31 March 2016**Target for financial year ending March 2017 ***Target for 2018 financial year and beyond
OuR STRATEGIc RESPONSE (CONTINUED)

FOSKOR INTEGRATED REPORT 2016
41hOw wE mANAGE RISk
5
cOST cONTROl
key performance indicator Performance against kPI* Future kPI** long-term kPI***
Achievement of EBITDA cost-saving targets
100% of EBITDA upliftment cost-saving targets achieved
Not applicable Not applicable
Cost savings from: ¢¢ Approved opex 2016 budget
¢¢ Logistic costs budget
Group opex savings 5.7% of 2016 budgetActual distribution costs 35% below budget
Cost savings from ¢¢ Approved 2017 opex budget
¢¢ Logistic costs budget
Cost savings from ¢¢ Approved opex budget
¢¢ Logistic costs budget
Commodity input costs within budget
Sulphur cost per ton 11% above budget
Ammonia cost per ton equal to budget
Commodity input costs within budget
Commodity input costs within budget
Distribution costs within budget:¢¢ Maputo
¢¢ Richards Bay
Distribution costs to: ¢¢ Richards Bay 18% below
budget
¢¢ Maputo 3% above budget
Distribution costs within budget:¢¢ Maputo
¢¢ Richards Bay
Distribution costs within budget:¢¢ Maputo
¢¢ Richards Bay
Production cost per ton within budget:¢¢ Rock
¢¢ Phosphoric acid
Production cost per ton:¢¢ Rock cost per ton 4%
below budget
¢¢ Phosphoric acid cost per ton 25% above budget
Production cost per ton within budget:¢¢ Rock
¢¢ Phosphoric acid
Production cost per ton within budget:¢¢ Rock
¢¢ Phosphoric acid
Distribution costs to Richards Bay positive variance is attributable to lower than budgeted rail rates and volumes railed. The Maputo negative variance is as a result of higher than budgeted export sales volumes. The phosphoric acid cost per ton target was not achieved because of production challenges experienced at the plant and production volumes being 71% of target.
6
SOcIAl lIcENcE TO OPERATE
key performance indicator Performance against kPI* Future kPI** long-term kPI***
Retain:¢¢ ISO 14001
¢¢ ISO 9001
Retained:¢¢ ISO 14001
¢¢ ISO 9001
Retain:¢¢ ISO 14001
¢¢ ISO 9001
Retain:¢¢ ISO 14001
¢¢ ISO 9001
¢¢ Targeted compliance: Zero incidence of non-compliance and fines
¢¢ Zero incidence of non-compliance and fines
¢¢ Targeted compliance: Zero incidence of non-compliance and fines
¢¢ Targeted compliance: Zero incidence of non-compliance and fines
Maintain/renew licences to operate and legal compliance¢¢ Water
¢¢ Air
¢¢ Mining
Maintained licences to operate and legal compliance ¢¢ Water usage
¢¢ Air quality
¢¢ Mining
Maintain/renew licences to operate¢¢ Water
¢¢ Air
¢¢ Mining
Maintain/renew licences to operate¢¢ Water
¢¢ Air
¢¢ Mining
Mining Charter compliance Achieved Mining Charter compliance
Mining Charter compliance Mining Charter compliance
Mine rehabilitation compliance Mine rehabilitation trust and guarantees in place
Mine rehabilitation compliance Mine rehabilitation compliance
BBBEE Transformation compliance – Level 3 target
BBBEE Level 5 BBBEE Level 3 target BBBEE Level 2 target
Stakeholder engagement Stakeholder engagements, CSI, LED, Community projects
Stakeholder engagement to be improved and feedback monitored
Not applicable
BBBEE Level 5 is lower than the target of Level 3 due to programmes to improve the rating being postponed due to Company performance. Plans to improve the BEE rating to Level 3 are being developed, and will also incorporate the requirements of the new Codes. Commodity prices.
* KPI achievement for the year ended 31 March 2016**Target for financial year ending March 2017 ***Target for 2018 financial year and beyond

FOSKOR INTEGRATED REPORT 2016
42
GOvERNANcE AND remuNerAtIoN
GOvERNANcEGOvERNANcE FRAmEwORk The Board is committed to applying the principles of corporate governance and it recognises that good corporate governance is essential in protecting the interests of all stakeholders. The governance structures and processes are regularly reviewed and updated
to accommodate internal developments and reflect best practice.
The Board is accountable and responsible overall for the performance of the Company. Its role includes the establishment, review and monitoring of strategic objectives, approving major transactions, and oversight over the Group’s systems of internal control, governance and risk management. The Board is also responsible for ensuring compliance with all relevant laws, regulations and codes. The Board’s role is related to all economic, environmental and social impacts. The detailed description of the Board’s responsibilities is contained in the Board Charter. New directors are informed of their duties through a formal induction process. Directors’ training is held at least once a year to keep the directors updated with regards to their responsibilities and economic, environmental and social topical issues. The independence of directors is regularly assessed in accordance with Companies Act guidelines, half the Board is made up of independent directors while the other half represents the shareholders.
The Board delegates certain functions to the Board Committees and management to assist in properly discharging its duties.
The Board committees are the Audit and Risk; Human Capital and Nominations; Technical; and Social and Ethics committees. The Board committees are then supported by the Executive Committee and a number of executive sub-committees namely the Internal Audit and Risk; Fraud Prevention and Ethics; ICT Steering Committee; Remuneration; and Compliance.
The Board selects and appoints the Company Secretary and recognises the pivotal role that this person plays in entrenching good corporate governance. All directors have unlimited access to the advice and services of the Company Secretary, who is responsible for ensuring that Board procedures are adequately followed.
The Board has adopted a comprehensive delegation of authority matrix aimed at clarifying the various limits of authority in place within the Group. The overall responsibility of management rests with the Chief Executive Officer and he gives regular reports about the achievement of Group objectives to the Board.
An externally conducted independent Board effectiveness evaluation was concluded in 2014 and actions are being developed in response to the outcomes of the evaluation.
“We apply the principles of good corporate governance.”

FOSKOR INTEGRATED REPORT 2016
43GOvERNANcE AND REmuNERATION
For detailed biographies of the Board and Executives go to www.foskor.co.za
ThE bOARD AND ITS GOvERNANcE STRucTuRES
kING IIIthe majority of
the Board does not comprise independent
Non-executive directors
kING IIIthe role of the Chairman is
not independent (representing the
shareholder)
kING IIIthe roles of the
Chairman and Ceo are separate
NON-ExEcuTIvE DIREcTORSMG Qhena
RJ Gaveni
G van Wyk
A Vellayan
JR Barton (Independent)
N Medupe (Independent)
NG Nika (Independent)
DS Phaho (Independent)
L Sennelo
VD Mazibuko
VS Sahney
V Ravichandran
ExEcuTIvE DIREcTORchief Executive Officer:
U Khumalo
bOARD OF DIREcTORS
lAwS/REGulATIONS/cODES POlIcIES AND GuIDElINES
Some key laws/Regulations/codes:
Basic Conditions of Employment Act, 1997 Companies Act, 2008King Report on Corporate Governance (King III) Compensation for Occupational Injuries and Diseases Act, 1993 Competition Act, 1998Employment Equity Act, 1998Explosives Act, 2003 Labour Relations Act, 1995Legal Metrology Act, 2014Mine Health and Safety Act, 1996Occupational Health and Safety Act, 1993Mineral and Petroleum Resources Development Act, 2002National Environmental Management Act, 1998National Environmental Management Act: Air Quality Act, 2004National Environmental Management: Biodiversity Act, 2004National Environmental Management: Integrated Coastal Management Act, 2008National Environmental Management Act: Waste Act, 2008National Nuclear Regulator Act, 1999Broad Based Black Economic Empowerment Act, 2003Fertilizers, Farm Feeds, Agricultural Remedies and Stock Remedies Act, 1947Hazardous Substances Act, 1973National Railway Safety Regulator Act, 2002National Water Act, 1998
Board and Committee Charters
Terms of reference
Delegation of Authority
Code of Ethics
Board-approved policies
mANAGEmENT
ExEcuTIvE cOmmITTEEU Khumalo (Chairman)
KM CeleJM MorotobaDP Singh
MA DindarSx LuthuliSM Sibisi
chAIRmANMG Qhena (Non-executive Director)
chIEF ExEcuTIvE OFFIcERU Khumalo (Executive Director)
bOARD cOmmITTEES
bOARD TEchNIcAl cOmmITTEED Phaho (Chairman)
JR Barton
U Khumalo
VD Mazibuko
V Ravichandran
bOARD humAN cAPITAl AND NOmINATIONS cOmmITTEEG van Wyk (Chairman)
MG Qhena
RJ Gaveni
A Vellayan
VS Sahney
U Khumalo
bOARD SOcIAl AND EThIcS cOmmITTEEG van Wyk (Chairman)
MG Qhena
RJ Gaveni
A Vellayan
VS Sahney
U Khumalo
bOARD AuDIT AND RISk cOmmITTEENG Nika (Chairman)
N Medupe
G van Wyk
L Sennelo

FOSKOR INTEGRATED REPORT 2016
44
ThE ROlE AND FuNcTION OF ThE bOARD
Attendance of scheduled and ad hoc meetings The Board members are required to attend all scheduled meetings of the Board, including meetings called on an ad hoc basis for special matters. There were no special Board meetings during the year.
ATTENDANcE REGISTER
board member
board meetings
Audit and Risk
human capital and Nominations
Social and Ethics Technical
MG Qhena 4/4 M 4/4 M 4/4
MA Pitse1 1/1 I 2/2 M 1/1 M 1/1 M 1/1
RJ GaveniA 4/4 M 4/4 M 4/4
G van Wyk 4/4 M 5/5 C 4/4 C 4/4 M 3/4
A Vellayan 2/4 M 2/4 M 2/4
JR Barton 3/4 M 3/4
N Medupe 4/4 M 5/5
NG Nika 4/4 C 5/5
DS Phaho 4/4 C 4/4
VS Sahney2 3/3 M 3/3 M 3/3
VD Mazibuko3 3/3 M 2/3
V Ravichandran4 2/3 M 2/3
L Sennelo5 2/3 M 2/3
C: Chairman M: Member I: Invitee A: Acting chairman1. Contract ended June 20152. Appointed June 20153. Appointed June 20154. Appointed June 20155. Appointed June 2015
The Board is satisfied that the committees have effectively carried out their responsibilities according to their charters and terms of reference. A brief summary of the responsibilities of the committees, membership and their key focus areas during the year are summarised below:
AuDIT AND RISk cOmmITTEE
members Area of responsibility key focus for the year
NG Nika (Chairman)
N Medupe
G van Wyk
L Sennelo
The Board Audit and Risk Committee assists the Board in carrying out its responsibilities to stakeholders in respect of the Company’s accounting, auditing, internal control and reporting practices.
The committee is authorised by the Board to examine any internal audit report and financial information it wishes to, and can instruct the management of Foskor, the internal auditors or the external auditors to conduct any investigation it considers necessary. Both the internal and external auditors have unrestricted access to the committee
¢¢ Approved and monitored the external audit plan
¢¢ Assessed the independence of the external auditor
¢¢ Obtained an unqualified audit opinion on the financial statements and recommended their approval to the Board
¢¢ Recommended the approval of the integrated annual report to the Board
¢¢ Approved and monitored the internal audit plan
¢¢ Obtained assurance over effectiveness of internal controls
¢¢ Oversight over the successful closure of the ERP implementation project
¢¢ Monitored ICT governance implementation
¢¢ Monitoring of the implementation of the risk management plan
¢¢ Monitoring the implementation of compliance risk management process
GOvERNANcE (CONTINUED)
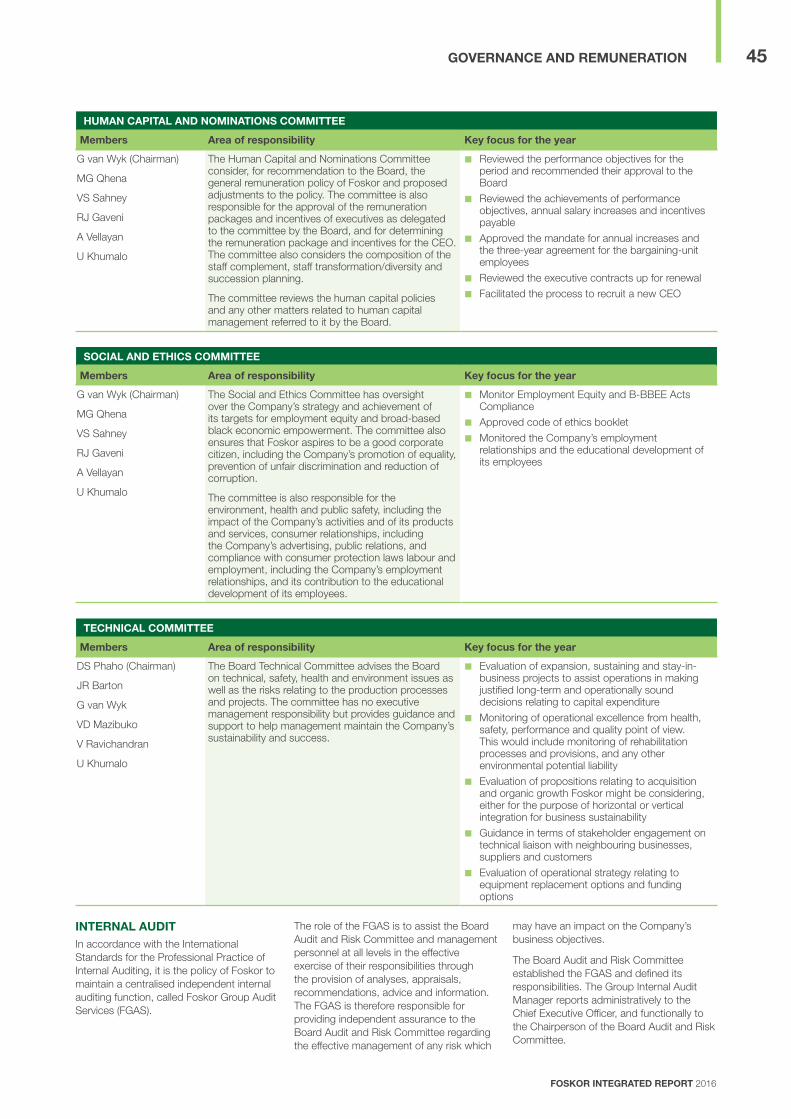
FOSKOR INTEGRATED REPORT 2016
45GOvERNANcE AND REmuNERATION
humAN cAPITAl AND NOmINATIONS cOmmITTEE
members Area of responsibility key focus for the year
G van Wyk (Chairman)
MG Qhena
VS Sahney
RJ Gaveni
A Vellayan
U Khumalo
The Human Capital and Nominations Committee consider, for recommendation to the Board, the general remuneration policy of Foskor and proposed adjustments to the policy. The committee is also responsible for the approval of the remuneration packages and incentives of executives as delegated to the committee by the Board, and for determining the remuneration package and incentives for the CEO. The committee also considers the composition of the staff complement, staff transformation/diversity and succession planning.
The committee reviews the human capital policies and any other matters related to human capital management referred to it by the Board.
¢¢ Reviewed the performance objectives for the period and recommended their approval to the Board
¢¢ Reviewed the achievements of performance objectives, annual salary increases and incentives payable
¢¢ Approved the mandate for annual increases and the three-year agreement for the bargaining-unit employees
¢¢ Reviewed the executive contracts up for renewal
¢¢ Facilitated the process to recruit a new CEO
SOcIAl AND EThIcS cOmmITTEE
members Area of responsibility key focus for the year
G van Wyk (Chairman)
MG Qhena
VS Sahney
RJ Gaveni
A Vellayan
U Khumalo
The Social and Ethics Committee has oversight over the Company’s strategy and achievement of its targets for employment equity and broad-based black economic empowerment. The committee also ensures that Foskor aspires to be a good corporate citizen, including the Company’s promotion of equality, prevention of unfair discrimination and reduction of corruption.
The committee is also responsible for the environment, health and public safety, including the impact of the Company’s activities and of its products and services, consumer relationships, including the Company’s advertising, public relations, and compliance with consumer protection laws labour and employment, including the Company’s employment relationships, and its contribution to the educational development of its employees.
¢¢ Monitor Employment Equity and B-BBEE Acts Compliance
¢¢ Approved code of ethics booklet
¢¢ Monitored the Company’s employment relationships and the educational development of its employees
TEchNIcAl cOmmITTEE
members Area of responsibility key focus for the year
DS Phaho (Chairman)
JR Barton
G van Wyk
VD Mazibuko
V Ravichandran
U Khumalo
The Board Technical Committee advises the Board on technical, safety, health and environment issues as well as the risks relating to the production processes and projects. The committee has no executive management responsibility but provides guidance and support to help management maintain the Company’s sustainability and success.
¢¢ Evaluation of expansion, sustaining and stay-in-business projects to assist operations in making justified long-term and operationally sound decisions relating to capital expenditure
¢¢ Monitoring of operational excellence from health, safety, performance and quality point of view. This would include monitoring of rehabilitation processes and provisions, and any other environmental potential liability
¢¢ Evaluation of propositions relating to acquisition and organic growth Foskor might be considering, either for the purpose of horizontal or vertical integration for business sustainability
¢¢ Guidance in terms of stakeholder engagement on technical liaison with neighbouring businesses, suppliers and customers
¢¢ Evaluation of operational strategy relating to equipment replacement options and funding options
INTERNAl AuDITIn accordance with the International Standards for the Professional Practice of Internal Auditing, it is the policy of Foskor to maintain a centralised independent internal auditing function, called Foskor Group Audit Services (FGAS).
The role of the FGAS is to assist the Board Audit and Risk Committee and management personnel at all levels in the effective exercise of their responsibilities through the provision of analyses, appraisals, recommendations, advice and information. The FGAS is therefore responsible for providing independent assurance to the Board Audit and Risk Committee regarding the effective management of any risk which
may have an impact on the Company’s business objectives.
The Board Audit and Risk Committee established the FGAS and defined its responsibilities. The Group Internal Audit Manager reports administratively to the Chief Executive Officer, and functionally to the Chairperson of the Board Audit and Risk Committee.
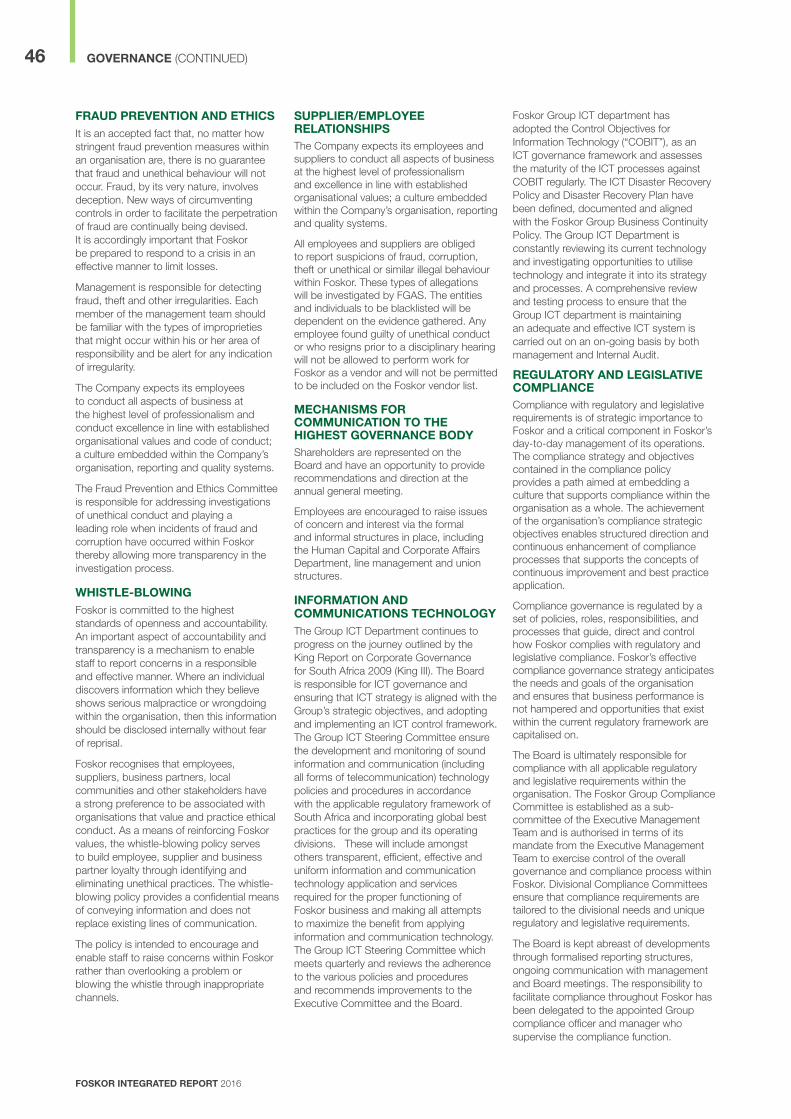
FOSKOR INTEGRATED REPORT 2016
46 GOvERNANcE (CONTINUED)
FRAuD PREvENTION AND EThIcSIt is an accepted fact that, no matter how stringent fraud prevention measures within an organisation are, there is no guarantee that fraud and unethical behaviour will not occur. Fraud, by its very nature, involves deception. New ways of circumventing controls in order to facilitate the perpetration of fraud are continually being devised. It is accordingly important that Foskor be prepared to respond to a crisis in an effective manner to limit losses.
Management is responsible for detecting fraud, theft and other irregularities. Each member of the management team should be familiar with the types of improprieties that might occur within his or her area of responsibility and be alert for any indication of irregularity.
The Company expects its employees to conduct all aspects of business at the highest level of professionalism and conduct excellence in line with established organisational values and code of conduct; a culture embedded within the Company’s organisation, reporting and quality systems.
The Fraud Prevention and Ethics Committee is responsible for addressing investigations of unethical conduct and playing a leading role when incidents of fraud and corruption have occurred within Foskor thereby allowing more transparency in the investigation process.
whISTlE-blOwING Foskor is committed to the highest standards of openness and accountability. An important aspect of accountability and transparency is a mechanism to enable staff to report concerns in a responsible and effective manner. Where an individual discovers information which they believe shows serious malpractice or wrongdoing within the organisation, then this information should be disclosed internally without fear of reprisal.
Foskor recognises that employees, suppliers, business partners, local communities and other stakeholders have a strong preference to be associated with organisations that value and practice ethical conduct. As a means of reinforcing Foskor values, the whistle-blowing policy serves to build employee, supplier and business partner loyalty through identifying and eliminating unethical practices. The whistle-blowing policy provides a confidential means of conveying information and does not replace existing lines of communication.
The policy is intended to encourage and enable staff to raise concerns within Foskor rather than overlooking a problem or blowing the whistle through inappropriate channels.
SuPPlIER/EmPlOyEE RElATIONShIPS The Company expects its employees and suppliers to conduct all aspects of business at the highest level of professionalism and excellence in line with established organisational values; a culture embedded within the Company’s organisation, reporting and quality systems.
All employees and suppliers are obliged to report suspicions of fraud, corruption, theft or unethical or similar illegal behaviour within Foskor. These types of allegations will be investigated by FGAS. The entities and individuals to be blacklisted will be dependent on the evidence gathered. Any employee found guilty of unethical conduct or who resigns prior to a disciplinary hearing will not be allowed to perform work for Foskor as a vendor and will not be permitted to be included on the Foskor vendor list.
mEchANISmS FOR cOmmuNIcATION TO ThE hIGhEST GOvERNANcE bODyShareholders are represented on the Board and have an opportunity to provide recommendations and direction at the annual general meeting.
Employees are encouraged to raise issues of concern and interest via the formal and informal structures in place, including the Human Capital and Corporate Affairs Department, line management and union structures.
INFORmATION AND cOmmuNIcATIONS TEchNOlOGyThe Group ICT Department continues to progress on the journey outlined by the King Report on Corporate Governance for South Africa 2009 (King III). The Board is responsible for ICT governance and ensuring that ICT strategy is aligned with the Group’s strategic objectives, and adopting and implementing an ICT control framework. The Group ICT Steering Committee ensure the development and monitoring of sound information and communication (including all forms of telecommunication) technology policies and procedures in accordance with the applicable regulatory framework of South Africa and incorporating global best practices for the group and its operating divisions. These will include amongst others transparent, efficient, effective and uniform information and communication technology application and services required for the proper functioning of Foskor business and making all attempts to maximize the benefit from applying information and communication technology. The Group ICT Steering Committee which meets quarterly and reviews the adherence to the various policies and procedures and recommends improvements to the Executive Committee and the Board.
Foskor Group ICT department has adopted the Control Objectives for Information Technology (“COBIT”), as an ICT governance framework and assesses the maturity of the ICT processes against COBIT regularly. The ICT Disaster Recovery Policy and Disaster Recovery Plan have been defined, documented and aligned with the Foskor Group Business Continuity Policy. The Group ICT Department is constantly reviewing its current technology and investigating opportunities to utilise technology and integrate it into its strategy and processes. A comprehensive review and testing process to ensure that the Group ICT department is maintaining an adequate and effective ICT system is carried out on an on-going basis by both management and Internal Audit.
REGulATORy AND lEGISlATIvE cOmPlIANcECompliance with regulatory and legislative requirements is of strategic importance to Foskor and a critical component in Foskor’s day-to-day management of its operations. The compliance strategy and objectives contained in the compliance policy provides a path aimed at embedding a culture that supports compliance within the organisation as a whole. The achievement of the organisation’s compliance strategic objectives enables structured direction and continuous enhancement of compliance processes that supports the concepts of continuous improvement and best practice application.
Compliance governance is regulated by a set of policies, roles, responsibilities, and processes that guide, direct and control how Foskor complies with regulatory and legislative compliance. Foskor’s effective compliance governance strategy anticipates the needs and goals of the organisation and ensures that business performance is not hampered and opportunities that exist within the current regulatory framework are capitalised on.
The Board is ultimately responsible for compliance with all applicable regulatory and legislative requirements within the organisation. The Foskor Group Compliance Committee is established as a sub-committee of the Executive Management Team and is authorised in terms of its mandate from the Executive Management Team to exercise control of the overall governance and compliance process within Foskor. Divisional Compliance Committees ensure that compliance requirements are tailored to the divisional needs and unique regulatory and legislative requirements.
The Board is kept abreast of developments through formalised reporting structures, ongoing communication with management and Board meetings. The responsibility to facilitate compliance throughout Foskor has been delegated to the appointed Group compliance officer and manager who supervise the compliance function.

FOSKOR INTEGRATED REPORT 2016
47GOvERNANcE AND REmuNERATION
There are currently no major court cases or matters of material regulatory censure against Foskor.
compliance Risk methodologyThe economical and efficient management of the compliance risks that Foskor is exposed to is dependent on the development and implementation of
cOmPlIANcE RISk mEThODOlOGyPhase 1 – Compliance Risk Identification Involves the determination of the compliance risks to which Foskor and its business are
exposed to, i.e. to identify the regulatory requirements applicable to Foskor. The technique of control self-assessment is used to identify the compliance risks Foskor are exposed to.
Phase 2 – Compliance Risk Prioritisation Involves the measurement (product of impact/seriousness and probability) and prioritisation of the compliance risks, based on information and data supplied by both management and the compliance function on a consensus basis. Prioritisation forms the foundation for the management of the compliance risks, ensuring that the areas posing the greatest risks are the areas focused on.
Phase 3 – Compliance Risk Management Involves the determination of the status of the identified and prioritised compliance risks by documenting the specific compliance risks the business is exposed to and the control environment mitigating such risks in Compliance Risk Management Plans.
Phase 4 – Compliance Risk Monitoring Involves the determination of the status of the regulatory control environment.
Phase 5 – Compliance Risk Reporting Involves the provision of regular, reliable, valued and timely information regarding Foskor’s level of compliance with applicable regulatory requirements and the compliance risks exposed to.
APPlIcATION OF ThE kING REPORT OF cORPORATE GOvERNANcE (kING III)
The Board is satisfied with its efforts to apply all material aspects of King III during the year. Below is a summary of where there is currently partial compliance or non-compliance; the principles not reported are where full compliance has been achieved.
cODE OF GOvERNANcE PRINcIPlE compliance Explanation for non-compliance
chapter 2: board of Directors
The Board should elect a Chairman who is an independent Non-executive Director.
Where the guidelines in the principle are not applied, a lead independent Director should be appointed and disclosure to justify why the Chairman is not independent should be provided in the integrated annual report.
x The appointment of the lead independent Director is still being considered by the Board.
The Board should comprise a balance of power, with a majority of Non-executive Directors. The majority of Non-executive Directors should be independent.
The majority of the Non-executive Directors should be independent.
x Four of the 13 Directors are independent, the Board considered the mix to be acceptable.
The role of the Chairman should be assessed annually and a succession plan put in place.
x The succession plan is to be developed.
Every Board should have a minimum of two Executive Directors one of whom should be the CEO and the other the director responsible for finance.
x The CFO is not a member of the Board, but he attends all the Board meetings to give financial feedback.
At least one-third of the non-executive Directors should rotate every year.
x Rotation of the Non-executive Directors has not yet been implemented.
chapter 8: Stakeholder relationships
Transparent and effective communication with stakeholders is essential for building and maintaining their trust and confidence.
The Board should consider disclosing in the integrated annual report the number and reasons for refusal of requests of information that were lodged with the Company in terms of the Promotion of Access to Information Act, 2000.
x The Board will consider disclosing in the integrated report the number and reasons for refusal of requests for information that were lodged.
a group-wide risk-based process and procedure to manage and mitigate the company’s compliance risks. The Compliance Risk Methodology provides for a visible (to regulators, shareholders, clients), formalised and structured risk-based process and procedure to manage and reduce the compliance risks to a level acceptable to Foskor.
Foskor’s Compliance Risk Methodology aligns with the requirements of the Generally Accepted Compliance Practice framework, as issued by the Compliance Institute Southern Africa. The framework consists of principles, standards and guidelines that act as a benchmark for compliance best practice for Southern African organisations.
FOSKOR INTEGRATED REPORT 2016
48
REmuNERATION PhIlOSOPhyIn order to attract and retain qualified personnel, we aim to offer fair and competitive remuneration packages. Our remuneration structure provides a job grading system and a salary range for each grade. The remuneration structure is consistent with the Company’s economic requirements and commensurate with those of the communities in which we operate.
We strive to obtain the highest possible degree of employee performance, morale and loyalty through:
¢¢ administering remuneration fairly and equitably;
¢¢ ensuring internal equity and consistency within and between all departments;
¢¢ providing an effective means of controlling payroll costs;
¢¢ providing a standard method of establishing and applying remuneration package rates;
¢¢ facilitating the employment, classification and promotion of employees; and
¢¢ ensuring that Foskor’s remuneration policy is competitive both nationally and globally.
These goals are achieved by:
¢¢ establishing remuneration package ranges that reflect the value of the various occupations;
¢¢ establishing and maintaining justifiable differentials between job levels;
¢¢ ensuring that pay rates and benefits are equal to those offered by other employers providing similar employment; and
¢¢ adjusting remuneration package ranges when warranted by changing economic and competitive factors.
EmPlOyEE bENEFITSFoskor aims to attract and maintain a healthy workforce, and to provide affordable and effective healthcare and death and disability benefits to all employees and their dependants.
Medical care is provided by a well-recognised medical aid provider. Employees have freedom of choice in the level of healthcare taken up, and the Company pays a portion of their contribution. Three months fully paid maternity leave and one-month
REmuNERATION
unpaid benefits are provided to permanent female employees who have been with the company for more than one year. Paternity leave is not provided as family responsibility leave.
Insurance is provided by an insurance company and covers death, permanent and temporary disability and the death of the spouse or partner of the employee. Funeral cover for employees and their dependants and mortgage protection can also be accessed.
Permanent employees must be members of the Company’s retirement fund, which is registered with the Financial Services Board and the South African Revenue Service. The defined benefit fund was closed in 1995, with a total liability as at 31 December 2015 of R38 million. Personnel employed after 1995 are members of the defined contribution fund. The Company contributes to the fund on behalf of the employees every month and individuals can select the level of their own contributions.
Temporary and part-time employees do not qualify for benefits provided to full-time employees such as medical aid, retirement funds, death, permanent or temporary disability insurance covers.
STRucTuRE OF REmuNERATION AcROSS All lEvElSWe have implemented a total guaranteed package approach for management staff and a cost-to-company approach for other levels of staff. These structures rest on three fundamental pillars: internal equity, structuring flexibility and external market competitiveness. These in turn contain and define the total cost of employment, empower employees to structure competitive packages and ensure remuneration that is both equitable and defendable.
“We aim to offer fair and competitive remuneration.”

FOSKOR INTEGRATED REPORT 2016
49GOvERNANcE AND REmuNERATION
Remuneration comprises the following elements:
GuARANTEED REmuNERATION
PERFORmANcE-bASED INcENTIvES OThER
Notional cost of employment benefits Allowances
Short-term incentives
long-term incentives
Circumstantial remuneration consists of allowances and emoluments specific to an individual’s job, plus any arising from skills scarcity. Additional to this are emoluments rewarding specific skills or qualifications deemed necessary for employment in a legal capacity. This allowance is applicable to all levels of employees.
bARGAINING cATEGORy EmPlOyEES
Cost-to-company package
Retirement benefits medical aid death and disability insurance
Housing Transport Divisional performance – production, safety, costs
Not applicable
All Company contributions to retirement funds, group life and disability insurance are included in the package. Employees can structure packages to their own needs.
All bargaining unit employees are paid monthly housing and transport allowances, irrespective of their position. The monetary amount of the transport allowance depends on the distance from the employee’s residence to the workplace.
For staff in the bargaining unit comprise two components: a quarterly component and an annual component based on quarterly/annual achievement of production, safety and cost targets.
mANAGE-mENT cATEGORy EmPlOyEES
Total guaranteed package
Retirement benefits medical aid death and disability insurance
Not applicable Company, divisional and individual performance
Company – Long-term strategic projects, ROCE Not applicable for middle management
Employee Share Ownership Plan units were awarded to employees who had been at Foskor up to 2013. Units vest over five years. Dividends are received when declared by Foskor. Units were awarded to all employees. The sale of the units is restricted until 2016.
This takes into account individual performance, external competitiveness, internal equity and affordability. The package includes contributions to retirement funds, medical aid, group life and disability insurance. Employees can structure their own package to their own needs.
Performance assessment based on short-term goals determined annually. The targets are mainly: earnings, cash, production, safety, cost and transformation
The criteria for long-term incentives include the achievement of particular ROCE targets, product diversification measures, human capital criteria include employee wellbeing, talent management and culture
NON-ExEcuTIvE DIREcTORS
Attendance fees per meeting Short-term incentives
Long-term incentives
Approved by the shareholders annually. Executive Directors are not paid Directors’ fees.
Not applicable Not applicable

FOSKOR INTEGRATED REPORT 2016
50 REmuNERATION (CONTINUED)
Remuneration comprises the following elements:
REmuNERATION ElEmENTS mANAGEmENT cATEGORy EmPlOyEES bARGAINING cATEGORy EmPlOyEESExecutive
managementGeneral management
Senior management
middle management
GuARANTEED REmuNERATION
Notional cost of employment
Annual total guaranteed package Annual cost-to-company package
Guaranteed allowances
Not applicable Housing
Transport
benefits ¢¢ Employer retirement fund contributions
¢¢ Employer medical aid contributions
¢¢ Employer contributions to group life and disability insurance
circumstantial remuneration
¢¢ Job-specific
¢¢ Skills scarcity
¢¢ Legal appointments
vARIAblE REmuNERATION
Short-term incentives
Performance-based
¢¢ Company
¢¢ Divisional
¢¢ Company
¢¢ Divisional
¢¢ Company
¢¢ Divisional
¢¢ Individual
¢¢ Divisional
long-term incentives
Performance-based
¢¢ Company
¢¢ Individual
Not applicable Not applicable
GuARANTEED REmuNERATIONEmployees in management are remunerated on a total guaranteed package. This takes into account individual performance, external competitiveness, internal equity and affordability. Included in the package are all company contributions to retirement funds, medical aid and Group life and disability insurance. Individuals can structure packages to their own needs.
Employees in the bargaining unit are remunerated on a cost-to-company package. All company contributions to retirement funds and Group life and disability insurance are included in the package. Individuals can structure packages to their own needs.
GuARANTEED AllOwANcESAll bargaining unit employees are paid monthly housing and transport allowances, irrespective of their position. The monetary amount of the transport allowance depends on the distance from the employee’s residence to the workplace.
bENEFITSBoth the employer and employee contribute to the employee’s medical aid scheme. Contributions to the Foskor Pension Fund and Chemical Industries National Pension Fund (CINPF) are made by both the employer and employee. Contributions to the Foskor Provident Fund are only made by the employer, though the employee
may decide on the level of contribution. Contributions to the Group life and disability insurance are made by the employer.
vARIAblE REmuNERATION
circumstantial remunerationCircumstantial remuneration consists of allowances and emoluments specific to an individual’s job, plus any arising from skills scarcity. Additional to this are emoluments rewarding specific skills or qualification deemed necessary for employment in a legal capacity.
ShORT-TERm INcENTIvESShort-term incentives for managers are payable annually after the financial year-end audit has been finalised. Incentives are calculated on company, divisional and individual performance.
The short-term incentive scheme for staff in the bargaining unit comprise two components: a quarterly component which is payable every quarter based on the preceding quarter’s performance and an annual component calculated on the preceding financial year’s production, cost and safety targets.
lONG-TERm INcENTIvESA long-term incentive scheme was implemented in 2008 to attract, retain and motivate senior, general, executive and director level management personnel who, in the opinion of the Board of Directors, are
able to influence the performance of the Company in alignment with management’s interests and those of the Company’s shareholders.
The criteria for long-term incentives include, for example, the achievement of particular Return on Capital Employed (ROCE) targets, product diversification measures. In terms of human capital, criteria include employee wellbeing, talent management and culture.
EmPlOyEE ShARE OwNERShIP PlAN (ESOP)All Foskor employees (including executive management) are entitled to receive units in the Employee Share Ownership Plan Trust (ESOP) which holds 6% of Foskor’s share capital through a special purpose vehicle. The initial allocation of the units was made in June 2011 to employees who had been employed with the Company on 1 April 2009, and a second allocation was made to employees engaged after 1 April 2009 but still in service on 30 June 2011. The allocated number of units per employee is based on their total cost to the Company.
The units from the initial allocation (employees present at 1 April 2009) will vest over a period of three years from 1 April 2012 to 1 April 2014. The subsequent allocation units will vest over a period of three years from the third anniversary of the allocation date.
FOSKOR INTEGRATED REPORT 2016
51GOvERNANcE AND REmuNERATION
NON-ExEcuTIvE DIREcTORS’ REmuNERATION Non-executive Directors’ remuneration is approved by the shareholders annually at the annual general meeting, and is based on attendance of directors at Board and committee meetings. Executive Directors are not paid Directors’ fees. Directors’ fees for Industrial Development Corporation representatives accrue to the IDC and not to the Directors individually, and the fees for Mr Ngwenya accrue to the Manyoro Consortium.
REmuNERATION AND STRATEGIc ObjEcTIvES AchIEvEmENT The remuneration of the staff is linked to the achievement of strategic objectives and key performance indicators. The short-term incentive performance is based on targets that are achievable in one year, including agreed milestones for the longer-term strategic projects. The long-term incentive performance is based on financial returns, implementation of strategic projects meant for beneficiation, expansion or growth and other agreed projects. There are no stretch targets.
The assessment of achievement is carried out by the Board Human Capital and Nominations Committee and they recommend the payment percentages to the Board. The payment of the incentives is at the full discretion of the Board. The short-term incentives are applicable for all levels of staff. Top and senior management are eligible for the long-term incentive scheme.
The Employee Share Ownership Plan (ESOP) pays out dividends to employees in relation to the number of units held when dividends have been declared; the sale of the units is restricted until 2016, the scheme ends on 31 March 2018. The ESOP is administered through a Trust that holds six percent of Foskor’s equity through a special purpose vehicle. All employees who were employed at 1 April 2009 were allocated the initial units that vested in April 2014. All employees who joined the Company between 1 April 2009 and June 2013 were allocated the subsequent units which vest over a period of five years from the allocation date. The valuation of the units at the time of sale will be performed by an independent valuation expert as the shares of the Company are not listed. Their value will be derived from the Foskor company valuation.
Remuneration policies on sign-on bonuses and termination payments are approved by the Human Capital and Nominations Committee.
ExEcuTIvE PAy cOmPOSITION The performance objectives of the short-term and long-term incentive plans are derived with the strategy of the Company in mind. The strategic criteria for both plans are listed below and linked to the strategic priorities from our strategy, refer to page 22.
ShORT-TERm INcENTIvE cRITERIA Strategic priority
Financial objectives ¢¢ Earning before interest and tax
¢¢ Free cash flow
¢¢ Improve EBIT
¢¢ Improve cash generation
corporate objectives ¢¢ Production targets
¢¢ Cost per ton
¢¢ Logistics (product railed)
¢¢ Strategic projects
¢¢ Safety
¢¢ Employee wellbeing
¢¢ Transformation
¢¢ Operational excellence
¢¢ Beneficiation projects
¢¢ Zero harm
¢¢ Good industrial relations
Divisional objectives ¢¢ Divisional costs
¢¢ Customer service
¢¢ Divisional projects
¢¢ Internal processes
¢¢ Operational excellence
¢¢ Customer value
lONG-TERm INcENTIvE cRITERIA Strategic priority
corporate objectives ¢¢ Return on capital employed
¢¢ Strategic long-term projects
¢¢ Human capital projects
¢¢ Improve EBIT
¢¢ Beneficiation and capacity improvement
¢¢ People engagement
The following graphs are for illustrative purposes to show the composition of the remuneration packages of the Chief Executive Officer and the executive management, as well as demonstrate the proportion of income for guaranteed and non-guaranteed income when targets are 100% achieved.

FOSKOR INTEGRATED REPORT 2016
52 REmuNERATION (CONTINUED)
FinancialCorporate
4545
Individual 10
Corporate 100 GuaranteedSTI
4030
LTI 30
NON-ExEcuTIvE DIREcTORS Non-executive Directors’ fees for the year were as follows:
DirectorAppointed with
effect fromResigned with
effect from
Directors’ fees 2016
(R)
Directors’ fees 2015
(R)
MG Qhena (Chairman)1 483 480 549 380
RJ Gaveni1 235 091 274 080
NG Nika 229 490 300 200
DS Phaho 217 290 270 800
N Medupe 201 690 134 480
G van Wyk1 187 667 332 980
L Sennelo 18 June 2015 160 409 –
VD Mazibuko2 18 June 2015 150 560 –
VS Sahney3 18 June 2015 147 810 –
JR Barton 145 630 272 780
A Vellayan5 98 540 254 490
V Ravichandran4 18 June 2015 49 270 –
P Ngwenya2 31 March 2015 6 790 261 280
F Madavo 26 January 2015 – 142 290
T Grobbelaar1 28 February 2014 – 6 400
Total 2 313 716 2 799 160
1. IDC representative – fees accrue to the shareholder2. Manyoro Consortium representative – half of the fees accrue to the directors and half to the shareholder3. Sun International – fees accrue to the shareholder4. CIL representatives – fees accrue to the shareholder5. CIL representative – fees are paid to the Director
cEO wEIGhTINGS – ShORT-TERm INcENTIvE (%)
cEO wEIGhTINGS – lONG-TERm INcENTIvE (%)
cEO wEIGhTINGS – ON 100% AchIEvEmENT (%)
ExEcuTIvE wEIGhTINGS –ShORT-TERm INcENTIvE (%)
ExEcuTIvE wEIGhTINGS –lONG-TERm INcENTIvE (%)
ExEcuTIvE wEIGhTINGS –ON 100% AchIEvEmENT (%)
FinancialCorporate
4040
Divisional 10
Corporate 100 GuaranteedSTI
4530
LTI 25Individual 10

53
FOSkOR INTEGRATED REPORT 2016
Ashraf Dindarchief Financial Officer
GOvERNANcE AND REmuNERATION

FOSKOR INTEGRATED REPORT 2016
54
FINANcIAl REVIEW
FINANcIAl OvERvIEwDespite tough trading conditions, industrial action and operational challenges experienced during the year, the Group managed to increase revenue and reduce operating losses year-on-year. The growth in revenue can be attributed to an increase in rock export sales due to the re-opening of the Richards Bay phosphates export corridor and a weaker ZAR/USD exchange rate.
Several strategic initiatives aimed at improving operational excellence and financial sustainability were successfully implemented in the current year. These initiatives included major maintenance programmes, cost optimisation and recapitalisation of the balance sheet. Notwithstanding these improvements, a conservative stance was adopted and an impairment of R200 million was raised in the current year. These initiatives resulted in improved efficiencies and lower cost of production, which in turn led to a decrease in operating losses from R419 million to R296 million compared to the prior year. Excluding once-off exceptional items being the impairment of R200 million in FY2016 and the profit on sale of investments of R217 million in FY2015, the operating loss would have been R96 million in FY2016 compared to R636 million in FY2015, a considerable improvement of R540 million. This demonstrates the relative success of the initiatives undertaken during the year. Net debt also decreased from R2.5 billion in 2015 to R1 billion in the current year due to the balance sheet recapitalisation.
kEy DRIvERSFoskor’s earnings are highly sensitive to commodity prices and exchange rate movements. The consequences of movements in these key drivers can be expressed as follows:
Sensitivity analysis
kEy DRIvER mOvEmENT EbIT ImPAcT
exchange rate r1 per uS dollar r313 millionphosphoric acid $10 per ton r27 million
Granular $10 per ton r38 millionrock export $10 per ton r107 million
magnetite export $10 per ton r120 millionSulphur $10 per ton r48 million
Acid plant efficiency 1% r39 million
Management has developed plans and strategies to deal with any significant changes in these key drivers. These are continuously being reviewed in an attempt to mitigate the risk.
Exchange ratesOur earnings are largely impacted by the average ZAR/USD exchange rate as most of our products’ selling prices and raw material costs are in US Dollars. The Group uses forward contracts and options to hedge or cover foreign exchange exposure, in addition to the natural hedging that takes place between our exports and imports.
During the year, the Rand averaged R13.58 (monthly averages) to the USD; this is 24% weaker than the average of R10.95 recorded in 2015. The Rand continued to remain weak and closed the financial year at R14.81 (2015: R11.89).
R5.9bn (R296m) R54m
cFO’S REPORT
REvENuE EbIT EbITDA 12% 29% 148%
(2015: R5.3 billion) (2015: loss of R419 million) (2015: R113 million)
54
FOSkOR INTEGRATED REPORT 2016
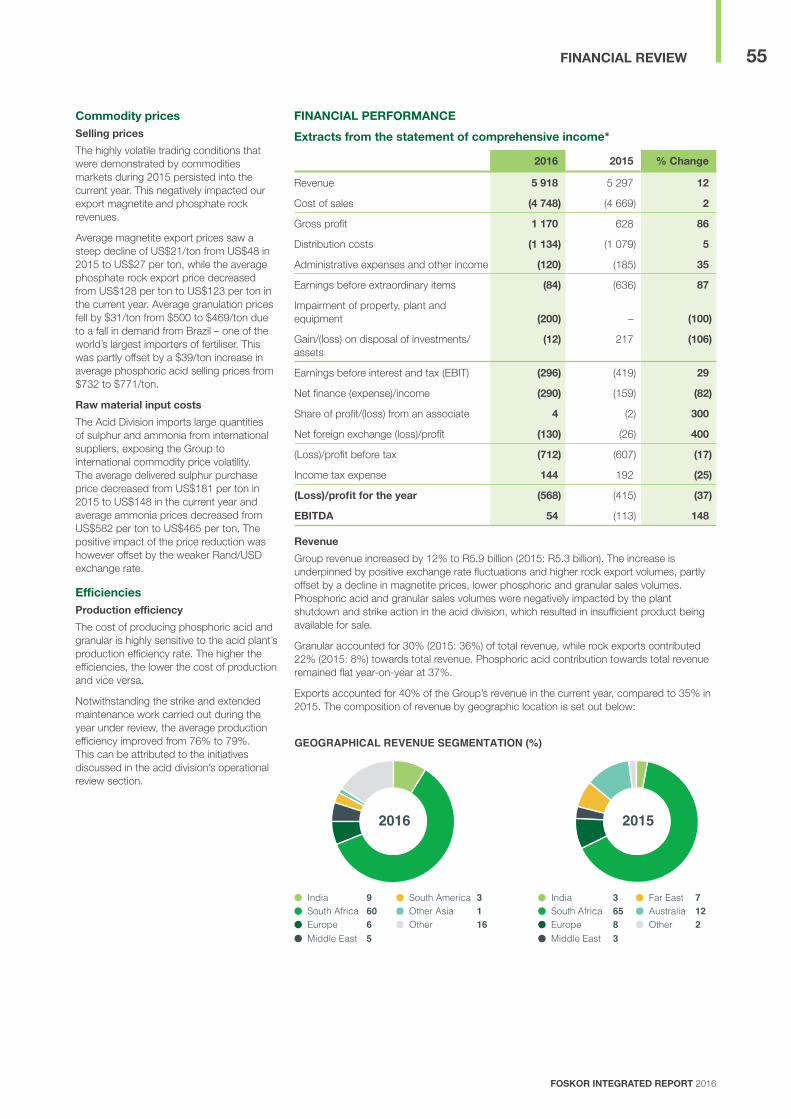
55
FOSkOR INTEGRATED REPORT 2016
FINANcIAl REvIEw
commodity pricesSelling prices
The highly volatile trading conditions that were demonstrated by commodities markets during 2015 persisted into the current year. This negatively impacted our export magnetite and phosphate rock revenues.
Average magnetite export prices saw a steep decline of US$21/ton from US$48 in 2015 to US$27 per ton, while the average phosphate rock export price decreased from US$128 per ton to US$123 per ton in the current year. Average granulation prices fell by $31/ton from $500 to $469/ton due to a fall in demand from Brazil – one of the world’s largest importers of fertiliser. This was partly offset by a $39/ton increase in average phosphoric acid selling prices from $732 to $771/ton.
Raw material input costs
The Acid Division imports large quantities of sulphur and ammonia from international suppliers, exposing the Group to international commodity price volatility. The average delivered sulphur purchase price decreased from US$181 per ton in 2015 to US$148 in the current year and average ammonia prices decreased from US$582 per ton to US$465 per ton. The positive impact of the price reduction was however offset by the weaker Rand/USD exchange rate.
EfficienciesProduction efficiency
The cost of producing phosphoric acid and granular is highly sensitive to the acid plant’s production efficiency rate. The higher the efficiencies, the lower the cost of production and vice versa.
Notwithstanding the strike and extended maintenance work carried out during the year under review, the average production efficiency improved from 76% to 79%. This can be attributed to the initiatives discussed in the acid division’s operational review section.
FINANcIAl PERFORmANcE
Extracts from the statement of comprehensive income*
2016 2015 % change
Revenue 5 918 5 297 12
Cost of sales (4 748) (4 669) 2
Gross profit 1 170 628 86
Distribution costs (1 134) (1 079) 5
Administrative expenses and other income (120) (185) 35
Earnings before extraordinary items (84) (636) 87
Impairment of property, plant and equipment (200) – (100)
Gain/(loss) on disposal of investments/assets
(12) 217 (106)
Earnings before interest and tax (EBIT) (296) (419) 29
Net finance (expense)/income (290) (159) (82)
Share of profit/(loss) from an associate 4 (2) 300
Net foreign exchange (loss)/profit (130) (26) 400
(Loss)/profit before tax (712) (607) (17)
Income tax expense 144 192 (25)
(loss)/profit for the year (568) (415) (37)
EbITDA 54 (113) 148
Revenue
Group revenue increased by 12% to R5.9 billion (2015: R5.3 billion). The increase is underpinned by positive exchange rate fluctuations and higher rock export volumes, partly offset by a decline in magnetite prices, lower phosphoric and granular sales volumes. Phosphoric acid and granular sales volumes were negatively impacted by the plant shutdown and strike action in the acid division, which resulted in insufficient product being available for sale.
Granular accounted for 30% (2015: 36%) of total revenue, while rock exports contributed 22% (2015: 8%) towards total revenue. Phosphoric acid contribution towards total revenue remained flat year-on-year at 37%.
Exports accounted for 40% of the Group’s revenue in the current year, compared to 35% in 2015. The composition of revenue by geographic location is set out below:
GEOGRAPHICAL REVENUE SEGMENTATION (%)
IndiaSouth AfricaEurope
2016
Middle East
South AmericaOther AsiaOther
96065
3116
IndiaSouth AfricaEurope
2015
Middle East
Far EastAustraliaOther
36583
7122

FOSKOR INTEGRATED REPORT 2016
56
CHANGE IN OPERATING PROFIT – YEAR-ON-YEAR(R million)
2015
2015
Distributioncosts
Salesprice
Salesvolume
Exchangerate
Productioncosts
Adminexpenses /
others
Gain ondisposal ofinvestment
2016Impairment-900-600-300
0300600900
(419) (296)(55)
(193)(421)
1 236
(80) 65 (229)(200)
Production costsThe Acid Division production costs decreased by $102 per ton from $921 to $819 per ton despite the higher maintenance costs incurred as a result of the maintenance programmes implemented at the Acid Division. The decrease in production costs is mainly due to improved efficiencies and lower raw material usage as a result of lower production volumes.
The Mining Division production costs per ton decreased by $16 per ton from $100 to $84 per ton in the current year. This is largely due to improved production efficiencies and cost saving initiatives implemented by management. Production efficiencies improved by 5% to 72% (2015: 67%). However, mining cost of sales was negatively impacted by the increased usage of rock stockpile to fulfil sales commitments during the year.
Overall, production costs were well controlled and increased by 2% across the Group.
During the year the Acid Division experienced a shortage of granular and phosphoric acid due to the unplanned plant shutdown and strike. In order to meet our customers’ needs, we imported 17k tons of phosphoric acid at an average price of $890/ton valued at R189 million (2015: RNil) and 66k tons of granular to the value of R416 million (2015: R532 million).
ImpairmentThe group recognised an impairment loss of R200 million relating to property, plant and equipment as the future cash flows from these is slightly lower than the carrying value of the assets.
Finance costsNet finance costs increased from R159 million to R290 million in the current year. This was as a result of higher average debt levels during the year and higher costs associated with the increased debt.
Foreign exchange lossThe net loss resulting from foreign exchange increased from R26 million to R130 million in the current year. This loss resulted mainly from higher import purchases at weaker Rand/US Dollar exchange rates. The zero-cost collar options used to hedge the exchange rate resulted in a loss due to the average Rand/US Dollar exchange rate weakening above the capped contract rates and the export sales volumes could not fully hedge the negative currency impact on imports.
loss for the yearThe net loss for the year increased from R415 million to R568 million mainly due to the impairment of property, plant and equipment, higher finance costs, foreign exchange losses and the once-off gain on the disposal of Coromandel shares realised in the prior year, partly offset by higher revenue compared to the previous year.
FINANcIAl POSITION
Summary statement of financial position*
2016 2015 % change
Assets 8 603 7 890 9
Equity 4 863 3 254 49
Liabilities 3 741 4 636 (19)
EquityFoskor entered into an agreement with its major shareholder the Industrial Development Corporation (IDC) to convert a long-term loan of R1.7 billion and capitalised interest of R477 million into 2 177 class B shares. The shares have a preferential right to dividends over ordinary shares and the required rate of return is an after tax IRR of 10.5%.
Funding
2016 2015 % change
Long-term loans (700) (1 631) (57)
Short-term loans (564) (1 063) (47)
Bank 249 219 14
Net debt (R’m) (1 015) (2 475) (59)
The IDC approved a R4 billion funding facility, which is made up of a R700 million working capital loan, R2.3 billion capital expenditure loan and a R1 billion equity injection. As at 31 March 2016, the R700 million working capital loan had been fully utilised. IDC loans are subordinated to the Group’s debt providers and creditors.
During the year the Group entered into a debtors factoring agreement with ABSA whereby Foskor debtors book (excluding foreign debtors) was ceded to ABSA. ABSA provided a facility of R450 million. The facility is valid for a period of 12 months from September 2015 and is renewable annually at the discretion of the bank. As at the end of March, R159 million of this facility was utilised.
Foskor has short-term facilities of R400 million (2015: R800 million) available from commercial banks. The short-term facilities were fully utilised as at the end of March 2016.
cFO’S REPORT (CONTINUED)

FOSKOR INTEGRATED REPORT 2016
57FINANcIAl PERFORmANcE
working capital
2016 2015 % change
Inventory 2 017 2 033 (1)
Trade and other receivables 961 498 93
Trade and other payables (1 310) (988) 33
working capital requirement 1 668 1 544 8
Working capital increased by 8% from R1.5 billion in 2015 to R1.7 billion in the current year. This is largely due to the R463 million increase in accounts receivables. The increase in trade receivables is due to higher credit sales in the month of March 2016 compared to the same month in 2015 as a result of the improvements in production during the last quarter of 2016. Our working capital requirements were financed through cash on hand and short-term funding facilities.
cASh FlOw
cash flow statement extracts*
2016 2015 % change
Cash utilised from operations (51) (119) 57
Cash utilised by operating activities (310) (130) (138)
Cash utilised in investing activities (405) (229) (77)
The R68 million decrease in cash utilised by operations compared to the previous year follows a similar trend to the operating profit. Trade receivables increased by 93% as a result of higher credit sales volumes during the month of March which will be settled in the new financial year. This resulted in a higher investment in working capital compared to the prior year.
Cash utilised by operating activities increased from R130 million to R310 million due to foreign exchange losses incurred in the current year (as noted above).
Cash utilised in investing activities increased by R176 million to R405 million. In 2015, the Group received R250 million from the sale of Coromandel shares, which was used to fund some of the capital expenditure incurred in the prior year.
Outlook Our immediate priority for 2017 is to improve the Acid plant performance, return to profitability and improve financial sustainability. To achieve this objective, we plan to continue focusing on cost optimisation, revenue growth, improving operational reliability and conversion efficiencies of the acid plant, maximising production and improving working capital management. The conversion by IDC of debt to equity will reduce the high interest cost incurred in 2016 and further assist in the turnaround plans.
We plan to invest circa R1.5 billion during 2017 in capital projects aimed at replacing old assets and ensuring plant availability and reliability.
South African farmers are expected to import about 3.8 million tons of maize as the country has been hit by the worst drought in 23 years. Our fertiliser sales might be negatively impacted if the drought continues into the new year for a prolonged period.
Market conditions are expected to remain subdued. A downward trend in phosphoric acid prices has become evident in quarter one of the new financial year. We also do not foresee magnetite prices recovering in the short term. Sulphur and ammonia costs are however expected to decrease, which will have a positive impact on our raw material costs. The weaker Rand exchange rate is expected to continue contributing positively towards our earnings.
Notwithstanding the subdued market conditions, we are confident of achieving further improvements in 2017.
* For a full set of consolidated financial statements please refer to www.foskor.co.za

FOSKOR INTEGRATED REPORT 2016
58
The summarised consolidated financial results are not the Group’s statutory accounts and do not contain sufficient information to allow for as complete an understanding of the results and state of affairs of the Group as that provided by the full set of Group consolidated annual financial statements.
bASIS OF PREPARATIONThe information in these audited summarised consolidated annual financial statements of the Group have been extracted from the Group’s audited annual financial statements which have been prepared in accordance with IAS 34, Interim Financial Reporting and the South African Companies Act of 2008, as amended. They do not include all the information required for the full annual financial statements and should be read in conjunction with the consolidated annual financial statements for the Group as at the year ended 31 March 2016. The financial statements have been prepared under the historical cost convention, except for certain items including the revaluation of available-for-sale investments and financial assets and liabilities at fair value through profit or loss. The summarised consolidated results are prepared on a going-concern basis.
SIGNIFIcANT AccOuNTING POlIcIESThe accounting policies applied by the Group in the summarised consolidated annual financial statements are the same as those applied by the Group in its full set of consolidated annual financial statements as at and for the year ended 31 March 2015.
kEy ESTImATES AND AREAS OF juDGEmENT
The preparation of the summary annual financial statements required management to make judgements, estimates and assumptions that affect the application of accounting policies and the reported amounts of assets and liabilities, income and expenses. Actual results may differ from these estimates.
In preparing these summary consolidated annual financial statements, the significant judgements made by management in applying the Group’s accounting policies and the key sources of estimation were the same as those that applied to the consolidated annual financial statements as at and for the year ended 31 March 2015.
The presentation and functional currency of Foskor (Pty) Limited is the South African Rand (R) and all monetary amounts are rounded to the nearest thousand.
Mr MA Dindar CA(SA), Chief Financial Officer is responsible for this set of financial results and has supervised the preparation thereof in conjunction with the General Manager: Finance and ICT, Ms TA Mthethwa CA(SA).
INDEPENDENT AuDIT by ThE AuDITORSThe Group’s 2015 consolidated annual financial statements and these summarised consolidated annual financial statements have been audited by the Group’s joint external auditors, KPMG Inc and Ngubane & Co Inc. The individual auditors assigned to perform the audit are Ms S Loonat and Mr H Mpungose.
AuDIT REPORT OPINIONThe unqualified audit report on the full set of annual financial statements, as well as the unqualified audit report on this set of summary financial statements is available at the Company’s registered office.
SummARy FINANcIAl STATEmENTS
The summarised consolidated financial results have been approved by the board of Directors and were signed on their behalf by the chairman, mr mG Qhena and chief Executive Officer, mr u khumalo. This document provides a summary of the information contained in Foskor’s annual consolidated financial statements, which are available on our website.
cFO’S REPORT (CONTINUED)

FOSKOR INTEGRATED REPORT 2016
59FINANcIAl PERFORmANcE
GROuP
2016 2015Notes R’000 r’000
ASSETSNon-current assetsProperty, plant and equipment 5 140 859 4 880 454Intangible assets 35 428 54 099Investment in joint venture 25 25Investment in associate 6 095 2 425Financial investments 189 725 152 642
5 372 132 5 089 645
current assetsNon-current asset held-for-sale – 46 856Inventories 1 2 016 550 2 033 037Trade and other receivables 961 318 498 461Derivative financial instruments 3 970 2 333Current tax asset – 743Cash and cash equivalents 2 249 206 219 058
3 231 044 2 800 488
Total assets 8 603 176 7 890 133
EQuITy AND lIAbIlITIESEquity attributable to ownersOrdinary shares 2 185 962 9 158Share premium 132 013 132 013Retained earnings 2 240 769 2 809 391Share-based payment reserve 303 914 303 914
Total equity 4 862 658 3 254 476
liabilitiesNon-current liabilitiesFinance lease liability 10 675 12 498Environmental rehabilitation liability 683 774 317 681Employee share-based payment liability 26 574 27 407Long-term interest-bearing loans 700 000 1 631 004Retirement benefit obligations 127 100 126 427Deferred income tax liabilities 283 890 428 271
1 832 013 2 543 288
current liabilitiesTrade and other payables 1 309 973 987 825
Short-term interest-bearing loans 564 240 1 062 965
Current tax liability 751 –Finance lease liability 1 823 1 833Derivative financial instruments 5 706 5 731Provisions 26 012 34 015
1 908 505 2 092 369
Total liabilities 3 740 518 4 635 657
Total equity and liabilities 8 603 176 7 890 133
AbRIDGED GROuP STATEmENT OF FINANcIAl POSITION AS AT 31 mARch 2016
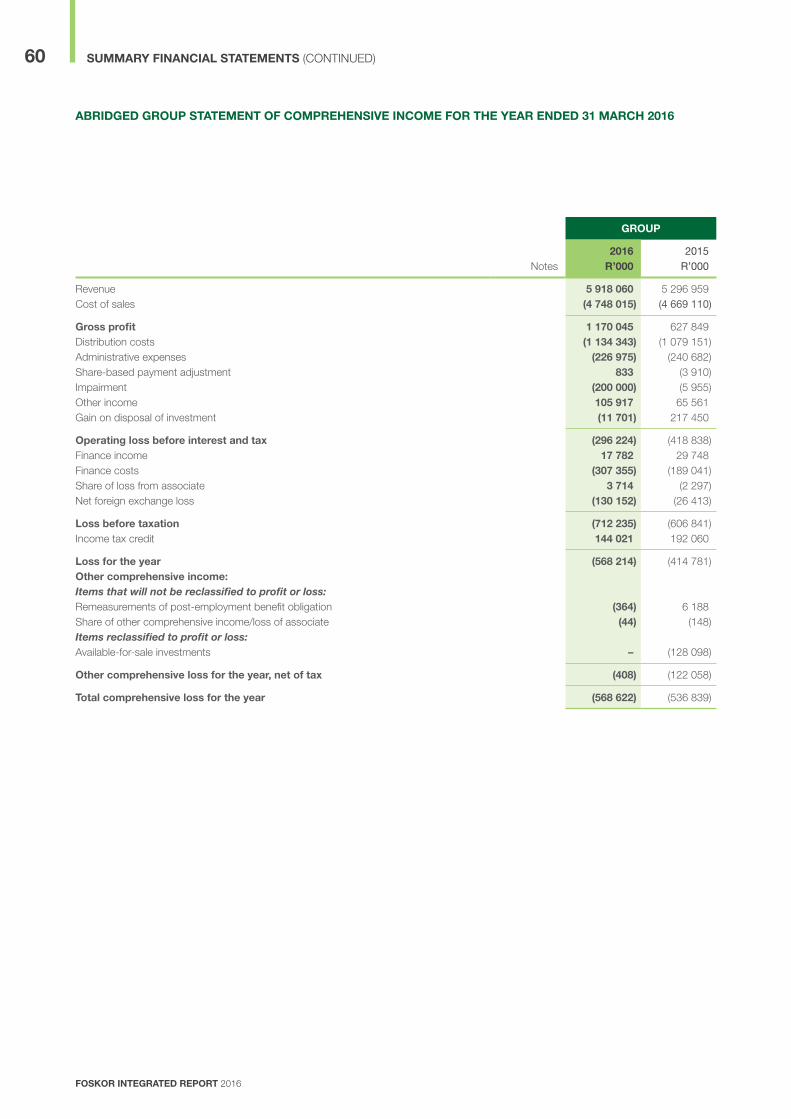
FOSKOR INTEGRATED REPORT 2016
60 SUMMARY FINANCIAL STATEMENTS (continued)
AbRIDGED GROuP STATEmENT OF cOmPREhENSIvE INcOmE FOR ThE yEAR ENDED 31 mARch 2016
GROuP
2016 2015Notes R’000 r’000
Revenue 5 918 060 5 296 959Cost of sales (4 748 015) (4 669 110)
Gross profit 1 170 045 627 849Distribution costs (1 134 343) (1 079 151)Administrative expenses (226 975) (240 682)Share-based payment adjustment 833 (3 910)Impairment (200 000) (5 955)Other income 105 917 65 561Gain on disposal of investment (11 701) 217 450
Operating loss before interest and tax (296 224) (418 838)Finance income 17 782 29 748Finance costs (307 355) (189 041)Share of loss from associate 3 714 (2 297)Net foreign exchange loss (130 152) (26 413)
loss before taxation (712 235) (606 841)Income tax credit 144 021 192 060
loss for the year (568 214) (414 781)Other comprehensive income:Items that will not be reclassified to profit or loss:Remeasurements of post-employment benefit obligation (364) 6 188Share of other comprehensive income/loss of associate (44) (148)Items reclassified to profit or loss:Available-for-sale investments – (128 098)
Other comprehensive loss for the year, net of tax (408) (122 058)
Total comprehensive loss for the year (568 622) (536 839)

FOSKOR INTEGRATED REPORT 2016
FINANCIAL PERFORMANCE 61
AbRIDGED GROuP STATEmENT OF chANGES IN EQuITy FOR ThE yEAR ENDED 31 mARch 2016
GROuP Notes
Share capitalR’000
Share premium
R’000
Retainedearnings
R’000
Share-basedpayment
reserveR’000
Otherreserves
R’000Total
R’000
balance at 31 march 2014 9 158 132 013 3 218 132 303 914 128 098 3 791 315 comprehensive incomeLoss for the year – – (414 781) – – (414 781)Other comprehensive incomeTransferred to profit or loss for the year – – – – (157 293) (157 293)Post-employment benefit obligation – – 8 595 – – 8 595 Deferred tax – – (2 407) – 29 195 26 788 Share of other comprehensive loss of associate – – (148) – – (148)
Total comprehensive loss for the period – – (408 741) – (128 098) (536 839)
balance at 31 march 2015 9 158 132 013 2 809 391 303 914 – 3 254 476
Class B shares 2 176 804 – – – – 2 176 804 comprehensive incomeLoss for the year – – (568 214) – – (568 214)Other comprehensive incomePost-employment benefit obligation – – (506) – – (506)Deferred tax – – 142 – – 142 Share of other comprehensive loss of associate – – (44) – – (44)
Total comprehensive loss for the period – – (568 622) – – (568 622)
balance at 31 march 2016 2 185 962 132 013 2 240 769 303 914 – 4 862 658
AbRIDGED STATEmENT OF cASh FlOw FOR ThE yEAR ENDED 31 mARch 2016
GROuP
Notes 2016
R’0002015
R’000
cash flows from operating activities Cash utilised by operations (51 042) (118 980)Interest received 7 954 14 749 Interest paid (134 126) (4 270)Realised foreign exchange loss (134 379) (21 805)Taxes received 1 278 6
Net cash utilised by operating activities (310 315) (130 300)
cash flows from investing activities Purchase of property, plant and equipment (433 341) (480 711)Purchase of intangibles (613) (2 147)Proceeds from sale of property, plant and equipment 36 150 – Purchase of financial investment held in the environmental rehabilitation trust (6 975) –Proceeds on disposal of investment – 249 545 Dividends received – 3 834
Net cash used in investing activities (404 779) (229 479)
cash flows from financing activitiesIssue of Class B shares 2 176 804 – Repayment of finance lease liability (1 833) (1 843)Repayment of/proceeds long-term interest-bearing loan (931 004) 431 004 Repayment of short-term interest-bearing loan (498 725) (363 577)
Net cash received in financing activities 745 242 65 584
Net increase/(decrease) in cash and cash equivalents 30 148 (294 195)Cash and cash equivalents at the beginning of the year 219 058 513 253
cash and cash equivalents at the end of the year 249 206 219 058

FOSKOR INTEGRATED REPORT 2016
62 SUMMARY FINANCIAL STATEMENTS (continued)
SElEcTED ExPlANATORy NOTES TO ThE AbRIDGED GROuP ANNuAl FINANcIAl STATEmENTS
GROuP
2016R’000
2015R’000
1. INvENTORIESSpares and consumables stores 354 841 332 394 Phosphate rock 658 395 973 043 Raw materials 519 706 412 004 Finished goods 483 608 315 596
total inventories 2 016 550 2 033 037
The value of inventory write down to net realisable value in the current year is R2.9 million (2015: R6.8 million).
GROuP
2016R’000
2015R’000
2. cASh AND cASh EQuIvAlENTSCash at bank and on hand 249 206 219 058
Cash and cash equivalents 249 206 219 058
GROuP
2016R’000
2015R’000
3. cOmmITmENTScapital commitmentsCapital expenditure contracted for at the end of the reporting period but not yet incurred is as follows:Property, plant and equipment 262 037 445 063
Total capital commitments 262 037 445 063
Operating lease commitmentsThe future minimum lease payments payable under non-cancellable leases are as follows:Payable not later than one year 1 803 1 792Payable later than one year and not later than five years 451 2 240
Total lease commitments 2 254 4 032

FOSKOR INTEGRATED REPORT 2016
FINANCIAL PERFORMANCE 63
SElEcTED ExPlANATORy NOTES TO ThE AbRIDGED GROuP ANNuAl FINANcIAl STATEmENTS(cONTINuED)
4. GROuP SEGmENTAl REPORTING
4.1 Segment information
Management has determined the operating segments based on the reports reviewed by the Executive Committee that are used to make strategic decisions. The Executive Committee considers the business primarily from a product perspective. The products are segmented into phosphate rock and magnetite (Phalaborwa) and phosphoric acid, granular fertiliser and NPK (Richards Bay).
Segment assets consist primarily of property, plant and equipment, intangible assets, inventories, trade and other receivables, and cash and cash equivalents. Segment liabilities comprise of borrowings, trade and other payables, and provisions.
Capital expenditure comprises additions to property, plant and equipment (refer to note 4) and intangible assets (refer to note 5 of the full set of annual financial statements).
Phalaborwa Richards bay Total
Phosphate rock magnetite
Phosphoric acid Granular NPk
2016 2016 2016 2016 2016 2016R’000 R’000 R’000 R’000 R’000 R’000
Total segment revenue 3 893 803 396 258 2 155 145 1 857 823 53 708 8 356 737Inter-segment revenue (2 437 189) – – – (5 542) (2 442 731)
Revenue from external customers 1 456 614 396 258 2 155 145 1 857 823 48 166 5 914 005Earnings before interest and tax (EBIT) 982 727 102 767 (969 956) – (5 178) 110 360Depreciation and amortisation 217 793 – 129 581 – 218 347 592Reportable segment assets 4 646 942 – 3 861 263 – 49 571 8 557 776Capital expenditure for reportable segment non-current assets 174 437 – 258 904 – – 433 341Reportable segment liabilities 1 164 534 – 2 242 407 – 1 976 3 408 917
1 Revenue from unreported segments amounts to R2.4 million (2015: R2.7 million)
4.2 Reconciliation of reportable segment EbIT to Group profit before tax is provided as follows:
The Executive Committee assesses the performance of the operating segments based on a measure of adjusted earnings before interest and tax (EBIT). Segment EBIT equals segment revenue less segment expenses, which include costs of sales and other operating costs. This measurement basis excludes the effects of allocated corporate expenditure. Interest income and expenditure, as well as foreign exchange gains and losses, are not allocated to segments as this type of activity is driven by the central treasury function, which manages the cash position of the Group.
The revenue from external parties reported to the Executive Committee is measured in a manner consistent with that of the statements of comprehensive income and there were no reconciling items. Sales of phosphate rock between operating segments (Rock and Acid Divisions; and Acid and NPK Divisions) are carried out at arm’s length.
2016R’000
2015R’000
Segmental earnings before interest and tax (EBIT) 110 360 (450 497)Net corporate and subsidiaries (expenses)/income (402 870) 29 362Finance income 17 782 29 748Finance costs (307 355) (189 041)Net foreign exchange losses (130 152) (26 413)
Group loss before tax (712 235) (606 841)

FOSKOR INTEGRATED REPORT 2016
64 SUMMARY FINANCIAL STATEMENTS (continued)
4. GROuP SEGmENTAl REPORTING (cONTINuED)
4.3 Reportable segment assets are reconciled to total Group assets as follows:
The amounts provided to the Executive Committee with respect to the total assets are measured in a manner consistent with that of the financial statements. Derivative financial instruments held by the Group are not considered to be segment assets but rather are managed by the central treasury function.
2016R’000
2015R’000
Segment assets for reportable segments 8 557 776 7 833 671unallocated:Derivative financial instruments 3 970 2 333Other assets 41 430 54 129
Total Group assets per the statements of financial position 8 603 176 7 890 133
4.4 Reportable segment liabilities are reconciled to total liabilities as follows:
The amounts provided to the Executive Committee with respect to the total liabilities are measured in a manner consistent with that of the financial statements. Deferred tax and derivative financial instruments are not considered to be segment assets but rather are managed by the central treasury function.
2016R’000
2015R’000
Segment liabilities for reportable segments 3 408 917 4 146 024unallocated:Deferred tax 283 890 428 271Corporate and subsidiary liabilities 47 711 61 362
Total Group liabilities per the statement of financial position 3 740 518 4 635 657
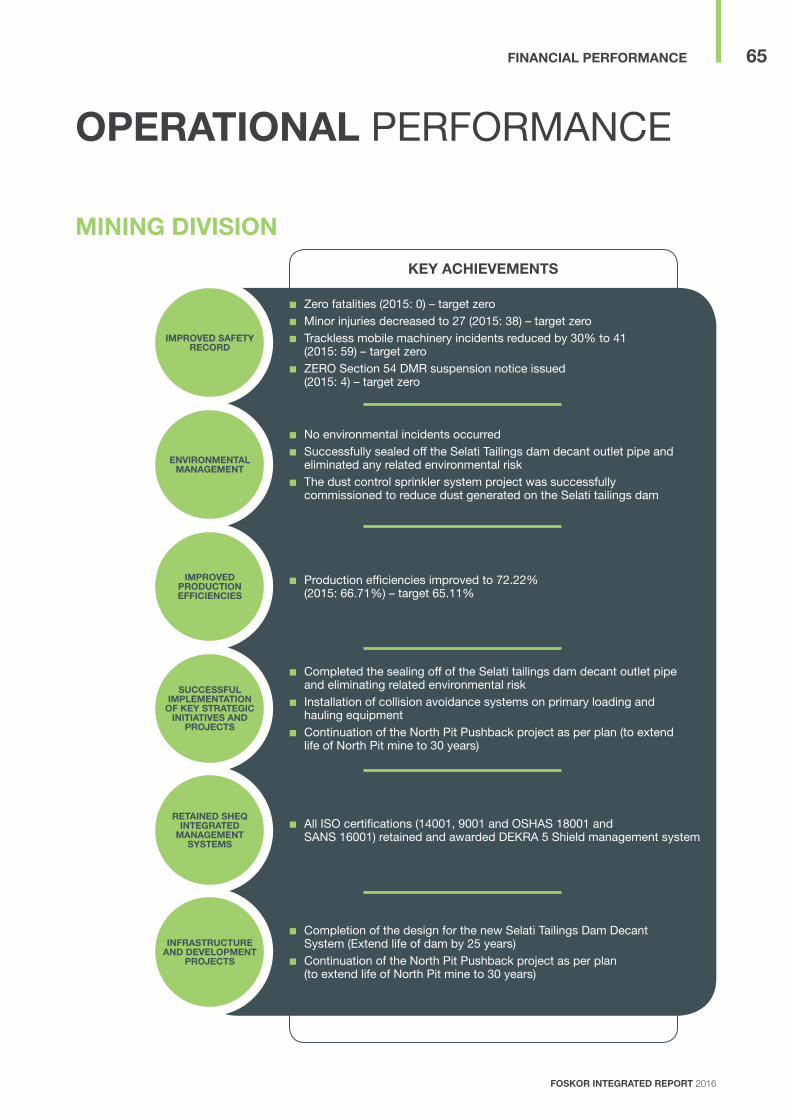
FOSKOR INTEGRATED REPORT 2016
FINANCIAL PERFORMANCE 65
OPERATIONAl performANCe
mINING DIvISION
kEy AchIEvEmENTS
¢¢ Zero fatalities (2015: 0) – target zero¢¢ minor injuries decreased to 27 (2015: 38) – target zero ¢¢ trackless mobile machinery incidents reduced by 30% to 41
(2015: 59) – target zero¢¢ Zero Section 54 dmr suspension notice issued
(2015: 4) – target zero
ImPROvED SAFETy REcORD
¢¢ No environmental incidents occurred ¢¢ Successfully sealed off the Selati tailings dam decant outlet pipe and
eliminated any related environmental risk¢¢ the dust control sprinkler system project was successfully
commissioned to reduce dust generated on the Selati tailings dam
ENvIRONmENTAl mANAGEmENT
¢¢ production efficiencies improved to 72.22% (2015: 66.71%) – target 65.11%
ImPROvED PRODucTION EFFIcIENcIES
¢¢ Completed the sealing off of the Selati tailings dam decant outlet pipe and eliminating related environmental risk¢¢ Installation of collision avoidance systems on primary loading and
hauling equipment¢¢ Continuation of the North pit pushback project as per plan (to extend
life of North pit mine to 30 years)
SuccESSFul ImPlEmENTATION
OF kEy STRATEGIc INITIATIvES AND
PROjEcTS
¢¢ All ISo certifications (14001, 9001 and oSHAS 18001 and SANS 16001) retained and awarded deKrA 5 Shield management system
RETAINED ShEQ INTEGRATED
mANAGEmENT SySTEmS
¢¢ Completion of the design for the new Selati tailings dam decant System (extend life of dam by 25 years)¢¢ Continuation of the North pit pushback project as per plan
(to extend life of North pit mine to 30 years)
INFRASTRucTuRE AND DEvElOPmENT
PROjEcTS

FOSKOR INTEGRATED REPORT 2016
66
OvERvIEwThe Mining Division mines apatite, a phosphate-bearing mineral, at its two open-cast mines and produces sufficient quantities of rock to feed Foskor’s phosphoric acid plant at the Acid Division in Richards Bay. We also supply local and international markets with smaller quantities of rock.
Recent advances in iron ore smelter technology have increased the demand for magnetite. Although magnetite is no longer present in the pyroxenite ores excavated from the two mines, we have sufficient stockpiled resources to capitalise on the increased demand.
mINING PERFORmANcE
Performance per mine The Mining Division mined a total of 29.16 million tons of material in 2016 (2015: 30.5 million tons), inclusive of the North Pit Pushback Project (NPPB), resulting in 12.89 million tons of waste and 16.27 tons of ore inclusive of marginal ore (2015: 15.4). The processing facility treated 14.8 million tons of ore, 10.3% lower than 2015. Run-of-mine (ROM) feed grades were on par with 2015 at 6.59% P2O5 (2015: 6.6%). Mine development work (NPPB project) is ongoing to ensure consistent feed grades in the region of 7% P2O5 content going forward. The 3.6 million tons were mined from the North Pit Push Back (2015: 4.18 million tons). Due to cash flow constraints less tons were planned to be moved in 2016.
Production performance The overall processing efficiency improved by 8.26% to 72.22% (2015: 66.71%). Total production for 2015 was 5.34% lower than 2015 at 1.876 million tons (2015: 1.982 million tons). This was as a result of the community action during August and December grounding bus transport, ESKOM load shedding and lower reliability of mining fleet.
chAllENGES
¢¢ the crushing plant and haul truck fleet reliability has declined due to age of equipment. A crusher renewal plan was implemented in July 2015 and replacement of key equipment is progressing as per the renewal plan. r 700 million was also approved by the Board to start with the mine fleet replacement
mAjOR EQuIPmENT FAIluRES
¢¢ production output decreased by 106 000 tons to 1 876 kt. (2015: 1982 kt). production was negatively affected (55 000 tons) by community action that prevented movement of busses for employees ¢¢ eSKom load shedding resulted in a production loss of 16 000 tons of
final product
DEcREASED PRODucTION
0
5 000
10 000
15 000
20 000
25 000
30 000
35 000
PERFORMANCE PER MINE(k tons mined)
3 885 5 687 5 307 7 078
20162013 2014 2015
NP WasteSP Waste
NP OreSP Ore
7 4557 864 9 115 5 808
12 99212 020 11 413
10 225
6 8368 957 7 343
6 050
0
500
1 000
1 500
2 000
2 500
3 000
Rock production
20172014 2015 2016
Actual Target
2 39
6
2013
2 63
9
1 92
2
2012
2 20
9
2 84
9
2 16
4
2 74
0
1 98
3
2 60
2
1 87
6
1 96
8
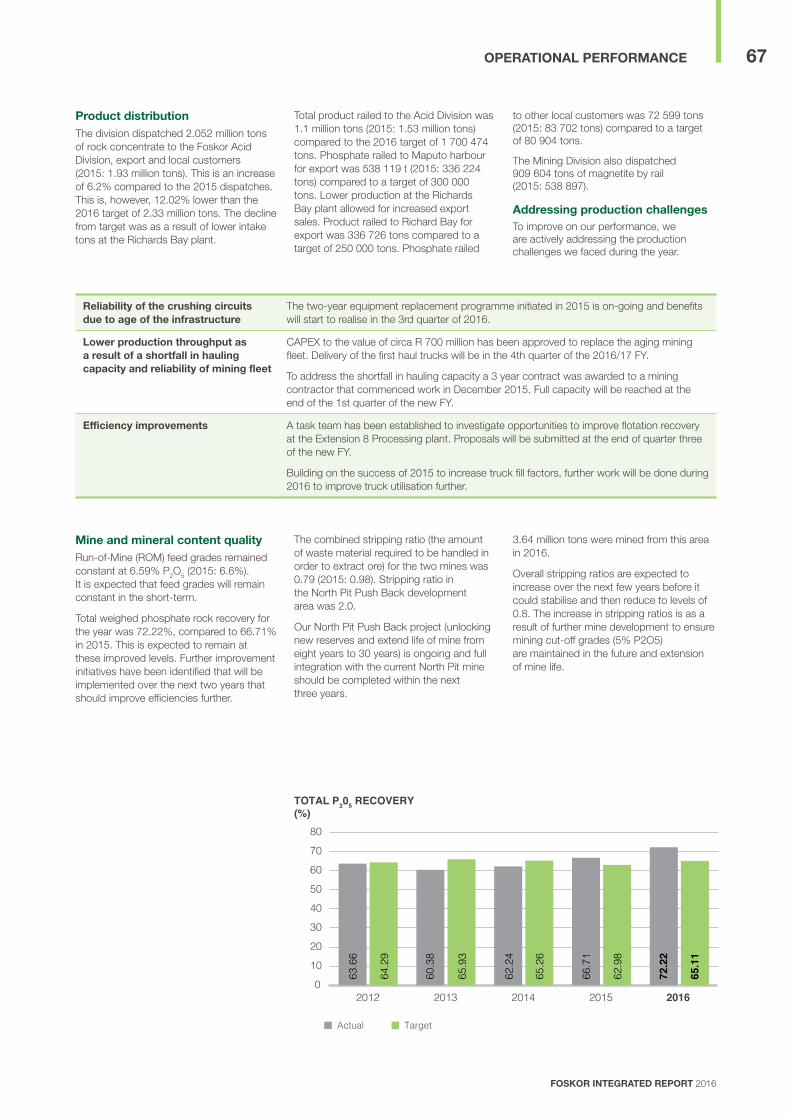
FOSKOR INTEGRATED REPORT 2016
67OPERATIONAl PERFORmANcE
Product distributionThe division dispatched 2.052 million tons of rock concentrate to the Foskor Acid Division, export and local customers (2015: 1.93 million tons). This is an increase of 6.2% compared to the 2015 dispatches. This is, however, 12.02% lower than the 2016 target of 2.33 million tons. The decline from target was as a result of lower intake tons at the Richards Bay plant.
Total product railed to the Acid Division was 1.1 million tons (2015: 1.53 million tons) compared to the 2016 target of 1 700 474 tons. Phosphate railed to Maputo harbour for export was 538 119 t (2015: 336 224 tons) compared to a target of 300 000 tons. Lower production at the Richards Bay plant allowed for increased export sales. Product railed to Richard Bay for export was 336 726 tons compared to a target of 250 000 tons. Phosphate railed
to other local customers was 72 599 tons (2015: 83 702 tons) compared to a target of 80 904 tons.
The Mining Division also dispatched 909 604 tons of magnetite by rail (2015: 538 897).
Addressing production challengesTo improve on our performance, we are actively addressing the production challenges we faced during the year.
mine and mineral content qualityRun-of-Mine (ROM) feed grades remained constant at 6.59% P2O5 (2015: 6.6%). It is expected that feed grades will remain constant in the short-term.
Total weighed phosphate rock recovery for the year was 72.22%, compared to 66.71% in 2015. This is expected to remain at these improved levels. Further improvement initiatives have been identified that will be implemented over the next two years that should improve efficiencies further.
The combined stripping ratio (the amount of waste material required to be handled in order to extract ore) for the two mines was 0.79 (2015: 0.98). Stripping ratio in the North Pit Push Back development area was 2.0.
Our North Pit Push Back project (unlocking new reserves and extend life of mine from eight years to 30 years) is ongoing and full integration with the current North Pit mine should be completed within the next three years.
3.64 million tons were mined from this area in 2016.
Overall stripping ratios are expected to increase over the next few years before it could stabilise and then reduce to levels of 0.8. The increase in stripping ratios is as a result of further mine development to ensure mining cut-off grades (5% P2O5) are maintained in the future and extension of mine life.
Reliability of the crushing circuits due to age of the infrastructure
The two-year equipment replacement programme initiated in 2015 is on-going and benefits will start to realise in the 3rd quarter of 2016.
lower production throughput as a result of a shortfall in hauling capacity and reliability of mining fleet
CAPEx to the value of circa R 700 million has been approved to replace the aging mining fleet. Delivery of the first haul trucks will be in the 4th quarter of the 2016/17 FY.
To address the shortfall in hauling capacity a 3 year contract was awarded to a mining contractor that commenced work in December 2015. Full capacity will be reached at the end of the 1st quarter of the new FY.
Efficiency improvements A task team has been established to investigate opportunities to improve flotation recovery at the Extension 8 Processing plant. Proposals will be submitted at the end of quarter three of the new FY.
Building on the success of 2015 to increase truck fill factors, further work will be done during 2016 to improve truck utilisation further.
0
10
20
30
40
50
60
70
80
TOTAL P205 RECOVERY(%)
20162013 2014 2015
Actual Target
63.6
6
2012
64.2
9
60.3
8
65.9
3
62.2
4
65.2
6
66.7
1
62.9
8
72.2
2
65.1
1
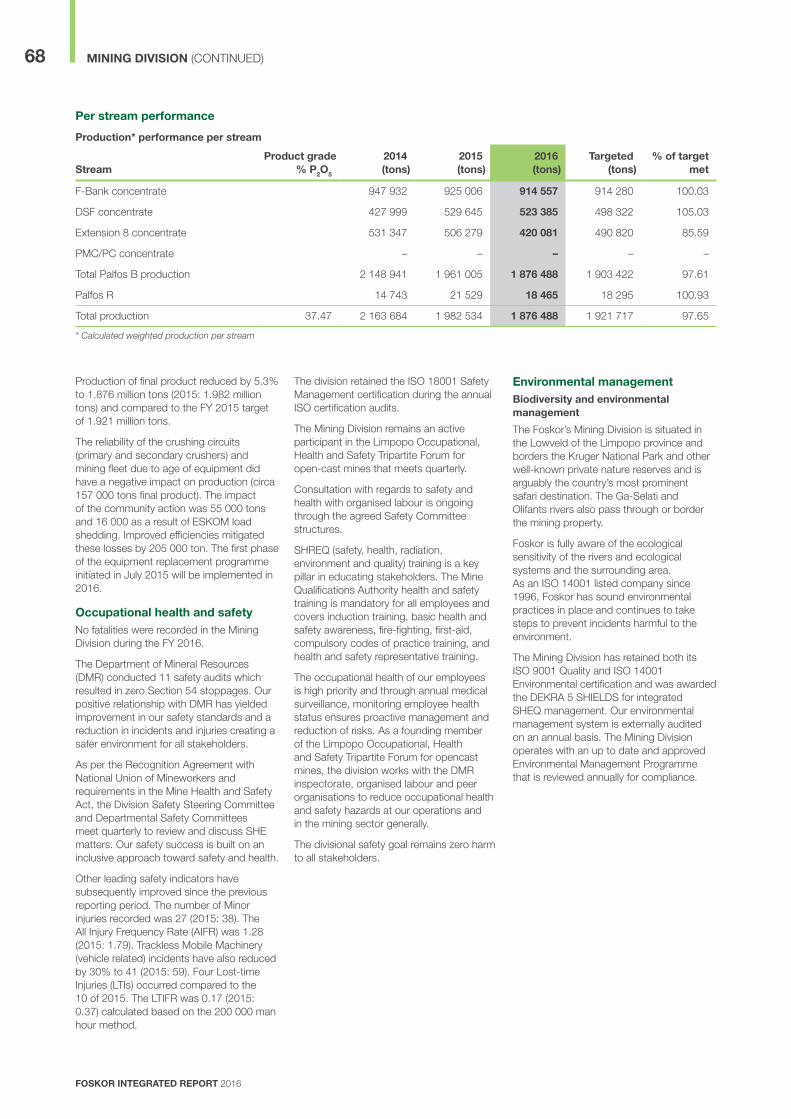
FOSKOR INTEGRATED REPORT 2016
68
Per stream performance
Production* performance per stream
Stream Product grade
% P2O5
2014 (tons)
2015 (tons)
2016 (tons)
Targeted (tons)
% of target met
F-Bank concentrate 947 932 925 006 914 557 914 280 100.03
DSF concentrate 427 999 529 645 523 385 498 322 105.03
Extension 8 concentrate 531 347 506 279 420 081 490 820 85.59
PMC/PC concentrate – – – – –
Total Palfos B production 2 148 941 1 961 005 1 876 488 1 903 422 97.61
Palfos R 14 743 21 529 18 465 18 295 100.93
Total production 37.47 2 163 684 1 982 534 1 876 488 1 921 717 97.65
* Calculated weighted production per stream
Production of final product reduced by 5.3% to 1.876 million tons (2015: 1.982 million tons) and compared to the FY 2015 target of 1.921 million tons.
The reliability of the crushing circuits (primary and secondary crushers) and mining fleet due to age of equipment did have a negative impact on production (circa 157 000 tons final product). The impact of the community action was 55 000 tons and 16 000 as a result of ESKOM load shedding. Improved efficiencies mitigated these losses by 205 000 ton. The first phase of the equipment replacement programme initiated in July 2015 will be implemented in 2016.
Occupational health and safetyNo fatalities were recorded in the Mining Division during the FY 2016.
The Department of Mineral Resources (DMR) conducted 11 safety audits which resulted in zero Section 54 stoppages. Our positive relationship with DMR has yielded improvement in our safety standards and a reduction in incidents and injuries creating a safer environment for all stakeholders.
As per the Recognition Agreement with National Union of Mineworkers and requirements in the Mine Health and Safety Act, the Division Safety Steering Committee and Departmental Safety Committees meet quarterly to review and discuss SHE matters. Our safety success is built on an inclusive approach toward safety and health.
Other leading safety indicators have subsequently improved since the previous reporting period. The number of Minor injuries recorded was 27 (2015: 38). The All Injury Frequency Rate (AIFR) was 1.28 (2015: 1.79). Trackless Mobile Machinery (vehicle related) incidents have also reduced by 30% to 41 (2015: 59). Four Lost-time Injuries (LTIs) occurred compared to the 10 of 2015. The LTIFR was 0.17 (2015: 0.37) calculated based on the 200 000 man hour method.
The division retained the ISO 18001 Safety Management certification during the annual ISO certification audits.
The Mining Division remains an active participant in the Limpopo Occupational, Health and Safety Tripartite Forum for open-cast mines that meets quarterly.
Consultation with regards to safety and health with organised labour is ongoing through the agreed Safety Committee structures.
SHREQ (safety, health, radiation, environment and quality) training is a key pillar in educating stakeholders. The Mine Qualifications Authority health and safety training is mandatory for all employees and covers induction training, basic health and safety awareness, fire-fighting, first-aid, compulsory codes of practice training, and health and safety representative training.
The occupational health of our employees is high priority and through annual medical surveillance, monitoring employee health status ensures proactive management and reduction of risks. As a founding member of the Limpopo Occupational, Health and Safety Tripartite Forum for opencast mines, the division works with the DMR inspectorate, organised labour and peer organisations to reduce occupational health and safety hazards at our operations and in the mining sector generally.
The divisional safety goal remains zero harm to all stakeholders.
Environmental management biodiversity and environmental management
The Foskor’s Mining Division is situated in the Lowveld of the Limpopo province and borders the Kruger National Park and other well-known private nature reserves and is arguably the country’s most prominent safari destination. The Ga-Selati and Olifants rivers also pass through or border the mining property.
Foskor is fully aware of the ecological sensitivity of the rivers and ecological systems and the surrounding area. As an ISO 14001 listed company since 1996, Foskor has sound environmental practices in place and continues to take steps to prevent incidents harmful to the environment.
The Mining Division has retained both its ISO 9001 Quality and ISO 14001 Environmental certification and was awarded the DEKRA 5 SHIELDS for integrated SHEQ management. Our environmental management system is externally audited on an annual basis. The Mining Division operates with an up to date and approved Environmental Management Programme that is reviewed annually for compliance.
mINING DIvISION (CONTINUED)
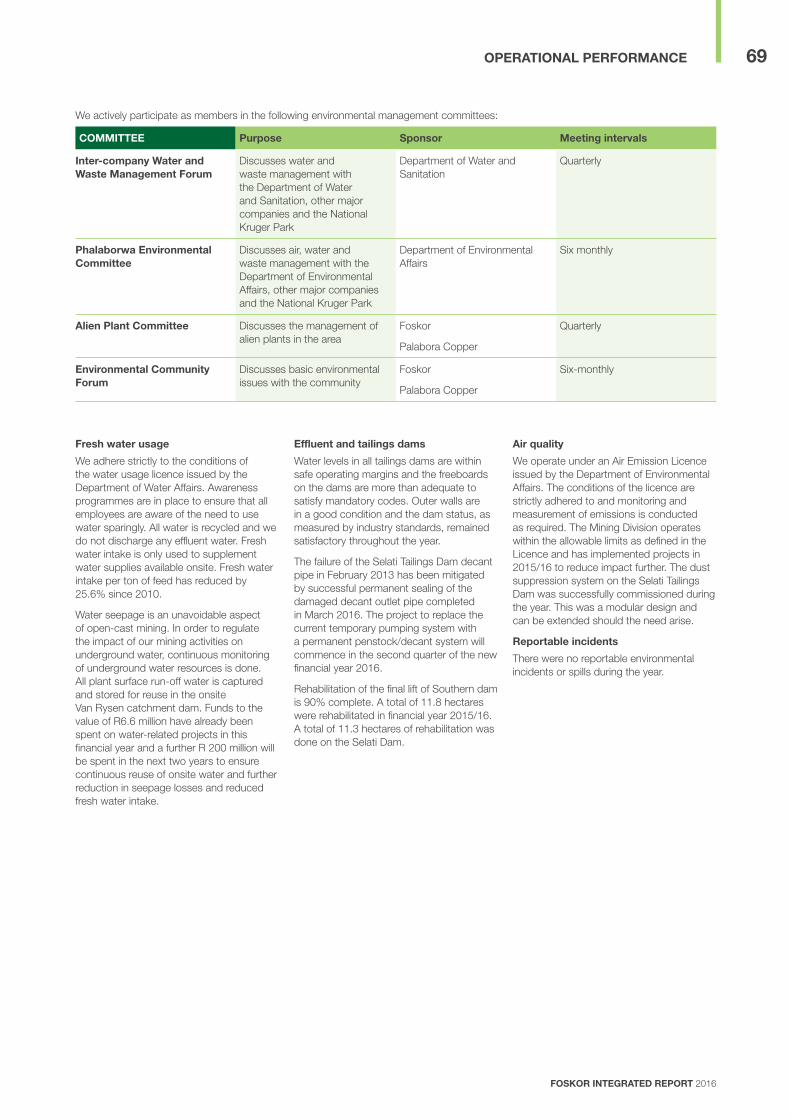
FOSKOR INTEGRATED REPORT 2016
69OPERATIONAl PERFORmANcE
We actively participate as members in the following environmental management committees:
cOmmITTEE Purpose Sponsor meeting intervals
Inter-company water and waste management Forum
Discusses water and waste management with the Department of Water and Sanitation, other major companies and the National Kruger Park
Department of Water and Sanitation
Quarterly
Phalaborwa Environmental committee
Discusses air, water and waste management with the Department of Environmental Affairs, other major companies and the National Kruger Park
Department of Environmental Affairs
Six monthly
Alien Plant committee Discusses the management of alien plants in the area
Foskor
Palabora Copper
Quarterly
Environmental community Forum
Discusses basic environmental issues with the community
Foskor
Palabora Copper
Six-monthly
Fresh water usage
We adhere strictly to the conditions of the water usage licence issued by the Department of Water Affairs. Awareness programmes are in place to ensure that all employees are aware of the need to use water sparingly. All water is recycled and we do not discharge any effluent water. Fresh water intake is only used to supplement water supplies available onsite. Fresh water intake per ton of feed has reduced by 25.6% since 2010.
Water seepage is an unavoidable aspect of open-cast mining. In order to regulate the impact of our mining activities on underground water, continuous monitoring of underground water resources is done. All plant surface run-off water is captured and stored for reuse in the onsite Van Rysen catchment dam. Funds to the value of R6.6 million have already been spent on water-related projects in this financial year and a further R 200 million will be spent in the next two years to ensure continuous reuse of onsite water and further reduction in seepage losses and reduced fresh water intake.
Effluent and tailings dams
Water levels in all tailings dams are within safe operating margins and the freeboards on the dams are more than adequate to satisfy mandatory codes. Outer walls are in a good condition and the dam status, as measured by industry standards, remained satisfactory throughout the year.
The failure of the Selati Tailings Dam decant pipe in February 2013 has been mitigated by successful permanent sealing of the damaged decant outlet pipe completed in March 2016. The project to replace the current temporary pumping system with a permanent penstock/decant system will commence in the second quarter of the new financial year 2016.
Rehabilitation of the final lift of Southern dam is 90% complete. A total of 11.8 hectares were rehabilitated in financial year 2015/16. A total of 11.3 hectares of rehabilitation was done on the Selati Dam.
Air quality
We operate under an Air Emission Licence issued by the Department of Environmental Affairs. The conditions of the licence are strictly adhered to and monitoring and measurement of emissions is conducted as required. The Mining Division operates within the allowable limits as defined in the Licence and has implemented projects in 2015/16 to reduce impact further. The dust suppression system on the Selati Tailings Dam was successfully commissioned during the year. This was a modular design and can be extended should the need arise.
Reportable incidents
There were no reportable environmental incidents or spills during the year.

FOSKOR INTEGRATED REPORT 2016
70
Sustainability performance data
Performance Data – human, Natural and Social capital
2016 Actual
2016 Target 2015 2014 2013 2012
Level of Assurance
People Employee numbers 1 338 1 311 1 357 1 427 1 387 Recruitment 72 61 44 140 159 Unionised labour 81.0% 88.1% 88.1% 89.1% 84.9%Employee turnover 6.3% 5.5% 11.4% 7.6% 7.1%
Skills development Training and development (R million) 2 807 017 3 570 943 7 532 399 8 659 835 6 201 574 5 007 809 Learnerships (number) 147 180 68 83 69 59 Learnerships (R million) 2 110 000 5 400 000 4 189 888 5 114 128 4 251 504 3 635 344 Bursaries (R million) 1 162 864 1 275 000 1 405 832 1 442 729 939 311 493 691Bursaries (R million) 15 16 4 5 6 –
Safety Fatalities – – – 1 – – High Lost time injuries 4 – 10 8 1 7 High Lost Time Injury Frequency Rate (LTIFR) 0.17 <0.4 0.37 0.25 0.03 0.27 High Occupational diseases (Hearing loss) 3 – 10 13 – 6 High Man hours without any lost time injury (millions) 0.6 6 0.2 0.6 6 5.2 High Number of section 54 notices issued by the DMR 0 – 4 5 – 1 High
Greenhouse gases energy consumption (kg of cO2–e) Coal (Scope1)1 68 929 71 920 56 075 56 075 NR ModerateDiesel (Scope1)1 40 546 45 894 46 881 46 881 NR ModeratePetrol (Scope1)1 230 337 322 322 NR ModerateWater (Scope 1)2 11 326 12 036 2 348 NR NR ModerateElectricity (Scope 2)2 375 107 440 057 414 055 414 055 NR ModerateTotal greenhouse gas (cO2 equivalent) 496 138 570 244 463 663 461 314 NR
waterPotable water (Municipal) m3 326 241 262 867 208 588 685 000 324 000 HighIndustrial water (Lepelle) m3 6 308 640 6 788 198 8 889 168 9 271 000 9 731 000 HighTotal fresh water consumption 6 634 881 7 051 065 9 097 756 9 956 000 10 055 000
waste management (tons)General refuse and waste – registered landfill disposal 336 380 378 408 NR ModerateUncontaminated steel – scrap sales disposal 1 560 1 439 1 197 2 232 NR ModerateRadiation–contaminated steel – stockpiled onsite disposal 660 746 746 936 NR ModerateHarzadous material – registered Enviroserv landfill disposal 72 62 150 132 NR Moderate
Air quality stations (mg/m2/day)Background 115 300 168 144 100 NR HighResidential receptor 160 600 317 277 300 NR HighIndustrial receptor 464 1 200 1 137 871 1 000 NR HighSource monitoring 1 788 2 400 2 350 2 300 2 300 NR High
mine rehabilitation Closure costs – scheduled (R millions) 526 478 458 408 379 High Closure costs – unscheduled (R millions) 616 596 559 533 503 High Mineral reserves (million tons) 1 388 1 405 1 435 1 372 1 391 High Mining area (km2) 23 23 23 High
Procurement spend (%) Local 59 – 61 63 63 65 High National 37 – 38 37 37 34 High International 4 – 1 – – 1 High
Procurement spend against mining targets (%) Local procurement of capital goods 70 40 30 35 25 22 ModerateLocal procurement of services 66 70 67 41 31 30 ModerateLocal procurement of consumables 62 50 27 44 47 35 Moderate
BBBEE rating level 5 3 5 4 3 5 High
High level of assurance = independent external verification/ assurance, report available; Moderate = internally verified by management 1 Scope 1 = Direct energy consumption 2 Scope 2 = Indirect energy consumption NR: Not reported
mINING DIvISION (CONTINUED)

FOSKOR INTEGRATED REPORT 2016
71OPERATIONAl PERFORmANcE
mINE RESOuRcES AND ORE RESERvES
The complex is a vertical volcanic pipe, roughly kidney-shaped and measuring between 1.5 and 3.5 kilometres in width and 6.5 kilometres in length. Extensive drilling since 1950 has allowed geologists to develop an accurate three-dimensional geological model of the complex. It consists of three joined lobes – namely the North Pyroxenite, Loolekop and South Pyroxenite areas. High concentrations of apatite mineralisation (expressed as a percentage of phosphoric acid) are present in the foskorite and pyroxenite rock types found across the three lobes. The foskorite and carbonatite rock types found in the Loolekop lobe contains copper and magnetite.
Our mineral resources and reserves are classified according to the South African Mineral Resource Committee (SAMREC) Code. Present-day calculations suggest that mined ore must contain at least 5.0% phosphate to be economically viable (cut-off grade). Material with between 4% and 5.0% P2O5 is classified as marginal.
Foskor has vast phosphate resources and at current mining rates (circa 34 million tons per year) this will ensure life of mine in excess of 70 years.
Resource estimates for the South and North Pyroxenite deposits based on our current geological and resource models show mineral reserves as at 31 March 2016:
¢¢ 219.2 million tons in the North Pyroxenite deposit (2015: 225 million tons).
¢¢ 1 169.5 million tons in the South Pyroxenite deposit (2015: 1 179 million tons).
The decline in Reserve Classification is in line with mining tons for 2015/16.
Phosphate-rich tailings have been deposited in the Palabora Copper (PC) active tailings dam since the late 1970s. Foskor owns the rights to the apatite in the tailings. Although not economical viable to mine at present this remains a valuable phosphate resource for the future.
PC also, from time to time, transports high-phosphate rock content tailings from their open-cast vermiculite mining area to a stockpile close to Foskor’s East Crusher. Since 2006, Foskor has been reclaiming these phosphate tailings from this stockpile on an opportunity basis to supplement run-of-mine from the open pits.
Based on current geological and resource models, mine resources and ore reserves are presented in the table below.
Proven and probable mineral reserves and reserves
2016 2015
Geological areaReserves category
Reserves (million tons) % P2O5
Reserves (million tons) % P2O5
North Pyroxenite PitProven 219.2 7.12 225.2 7.12
Probable 20.1 6.91 20.1 6.91
South Pyroxenite PitProven 1 169.5 6.78 1 179.7 6.78
Probable 137.8 6.47 137.8 6.47
The Foskor mines are situated within the Phalaborwa Igneous complex comprising 14 distinct rock types, each with a specific mineral composition. Foskor operates two open pit mines extracting apatite, the phosphate baring mineral.
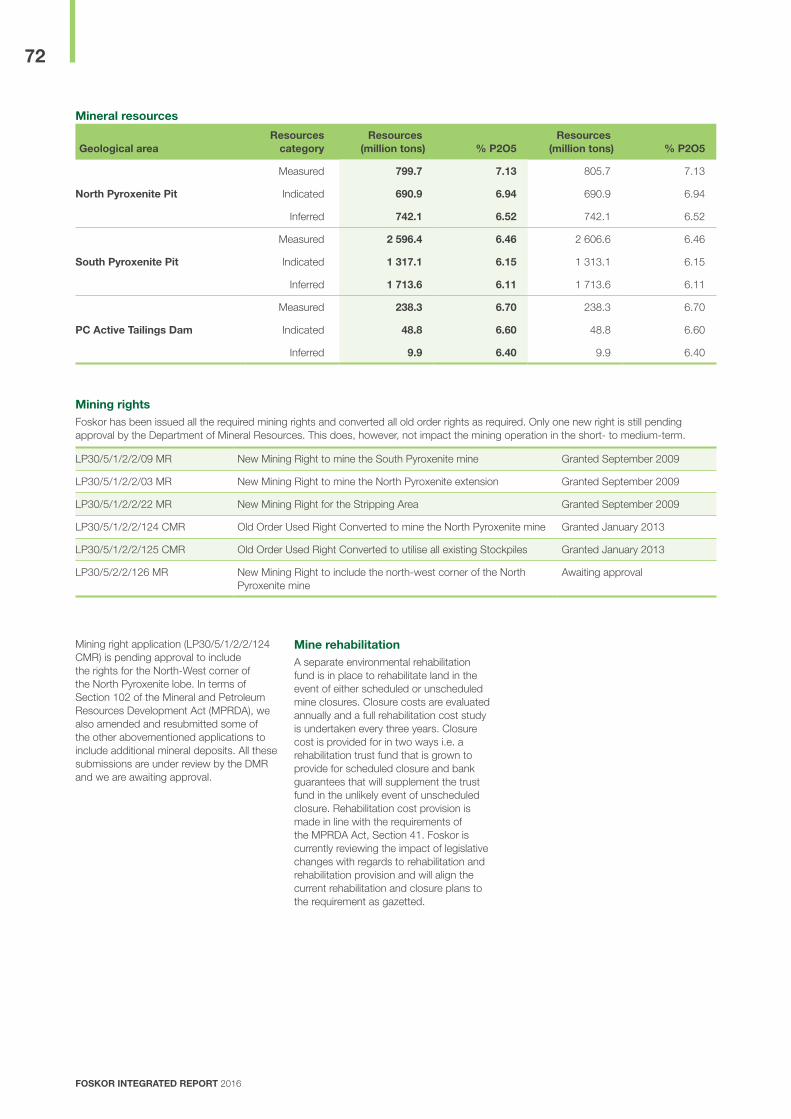
FOSKOR INTEGRATED REPORT 2016
72
mineral resources
Geological areaResources
categoryResources
(million tons) % P2O5Resources
(million tons) % P2O5
North Pyroxenite Pit
Measured 799.7 7.13 805.7 7.13
Indicated 690.9 6.94 690.9 6.94
Inferred 742.1 6.52 742.1 6.52
South Pyroxenite Pit
Measured 2 596.4 6.46 2 606.6 6.46
Indicated 1 317.1 6.15 1 313.1 6.15
Inferred 1 713.6 6.11 1 713.6 6.11
Pc Active Tailings Dam
Measured 238.3 6.70 238.3 6.70
Indicated 48.8 6.60 48.8 6.60
Inferred 9.9 6.40 9.9 6.40
mining rightsFoskor has been issued all the required mining rights and converted all old order rights as required. Only one new right is still pending approval by the Department of Mineral Resources. This does, however, not impact the mining operation in the short- to medium-term.
LP30/5/1/2/2/09 MR New Mining Right to mine the South Pyroxenite mine Granted September 2009
LP30/5/1/2/2/03 MR New Mining Right to mine the North Pyroxenite extension Granted September 2009
LP30/5/1/2/2/22 MR New Mining Right for the Stripping Area Granted September 2009
LP30/5/1/2/2/124 CMR Old Order Used Right Converted to mine the North Pyroxenite mine Granted January 2013
LP30/5/1/2/2/125 CMR Old Order Used Right Converted to utilise all existing Stockpiles Granted January 2013
LP30/5/2/2/126 MR New Mining Right to include the north-west corner of the North Pyroxenite mine
Awaiting approval
Mining right application (LP30/5/1/2/2/124 CMR) is pending approval to include the rights for the North-West corner of the North Pyroxenite lobe. In terms of Section 102 of the Mineral and Petroleum Resources Development Act (MPRDA), we also amended and resubmitted some of the other abovementioned applications to include additional mineral deposits. All these submissions are under review by the DMR and we are awaiting approval.
mine rehabilitationA separate environmental rehabilitation fund is in place to rehabilitate land in the event of either scheduled or unscheduled mine closures. Closure costs are evaluated annually and a full rehabilitation cost study is undertaken every three years. Closure cost is provided for in two ways i.e. a rehabilitation trust fund that is grown to provide for scheduled closure and bank guarantees that will supplement the trust fund in the unlikely event of unscheduled closure. Rehabilitation cost provision is made in line with the requirements of the MPRDA Act, Section 41. Foskor is currently reviewing the impact of legislative changes with regards to rehabilitation and rehabilitation provision and will align the current rehabilitation and closure plans to the requirement as gazetted.

FOSKOR INTEGRATED REPORT 2016
73OPERATIONAl PERFORmANcE
AcID DIvISION
kEy AchIEvEmENTS
¢¢ Zero fatalities (2015: 0) – target zero¢¢ lost-time injuries reduced to 3 (2015: 4)
ImPROvED SAFETy REcORD
rock conversion efficiency at Acid division has improved from 56% may 2015 to 90% march 2016
ImPROvED EFFIcIENcy
¢¢ deKrA 5 Shield SHe status maintained¢¢ All ISo certifications (14001, 9001, oSHAS 18001 and
SANS 16001) retained
mAINTAINED QuAlITy
mANAGEmENT
¢¢ two weak phosphoric acid tanks were rebuilt and one strong phosphoric acid tank completed¢¢ replacement of spiral coolers completed
ASSET REPlAcEmENT PROGRAmmE
PROGRESSING wEll
chAllENGES
¢¢ equipment failure in concentration plant¢¢ liquid effluent discharge compliance with statutory¢¢ failure of fAt in Sulphuric acid A plant¢¢ Industrial relation climate¢¢ dol issues pertaining to pressure vessels
mAjOR EQuIPmENT FAIluRES
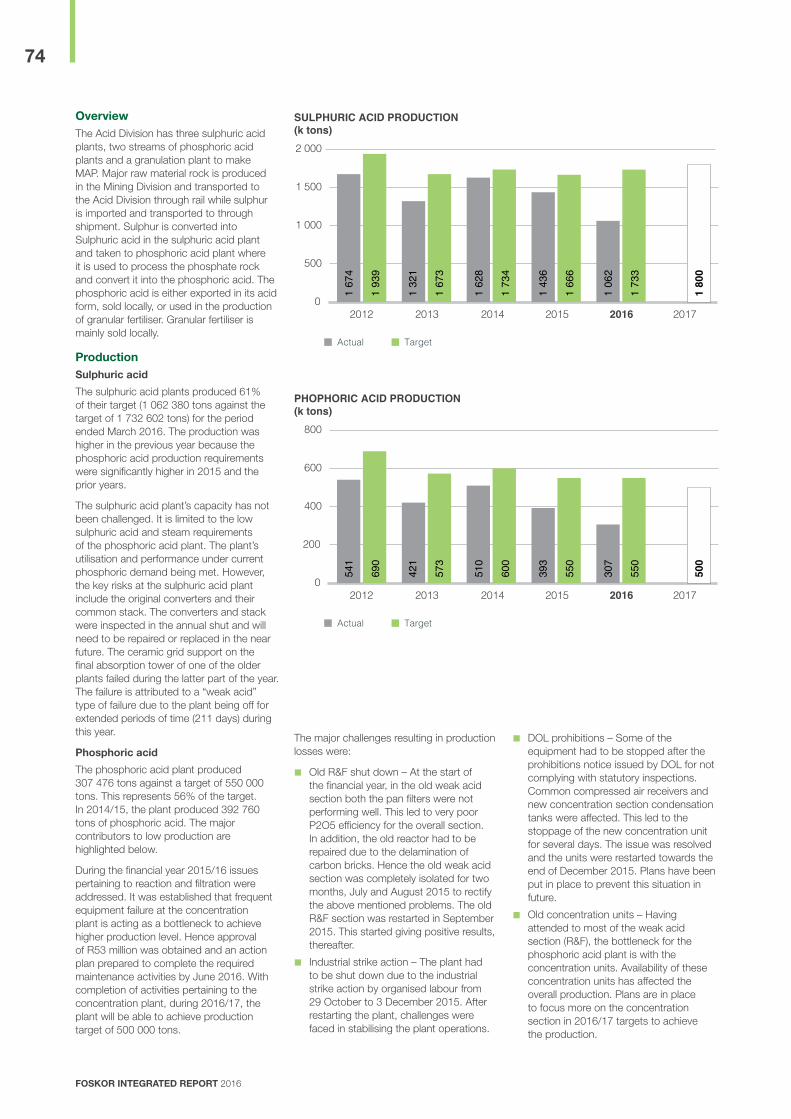
FOSKOR INTEGRATED REPORT 2016
74
0
500
1 000
1 500
2 000
SULPHURIC ACID PRODUCTION(k tons)
20172014 2015 2016
Actual Target1
674
2013
1 93
9
1 80
0
2012
1 32
1
1 67
3
1 62
8
1 73
4
1 43
6
1 66
6
1 06
2
1 73
3
0
200
400
600
800
PHOPHORIC ACID PRODUCTION(k tons)
20172014 2015 2016
Actual Target
541
2013
690
500
2012
421
573
510
600
393
550
307
550
OverviewThe Acid Division has three sulphuric acid plants, two streams of phosphoric acid plants and a granulation plant to make MAP. Major raw material rock is produced in the Mining Division and transported to the Acid Division through rail while sulphur is imported and transported to through shipment. Sulphur is converted into Sulphuric acid in the sulphuric acid plant and taken to phosphoric acid plant where it is used to process the phosphate rock and convert it into the phosphoric acid. The phosphoric acid is either exported in its acid form, sold locally, or used in the production of granular fertiliser. Granular fertiliser is mainly sold locally.
Production Sulphuric acid
The sulphuric acid plants produced 61% of their target (1 062 380 tons against the target of 1 732 602 tons) for the period ended March 2016. The production was higher in the previous year because the phosphoric acid production requirements were significantly higher in 2015 and the prior years.
The sulphuric acid plant’s capacity has not been challenged. It is limited to the low sulphuric acid and steam requirements of the phosphoric acid plant. The plant’s utilisation and performance under current phosphoric demand being met. However, the key risks at the sulphuric acid plant include the original converters and their common stack. The converters and stack were inspected in the annual shut and will need to be repaired or replaced in the near future. The ceramic grid support on the final absorption tower of one of the older plants failed during the latter part of the year. The failure is attributed to a “weak acid” type of failure due to the plant being off for extended periods of time (211 days) during this year.
Phosphoric acid
The phosphoric acid plant produced 307 476 tons against a target of 550 000 tons. This represents 56% of the target. In 2014/15, the plant produced 392 760 tons of phosphoric acid. The major contributors to low production are highlighted below.
During the financial year 2015/16 issues pertaining to reaction and filtration were addressed. It was established that frequent equipment failure at the concentration plant is acting as a bottleneck to achieve higher production level. Hence approval of R53 million was obtained and an action plan prepared to complete the required maintenance activities by June 2016. With completion of activities pertaining to the concentration plant, during 2016/17, the plant will be able to achieve production target of 500 000 tons.
The major challenges resulting in production losses were:
¢¢ Old R&F shut down – At the start of the financial year, in the old weak acid section both the pan filters were not performing well. This led to very poor P2O5 efficiency for the overall section. In addition, the old reactor had to be repaired due to the delamination of carbon bricks. Hence the old weak acid section was completely isolated for two months, July and August 2015 to rectify the above mentioned problems. The old R&F section was restarted in September 2015. This started giving positive results, thereafter.
¢¢ Industrial strike action – The plant had to be shut down due to the industrial strike action by organised labour from 29 October to 3 December 2015. After restarting the plant, challenges were faced in stabilising the plant operations.
¢¢ DOL prohibitions – Some of the equipment had to be stopped after the prohibitions notice issued by DOL for not complying with statutory inspections. Common compressed air receivers and new concentration section condensation tanks were affected. This led to the stoppage of the new concentration unit for several days. The issue was resolved and the units were restarted towards the end of December 2015. Plans have been put in place to prevent this situation in future.
¢¢ Old concentration units – Having attended to most of the weak acid section (R&F), the bottleneck for the phosphoric acid plant is with the concentration units. Availability of these concentration units has affected the overall production. Plans are in place to focus more on the concentration section in 2016/17 targets to achieve the production.

FOSKOR INTEGRATED REPORT 2016
75OPERATIONAl PERFORmANcE
PRODucTION EFFIcIENcy The production efficiency rate for the year was 78.75%. At the beginning of the financial year the efficiencies dropped to as low as 57%. Root cause analysis for loss of efficiency has been identified and addressed under initiative Project Makukhanye. Hence the last two quarters average has improved to above 80%, with the last two month’s average above 90%.
For financial year 2017 we are confident that the plant will achieve an average efficiency of 86%.
GRANulATIONGranulation plant production volume is governed by phosphoric acid availability, after meeting local supply and market demand for the product. Thus for the financial year sufficient acid was allocated to produce 198 251 tons of granulated fertiliser product. The limited supply of phosphoric acid to granulation and strategic marketing decision not to produce granular product based on product mix calculations in the year under review resulted in granular production being 201 749 tons below budget.
During the financial year 2016/17 the production of phosphoric acid is anticipated to improve to 500 000 tons thus expectations are that there will be enough acid available to achieve granulation production of 370 000 tons.
Asset replacement Much of the Acid Division’s plant and machinery was installed in 1976 and most of it had to either be refurbished or replaced. The completion of these projects will increase plant availability thereby leading to improved production capacity and efficiency. The cash flow forecast for capital projects is planned at R235 million per annum for the next three years.
The Asset Replacement Programme has been implemented in the 2014/15 financial year. Critical tanks have been put on major maintenance or replacement as part of the asset replacement programme. This resulted in reduced throughput as the plant had to stop due to high weak acid stocks. In the financial year 2015/16 the complete refurbishment of two tanks and the replacement of another tank in the phosphoric acid plant were completed. Replacement of a molten sulphur storage tank in the sulphuric acid plant commenced and was at 80% completion at end March 2016. The main focus will continue to be on asset replacement programme projects and details are stated below:
0
100
200
300
400
GRANULATION PRODUCTION (k tons)
20172014 2015 2016
Actual Target
283
2013
347
370
2012
230
349
307
370
297
393
198
400
0
20
40
60
80
100
P2O5 EFFICIENCY(%)
20172014 2015 2016
Actual Target
87.3
5
2013
89.2
7
86.0
0
2012
88.0
5
91.0
1
84.9
0
92.0
0
76.2
8
90.9
4
78.7
5
89.3
6

FOSKOR INTEGRATED REPORT 2016
76
ASSET REPlAcEmENT ITEmS Description Planned timeline
1
Install a new belt filter at our old phosphoric acid plant
The two pan filters utilised by our old phosphoric acid plant require regular maintenance and suffer from frequent breakdowns and long replacement lead times. In 2002 we built a new phosphoric acid plant that makes use of three more reliable and technologically advanced Gaudfrin belt filters. We plan to install a fourth Gaudfrin belt filter to serve as a backup filter to both old and new acid plants. In the short term the belt filter will primarily compensate for any pan filter shortfalls. We expect that the new belt filter will improve our performance and fit in seamlessly with our belt filter maintenance programme.
The construction and installation of the belt filter system equipment and facilities was completed and the filter was commissioned in September 2015.
2
Install a fourth concentrator unit in the new phosphoric acid plant
The new phosphoric acid plant utilises three concentrator units concurrently. With aged concentration units in the old phosphoric acid plant (1976), a unit similar to new concentrator for backup purposes is required. This will fill the gap in production capacity, stabilise the operation of the sulphuric and phosphoric acid plants by using the available acid storage capacity optimally, and reduce steam losses and plant downtime.
The detailed design and engineering for the new concentrator unit was at 80% completion at end March 2016. Some delays were experienced due to scope changes. Implementation of the project will be undertaken on a EPC/Turnkey basis. Duration of construction and commissioning is 18 months from commencement.
3
Replace both pan filters in the old phosphoric acid plant
As discussed above, the old phosphoric acid plant utilises two pan filters which have passed their useful lifespan and are due for replacement. A major overhaul of one filter was performed in April to May 2012 locally, while a partial replacement of the other was performed in October to November 2012 with the original manufacturer. In light of the work already undertaken, we intend to complete the pan filter replacement work.
Major refurbishment of Pan Filter #2 was undertaken in July/August 2015. The balance of the work, awaiting spares delivery from Belgium, will be completed in 2016.
Replacement of Pan Filter #1 commenced in October 2015 with the order placement for long lead items. In December 2015 the dismantling of the filter started. Completion of the filter is planned for end June 2016.
4
Install an additional acid clarifier
Our existing infrastructure consists of two acid clarifiers: a 1 800m3 clarifier in our old plant and a 3 500m3 clarifier in our new plant. We recently revised our acid plant configuration in both weak and strong grade phosphoric acid sections. Due to the reconfiguration, we need to improve our clarifier capacity to improve sludge handling and minimise associated acid losses.
The current challenges in the Acid Plant indicated that the requirement for an additional in-process storage tank is of higher priority than an additional clarifier. Construction of the tank will commence in 2016 and is planned for completion by October 2017.
5
Replace the main stack and converters for both sulphuric acid plants
Sulphuric acid plants A and B share one common stack. The stack and the catalytic converters at both plants are finishing their useful lifespan and approaching replacement. The replacements will also enable Foskor to meet the planned new environmental legislation for stack emissions from sulphuric acid plants.
A reputed French engineering company, Technip, has completed a techno-economic feasibility study for modification. Detailed design and engineering for modifications to the a sulphuric acid plant will be undertaken in 2016/17 with planned implementation in 2017/18. The necessary replacements or modifications will be done in phases and completed by 2025 due to the cost and impact of modifications on plant availability.
6
build a new reactor for the old phosphoric acid plant
The concrete reactor in the old acid plant has been in operation for 39 years and has been repaired twice. The advanced age of the reactor poses a major health, safety and environmental risk, and it must be replaced.
Conceptual design and location feasibility study was completed with involvement of original process licensor (Prayon Technologies) and engineering contractor (SNC Lavalin, Belgium). Basic design engineering is planned for 2016. Alternative options regarding the location of the reactor are explored that could have a significant impact on the cost and duration of the reactor replacement.
AcID DIvISION (CONTINUED)
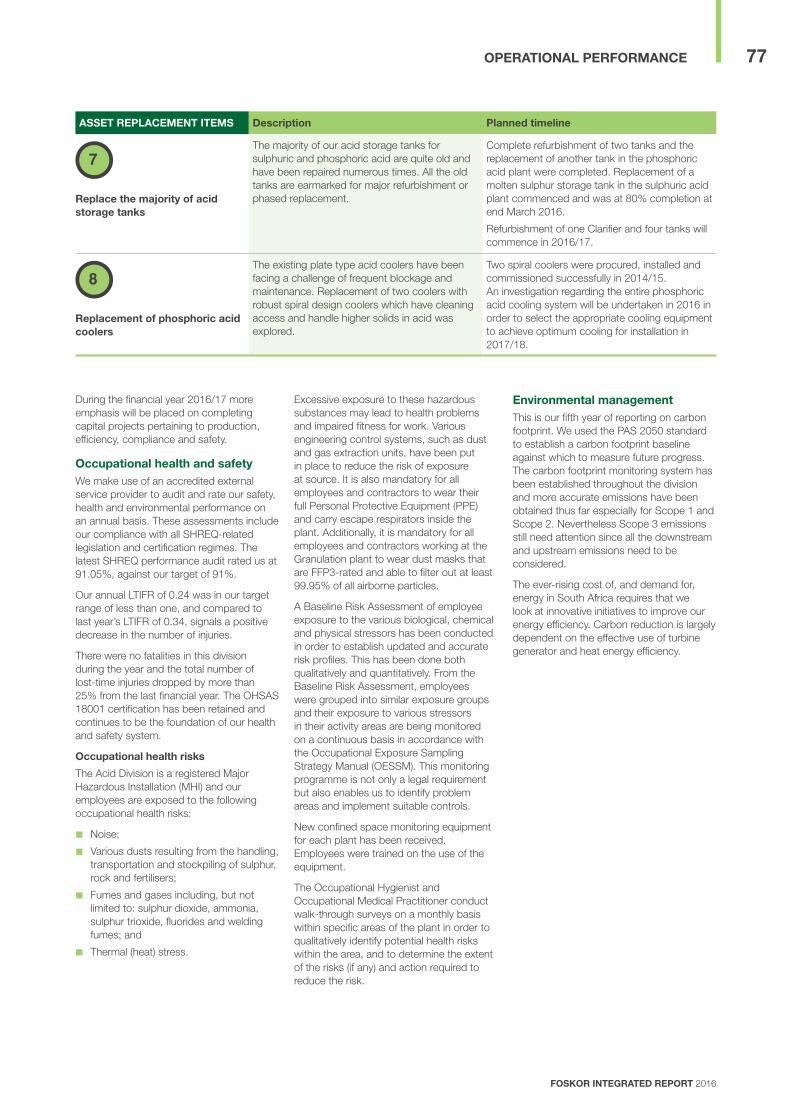
FOSKOR INTEGRATED REPORT 2016
77OPERATIONAl PERFORmANcE
ASSET REPlAcEmENT ITEmS Description Planned timeline
7
Replace the majority of acid storage tanks
The majority of our acid storage tanks for sulphuric and phosphoric acid are quite old and have been repaired numerous times. All the old tanks are earmarked for major refurbishment or phased replacement.
Complete refurbishment of two tanks and the replacement of another tank in the phosphoric acid plant were completed. Replacement of a molten sulphur storage tank in the sulphuric acid plant commenced and was at 80% completion at end March 2016.
Refurbishment of one Clarifier and four tanks will commence in 2016/17.
8
Replacement of phosphoric acid coolers
The existing plate type acid coolers have been facing a challenge of frequent blockage and maintenance. Replacement of two coolers with robust spiral design coolers which have cleaning access and handle higher solids in acid was explored.
Two spiral coolers were procured, installed and commissioned successfully in 2014/15.An investigation regarding the entire phosphoric acid cooling system will be undertaken in 2016 in order to select the appropriate cooling equipment to achieve optimum cooling for installation in 2017/18.
During the financial year 2016/17 more emphasis will be placed on completing capital projects pertaining to production, efficiency, compliance and safety.
Occupational health and safety We make use of an accredited external service provider to audit and rate our safety, health and environmental performance on an annual basis. These assessments include our compliance with all SHREQ-related legislation and certification regimes. The latest SHREQ performance audit rated us at 91.05%, against our target of 91%.
Our annual LTIFR of 0.24 was in our target range of less than one, and compared to last year’s LTIFR of 0.34, signals a positive decrease in the number of injuries.
There were no fatalities in this division during the year and the total number of lost-time injuries dropped by more than 25% from the last financial year. The OHSAS 18001 certification has been retained and continues to be the foundation of our health and safety system.
Occupational health risks
The Acid Division is a registered Major Hazardous Installation (MHI) and our employees are exposed to the following occupational health risks:
¢¢ Noise;
¢¢ Various dusts resulting from the handling, transportation and stockpiling of sulphur, rock and fertilisers;
¢¢ Fumes and gases including, but not limited to: sulphur dioxide, ammonia, sulphur trioxide, fluorides and welding fumes; and
¢¢ Thermal (heat) stress.
Excessive exposure to these hazardous substances may lead to health problems and impaired fitness for work. Various engineering control systems, such as dust and gas extraction units, have been put in place to reduce the risk of exposure at source. It is also mandatory for all employees and contractors to wear their full Personal Protective Equipment (PPE) and carry escape respirators inside the plant. Additionally, it is mandatory for all employees and contractors working at the Granulation plant to wear dust masks that are FFP3-rated and able to filter out at least 99.95% of all airborne particles.
A Baseline Risk Assessment of employee exposure to the various biological, chemical and physical stressors has been conducted in order to establish updated and accurate risk profiles. This has been done both qualitatively and quantitatively. From the Baseline Risk Assessment, employees were grouped into similar exposure groups and their exposure to various stressors in their activity areas are being monitored on a continuous basis in accordance with the Occupational Exposure Sampling Strategy Manual (OESSM). This monitoring programme is not only a legal requirement but also enables us to identify problem areas and implement suitable controls.
New confined space monitoring equipment for each plant has been received. Employees were trained on the use of the equipment.
The Occupational Hygienist and Occupational Medical Practitioner conduct walk-through surveys on a monthly basis within specific areas of the plant in order to qualitatively identify potential health risks within the area, and to determine the extent of the risks (if any) and action required to reduce the risk.
Environmental management This is our fifth year of reporting on carbon footprint. We used the PAS 2050 standard to establish a carbon footprint baseline against which to measure future progress. The carbon footprint monitoring system has been established throughout the division and more accurate emissions have been obtained thus far especially for Scope 1 and Scope 2. Nevertheless Scope 3 emissions still need attention since all the downstream and upstream emissions need to be considered.
The ever-rising cost of, and demand for, energy in South Africa requires that we look at innovative initiatives to improve our energy efficiency. Carbon reduction is largely dependent on the effective use of turbine generator and heat energy efficiency.

FOSKOR INTEGRATED REPORT 2016
78
Energy consumption and greenhouse gas equivalent emissions per source – 2015/2016
Source ScopeAnnual
consumption
monthly average
consumptionconversion factor kg cO2e kg of cO2-e % total
Sasol gas – CH4 (GJ) Scope 1 78 389 6 532 50.1 3 927 289 2.67
Diesel (L) Scope 1 270 278 22 523 2.67 721 642 0.49
Grid electricity (kWh) Scope 2 127 291 455 10 607 621 1.03 131 110 198 88.98
Water (Kl) Scope 3 5 491 523 457 627 1.78 9 774 911 6.63
General Waste (Kg) Scope 3 324 277 27 023 2.94 953 374 0.65
Recycled waste (Kg) Scope 3 464 535 38 711 1.84 854 744 0.58
Total 147 342 159 100
Scope 1 = Direct emissionsScope 2 = Indirect emissions as a result of purchased electricityScope 3 = Other indirect emissions not included in Scope 2
Fresh water usageOur operations are heavily reliant on water. As both societal and industrial demand for water grows and access becomes increasingly competitive, coupled with the current drought, we expect water constraints to affect the whole country. It is therefore important that we consider proactively the risks associated with the availability of water, both in terms of quality and quantity, and respond by using water responsibly and reducing our impact on local water resources. Historical water use as supplied by the municipality is shown below.
Fresh water consumption (m3)
water type 2010 2011 2012 2013 2014 2015 2016
Potable water 5 244 818 3 430 730 2 008 329 2 972 112 3 196 644 5 528 217 3 953 376
Clarified water 4 152 170 5 412 847 4 126 739 3 490 816 4 160 662 2 528 708 1 538 147
Total 9 396 988 8 843 577 6 138 068 6 462 928 7 357 306 8 056 925 5 491 523
We obtain all our water from the uMhlathuze Municipality in two grades: potable water and clarified water. The Richards Bay region has been experiencing drought since September 2014 due to low water levels at Goedetrouw Dam (Water level at 22.56 as of March 2016) which supplies the Richards Bay area and the surrounding towns. Consequently, the municipality has put in place water restrictions based on allocation. With the Level 4 – 15% water restrictions currently in place, we are bound to consume 9 800KL of potable water and 14 450KL per day. This has compelled and encouraged us to look at ways to improve water efficiency on site and also explore water saving projects such as rainwater harvesting.
A storm water dam situated on the south-east boundary of the site collects the majority of storm water run-off from the site. The water is reused in our two phosphoric acid plants. We also have an agreement with a neighbouring business, South 32, to recycle their storm water as a replacement for our own municipal raw water intake. The Acid Division will endeavour to reuse and recycle water from within the site and from other industries wherever practically possible.
Effluent managementAs stipulated in the Effluent Disposal Agreement between Foskor and Mhlathuze Water, Foskor Richards Bay on a daily basis, analyses an hourly 24-hour composite sample and submit a split sample to Mhlathuze’s Scientific Services Laboratory for analysis.
As a way of enforcing compliance to all stakeholders, Mhlathuze water implemented a non-conformance penalty system which came in to effect in July 2015. Effluent compliance especially on pH is a concern. Consequently there is a task team that meets every Tuesday to address effluent compliance on site.
Groundwater RemediationDuring the year we reassessed the strategies we currently have in place to prevent groundwater pollution and pollution of the surrounding environment. The study proposed various mitigation measures as set out in our Groundwater Remediation: Concept Designs Report. The proposed measures have been approved for implementation in the new financial
year. The pump connections and drain points have been installed and are currently operational.
All the boreholes that were damaged or destroyed in the last year either as a result of other projects on site or due to shallow depth of installation have been re-installed. In addition to this, additional boreholes were installed as a way of upgrading our entire monitoring borehole network to meet approved Department of Water Affairs and Sanitation methodology.
Groundwater contamination on site is still a concern, however there are projects in the pipeline that will minimise and prevent further contamination. These include:
¢¢ Upgrade of the C Tank farm
¢¢ Upgrade of the E Tank farm
¢¢ Maintenance and improvement of containment around sulphur melters, sulphur section and sulphuric acid tank farm
AcID DIvISION (CONTINUED)
FOSKOR INTEGRATED REPORT 2016
79OPERATIONAl PERFORmANcE
Air Quality managementFoskor’s new AEL was issued and approved on 30 September 2015 and is valid to September 2020. On receipt of the licence, Foskor was required to submit Dust management and Air Quality management (Fence-line) plans within six months. Foskor submitted the plans as well as other plans that were required. Foskor is currently compliant with the New AEL. The phosphoric acid plant and the granulation plant are 100% compliant against emissions limits as stipulated in the AEL. The sulphuric acid plant is 99.9% compliant, compared to a legal limit of 99%. The Scheduled Trade Permit has also been received and the new conditions are under review.
Our asset replacement programme takes into account the new air emissions legislation that requires us to reduce our sulphur dioxide gas emissions to 134ppm (350mg/Nm3) per plant by March 2020. Fluoride and ammonia are also required to be reduced to 5mg/Nm3 and 50mg/Nm3 by 2020 respectively.
The vast capital investment demanded by the modifications as well as reducing the impact of plant non-availability during modifications will result in the modifications implemented in a phased approach. This approach will result in completion of the modifications in 2025 and a concession for not meeting the requirements by 2020 will be sought from the authorities.
Reportable Incidents and External AuditsThere was one reportable environmental incident in terms of S(30) OF NEMA that occurred in December 2015, where the storm water dam overflowed. The Department of Environmental Affairs (DEA) and the local regulatory authorities were notified and we await the follow-up inspection by the Department.
In October 2015, the Department of Economic Development and Tourism and Environmental Affairs (DEDTEA) conducted an audit as their way to ensure environmental compliance. The audit are conducted in all industries in Richards Bay with each industry visited at least every two years. There were no non-conformances raised during this audit through recommendations for improvements were made.
waste management
The Acid Division generates a variety of waste materials and about 25 waste streams have been identified. We acknowledge the importance of effective waste management on site. The company believes in the culture of reusing and recycling wherever possible and that waste disposal to landfills should be the last resort. Consequently we are committed to developing sustainable ways to implement waste management. Our waste is divided into two broad categories – hazardous and general (and recyclable waste). The amount of waste disposed and the form of disposal is presented in the Sustainability Performance Data table.
Radiation monitoringFoskor Acid Division has a certification of registration with the National Nuclear Regulator and therefore have to comply to set conditions and regulatory requirements. In order to comply to set conditions systematic management programs and controls are implemented, monitored and evaluated for continual improvement to take effect. The below abridged report consists of critical monitoring and controls implemented in the past financial year.
One major challenge faced was the accumulation of a large volume of slightly radioactively contaminated filter cloths and associated rubber lining items over a number of years (approximately ten years). These materials were filling the available storage space at the Richards Bay Operations Salvage Yard, and have no further use. Hence various waste handling management options were explored whilst involving the NNR. The only viable option was to conduct assessments and apply for disposal at a “Class A” landfill site which was approved by the NNR after lengthy processes and engagements. Foskor Acid Division now has authorization to dispose radioactive materials (Filter Cloths and Rubber) to eShongweni Landfill Site.

FOSKOR INTEGRATED REPORT 2016
80 AcID DIvISION (CONTINUED)
Sustainability performance data
Performance Data – human, Natural and Social capital
2016 Actual
2016 Target 2015 2014 2013 2012
Level of assurance
People Employee numbers 665 602 640 675 743 Recruitment 49 29 41 56 45 Unionised labour % 75.3 82.7 80.9 77.5 68.8Employee turnover % 5.0 7.4 11.4 7.6 7.1
Skills development Training and development (R million) 1 612 363 2 500 000 2 262 757 3 857 604 5 639 475 6 449 962 Learnerships (number) 63 89 54 32 58 37 Learnerships (R million) 1 457 500 2 670 000 2 485 912 1 193 910 2 429 832 1 070 133 Bursaries (R million) 839 422 950 000 805 224 1 124 109 790 991 597 096
Safety Fatalities – – – – 1 – High Lost time injuries 3 6 4 4 8 5 High Lost Time Injury Frequency Rate (LTIFR) 0.24 0.6 0.34 0.36 0.59 0.45 High Total Injury Frequency Rate (TIFR) 4.96 5.5 6.65 5.42 6.59 5.26 High Occupational diseases (reported to COID) 1 0 5 3 1 High
Greenhouse gases energy consumption (kg of cO2–e) Diesel (Scope1)1 721 642 1 350 517 1 589 299 139 343 NR ModerateGas (Scope1)1 3 927 289 2 533 506 4 166 967 286 439 NR ModerateTravel (Scope1)1 NR NR 82 714 NR NR ModerateWater (Scope 1)2 9 774 911 14 346 966 13 096 004 NR NR ModerateElectricity (Scope 2)2 131 110 198 100 447 581 94 479 759 43 188 385 NR ModerateGeneral waste (Scope 3)3 953 374 1 480 999 2 617 747 NR NR ModerateRecycled waste (Scope 3)3 854 744 1 528 121 1 848 354 NR NR Moderate
Total greenhouse gas (cO2 equivalent) 147 342 159 121 687 690 117 880 844 43 614 167 NR
waterPotable water (Municipal) m3 1 538 147 5 528 217 3 196 644 2 972 112 2 008 329 HighClarified water (Municipal) m3 3 953 376 2 528 708 4 160 662 3 490 816 4 126 739 HighTotal fresh water consumption 5 491 523 8 056 925 7 357 306 6 462 928 6 135 068
waste management (tons)Harzadous material – registered landfill disposal 11 909 13 716 13 260 16 485 NR ModerateGeneral material – registered landfill disposal 667 834 949 1 646 NR ModerateRecyclable material – registered landfill disposal 794 1 614 1 064 1 602 NR Moderate
Procurement spend (%) Local 64 – 66 87 86 75 High National 8 – 10 7 3 13 High International 28 – 24 6 11 12 High
bbbEE rating level 5 3 5 4 3 5 High
High level of assurance = independent external verification/assurance, report available; Moderate = internally verified by management 1 Scope 1 = Direct emmissions 2 Scope 2 = Indirect emmissions 3 Scope 3 = Other indirect, not included in Scope 2NR: Not reported

FOSKOR INTEGRATED REPORT 2016
81OPERATIONAl PERFORmANcE
Total employees 2016 % change 2015 2014 2013 2012
Foskor Group (including contractors) 2 003 4.5 1 913 1 997 2 101 2 130
Employees per contract type 2016 % split 2015 2014 2013 2012
Permanent 1 778 88.8 1 767 1 842 1 945 1 857 Contract 225 11.2 146 155 156 273
Employees per gender 2016 Gender % split 2015 2014 2013 2012
Male 1 640 81.9 1 595 1 675 1 766 1 806 Female 363 18.1 318 322 335 324
Employees per level 2016 % change 2015 2014 2013 2012
Top management 11 (9.1) 12 13 13 15 Senior management 29 (3.4) 30 29 29 36 Middle management 126 (4.8) 132 139 164 152 Skilled 567 0.2 566 583 607 594 Semi-skilled 708 3.1 686 722 747 706 Unskilled 337 (1.2) 341 356 385 354 Contractors 225 35 146 155 156 273 Foskor Group 2 003 4.7 1 913 1 997 2 101 2 130
OuR PEOPlE
Recruitment Foskor hired 121 new permanent employees during the year, and our permanent employee complement increased by 0.62% to 1 778 (2015: 4.07% decrease). All skill levels, except senior management levels, reduced in numbers.
The size of our senior and top management team reduced to 40 this year, while our overall female representation increased by 14.2% (2015: reduced by 1.24%). Contractors increased to 225 (2015: 146), representing 11.23% of our total workforce, although the majority (176) are learnership programmes and graduates in training.
The average age of our entire workforce is around 41, which leaves 24 years on average working life until retirement. Average annual staff turnover is 6.2% (2015: 6.1%) of which retirees make up 1.5%. A system whereby some of the retirees are appointed as mentors and coaches for the engineers in our training programme is in place.
PermanentContract
88.811.2
Top management 11Senior management 29Middle management 126
MaleFemale
81.918.1
Skilled 567Semi-skilled 708Unskilled 337Contractors 225
cONTRAcT TyPE (%)
GENDER PROFIlE (%)
EmPlOyEES PER lEvEl

FOSKOR INTEGRATED REPORT 2016
82
Permanent employees recruited 2012 2013 2014 2015 2016
Foskor Group 204 178 81 90 121
Recruitment per division 2012 2013 2014 2015 2016
Phalaborwa and Midrand 159 140 44 61 72Richards Bay 45 38 37 29 49
Recruitment per gender 2012 2013 2014 2015 2016
Male 165 133 56 73 95Female 39 45 25 17 26
Recruitment by age 2012 2013 2014 2015 2016
<30 131 123 31 42 6930 – 40 58 39 38 35 4140 – 50 9 14 4 7 850 – 60 6 1 7 6 3>61 – 1 1 – –
% Employee turnover 2012 2013 2014 2015 2016
Foskor Group 6.6 5.8 10.2 6.1 6.2
% Turnover per division 2012 2013 2014 2015 2016
Phalaborwa and Midrand 6.3 5.0 9.6 5.5 6.3Richards Bay 7.1 7.6 11.4 7.4 5.0
% Turnover per gender 2012 2013 2014 2015 2016
Male 6.8 5.5 9.8 6.1 6.2Female 5.4 7.3 12.0 6.4 4.2
% Turnover by age 2012 2013 2014 2015 2016
<30 4.6 4.4 6.1 6.0 3.530 – 40 4.6 6.2 9.6 4.4 5.740 – 50 5.8 5.7 9.3 7.2 4.950 – 60 5.9 4.1 8.5 3.4 4.2>60 75.7 29.8 59.0 35.9 24.5
Training and developmentFoskor realises the importance of managing its talent from recruitment and employment through to retirement. Our succession plans take into account our strategic objectives and as such have identified key roles and individual positions to be developed. We are also continuing to address our skills shortages with the help of Coromandel, our strategic partner and Indian shareholder, which gives us access to the expert knowledge necessary to do on-the-job training for our employees. A formal Knowledge Transfer process is now in place between expatriates and identified Foskor employees.
Knowledge and skills development remain vital to the health of our organisation. Training initiatives bolster employee retention and we view them as a vitally important investment. Training is one of the key ways we maintain and improve our intellectual capital, and the quality of an organisation’s training affects its value.
Special emphasis was placed on the development of women and various initiatives were introduced during the year aimed at training women in the workplace. We spent a total of R6.5 million on training and development initiatives for 2016 (2015: R9.8 million).
Employee operational structure and diversification Foskor’s staff falls broadly into two categories: Operational staff (bargaining category employees) and managerial (middle, senior and top management). The table below also shows the racial and gender diversification of our permanent staff.
For the year ended 31 march 2016
Occupational levels
Actualhead
count
Disadvantaged Advantaged Race and gender composition
Total % Total % AF Am cF cm IF Im wF wm
Top management 11 10 77 3 23 2 7 – 1 – – – 3 Senior management 29 21 72 8 28 2 11 – 3 – 4 1 8 Professional and middle management 126 96 69 43 31 16 56 1 2 2 11 8 43 Skilled 567 458 79 125 21 73 315 2 1 10 24 33 125 Semi-skilled 703 698 97 24 3 79 606 1 – 1 6 5 24 Unskilled 357 355 100 1 0 55 300 – – – – – 1
Total 1 778 1 638 89 204 11 227 1 295 4 7 13 45 47 204
AF = African female AM = African male CF = Coloured female CM = Coloured male IF = Indian female IM = Indian male WF = White female WM = White male
Effective succession planning, including mentoring and training, assists with the smooth transition when employees are promoted or move on. The Board Human Capital and Nominations Committee is responsible for succession planning and the identification of potential successors for key positions.
OuR PEOPlE (CONTINUED)
FOSKOR INTEGRATED REPORT 2016
83OPERATIONAl PERFORmANcE
In order to address the shortage of skills, especially critical skills, we provide bursaries, learnerships, internships and other technical training opportunities. Across our two divisions we provided 53 learnerships during the year, 21 of whom were recruited after successfully completing their learnerships. Eight apprentices were trained at the Phalaborwa-based technical training centre. Six were full-time employees of Foskor and 62 were unemployed learners from the local community.
Our bursary programme offers deserving candidates the opportunity to study engineering and geology at a university or a university of technology. Due to austerity measures, no new bursaries were awarded during 2015. However, we still continue funding the old bursars. We currently have 13 bursars at the Mining Division and seven at the Acid Division. This brings the total number of bursars for both operations to 20. An amount of R2 million (2015: R2.2 million) was spent on bursaries.
Our graduate development programme aims to develop a strong technical foundation and blends academic theory and practical exposure. Every participant has a mentor who supervises their formal training and work exposure. A total of 15 graduates are currently participating in this programme, nine at the Acid Division and six at the Mining Division. Foskor also has an agreement with the MQA to assist with a development programme for MQA graduates. There are currently three engineers on this programme that was funded by the MQA.
The Adult Education Training programme presented at the Mining Division currently hosts 47 employees. Foskor invested R116 751.59 in the programme in 2016 (2015: R120 960), which offers eligible employees free tuition and learning materials.
Thirty one learners were registered at the Mining Division in the Foundational Learning Competency (FLC) to assist them to meet MQA basic requirements needed enabling them to register for qualification in Mineral Processing (Metallurgy) and Mineral Excavation Skills Programmes. An amount of R79 341.78 was invested in the programme.
In partnership with Mopani FET College and the LGSETA, the Mining Division is hosting 10 Learners in the fields of Management Assistant, Business Management and Finance Management. The purpose is to assist the learners in gaining work place experience to enable them to qualify for diplomas at the end of the 18-month training programme.
An apprenticeship programme is run at the Acid Division for the development of artisan learners. In partnership with Umfolozi FET College and CHIETA, the Acid Division is hosting 25 learners to eventually be declared competent artisans.
Trade union representativeness Foskor has once again continued to fully subscribe to the principles of industrial democracy and employee participation during the year under review. This process allows all employees of Foskor to freely participate in affairs affecting the interests of their members through trade union representation on all matters which affect their conditions of employment. There are presently six trade unions representing a total of 1 594 employees which equates to about 90% of our permanent staff complement. The National Union of Mineworkers (NUM), which is based at the Mining Division, represents the majority (60.1%) of our employees in the Group. The Chemical Energy Paper Printing Wood and Allied Workers Union (CEPPWAWU), which is based at our Acid Division operations in Richards Bay is the second largest trade union with a share of 24.5% employees. Solidarity at both operations has a combined share of 11.8%. UASA and UCIMESHAWU enjoy a support base of 3.3% and 0.3% respectively.
Substantive condition of employment The three-year agreement that was signed with both NUM and CEPPWAWU in 2014 is entering its last year on 1 April 2016. The agreement will come to an end on 31 March 2017. Considering the fact that the agreement will be lapsing next year, the company expects that the unions will soon be forwarding a new set of wage proposals for the 2017/2018 financial year. The current wage agreement was characterised by a staggered approach, which has, apart from substantially reducing salary inequalities, effectively put to rest the salary progression dispute that gave rise to the 2012 industrial action at the Mining Division.
Dispute resolutionDuring the year under review (2015 –16 financial year), 24 CCMA and NBCCI cases were reported of which 23 were finalised as reflected below. Altogether 15 of them related to individuals while nine were collective in nature. The cases were concluded as follows:
¢¢ one favourable arbitration award;
¢¢ seven favourable settlement agreements;
¢¢ eight withdrawal/dismissals;
¢¢ six abandoned;
¢¢ one strike certificate: and
¢¢ one still outstanding
It is also worth mentioning that of these cases, 11 relate to allegations of unfair labour practice (ULP), eight to misconduct, one to retrenchment, two to collective agreements and one to constructive dismissal. The fact that fourteen of the cases were either dismissed by the CCMA or withdrawn by the applicants is indicative of the fact that more training on industrial relations is still necessary amongst trade union representatives. Accordingly, Foskor’s industrial relations section has been arranging, and will continue to arrange for CCMA training and other IR-related training to capacitate trade union representatives, in order to reduce the number of complaints which are frivolously lodged with the CCMA.
General industrial relations climateA sound employment relations climate continued to prevail during the period under review at the Mining division.
However, the Company experienced industrial instability at the Acid Division where the CEPPWAWU went on 30-day protected strike action. Although some employees were willing to report for work, the strike climate forced the Company to suspend the operations for safety reasons. The issues which gave rise to the strikes are allegations that the company was not making contribution towards the provident fund and non-payment of the annual performance bonus. The union made the demand for payment of annual performance bonuses despite the fact that the division did not meet its annual performance objectives/targets. The strike was nevertheless successfully resolved at the end of November 2015 by way of a settlement agreement. Most of the outstanding issues that emanated from the strike which formed part of the settlement agreement were being finalised at the time of compiling this report. The parties also agreed that the matter pertaining to provident fund contributions will be referred to private arbitration, which is scheduled to take place on 14 April 2016. The company and trade unions continue to utilise the existing forums to engage each other on matters of mutual interest. The employment relations climate can currently be described as satisfactory.

FOSKOR INTEGRATED REPORT 2016
84
SOcIAl
mining is a key driver of economic growth in South Africa and it continues to play a significant role in socio-economic development which attempts to redress the socio-economic imbalances in our communities.
When Foskor was issued with the conversion of the mining rights, the licence to operate was conditional on compliance with the Mining Charter, Broad-Based Black Economic Empowerment (BBBEE) Act and the Minerals and Petroleum Resources Development Act (MPRDA).
We aspire to fully comply with the transformation legislation and guidelines to ensure that our stakeholders participate in the economic benefits generated at our operations, and that our activities leave our host governments and communities with a firm foundation for a sustainable future.
We have different transformation initiatives in the divisions to assist in highlighting the management team about issues that affect our employees and the immediate communities. The consultative forums
include Employment Equity forums, monthly organised labour meetings, scheduled community meetings, and others.
cAREER DEvElOPmENT AND wOmEN IN mININGAs part of our initiatives to develop women, we have spent in excess of R1 million to train women in the current year. Our career development and succession planning programme provides for employees to be chosen for development and advancement based on core competency requirements. A career path is then planned for the individuals selected with a mentor assigned to the protégé. The career progression plan for women at Foskor is given priority and the management team supports initiatives to develop women and 12% of the 94 people identified for career progression are women. The career progression planning at Foskor ranges from 12 months to four years depending on the extent of the level of the incumbents workplace exposure. It must be noted that mentoring forms an integral part of employees’ career development to ensure that there is proper and well informed transfer of skills.
In 2015, women occupied 12% of mining and process-related positions, and made up 16% of our permanent staff. Our employment equity plan is geared to support the increasing of the total number of women we employ.
bROAD-bASED blAck EcONOmIc EmPOwERmENTThe current BBBEE certificate which expires in March 2016 can be accessed from our website www.foskor.co.za. A summary of the account of our current BBBEE Level 5 is presented below:
ElEmENTmaximum score
old scorecardFoskor
scoremaximum score
new scorecard
Ownership 20 11.21 25
Management control 10 10.25 15
Employment equity 15 7.62 –
Skills development 15 5.83 20
Preferential procurement 20 17.40 –
Enterprise development 15 2.06 40
Socio-economic development 5 2.51 5
100 56.88 105
mINING chARTER All mining rights holders are required to submit an annual compliance assessment to the Department of Mineral Resources on progress made against meeting the annual targets in the Charter. We have submitted all the required annual reports.
We have completed our first five-year cycle of the Social and Labour Plan in 2014 and subsequently a new five-year plan has been submitted with new transformation targets. The proposed SLP has been approved by the DMR for implementation as supported by all critical stakeholders being the majority union NUM, Ba-Phalaborwa Municipality and the representatives from the communities.
We are waiting in great anticipation, the new mining charter targets that will bring a new transformation dispensation in the mining industry.
OuR PEOPlE (CONTINUED)
FOSKOR INTEGRATED REPORT 2016
85OPERATIONAl PERFORmANcE
SOcIO-EcONOmIc DEvElOPmENTThe delivery of community development projects is informed by the Social and Labour Plans (SLPs) that are submitted every five years to the DMR, detailing community development projects and targets. Foskor will be making a minimum direct investment of R35 million for the funding of the four Local Economic Development projects in the SLP in the Mining Division for the next five-year cycle. A further annual investment of R3.0 million is made in the group as part of the fixed and ad hoc donations. The total SLP funding for the second cycle is in the excess of R70 million.
We invest in communities within a 50-kilometre radius of our Mining and Acid operations. Our corporate social investment (CSI) and local economic development (LED) under the stewardship of the Corporate Affairs Department, manage education, skills development, housing and infrastructure upgrades and healthcare and social welfare. We conduct rigorous community needs assessments, and put in place monitoring and control systems to safeguard the integrity of initiatives and ensure they continue to meet the needs of our local communities.
We provide market-related housing allowances for qualifying employees and communal living facilities at Namakgale for those who choose to live in these well-maintained facilities.
cOmmuNITIESThe mining industry is expected to make a difference by being able to create a sustainable business which can effectively engage its stakeholders – most directly our employees and the communities close to our operations, but equally to the stakeholders who indirectly affect, or are affected by, what we do, including governments, shareholders, partners and suppliers. We are committed to working with our stakeholders in government, business and civil society to promote good governance and the responsible use of mineral wealth for the benefit of society in general.
We believe that establishing relationships built on trust, integrity and mutual respect is fundamental to our ability to create value for the communities and the shareholder. The need to invest in building mutually beneficial relationships is of great importance.
Our Company sustainability as a mining operation depends on our ability to positively contribute to the wellbeing and prosperity of our host communities. The recent challenging social context in South Africa on unemployment and prevalence of child-headed families due to the impact of HIV/AIDS highlights the need for sustainable community development as both a commercial and a social imperative around our operations in both Phalaborwa and Richards Bay.
Our established Community Trusts are geared to support the local communities by adopting the approach of the provincial development plan which supports poverty alleviation through agricultural projects and skills development initiatives. The Community Trusts are managed by community-representing Trustees in terms of the trust deeds and are funded through the Foskor dividends when the Company is profitable.
Our corporate social investment includes investments in sports, arts and culture, health and food security, and the support of vulnerable groups.
There are no disputes with communities’ relating to land use, customary rights of local communities and indigenous people. There is one pending land claim in Phalaborwa.
Priska combined School
Foskor in partnership with the Ba-Phalaborwa Municipality library jointly converted a classroom into a library at Priska Combined School. Priska School in situated in a very small remote village under the leadership of Hosi Majeje in the outskirts of Phalaborwa. Ba-Phalaborwa municipality realised the need of essential services and resources in village and approached Foskor to go into this worthy cause partnership. Foskor management approved the funding of the project to convert a classroom to a library. The library will be of utmost importance to the learners as well as educators of Priska as the nearest library facility is ±23km.
The headmaster Mr Mabunda appreciated the facility as it will give exposure to the learners who are at the deep rural as the future plan is to equip the library with computers with internet access. The Lulekani Circuit Manager Ms Tilly Baloyi thanked Foskor with all the development that are taking place in the school as the school is regarded to be in a poorest of the poor community
Nwasorini Primary SchoolThe school management team requested a donation from Foskor to repair the dilapidated ablution facilities. An amount of R206 136.39 was approved to refurbish the facility. The school principal appreciated the assistance received from Foskor as the teaching and learning process was no longer effective due to lack of usable and decent facilities.
mandela dayA group of seven Foskor employees together with traffic officers joined hands in preparing food for the Nthabiseng Special School learners, educators and all the school workers in contribution of the 67 minutes of doing community service in honour of the late Nelson Mandela. Learners with special needs also received lessons on road safety.
Phakgamang GardensPhakgamang is a home-based care organisation that extends the health arm of the local health facilities to take care of patients that are bedridden in their homes. The borehole was sunk by one of the drilling contractors as part of the community spending. The official handover of the borehole project was done by VP Mining and thereafter the Mayor led the way to sow seeds and plant seedlings. The borehole project was started after the Phakgamang Home Based Care Givers realised the need for a vegetable garden when they visited patients who are poverty stricken. The care givers started a garden which feeds both patients and care givers’ families.
EDucATION“Donating a dictionary” projectThis project is meant to strengthen our relationship with the Department of Education in making a difference in educating the children, under a theme “Every child deserves a dictionary”. On this project Foskor pledged 100 primary school dictionaries for local primary schools in deep rural areas. We bought into the project because as Foskor we believe that once a learner is literate, the possibilities are endless. The schools that will benefit from Foskor’s pledge are primary schools because we also consider that foundation phase is the starting point of good education. We will always ensure that we contribute towards the enhancement of a conducive teaching and learning environment.

FOSKOR INTEGRATED REPORT 2016
86 SOcIAl (CONTINUED)
career guidance to rural schoolsFoskor is working together with five traditional Authorities form Kwa-Mkhwanazi, Kwa-Dube, Mambuka, Bhejane and Madlebe in terms of motivating all Maths & Science matric students under their communities. This is an initiative where CSI has partnered with Foskor Learning & Development Department. Foskor see the need to motivate these learners from rural areas as they always make wrong choices in terms of choosing their career paths which is not helpful in turning the situation around. This is an ongoing project as Foskor have already started with schools from Kwa Mkhwanazi Traditional Authority and it will be extended to other Traditional Authorities.
SOcIAl SuPPORT TO cOmmuNITIES
house of Shalom centre for OrphansAs part of Corporate Social Investment Programme, Foskor places a high priority on supporting orphans and vulnerable children. Social support assists the development of our communities that have been affected by socio-economic problems. It aims to improve communities through basic education, supporting those infected with or affected by illness. Foskor supports children within communities who by no fault of their own require assistance with day care, education and basic household provisions. Social support projects are driven by Foskor through partnerships with government department and private sector to accelerate development in our communities. Foskor works together with the House of Shalom Centre for Orphans.
AGRIculTuRAl PROjEcT INITIATIvE (AGRIculTuRE & FOOD SEcuRITy)Foskor – market daysOur local cooperative farmers are given the platform to market their fresh produce vegetables during the last Friday of each month. The market usually takes place at Foskor premises, which this is meant to create a platform or market for our agricultural cooperatives to sell their products. These cooperatives have been supported by Foskor employees in buying their fresh produce over the past year and are now able to sell their fresh produce directly to customers.
SkIllS DEvElOPmENTbakery/confectionary training for Nawe Zifunze disabled ladiesThis project is aimed at empowering women with disabilities with skills to enable them to survive the difficulties arising from unemployment. Foskor is working together with Nawe Zifunze Disabled Centre in Richards bay, where 10 ladies were identified and enrolled in a two-week course in bakery. The ladies received their certificates after they were taught to bake a number of goodies, including pies, muffins, tarts and birthday cakes. The ladies will use their skills in bringing in a steady income to those wanting to start their own businesses and this will ensure that they are independent.
ceramic/pottery projectDepartment of Arts and Culture offers various skills development initiatives. Foskor partnered with the Department and Zikhulise Skills Centre in training the youth for a Ceramic and Pottery course. The youth are from ages 18 to 35 years from the neighbouring communities. This is to ensure that the neighbouring communities benefit in this initiative. Foskor in collaboration with Zikhulise Skills Centre and Department of Arts and Culture aims to assist the youth in marketing their products at relevant expo and on market days in Richards bay.
cSI STAkEhOlDER cOllAbORATIONFoskor Acid Division has formed partnership with the local stakeholders which are local corporates and government departments in Richards bay on CSI projects that serves the surrounding communities. The projects that will be conducted in collaboration are Environmental Awareness days, National Water Month, Arbour Days, and International Coastal Clean-ups.

FOSKOR INTEGRATED REPORT 2016
87OPERATIONAl PERFORmANcE
AbbREvIATION mEANING
AbET Adult Basic Education Training
AEl Atmospheric Emissions Licence
AhF Anhydrous fluoride acid
AmS 16001 Aids Management Systems 16001 standard
ARc Agricultural Research Council
b-bbEE Broad-based Black Economic Empowerment
bARc Board Audit and Risk Committee
bEE Black Economic Empowerment
cAPEx Capital expenditure
ccmA Commission for Conciliation, Mediation and Arbitration
cEO Chief Executive Officer
cEPPwAwu Chemical, Energy, Paper, Printing, Wood and Allied Workers Union
cIl cooler Coromandel International Ltd
cINPF Chemical Industries National Provident Fund
cO2 Carbon dioxide
cOID Compensation for occupational injuries and diseases
cOSO Committee of Sponsoring Organisations
cRF Institute A company offering independent HR assessment and acknowledgement, headquartered in The Netherlands
cSI Corporate Social Investment
DAEA Department of Agriculture and Environmental Affairs
DAP Di-ammonium phosphate
DEA Department Environmental Affairs
DEkRA certification A global provider of auditing and certification services, specialising in the fields of safety, environment and health, headquartered in Germany
DmR Department of Mineral Resources
DTI Department of Trade and Industry
DwA Department Water Affairs
EbIT Earnings before interest and taxes
EbITDA Earnings before interest, taxes, depreciation and amortisation
ERm Enterprise-wide risk management
ESOP Employee share ownership plan
ExcO Executive Committee
FFP3 Filtering Face Piece Level 3 respirator
FGAS Foskor Group Audit Services
FOb Free on Board
FOR Free on Rail
AbbREvIATION mEANING
FZE Free zone establishment. Refers to a limited liability entities owned by an individual or corporate entity, as in Sun International (FZE) Dubai
GRI Global Reporting Initiative
hDSA Historically Disadvantaged South Africans
hIv/AIDS Human Immunodeficiency Virus/Acquired Immune Deficiency Syndrome
hl, cmw, hDPE, k4 Various recyclable waste generated
IAS International Accounting Standards
IcT Information and Communications Technology
IDc Industrial Development Corporation of South Africa Ltd
IDP Integrated Development Plan
IFRS International Financial Reporting Standard
IIR Framework The IIRC’s Integrated Reporting Framework
IIRc International Integrated Reporting Council
IR Industrial Relations
IRmSA Institute of Risk Management of South Africa
ISO 14001 International Organisation of Standards – Environmental Management
ISO 16001 International Organisation of Standards – Energy Management Systems
ISO 31000 International Organisation of Standards – Risk Management
ISO 9001 International Organisation of Standards – Quality Management
king III Corporate Governance Codes of the King 3 report
kPI Key Performance Indicator
kZN KwaZulu-Natal
lA crushers A load and haul materials handling service provider in Phalaborwa for both the PMC and Foskor
lED Local economic development
lTIFR Lost time injury frequency rate
mAP Mono-ammonium phosphates
mAPz MAP with zinc
mDP Management Development Programme
mDw Mission-directed work teams
mPRDA Mineral and Petroleum Resources Developments Act
mQA Mining Qualifications Authority
mvA Megavolt Ampere
mw Mega Watt
GlOSSARy

FOSKOR INTEGRATED REPORT 2016
88
AbbREvIATION mEANING
NEcSA Nuclear Energy Corporation Ltd of South Africa
NEmA National Electrical Manufacturers Association
NERA National Empowerment Rating Agency
NGO Non-governmental organisation
NPk Nitrogen-phosphate-kalium (complex fertilisers)
Num The National Union of Mineworkers
OhS Act Operational Health and Safety Act of South Africa
OhSAS Occupational Health and Safety Assessment Series
P2O5 The term used in the phosphate industry to measure its phosphoric acid production volumes
PAS 2050 standard Publicly Available Standards (PAS) 2050 is a method for the assessment of the life cycle GHG emissions associated with goods and services
Phb Phalaborwa
Pmc Phalaborwa Mining Company
PPE Personal Protective Equipment
PROTEc Programme for Technological Careers
Rby Richards Bay
ROcE Return on capital employed
ROm Run of mine
SAbS South African Board of Standards
SAmREc South African Mineral Resource Committee
SANS South African National Standards
SANS 16001 South African National Standards for HIV/AIDS
SANS 451:2008 South African National Standards for Spirometry
SARS South African Revenue Service
SASDc South African Supplier Development Council
SEAON South African Environmental Observation Network
SETA South Africa’s Skills Education and Training Authority
SGS is a leading inspection, verification, testing and certification company, headquartered in Switzerland
ShREQ Safety, Health, Radiation, Environment and Quality
SmmE Small, Medium and Micro Enterprise
SO2 Sulphur Dioxide
SPv Special purpose vehicles
SQm A producer of specialty fertilisers and inorganic industrial chemicals, headquartered in Chile
SRk consulting A water quality management consultancy
Tbc To be confirmed
AbbREvIATION mEANING
TFR Transnet Freight Rail
TIFR Total injury frequency rate
uASA United Association of South Africa
uIF Unemployment Insurance Fund
uNImEShAwu United Chemical Industries, Mining, Electrical, State, Health, and Allied Workers Union
uS United States
uSD or uS$ United Stated Dollar
ZAR South African Rand
TERm mEANING
black As defined in the dti Codes of Good Practice and amended in terms of the High Court ruling at June 2008
carry trade A trade where you borrow and pay interest in order to buy something else that has higher interest
current ratio Current assets to current liabilities ratio
Debt to equity ratio Interest-bearing debt to equity ratio
Free cash flows Net cash from operating activities less net cash in investing activities
Governing board The committee of directors that governs the affairs of Foskor
middle management Functional managers
Operating income Operating income expressed as ato revenue percentage of revenue
Pre-tax margin Profit before tax expressed as a percentage of revenue
Professional Technical experts and specialists
Return on net assets Profit after tax expressed as a percentage of net assets
Return on equity Operating profit expressed as a percentage of shareholder equity and reserves
Senior management Group and divisional managers
Semi-skilled Technical and mechanical operators,employees drivers (heavy motor vehicles) and technical
assistants
Skilled employees Artisans, technicians and production supervisors
Top management Executives and general managers
unskilled labour Elementary occupations

FOSKOR INTEGRATED REPORT 2016
89

INT
EG
RA
TE
D R
EP
OR
T 2016
www.foskor.co.za