
Integrated Pumped Hydro Reverse Osmosis systems · Original article Integrated Pumped Hydro Reverse...
20
Original article Integrated Pumped Hydro Reverse Osmosis systems Alexander H. Slocum a , Maha N. Haji a , A Zachary Trimble b,⇑ , Marco Ferrara c , Sasan J. Ghaemsaidi a a Department of Mechanical Engineering, Massachusetts Institute of Technology, United States b Department of Mechanical Engineering, University of Hawaii, United States c 24M Technologies, Inc., United States article info Article history: Received 25 September 2015 Revised 1 August 2016 Accepted 6 September 2016 Keywords: Renewable energy storage Desalination Pumped hydro Drought abstract Ideal head height for pumped hydro energy storage/generation systems and reverse osmosis desalination plants coincide (500–700 m). Many drought stricken coastal regions have nearby mountains of sufficient elevation to support upper reservoirs at this ideal head height. A good symbiotic match might thus be realized by co-locating a pumped hydro plant with a reverse osmosis desalination plant, which we call an Integrated Pumped Hydro Reverse Osmosis (IPHRO) system. Combining systems reduces capital investment, such as pump costs, and solves the desalination brine disposal challenge since 10–20 times more water is required to generate one person’s power needs than to generate their fresh water needs, so brine outflow can be diluted by the turbine output water reducing costs of diffusing outflow pipes. This paper describes an algorithm that weights distance from the ocean and mountain height to explore where around the world such IPHRO systems might be located. Design equations are presented to pre- liminarily explore the size and cost of an IPHRO system and enable first order site feasibility assessment. An example is given for providing power and water for one million people with an IPRHO system in southern California. Analysis and consideration of other sites is included in a supplementary document. Ó 2016 Elsevier Ltd. All rights reserved. 1. Introduction Many coastal regions, such as those in California, have severe drought conditions [1]. Reverse osmosis (RO) desalination plants can be built to generate fresh water, but require electricity from the grid that if generated by fossil fuels may exacerbate climate change and worsen droughts [2]. Meanwhile, drought in the Mid- dle East creates humanitarian crises and is politically destabilizing with dire consequences [3]. Governments in the region are begin- ning to focus on managing their abundant energy supplies, with an eye towards solar and wind energy, meanwhile they also need to produce fresh water. Rather than consider energy and water systems separately, cost savings might be obtained by combining systems. For example, combining pumped hydro energy storage (PH) with RO desalina- tion. Furthermore, additional cost savings and revenues can be realized by combining other harvest activities such as offshore wind turbines and aquaculture [4], or energy storage [5], or extracting uranium from seawater [6,7]. Water management, including desalination, and renewable energy strategies might be best considered together; however large scale use of renewables requires utility-scale electricity stor- age as a key element [8,9]. Currently pumped storage hydro accounts for 95% of global grid storage capacity [10], but may incur significant evaporative water losses depending on local tempera- tures and humidity. Most pumped storage hydro utilizes large lakes, and if a small dedicated deep lake was used that was almost completely cycled every day, evaporation could be minimized with the use of floating cover elements [11–13] which are commercially available as hexagonal elements made from recycled plastic (e.g., http://www.awtti.com/hexprotect_cover.php). For islands, or regions without a strong grid, RO systems can be economically operated by an intermittent renewable energy sup- ply [14,15]. Large scale energy storage to enable continuous oper- ation would be economically more efficient in terms of capital recovery and reduced membrane costs. This was demonstrated with a system that utilizes wind power combined with flywheels and batteries that enabled an RO system to run continuously in the Canary Islands [16]. Desalination, however, also creates brine. Brine disposal into the ocean is common in many parts of the world with the use of long (and costly) diffusing outflow pipes, but may be a contentious issue in some areas such as Hawaii and the Gulf of Aqab. An alter- http://dx.doi.org/10.1016/j.seta.2016.09.003 2213-1388/Ó 2016 Elsevier Ltd. All rights reserved. ⇑ Corresponding author. E-mail addresses: [email protected] (A.H. Slocum), [email protected] (M.N. Haji), [email protected] (A Zachary Trimble), [email protected] (M. Ferrara), [email protected] (S.J. Ghaemsaidi). Sustainable Energy Technologies and Assessments 18 (2016) 80–99 Contents lists available at ScienceDirect Sustainable Energy Technologies and Assessments journal homepage: www.elsevier.com/locate/seta
Transcript of Integrated Pumped Hydro Reverse Osmosis systems · Original article Integrated Pumped Hydro Reverse...
Sustainable Energy Technologies and Assessments 18 (2016) 80–99
Contents lists available at ScienceDirect
Sustainable Energy Technologies and Assessments
journal homepage: www.elsevier .com/locate /seta
Original article
Integrated Pumped Hydro Reverse Osmosis systems
http://dx.doi.org/10.1016/j.seta.2016.09.0032213-1388/� 2016 Elsevier Ltd. All rights reserved.
⇑ Corresponding author.E-mail addresses: [email protected] (A.H. Slocum), [email protected] (M.N. Haji),
[email protected] (A Zachary Trimble), [email protected] (M. Ferrara),[email protected] (S.J. Ghaemsaidi).
Alexander H. Slocum a, Maha N. Haji a, A Zachary Trimble b,⇑, Marco Ferrara c, Sasan J. Ghaemsaidi a
aDepartment of Mechanical Engineering, Massachusetts Institute of Technology, United StatesbDepartment of Mechanical Engineering, University of Hawaii, United Statesc24M Technologies, Inc., United States
a r t i c l e i n f o a b s t r a c t
Article history:Received 25 September 2015Revised 1 August 2016Accepted 6 September 2016
Keywords:Renewable energy storageDesalinationPumped hydroDrought
Ideal head height for pumped hydro energy storage/generation systems and reverse osmosis desalinationplants coincide (500–700 m). Many drought stricken coastal regions have nearby mountains of sufficientelevation to support upper reservoirs at this ideal head height. A good symbiotic match might thus berealized by co-locating a pumped hydro plant with a reverse osmosis desalination plant, which we callan Integrated Pumped Hydro Reverse Osmosis (IPHRO) system. Combining systems reduces capitalinvestment, such as pump costs, and solves the desalination brine disposal challenge since 10–20 timesmore water is required to generate one person’s power needs than to generate their fresh water needs, sobrine outflow can be diluted by the turbine output water reducing costs of diffusing outflow pipes. Thispaper describes an algorithm that weights distance from the ocean and mountain height to explorewhere around the world such IPHRO systems might be located. Design equations are presented to pre-liminarily explore the size and cost of an IPHRO system and enable first order site feasibility assessment.An example is given for providing power and water for one million people with an IPRHO system insouthern California. Analysis and consideration of other sites is included in a supplementary document.
� 2016 Elsevier Ltd. All rights reserved.
1. Introduction
Many coastal regions, such as those in California, have severedrought conditions [1]. Reverse osmosis (RO) desalination plantscan be built to generate fresh water, but require electricity fromthe grid that if generated by fossil fuels may exacerbate climatechange and worsen droughts [2]. Meanwhile, drought in the Mid-dle East creates humanitarian crises and is politically destabilizingwith dire consequences [3]. Governments in the region are begin-ning to focus on managing their abundant energy supplies, with aneye towards solar and wind energy, meanwhile they also need toproduce fresh water.
Rather than consider energy and water systems separately, costsavings might be obtained by combining systems. For example,combining pumped hydro energy storage (PH) with RO desalina-tion. Furthermore, additional cost savings and revenues can berealized by combining other harvest activities such as offshorewind turbines and aquaculture [4], or energy storage [5], orextracting uranium from seawater [6,7].
Water management, including desalination, and renewableenergy strategies might be best considered together; howeverlarge scale use of renewables requires utility-scale electricity stor-age as a key element [8,9]. Currently pumped storage hydroaccounts for 95% of global grid storage capacity [10], but may incursignificant evaporative water losses depending on local tempera-tures and humidity. Most pumped storage hydro utilizes largelakes, and if a small dedicated deep lake was used that was almostcompletely cycled every day, evaporation could be minimized withthe use of floating cover elements [11–13] which are commerciallyavailable as hexagonal elements made from recycled plastic (e.g.,http://www.awtti.com/hexprotect_cover.php).
For islands, or regions without a strong grid, RO systems can beeconomically operated by an intermittent renewable energy sup-ply [14,15]. Large scale energy storage to enable continuous oper-ation would be economically more efficient in terms of capitalrecovery and reduced membrane costs. This was demonstratedwith a system that utilizes wind power combined with flywheelsand batteries that enabled an RO system to run continuously inthe Canary Islands [16].
Desalination, however, also creates brine. Brine disposal intothe ocean is common in many parts of the world with the use oflong (and costly) diffusing outflow pipes, but may be a contentiousissue in some areas such as Hawaii and the Gulf of Aqab. An alter-
A.H. Slocum et al. / Sustainable Energy Technologies and Assessments 18 (2016) 80–99 81
nate strategy would be disposal of the brine by evaporation, withrecovery of salt and minerals as a byproduct [17,18]. In the currentproposal we show that if excess renewable power is stored in ahigh reservoir, the water needed for power generations is >10Xmore than for freshwater generation, and thus the brine can becombined with the water for power generation so it is automati-cally diluted, thus saving brine outflow pipe disposal or evapora-tive pond costs.
Hydropower plants have been in operation for centuries, andpumped hydropower plants have been in operation for decadeswhere an upper reservoir works in conjunction with a lower reser-voir to store energy or produce power using a pump/turbine. Manypumped storage hydro facilities have been designed to receivepower from nuclear energy systems operating at night so the reac-tor can run 24/7 at full power thus during peak demand the systemessentially provides twice the power that the reactor alone can.Hydropower plants can last for tens of thousands of cycles (essen-tially decades, and even then can be cost effectively rebuilt). Addi-tionally an important feature of pumped hydro that is often takenfor granted is its ability to stabilize a grid and/or to restart a largegrid that has suffered a blackout1. Furthermore, like any otherenergy storage system, pumped hydro plants also enable intermit-tent renewable energy machines, such as wind turbines and PV solarpower panels, to function as baseload power systems.
While there are many freshwater pumped hydro plants in oper-ation, it is often difficult to cite a new plant because of geography,population pressure, and scarcity of fresh water in many locations.The oceans, however, represent an essentially infinite lower reser-voir in coastal locations where there are nearby mountains. Onlyone pumped seawater hydro plant currently exists, a 30 MW unitin Japan, which is supplied with excess power from the grid[19,20], and it has been successfully operating for many years.An earlier seawater pumped hydro storage was to be built in Egypt[21]. Currently, a 300 MW pumped seawater hydro system pow-ered entirely by solar PV is under tender in Chile, but no significantRO is currently planned [22]. Several alternatives were also pro-posed in the 1980s which also were to include RO plants coupledto a renewable energy system [23]. The Red Sea Dead Sea projecthas been around for decades and recently a detailed study showedit was economical to closely couple the desalination system withthe pumped storage hydroelectric system where the brine outputfrom the RO system was pumped uphill to a holding lake whereit was released through a power turbine when needed with out-flow to the dead sea [24]. In the 1990s a combined pumped hydroand RO system was proposed for the Aqaba Jordan region [25,26]but perhaps not enough detail was available to convince the regionat the time that it should develop such a system.
2. Symbiotic approach: co-location of Pumped Hydro andReverse Osmosis Systems
Pumped storage hydro facilities are typically operated by powercompanies, distinct from water companies. Given the lack of fresh-water in arid coastal locations, it is logical to consider using theocean as a lower reservoir and pumping seawater to an upperreservoir to store energy. The electricity produced could then beused by a conventional RO plant. There have been studies on thetotal cost of desalination, capital and operating costs [27,28] butdetailed breakdown of system element costs are difficult to comeby. Total capital costs for brackish water are reported on the orderof $2/gallon/day to $4/gallon/day [29] to $1.5/gallon/day to $3/gal-lon/day [30,31]. The process equipment costs are about 49% of this
1 http://www.dena.de/en/press-releases/pressemitteilungen/netzstabilitaet-und-versorgungssicherheit-durch-pumpspeicherwerke.html.
total [32]. Consensus appears to be that in order to accurately pre-dict costs for a project, a site specific design study must be under-taken [33,34].
As a modern example of an efficient seawater RO plant, theAshdod desalination plant in Israel had a total CAPEX of $400 Mdol-lars, where the costs of the membranes and associated equipmentwas about 10% and the pumps was about 10%. The civil engineeringand piping costs were about 20% of the total due to the 3 km dis-tance from the sea. The plant operates with sea water intake =220,000,000 m3/year; desalinated water output = 100,000,000 m3/year; brine discharge = 120,000,000 m3/year; and electricalpower required for the process = 3.5 kWh/m3 of desalinated water(including pumping and transport to 3 km from the sea) [35–38].
Hence, it will be assumed here that the potential for reducingcosts by eliminating the high pressure pumps for the RO system,and the long brine diffusing outflow pipe, should result in signifi-cant costs savings, but in order to quantify these savings, a detaileddesign will need to be conducted for a specific site. However, theprimary challenge is the selection of a site where the large seawa-ter flow in/out of the system can be placed in addition to the upperreservoir. The RO desalination plant will be relatively modest in itssiting needs, but at the very least could share the water inflowinfrastructure. Once a site is selected, a program such as WTCOSTcould be used to perform detailed cost analysis with a granularitydown to the component level to estimate capital and operation andmaintenance costs for desalination plants [39]. The detailed cost-ing, down to the pump selection level, could then be able to deter-mine weather the RO plant should be operated stand-alone or haveits pressurized pre-treated saline water supplied from the upperreservoir, with the brine discharged into the water inflow to thepump/turbine.
Fig. 1 shows a symbiotic system where a pumped hydroenergy storage system and RO desalination plant share elementsto potentially increase efficiency and reduce capital costs. Thisstrategy implies identifying regions having renewable energysources (sun, wind) and geography (ocean access and >500 mhigh mountains) in close proximity to locations with needs forpower and water. If the water is needed in regions near the levelof the reservoir, the RO plant might be operated with electricity,but the low pressure brine output could still be discharged intothe lake to be highly diluted before exiting to the sea throughthe turbine when it is generating power. If the water is neededat near sea level, then the RO plant would not need high pres-sure pumps, and pretreated water from the upper reservoir couldflow further downhill in pipes to directly supply the ROmembranes.
When a significant portion of a region’s power comes frominherently intermittent solar and wind power systems, energystorage becomes important for a stable profitable grid. Optionsinclude batteries, flywheels and pumped hydro systems. These sys-tems, however, actually add little to the requirement for generat-ing power, they only smooth out the intermittencies ofrenewables, and themselves consume power to operate. Theybecome part of the parasitic losses a grid must endure. Meanwhile,as more fresh water is needed to counter drought conditions, moreelectric power is required. A desalination plant can act as an absor-ber of excess power, but RO plants, for example, function bestwhen they are run constantly; hence there must also be a way tostore excess power.
Pumped hydro systems can be used to store vast amounts ofexcess energy sometimes generated by renewable power systems,e.g. wind turbines operating at night; and it turns out that a highlyefficient operating point for such systems occurs at a hydraulichead of about 500–700 m, precisely what is needed for an RO plant.A seaside PH system in Japan, created as an energy storage systemin a country with scarce land that is in need of PH systems to work
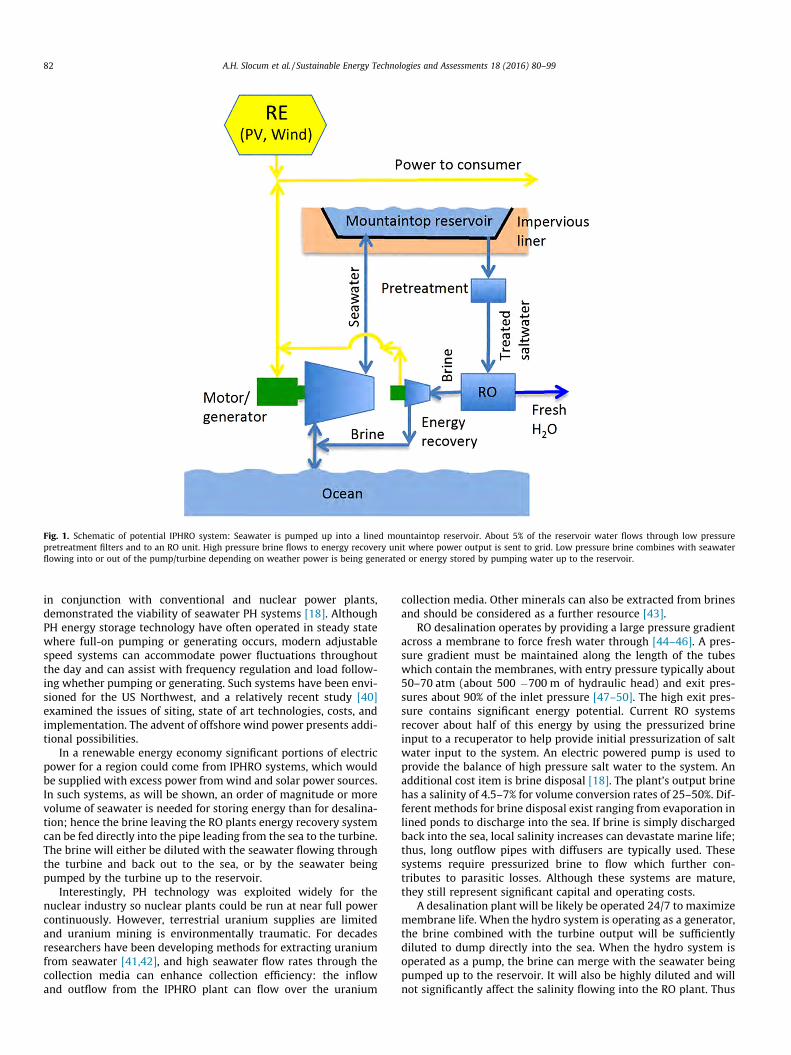
Fig. 1. Schematic of potential IPHRO system: Seawater is pumped up into a lined mountaintop reservoir. About 5% of the reservoir water flows through low pressurepretreatment filters and to an RO unit. High pressure brine flows to energy recovery unit where power output is sent to grid. Low pressure brine combines with seawaterflowing into or out of the pump/turbine depending on weather power is being generated or energy stored by pumping water up to the reservoir.
82 A.H. Slocum et al. / Sustainable Energy Technologies and Assessments 18 (2016) 80–99
in conjunction with conventional and nuclear power plants,demonstrated the viability of seawater PH systems [18]. AlthoughPH energy storage technology have often operated in steady statewhere full-on pumping or generating occurs, modern adjustablespeed systems can accommodate power fluctuations throughoutthe day and can assist with frequency regulation and load follow-ing whether pumping or generating. Such systems have been envi-sioned for the US Northwest, and a relatively recent study [40]examined the issues of siting, state of art technologies, costs, andimplementation. The advent of offshore wind power presents addi-tional possibilities.
In a renewable energy economy significant portions of electricpower for a region could come from IPHRO systems, which wouldbe supplied with excess power from wind and solar power sources.In such systems, as will be shown, an order of magnitude or morevolume of seawater is needed for storing energy than for desalina-tion; hence the brine leaving the RO plants energy recovery systemcan be fed directly into the pipe leading from the sea to the turbine.The brine will either be diluted with the seawater flowing throughthe turbine and back out to the sea, or by the seawater beingpumped by the turbine up to the reservoir.
Interestingly, PH technology was exploited widely for thenuclear industry so nuclear plants could be run at near full powercontinuously. However, terrestrial uranium supplies are limitedand uranium mining is environmentally traumatic. For decadesresearchers have been developing methods for extracting uraniumfrom seawater [41,42], and high seawater flow rates through thecollection media can enhance collection efficiency: the inflowand outflow from the IPHRO plant can flow over the uranium
collection media. Other minerals can also be extracted from brinesand should be considered as a further resource [43].
RO desalination operates by providing a large pressure gradientacross a membrane to force fresh water through [44–46]. A pres-sure gradient must be maintained along the length of the tubeswhich contain the membranes, with entry pressure typically about50–70 atm (about 500 �700 m of hydraulic head) and exit pres-sures about 90% of the inlet pressure [47–50]. The high exit pres-sure contains significant energy potential. Current RO systemsrecover about half of this energy by using the pressurized brineinput to a recuperator to help provide initial pressurization of saltwater input to the system. An electric powered pump is used toprovide the balance of high pressure salt water to the system. Anadditional cost item is brine disposal [18]. The plant’s output brinehas a salinity of 4.5–7% for volume conversion rates of 25–50%. Dif-ferent methods for brine disposal exist ranging from evaporation inlined ponds to discharge into the sea. If brine is simply dischargedback into the sea, local salinity increases can devastate marine life;thus, long outflow pipes with diffusers are typically used. Thesesystems require pressurized brine to flow which further con-tributes to parasitic losses. Although these systems are mature,they still represent significant capital and operating costs.
A desalination plant will be likely be operated 24/7 to maximizemembrane life. When the hydro system is operating as a generator,the brine combined with the turbine output will be sufficientlydiluted to dump directly into the sea. When the hydro system isoperated as a pump, the brine can merge with the seawater beingpumped up to the reservoir. It will also be highly diluted and willnot significantly affect the salinity flowing into the RO plant. Thus
A.H. Slocum et al. / Sustainable Energy Technologies and Assessments 18 (2016) 80–99 83
the brine is discharged directly into the large pipe that connectsthe ocean to the turbine unit that operates as a pump/generator.This operation mode will necessitate a separate pipe leading fromthe reservoir first to the pretreatment station, which can be locatedtens of meters below the reservoir so no pump is required, andthen to supply very steady pressure saltwater to the RO plant asshown in Fig. 1.
In summary, comparing an IPHRO system to separate pumpedstorage hydro energy storage and conventional RO desalinationplants, the former can use one set of very large turbines to supplyall the high pressure flow at a constant feed pressure, and the brineproduced can be diluted with the high seawater flow required forenergy storage and power generation. In addition, civil works, landarea, and some buildings can be shared. Any region contemplatingenergy storage and RO desalination should thus examine the designof an IPHRO system in addition to separate systems to determinethe best option for the site-specific conditions. This paper presentsa first order analysis procedure for this comparison and identifiessome regions around the world where it might be applicable.
2.1. System example
Here a generic scenario is considered for symbiotically provid-ing power and water for one million people accustomed to a USlifestyle (2 kW average electric power and 500 L/day water con-sumption). Note for most parts of the world, half this value wouldbe excellent. Fig. 2 shows the spreadsheet output based on theabove analysis. The spreadsheet, IPHROS.xls, and details of thecalculation methodology are provided in the Supplementary Mate-rials A. Values in the spreadsheet are easily adjusted to representlocal consumption allowing users to explore scenarios for theirlocal needs and situations.
The first item to note is that the energy needed to produce freshwater appears to be significantly lower than is typically cited in ROliterature. The theoretical minimum energy for desalinating 35%salinity seawater to yield 50% freshwater is 1.06 kWh/m3. CurrentSWRO systems are cited as having gross power consumption ofbetween 3 and 4 kWh/m3 of freshwater produced [44] of whichabout 1 kWh/m3 is needed for peripheral support items (intake, pre-treatment, post treatment, andbrine discharge) [46], for a net desali-nation energy of about 2–3 kWh/m3. The IPHROS system inherentlyincludes these peripheral items which is how it can achieve a lowergross energy requirement, which is predicted to be 2.2 kWh/m3 for35% salinitywater, 45% conversion to freshwaterwith 50 atmof sea-water pressure supplying the membranes. If the required pressurewere 60 atm to yield 50% conversion, the gross desalination energywould be 2.7 kWh/m3. In general, larger machines cost less per unitfunction accomplished, and having fewer pumps will also meanlower maintenance costs. The pumped hydro system has a highround trip efficiency>80% [51]whichalsocontributes to the savings.Further advantage is obtained by discharging the brine into the largepipe that connects the ocean to the turbine unit as discussed above.
Fig. 3 shows the renewable system parameters associated withproviding power (2 kW/person) and water (500 L/day/person) toone million people assumed in Fig. 2. This is for a California life-style, and for many regions around the world half the power wouldbe more than welcome. It should be noted that for a 30 m waterdepth change in the storage reservoir located 500 m above sealevel, it takes about 1.3 km2 to serve the needs of one million peo-ple (20 m water depth change at 500 m requires about 2 km2 - usethe spreadsheet provided in Supplementary Materials A to playyour own ‘‘what if” scenarios).
The land areas required for renewable energy harvestingdevices are reasonable, especially with good urban planning. Solarpanels can be located on rooftops, especially on large flat industrialrooftops and in some cases incorporated into the reservoir as float-
ing panels. Large wind turbines are not suitable for being placed incities, but can readily be placed among central pivot irrigatedfields, or offshore. Fig. 4 shows the economic factors associatedwith the IPHRO system, excluding real estate costs which shouldbe minimal if the renewable energy harvesting devices are placedon rooftops and amidst farmland; and the IPHRO lake and turbinesystem is assumed to be placed on public lands. In general, thecosts assumed for solar, wind, and PH are conservative (high)and should be expected to decrease, especially with the greatincrease in volumes that could be brought on by widespread adop-tion of IPHRO systems. The cost of the salt water RO desalinationsystem will be less than for a conventional system [27,46] becausethe IPHRO system will not require pumps and brine outfall subsys-tems; however, the capital cost is still very small compared to therenewable energy systems, and thus for the analysis here conven-tional RO system costs are assumed. The real savings will be inlower amount of energy required to produce fresh water.
Reasonably conservative assumptions were made for the eco-nomic analysis shown in the figure and show a good rate of returnover the 20 year period for the project loan of 2.4% is reasonable forthe scale and importance of the project and potential to providepower and water using renewable energy sources. If the civil engi-neering challenges were more significant so the cost of the hydro-power component were greater, at $3/installed Watt, then theannual rate of return would still be an accepTable 1.2%. The spread-sheet is provided in the supplemental materials so other scenariosand sensitivities can be investigated. Other potential income fromsymbiotic activities such as aquaculture or uranium harvestingfrom the seawater flow would likely be a fraction of revenue fromwater and electricity, and thus are best left to secondary effort oncethe primary system becomes operational.
3. Geographic potential assessment
In order to investigate the applicability of IPHROS in variousregions, a geographic information system (GIS) based topographicanalysis was performed using shuttle radar topography mission(SRTM) digital elevation models (DEM) from NASA [52–55]. First,3-arc second (�90 m) was used to determine the locations ofregions that had elevations 500 m. Next, the elevation of each loca-tion was divided by the distance to the seacoast, resulting in whatis referred to here as the ‘‘A-Index”. The higher the A-Index, thegreater the potential suitability for IPHROS.
The A-Index is a currently a qualitative measure intended toidentify geographical regions that can even be considered, thosewhich meet a minimum height requirement and within regionallyacceptable tunneling distance from shore, and colorize the regionso as to allow for rapid assessment of an area under scrutinization.It would be analogous to forming an A-list of options (the firstplace to go looking). The A-Index thus serves as an indicator for aregion to identify where the reservoir might be placed. The greaterthe value of the A-Index, the higher the reservoir, or the closer tothe shore a region might be, both factors that can increase thevalue of a project either by providing greater energy storage poten-tial or lower construction costs. It might be possible in the future tocreate a more quantitative index.
For the United States, more detailed analysis was conductedusing higher resolution 1-arc second (�30 m) SRTM DEM fromNASA. The potential energy per cycle (reservoir filled and thendrawn down) of areas with a high A-Index was determined usingthe formula
Epot ¼ grtqswghLdS; ð1Þ
where grt = IPHROS round-trip efficiency (based on typical valuesfound for pumped storage hydroelectric systems), qsw = seawater

Fig. 2. IPHRO System parameters for serving one million people (inputs in black and outputs in blue). (For interpretation of the references to colour in this figure legend, thereader is referred to the web version of this article.)
84 A.H. Slocum et al. / Sustainable Energy Technologies and Assessments 18 (2016) 80–99
density, g = gravity, hL = elevation above sea-level, d and S are thedepth and surface area respectively of the IPHROS reservoir. Forthe following analysis, grt is taken to be 80% and d is estimated tobe 30 m. If smaller surface areas are desired for the lake deeperdepths can be used. The results of the GIS-based analysis for varioussites across the globe are presented in this section, additional sitesare presented in Supplementary Materials A.
3.1. Southern California
Southern California is very dry with a very large population, andtakes water from the Owen’s valley, so if this water was no longerneeded, farming in the valley might flourish [56,57,1]. In southern
California, the mountains around Malibu and San Clemente havegreat promise for IPHRO systems as shown in Figs. 5 and 6.
Based on the resulting qualitative A-Index (good mountainheight within tunneling distance from shore) for areas around Mal-ibu and San Clemente, regions highlighted were selected for fur-ther analysis (Figs. 5 and 6). These regions have a total upperreservoir (lake) area potential of approximately 14.7 km2. Assum-ing these are all developed into IPHROS lakes in which 30 m ofwater is pumped up and down with each cycle, these regions couldprovide power and freshwater for about 28 million people. A reser-voir depth of 30 m is considered reasonable because it is a deptheasily reached by divers if any maintenance is needed, althougha smaller area or more people served could be realized with greater
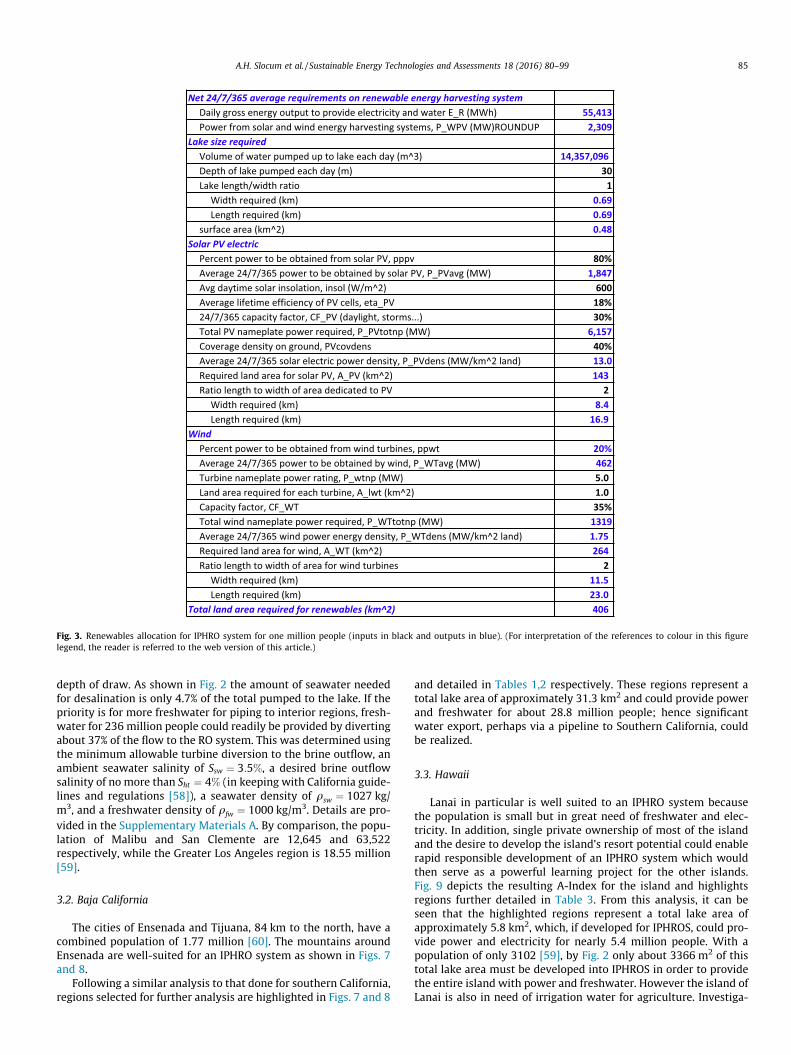
Fig. 3. Renewables allocation for IPHRO system for one million people (inputs in black and outputs in blue). (For interpretation of the references to colour in this figurelegend, the reader is referred to the web version of this article.)
A.H. Slocum et al. / Sustainable Energy Technologies and Assessments 18 (2016) 80–99 85
depth of draw. As shown in Fig. 2 the amount of seawater neededfor desalination is only 4.7% of the total pumped to the lake. If thepriority is for more freshwater for piping to interior regions, fresh-water for 236 million people could readily be provided by divertingabout 37% of the flow to the RO system. This was determined usingthe minimum allowable turbine diversion to the brine outflow, anambient seawater salinity of Ssw ¼ 3:5%, a desired brine outflowsalinity of no more than Sht ¼ 4% (in keeping with California guide-lines and regulations [58]), a seawater density of qsw ¼ 1027 kg/m3, and a freshwater density of qfw ¼ 1000 kg/m3. Details are pro-vided in the Supplementary Materials A. By comparison, the popu-lation of Malibu and San Clemente are 12,645 and 63,522respectively, while the Greater Los Angeles region is 18.55 million[59].
3.2. Baja California
The cities of Ensenada and Tijuana, 84 km to the north, have acombined population of 1.77 million [60]. The mountains aroundEnsenada are well-suited for an IPHRO system as shown in Figs. 7and 8.
Following a similar analysis to that done for southern California,regions selected for further analysis are highlighted in Figs. 7 and 8
and detailed in Tables 1,2 respectively. These regions represent atotal lake area of approximately 31.3 km2 and could provide powerand freshwater for about 28.8 million people; hence significantwater export, perhaps via a pipeline to Southern California, couldbe realized.
3.3. Hawaii
Lanai in particular is well suited to an IPHRO system becausethe population is small but in great need of freshwater and elec-tricity. In addition, single private ownership of most of the islandand the desire to develop the island’s resort potential could enablerapid responsible development of an IPHRO system which wouldthen serve as a powerful learning project for the other islands.Fig. 9 depicts the resulting A-Index for the island and highlightsregions further detailed in Table 3. From this analysis, it can beseen that the highlighted regions represent a total lake area ofapproximately 5.8 km2, which, if developed for IPHROS, could pro-vide power and electricity for nearly 5.4 million people. With apopulation of only 3102 [59], by Fig. 2 only about 3366 m2 of thistotal lake area must be developed into IPHROS in order to providethe entire island with power and freshwater. However the island ofLanai is also in need of irrigation water for agriculture. Investiga-
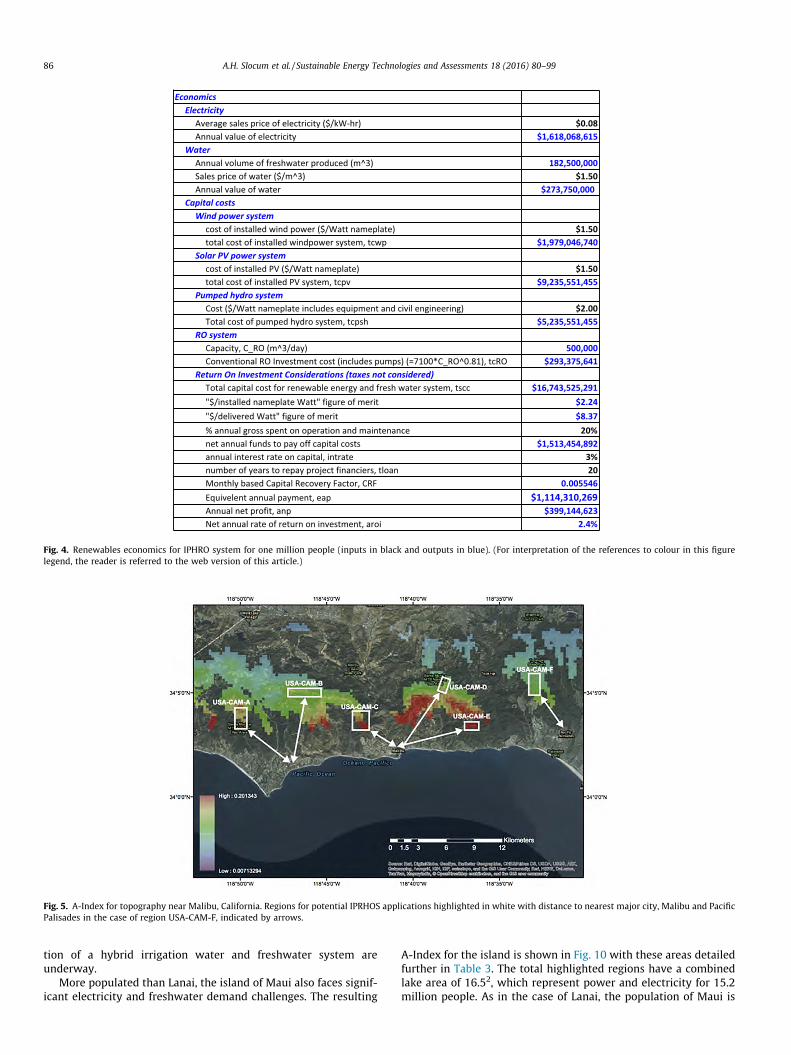
Fig. 4. Renewables economics for IPHRO system for one million people (inputs in black and outputs in blue). (For interpretation of the references to colour in this figurelegend, the reader is referred to the web version of this article.)
Fig. 5. A-Index for topography near Malibu, California. Regions for potential IPRHOS applications highlighted in white with distance to nearest major city, Malibu and PacificPalisades in the case of region USA-CAM-F, indicated by arrows.
86 A.H. Slocum et al. / Sustainable Energy Technologies and Assessments 18 (2016) 80–99
tion of a hybrid irrigation water and freshwater system areunderway.
More populated than Lanai, the island of Maui also faces signif-icant electricity and freshwater demand challenges. The resulting
A-Index for the island is shown in Fig. 10 with these areas detailedfurther in Table 3. The total highlighted regions have a combinedlake area of 16.52, which represent power and electricity for 15.2million people. As in the case of Lanai, the population of Maui is
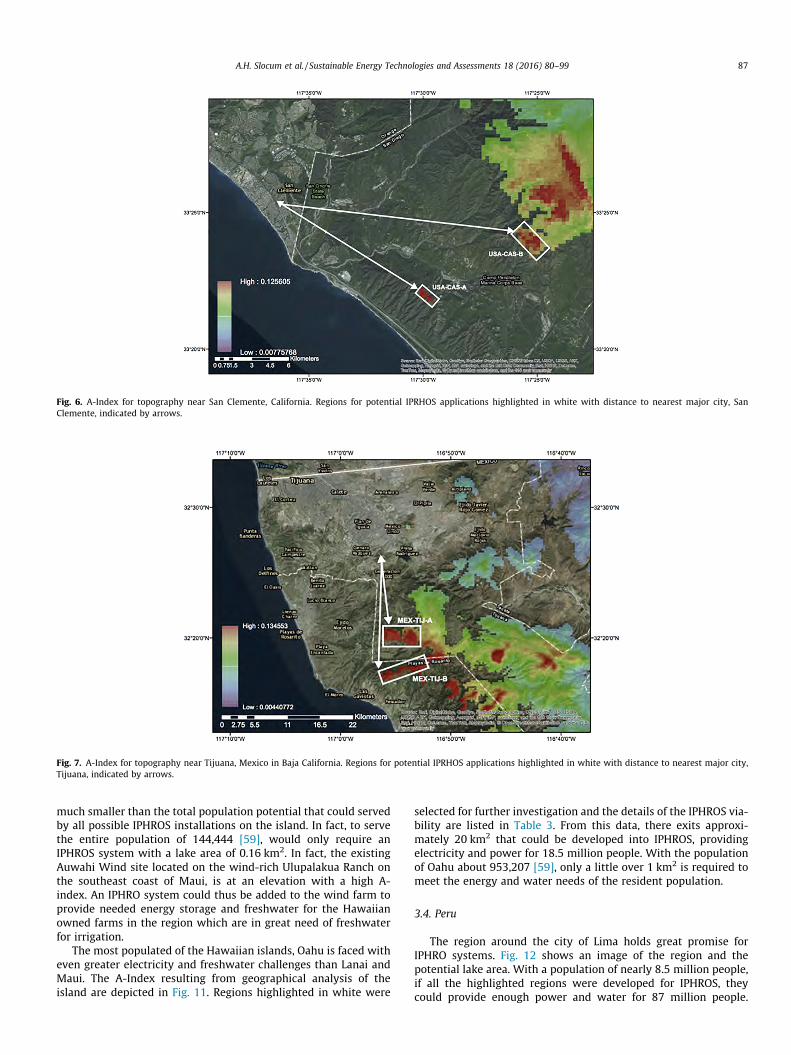
Fig. 6. A-Index for topography near San Clemente, California. Regions for potential IPRHOS applications highlighted in white with distance to nearest major city, SanClemente, indicated by arrows.
Fig. 7. A-Index for topography near Tijuana, Mexico in Baja California. Regions for potential IPRHOS applications highlighted in white with distance to nearest major city,Tijuana, indicated by arrows.
A.H. Slocum et al. / Sustainable Energy Technologies and Assessments 18 (2016) 80–99 87
much smaller than the total population potential that could servedby all possible IPHROS installations on the island. In fact, to servethe entire population of 144,444 [59], would only require anIPHROS system with a lake area of 0.16 km2. In fact, the existingAuwahi Wind site located on the wind-rich Ulupalakua Ranch onthe southeast coast of Maui, is at an elevation with a high A-index. An IPHRO system could thus be added to the wind farm toprovide needed energy storage and freshwater for the Hawaiianowned farms in the region which are in great need of freshwaterfor irrigation.
The most populated of the Hawaiian islands, Oahu is faced witheven greater electricity and freshwater challenges than Lanai andMaui. The A-Index resulting from geographical analysis of theisland are depicted in Fig. 11. Regions highlighted in white were
selected for further investigation and the details of the IPHROS via-bility are listed in Table 3. From this data, there exits approxi-mately 20 km2 that could be developed into IPHROS, providingelectricity and power for 18.5 million people. With the populationof Oahu about 953,207 [59], only a little over 1 km2 is required tomeet the energy and water needs of the resident population.
3.4. Peru
The region around the city of Lima holds great promise forIPHRO systems. Fig. 12 shows an image of the region and thepotential lake area. With a population of nearly 8.5 million people,if all the highlighted regions were developed for IPHROS, theycould provide enough power and water for 87 million people.
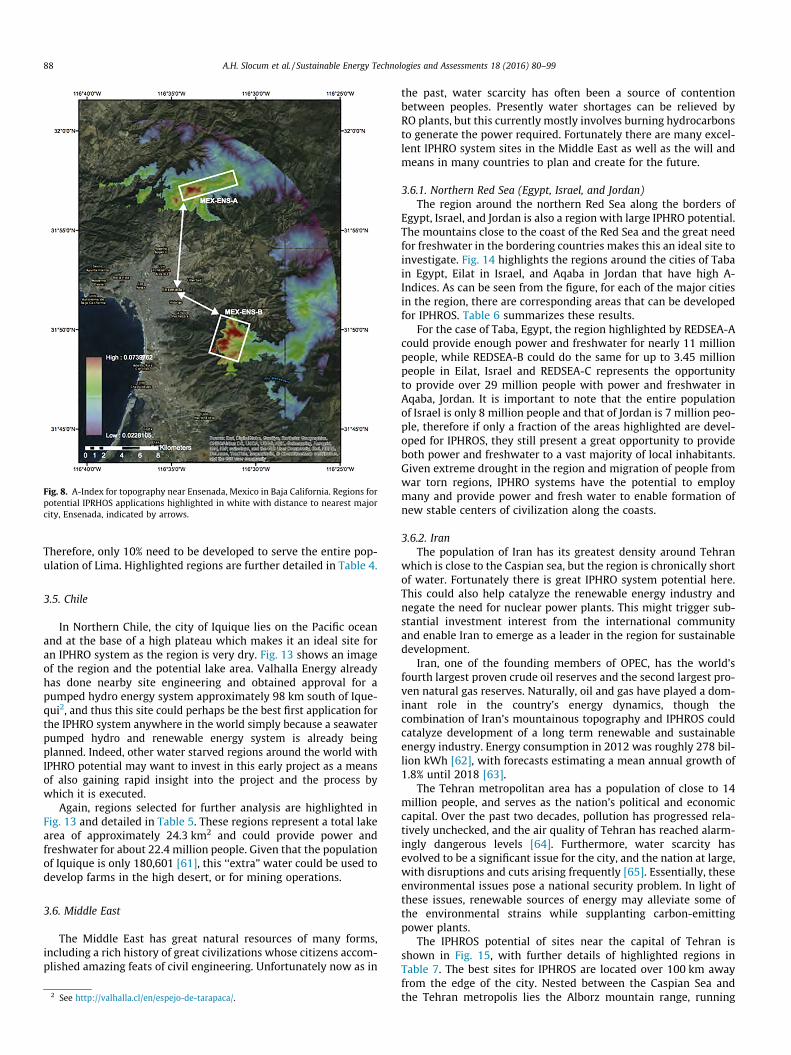
Fig. 8. A-Index for topography near Ensenada, Mexico in Baja California. Regions forpotential IPRHOS applications highlighted in white with distance to nearest majorcity, Ensenada, indicated by arrows.
88 A.H. Slocum et al. / Sustainable Energy Technologies and Assessments 18 (2016) 80–99
Therefore, only 10% need to be developed to serve the entire pop-ulation of Lima. Highlighted regions are further detailed in Table 4.
3.5. Chile
In Northern Chile, the city of Iquique lies on the Pacific oceanand at the base of a high plateau which makes it an ideal site foran IPHRO system as the region is very dry. Fig. 13 shows an imageof the region and the potential lake area. Valhalla Energy alreadyhas done nearby site engineering and obtained approval for apumped hydro energy system approximately 98 km south of Ique-qui2, and thus this site could perhaps be the best first application forthe IPHRO system anywhere in the world simply because a seawaterpumped hydro and renewable energy system is already beingplanned. Indeed, other water starved regions around the world withIPHRO potential may want to invest in this early project as a meansof also gaining rapid insight into the project and the process bywhich it is executed.
Again, regions selected for further analysis are highlighted inFig. 13 and detailed in Table 5. These regions represent a total lakearea of approximately 24.3 km2 and could provide power andfreshwater for about 22.4 million people. Given that the populationof Iquique is only 180,601 [61], this ‘‘extra” water could be used todevelop farms in the high desert, or for mining operations.
3.6. Middle East
The Middle East has great natural resources of many forms,including a rich history of great civilizations whose citizens accom-plished amazing feats of civil engineering. Unfortunately now as in
2 See http://valhalla.cl/en/espejo-de-tarapaca/.
the past, water scarcity has often been a source of contentionbetween peoples. Presently water shortages can be relieved byRO plants, but this currently mostly involves burning hydrocarbonsto generate the power required. Fortunately there are many excel-lent IPHRO system sites in the Middle East as well as the will andmeans in many countries to plan and create for the future.
3.6.1. Northern Red Sea (Egypt, Israel, and Jordan)The region around the northern Red Sea along the borders of
Egypt, Israel, and Jordan is also a region with large IPHRO potential.The mountains close to the coast of the Red Sea and the great needfor freshwater in the bordering countries makes this an ideal site toinvestigate. Fig. 14 highlights the regions around the cities of Tabain Egypt, Eilat in Israel, and Aqaba in Jordan that have high A-Indices. As can be seen from the figure, for each of the major citiesin the region, there are corresponding areas that can be developedfor IPHROS. Table 6 summarizes these results.
For the case of Taba, Egypt, the region highlighted by REDSEA-Acould provide enough power and freshwater for nearly 11 millionpeople, while REDSEA-B could do the same for up to 3.45 millionpeople in Eilat, Israel and REDSEA-C represents the opportunityto provide over 29 million people with power and freshwater inAqaba, Jordan. It is important to note that the entire populationof Israel is only 8 million people and that of Jordan is 7 million peo-ple, therefore if only a fraction of the areas highlighted are devel-oped for IPHROS, they still present a great opportunity to provideboth power and freshwater to a vast majority of local inhabitants.Given extreme drought in the region and migration of people fromwar torn regions, IPHRO systems have the potential to employmany and provide power and fresh water to enable formation ofnew stable centers of civilization along the coasts.
3.6.2. IranThe population of Iran has its greatest density around Tehran
which is close to the Caspian sea, but the region is chronically shortof water. Fortunately there is great IPHRO system potential here.This could also help catalyze the renewable energy industry andnegate the need for nuclear power plants. This might trigger sub-stantial investment interest from the international communityand enable Iran to emerge as a leader in the region for sustainabledevelopment.
Iran, one of the founding members of OPEC, has the world’sfourth largest proven crude oil reserves and the second largest pro-ven natural gas reserves. Naturally, oil and gas have played a dom-inant role in the country’s energy dynamics, though thecombination of Iran’s mountainous topography and IPHROS couldcatalyze development of a long term renewable and sustainableenergy industry. Energy consumption in 2012 was roughly 278 bil-lion kWh [62], with forecasts estimating a mean annual growth of1.8% until 2018 [63].
The Tehran metropolitan area has a population of close to 14million people, and serves as the nation’s political and economiccapital. Over the past two decades, pollution has progressed rela-tively unchecked, and the air quality of Tehran has reached alarm-ingly dangerous levels [64]. Furthermore, water scarcity hasevolved to be a significant issue for the city, and the nation at large,with disruptions and cuts arising frequently [65]. Essentially, theseenvironmental issues pose a national security problem. In light ofthese issues, renewable sources of energy may alleviate some ofthe environmental strains while supplanting carbon-emittingpower plants.
The IPHROS potential of sites near the capital of Tehran isshown in Fig. 15, with further details of highlighted regions inTable 7. The best sites for IPHROS are located over 100 km awayfrom the edge of the city. Nested between the Caspian Sea andthe Tehran metropolis lies the Alborz mountain range, running
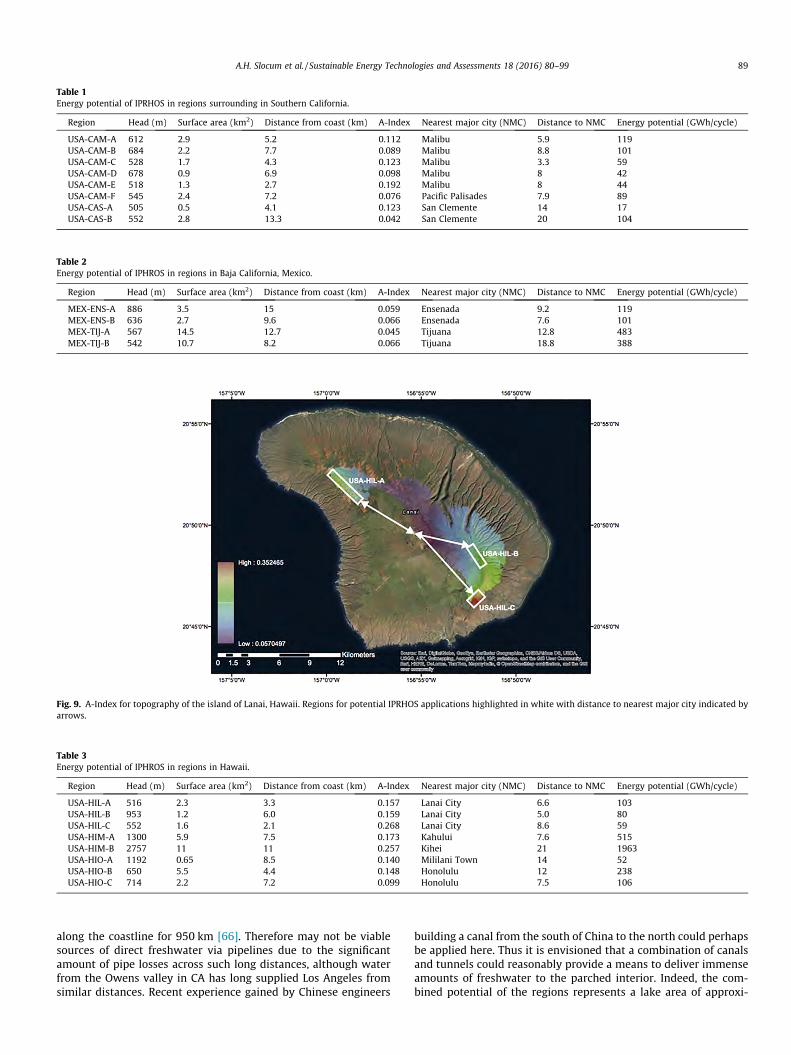
Fig. 9. A-Index for topography of the island of Lanai, Hawaii. Regions for potential IPRHOS applications highlighted in white with distance to nearest major city indicated byarrows.
Table 3Energy potential of IPHROS in regions in Hawaii.
Region Head (m) Surface area (km2) Distance from coast (km) A-Index Nearest major city (NMC) Distance to NMC Energy potential (GWh/cycle)
USA-HIL-A 516 2.3 3.3 0.157 Lanai City 6.6 103USA-HIL-B 953 1.2 6.0 0.159 Lanai City 5.0 80USA-HIL-C 552 1.6 2.1 0.268 Lanai City 8.6 59USA-HIM-A 1300 5.9 7.5 0.173 Kahului 7.6 515USA-HIM-B 2757 11 11 0.257 Kihei 21 1963USA-HIO-A 1192 0.65 8.5 0.140 Mililani Town 14 52USA-HIO-B 650 5.5 4.4 0.148 Honolulu 12 238USA-HIO-C 714 2.2 7.2 0.099 Honolulu 7.5 106
Table 2Energy potential of IPHROS in regions in Baja California, Mexico.
Region Head (m) Surface area (km2) Distance from coast (km) A-Index Nearest major city (NMC) Distance to NMC Energy potential (GWh/cycle)
MEX-ENS-A 886 3.5 15 0.059 Ensenada 9.2 119MEX-ENS-B 636 2.7 9.6 0.066 Ensenada 7.6 101MEX-TIJ-A 567 14.5 12.7 0.045 Tijuana 12.8 483MEX-TIJ-B 542 10.7 8.2 0.066 Tijuana 18.8 388
Table 1Energy potential of IPRHOS in regions surrounding in Southern California.
Region Head (m) Surface area (km2) Distance from coast (km) A-Index Nearest major city (NMC) Distance to NMC Energy potential (GWh/cycle)
USA-CAM-A 612 2.9 5.2 0.112 Malibu 5.9 119USA-CAM-B 684 2.2 7.7 0.089 Malibu 8.8 101USA-CAM-C 528 1.7 4.3 0.123 Malibu 3.3 59USA-CAM-D 678 0.9 6.9 0.098 Malibu 8 42USA-CAM-E 518 1.3 2.7 0.192 Malibu 8 44USA-CAM-F 545 2.4 7.2 0.076 Pacific Palisades 7.9 89USA-CAS-A 505 0.5 4.1 0.123 San Clemente 14 17USA-CAS-B 552 2.8 13.3 0.042 San Clemente 20 104
A.H. Slocum et al. / Sustainable Energy Technologies and Assessments 18 (2016) 80–99 89
along the coastline for 950 km [66]. Therefore may not be viablesources of direct freshwater via pipelines due to the significantamount of pipe losses across such long distances, although waterfrom the Owens valley in CA has long supplied Los Angeles fromsimilar distances. Recent experience gained by Chinese engineers
building a canal from the south of China to the north could perhapsbe applied here. Thus it is envisioned that a combination of canalsand tunnels could reasonably provide a means to deliver immenseamounts of freshwater to the parched interior. Indeed, the com-bined potential of the regions represents a lake area of approxi-
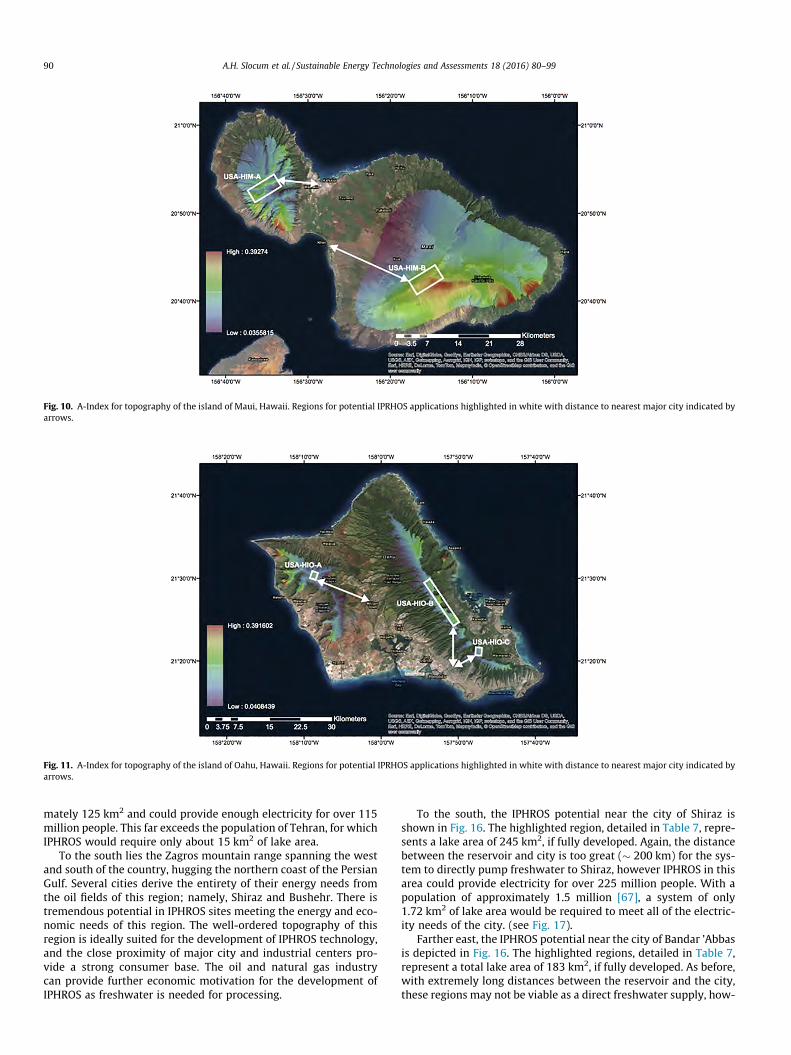
Fig. 10. A-Index for topography of the island of Maui, Hawaii. Regions for potential IPRHOS applications highlighted in white with distance to nearest major city indicated byarrows.
Fig. 11. A-Index for topography of the island of Oahu, Hawaii. Regions for potential IPRHOS applications highlighted in white with distance to nearest major city indicated byarrows.
90 A.H. Slocum et al. / Sustainable Energy Technologies and Assessments 18 (2016) 80–99
mately 125 km2 and could provide enough electricity for over 115million people. This far exceeds the population of Tehran, for whichIPHROS would require only about 15 km2 of lake area.
To the south lies the Zagros mountain range spanning the westand south of the country, hugging the northern coast of the PersianGulf. Several cities derive the entirety of their energy needs fromthe oil fields of this region; namely, Shiraz and Bushehr. There istremendous potential in IPHROS sites meeting the energy and eco-nomic needs of this region. The well-ordered topography of thisregion is ideally suited for the development of IPHROS technology,and the close proximity of major city and industrial centers pro-vide a strong consumer base. The oil and natural gas industrycan provide further economic motivation for the development ofIPHROS as freshwater is needed for processing.
To the south, the IPHROS potential near the city of Shiraz isshown in Fig. 16. The highlighted region, detailed in Table 7, repre-sents a lake area of 245 km2, if fully developed. Again, the distancebetween the reservoir and city is too great (� 200 km) for the sys-tem to directly pump freshwater to Shiraz, however IPHROS in thisarea could provide electricity for over 225 million people. With apopulation of approximately 1.5 million [67], a system of only1.72 km2 of lake area would be required to meet all of the electric-ity needs of the city. (see Fig. 17).
Farther east, the IPHROS potential near the city of Bandar ’Abbasis depicted in Fig. 16. The highlighted regions, detailed in Table 7,represent a total lake area of 183 km2, if fully developed. As before,with extremely long distances between the reservoir and the city,these regions may not be viable as a direct freshwater supply, how-
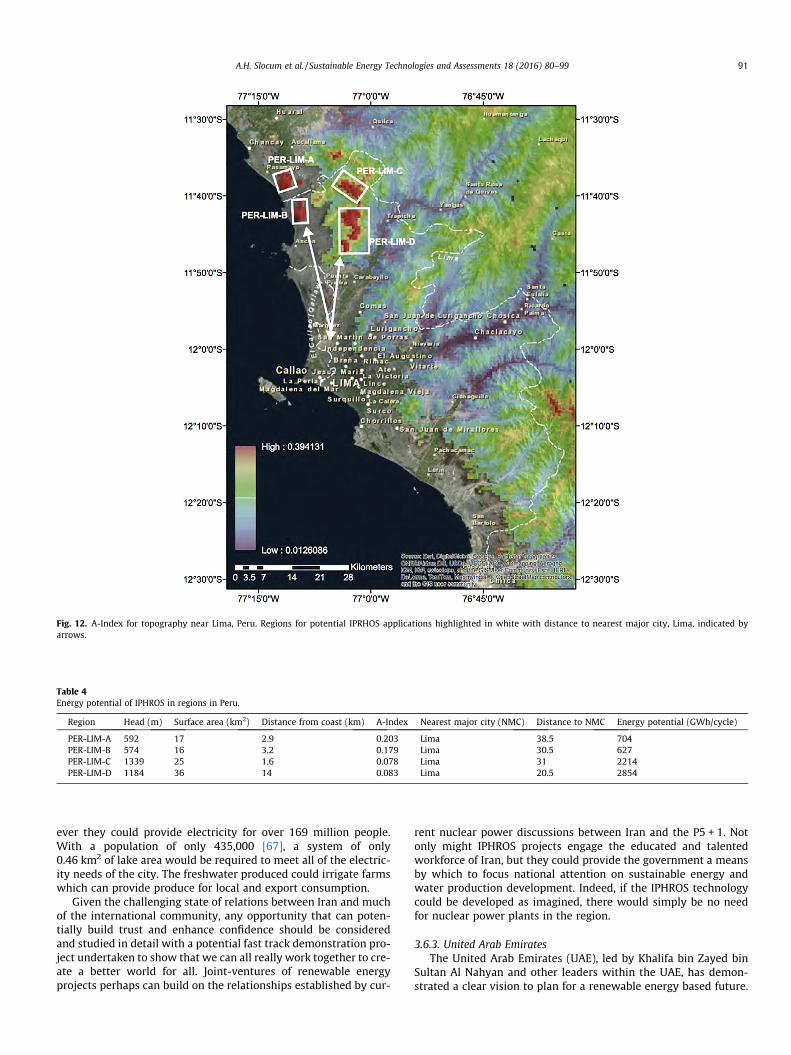
Fig. 12. A-Index for topography near Lima, Peru. Regions for potential IPRHOS applications highlighted in white with distance to nearest major city, Lima, indicated byarrows.
Table 4Energy potential of IPHROS in regions in Peru.
Region Head (m) Surface area (km2) Distance from coast (km) A-Index Nearest major city (NMC) Distance to NMC Energy potential (GWh/cycle)
PER-LIM-A 592 17 2.9 0.203 Lima 38.5 704PER-LIM-B 574 16 3.2 0.179 Lima 30.5 627PER-LIM-C 1339 25 1.6 0.078 Lima 31 2214PER-LIM-D 1184 36 14 0.083 Lima 20.5 2854
A.H. Slocum et al. / Sustainable Energy Technologies and Assessments 18 (2016) 80–99 91
ever they could provide electricity for over 169 million people.With a population of only 435,000 [67], a system of only0.46 km2 of lake area would be required to meet all of the electric-ity needs of the city. The freshwater produced could irrigate farmswhich can provide produce for local and export consumption.
Given the challenging state of relations between Iran and muchof the international community, any opportunity that can poten-tially build trust and enhance confidence should be consideredand studied in detail with a potential fast track demonstration pro-ject undertaken to show that we can all really work together to cre-ate a better world for all. Joint-ventures of renewable energyprojects perhaps can build on the relationships established by cur-
rent nuclear power discussions between Iran and the P5 + 1. Notonly might IPHROS projects engage the educated and talentedworkforce of Iran, but they could provide the government a meansby which to focus national attention on sustainable energy andwater production development. Indeed, if the IPHROS technologycould be developed as imagined, there would simply be no needfor nuclear power plants in the region.
3.6.3. United Arab EmiratesThe United Arab Emirates (UAE), led by Khalifa bin Zayed bin
Sultan Al Nahyan and other leaders within the UAE, has demon-strated a clear vision to plan for a renewable energy based future.
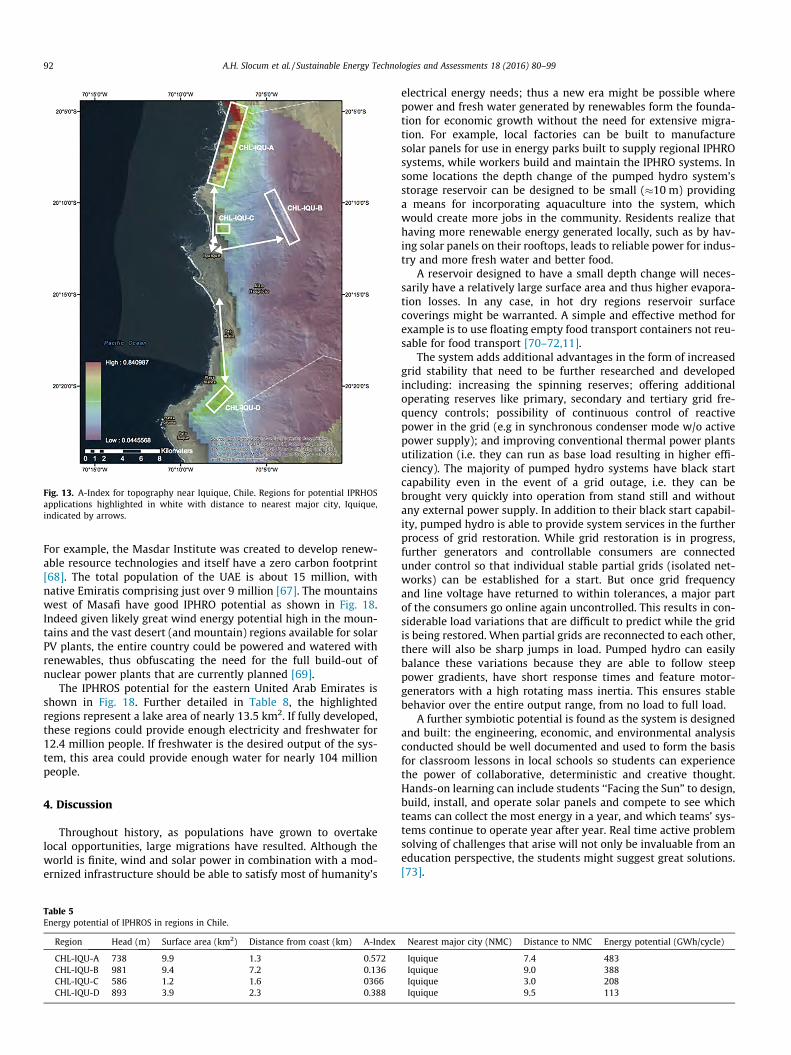
Fig. 13. A-Index for topography near Iquique, Chile. Regions for potential IPRHOSapplications highlighted in white with distance to nearest major city, Iquique,indicated by arrows.
92 A.H. Slocum et al. / Sustainable Energy Technologies and Assessments 18 (2016) 80–99
For example, the Masdar Institute was created to develop renew-able resource technologies and itself have a zero carbon footprint[68]. The total population of the UAE is about 15 million, withnative Emiratis comprising just over 9 million [67]. The mountainswest of Masafi have good IPHRO potential as shown in Fig. 18.Indeed given likely great wind energy potential high in the moun-tains and the vast desert (and mountain) regions available for solarPV plants, the entire country could be powered and watered withrenewables, thus obfuscating the need for the full build-out ofnuclear power plants that are currently planned [69].
The IPHROS potential for the eastern United Arab Emirates isshown in Fig. 18. Further detailed in Table 8, the highlightedregions represent a lake area of nearly 13.5 km2. If fully developed,these regions could provide enough electricity and freshwater for12.4 million people. If freshwater is the desired output of the sys-tem, this area could provide enough water for nearly 104 millionpeople.
4. Discussion
Throughout history, as populations have grown to overtakelocal opportunities, large migrations have resulted. Although theworld is finite, wind and solar power in combination with a mod-ernized infrastructure should be able to satisfy most of humanity’s
Table 5Energy potential of IPHROS in regions in Chile.
Region Head (m) Surface area (km2) Distance from coast (km) A-Index
CHL-IQU-A 738 9.9 1.3 0.572CHL-IQU-B 981 9.4 7.2 0.136CHL-IQU-C 586 1.2 1.6 0366CHL-IQU-D 893 3.9 2.3 0.388
electrical energy needs; thus a new era might be possible wherepower and fresh water generated by renewables form the founda-tion for economic growth without the need for extensive migra-tion. For example, local factories can be built to manufacturesolar panels for use in energy parks built to supply regional IPHROsystems, while workers build and maintain the IPHRO systems. Insome locations the depth change of the pumped hydro system’sstorage reservoir can be designed to be small (�10 m) providinga means for incorporating aquaculture into the system, whichwould create more jobs in the community. Residents realize thathaving more renewable energy generated locally, such as by hav-ing solar panels on their rooftops, leads to reliable power for indus-try and more fresh water and better food.
A reservoir designed to have a small depth change will neces-sarily have a relatively large surface area and thus higher evapora-tion losses. In any case, in hot dry regions reservoir surfacecoverings might be warranted. A simple and effective method forexample is to use floating empty food transport containers not reu-sable for food transport [70–72,11].
The system adds additional advantages in the form of increasedgrid stability that need to be further researched and developedincluding: increasing the spinning reserves; offering additionaloperating reserves like primary, secondary and tertiary grid fre-quency controls; possibility of continuous control of reactivepower in the grid (e.g in synchronous condenser mode w/o activepower supply); and improving conventional thermal power plantsutilization (i.e. they can run as base load resulting in higher effi-ciency). The majority of pumped hydro systems have black startcapability even in the event of a grid outage, i.e. they can bebrought very quickly into operation from stand still and withoutany external power supply. In addition to their black start capabil-ity, pumped hydro is able to provide system services in the furtherprocess of grid restoration. While grid restoration is in progress,further generators and controllable consumers are connectedunder control so that individual stable partial grids (isolated net-works) can be established for a start. But once grid frequencyand line voltage have returned to within tolerances, a major partof the consumers go online again uncontrolled. This results in con-siderable load variations that are difficult to predict while the gridis being restored. When partial grids are reconnected to each other,there will also be sharp jumps in load. Pumped hydro can easilybalance these variations because they are able to follow steeppower gradients, have short response times and feature motor-generators with a high rotating mass inertia. This ensures stablebehavior over the entire output range, from no load to full load.
A further symbiotic potential is found as the system is designedand built: the engineering, economic, and environmental analysisconducted should be well documented and used to form the basisfor classroom lessons in local schools so students can experiencethe power of collaborative, deterministic and creative thought.Hands-on learning can include students ‘‘Facing the Sun” to design,build, install, and operate solar panels and compete to see whichteams can collect the most energy in a year, and which teams’ sys-tems continue to operate year after year. Real time active problemsolving of challenges that arise will not only be invaluable from aneducation perspective, the students might suggest great solutions.[73].
Nearest major city (NMC) Distance to NMC Energy potential (GWh/cycle)
Iquique 7.4 483Iquique 9.0 388Iquique 3.0 208Iquique 9.5 113
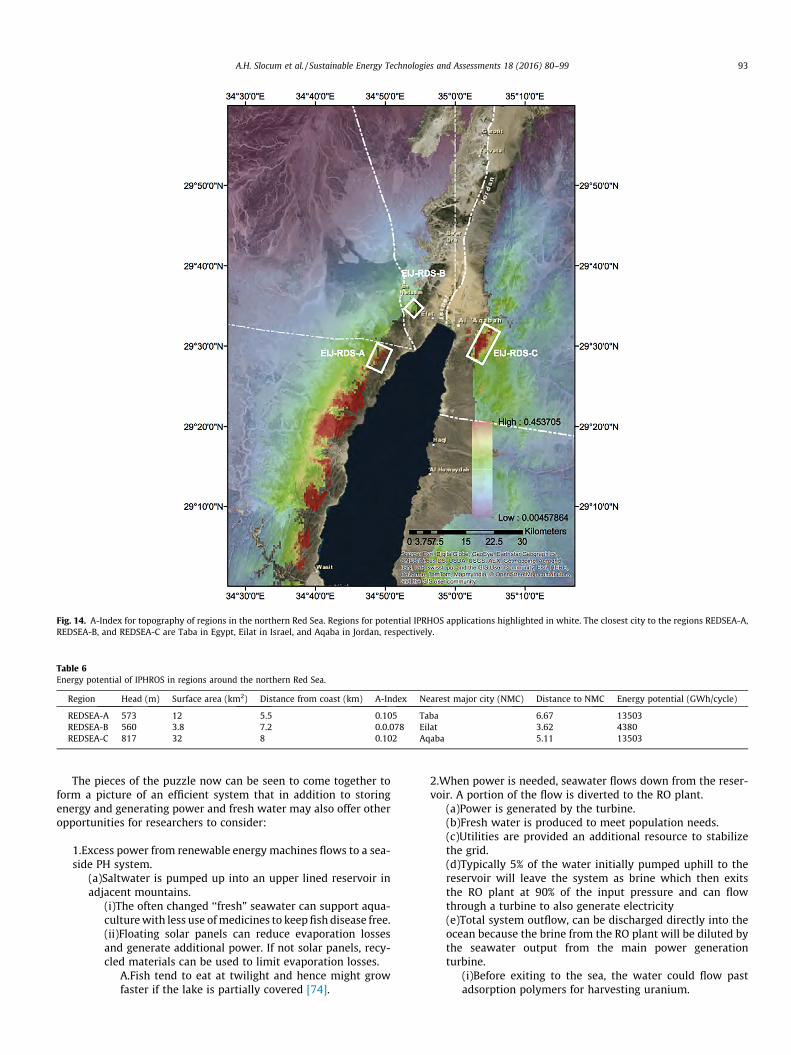
Fig. 14. A-Index for topography of regions in the northern Red Sea. Regions for potential IPRHOS applications highlighted in white. The closest city to the regions REDSEA-A,REDSEA-B, and REDSEA-C are Taba in Egypt, Eilat in Israel, and Aqaba in Jordan, respectively.
Table 6Energy potential of IPHROS in regions around the northern Red Sea.
Region Head (m) Surface area (km2) Distance from coast (km) A-Index Nearest major city (NMC) Distance to NMC Energy potential (GWh/cycle)
REDSEA-A 573 12 5.5 0.105 Taba 6.67 13503REDSEA-B 560 3.8 7.2 0.0.078 Eilat 3.62 4380REDSEA-C 817 32 8 0.102 Aqaba 5.11 13503
A.H. Slocum et al. / Sustainable Energy Technologies and Assessments 18 (2016) 80–99 93
The pieces of the puzzle now can be seen to come together toform a picture of an efficient system that in addition to storingenergy and generating power and fresh water may also offer otheropportunities for researchers to consider:
1.Excess power from renewable energy machines flows to a sea-side PH system.
(a)Saltwater is pumped up into an upper lined reservoir inadjacent mountains.
(i)The often changed ‘‘fresh” seawater can support aqua-culturewith less use ofmedicines to keep fish disease free.(ii)Floating solar panels can reduce evaporation lossesand generate additional power. If not solar panels, recy-cled materials can be used to limit evaporation losses.
A.Fish tend to eat at twilight and hence might growfaster if the lake is partially covered [74].
2.When power is needed, seawater flows down from the reser-voir. A portion of the flow is diverted to the RO plant.
(a)Power is generated by the turbine.(b)Fresh water is produced to meet population needs.(c)Utilities are provided an additional resource to stabilizethe grid.(d)Typically 5% of the water initially pumped uphill to thereservoir will leave the system as brine which then exitsthe RO plant at 90% of the input pressure and can flowthrough a turbine to also generate electricity(e)Total system outflow, can be discharged directly into theocean because the brine from the RO plant will be diluted bythe seawater output from the main power generationturbine.
(i)Before exiting to the sea, the water could flow pastadsorption polymers for harvesting uranium.
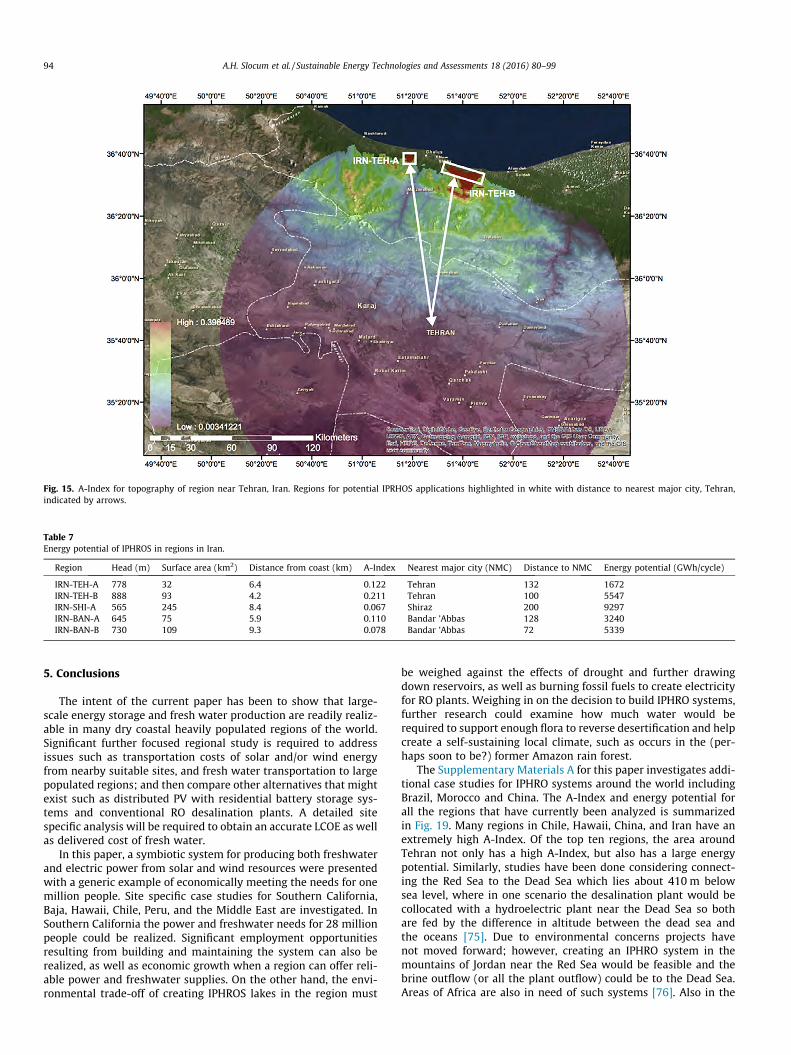
Fig. 15. A-Index for topography of region near Tehran, Iran. Regions for potential IPRHOS applications highlighted in white with distance to nearest major city, Tehran,indicated by arrows.
Table 7Energy potential of IPHROS in regions in Iran.
Region Head (m) Surface area (km2) Distance from coast (km) A-Index Nearest major city (NMC) Distance to NMC Energy potential (GWh/cycle)
IRN-TEH-A 778 32 6.4 0.122 Tehran 132 1672IRN-TEH-B 888 93 4.2 0.211 Tehran 100 5547IRN-SHI-A 565 245 8.4 0.067 Shiraz 200 9297IRN-BAN-A 645 75 5.9 0.110 Bandar ’Abbas 128 3240IRN-BAN-B 730 109 9.3 0.078 Bandar ’Abbas 72 5339
94 A.H. Slocum et al. / Sustainable Energy Technologies and Assessments 18 (2016) 80–99
5. Conclusions
The intent of the current paper has been to show that large-scale energy storage and fresh water production are readily realiz-able in many dry coastal heavily populated regions of the world.Significant further focused regional study is required to addressissues such as transportation costs of solar and/or wind energyfrom nearby suitable sites, and fresh water transportation to largepopulated regions; and then compare other alternatives that mightexist such as distributed PV with residential battery storage sys-tems and conventional RO desalination plants. A detailed sitespecific analysis will be required to obtain an accurate LCOE as wellas delivered cost of fresh water.
In this paper, a symbiotic system for producing both freshwaterand electric power from solar and wind resources were presentedwith a generic example of economically meeting the needs for onemillion people. Site specific case studies for Southern California,Baja, Hawaii, Chile, Peru, and the Middle East are investigated. InSouthern California the power and freshwater needs for 28 millionpeople could be realized. Significant employment opportunitiesresulting from building and maintaining the system can also berealized, as well as economic growth when a region can offer reli-able power and freshwater supplies. On the other hand, the envi-ronmental trade-off of creating IPHROS lakes in the region must
be weighed against the effects of drought and further drawingdown reservoirs, as well as burning fossil fuels to create electricityfor RO plants. Weighing in on the decision to build IPHRO systems,further research could examine how much water would berequired to support enough flora to reverse desertification and helpcreate a self-sustaining local climate, such as occurs in the (per-haps soon to be?) former Amazon rain forest.
The Supplementary Materials A for this paper investigates addi-tional case studies for IPHRO systems around the world includingBrazil, Morocco and China. The A-Index and energy potential forall the regions that have currently been analyzed is summarizedin Fig. 19. Many regions in Chile, Hawaii, China, and Iran have anextremely high A-Index. Of the top ten regions, the area aroundTehran not only has a high A-Index, but also has a large energypotential. Similarly, studies have been done considering connect-ing the Red Sea to the Dead Sea which lies about 410 m belowsea level, where in one scenario the desalination plant would becollocated with a hydroelectric plant near the Dead Sea so bothare fed by the difference in altitude between the dead sea andthe oceans [75]. Due to environmental concerns projects havenot moved forward; however, creating an IPHRO system in themountains of Jordan near the Red Sea would be feasible and thebrine outflow (or all the plant outflow) could be to the Dead Sea.Areas of Africa are also in need of such systems [76]. Also in the
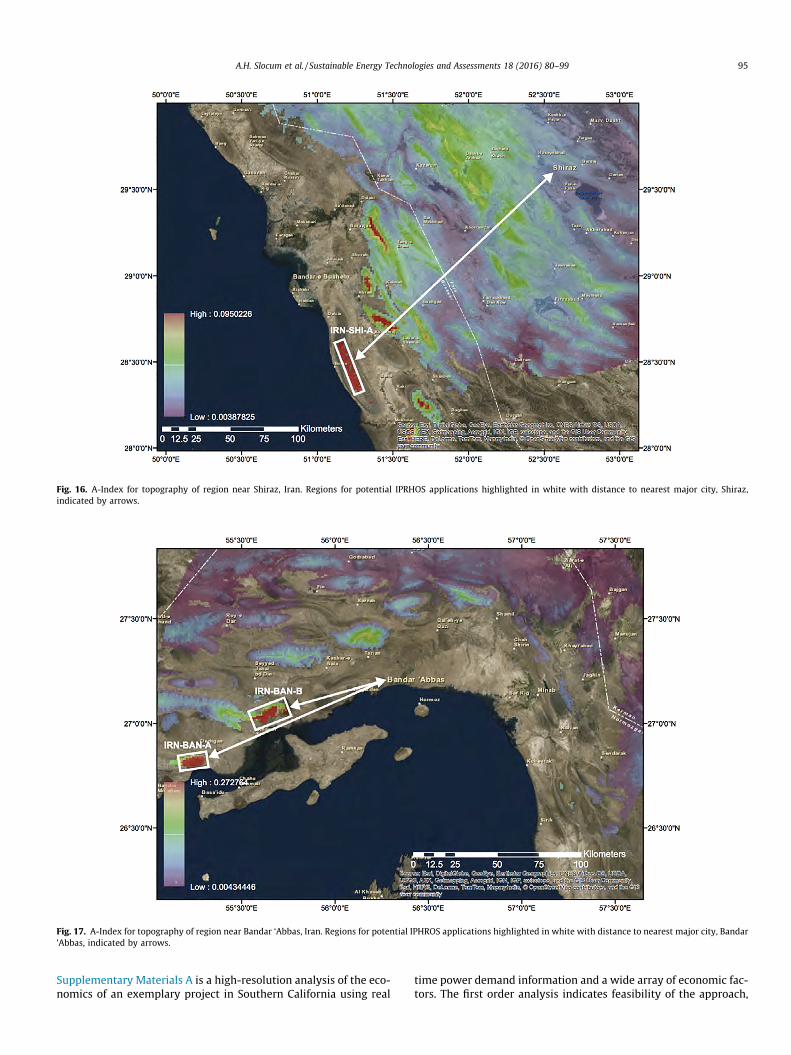
Fig. 16. A-Index for topography of region near Shiraz, Iran. Regions for potential IPRHOS applications highlighted in white with distance to nearest major city, Shiraz,indicated by arrows.
Fig. 17. A-Index for topography of region near Bandar ‘Abbas, Iran. Regions for potential IPHROS applications highlighted in white with distance to nearest major city, Bandar’Abbas, indicated by arrows.
A.H. Slocum et al. / Sustainable Energy Technologies and Assessments 18 (2016) 80–99 95
Supplementary Materials A is a high-resolution analysis of the eco-nomics of an exemplary project in Southern California using real
time power demand information and a wide array of economic fac-tors. The first order analysis indicates feasibility of the approach,
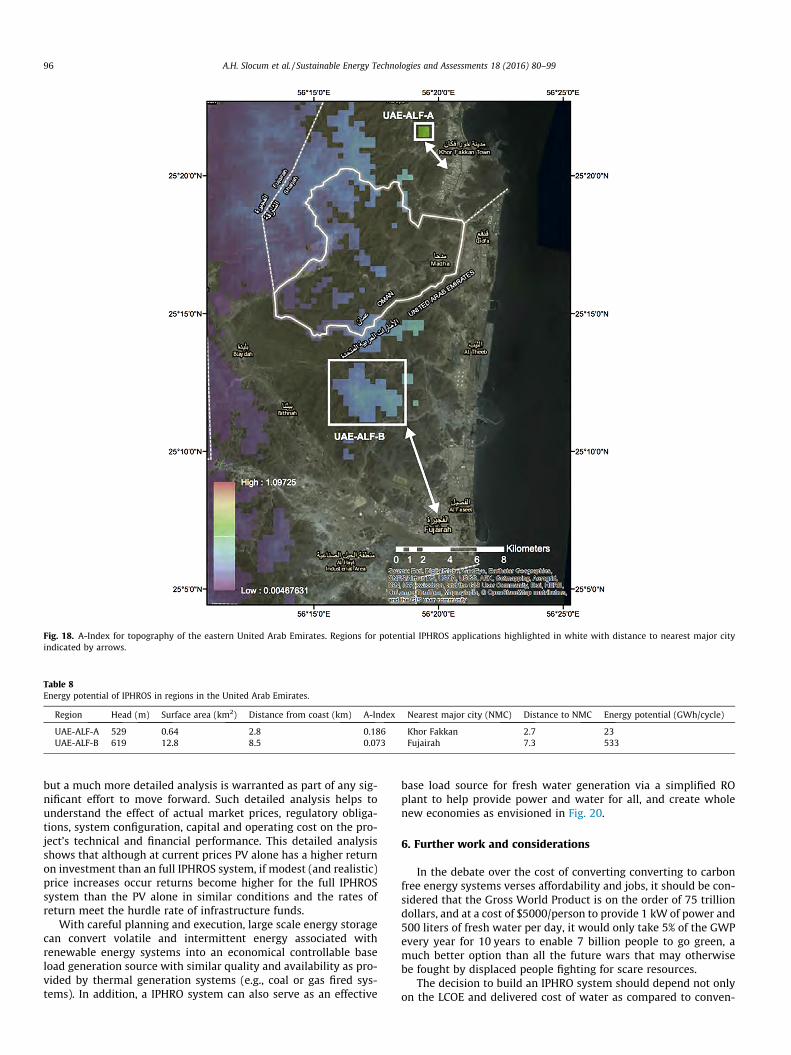
Fig. 18. A-Index for topography of the eastern United Arab Emirates. Regions for potential IPHROS applications highlighted in white with distance to nearest major cityindicated by arrows.
Table 8Energy potential of IPHROS in regions in the United Arab Emirates.
Region Head (m) Surface area (km2) Distance from coast (km) A-Index Nearest major city (NMC) Distance to NMC Energy potential (GWh/cycle)
UAE-ALF-A 529 0.64 2.8 0.186 Khor Fakkan 2.7 23UAE-ALF-B 619 12.8 8.5 0.073 Fujairah 7.3 533
96 A.H. Slocum et al. / Sustainable Energy Technologies and Assessments 18 (2016) 80–99
but a much more detailed analysis is warranted as part of any sig-nificant effort to move forward. Such detailed analysis helps tounderstand the effect of actual market prices, regulatory obliga-tions, system configuration, capital and operating cost on the pro-ject’s technical and financial performance. This detailed analysisshows that although at current prices PV alone has a higher returnon investment than an full IPHROS system, if modest (and realistic)price increases occur returns become higher for the full IPHROSsystem than the PV alone in similar conditions and the rates ofreturn meet the hurdle rate of infrastructure funds.
With careful planning and execution, large scale energy storagecan convert volatile and intermittent energy associated withrenewable energy systems into an economical controllable baseload generation source with similar quality and availability as pro-vided by thermal generation systems (e.g., coal or gas fired sys-tems). In addition, a IPHRO system can also serve as an effective
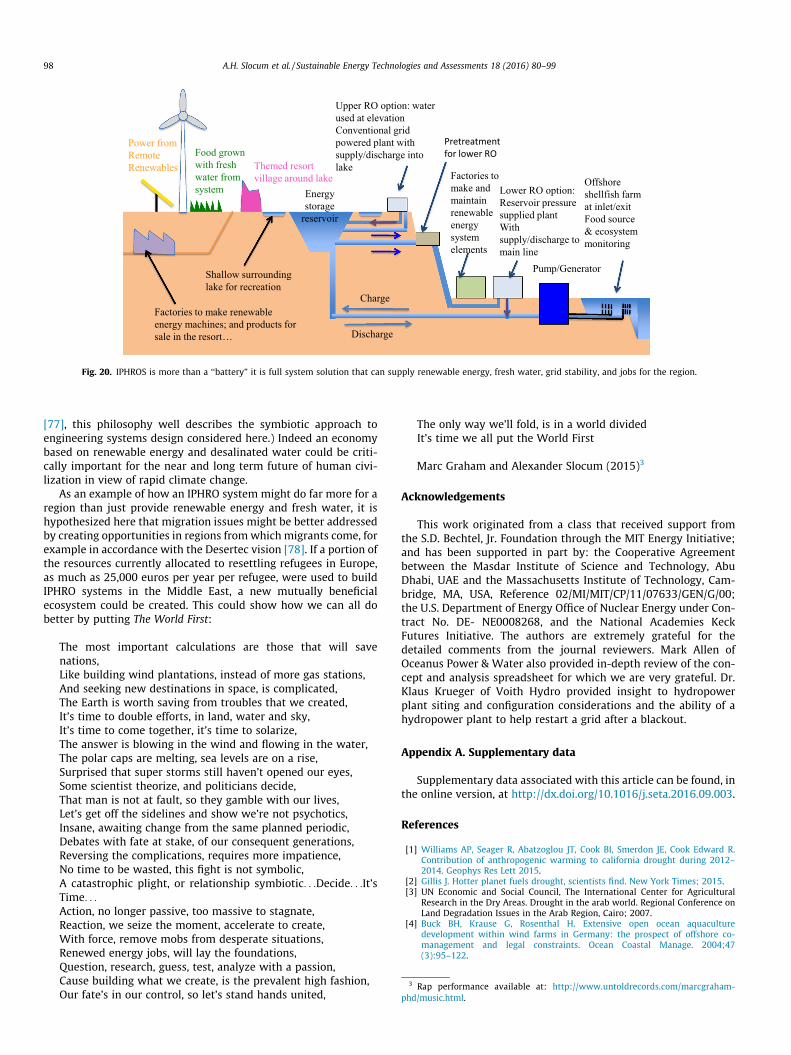
base load source for fresh water generation via a simplified ROplant to help provide power and water for all, and create wholenew economies as envisioned in Fig. 20.
6. Further work and considerations
In the debate over the cost of converting converting to carbonfree energy systems verses affordability and jobs, it should be con-sidered that the Gross World Product is on the order of 75 trilliondollars, and at a cost of $5000/person to provide 1 kW of power and500 liters of fresh water per day, it would only take 5% of the GWPevery year for 10 years to enable 7 billion people to go green, amuch better option than all the future wars that may otherwisebe fought by displaced people fighting for scare resources.
The decision to build an IPHRO system should depend not onlyon the LCOE and delivered cost of water as compared to conven-

Fig. 19. Summary of A-Index and energy potential of all regions investigated in this paper (*) and its supplemental materials (+).
A.H. Slocum et al. / Sustainable Energy Technologies and Assessments 18 (2016) 80–99 97
tional systems, but also on to the long term prognosis for alterna-tives as regional impacts of climate change create policyuncertainties.
In addition, the development of IPHRO systems is not just aboutproviding renewable energy and freshwater, it is also about creat-ing a societal approach to supplying two of our greatest needs; andsince renewable power systems tend to be widely distributed and
it will take decades to build all the systems needed, many skilledjobs can be created and sustained. As IPHRO related systems comeon line, workers will also be needed to maintain these systems andreplace and recycle systems at their end of useful life. The questionof IPHRO systems is thus perhaps not ‘does it work?’, but ‘whatdoes it make possible?’ (Adopted from Brian Massumi in the trans-lator’s forward of Deleuze and Guattari’s ‘A Thousand Plateaus’
Pump/Generator
Charge
Discharge
Shallow surrounding lake for recreation
Upper RO option: water used at elevationConventional grid powered plant with supply/discharge into lake
Lower RO option: Reservoir pressure supplied plantWith supply/discharge to main line
Themed resort village around lake
Power from Remote Renewables
Food grown with fresh water from system Energy
storage reservoir
Offshore shellfish farm at inlet/exitFood source & ecosystem monitoring
Factories to make and maintain renewable energy system elements
Pretreatment for lower RO
Factories to make renewable energy machines; and products for sale in the resort…
Fig. 20. IPHROS is more than a ‘‘battery” it is full system solution that can supply renewable energy, fresh water, grid stability, and jobs for the region.
3 Rap performance available at: http://www.untoldrecords.com/marcgraham-hd/music.html.
98 A.H. Slocum et al. / Sustainable Energy Technologies and Assessments 18 (2016) 80–99
[77], this philosophy well describes the symbiotic approach toengineering systems design considered here.) Indeed an economybased on renewable energy and desalinated water could be criti-cally important for the near and long term future of human civi-lization in view of rapid climate change.
As an example of how an IPHRO system might do far more for aregion than just provide renewable energy and fresh water, it ishypothesized here that migration issues might be better addressedby creating opportunities in regions fromwhich migrants come, forexample in accordance with the Desertec vision [78]. If a portion ofthe resources currently allocated to resettling refugees in Europe,as much as 25,000 euros per year per refugee, were used to buildIPHRO systems in the Middle East, a new mutually beneficialecosystem could be created. This could show how we can all dobetter by putting The World First:
The most important calculations are those that will savenations,Like building wind plantations, instead of more gas stations,And seeking new destinations in space, is complicated,The Earth is worth saving from troubles that we created,It’s time to double efforts, in land, water and sky,It’s time to come together, it’s time to solarize,The answer is blowing in the wind and flowing in the water,The polar caps are melting, sea levels are on a rise,Surprised that super storms still haven’t opened our eyes,Some scientist theorize, and politicians decide,That man is not at fault, so they gamble with our lives,Let’s get off the sidelines and show we’re not psychotics,Insane, awaiting change from the same planned periodic,Debates with fate at stake, of our consequent generations,Reversing the complications, requires more impatience,No time to be wasted, this fight is not symbolic,A catastrophic plight, or relationship symbiotic. . .Decide. . .It’sTime. . .Action, no longer passive, too massive to stagnate,Reaction, we seize the moment, accelerate to create,With force, remove mobs from desperate situations,Renewed energy jobs, will lay the foundations,Question, research, guess, test, analyze with a passion,Cause building what we create, is the prevalent high fashion,Our fate’s in our control, so let’s stand hands united,
The only way we’ll fold, is in a world dividedIt’s time we all put the World First
Marc Graham and Alexander Slocum (2015)3
Acknowledgements
This work originated from a class that received support fromthe S.D. Bechtel, Jr. Foundation through the MIT Energy Initiative;and has been supported in part by: the Cooperative Agreementbetween the Masdar Institute of Science and Technology, AbuDhabi, UAE and the Massachusetts Institute of Technology, Cam-bridge, MA, USA, Reference 02/MI/MIT/CP/11/07633/GEN/G/00;the U.S. Department of Energy Office of Nuclear Energy under Con-tract No. DE- NE0008268, and the National Academies KeckFutures Initiative. The authors are extremely grateful for thedetailed comments from the journal reviewers. Mark Allen ofOceanus Power & Water also provided in-depth review of the con-cept and analysis spreadsheet for which we are very grateful. Dr.Klaus Krueger of Voith Hydro provided insight to hydropowerplant siting and configuration considerations and the ability of ahydropower plant to help restart a grid after a blackout.
Appendix A. Supplementary data
Supplementary data associated with this article can be found, inthe online version, at http://dx.doi.org/10.1016/j.seta.2016.09.003.
References
[1] Williams AP, Seager R, Abatzoglou JT, Cook BI, Smerdon JE, Cook Edward R.Contribution of anthropogenic warming to california drought during 2012–2014. Geophys Res Lett 2015.
[2] Gillis J. Hotter planet fuels drought, scientists find. New York Times; 2015.[3] UN Economic and Social Council, The International Center for Agricultural
Research in the Dry Areas. Drought in the arab world. Regional Conference onLand Degradation Issues in the Arab Region, Cairo; 2007.
[4] Buck BH, Krause G, Rosenthal H. Extensive open ocean aquaculturedevelopment within wind farms in Germany: the prospect of offshore co-management and legal constraints. Ocean Coastal Manage. 2004;47(3):95–122.
p

A.H. Slocum et al. / Sustainable Energy Technologies and Assessments 18 (2016) 80–99 99
[5] Slocum AH. Symbiotic offshore energy harvesting and storage systems.Sustainable Energy Technol Assess 2015;11:135–41.
[6] Picard M, Baelden C, Wu Y, Chang L, Slocum AH. Extraction of uranium fromseawater: design and testing of a symbiotic system. Nucl Technol 2014;188(2):200–17.
[7] Haji MN, Vitry C, Slocum AH. Decoupling the functional requirements of anadsorbent for harvesting uranium from seawater through the use of shellenclosures. Proceedings of the 2015 ANS Winter Meeting and NuclearTechnology Expo.. La Grange Park, IL: American Nuclear Society; 2015.
[8] Farid AM, Lubega WN. Powering & watering agriculture: application of energy-water nexus planning. Global Humanitarian Technology Conference(GHTC). IEEE; 2013. p. 248–53.
[9] Kassakian JG, Schmalensee R, Desgroseilliers G, Heidel TD, Afridi K, Farid AM,Grochow JM, Hogan WW, Jacoby HD, Kirtley JL. The future of the electricitygrid: an interdisciplinary mit study. Tech Rep Cambridge, MA; 2011.
[10] Simbolotti G, Kempener R. Electricity storage. International Renewable EnergyAgency, Tech. Rep; 2012.
[11] Simon K, Shanbhag R, Slocum AH. Reducing evaporative water losses fromirrigation ponds through the reuse of polyethylene terephthalate bottles. J IrrigDrain Eng 2015:06015005.
[12] Thoresen R. Device for preventing of evaporation of water, March 26 1998. WOPatent App. PCT/NO1997/000,246.
[13] Froekjaer T. A floating tag for the reduction of evaporation from liquidreservoirs, January 11 2012. EP Patent 1,697,234.
[14] Gilau AM, Small MJ. Designing cost-effective sea water reverse osmosis systemunder optimal energy options for developing countries. In Proceedings of theInternational Conference on Renewable Energy for Developing Countries. p. 1.
[15] Espino T, Penate B, Piernavieja G, Herold D, Neskakis A. Optimised desalinationof seawater by a pv powered reverse osmosis plant for a decentralised coastalwater supply. Desalination 2003;156(1):349–50.
[16] Carta JA, Gonzalez J, Subiela V. Operational analysis of an innovative windpowered reverse osmosis system installed in the canary islands. Solar Energy2003;75(2):153–68.
[17] Ahmed M, Shayya WH, Hoey D, Mahendran A, Morris R, Al-Handaly J. Use ofevaporation ponds for brine disposal in desalination plants. Desalination2000;130(2):155–68.
[18] Ahmed M, Shayya WH, Hoey D, Al-Handaly J. Brine disposal from reverseosmosis desalination plants in Oman and the United Arab Emirates.Desalination 2001;133(2):135–47.
[19] Fujihara T, Imano H, Oshima K. Development of pump turbine for seawaterpumped-storage power plant. Hitachi Rev 1998;47(5):199–202.
[20] Okinawa Sea Water Pumped Storage. http://www.jpower.co.jp/english/international/consultation/detailold/seasjapan24.pdf. Accessed on: 7 June2016.
[21] WPDC. Egypt plans seawater pumped-storage plant, water power & damconstruction. World News; 1989.
[22] Hristova D. Chile Valhalla mulls partners for pumped storage, solar project –report. See News; 2015.
[23] Murakami M. Hydro-powered reverse osmosis (ro) desalination for co-generation: a middle east case study. Desalination 1994;97(1):301–11.
[24] Novosel T, Cosic B, Krajacic G, Duic N, Pukšec T, Mohsen MS, Ashhab MS,Ababneh AK. The influence of reverse osmosis desalination in a combinationwith pump storage on the penetration of wind and pv energy: a case study forjordan. Energy 2014;76:73–81.
[25] Murakami M. Managing water for peace in the middle east; alternativestrategies. United Nations University Press; 1995.
[26] Kobori I, Glantz MH, et al. Central Eurasian water crisis: Caspian, Aral and DeadSeas. United Nations University Press; 2004.
[27] Wittholz MK, O’Neill BK, Colby CB, Lewis D. Estimating the cost of desalinationplants using a cost database. Desalination 2008;229(1–3).
[28] Bergman R, Elarde J, Huehmer R. Cost of membrane treatment: current costsand trends. Membrane Technology Conference Proceedings. American WaterWorks Association; 2012.
[29] Arroyo J, Shirazi S. Cost of brackish groundwater desalination in Texas. TexasWater Development Board; 2012.
[30] Younos T. The economics of desalination. The economics of desalination. JContemp Water Res Educ 2005;132(1):39–45.
[31] Burbano AA, Adham SS, Pearce WR. The state of full-scale ro/nf desalination-results from a worldwide survey. Am Water Works Assoc J 2007;99(4):116.
[32] Membrane Desalination Costs. http://www.amtaorg.com/wp-content/uploads/6MembraneDesalinationCosts.pdf. Accessed on: 7 June 2016.
[33] Alspach B, Watson I. Take it with a grain of salt: What you need to know aboutswro costs. Membrane Technology Conference Proceedings. Long Beach,CA: American Water Works Association; 2011.
[34] Alspach B, Watson I. Swro costs: Don’t believe everything you read. IDA JDesalin Water Reuse 2011;3(2):22–8.
[35] The Seawater Desalination Plant in Ashdod. http://www.mekorot.co.il/Eng/newsite/Projects/Pages/TheAshdodDesalinationFacility.aspx. Accessed on: 7June 2016.
[36] Ashdod Desalination Plant, Ashdod, Israel. http://www.water-technology.net/projects/ashdod-desalination-plant-ashdod/. Accessed on: 20 July 2016.
[37] Shary D. personal communication. Minrav Holding Ltd, construction companywhich built the Ashdod plant; 2016.
[38] A. Kanarek. personal communication. IVM-JV, operator of the Ashdod plant.[39] Moch I, Querns WR, Steward D. WTCost II: modeling the capital and operating
costs of thermal desalination processes utilizing a recently developed
computer program that evaluates membrane desalting, electrodialysis, andion exchange plants. United States Department of Interior, Bureau ofReclamation; 2008.
[40] MWH. Technical Analysis of Pumped Storage and Integration with WindPower in the Pacific Northwest. Technical Report MWH-HDC-T12, U.S. ArmyCorps of Engineers Northwest Division, Hydroelectric Design Center; 2009.
[41] Davies RV, Kennedy J, McIlroy RW, Spence R, Hill KM. Extraction of uraniumfrom sea water. Nature 1964;203(4950):1110–5.
[42] Kim J, Tsouris C, Mayes RT, Oyola Y, Saito T, Janke CJ, Dai S, Schneider E, SachdeD. Recovery of uranium from seawater: a review of current status and futureresearch needs. Sep Sci Technol 2013;48(3):367–87.
[43] Al-mutaz IS, Wagialla KM. Techno-economic feasibility of extracting mineralsfrom desalination brines. Desalination 1988;69(3):297–307.
[44] Elimelech M, Phillip WA. The future of seawater desalination: energytechnology, and the environment. Science 2011;333(6043):712–7.
[45] Electric Power Development Company. Okinawa Sea Water Pumped Storage;1989.
[46] Fritzmann C, Löwenberg J, Wintgens T, Melin T. State-of-the-art of reverseosmosis desalination. Desalination 2007;216(1):1–76.
[47] Menningmann J. Seawater desalination with reverse osmosis; 2011.[48] Lenntech. Reverse osmosis desalination process; 2015. [Online, Accessed on 22
July 2015].[49] Menningmann J. Ro membrane technology- advances improve global access to
clean water. Water Qual Prod 2005;10(4):18.[50] Cohen-Tanugi D, Grossman JC. Water permeability of nanoporous graphene at
realistic pressures for reverse osmosis desalination. J Chem Phys 2014;141(7):074704.
[51] Rehman S, Al-Hadhrami LM, Alam MM. Pumped hydro energy storage system:a technological review. Renewable Sustainable Energy Rev 2015;44:586–98.
[52] Farr TG, Kobrick M. Shuttle radar topography mission produces a wealth ofdata. Eos, Trans Am Geophys Union 2000;81(48):583–5.
[53] Farr TG, Rosen PA, Caro E, Crippen R, Duren R, Hensley S, Kobrick M, Paller M,Rodriguez E, Roth L, Seal D, Shaffer S, Shimada J, Umland J, Werner M, Oskin M,Burbank D, Alsdorf D. The shuttle radar topography mission. Rev Geophys2007;45(2).
[54] Kobrick M. On the toes of giants–How SRTM was born. Photogramm EngRemote Sens 2006;72(3):206–10.
[55] Rosen PA, Hensley S, Joughin IR, Li FK, Madsen SN, Rodrguez E, Goldstein RM.Synthetic aperture radar interferometry. Proc IEEE 2000;88(3):333–82.
[56] Kahrl WL. Water and power: the conflict over Los Angeles’ water supply in theOwens valley. University of California Press; 1982.
[57] Mulholland C. William Mulholland and the rise of Los Angeles. University ofCalifornia Press; 2000.
[58] Jenkins S, Paduan J, Roberts P, Schlenk D, Weiss J. Management of brinedischarges to coastal waters: recommendations of a science advisory panel.Technical Report 692, Costa Mesa: Southern California Costa Water ResearchProject; 2012.
[59] United States Census Bureau. Annual Estimates of the Resident Population:April 1, 2010 to July 1, 2014; 2010.
[60] Secretara de Desarrollo Social. Catlogo de Localidades; 2010.[61] Instituto Nacional de Estadsticas. Census; 2012.[62] U.S. Energy Information Administration. Iran; 2014.[63] Hossein A, Yazdan GF, Ehsan AG. Energy consumption in Iran with Bayesian
approach 1. OPEC Energy Rev 2012;36(4):444–55.[64] Erdbrink T. Annual buildup of air pollution chokes Tehran. The New York
Times; 2013.[65] Rezaian J. Iran’s water crisis the product of decades of bad planning. The New
York Times; 2014.[66] Ghorbani M. The economic geology of Iran. Netherlands: Springer; 2013.[67] United Nations Statistics Division; 2015.[68] Heap T. Masdar: Abu Dhabi’s carbon-neutral city. BBC News; 2010.[69] Dyck E, Evrensel A. From consideration to construction: the United Arab
Emirates’ journey to nuclear power. IAEA Department of Nuclear Energy;2015.
[70] Cullen AP. Covering or blanketing liquid surfaces and float members foreffecting same; 1976. US Patent 3,938,338.
[71] Santafé MR, Soler JBT, Romero FJS, Gisbert PSF, Gozálvez JJF, Gisbert CMF.Theoretical and experimental analysis of a floating photovoltaic cover forwater irrigation reservoirs. Energy 2014;67:246–55.
[72] Ruskowitz JA, Suárez F, Tyler SW, Childress AE. Evaporation suppression andsolar energy collection in a salt-gradient solar pond. Solar Energy2014;99:36–46.
[73] Graham M, Slocum AH, Moreno Sanchez R. Teaching high school students andcollege freshmen product development by deterministic design With PREP. JMech Des 2007;129(7):677–81.
[74] Barnes ME, Miller J, Durben DJ. Partial overhead tank cover use during feralbrown trout rearing. North Am J Aquacult 2005;67(4):319–23.
[75] McPhail A, Lintner S. Red sea dead sea water conveyance study programoverview; 2013.
[76] May D. The trans-africa pipeline: Building a sustainable water generation anddistribution network. http://transafricapipeline.org/PDFs/TAPDMayPaper.pdf,2011.
[77] Deleuze G, Guattari F. A thousand plateaus: capitalism andschizophrenia. Minneapolis, MN: University of Minnesota Press; 1987.
[78] Desertec. Desertec website. http://www.desertec.org/.