
Integrated Pollution Prevention and Control (IPPC) · 2019-11-14 · pollution prevention and...
485
Report EUR 25786 EN 20 13 SCALET Bianca Maria, GARCIA MUÑOZ Marcos, SISSA Aivi Querol, ROUDIER Serge, DELGADO SANCHO Luis Industrial Emissions Directive 2010/75/EU (Integrated Pollution Prevention and Control) Best Available Techniques (BAT) Reference Document for the Manufacture of Glass JRC REFERENCE REPORT
Transcript of Integrated Pollution Prevention and Control (IPPC) · 2019-11-14 · pollution prevention and...
2 0 1 3
SCALET Bianca Maria, GARCIA MUÑOZ Marcos,SD
Industrial Emissions Directive 2010/75/EU
Best Available Techniques (BAT) Reference Document for the Manufacture of Glass
J R C R E F E R E N C E R E P O R T
ISSA Aivi Querol, ROUDIER Serge, ELGADO SANCHO Luis
(Integrated Pollution Prevention and Control)
Report EUR 25786 EN

European Commission
Joint Research Centre
Institute for prospective technological studies
Contact information
European IPPC Bureau
Address: Joint Research Centre, Edificio Expo c/ Inca Garcilaso, 3 E-41092 Seville, Spain
E-mail: [email protected]
Tel.: +34 95 4488 284
Fax: +34 95 4488 426
http://eippcb.jrc.ec.europa.eu
http://ipts.jrc.ec.europa.eu/
This publication is a Reference Report by the Joint Research Centre of the European Commission.
Legal Notice
Under the Commission Decision of 12 December 2011 on the Re-use of Commission Documents (2011/833/EU), the present
BREF document is subject to free re-use, except for parts covered by any third-party rights which may be present in the
document (such as images, tables, data, written material, or similar, the rights to which need to be acquired separately from
their respective rights-holders for further use). The European Commission is not liable for any consequence stemming from the
re-use of this publication. Any re-use is subject to the acknowledgement of the source and non-distortion of the original
meaning or message
Europe Direct is a service to help you find answers to your questions about the European Union
Freephone number (*): 00 800 6 7 8 9 10 11
(*) Certain mobile telephone operators do not allow access to 00 800 numbers or these calls may be billed.
A great deal of additional information on the European Union is available on the Internet.
It can be accessed through the Europa server http://europa.eu/.
JRC 78091
EUR 25786 EN
ISBN 978-92-79-28284-3 (pdf)
ISBN 978-92-79-28285-0 (print)
ISSN 1831-9424 (online)
ISSN 1018-5593 (print)
doi:10.2791/69502
Luxembourg: Publications Office of the European Union, 2013
© European Union, 2013
Reproduction is authorised provided the source is acknowledged.
Printed in Spain

Best Available Techniques (BAT) Reference Document for The Manufacture of Glass
Industrial Emissions Directive 2010/75/EU Integrated Pollution Prevention and Control
Authors:
SCALET Bianca Maria, GARCIA MUÑOZ Marcos, SISSA Aivi Querol, ROUDIER Serge, DELGADO SANCHO Luis
2013
EUR 25786 EN


Acknowledgements
This report was produced by the European Integrated Pollution Prevention and Control Bureau
(EIPPCB) at the European Commission's Joint Research Centre – Institute for Prospective Technological Studies (IPTS) under the supervision of
Serge Roudier (Head of the EIPPCB) and Luis Delgado (Head of the Sustainable Production and Consumption Unit).
The main EIPPCB author of this BREF was Ms Bianca Maria Scalet. Mr Marcos García Muñoz and Ms Aivi Sissa Queirolo started the work.
This project report was drawn up in the framework of the implementation of the Industrial Emissions Directive (2010/75/EU) and is the result of
the exchange of information provided for in Article 13 of the Directive for the Manufacture of Glass.
Member States (Belgium, Bulgaria, Denmark, Germany, Ireland, Spain, France, Italy, Luxembourg, Hungary, Netherlands, Austria, Poland, Portugal,
Romania, Finland, Sweden, United Kingdom), industrial associations representing the European glass manufacturers (CPIV, FEVE, Glass for Europe,
APFE, European Domestic Glass, ESGA, EURIMA, ECFIA,ANFFECC) and Ökopol representing the European Environmental Bureau participated in the
information exchange.
The whole EIPPCB team provided contributions and peer reviewing.
nowferi
Typewritten Text
nowferi
Typewritten Text
nowferi
Typewritten Text

This document is one from the series of foreseen documents listed below (at the time of writing, not all documents have been drafted):
Best Available Techniques Reference Document . . . Code
Ceramic Manufacturing Industry CER Common Waste Water and Waste Gas Treatment/Management Systems in the Chemical Sector CWW
Emissions from Storage EFS
Energy Efficiency ENE
Ferrous Metals Processing Industry FMP
Food, Drink and Milk Industries FDM
Industrial Cooling Systems ICS
Intensive Rearing of Poultry and Pigs IRPP
Iron and Steel Production IS
Large Combustion Plants LCP
Large Volume Inorganic Chemicals – Ammonia, Acids and Fertilisers Industries LVIC-AAF
Large Volume Inorganic Chemicals – Solids and Others industry LVIC-S
Large Volume Organic Chemical Industry LVOC
Management of Tailings and Waste-rock in Mining Activities MTWR
Manufacture of Glass GLS
Manufacture of Organic Fine Chemicals OFC
Non-ferrous Metals Industries NFM
Production of Cement, Lime and Magnesium Oxide CLM
Production of Chlor-alkali CAK
Production of Polymers POL
Production of Speciality Inorganic Chemicals SIC
Pulp and Paper Industry PP
Refining of Mineral Oil and Gas REF
Slaughterhouses and Animals By-products Industries SA
Smitheries and Foundries Industry SF
Surface Treatment of Metals and Plastics STM
Surface Treatment Using Organic Solvents STS
Tanning of Hides and Skins TAN
Textiles Industry TXT
Waste Incineration WI
Waste Treatments Industries WT
Wood and Wood Products Preservation with Chemicals WPC
Wood-based Panels Production WBP
Reference Document . . .
Economics and Cross-media Effects ECM
General Principles of Monitoring MON Electronic versions of draft and finalised documents are publicly available and can be downloaded from http://eippcb.jrc.ec.europa.eu/.

Preface
Manufacture of Glass i
PREFACE 1. Status of this document
Unless otherwise stated, references to “the Directive” in this document refer to Directive 2010/75/EU of the European Parliament and the Council on industrial emissions (integrated pollution prevention and control) (Recast). The original best available techniques (BAT) reference document (BREF) on the Manufacture of Glass was adopted by the European Commission in 2001. This document is the result of a review of that BREF. The review commenced in March 2006.
This BAT reference document for the Manufacture of Glass forms part of a series presenting the results of an exchange of information between EU Member States, the industries concerned, non-governmental organisations promoting environmental protection and the Commission, to draw up, review, and where necessary, update BAT reference documents as required by Article 13(1) of the Directive. This document is published by the European Commission pursuant to Article 13(6) of the Directive. As set out in Article 13(5) of the Directive, the Commission Implementing Decision (2012/134/EU) on the BAT conclusions contained in Chapter 5 was adopted on 28 February 2012 and published on 8 March 2012 (1). 2. Participants in the information exchange As required in Article 13(3) of the Directive, the Commission has established a forum to promote the exchange of information, which is composed of representatives from Member States, the industries concerned and non-governmental organisations promoting environmental protection (Commission Decision of 16 May 2011 establishing a forum for the exchange of information pursuant to Article 13 of the Directive 2010/75/EU on industrial emissions (2011/C 146/03), OJ C 146, 17.05.2011, p. 3). Forum members have nominated technical experts constituting the technical working group (TWG) that was the main source of information for drafting this document. The work of the TWG was led by the European IPPC Bureau (of the Commission's Joint Research Centre). 3. Structure and contents of this document Chapters 1 and 2 provide general information on the glass industry and on the industrial processes and techniques used within this sector. Chapter 3 provides data and information concerning the environmental performance of installations within the sector, and in operation at the timeof writing, in terms of current emissions, consumption and nature of raw materials, water consumption, use of energy and the generation of waste. Chapter 4 describes in more detail the techniques to prevent or, where this is not practicable, to reduce the environmental impact of installations in this sector that were considered in determining the BAT. This information includes, where relevant, the environmental performance levels (e.g. emission and consumption levels) which can be achieved by using the techniques, the associated monitoring and the costs and the cross-media issues associated with the techniques.
(1) OJ L 70, 08.03.2012, p.1

Preface
ii Manufacture of Glass
Chapter 5 presents the BAT conclusions as defined in Article 3(12) of the Directive. Chapter 6 presents information on ‘emerging techniques’ as defined in Article 3(14) of the Directive. Concluding remarks and recommendations for future work are presented in Chapter 7. 4. Information sources and the derivation of BAT This document is based on information collected from a number of sources, in particular, through the TWG that was established specifically for the exchange of information under Article 13 of the Directive. The information has been collated and assessed by the European IPPC Bureau (of the Commission’s Joint Research Centre) who led the work on determining BAT, guided by the principles of technical expertise, transparency and neutrality. The work of the TWG and all other contributors is gratefully acknowledged. The BAT conclusions have been established through an iterative process involving the following steps: • identification of the key environmental issues for the sector; • examination of the techniques most relevant to address these key issues; • identification of the best environmental performance levels, on the basis of the available
data in the European Union and worldwide; • examination of the conditions under which these environmental performance levels were
achieved, such as costs, cross-media effects, and the main driving forces involved in the implementation of the techniques;
• selection of the best available techniques (BAT), their associated emission levels (and other environmental performance levels) and the associated monitoring for this sector according to Article 3(10) of, and Annex III, to the Directive.
Expert judgement by the European IPPC Bureau and the TWG has played a key role in each of these steps and the way in which the information is presented here. Where available, economic data have been given together with the descriptions of the techniques presented in Chapter 4. These data give a rough indication of the magnitude of the costs and benefits. However, the actual costs and benefits of applying a technique may depend strongly on the specific situation of the installation concerned, which cannot be evaluated fully in this document. In the absence of data concerning costs, conclusions on the economic viability of techniques are drawn from observations on existing installations. 5. Review of BAT reference documents (BREFs)
BAT is a dynamic concept and so the review of BREFs is a continuing process. For example, new measures and techniques may emerge, science and technologies are continuously developing and new or emerging processes are being successfully introduced into the industries. In order to reflect such changes and their consequences for BAT, this document will be periodically reviewed and, if necessary, updated accordingly.

Preface
Manufacture of Glass iii
6. Contact information
All comments and suggestions should be made to the European IPPC Bureau at the Institute for Prospective Technological Studies at the following address: European Commission Institute for Prospective Technological Studies European IPPC Bureau Edificio Expo c/ Inca Garcilaso, 3 E-41092 Seville, Spain Telephone: +34 95 4488 284 Fax: +34 95 4488 426 E-mail: [email protected]: http://eippcb.jrc.ec.europa.eu


Manufacture of Glass v
Best Available Techniques (BAT) Reference Document for the Manufacture of Glass
Acknowledgements.................................................................................................................................... II PREFACE....................................................................................................................................................I SCOPE ................................................................................................................................................. XVII 1 GENERAL INFORMATION........................................................................................................... 1
1.1 Structure of the industry............................................................................................................. 1 1.2 Introduction................................................................................................................................ 2
1.2.1 Characteristics of glass..................................................................................................... 5 1.2.2 Broad classification of glass types ................................................................................... 6 1.2.3 Historical origins.............................................................................................................. 7
1.3 Container glass ........................................................................................................................... 9 1.3.1 Sector overview ............................................................................................................... 9 1.3.2 Products and markets ..................................................................................................... 11 1.3.3 Commercial and financial considerations ...................................................................... 12 1.3.4 Main environmental issues............................................................................................. 13
1.4 Flat glass .................................................................................................................................. 13 1.4.1 Sector overview ............................................................................................................. 13 1.4.2 Products and markets ..................................................................................................... 15 1.4.3 Commercial and financial considerations ...................................................................... 16 1.4.4 Main environmental issues............................................................................................. 17
1.5 Continuous filament glass fibre................................................................................................ 18 1.5.1 Sector Overview............................................................................................................. 18 1.5.2 Products and markets ..................................................................................................... 19 1.5.3 Commercial and financial considerations ...................................................................... 20 1.5.4 Main environmental issues............................................................................................. 20
1.6 Domestic glass ......................................................................................................................... 21 1.6.1 Sector overview ............................................................................................................. 21 1.6.2 Products and markets ..................................................................................................... 22 1.6.3 Commercial and financial considerations ...................................................................... 23 1.6.4 Main environmental issues............................................................................................. 24
1.7 Special glass ............................................................................................................................. 25 1.7.1 Sector overview ............................................................................................................. 25 1.7.2 Products and markets ..................................................................................................... 26 1.7.3 Commercial and financial considerations ...................................................................... 28 1.7.4 Main environmental issues............................................................................................. 29
1.8 Mineral wool ............................................................................................................................ 29 1.8.1 Sector overview ............................................................................................................. 29 1.8.2 Products and markets ..................................................................................................... 31 1.8.3 Commercial and financial considerations ...................................................................... 31 1.8.4 Main environmental issues............................................................................................. 32
1.9 High temperature insulation wools........................................................................................... 33 1.9.1 Sector overview ............................................................................................................. 33 1.9.2 Products and markets ..................................................................................................... 33 1.9.3 Commercial considerations............................................................................................ 35 1.9.4 Main environmental issues............................................................................................. 35
1.10 Frits .......................................................................................................................................... 36 1.10.1 Sector overview ............................................................................................................. 36 1.10.2 Products and markets ..................................................................................................... 37 1.10.3 Commercial considerations............................................................................................ 37 1.10.4 Main environmental issues............................................................................................. 38
2 APPLIED PROCESSES AND TECHNIQUES ............................................................................ 39 2.1 Materials handling.................................................................................................................... 39 2.2 Glass melting............................................................................................................................ 40
2.2.1 Raw materials for glass making ..................................................................................... 40 2.2.2 The melting process ....................................................................................................... 42
2.3 Melting techniques ................................................................................................................... 45 2.3.1 Regenerative furnaces .................................................................................................... 47
nowferi
Rectangle
vi Manufacture of Glass
2.3.2 Conventional recuperative furnace .................................................................................49 2.3.3 Oxy-fuel melting ............................................................................................................50 2.3.4 Electric melting ..............................................................................................................50 2.3.5 Combined fossil fuel and electric melting ......................................................................51 2.3.6 Discontinuous batch melting ..........................................................................................52 2.3.7 Special furnace designs ..................................................................................................52
2.4 Container glass .........................................................................................................................53 2.5 Flat glass ...................................................................................................................................57
2.5.1 The float glass process....................................................................................................57 2.5.2 The rolled process (patterned and wired glass)...............................................................59
2.6 Continuous filament glass fibre ................................................................................................60 2.7 Domestic glass ..........................................................................................................................62 2.8 Special glass .............................................................................................................................64 2.9 Mineral wool.............................................................................................................................68
2.9.1 Glass wool ......................................................................................................................68 2.9.2 Stone wool ......................................................................................................................71
2.10 High temperature insulation glass wools (ASW/RCF and AES)..............................................74 2.11 Frits...........................................................................................................................................77
2.11.1 The frits production process ...........................................................................................77 2.11.2 Melting furnaces used in frits production .......................................................................78 2.11.3 Frits as raw material in the production of glazes and enamels .......................................80
3 PRESENT CONSUMPTION AND EMISSION LEVELS ...........................................................81 3.1 Introduction ..............................................................................................................................81 3.2 General overview of the glass industry.....................................................................................82
3.2.1 Process inputs .................................................................................................................82 3.2.2 Process outputs ...............................................................................................................85
3.2.2.1 Emissions to air ......................................................................................................85 3.2.2.2 Emissions to water..................................................................................................89 3.2.2.3 Emissions of other wastes.......................................................................................90
3.2.3 Energy ............................................................................................................................90 3.2.4 Noise...............................................................................................................................96
3.3 Container glass .........................................................................................................................96 3.3.1 Process inputs .................................................................................................................98 3.3.2 Emissions to air ..............................................................................................................99
3.3.2.1 Raw materials .........................................................................................................99 3.3.2.2 Melting ...................................................................................................................99 3.3.2.3 Downstream activities ..........................................................................................111 3.3.2.4 Diffuse/fugitive emissions ....................................................................................112
3.3.3 Emissions to water........................................................................................................112 3.3.4 Other wastes .................................................................................................................113 3.3.5 Energy ..........................................................................................................................113
3.4 Flat glass .................................................................................................................................116 3.4.1 Process inputs ...............................................................................................................116 3.4.2 Emissions to air ............................................................................................................117
3.4.2.1 Raw materials .......................................................................................................117 3.4.2.2 Melting .................................................................................................................117 3.4.2.3 Downstream activities ..........................................................................................119 3.4.2.4 Diffuse/fugitive emissions ....................................................................................120
3.4.3 Emissions to water........................................................................................................120 3.4.4 Other wastes .................................................................................................................120 3.4.5 Energy ..........................................................................................................................121
3.5 Continuous filament glass fibre ..............................................................................................122 3.5.1 Process inputs ...............................................................................................................123 3.5.2 Emissions to air ............................................................................................................124
3.5.2.1 Raw materials .......................................................................................................124 3.5.2.2 Melting .................................................................................................................124 3.5.2.3 Downstream activities ..........................................................................................126 3.5.2.4 Diffuse/fugitive emissions ....................................................................................126
3.5.3 Emissions to water........................................................................................................127 3.5.4 Other wastes .................................................................................................................128 3.5.5 Energy ..........................................................................................................................129
3.6 Domestic glass ........................................................................................................................130

Manufacture of Glass vii
3.6.1 Process inputs............................................................................................................... 132 3.6.2 Emissions to air............................................................................................................ 133
3.6.2.1 Raw materials....................................................................................................... 133 3.6.2.2 Melting ................................................................................................................. 133 3.6.2.3 Downstream activities .......................................................................................... 134 3.6.2.4 Diffuse/fugitive emissions.................................................................................... 135
3.6.3 Emissions to water ....................................................................................................... 135 3.6.4 Other wastes................................................................................................................. 136 3.6.5 Energy.......................................................................................................................... 136
3.7 Special glass ........................................................................................................................... 137 3.7.1 Process inputs............................................................................................................... 138 3.7.2 Emissions to air............................................................................................................ 139
3.7.2.1 Raw materials....................................................................................................... 139 3.7.2.2 Melting ................................................................................................................. 140 3.7.2.3 Downstream activities .......................................................................................... 140 3.7.2.4 Diffuse/fugitive emissions.................................................................................... 140
3.7.3 Emissions to water ....................................................................................................... 141 3.7.4 Other wastes................................................................................................................. 141 3.7.5 Energy.......................................................................................................................... 142
3.8 Mineral wool .......................................................................................................................... 142 3.8.1 Process inputs............................................................................................................... 142 3.8.2 Emissions to air............................................................................................................ 144
3.8.2.1 Raw materials....................................................................................................... 144 3.8.2.2 Melting ................................................................................................................. 145 3.8.2.3 Downstream activities .......................................................................................... 152 3.8.2.4 Diffuse/fugitive emissions.................................................................................... 154
3.8.3 Emissions to water ....................................................................................................... 154 3.8.4 Other wastes................................................................................................................. 155 3.8.5 Energy.......................................................................................................................... 156
3.9 High temperature insulation wools......................................................................................... 157 3.9.1 Process inputs............................................................................................................... 157 3.9.2 Emissions to air............................................................................................................ 158
3.9.2.1 Raw materials....................................................................................................... 158 3.9.2.2 Melting ................................................................................................................. 158 3.9.2.3 Downstream activities .......................................................................................... 158 3.9.2.4 Diffuse/fugitive emissions.................................................................................... 158
3.9.3 Emissions to water ....................................................................................................... 159 3.9.4 Other wastes................................................................................................................. 159 3.9.5 Energy.......................................................................................................................... 159
3.10 Frits ........................................................................................................................................ 160 3.10.1 Process inputs............................................................................................................... 160 3.10.2 Emissions to air............................................................................................................ 161
3.10.2.1 Raw materials....................................................................................................... 161 3.10.2.2 Melting ................................................................................................................. 161 3.10.2.3 Downstream activities .......................................................................................... 163 3.10.2.4 Diffuse/fugitive emissions.................................................................................... 163
3.10.3 Emissions to water ....................................................................................................... 163 3.10.4 Other wastes................................................................................................................. 163 3.10.5 Energy.......................................................................................................................... 164
4 TECHNIQUES TO CONSIDER IN THE DETERMINATION OF BAT................................ 165 4.1 Introduction............................................................................................................................ 165 4.2 Melting technique selection ................................................................................................... 169
4.2.1 Electric melting............................................................................................................ 171 4.2.2 Operation and maintenance of furnaces ....................................................................... 177
4.3 Techniques for materials storage and handling ...................................................................... 179 4.3.1 Techniques for materials storage ................................................................................. 179 4.3.2 Techniques for materials handling ............................................................................... 180
4.4 Techniques for controlling emissions to air from melting activities ...................................... 181 4.4.1 Particulate matter ......................................................................................................... 181
4.4.1.1 Primary techniques............................................................................................... 185 4.4.1.2 Electrostatic precipitators..................................................................................... 190 4.4.1.3 Bag filters ............................................................................................................. 201

viii Manufacture of Glass
4.4.1.4 Mechanical collectors ...........................................................................................210 4.4.1.5 High-temperature filter media ..............................................................................211 4.4.1.6 Wet scrubbers .......................................................................................................212
4.4.2 Nitrogen oxides (NOX) .................................................................................................213 4.4.2.1 Combustion modifications....................................................................................214 4.4.2.2 Batch formulation .................................................................................................221 4.4.2.3 Special furnace designs.........................................................................................222 4.4.2.4 The FENIX process ..............................................................................................224 4.4.2.5 Oxy-fuel melting...................................................................................................226 4.4.2.6 Chemical reduction by fuel (CRF)........................................................................240 4.4.2.7 Selective catalytic reduction (SCR) ......................................................................245 4.4.2.8 Selective non-catalytic reduction (SNCR)............................................................254
4.4.3 Sulphur oxides (SOX) ...................................................................................................258 4.4.3.1 Fuel selection........................................................................................................258 4.4.3.2 Batch formulation .................................................................................................260 4.4.3.3 Dry or semi-dry scrubbing....................................................................................262 4.4.3.4 Wet scrubbers .......................................................................................................273
4.4.4 Fluorides (HF) and chlorides (HCl)..............................................................................276 4.4.4.1 Reduction at source...............................................................................................276 4.4.4.2 Scrubbing techniques............................................................................................278
4.4.5 Oxides of carbon...........................................................................................................279 4.5 Techniques for controlling emissions to air from non-melting activities ...............................279
4.5.1 Container glass .............................................................................................................280 4.5.2 Flat glass.......................................................................................................................281 4.5.3 Continuous filament glass fibre ....................................................................................282 4.5.4 Domestic glass..............................................................................................................282 4.5.5 Special glass .................................................................................................................283 4.5.6 Mineral wool ................................................................................................................283
4.5.6.1 Forming area.........................................................................................................284 4.5.6.2 Curing oven ..........................................................................................................295 4.5.6.3 Product cooling.....................................................................................................300 4.5.6.4 Product machining and packaging ........................................................................300 4.5.6.5 Odours arising from mineral wool production......................................................300
4.5.7 High temperature insulation wools...............................................................................303 4.5.8 Frits...............................................................................................................................305
4.6 Techniques for controlling emissions to water .......................................................................305 4.7 Techniques for minimising other wastes ................................................................................308 4.8 Energy.....................................................................................................................................310
4.8.1 Melting techniques and furnace design ........................................................................311 4.8.2 Combustion control and fuel choice .............................................................................313 4.8.3 Cullet usage ..................................................................................................................314 4.8.4 Waste heat boiler ..........................................................................................................316 4.8.5 Batch and cullet preheating ..........................................................................................318
4.9 Environmental management systems......................................................................................322 5 BAT CONCLUSIONS FOR THE MANUFACTURE OF GLASS............................................326
SCOPE ................................................................................................................................................326 DEFINITIONS .....................................................................................................................................326 General considerations..........................................................................................................................327
Averaging periods and reference conditions for air emissions .........................................................327 Conversion to reference oxygen concentration.................................................................................328 Conversion from concentrations to specific mass emissions ............................................................328 Definitions for certain air pollutants .................................................................................................329 Averaging periods for waste water discharges .................................................................................329
5.1 General BAT conclusions for the manufacture of glass .........................................................330 5.1.1 Environmental management systems ...........................................................................330 5.1.2 Energy efficiency..........................................................................................................331 5.1.3 Materials storage and handling.....................................................................................331 5.1.4 General primary techniques..........................................................................................333 5.1.5 Emissions to water from glass manufacturing processes..............................................335 5.1.6 Waste from the glass manufacturing processes ............................................................337 5.1.7 Noise from the glass manufacturing processes.............................................................337
5.2 BAT conclusions for container glass manufacturing ..............................................................338

Manufacture of Glass ix
5.2.1 Dust emissions from melting furnaces ......................................................................... 338 5.2.2 Nitrogen oxides (NOX) from melting furnaces ............................................................ 338 5.2.3 Sulphur oxides (SOX) from melting furnaces............................................................... 341 5.2.4 Hydrogen chloride (HCl) and hydrogen fluoride (HF) from melting furnaces ............ 341 5.2.5 Metals from melting furnaces ...................................................................................... 342 5.2.6 Emissions from downstream processes........................................................................ 343
5.3 BAT conclusions for flat glass manufacturing....................................................................... 345 5.3.1 Dust emissions from melting furnaces ......................................................................... 345 5.3.2 Nitrogen oxides (NOX) from melting furnaces ............................................................ 345 5.3.3 Sulphur oxides (SOX) from melting furnaces............................................................... 347 5.3.4 Hydrogen chloride (HCl) and hydrogen fluoride (HF) from melting furnaces ............ 348 5.3.5 Metals from melting furnaces ...................................................................................... 348 5.3.6 Emissions from downstream processes........................................................................ 350
5.4 BAT conclusions for continuous filament glass fibre manufacturing .................................... 351 5.4.1 Dust emissions from melting furnaces ......................................................................... 351 5.4.2 Nitrogen oxides (NOX) from melting furnaces ............................................................ 352 5.4.3 Sulphur oxides (SOX) from melting furnaces............................................................... 353 5.4.4 Hydrogen chloride (HCl) and hydrogen fluoride (HF) from melting furnaces ............ 354 5.4.5 Metals from melting furnaces ...................................................................................... 354 5.4.6 Emissions from downstream processes........................................................................ 355
5.5 BAT conclusions for domestic glass manufacturing.............................................................. 356 5.5.1 Dust emissions from melting furnaces ......................................................................... 356 5.5.2 Nitrogen oxides (NOX) from melting furnaces ............................................................ 357 5.5.3 Sulphur oxides (SOX) from melting furnaces............................................................... 358 5.5.4 Hydrogen chloride (HCl) and hydrogen fluoride (HF) from melting furnaces ............ 359 5.5.5 Metals from melting furnaces ...................................................................................... 360 5.5.6 Emissions from downstream processes........................................................................ 362
5.6 BAT conclusions for special glass manufacturing ................................................................. 363 5.6.1 Dust emissions from melting furnaces ......................................................................... 363 5.6.2 Nitrogen oxides (NOX) from melting furnaces ............................................................ 364 5.6.3 Sulphur oxides (SOX) from melting furnaces............................................................... 366 5.6.4 Hydrogen chloride (HCl) and hydrogen fluoride (HF) from melting furnaces ............ 366 5.6.5 Metals from melting furnaces ...................................................................................... 367 5.6.6 Emissions from downstream processes........................................................................ 367
5.7 BAT conclusions for mineral wool manufacturing ................................................................ 369 5.7.1 Dust emissions from melting furnaces ......................................................................... 369 5.7.2 Nitrogen oxides (NOX) from melting furnaces ............................................................ 369 5.7.3 Sulphur oxides (SOX) from melting furnaces............................................................... 371 5.7.4 Hydrogen chloride (HCl) and hydrogen fluoride (HF) from melting furnaces ............ 372 5.7.5 Hydrogen sulphide (H2S) from stone wool melting furnaces....................................... 372 5.7.6 Metals from melting furnaces ...................................................................................... 373 5.7.7 Emissions from downstream processes........................................................................ 373
5.8 BAT conclusions for high temperature insulation wools (HTIW) manufacturing ................. 375 5.8.1 Dust emissions from melting and downstream processes ............................................ 375 5.8.2 Nitrogen oxides (NOX) from melting and downstream processes................................ 376 5.8.3 Sulphur oxides (SOX) from melting and downstream processes.................................. 376 5.8.4 Hydrogen chloride (HCl) and hydrogen fluoride (HF) from melting furnaces ............ 377 5.8.5 Metals from melting furnaces and downstream processes ........................................... 377 5.8.6 Volatile organic compounds from downstream processes ........................................... 378
5.9 BAT conclusions for frits manufacturing............................................................................... 379 5.9.1 Dust emissions from melting furnaces ......................................................................... 379 5.9.2 Nitrogen oxides (NOX) from melting furnaces ............................................................ 379 5.9.3 Sulphur oxides (SOX) from melting furnaces............................................................... 380 5.9.4 Hydrogen chloride (HCl) and hydrogen fluoride (HF) from melting furnaces ............ 381 5.9.5 Metals from melting furnaces ...................................................................................... 381 5.9.6 Emissions from downstream processes........................................................................ 382
Glossary: .............................................................................................................................................. 383 5.10 Description of techniques....................................................................................................... 383
5.10.1 Dust emissions ............................................................................................................. 383 5.10.2 NOX emissions ............................................................................................................. 383 5.10.3 SOX emissions.............................................................................................................. 385 5.10.4 HCl, HF emissions ....................................................................................................... 385 5.10.5 Metal emissions ........................................................................................................... 385

x Manufacture of Glass
5.10.6 Combined gaseous emissions (e.g. SOX, HCl, HF, boron compounds)........................386 5.10.7 Combined emissions (solid + gaseous).........................................................................386 5.10.8 Emissions from cutting, grinding, polishing operations ...............................................387 5.10.9 H2S, VOC emissions.....................................................................................................387 5.10.10 Dust emissions..............................................................................................................387 5.10.11 NOX emissions..............................................................................................................388 5.10.12 SOX emissions ..............................................................................................................389 5.10.13 HCl, HF emissions........................................................................................................389 5.10.14 Metal emissions ............................................................................................................389 5.10.15 Combined gaseous emissions (e.g. SOX, HCl, HF, boron compounds)........................390 5.10.16 Combined emissions (solid + gaseous).........................................................................390 5.10.17 Emissions from cutting, grinding, polishing operations ...............................................391 5.10.18 H2S, VOC emissions.....................................................................................................391
6 EMERGING TECHNIQUES........................................................................................................393 6.1 Glas Flox® high-temperature combustion system...................................................................393 6.2 Advanced cullet and batch preheaters.....................................................................................394
6.2.1 PRECIOUS-project ......................................................................................................394 6.2.2 PRAXAIR-BCP project................................................................................................394
6.3 New product formulations ......................................................................................................396 6.4 Waste injection in the stone wool production process ............................................................397 6.5 Submerged combustion melting technology...........................................................................398 6.6 Flue-gas treatment with dry sodium bicarbonate and chemical valorisation of gas treatment
residues ...................................................................................................................................400 6.7 Application of ceramic and catalytic ceramic filters for the removal of multiple pollutants
from process waste gases........................................................................................................401 6.8 NASU electrostatic precipitator for nanoparticles ..................................................................403 6.9 Charged cloud scrubber ..........................................................................................................405
7 CONCLUDING REMARKS AND RECOMMENDATIONS FOR FUTURE WORK...........407 8 ANNEXES.......................................................................................................................................413
8.1 Annex I: Method of estimation of air pollution control costs and cross-media effects ..........413 8.1.1 Costs included in the economic evaluation...................................................................413 8.1.2 Comparison of costs of different technologies .............................................................415 8.1.3 Air pollution control cost data ......................................................................................416 8.1.4 Distribution of APC costs in combined systems, among more than one pollutant species
......................................................................................................................................416 8.1.5 Cross-media effects ......................................................................................................417 8.1.6 Example cost calculation ..............................................................................................418 8.1.7 Cost data for APC systems applied to glass melting furnaces ......................................420
8.2 Annex II: Example sulphur balances for industrial glass furnaces .........................................435 8.3 Annex III: Emission Monitoring.............................................................................................439
8.3.1 Main pollutants .............................................................................................................439 8.3.2 Monitoring of emissions...............................................................................................440
8.4 Annex IV: Calculation of conversion factors for the determination of mass emissions from concentrations .........................................................................................................................447
GLOSSARY ............................................................................................................................................449 REFERENCES .......................................................................................................................................455

Manufacture of Glass xi
List of tables Table 1.1: Approximate sector-based breakdown of glass industry production for the years 1996 (EU-
15) and 2005 (EU-25)............................................................................................................ 4 Table 1.2: Distribution of container glass installations and production in Member States................... 10 Table 1.3: Number of container glass installations in specified production ranges .............................. 10 Table 1.4: Owners and locations of float tanks in the EU-27 in 2007 .................................................. 14 Table 1.5: Joint ventures of float tanks in the EU-27 in 2007 .............................................................. 14 Table 1.6: Number of float tanks in Member States in 2007 in the EU-27........................................... 14 Table 1.7: Percentage of float capacity in specified ranges .................................................................. 15 Table 1.8: Estimated evolution of the capacity utilisation and surplus float glass production within the
EU-27 .................................................................................................................................. 16 Table 1.9: Number of continuous filament installations and furnaces in Member States..................... 19 Table 1.10: Number of continuous filament furnaces in specified production ranges............................ 19 Table 1.11: Number and distribution of IPPC domestic glass installations in Member States in 2006.. 22 Table 1.12: Number of domestic glass installations in specified production ranges in 2006 (estimated)
............................................................................................................................................. 22 Table 1.13: Special glass sector breakdown for the year 2005 ............................................................... 26 Table 1.14: Geographical distribution of main special glass production in EU...................................... 27 Table 1.15: Investment costs for special glass installations.................................................................... 28 Table 1.16: Number of mineral wool installations in the EU-27 ............................................................ 30 Table 1.17: Number of mineral wool installations in specified production ranges................................. 30 Table 1.18: Distribution of HTIW installations in Member States ......................................................... 33 Table 1.19: Distribution of frits installations with a total capacity of >20 tonnes/day (2008 estimation)
............................................................................................................................................. 36 Table 1.20: Number of frits installations located in Spain in specified production ranges (estimates) .. 36 Table 2.1: Important glass making raw materials ................................................................................. 40 Table 2.2: Elements used to impart colour to silicate glasses ............................................................... 41 Table 2.3: Estimate of EU furnace types in 2005 (for installations >20 t/day)..................................... 46 Table 2.4: Typical container glass composition.................................................................................... 53 Table 2.5: Typical soda-lime silica flat glass composition ................................................................... 57 Table 2.6: Typical E-glass composition for glass fibre products used in general applications............. 60 Table 2.7: Typical E-glass composition for glass fibre yarn products used in printed circuit boards and
aerospace ............................................................................................................................. 60 Table 2.8: Chemical composition of the main products of the special glass sector .............................. 67 Table 2.9: Typical mineral wool compositions..................................................................................... 68 Table 2.10: Typical chemical composition ranges for ASW/RCF and AES, in mass percentage .......... 74 Table 3.1: Common raw materials utilised in the glass industry .......................................................... 83 Table 3.2: Reference conditions of emission data ................................................................................ 86 Table 3.3: Summary of emissions to atmosphere arising from melting activities ................................ 87 Table 3.4: Classification of metals and their compounds ..................................................................... 87 Table 3.5: Potential heavy metal emissions from glass processes without abatement.......................... 88 Table 3.6: Theoretical energy requirements for the melting of common glasses from batch
formulations without cullet recycling .................................................................................. 92 Table 3.7: Examples of energy output distribution for the production of the most common industrial
glasses.................................................................................................................................. 93 Table 3.8: Examples of specific energy consumption for a range of glass furnaces............................. 95 Table 3.9: Overview of major container glass production inputs and outputs...................................... 97 Table 3.10: Materials utilised in the container glass sector .................................................................... 98 Table 3.11: Statistical data on furnace sizes and type from the FEVE survey (2005 values) ............... 100 Table 3.12: Statistical data on total cullet rates for the EU container glass furnaces, reported from the
FEVE survey for different glass colours (2005 values) ..................................................... 101 Table 3.13: Specific melting energy for different furnace types and size ranges from the FEVE survey
(2005 data)......................................................................................................................... 102 Table 3.14: Dust emissions from container glass furnaces with and without abatement systems from the
FEVE survey (reference year 2005) .................................................................................. 104 Table 3.15: SOX emissions from container glass furnaces with and without abatement systems, from the
FEVE survey (reference year 2005) .................................................................................. 106 Table 3.16: NOX emissions from container glass furnaces for different fuel types and furnace
techniques, from the FEVE survey (reference year 2005)................................................. 107 Table 3.17: HCl and HF emissions from container glass furnaces with and without abatement systems,
from the FEVE survey (reference year 2005).................................................................... 108

xii Manufacture of Glass
Table 3.18: Emissions of metals from container glass furnaces with and without abatement systems, from the FEVE survey (reference year 2005) ....................................................................110
Table 3.19: Typical unabated emission values from surface coating activities with tin chloride for container glass....................................................................................................................111
Table 3.20: Typical unabated emission values from surface treatment of container glass with SO3 ....111 Table 3.21: Total direct energy consumption (plant) per net tonne of product from the FEVE survey for
bottle/jars and flaconnage production ................................................................................114 Table 3.22: Materials utilised in the flat glass sector ............................................................................116 Table 3.23: Overview of air pollution control (APC) systems installed in the flat glass sector in Europe
............................................................................................................................................118 Table 3.24: Emission levels from flat glass furnaces with and without abatement systems .................118 Table 3.25: Overview of the continuous filament glass fibre sector inputs and outputs .......................122 Table 3.26: Materials utilised in the continuous filament glass fibre sector .........................................123 Table 3.27: Distribution of boron compounds at different temperatures and treatment stages of the flue-
gases ...................................................................................................................................124 Table 3.28: Emission levels from continuous filament glass fibre furnaces .........................................125 Table 3.29: Overview of domestic glass sector inputs and outputs.......................................................131 Table 3.30: Materials utilised in the domestic glass sector ...................................................................132 Table 3.31: Summary of emissions to air from domestic glass furnaces...............................................134 Table 3.32: Typical concentrations measured in water at discharge point, after treatment...................136 Table 3.33: Materials utilised in the special glass sector.......................................................................138 Table 3.34: Overview of inputs and outputs for example glass ceramic, borosilicate glass tubes and
soda-lime glass lamp bulbs processes ................................................................................139 Table 3.35: Materials utilised in the mineral wool sector......................................................................143 Table 3.36: Waste gas volumes for the main process activities in the mineral wool sector ..................144 Table 3.37: Full range of emissions from mineral wool melting furnaces in the EU-27, for 2005 .......146 Table 3.38: Dust emissions from melting furnaces for glass wool production (year 2005) ..................147 Table 3.39: SOX emissions from melting furnaces for glass wool production (year 2005)...................148 Table 3.40: NOX emissions from melting furnaces for glass wool production (year 2005) ..................148 Table 3.41: HCl, HF and CO emissions from melting furnaces for glass wool production ..................149 Table 3.42: Dust, SOx, NOx, HCl and HF emissions from melting furnaces for stone wool production
(year 2005) .........................................................................................................................150 Table 3.43: Emissions of H2S, CO, CO2 and metals emissions from melting furnaces for stone wool
production (year 2005) .......................................................................................................151 Table 3.44: Full range of emissions from downstream activities in the glass wool production sector for
the year 2005 ......................................................................................................................153 Table 3.45: Full range of emissions from downstream activities in the stone wool production for the
year 2005............................................................................................................................153 Table 3.46: Mineral wool sector solid waste generation and disposal ..................................................156 Table 3.47: Energy use in mineral wool production..............................................................................156 Table 3.48: Materials utilised in the high temperature insulation wools sector ....................................157 Table 3.49: Main raw materials utilised in frit production....................................................................160 Table 3.50: Typical emission levels from melting furnaces for the frits sector ....................................161 Table 3.51: Examples of NOX emission levels from frit production installations operating with different
combustion conditions and batch formulations ..................................................................162 Table 4.1: Information for each technique described in this chapter...................................................166 Table 4.2: Main advantages and disadvantages of electric melting ....................................................173 Table 4.3: Example installation for the application of electric melting in the domestic glass sector
(crystal and lead crystal glass)............................................................................................174 Table 4.4: Example installation for the application of electric melting in the special glass sector .....176 Table 4.5: Main advantages and disadvantages of primary techniques for dust reduction..................189 Table 4.6: Main advantages and disadvantages of electrostatic precipitators .....................................194 Table 4.7: Dust emission levels associated with the use of ESPs for example installations ...............196 Table 4.8: Summary Examples of actual costs of electrostatic precipitators applied to the glass
manufacturing of flat, container, special glass and mineral wool ......................................200 Table 4.9: Main advantages and disadvantages of bag filters .............................................................205 Table 4.10: Examples of actual costs of bag filters applied to the special glass sector in two installations
............................................................................................................................................209 Table 4.11: Main advantages and disadvantages of cyclones ...............................................................211 Table 4.12: Main advantages and disadvantages of high-temperature filters........................................212 Table 4.13: Main advantages and disadvantages of wet scrubbers .......................................................213 Table 4.14: Main advantages and disadvantages of combustion modifications ....................................218

Manufacture of Glass xiii
Table 4.15: Examples of NOX emission levels associated with the application of combustion modifications ..................................................................................................................... 219
Table 4.16: Main advantages and disadvantages of oxy-fuel melting .................................................. 233 Table 4.17: NOX emission levels associated with the use of oxy-fuel melting in example installations
........................................................................................................................................... 234 Table 4.18: Examples of actual and estimated costs of oxy-fuel melting applied to the container and
special glass sectors. .......................................................................................................... 239 Table 4.19: The main advantages and disadvantages of the 3R technique ........................................... 243 Table 4.20: NOX emission levels associated with the use of the SCR technique in example installations
........................................................................................................................................... 248 Table 4.21: Results of discontinuous NOX emissions measurements from a float glass furnace equipped
with SCR ........................................................................................................................... 249 Table 4.22: Main advantages and disadvantages of the SCR technique ............................................... 250 Table 4.23: Cost data associated with the use of SCR technique for example installations producing
container, flat and special glass ......................................................................................... 253 Table 4.24: Plants operating with the SCR technique and operating parameters ................................. 254 Table 4.25: Main advantages and disadvantages of the SNCR technique ............................................ 256 Table 4.26: Indicative ranges of SOX emissions from soda-lime glass furnaces for different fuels ..... 259 Table 4.27: Indicative dry absorption efficiencies with Ca(OH)2......................................................... 266 Table 4.28: Indicative SOX abatement rates for dry scrubbing with Ca(OH)2...................................... 266 Table 4.29: Indicative SOX abatement rates for dry scrubbing with Na2CO3 ....................................... 266 Table 4.30: Actual removal efficiencies of acid gaseous pollutants for dry scrubbing with different type
of absorption reagent and operating conditions ................................................................. 267 Table 4.31: Indicative SOX abatement rates for semi-dry scrubbing with Na2CO3 solution................. 267 Table 4.32: SOX abatement rates for semi-dry scrubbing with Ca(OH)2 .............................................. 267 Table 4.33: Main advantages and disadvantages of dry and semi-dry scrubbing techniques ............... 270 Table 4.34: Emission levels associated with the use of dry scrubbing combined with a filtration system
in example installations ..................................................................................................... 270 Table 4.35: Emission levels associated with the application of wet scrubbing to an electric furnace
producing special glass in an example installation ............................................................ 276 Table 4.36: Solid and gaseous emissions from the forming area of a glass wool installation where a
WESP is used..................................................................................................................... 291 Table 4.37: Main advantages and disadvantages of wet electrostatic precipitators (WESPs) .............. 292 Table 4.38: Main advantages and disadvantages of stone wool filters ................................................. 293 Table 4.39: Main advantages and disadvantages of waste gas incineration ......................................... 298 Table 4.40: General achievable values for emissions to air from non-melting activities in the mineral
wool sector, applying different techniques ........................................................................ 302 Table 4.41: Investment and operating costs of abatement techniques for non-melting activities in the
mineral wool sect ............................................................................................................... 303 Table 4.42: List of potential waste water treatment techniques for use in the glass industry ............... 307 Table 4.43: Typical specific energy consumption values achieved by applying available
techniques/measures for minimising the use of energy ..................................................... 310 Table 4.44: Example installations of waste heat boilers applied in different sectors of the glass industry
........................................................................................................................................... 317 Table 4.45: Example installation for the application of a direct batch and cullet preheater to a container
glass furnace ...................................................................................................................... 321 Table 5.1: Reference conditions for BAT-AELs concerning air emissions ........................................ 327 Table 5.2: Indicative factors used for converting mg/Nm3 into kg/tonne of melted glass based on
energy efficient fuel-air furnaces ....................................................................................... 329 Table 5.3 BAT-AELs for carbon monoxide emissions from melting furnaces ................................. 334 Table 5.4: BAT-AELs for ammonia emissions, when SCR or SNCR techniques are applied ........... 334 Table 5.5: BAT-AELs for waste water discharges to surface waters from the manufacture of glass. 336 Table 5.6: BAT-AELs for dust emissions from the melting furnace in the container glass sector ..... 338 Table 5.7: BAT-AELs for NOX emissions from the melting furnace in the container glass sector .... 340 Table 5.8: BAT-AEL for NOX emissions from the melting furnace in the container glass sector, when
nitrates are used in the batch formulation and/or special oxidising combustion conditions in cases of short campaigns or for melting furnaces with a capacity of <100 t/day............... 340
Table 5.9: BAT-AELs for SOX emissions from the melting furnace in the container glass sector..... 341 Table 5.10: BAT-AELs for HCl and HF emissions from the melting furnace in the container glass
sector.................................................................................................................................. 342 Table 5.11: BAT-AELs for metal emissions from the melting furnace in the container glass sector ... 342 Table 5.12: BAT-AELs for air emissions from hot-end coating activities in the container glass sector
when the flue-gases from downstream operations are treated separately .......................... 343

xiv Manufacture of Glass
Table 5.13: BAT-AEL for SOX emissions from downstream activities when SO3 is used for surface treatment operations in the container glass sector, when treated separately.......................344
Table 5.14: BAT-AELs for dust emissions from the melting furnace in the flat glass sector ...............345 Table 5.15: BAT-AELs for NOX emissions from the melting furnace in the flat glass sector ..............346 Table 5.16: BAT-AEL for NOX emissions from the melting furnace in the flat glass sector, when
nitrates are used in the batch formulation for the production of special glasses in a limited number of short campaigns ................................................................................................347
Table 5.17: BAT-AELs for SOX emissions from the melting furnace in the flat glass sector...............348 Table 5.18: BAT-AELs for HCl and HF emissions from the melting furnace in the flat glass sector ..348 Table 5.19: BAT-AELs for metal emissions from the melting furnace in the flat glass sector, with the
exception of selenium coloured glasses .............................................................................349 Table 5.20: BAT-AELs for selenium emissions from the melting furnace in the flat glass sector for the
production of coloured glass ..............................................................................................349 Table 5.21: BAT-AELs for air emissions from downstream processes in the flat glass sector, when
treated separately................................................................................................................350 Table 5.22: BAT-AELs for dust emissions from the melting furnace in the continuous filament glass
fibre sector..........................................................................................................................351 Table 5.23: BAT-AELs for NOX emissions from the melting furnace in the continuous filament glass
fibre sector..........................................................................................................................352 Table 5.24: BAT-AELs for SOX emissions from the melting furnace in the continuous filament glass
fibre sector..........................................................................................................................353 Table 5.25: BAT-AELs for HCl and HF emissions from the melting furnace in the continuous filament
glass fibre sector.................................................................................................................354 Table 5.26: BAT-AELs for metal emissions from the melting furnace in the continuous filament glass
fibre sector..........................................................................................................................355 Table 5.27: BAT-AELs from downstream processes in the continuous filament glass fibre sector, when
treated separately................................................................................................................355 Table 5.28: BAT-AELs for dust emissions from the melting furnace in the domestic glass sector ......356 Table 5.29: BAT-AELs for NOX emissions from the melting furnace in the domestic glass sector .....357 Table 5.30: BAT-AELs for NOX emissions from the melting furnace in the domestic glass sector, when
nitrates are used in the batch formulation for a limited number of short campaigns or for melting furnaces with a capacity <100 t/day producing special types of soda-lime glasses (clear/ultra-clear glass or coloured glass using selenium) and other special glasses (i.e. borosilicate, glass ceramics, opal glass, crystal and lead crystal).......................................358
Table 5.31: BAT-AELs for SOX emissions from the melting furnace in the domestic glass sector......359 Table 5.32: BAT-AELs for HCl and HF emissions from the melting furnace in the domestic glass
sector ..................................................................................................................................360 Table 5.33: BAT-AELs for metal emissions from the melting furnace in the domestic glass sector with
the exception of glasses where selenium is used for decolourising....................................360 Table 5.34: BAT-AELs for selenium emissions from the melting furnace in the domestic glass sector
when selenium compounds are used for decolourising the glass .......................................361 Table 5.35: BAT-AELs for lead emissions from the melting furnace in the domestic glass sector when
lead compounds are used for manufacturing lead crystal glass..........................................361 Table 5.36: BAT-AELs for air emissions from dusty downstream processes in the domestic glass
sector, when treated separately...........................................................................................362 Table 5.37: BAT-AELs for HF emissions from acid polishing processes in the domestic glass sector,
when treated separately ......................................................................................................362 Table 5.38: BAT-AELs for dust emissions from the melting furnace in the special glass sector .........363 Table 5.39: BAT-AELs for NOX emissions from the melting furnace in the special glass sector ........365 Table 5.40: BAT-AELs for NOX emissions from the melting furnace in the special glass sector when
nitrates are used in the batch formulation...........................................................................365 Table 5.41: BAT-AELs for SOX emissions from the melting furnace in the special glass sector .........366 Table 5.42: BAT-AELs for HCl and HF emissions from the melting furnace in the special glass sector
............................................................................................................................................367 Table 5.43: BAT-AELs for metal emissions from the melting furnace in the special glass sector .......367 Table 5.44: BAT-AELs for dust and metals emissions from downstream processes in the special glass
sector, when treated separately...........................................................................................368 Table 5.45: BAT-AELs for HF emissions from acid polishing processes in the special glass sector ...368 Table 5.46: BAT-AELs for dust emissions from the melting furnace in the mineral wool sector ........369 Table 5.47: BAT-AELs for NOX emissions from the melting furnace in the mineral wool sector .......370 Table 5.48: BAT-AELs for NOX emissions from the melting furnace in glass wool production when
nitrates are used in the batch formulation...........................................................................370 Table 5.49: BAT-AELs for SOX emissions from the melting furnace in the mineral wool sector ........371
Manufacture of Glass xv
Table 5.50: BAT-AELs for HCl and HF emissions from the melting furnace in the mineral wool sector........................................................................................................................................... 372
Table 5.51: BAT-AELs for H2S emissions from the melting furnace in stone wool production.......... 372 Table 5.52: BAT-AELs for metal emissions from the melting furnace in the mineral wool sector...... 373 Table 5.53: BAT-AELs for air emissions from downstream processes in the mineral wool sector, when
treated separately ............................................................................................................... 374 Table 5.54: BAT-AELs for dust emissions from the melting furnace in the HTIW sector .................. 375 Table 5.55: BAT-AELs from dusty downstream processes in the HTIW sector, when treated separately
........................................................................................................................................... 376 Table 5.56: BAT-AELs for NOX emissions from the lubricant burn-off oven in the HTIW sector ..... 376 Table 5.57: BAT-AELs for SOX emissions from the melting furnaces and downstream processes in the
HTIW sector ...................................................................................................................... 376 Table 5.58: BAT-AELs for HCl and HF emissions from the melting furnace in the HTIW sector...... 377 Table 5.59: BAT-AELs for metal emissions from the melting furnace and/or downstream processes in
the HTIW sector ................................................................................................................ 377 Table 5.60: BAT-AELs for VOC emissions from the lubricant burn-off oven in the HTIW sector, when
treated separately ............................................................................................................... 378 Table 5.61: BAT-AELs for dust emissions from the melting furnace in the frits sector ...................... 379 Table 5.62: BAT-AELs for NOX emissions from the melting furnace in the frits sector ..................... 380 Table 5.63: BAT-AELs for SOX emissions from the melting furnace in the frits sector ...................... 381 Table 5.64: BAT-AELs for HCl and HF emissions from the melting furnace in the frits sector.......... 381 Table 5.65: BAT-AELs for metal emissions from the melting furnace in the frits sector .................... 382 Table 5.66: BAT-AELs for air emissions from downstream processes in the frits sector, when treated
separately ........................................................................................................................... 382 Table 6.1: Environmental performance overview for catalytic ceramic filter installations ................ 402 Table 7.1: Split views ......................................................................................................................... 409 Table 8.1: Indirect emissions related to the consumption of chemicals and electricity ...................... 418 Table 8.2: Example cost calculation (ESP plus Ca(OH)2 scrubber) for a 700 tonnes/day.................. 418 Table 8.3: Estimated costs for air pollution control systems with electrostatic precipitators plus dry
scrubbing, applied to the flue-gases of glass melting furnaces .......................................... 421 Table 8.4: Estimated costs for air pollution control systems with bag filters plus scrubbing, applied to
the flue-gases of glass melting furnaces ............................................................................ 423 Table 8.5: Comparison of methods for the removal of SOX, HCl, HF and other gaseous pollutants from
flue-gases of glass melting furnaces .................................................................................. 425 Table 8.6: Overview of specific costs for different air pollution control (APC) techniques applied to
glass furnaces for the abatement of dust and SOX ............................................................. 427 Table 8.7: Estimated example costs and associated direct and indirect emissions associated with the
application of primary measures for NOX emissions reduction ......................................... 429 Table 8.8: Estimated example costs for the application of secondary measures for NOX emissions
reduction ............................................................................................................................ 431 Table 8.9: Additional costs associated with the application of DeNOX techniques (in EUR/tonne
melted glass) ...................................................................................................................... 432 Table 8.10: Estimated specific indirect emissions per tonne melted glass for different glass furnaces and
for different air pollution control (APC) techniques.......................................................... 433 Table 8.11: Raw materials and typical sulphur content in the mineral wool manufacturing production
........................................................................................................................................... 437 Table 8.12: Typical SO3 content of common cullet types..................................................................... 437 Table 8.13: Main pollutants likely to be considered for measurement in the glass industry ................ 439 Table 8.14: Continuous monitoring techniques .................................................................................... 443 Table 8.15: Mass flow thresholds for continuous monitoring of emissions.......................................... 443 Table 8.16: Discontinuous monitoring techniques................................................................................ 444 Table 8.17: Example of detection limit values for the measurement of emissions from glass melting
furnaces.............................................................................................................................. 446 Table 8.18: Example of detection limit values and expanded uncertainties for the measurement of
emissions in the glass industry sector ................................................................................ 446

xvi Manufacture of Glass
List of figures Figure 1.1: Graph on production development by sector (data from 2004 onwards refer to ....................4 Figure 1.2: Most popular high temperature insulation wools for above 600 °C and up to 1800 °C.......34 Figure 2.1: A cross-fired regenerative furnace .......................................................................................47 Figure 2.2: Cross-section of a regenerative furnace ...............................................................................48 Figure 2.3: Single pass end-fired regenerative furnace...........................................................................48 Figure 2.4: Plan view of an end-fired regenerative furnace....................................................................49 Figure 2.5: Blow and blow forming and press and blow forming ..........................................................55 Figure 2.6: The float glass process .........................................................................................................58 Figure 2.7: The rolled glass process .......................................................................................................59 Figure 2.8: The pressing process for the formation of glass articles.......................................................63 Figure 2.9: The spinning process for the formation of glass articles ......................................................63 Figure 2.10: A typical glass wool plant ....................................................................................................68 Figure 2.11: Typical glass wool process water circuit..............................................................................70 Figure 2.12: A typical stone wool plant....................................................................................................71 Figure 2.13: A typical hot blast cupola furnace........................................................................................72 Figure 2.14: Parallel blowing method.......................................................................................................75 Figure 2.15: Horizontal blowing method..................................................................................................75 Figure 2.16: Spinning process ..................................................................................................................75 Figure 2.17: Schematic representation of the frits production process .....................................................77 Figure 2.18: Schematic representation of typical melting furnaces for frits production with oxygen-
enriched fuel/air combustion and heat recovery...................................................................79 Figure 2.19: Schematic representation of typical melting furnaces for frits production with oxy-fuel
combustion ...........................................................................................................................79 Figure 3.1: Typical water distribution in a container glass plant ............................................................89 Figure 3.2: Trend curves for the total melting energy in flaconnage production from the FEVE survey
(2005 data–primary energy for electric boosting or oxygen production is not included)...103 Figure 3.3: Energy usage in a typical bottle/jar container glass plant (not representative of
perfume/cosmetic ware production) ...................................................................................113 Figure 3.4: Mean energy consumptions in glass container furnaces expressed in GJ/tonne melted glass
and standardised to 50 % cullet (2005) ..............................................................................115 Figure 3.5: Energy usage distribution for a typical float glass process.................................................121 Figure 3.6: Example of water balance for a continuous filament glass fibre installation .....................128 Figure 3.7: Direct energy usage in a typical continuous filament glass fibre production process ........129 Figure 3.8: Energy usage in soda-lime-silica glass tableware production ............................................137 Figure 3.9: Expected concentration of SO2 depending on the percentage of cement briquettes recycled
with the batch charge in the cupola furnace .......................................................................145 Figure 4.1: Electrostatic precipitator ....................................................................................................191 Figure 4.2: Results of dust emissions (monthly spot measurements) from an oil-fired float glass furnace
equipped with an ESP and dry scrubbing with Ca(OH)2....................................................195 Figure 4.3: Specific costs per tonne molten glass for air pollution control by dry scrubbing and filters,
with total disposal of filter dust, for float glass furnaces depending on melting pull ........198 Figure 4.4: Bag (fabric) filter scheme...................................................................................................202 Figure 4.5: Estimated costs for dry scrubbers in combination with bag filters for container glass
furnaces, assuming a complete filter dust disposal and 25 % SOX removal.......................208 Figure 4.6: NOX emissions from the FENIX process ...........................................................................225 Figure 4.7: Difference in specific melting costs after conversion from conventional furnaces to oxygen-
firing for different glass production installations (container, float,continuous filament glass fibre and tableware)............................................................................................................237
Figure 4.8: Variation of NOX concentration over time for a float glass furnace equipped with SCR ..248 Figure 4.9: Continuous improvement in an EMS model ......................................................................323 Figure 6.1: Schematic diagram of the advanced batch and cullet preheater .........................................395 Figure 6.2: Schematic diagram of the submerged combustion melter..................................................398 Figure 6.3: Schematic representation of a sonic jet charger .................................................................404 Figure 6.4: Schematic diagram of the charged cloud scrubber system.................................................405 Figure 8.1: Sulphur balance for a float glass furnace with complete filter dust recycling....................436 Figure 8.2: Sulphur balance for a container glass furnace with partial filter dust recycling.................436 Figure 8.3: Schematic sulphur balance for an oxy-fuel glass wool furnace with filter dust recycling .438

Scope
Manufacture of Glass xvii
SCOPE This BREF for the Manufacture of Glass covers the following activities within the scope of Annex I of Directive 2010/75/EU:
• 3.3: Manufacture of glass including glass fibre with a melting capacity exceeding 20 tonnes per day;
• 3.4: Melting mineral substances including the production of mineral fibres with a melting capacity exceeding 20 tonnes per day.
Other reference documents which are of relevance for the sector covered in this document are the following:
• Emissions from Storage BREF (EFS) for storage and handling of materials; • Energy Efficiency BREF (ENE) for general energy efficiency aspects; • Economic and Cross-Media Effects BREF (ECM) for economic and cross-media effects • General Principles of Monitoring BREF (MON) for emissions and consumption
monitoring.
The following activities are not within the scope of this BREF:
• Production of water glass, covered by the reference document Large Volume Inorganic Chemicals-Solids and Other Industry (LVIC-S)
• Production of polycrystalline wool • Production of mirrors, covered by the reference document Surface Treatment Using
Organic Solvents (STS)
The scope of the BREF does not include matters that only concern safety in the workplace or the safety of products because these matters are not covered by the Directive. They are discussed only where they affect matters within the scope of the Directive.

Chapter 1
Manufacture of Glass 1
1 GENERAL INFORMATION 1.1 Structure of the industry The types of activities falling under the scope of this document vary widely in scale, the techniques employed, and the associated environmental issues. When determining whether an installation falls within the definitions in Annex I, the aggregated capacity of each melting activity at the installation is considered. For the purposes of this document, the melting capacity criterion of 20 tonnes per day should be used to relate to the mass of the melt produced. This approach is not intended to prejudge the interpretation of the definition in the Directive, rather it is intended to ensure that the information provided is consistent with the standard terminology used within the glass industry. For the purposes of this document, the industrial activities falling within the definitions in Sections 3.3 and 3.4 of Annex I of Directive 2010/75/EU will be referred to as ‘the glass industry’, which is comprised of eight sectors. These sectors are based on the products manufactured, but inevitably there is some overlap between them. The eight sectors are: 1. Container glass 2. Flat glass 3. Continuous filament glass fibre 4. Domestic glass 5. Special glass (without water glass) 6. Mineral wool (with two divisions, glass wool and stone wool) 7. High temperature insulation wools (excluding polycrystalline wool) 8. Frits. The high temperature insulation wool (HTIW) manufacturing sector differs significantly from the other sectors of the glass industry. The typical production of the installations is between 5 – 10 tonnes/day, therefore below the tonnage requirement of 20 tonnes/day set by the Directive. However, the sector fully supports the objectives of the BREF and for that reason it is included in the GLS BREF. Polycrystalline wool production, which is obtained by a sol-gel method from aqueous spinning solutions, and does not undergo a high-temperature melting process, is not covered in this document due to the particular characteristics of the product. Water glass production is now covered in the Large Volume Inorganic Chemicals – Solids and Others Industry (LVIC-S) BREF. [138, EC 2007]
In addition to the basic manufacturing activities, this document covers the directly associated activities which could have an effect on emissions or pollution. Thus this document includes activities from the receipt of raw materials through the production of any intermediates to the dispatch of finished products. Certain activities are not covered because they are not considered to be directly associated with the primary activity. For example, the subsequent processing of flat glass into other products (e.g. double glazing or automotive products) is not covered. Again, this approach is not intended to prejudge the interpretation of the Directive by Member States. The activities covered include:
Chapter 1
2 Manufacture of Glass
• raw materials handling and storage • mixing and transfer • melting and refining • forming (e.g. float bath, rolling, pressing, blowing, fiberising, frits quenching) • conditioning (e.g. lehr, annealing, tempering) • coating, including binder and lubricant application • surface treatments (e.g. acid polishing) • curing and drying activities • milling • machining, cutting and packaging • waste storage, handling, and processing.
1.2 Introduction [19, CPIV 1998] [27, EURIMA 1998] [63, CPIV Annual report 2007] [65, GEPVP-Proposals for GLS revision 2007] [68, Domestic Glass Data update 2007] [69, EURIMA data collection 2007]
The glass industry within the European Union (EU) is extremely diverse, both in the products made and the manufacturing techniques employed. Products range from intricate handmade lead crystal goblets to the huge volumes of float glass produced for the construction and automotive industries. Manufacturing techniques vary from the small electrically-heated furnaces in the high temperature insulation wools (HTIW) sector to the cross-fired regenerative furnaces in the flat glass sector, producing up to 1 000 tonnes per day. The wider glass industry also includes many smaller installations that fall below the 20 tonnes per day threshold. However, for some of the statistical data given in this chapter, it has not been possible to separate out the contribution from the smaller plants, but this is not considered significant since they account for less than 5 % of the total industry output. The glass industry is essentially a commodity industry, although many ways of adding value to high volume products have been developed to ensure the industry remains competitive. Over 80 % of the industry output is sold to other industries, and the glass industry as a whole is very dependent on the building, and the food and beverage industries. However, this general picture is not true for all of its components, as some of the smaller volume sectors produce high-value technical or consumer products. In the late 1990s, the glass industry continued a period of reorganisation. In order to reduce costs and compete more effectively in a global market, and to benefit from economies of scale, companies merged together and the number of independent operators fell. The groups that dominate the industry became more international in their operations, and users increasingly required homogeneous quality, regardless of the country where the products were used. The EU glass industry was at the forefront of technological developments and thus was likely to benefit from improved industrial performance in future years. With the notable exception of Saint-Gobain, there are, at the time of writing, few major companies operating in more than two of the eight sectors specified in the previous section. For example, the Owens Corning Corporation specialises in glass fibre technology, continuous filament glass fibre and glass wool. PPG is a large international producer of flat glass and continuous filament glass fibre, but is no longer active in flat glass manufacturing in Europe and operates only continuous filament glass fibre plants. Pilkington Group specialises mainly in flat glass activities. The major environmental challenges for the glass industry are emissions to air and energy consumption. Glass making is a high temperature, energy intensive activity, resulting in the emissions of products from combustion and the high-temperature oxidation of atmospheric

Chapter 1
Manufacture of Glass 3
nitrogen; i.e. sulphur dioxide, carbon dioxide, and oxides of nitrogen. Furnace emissions also contain dust arising mainly from the volatilisation and subsequent condensation of volatile batch materials. From data provided by the glass industry, it is estimated that in 2005, the emissions to air consisted of 6 500 tonnes of dust; 105 000 tonnes of NOX; 80000 tonnes of SO2; and 22 million tonnes of CO2 (direct emissions). This amounted to around of 0.8 % of total EU emissions. [158, EEA – NEC report 2008]. Total energy consumption by the glass industry was approximately 311 PJ (86.5 million MWh). Of the total energy, 15 % is consumed as electricity, 30 % as fuel oil and 55 % as natural gas. The different strategies and energy policies of the Member States can have a direct impact on the quantity and quality of the air emissions associated with the production cycle (e.g. NOX,SOX emissions from fuel oil or natural gas). Emissions to the water environment are relatively low and there are few major issues that are specific to the glass industry. However, there are water pollution issues in some sectors and these are covered in the specific sections of this document. Solid waste levels are also generally very low, and many initiatives have been implemented for reducing waste generation, and for recycling in-house and post-consumer waste. In general, the raw materials for glass making are readily available, relatively harmless, natural or man-made substances. There are no major environmental problems associated with the provision of raw materials and waste levels are usually very low. Many of the sectors within the glass industry utilise large continuous furnaces with typical lifetimes of 10 – 12 years and in some cases up to 20 years or more. These furnaces represent a large capital commitment and the continuous operation of the furnace and the periodic rebuilds provide a natural cycle of investment in the process. Major changes of melting technology are most economically implemented if they coincide with furnace rebuilds. This can also be true for complex secondary abatement measures that must be correctly sized and any necessary gas conditioning implemented. However, many improvements to the operation of the furnace, including the installation of secondary techniques, are possible during the operating campaign. For smaller furnaces with more frequent rebuilds and lower capital costs, the advantages of coordinating environmental improvements and furnace repairs are less significant, but environmental improvements may be more economical if coordinated with other investments. The total production of the glass industry within the EU-15 in 1996 was estimated at 29 million tonnes (excluding HTIW and frits). In 2005, the total production within the EU-25 was approximately 37.7 million tonnes, including all the sectors. An indicative breakdown by sector is given in Table 1.1 below. There was a steady growth in the overall volume of production over the period 1997 – 2005. However, the growth and/or fluctuation of each sector has been different and will be discussed later in this document. The global recession has significantly reduced production levels in most sectors from 2008 onwards.
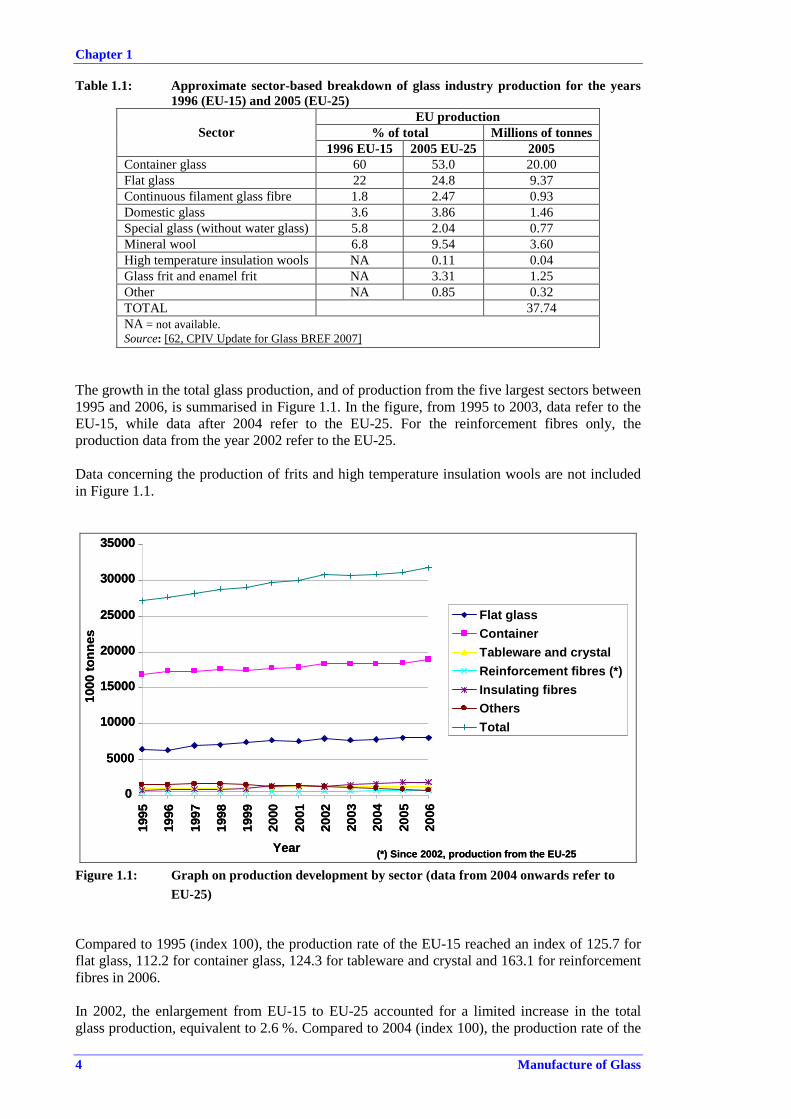
Chapter 1
4 Manufacture of Glass
Table 1.1: Approximate sector-based breakdown of glass industry production for the years 1996 (EU-15) and 2005 (EU-25)
EU production % of total Millions of tonnes Sector
1996 EU-15 2005 EU-25 2005 Container glass 60 53.0 20.00 Flat glass 22 24.8 9.37 Continuous filament glass fibre 1.8 2.47 0.93 Domestic glass 3.6 3.86 1.46 Special glass (without water glass) 5.8 2.04 0.77 Mineral wool 6.8 9.54 3.60 High temperature insulation wools NA 0.11 0.04 Glass frit and enamel frit NA 3.31 1.25 Other NA 0.85 0.32 TOTAL 37.74 NA = not available. Source: [62, CPIV Update for Glass BREF 2007]
The growth in the total glass production, and of production from the five largest sectors between 1995 and 2006, is summarised in Figure 1.1. In the figure, from 1995 to 2003, data refer to the EU-15, while data after 2004 refer to the EU-25. For the reinforcement fibres only, the production data from the year 2002 refer to the EU-25. Data concerning the production of frits and high temperature insulation wools are not included in Figure 1.1.
0
5000
10000
15000
20000
25000
30000
35000
1995
1996
1997
1998
1999
2000
2001
2002
2003
2004
2005
2006
Year
1000
tonn
es
Flat glassContainer Tableware and crystalReinforcement fibres (*) Insulating fibres Others Total
(*) Since 2002, production from the EU-25
0
5000
10000
15000
20000
25000
30000
35000
1995
1996
1997
1998
1999
2000
2001
2002
2003
2004
2005
2006
Year
1000
tonn
es
Flat glassContainer Tableware and crystalReinforcement fibres (*) Insulating fibres Others Total
(*) Since 2002, production from the EU-25
Figure 1.1: Graph on production development by sector (data from 2004 onwards refer to EU-25)
Compared to 1995 (index 100), the production rate of the EU-15 reached an index of 125.7 for flat glass, 112.2 for container glass, 124.3 for tableware and crystal and 163.1 for reinforcement fibres in 2006. In 2002, the enlargement from EU-15 to EU-25 accounted for a limited increase in the total glass production, equivalent to 2.6 %. Compared to 2004 (index 100), the production rate of the

Chapter 1
Manufacture of Glass 5
EU-25 reached an index of 105.1 for flat glass, 105.7 for container glass, 92.4 for tableware and crystal and 114.9 for reinforcement fibres in 2006 [63, CPIV Annual report 2007].
The output from the different sectors is very diverse and the links between the sectors are at times tenuous. However, the common thread linking all of the activities discussed in this document is the melting of inorganic materials to form a molten glass, or glass-like substance which is then formed into products. In many ways each of the sectors of the glass industry is a separate industry in its own right, each producing very different products for different markets and facing different challenges. Sections 1.3 to 1.10 of this chapter give a brief overview of each of the sectors and outline some of the important factors that affect each. Where possible, the information is presented in a comparable way for each sector. The differing structures, organisation and priorities of each sector mean that the information sometimes varies in detail and in nature. This is to be expected because the relative importance of certain parameters will differ from sector to sector.
1.2.1 Characteristics of glass [22, Schott 1996]
The term ‘glass’ does not have a convenient simple definition. In its broadest sense, glass is a collective term for an unlimited number of materials of different compositions in a glassy state. More specifically, the term is used to relate to a state of inorganic matter which may be likened to a solid, but which has the properties of a highly viscous liquid, exhibiting neither a crystalline structure nor a distinct melting point, i.e. a super-cooled liquid. In the glass industry, the term is usually used to refer to silicate glasses, substances containing a high proportion of silica (SiO2)and which naturally form glass under normal conditions of cooling from the molten state. Glasses are structurally similar to liquids, but at ambient temperatures they react to the impact of force with elastic deformation and so must also be considered to behave as solids. The use of the term glass is generally restricted to inorganic substances and is not used in connection with organic materials such as transparent plastics. Various chemical materials can form a vitreous structure; such as the oxides of silicon, boron, germanium, phosphorus and arsenic. When cooled quickly from the molten state, they solidify without crystallisation to form glasses. These glass formers exhibit the same behaviour when mixed with other metallic components within certain compositional limits. The addition of these glass network modifiers, the most common being alkali-oxides as fluxing agents (sodium, potassium, lithium, etc.), alkaline earth metal oxides (calcium, magnesium, barium, strontium, etc.), other metal glass modifiers (i.e. aluminium oxide), changes the bonding relationships and structural groupings, resulting in changes in the physical and chemical properties of the glass. The glassy state is not limited to oxides and can also be observed when certain sulphur and selenium compounds are rapidly cooled. Under extreme conditions, glass can be made from some oxide-free metallic alloys, and many organic liquids transform into a glassy state at low temperatures (e.g. glycerine at -90 °C). Glasses are energetically unstable in comparison with a crystal of the same chemical composition. In general, when cooling a melted substance, crystallisation begins when the temperature falls below the melting point. In glass this does not occur because the molecular building blocks (SiO4 tetrahedrons in silicate glass) are spatially cross-linked to one other. To form crystals, these linkages must first be broken so that crystal nuclei can form. This can only occur at lower temperatures, but at these temperatures the viscosity of the melt impedes the restructuring of the molecules and the growth of crystals. In general, the tendency to crystallise (devitrification) decreases with an increasing rate of cooling (within the critical temperature range below the melting point) and with the number and type of different components in the formulation.

Chapter 1
6 Manufacture of Glass
The mechanical properties of glass are rather specific. The actual tensile strength of glass is several hundred times lower than the theoretical value calculated from chemical bond energies. The tensile strength is heavily dependent on the surface condition of the glass and the presence of internal defects. Treatments such as coating, fire polishing and prestressing can greatly improve the tensile strength but it still remains far below the theoretical value. Many glass formulations are also susceptible to breaking under rapid temperature changes. There are several reasons for this: principally poor heat conductivity, the relatively high thermal expansion coefficient of alkali-rich glasses, and limited tensile strength. Glasses are divided into two categories; those with a thermal expansion coefficient below 6 x 10⁻⁶/K are termed ‘hard glasses’, and those with a higher thermal expansion coefficient are termed ‘soft glasses’.
1.2.2 Broad classification of glass types [22, Schott 1996] [100, ICF BREF revision 2007]
Glass is a substance of variable composition, which for simplicity is expressed by convention in terms of the relative proportions of the oxides of the constitutive elements (SiO2, Na2O, CaO, B2O3, etc.) though these do not exist as such in the glass. The most widely used classification of glass type is by chemical composition, which gives rise to four main groupings: soda-lime glass, lead crystal and crystal glass, borosilicate glass and special glass. The first three of these categories account for over 95 % of all glass produced. The thousands of special glass formulations produced mainly in small amounts account for the remaining 5 %. With very few exceptions, most glasses are silicate based, the main component of which is silicon dioxide (SiO2). Stone wool is an exception to this classification of glass types in that the typical chemical composition does not fit into any of these categories. A typical stone wool composition is presented in Table 2.9. Soda-lime glasses The vast majority of industrially produced glasses have very similar compositions and are collectively called soda-lime glasses. A typical soda-lime glass composition can be expressed as 71 – 75 % silicon dioxide (SiO2 derived mainly from sand), 12 – 16 % sodium oxide (‘soda’ Na2O from soda ash - Na2CO3), 10 – 15 % calcium oxide (‘lime’ CaO from limestone - CaCO3)and low levels of other components designed to impart specific properties to the glass. In some compositions, a portion of the calcium oxide or sodium oxide is replaced with magnesium oxide (MgO) and potassium oxide (K2O) respectively. More detailed glass compositions are given in Chapter 2, in the relevant sections. Soda-lime glass is used for bottles, jars, flaconnage (perfumery and cosmetics), everyday tableware and window glass. The widespread use of soda-lime glass results from its chemical and physical properties. Amongst the most important of these properties is the excellent light transmission of soda-lime glass, hence its use in flat glass and transparent articles. It also has a smooth, non-porous surface that is largely chemically inert, and so is easily cleaned and does not affect the taste of the contents. The tensile and thermal performances of the glass are sufficient for these applications, and the raw materials are comparatively cheap and economical to melt. The higher the alkali content of the glass, the higher the thermal expansion coefficient and the lower the resistance to thermal shock and chemical attack. Soda-lime glasses are not generally suited to applications involving extreme or rapid changes in temperature.
Chapter 1
Manufacture of Glass 7
Lead crystal and crystal glass Lead oxide can be used to replace much of the calcium oxide in the batch to produce a glass known popularly as lead crystal. A typical composition is 54 – 65 % SiO2, 25 – 30 % PbO (lead oxide), 13 – 15 % Na2O or K2O, plus other various minor components. This type of formulation, with a lead oxide content of over 24 %, produces glass with a high density and refractive index, and thus excellent brilliance and sonority, as well as excellent workability allowing a wide variety of shapes and decorations. Typical products are high-quality drinking glasses, decanters, bowls and decorative items. Lead oxide can be partially or totally replaced by barium, zinc or potassium oxides in glasses known as crystal glass that have a lower brilliance or density than lead crystal. Precise definitions associated with chemical and physical characteristics are set out in the Council Directive 69/493/EEC on the approximation of the laws of the member States relating to crystal glass. Borosilicate glasses Borosilicate glasses can be considered to incorporate boron and silicon oxides. A typical composition is 70 – 80 % SiO2, 7 – 15 % B2O3, 4 – 8 % Na2O or K2O, and 2 – 7 % Al2O3(aluminium oxide). Glasses with this composition show a high resistance to chemical corrosion and temperature change (low thermal expansion coefficient). Applications include chemical process components, laboratory equipment, pharmaceutical containers, lighting, cookware, and oven doors and hobs. Many of the borosilicate formulations are for low volume technical applications and are considered to fall into the special glass category. A further application of borosilicate glass is the production of glass fibre, both continuous filaments and glass wool insulation. In addition to the chemical resistance and low thermal expansion coefficient, the boron trioxide is important in the fiberisation of the glass melt. Typical compositions for glass fibre differ from the composition above. For example, the composition of E-glass is SiO2: 52 – 56 %, earth alkali oxides: 16 – 25 %, B2O3: 5 – 10 %, Al2O3: 12 – 16 % plus other minor components. It should also be noted that for continuous filament glass fibre, new low-boron/boron-free formulations are becoming more important. Special glasses This is an extremely diverse grouping, which covers the specialised low volume, high-value products, the compositions of which vary very widely depending on the required properties of the products. Some of the applications include: specialist borosilicate products; optical glass, glass for electrotechnology and electronics; cathode ray tubes; fused silica items; glass seals; X-ray tubes; glass solders; LCD panels, sintered glass; electrodes; and glass ceramics. More information on technical glass formulations is given in Chapter 2.
1.2.3 Historical origins [19, CPIV 1998][22, Schott 1996]
Glassy materials do occur naturally, for example, obsidian is often found in volcanic areas and has a composition comparable to man-made glass. This material, which consists mainly of silicon dioxide, and sodium and calcium compounds, was used by early man to make arrowheads, spearheads and knives. Other natural forms of glass are tektites, formed by the solidification of molten rock sprayed into the atmosphere when meteorites hit the surface of the earth; and fulgurites, formed when lightning hits sand. Although it is not known when glass was first produced artificially, the oldest finds date back to around 3500 BC. It is thought that glass making originated in Egypt and Mesopotamia, but developed later and independently in China, Greece and Northern Tyrol. Ancient glass manufacture is believed to be linked with the production of ceramics or bronze, where it could have originated as a by-product. Its early uses were as jewellery and for small vessels. Production began to increase significantly from around 1500 BC when larger and more utilitarian items (bowls, containers and cups) were made by moulding glass around a sand or

Chapter 1
8 Manufacture of Glass
clay core. The first major technical revolution in the manufacture of glass occurred in the first century AD in Palestine or in Syria with the discovery of the glass blowing pipe. This technique involved taking molten glass on to the end of the blowpipe into which the artisan blew to form a hollow body. This technique allowed the production of a wide variety of shapes and spread across the whole occident, e.g. Italy and France. Glass manufacturing in Europe developed further in the middle ages, and Venice became the European centre of glass art. In the 14th century, glass workshops were set up all over the continent and at the same time the manufacture of flat glass for glazing developed in France. For centuries, window glass was blown with a glassblowing pipe into large cylindrical bodies, cut up and ironed flat while still hot. Only limited glass quantities could be handled and the window glass was very small. The new technique consisted of blowing a glass sphere with a pipe, which was then opened at the end, opposite where the glass was attached to the pipe, and spun flat. After the discovery of the plate pouring process in 1688 under Louis XIV, large surface mirrors could be created. At the same time, English glass manufacturers developed lead crystal, yielding a glass of high brilliance and pure ring. In the 18th century, some factories were already producing more than one million bottles per year (around 3 tonnes/day), by manual mouth-blown techniques. During the industrial revolution of the 19th century, technical progress accelerated: furnaces were heated with coal instead of wood; the first automatic machines were used; and blowing was done using compressed air in metallic moulds. At the end of the 19th century, the continuous furnace was invented by Friedrich Siemens, allowing large-scale continuous production and the use of machinery. Two important steps were taken in the 20th century: the full mechanisation of bottle manufacture with the introduction of the first automatic individual section (IS) machine around 1920, and the invention of the float process for flat glass in 1962. Today, the production of an IS machine can be above 500 bottles/minute and the production of float can be up to 1 000 tonnes/day.

Chapter 1
Manufacture of Glass 9
1.3 Container glass 1.3.1 Sector overview [19, CPIV 1998] [62, CPIV Update for Glass BREF 2007] [64, FEVE 2007] [125, FEVE 2009]
Container glass is the largest sector of the EU glass industry, representing between 50 and 60 % of the total glass production, depending on the reference year. The sector covers the production of glass packaging, i.e. bottles and jars used for packaging food, drink, cosmetics and perfumes, pharmaceuticals and technical products. In 2005, the sector produced 20 million tonnes of container glass from the furnaces operating in the EU-25 and a total of 21 million tonnes in the EU-27. An increase was observed in 2006 and 22 million tonnes were produced in 2007 in the EU-27. On average, in the EU-15, the output has risen yearly by 0.9 %. The production figures for 2007 confirm an upward trend in growth in the glass industry leading to a 4 % increase in that year. However, the financial crisis and the resulting contraction of consumer demand lead in 2008 and 2009 to reductions in production capacity by temporary or permanent closures of furnaces and/or production lines. More importantly it has seriously reduced the industry’s ability to access capital and investment. At the time of writing (2010), there are approximately 70 companies with 170 installations and the sector directly employs approximately 40 000 people. Container glass is produced in 19 of the 27 Member States (see Table 1.2). The EU-27 output is now accounted for by some large groups (Ardagh Glass, BA Vidro, O-I Europe, Saint-Gobain, Vetropack and Vidrala) and many smaller independent companies and groups which continue to compete effectively, due to the existence of regional and niche markets. Europe is the largest producer of container glass, followed by the US and Japan. The geographical distribution of the sector, with an indication of the share of production for the main Member States is shown in Table 1.2.

Chapter 1
10 Manufacture of Glass
Table 1.2: Distribution of container glass installations and production in Member States
Member State Number of installations
Distribution of EU production in
tonnes x 103 (1)
Distribution of EU production % (1)
2005 2006 2007 2005 2006 2007Germany 39 3895 3886 4080 19 19 19France 24 3784 3828 3722 18 18 17Italy 32 3543 3549 3621 17 17 17Spain 20 2144 2148 2222 10 10 10United Kingdom 13 2081 2160 2244 10 10 10Poland 17 1088 1120 1230 5 5 6Portugal 6 1024 1096 1231 5 5 6The Netherlands 5Austria 3Czech Republic 5Belgium 2Greece 2Denmark 1Sweden 1Estonia 1 Finland (2) 1Hungary 1Slovakia 1 Romania 1Latvia 0Lithuania 0Cyprus 0Bulgaria 0Ireland 0Slovenia 0Malta 0Luxembourg 0Subtotal ‘Others’ (3) 3164 3085 3239 15 15 15 Total 175 20723 20872 21589 (1) Data available from FEVE. (2)The plant shut down in 2009. (3) Available data for: Austria, Belgium, Bulgaria, Czech Republic, Denmark, Finland, Greece, Hungary,
the Netherlands, Romania, Slovakia and Sweden are consolidated under ‘Others’ for confidentiality reasons.
Source: [85, Spanish BAT Glass Guide 2007] [125, FEVE 2009]
The most common size for a glass manufacturing installation is between 300 and 600 tonnes per day. The typical distribution of installations within different size ranges, limited to the plants covered by a survey carried out by FEVE (134 installations from a total of 175 in the EU-27), is presented in Table 1.3.
Table 1.3: Number of container glass installations in specified production ranges Production range (tonnes/day) <150 150 to 300 300 to 600 600 to 1 000 >1 000
Number of installations in each range 15 38 56 23 2
Rate (%) of installations in each range 11.2 28.4 41.8 17.2 1.5 Source: [126, FEVE 2009]

Chapter 1
Manufacture of Glass 11
1.3.2 Products and markets [19, CPIV 1998]
Container glass is made from a basic soda-lime formulation and is melted in a fossil fuel fired furnace, or exceptionally an electrically heated furnace. The molten glass is generally formed into the products by automated individual section (IS) machines. Where appropriate, colouring agents are added to the glass and surface coatings are applied to the finished products. By volume, the most important products of the container glass sector are bottles for wines, beers, spirits, soft drinks, etc. and wide neck jars for the food industry. These products are generally considered commodity items, but another important part of the sector is the production of higher value containers for the pharmaceutical and perfumes/cosmetics industries. The majority of production is sold to customer industries within the EU, which then sell their packaged products into markets in the EU and the rest of the world. The relative importance of the various customer industries varies considerably between Member States. This is reflected in the great diversity of national markets for glass containers and the products they require, particularly in terms of colour, shape, size and design. There are three broad customer industry sectors. The beverage sector accounts for approximately 75 % of the total tonnage of glass packaging containers. This includes still and sparkling wines, fortified wines, spirits, beers and ciders, flavoured alcoholic beverages, soft drinks, fruit juices and mineral waters. The food sector accounts for about 20 % of the tonnage (mostly jars). This covers a wide range of products, such as: wet and dry preserves, milk and milk products, jams and spreads, sauces and dressings, oil, vinegar, etc. Perfumery/cosmetics, pharmaceuticals and technical product containers (flaconnage), which are generally small bottles, account for the remaining 5 % or so of container glass tonnage. An important characteristic of the sector is that delivery distances for mainstream beverage bottles and jars are generally limited to a few hundred kilometres, because, for empty containers, the cost of transport is relatively high compared to the sales price. Furthermore, specific local or regional markets exist with characteristic glass containers, particularly in alcoholic beverages (distinct wine regions, whisky, cognac, champagne, and beer), and this has acted against market concentration. Flaconnage, in particular higher value perfume and cosmetic ware, are more exposed to international competition. On the other hand, the increased growth and influence of global food and drink, pharmaceuticals and cosmetics groups have been mirrored over the period 1997 to 2005 by further concentration and internationalisation of glass industry ownership, coupled with greater specialisation in terms of the glass products supplied (it is more and more unusual for a company to manufacture products in more than one glass sector).

Chapter 1
12 Manufacture of Glass
1.3.3 Commercial and financial considerations [19, CPIV 1998] [63, CPIV Annual report 2007]
The container glass industry is a relatively mature industry serving extremely dynamic markets, which has experienced slow overall growth during the period 1997 to 2006. There are inevitable local or temporary changes, but the overall trend is expected to continue in the medium term. However, competition from alternative packaging materials is expected to continue to challenge the sector. Although furnaces have long operating lives, the large number of furnaces means that in any one year, a significant portion of capacity will be approaching rebuilds. In the container glass sector, overcapacity tends to be localised and short term. Competition from alternative materials is a significant factor for price levels. Due to transport costs, most products are sold within 500 km of the production site, and so imports and exports tend to be fairly limited. This is not the case for the perfume/cosmetics industry for which exports can represent over 40 % of production. During 2005, EU exports exceeded imports by around 70 %, i.e. 931 784 tonnes against 262 192 tonnes, but in 2006 exports only increased by 0.5 % and imports by 11.7 %. Total extra-EU trade represents only 4.6 % of the sector production of 20 million tonnes. However, areas on the fringes of the EU can be subject to quite severe competition from non-EU countries, often with significantly lower prices but acceptable quality. This is particularly true for lower value products. It is, however, important to remember that although the containers are sold locally, the goods packaged in glass are often exported in substantial quantities outside the EU (e.g. wines, spirits, beers, perfumes, oil). There is a wide range of factors that can affect the market for container glass. The main threat is from alternative packaging materials, especially plastics (mainly PET-polyethylene terephthalate), metals (steel and aluminium) and laminated cartons. The main advantages of container glass are its high chemical resistance and barrier properties (so protecting and preserving the quality of the contents), and aesthetic appeal (transparency, colour, design, etc. for the presentation of goods and the identification of brands), recyclability back into new bottles, resealability, ease of cleaning, and reusability. In addition, the virgin raw materials used for making glass are abundant in nature. The position of glass relative to its competitors varies widely between regions and products, depending on market preferences, costs and packaging developments. The main disadvantages of glass are its weight and the risk of breakage. Other important factors are associated with fluctuations in the demand for the packaged products. For example, changes in consumer habits, such as the trend towards the consumption of lower volumes but of higher quality wines. Climatic factors which affect the size of wine harvests and the consumption of beer and soft drinks during the summer periods can also be important. Fluctuations in foreign exchange rates and the prevailing local economic climate will affect the demand for high-value items such as perfumes and spirits. Glass making is a capital-intensive industry and this restricts entry into the market to fairly large enterprises with substantial financial resources. The long-term slow growth means that although new furnaces are being constructed, they tend to be built by companies already operating in that region, or by other existing companies entering that region. Much of the growth in sales will be met by upgrading existing plants at scheduled rebuilds. Overall there is a trend of transfer of ownership of smaller companies to large companies.

Chapter 1
Manufacture of Glass 13
The investment cycle is long. In general, container glass furnaces operate continuously, or with one or two minor repairs, for over 20 years, after which time they are rebuilt with either partial or total replacement of the structure depending on its condition. The straightforward rebuild of a medium sized furnace (around 250 tonnes per day) will cost in the region of EUR 3 to 5 million or more. The actual expenditure can be significantly higher, because the rebuild can be a convenient time to implement any upgrades to the process. A new plant of comparable size on a green field site would cost in the region of EUR 40 to 50 million including infrastructure and services.
1.3.4 Main environmental issues The main environmental issue associated with container glass production is that it is a high temperature, energy-intensive process. This results in the emission of combustion products and the high-temperature oxidation of atmospheric nitrogen, i.e. sulphur dioxide, carbon dioxide, and nitrogen oxides. Furnace emissions also contain dust (arising from the volatilisation and subsequent condensation of volatile batch materials) and traces of chlorides, fluorides and metals present as impurities in the raw materials. Technical solutions are possible for minimising all of these emissions, but each technique has different financial and environmental implications associated with it. Major environmental improvements have been made within the sector, giving rise to substantial reductions in furnace emissions and energy usage. In particular, advances have been made with primary emission reduction techniques for oxides of nitrogen and sulphur dioxide. Waste levels within the sector are very low. Indeed continued development within the sector has been the increased use of recycled glass (cullet). In 2008, the average rate of utilisation of post-consumer cullet within the EU container glass sector is approximately 50 % of the total raw material input, with some installations utilising 80 % or more recycled glass. Some product types, where a high degree of colourlessness is required, e.g. in certain perfume or luxury cosmetics, but also spirit markets, post-consumer recycled glass may not be employed to a significant extent, due to coloured glass impurities. A distinct advantage of glass over alternative packaging materials is the ease of recycling and reuse. In general, container glass production should not present significant water pollution problems. Water is used mainly for cleaning and cooling and can be readily treated or reused.
1.4 Flat glass 1.4.1 Sector overview [19, CPIV 1998] [65, GEPVP-Proposals for GLS revision 2007] [127, Glass for Europe 2008]
Flat glass is the second largest sector of the glass industry in the EU-27, which represented around 26 % of the total glass production in 2005, 28 % in 2006 and 29 % in 2007. The sector covers the production of float glass and rolled glass. Float glass represents the main product; while rolled glass is only about 3.5 % of the total and is declining, while the production of float glass has increased over the years. In 2007, the sector produced approximately 9.5 million tonnes of glass from the 58 float tanks operating in the EU-27. There are nine manufacturers of float glass and four rolled glass manufacturing plants operating in the EU-27. Flat glass is produced in 16 Member States. In 2007, the sector directly employed approximately 17 000 people in the manufacture of flat glass. On average, flat glass output annual growth is in the order of 2 – 3 %.

Chapter 1
14 Manufacture of Glass
Flat glass manufacture is a worldwide business including four major groups; in order of worldwide capacities, they are: Asahi Glass (AGC Flat Glass Europe), NSG (Pilkington, UK), Saint-Gobain (France) and Guardian Industries (US). Information regarding the ownership of float tanks is shown in Table 1.4 and in Table 1.5 below (EU-27, 2007).
Table 1.4: Owners and locations of float tanks in the EU-27 in 2007
Company Number of tanks Locations
Saint-Gobain 16 Germany (4), France (3), Belgium (2), Spain (2), Italy (1), Portugal (1), United Kingdom (1), Poland (1), Romania (1)
AGC Flat Glass Europe 13 Belgium (4), France (2), Italy (2), Netherlands (1),
Czech Republic (3), Spain (1)
Pilkington 12 Germany (4), United Kingdom (3), Italy (2), Finland (1), Sweden (1), Poland (1)
Guardian 8 Luxembourg (2), Spain (2), Germany (1), United Kingdom (1), Hungary (1), Poland (1)
Euroglas 3 France (1), Germany (2) Manfredonia Vetro/Sangalli 1 Italy (1)
Sisecam 1 Bulgaria (1) Interpane 1 France(1) Ges Scaieni 1 Romania (1) Total 56
Table 1.5: Joint ventures of float tanks in the EU-27 in 2007 Company Number of tanks Locations
AGC Flat Glass Europe/Scheuten 1 Belgium Saint-Gobain/Pilkington 1 Italy
The geographical distribution of the sector and the range of installation sizes are shown in Table 1.6 and Table 1.7:
Table 1.6: Number of float tanks in Member States in 2007 in the EU-27 Member State Number of float tanks % distribution of EU production
Germany 11 19.0 France 7 12.1 Italy 7 12.1 Belgium 7 12.1 United Kingdom 5 8.6 Spain 5 8.6 Poland 3 5.2 Czech Republic 3 5.2 Luxembourg 2 3.45 Romania 2 3.45 Finland 1 1.7 Netherlands 1 1.7 Portugal 1 1.7 Sweden 1 1.7 Hungary 1 1.7 Bulgaria 1 1.7 Total 58 100 Source: [127, Glass for Europe 2008]

Chapter 1
Manufacture of Glass 15
Table 1.7: Percentage of float capacity in specified ranges Capacity range
(tonnes/day) % Capacity in each range in the EU-27
<400 1 400 to 550 37 550 to 700 48
>700 14
1.4.2 Products and markets [19, CPIV 1998] [65, GEPVP-Proposals for GLS revision 2007]
There are two types of flat glass produced in the EU; rolled glass and float glass. Although strictly there are other types of flat glass, they are not considered to fall within this sector, either because they are covered within the special glass sector or they do not meet the production criterion of 20 tonnes per day specified in Directive 2008/1/EC. The majority of rolled glass is patterned or wired glass and accounts for around 3.5 % of the total sector output. Patterned glass is used for horticultural greenhouses, for decorative purposes and in applications where light is dispersed, for example for glass partitions, bathroom windows and for photovoltaic panels. Float glass makes up the other 95 % of output and is used principally in the building and automotive industries. Prior to the invention of the float glass process in 1962 by Pilkington, there were two main types of unpatterned glass: sheet glass and plate glass. The most widely used method for producing sheet glass was the Pittsburgh process, which involves drawing glass vertically from the tank. A refractory guidance device is placed in the glass at the drawing location and cooled grippers receive the glass. The glass passes through an annealing shaft about 12 m long and is then cut to shape. Prior to the availability of float glass, plate glass was the highest quality glass available. Plate glass is produced from rolled glass or thick sheet glass by grinding and polishing the glass using rotating discs on large tables or conveyors. The twin process involves polishing the glass on both sides at once. The grinding and polishing process generates large amounts of solid waste for disposal. The advantages of the float process (economy, product range, low waste and quality) are such that, since its introduction in 1962, sheet glass and plate glass have gradually been replaced and are no longer produced within the EU. Some rolled glass products are still polished for specialist applications, and diminishing levels of sheet glass and plate glass are still produced in some parts of the world. For the purposes of this document, sheet glass and plate glass manufacture can be considered essentially obsolete techniques. The most important markets for float glass are the building and automotive industries. The largest of these markets is the building industry which accounts for 75 to 85 % of output, and the majority of the remaining 15 to 25 % is processed into glazings for the automotive industry. Some glass is simply cut to size and used directly, but the majority of flat glass production is processed into other products. For the automotive industry, these are laminated windscreens, side and rear glazings, and sunroofs. The main processed product for the building industry is insulated glazing in the form of double or triple glazed units, often with one layer of coated glass. These glazed units account for 40 to 50 % of the building market with the remainder being made up of silvered, coated, toughened, and laminated products which each make up 10 to 15 %.

Chapter 1
16 Manufacture of Glass
1.4.3 Commercial and financial considerations [19, CPIV 1998] [63, CPIV Annual report 2007] [127, Glass for Europe 2008]
On average, total extra-EU trade represents about 15 % of EU production with a slightly positive balance of trade. In the region of 10 % of production is exported to non-EU countries and a similar but generally lower figure (6.3 % in 2006 for unprocessed glass) is imported into the EU market, predominantly from Far East Asia. This summary is true for both unprocessed and processed glass. Flat glass is expensive to transport and it is desirable to supply customers as close to the manufacturing site as possible. However, with 58 float lines in operation in 2007 in the EU and the intense competition between companies, the distances the glass is transported can be substantial, but is ultimately limited by cost. The vast majority of glass manufactured and processed in the EU is sold in Western Europe. After some years of rather low and diminishing imports, since 2005 the quantity of float glass imported from outside the EU-27 has sharply increased up to twice as much as in the past. During 2007, a historic peak in imports was observed with total extra-EU imports representing approximately 11 % of the total EU production, predominantly from China. For the same year, the extra-EU exports represented 10.5 % of the total EU production. Due to large overcapacity in China, those imports are expected to continue rising in the near future. Other large importers to Europe are Turkey, the US, Indonesia, Israel and Russia. Basic flat glass production is a mature, cyclical, and essentially a commodity business. Between 1986 and 2000 the sector showed a substantial annual growth between 2 and 3 %. The trend of growth has been confirmed during the period 2000 - 2006, for both the EU-15 and the EU-27. However, overcapacity in the sector has led to severe price pressure, with glass prices falling in real terms. Prices can fluctuate between markets but have been particularly low in Germany, the largest producer. Demand for flat glass is particularly sensitive to economic cycles because it is heavily dependant on the building and automotive industries. During periods of economic growth and a high demand for flat glass, it can be quite a prosperous business, during economic downturns or recession the opposite can be true. Capacity utilisation has been around 90 % in the period 2000 - 2007. The general opinion within the industry is that long-term profitability requires capacity utilisation in excess of 90 %. The estimated evolution of the capacity utilisation of existing float tanks in the EU-27 and the surplus production are presented in Table 1.8.
Table 1.8: Estimated evolution of the capacity utilisation and surplus float glass production within the EU-27
Year end Saleable capacity
Worldwide sales of EU-27 producers
Capacity utilisation on EU-27 manufacturers’ sales worldwide
Surplus Utilisation thousand tonnes thousand tonnes thousand tonnes %
2007 9 576 8 921 655 93.16 2008 (1) 9 709 9 141 568 94.15 2009 (1) 10 319 9 516 803 92.22 2010 (1) 10 808 9 938 870 92.00 (1) Estimated data Source: [127, Glass for Europe 2008]

Chapter 1
Manufacture of Glass 17
Flat glass manufacture and float glass in particular is a very capital-intensive activity requiring substantial financial resources, long-term investment and highly technical skills. For this reason there are a limited number of large international manufacturers. Smaller producers do exist although they are not common. Float glass furnaces operate continuously for 12 to 15 years (or longer in some cases), after which time they are rebuilt with either partial or total replacement of the structure depending on its condition. A major rebuild would cost EUR 30 – 50 million and a new float line (typically 500 tonnes per day) would cost in the region of EUR 100 – 150 million.
1.4.4 Main environmental issues [65, GEPVP-Proposals for GLS revision 2007]
The main environmental issue associated with flat glass production is that it is a high temperature, energy-intensive process. This results in the emissions of combustion products and the high-temperature oxidation of atmospheric nitrogen, i.e. sulphur dioxide, carbon dioxide, and nitrogen oxides. Furnace emissions also contain dust (arising from the volatilisation and subsequent condensation of volatile batch materials) and traces of chlorides, fluorides and metals present as impurities in the raw materials. Technical solutions are possible for minimising all of these emissions, but each technique has different financial and environmental implications associated with it. Waste glass generated on site is recycled to the furnace and the sector has made significant improvements in the recycling of processed and post-consumer waste. Flat glass cullet is a useful raw material for other parts of the glass industry, particularly the container glass and insulation wool sectors, and it is estimated that up to 95 % of waste glass from processing is recycled in some way. In general, flat glass production should not present significant water pollution problems. Water is used mainly for cleaning and cooling and can be readily treated or reused. Major environmental improvements have been made in flat glass production, emissions have been reduced substantially by means of primary and secondary measures and reductions of specific energy consumption have been achieved. From 1960 to 1995, energy consumption has been reduced by 60 %, while during the period 1996 – 2006, a further reduction of about 20 % was achieved. The theoretical minimum for glass melting is 0.76 MWh/tonne (equivalent to 2.74 GJ/tonne) and significant development in technology would be necessary for further improvements [128, ECORYS 2008]. The observed minimum values for specific energy consumption are about 5 GJ/tonne, at the beginning of a furnace campaign (see Section 3.4.5). In considering the overall environmental impact of the flat glass sector, it is useful to consider some of the environmental benefits associated with the products. For example, the total energy balance associated with the production of glazing includes both the energy consumed in its manufacture and its impact on the energy consumed by the building where the glazing is utilised throughout the period it is installed (say 30 years). The building sector accounts for at least 40 % of the EU energy consumption, half of which is used to heat homes. The upgrading of existing and new buildings in Europe, by substituting ordinary or double glazing with low-emissivity double glazing significantly enhances heat insulation. Heat losses are reduced to less than 20 % compared with single glazing, and to less than 40 % compared with normal double glazing. This can make a significant impact on the use of energy in buildings. Advanced products for the automotive market help to reduce fuel consumption by saving weight, and to reduce air conditioner load by the use of solar control glasses.
Chapter 1
18 Manufacture of Glass
The estimated reduction of energy consumption for heating that could be achieved by promoting the use of high-performance, low-energy or triple glazing in all new and existing buildings in the EU-27 is equivalent to 975 000 TJ of energy per year, corresponding to as much as 97 million tonnes of CO2 emissions per year. [159, Glass for Europe 2009]
An additional reduction of CO2 emissions between 15 and 80 million tonnes per year has been estimated as the possible result of the application of solar control glass in buildings equipped with air conditioning. [160, Glass for Europe 2008]
During the lifetime of the glass, the reduction in CO2 emissions achieved by using energy-efficient glass products will outweigh by far those created in manufacturing the glass. References [GEPVP: ‘LOW-E GLASS IN BUILDINGS - Impact On The Environment & On Energy Savings - Contribution of the flat glass industry towards reducing greenhouse gas emissions & energy consumption in the EU-15’ (2000)][GEPVP: ‘ENERGY & ENVIRONMENTAL BENEFITS from Advanced Double Glazing in EU Buildings’ (March 2005)][ECOFYS: ‘Impact of the improvement of thermal insulation (CTE2) on the CTE’ (July 2004)][TNO Report: ‘Impact of Solar Control Glazing on energy and CO2 savings in Europe’ (July 2007)]
1.5 Continuous filament glass fibre [66, APFE UPDATE IPPC Glass BREF 2007] [67, APFE Plant survey 2007]
1.5.1 Sector Overview [19, CPIV 1998]
The production of continuous filament glass fibre is one of the smallest sectors of the glass industry in terms of tonnage, but the products have a relatively high value to mass ratio. This sector covers the manufacture of continuous glass filaments, which are converted into other products. It is distinct from the manufacture of glass fibre insulation, which is made by a different process and is generally termed ‘glass wool’. In 2005, the sector produced 933400 tonnes of fibre from the 34 furnaces operating at the 17 sites in the EU-25 to make principally E-glass and a small amount of C and AR glass fibres. In 2005, the sector directly employed 6500 people.
The sector showed good growth from 1997 to 2007 taking into consideration the increase in the four new production installations in Latvia, the Czech Republic and Slovakia. There were seven producers in the EU: Ahlstrom, Johns Manville, Lanxess, P-D Oschatz, Owens Corning, PPG and Saint-Gobain Vetrotex. In 2007, Owens Corning acquired Saint-Gobain Reinforcements and Composites business to form OCV Reinforcements. As a condition of the acquisition, it was necessary to divest two sites from the newly formed OCV Company into a newly formed company known as 3B-Fibreglass. Saint-Gobain retained its Textile Solutions business as a separate organisation. The largest of these is now OCV Reinforcements with plants in France, Germany, Italy, Belgium and Spain. The next largest producers in the EU are PPG, 3B and Johns Manville with plants throughout the EU-25.
On a global basis in 2005, the US was the largest producer with over 40 % of worldwide output, and Europe and Asia each accounted for 20 to 25 % respectively. The world’s largest producer is Owens Corning followed by Vetrotex and PPG. The geographical distribution of the sector and the range of furnace sizes are shown in Table 1.9 and Table 1.10.

Chapter 1
Manufacture of Glass 19
Table 1.9: Number of continuous filament installations and furnaces in Member States
Member State Number of installations
Number of furnaces (in operation in 2005) EU-25 production
Germany 3 5 Belgium 2 5 Czech Republic 2 4 France 2 4 Italy 2 3 Finland 1 3 Slovakia 1 3 The Netherlands 1 2 United Kingdom 1 2 Spain 1 2 Latvia 1 1
Total 17 34 933 400 tonnes in 2005
Table 1.10: Number of continuous filament furnaces in specified production ranges Production range (tonnes/day) <50 50 to 100 >100
Number of furnaces in each range (2005) 11 11 12
1.5.2 Products and markets [19, CPIV 1998] [66, APFE UPDATE IPPC Glass BREF 2007]
Continuous filament glass fibre is produced and supplied in a variety of forms: roving, mat, chopped strand, textile (yarn), tissue, and milled fibre. The main end use (approximately 90 %) is the production of composite materials (glass-reinforced plastic, GRP), by reinforcement of both thermosetting and thermoplastics resins. Composites are used in a wide variety of industrial applications within the EU due to their high strength to weight ratio, light weight and corrosion-resistant properties. New applications are being developed continuously. The main markets for composite materials are the building industry, the automotive and transport sectors, and the electrical and electronics industry. Other uses are in pipes and tanks, agricultural equipment, industrial machinery, and in the sports, leisure and marine sectors. A rapidly growing market for glass fibre composites is renewable energy and wind energy in particular. The second most important end use is the manufacture of textiles that are used in similar markets to composites though clearly for different applications. The main market for glass textiles is the electronics industry where they are used in the production of printed circuit boards. This manufacture of textiles has been rapidly shifting to Asia for competitiveness reasons. The sector has a wide and increasingly diverse customer base with substantial international trade. This global trade reduces the impact of fluctuating economic performance between specific markets or geographical regions. It does, however, increase vulnerability to competition from lower cost regions.
Chapter 1
20 Manufacture of Glass
1.5.3 Commercial and financial considerations [19, CPIV 1998] [66, APFE UPDATE IPPC Glass BREF 2007]
The continuous filament glass fibre sector shows good growth over the longer term. Its products have relatively high value, are readily transported and there is significant international trade. Although demand for the products is increasing, there is very strong competition which places pressure on prices, and limits profitability. Average capacity utilisation in 2005 was around 95 %. In 2005, exports and imports were 27 % and over 44 % of EU output respectively, representing a negative balance of trade and an increasing import penetration mainly from Asia. Continuous filament glass fibre manufacture is a very capital-intensive activity requiring substantial financial resources, long-term investment and employees with highly technical skills. For this reason there are a limited number of large international manufacturers and a few smaller producers. Furnaces in this sector operate continuously for 8 to 12 years, after which time they are rebuilt with either partial or total replacement of the structure depending on its condition. The rebuild of a medium sized furnace (around 75 tonnes per day) will cost in the region of EUR 8 million. A new plant of comparable size on a green field site would cost in the region of EUR 75 million to 90 million including infrastructure and services.
1.5.4 Main environmental issues [66, APFE UPDATE IPPC Glass BREF 2007]
The production of continuous filament glass fibre is a relatively low waste activity compared to many industrial activities. However, the production of fine fibres can cause breakages, which in turn leads to a higher level of waste per tonne of product than the glass industry average. In 2005, there was evidence of a reduction in the amount of glass melted going to landfill, some through conversion efficiency improvements and some via recycling back into the process. Recycling back to fibreglass furnaces is still a major difficulty but there is evidence of greater activity to overcome these difficulties. In general, glass filament production does not present major water pollution problems. Water is used mainly for cleaning and cooling, but there are potential emissions associated with the use of coating materials. Emissions can arise from coating preparation and handling, throw-off from winding and secondary processing operations. Emissions can be minimised by use of appropriate techniques for handling and spillage containment, and residual levels of pollution can be treated with standard techniques. The main environmental issue associated with continuous filament glass fibre production is that it is a high-temperature, energy-intensive process. This results in the emissions of combustion products, and the oxidation of atmospheric nitrogen, i.e. sulphur dioxide, carbon dioxide, and nitrogen oxides. Furnace emissions also contain dust (arising from the volatilisation and subsequent condensation of volatile batch materials) and traces of chlorides and metals present as impurities in the raw materials. The resulting dust, separated by filtration from the flue-gases, in most cases is not recycled back to the furnace, due to the carryover phenomena and to the presence of aggressive/corrosive components such as sodium chloride (NaCl). Due to the nature of the fiberising process, varying levels of fluorides are sometimes used in the batch, which can give rise to emissions of hydrogen fluoride. This is a complex issue that is discussed in detail in Chapter 4. Technical solutions are possible for minimising all of these emissions, but each technique has associated financial and environmental implications. Major
Chapter 1
Manufacture of Glass 21
environmental improvements have been made in glass filament production, emissions have been reduced substantially and reductions have been made in energy consumption. In considering the overall environmental impact of the sector, it is useful to consider some of the environmental benefits associated with composite materials, which are the main end use for glass filaments. In addition to their numerous technical benefits, composite materials generally use much less energy to produce than the materials they replace, particularly steel and aluminium. They provide a weight reduction in transport applications, (which contributes to fuel savings) and they have a longer service life due to their high resistance to corrosion. More recently they have contributed to the successful development of large commercially-viable wind farm structures, especially the blades, making a valued and major contribution to the renewable energy industry and the global CO2 reduction effort.
1.6 Domestic glass 1.6.1 Sector overview [28, Domestic 1998] [68, Domestic Glass Data update 2007]
The domestic glass sector is one of the smaller sectors of the glass industry with approximately 4 % of total output. This sector covers the production of glass tableware, cookware and decorative items, which include drinking glasses, cups, bowls, plates, cookware, vases and ornaments. The manufacture of domestic glass is very widely distributed across the EU with more than 300 installations, of which there are more than 120 in Italy and about 70 in Poland. Approximately, 60 installations meet the production criterion of 20 tonnes per day, as total melting capacity for the installation comprising one or more furnaces, as specified by Directive 2008/1/EC, and these account for the majority of EU production. In 2006, total production was about 1.46 million tonnes for the EU-27. The largest domestic glass manufacturers in Europe are Arc International (France), Bormioli Rocco e Figlio, Bormioli Luigi, and RCR Cristalleria Italiana (Italy), Durobor (Belgium), Duralex (France), Pasabahce (Bulgaria), Riedel Nachtmann (Germany), Waterford Crystal (Ireland), Zwiesel (Germany), and Libbey (Portugal). As mentioned above, there are many smaller companies, which often specialise in higher value-added products (lead crystal, etc.). The geographical distribution of the sector, together with the estimated share of production, and the range of installation sizes are shown in Table 1.11 and Table 1.12.

Chapter 1
22 Manufacture of Glass
Table 1.11: Number and distribution of IPPC domestic glass installations in Member States in 2006
Member State Number of
installations above (20 t/d)
Approximate % of EU production
France 7 26.9 Germany 8 22.2 Italy 7 11.7 Spain 5 10.1 Poland 4 5.5 Czech Republic 8 5.2 The Netherlands 1 4.8 Slovakia 3 3.0 Belgium 1 1.7 Portugal 1 1.6 Greece 2 1.6 Bulgaria 1 1.3 Hungary 2 1.2 Ireland 1 1.1 Austria 4 0.6 Sweden 1 0.5 Finland 1 0.5 Slovenia 2 0.2 United Kingdom 1 0.2 Total 60 1 463 000 tonnes in 2006 Source: [68, Domestic Glass Data update 2007]
Table 1.12: Number of domestic glass installations in specified production ranges in 2006 (estimated)
Production range (tonnes/day) <20 20 to 100 >100
Number of installations in each range >240 41 19
Source: [68, Domestic Glass Data update 2007]
1.6.2 Products and markets [28, Domestic 1998]
The domestic glass sector is very diverse in its products and the processes utilised. Products range from bulk consumer goods to high-value lead crystal decanters and goblets. Product forming methods include manual methods (blowpipes and cutting) and completely automated machines. The basic products are outlined in Section 1.6.1, with drinking glasses accounting for over 50 % of output. The majority of products are made from soda-lime glass, which can be clear or coloured. Lead crystal and crystal glass formulations are used to produce glasses, decanters and decorative items with high brilliance and density. Opal glass is used to produce cups, plates, serving dishes, and ovenware. Borosilicate domestic glass is perhaps better known by some of the common trademarks, namely Duran (Schott) and Pyrex (Arc International), and the main products are cookware and heat resistant tableware. In some cases, products made of these different glass formulations are tempered in order to increase their resistance to mechanical and thermal shocks. Glass ceramic products are used for high-temperature applications, principally cookware, and can withstand high levels of thermal shock. The end user customer base is clearly extremely broad but immediate sales are generally to large retailers and wholesalers, although some producers do also sell directly to the public.
Chapter 1
Manufacture of Glass 23
Different parts of the market are affected by a wide range of factors. Customer tastes and social trends are very important. For example, the trend towards more casual dining particularly in Europe has resulted in a higher demand for cheaper medium quality items, and the demand for coloured glass varies with time and region. It is important for the manufacturer to keep ahead of these changes and to respond accordingly; therefore, flexibility is an important part of the manufacturing operation. As a consequence, domestic glass formulations must be tailored to specific products and processing requirements. Even basic soda-lime formulations can show significant differences from other soda-lime formulations such as container or flat glass. Increased mechanisation in lead crystal production has led to the production of cheaper items with quality close to that of handmade items. However, this type of high-value product is particularly sensitive to customer perception and the crucial handmade label still commands a higher price. This means it is unlikely that handmade items will be restricted (in the medium term at least) to individually commissioned products.
1.6.3 Commercial and financial considerations [28, Domestic 1998]
In common with most sectors of the glass industry, the domestic glass sector is an established mature business that experiences modest long-term growth in demand. Domestic glass products are readily transported and there is substantial international trade both between Member States and outside the EU. The main threat to this sector is competition in the domestic markets from increased imports, and greater competition in the important export markets. This increased competition has led to severe pressure on prices and therefore restricted profitability. In 2005, exports and imports represented 26 % and 28.5 % respectfully of EU output, in tonnage terms. Although this represents a fair overall balance of trade, the majority of imports were from Far East Asia and Turkey, which greatly outweighed EU exports into these regions. As in other sectors of the industry, large scale glass making is very capital intensive requiring substantial long-term investment. This is reflected in the small proportion of domestic glass manufacturers producing more than 20 tonnes per day. Although these few companies produce the majority of the EU output, the domestic glass sector is unusual in that there are a large number of smaller, less capital-intensive installations often specialising in high-value handmade items or niche markets. These small amounts of glass can be produced in pot furnaces and day tanks, which are relatively cheap to build and operate, but could never compete economically in high volume markets. The domestic glass sector utilises a wide range of furnace sizes and types and the furnace repair interval will vary accordingly. Large fossil fuel furnaces will run for 5 to 8 years before a major repair is needed. For electrically heated furnaces, it will be 3 to 6 years and for pot furnaces 10 to 20 years, with the pots being replaced every 3 to 12 months. For a typical electrically-heated 30 tonnes per day lead crystal furnace, a major repair (excluding forming machines) would be in the region of EUR 2 million, and a new furnace EUR 8 million. For a typical fossil fuel fired 130 tonnes per day soda-lime furnace, a major repair (excluding forming machines) would be in the region of EUR 4 million, and a new furnace EUR 12 million.

Chapter 1
24 Manufacture of Glass
1.6.4 Main environmental issues In general, the raw materials for domestic glass production are relatively harmless natural or man-made substances. The exception to this is the production of lead crystal or crystal glass, which involves the use of lead oxide and sometimes antimony or arsenic trioxide, which require careful handling and storage to prevent emissions. The sector produces relatively low levels of waste and most internally-produced cullet is recycled. Where this is not possible, due to quality restrictions, the cullet is usually recovered or recycled by the container glass sector (except lead crystal and crystal glass). In general, the use of external cullet in the process is not practicable, due to the same quality considerations mentioned above. Most types of domestic glass production should not present major water pollution problems. Water is used widely for cleaning and cooling and can be readily recycled or treated. However, the use of more toxic compounds in lead crystal or crystal glass production provides a higher potential for pollution. Emissions can be minimised and residual levels of pollution can be treated with standard techniques. As for the other glass sectors, the main environmental issue associated with domestic glass production is that it is a high temperature, energy-intensive process. For fossil fuel furnaces this results in the emissions of products from combustion and from the high-temperature oxidation of atmospheric nitrogen, i.e. sulphur dioxide, carbon dioxide, and nitrogen oxides. Furnace emissions also contain dust and traces of chlorides, fluorides and metals deriving from the volatilisation and subsequent condensation of volatile materials present in the batch formulation. The use of specific raw materials applied to give particular characteristics to the final product can give rise to the emission of hydrogen fluoride from opal glass produced with raw materials containing fluorine, boron compounds from borosilicate glasses, nitrogen oxides from the use of nitrates, etc. Where acid polishing is carried out, there are associated air, water and waste issues to consider. Technical solutions are possible for minimising all of these emissions, but each technique has associated financial and environmental implications. In recent years, environmental improvements have been made, with emissions and energy consumption being reduced significantly.

Chapter 1
Manufacture of Glass 25
1.7 Special glass 1.7.1 Sector overview [26, Special 1998] [73, Special Glass Proposal 2007]
In 2005, the production of the special glass sector was around 2.1 % of the glass industry output, and in terms of tonnage was the fifth largest sector. Without water glass, the sector produced 0.770 million tonnes of products (see Table 1.13) but, the whole production capacity was 1.29 million tonnes. Special glass is an extremely broad sector covering a wide range of products of relatively great value such as: cathode ray tubes (CRT) glass (panels and funnels), lighting glass (tubes and bulbs), borosilicate glass tubes, laboratory and technical glassware; borosilicate and ceramic glasses (cookware and high-temperature domestic applications) and optical glass, quartz glass, glass for the electronics industry (e.g. LCD panels). There is a degree of overlap between the special glass sector and other sectors of the glass industry, particularly the domestic glass sector for some borosilicate and glass ceramic products. This is not considered to be a significant issue since the products involved only represent a minor part of the sector output. In 2005, glass tubes and bulbs accounting for 53.5 % and CRT glass accounting for about 21.7 % of the total capacity represented the main production of the special glass sector. Between 2005 and 2007, seven plants located in the UK, France, Germany, Lithuania, and the Czech Republic, producing CRT panels and funnels closed, leaving only one CRT glass manufacturer in Europe, with one plant owned by Indian private conglomerate Videocon, located in Poland. While lighting glass, borosilicate glass and glass ceramics are normally above the threshold of 20 tonnes per day, as specified in the Industrial Emissions Directive 2010/75/EU, most small producers of the low-volume specialist products, such as optical glass and glass for the electronics industry, often fall below this threshold. There are some integrated installations that produce a wide range of low and higher volume products, and in these cases total production may be above the threshold level of 20 tonnes per day. Although usually considered to be part of the chemical industry, water glass (sodium silicate) can be produced by melting sand and soda ash. This activity fits the definitions in Sections 3.3 and 3.4 of Annex I to Directive 2010/75/EU. For the purposes of the original glass BREF adopted in 2001, this activity was considered to fall within the special glass sector but this production is now covered in the Large Volume Inorganic Chemicals - Solids and Others Industry (LVIC-S) BREF [http://eippcb.jrc.es/reference/].

Chapter 1
26 Manufacture of Glass
1.7.2 Products and markets [26, Special 1998] [73, Special Glass Proposal 2007]
Table 1.13 shows the relative outputs of each part of the sector. CRT glass, and glass tubes plus bulbs account for almost 80 % of capacity.
Table 1.13: Special glass sector breakdown for the year 2005
Glass type Production (tonnes)
Capacity (tonnes/yr)
Sector capacity (%)
CRT glass (panel and funnel) 230 000 280 000 21.7
Glass tubes and bulbs 384 000 692 000 53.5
Borosilicate glass (excluding tubes) 50 000 90 000 7.0
Other lighting glass (excluding quartz, tubes and bulbs) 30 000 60 000 4.6
Glass ceramics 55 000 120 000 9.3
Quartz glass 5 000 15 000 1.2
Optical glass 6 000 10 000 0.8
Other glass types 10 000 25 000 1.9
Total special glass 770 000 1 292 000 100.0
N.B. Water glass is now included in the Large Volume Inorganic Chemicals-Solids and Others Industry (LVIC-S) BREF Source: [74, Special Glass breakdown 2007]
The most important products and markets for special glass are described below. Cathode ray tubes (CRT) glass and flat panelsThe fall of the CRT funnels market coincides with the rapid growth of flat panel glass production, in particular for TV applications and computer monitors. Most of the plants are located close to major production sites of LCD panels, i.e. in Asia. The technology used is either float or vertical draw. So far only one float plant has been built in Europe by Schott AG in Germany for the production of glass panels. In 2008, the plant was still in a stage of extensive sampling with customers rather than in a full business phase. Lighting glassThe production volume of lighting glass remains large. This sector includes incandescent and fluorescent lighting (both for domestic and public applications), halogen lights and automotive headlights. This last use is decreasing as glass headlights are being replaced by polymer materials. Lighting is globally a mature business but is still slightly eroded by imports from the Far East. Small but high in added value are the reflectors and heat/UV protection filters for video projectors. Glass tubingThe production of glass tubes is mainly driven by pharmaceutical and medical applications. Although it has been said that in the long-term, polymers may threaten the business, the markets keep growing a few percentage points per year, and European manufacturing sites were working at full capacity in 2005 and are continuing to do so.
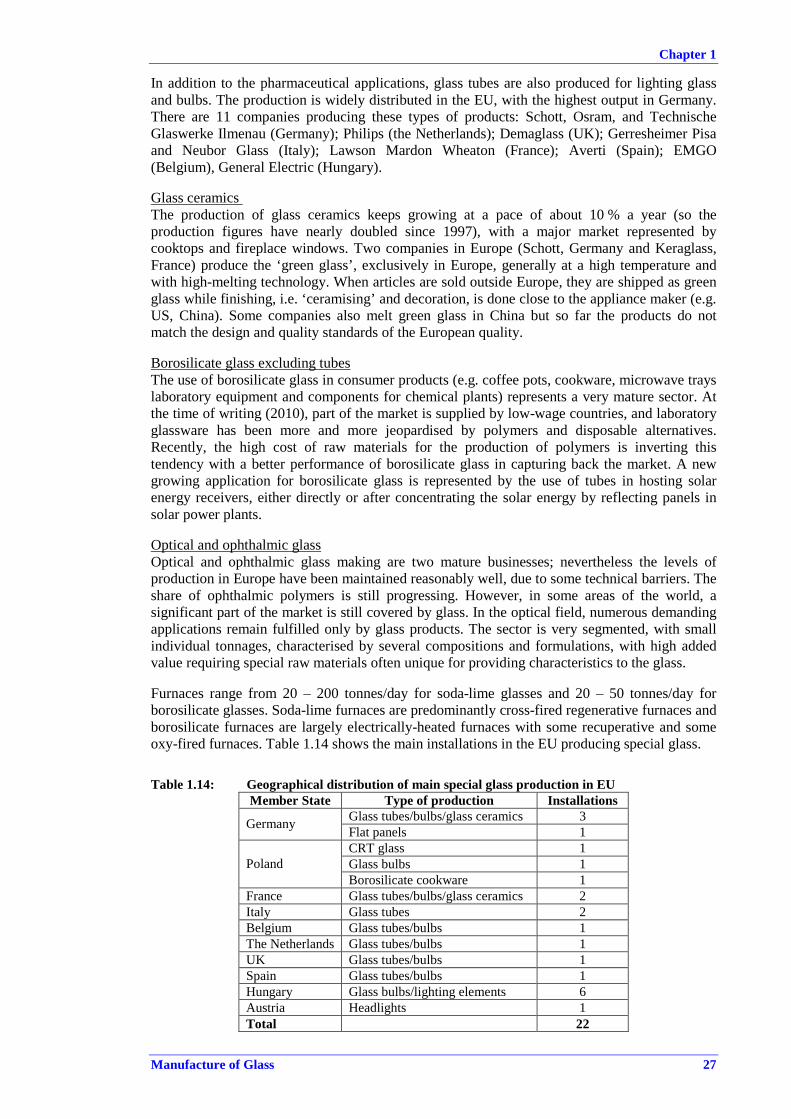
Chapter 1
Manufacture of Glass 27
In addition to the pharmaceutical applications, glass tubes are also produced for lighting glass and bulbs. The production is widely distributed in the EU, with the highest output in Germany. There are 11 companies producing these types of products: Schott, Osram, and Technische Glaswerke Ilmenau (Germany); Philips (the Netherlands); Demaglass (UK); Gerresheimer Pisa and Neubor Glass (Italy); Lawson Mardon Wheaton (France); Averti (Spain); EMGO (Belgium), General Electric (Hungary). Glass ceramics The production of glass ceramics keeps growing at a pace of about 10 % a year (so the production figures have nearly doubled since 1997), with a major market represented by cooktops and fireplace windows. Two companies in Europe (Schott, Germany and Keraglass, France) produce the ‘green glass’, exclusively in Europe, generally at a high temperature and with high-melting technology. When articles are sold outside Europe, they are shipped as green glass while finishing, i.e. ‘ceramising’ and decoration, is done close to the appliance maker (e.g. US, China). Some companies also melt green glass in China but so far the products do not match the design and quality standards of the European quality. Borosilicate glass excluding tubesThe use of borosilicate glass in consumer products (e.g. coffee pots, cookware, microwave trays laboratory equipment and components for chemical plants) represents a very mature sector. At the time of writing (2010), part of the market is supplied by low-wage countries, and laboratory glassware has been more and more jeopardised by polymers and disposable alternatives. Recently, the high cost of raw materials for the production of polymers is inverting this tendency with a better performance of borosilicate glass in capturing back the market. A new growing application for borosilicate glass is represented by the use of tubes in hosting solar energy receivers, either directly or after concentrating the solar energy by reflecting panels in solar power plants. Optical and ophthalmic glassOptical and ophthalmic glass making are two mature businesses; nevertheless the levels of production in Europe have been maintained reasonably well, due to some technical barriers. The share of ophthalmic polymers is still progressing. However, in some areas of the world, a significant part of the market is still covered by glass. In the optical field, numerous demanding applications remain fulfilled only by glass products. The sector is very segmented, with small individual tonnages, characterised by several compositions and formulations, with high added value requiring special raw materials often unique for providing characteristics to the glass. Furnaces range from 20 – 200 tonnes/day for soda-lime glasses and 20 – 50 tonnes/day for borosilicate glasses. Soda-lime furnaces are predominantly cross-fired regenerative furnaces and borosilicate furnaces are largely electrically-heated furnaces with some recuperative and some oxy-fired furnaces. Table 1.14 shows the main installations in the EU producing special glass.
Table 1.14: Geographical distribution of main special glass production in EU Member State Type of production Installations
Glass tubes/bulbs/glass ceramics 3 Germany Flat panels 1 CRT glass 1 Glass bulbs 1 Poland Borosilicate cookware 1
France Glass tubes/bulbs/glass ceramics 2 Italy Glass tubes 2 Belgium Glass tubes/bulbs 1 The Netherlands Glass tubes/bulbs 1 UK Glass tubes/bulbs 1 Spain Glass tubes/bulbs 1 Hungary Glass bulbs/lighting elements 6 Austria Headlights 1 Total 22

Chapter 1
28 Manufacture of Glass
1.7.3 Commercial and financial considerations [26, Special 1998] [19, CPIV 1998] [73, Special Glass Proposal 2007]
The types of special glass range from mature established businesses to those serving highly developing markets, with some companies operating in a wide range of markets. Growth, profits and outlook can vary widely for each part of the sector. For example, in 1996, CRT glass production for computer monitors showed very high growth in Europe, while the demand for optical glass in Europe was stagnant due to competition from alternative materials. Overall sector growth between 1986 and 1996 was steady with the value of production rising from EUR 1 750 to 2 760 million. This situation was totally different in 2005 with the falling demand for CRT funnels and the increase in the flat panels market. In 2005, EU exports of special glass were 8 1716 tonnes and imports were 90 773 tonnes, giving a significant trade deficit. The highest level of imports (about 45 %) was from Far East Asia, with 21.4 % from China. Large-scale glass making is very capital intensive requiring substantial long-term investment and technical skills. This is reflected in the limited number of special glass manufacturers in the EU producing more than 20 tonnes/day. Although these few companies produce the majority of the EU output, the special glass sector has a large number of smaller, less capital-intensive installations often specialising in high value, high quality and technically demanding products. These small amounts of glass are produced in small furnaces, often electrically heated, and are operated for shorter campaigns. Despite the scale, these operations usually also require substantial long-term investment in high-quality equipment, skilled staff, and extensive research and development work. The special glass sector utilises a wide range of furnaces and the furnace repair interval will vary accordingly. Large fossil fuel furnaces for special glass will run for 6 to 7 years before a major repair is needed. For electrically heated furnaces, the rebuild interval is 3 to 4 years. Due to the wide variation within the sector, typical costs are difficult to predict; examples of investment costs related to the main products of the special glass sector are shown in Table 1.15.
Table 1.15: Investment costs for special glass installations
Production Unit Capacity Output per year Total investment (in millions)
Borosilicate cookware, laboratory glass, etc.
One furnace (35 – 40 t/day)
Typically 26 million pieces EUR 35 – 40
Glass ceramic oven cook tops One furnace (65 t/day) 3.5 million pieces EUR 75
Glass tubes, melting and drawing Two furnaces (30 – 35 t/day) 16 000 tonnes net EUR 50 – 70
Lamp bulbs (soda-lime glass)
One furnace (80 t/day) 100 million pieces EUR 40 – 50
Source: [161, Special glass 2008]
Chapter 1
Manufacture of Glass 29
1.7.4 Main environmental issues [73, Special Glass Proposal 2007]
The broad range and specialised nature of the products of the special glass sector lead to the use of a wider range of raw materials than encountered in most other sectors. For example, some products (CRT funnels, optical flint glass) contain high levels of lead oxide of over 20 %. Certain compositions can require specialised refining agents such as oxides of arsenic and antimony, and some optical glasses can contain up to 35 % fluoride and 10 % arsenic oxide. The sector produces relatively low levels of waste and most internally-produced cullet is recycled. Quality considerations have restricted the use of external and post-consumer cullet in the process. In order to make it easier to recycle the waste, initiatives were developed to standardise CRT glass formulations, but at the time of writing this document (2010), CRT production has been drastically reduced in the EU as indicated in Section 1.7.1. Water is used widely for cleaning and cooling and can be readily recycled or treated. Special glass production can give rise to water pollution issues due to polishing and grinding operations, particularly with glasses which contain lead. Emissions can be minimised by appropriate techniques for handling and spillage containment, and residual levels of pollution can be treated with standard techniques. The main environmental issue associated with all fossil-fuel fired glass furnaces is that it is a high temperature, energy-intensive process. This results in the emission of products from combustion and from the high-temperature oxidation of atmospheric nitrogen, i.e. sulphur dioxide, carbon dioxide, and nitrogen oxides. Furnace emissions also contain dust, and traces of chlorides, fluorides and metals are present in the raw materials. The use of specific raw materials for giving certain characteristics to the final product can give rise to the emission of hydrogen fluoride from raw materials containing fluorine, boron compounds from borosilicate glasses, nitrogen oxides from the use of nitrates and metals from refining or decolourising agents (e.g. Sb, As, Se). Where toxic batch materials are used, appropriate measures should be taken in order to control the potential for emissions from handling, storage and from the furnace. Technical solutions are possible for minimising all of these emissions, but each technique has associated financial and environmental implications. In recent years, environmental improvements have been made, with emissions and energy consumption being reduced significantly by both primary and secondary measures.
1.8 Mineral wool 1.8.1 Sector overview [27, EURIMA 1998] [69, EURIMA data collection 2007]
The mineral wool sector represents approximately 10 % of the total output tonnage of the glass industry. The sector covers the production of glass wool and stone wool insulating materials, which are essential randomly interlaced masses of fibre with varying lengths and bound by a resin-based binder. Although the term ‘glass fibre’ is sometimes used to describe glass wool, insulation should not be confused with the products of the continuous filament glass fibre sector, which are made by different processes and sold into different markets. In 2005, the sector directly employed over 21 000 people at 62 installations, and produced 3.6 million tonnes of products with a value of around EUR 3 000 million. Between 1996 (EU-15) and 2005 (EU-25), output grew from 2 million to 3.62 million tonnes. Five main producers operate in the EU: Saint-Gobain (21 installations in 13 Member States); Rockwool International (15 installations in 10 Member States); Paroc (7 installations in 4 Member States); URSA (7 installations in 7 Member States: Spain, France, Belgium,

Chapter 1
30 Manufacture of Glass
Germany, Slovenia, Hungary and Poland); and Knauf Insulation/Heraklith (combined in 2006 with 10 installations in 6 Member States). Most of these companies have operations in non-EU countries or in other sectors. There are also several independent manufacturers in the EU.
The geographical distribution of the mineral wool sector, the estimated share of production and the range of installation sizes are shown in Table 1.16 and Table 1.17. However, a new plant not included here will be built in Angers, France.
Table 1.16: Number of mineral wool installations in the EU-27
Member State Number of installations Approximate % of EU production
Germany 10 18.1 Poland 6 13.3 France 5 10.2 The Netherlands 2 8.8 United Kingdom 5 7.1 Denmark 3 5.8 Finland 5 5.6 Spain 4 4.8 Sweden 3 4.2 Belgium 2 4.1 Czech Republic 2 3.4 Slovenia 3 3.0 Hungary 3 2.7 Slovakia 1 2.2 Austria 2 1.9 Italy 2 1.5 Lithuania 1 1.4 Portugal 2 1.0 Greece 1 0.8 Ireland 1 0.2 Romania 1 0.2 Bulgaria 0 0.0 Cyprus 0 0.0 Estonia 0 0.0 Latvia 0 0.0 Luxembourg 0 0.0 Malta 0 0.0 Total 64 3 654 333 tonnes Source: [69, EURIMA data collection 2007] [133, EURIMA Contribution November 2008]
Table 1.17 shows the number of installations falling into specified production ranges in 2005. Several of the installations operate more than one furnace. These figures represent actual output in 2005 and it is estimated that most installations were operating between 10 and 20 % below full capacity. The average production per installation in 2005 was in the region of 58 064 tonnes. It should be noted that these figures are for tonnage and for a given application; stone wool products are significantly more dense than glass wool products, particularly for the lower density range.
Table 1.17: Number of mineral wool installations in specified production ranges Production range (tonnes/day) <27 27 to 82 82 to 164 164 to 274 >274
Production range (tonnes/year) <10 000 10 000 to 30 000 30 000 to 60 000 60 000 to 100 000 >100 000
Number of installations in each range
4 12 24 17 7
NB: Days production/year: 350 Source: [69, EURIMA data collection 2007] [133, EURIMA Contributions November 2008]

Chapter 1
Manufacture of Glass 31
1.8.2 Products and markets [27, EURIMA 1998]
Mineral wool was first produced in 1864 by applying a jet of steam on molten slag escaping from a blast furnace. Commercial patents and production began in about 1870. The market started to grow significantly during World War II when there was a demand for cheap prefabricated housing to replace damaged homes. In 1943, in the US alone, there were over 500 000 tonnes of mineral wool produced. In most developed countries, thermal insulation has become universally accepted and incorporated into almost every form of building. In addition to its thermal properties, mineral wool insulation has good acoustic and fire-protection properties. The main products are low-density insulation rolls, medium and high-density slabs, loose wool for blowing, and pipe insulation. The main markets for these products are: building thermal insulation (walls, roofs, floors, etc.); heating and ventilation applications; industrial (technical) installations (process pipework, vessels, chemical plant, offshore and marine); fire protection; acoustics (sound absorption and insulation); inert growing media and soil conditioning. Glass wool and stone wool are interchangeable in many applications, but some applications demand one product in preference to the other. Stone wool is usually favoured for high temperature or fire-protection applications, and glass wool is frequently used where a light weight is critical. The most important market for mineral wool is the building industry, which takes up to 70 % of output and is very dependent on the prevailing economic climate and on the regulatory framework. In spite of the technical expertise required to manufacture fibre insulation, it is essentially a commodity product. There is little opportunity for differentiation between products competing in the same markets, and competition is based mainly on price. This has led to substantial cost reductions and downsizing within the sector. Price competition is weaker in the ‘technical’ product market, which requires higher value added products such as rigid pipe sections for high temperature and fire-resistant applications. Due to the moderate temperature range required for the building industry, a wide variety of alternative insulation materials is available, the most common being: plastic foams (the main competitor), cellulose fibre (shredded newspaper), vermiculite and perlite, and foamed glass. None of these materials can match mineral wool in all areas of performance (low price, thermal performance, acoustic performance, flammability, and ease of installation), but they all have their place in the market.
1.8.3 Commercial and financial considerations [27, EURIMA 1998] [9, IPC Guidance S2 3.03 1996]
The mineral wool sector is a very mature business with a growth rate of around 3 % per year and is increasingly competitive. Mineral wool products have a low value to volume ratio, which limits the distance over which they can be economically transported. Despite this, there is significant trade within the EU but extra-EU trade represents less than 5 % of output. Clearly, extra-EU trade is greatest for those Member States that border non-EU countries.
Mineral wool production is a very capital-intensive activity requiring substantial financial resources, long-term investment and highly technical skills. This creates a substantial barrier against entry into the market and most producers are large companies with a long history in the business. There are only a few small independent manufacturers. The mineral wool sector uses oxy-gas, recuperative and electrical furnaces for glass wool production; and predominately hot blast cupolas for stone wool production. Furnaces have a

Chapter 1
32 Manufacture of Glass
limited lifetime and the furnace replacement interval will vary according to design. Recuperative and oxy-gas furnaces will run for 8 to 12 years before a major repair is needed, and electrically heated furnaces for 3 to 6 years. Cupola furnaces have longer periods and do not operate continuously for long periods, usually operating for 1 to 3 weeks between shutdowns. A typical glass wool plant of 60 000 tonnes per year represents an investment cost of around EUR 100 million. A stone wool plant producing a similar volume (i.e. approximately 120 000 tonnes per year) would represent a similar investment. The costs of glass furnace replacements are comparable to those quoted for the other glass sectors.
1.8.4 Main environmental issues In common with all glass making activities, mineral wool production is a high temperature, energy-intensive process. For fossil-fuelled furnaces, this results in the emission of products of combustion and the high-temperature oxidation of atmospheric nitrogen, i.e. sulphur dioxide, carbon dioxide, and nitrogen oxides. Furnace emissions also contain dust, and traces of chlorides, fluorides and metals if present as impurities in the raw materials. In the mineral wool sector there are two further important emission sources: the forming area (where the binder is applied to the fibres) and the curing oven (where the product is dried and the binder cured). Forming area emissions are likely to contain significant levels of particulate matter, phenol, formaldehyde, ammonia and water. Curing oven emissions will contain volatile binder components, binder breakdown products, and combustion products from the oven burners. Technical solutions are possible for minimising all of these emissions, but each technique has associated financial and environmental cross-media implications. Major environmental improvements have been made in mineral wool production. Emissions have been reduced substantially and major reductions have been made in energy consumption. In general, the production of mineral wool insulation should not present major water pollution problems. The basic processes are net users of water, mainly due to evaporation from the forming area and curing oven. Process water systems are usually a closed loop with clean water top up, but precautions are necessary to prevent contamination of clean water systems. Emissions can be minimised by appropriate techniques for handling and spillage containment, and residual levels of pollution can be treated with standard techniques. In considering the overall environmental impact of the sector, it is useful to consider some of the environmental benefits associated with the products. The production of mineral wool requires relatively little energy, compared to the potential saving during the use of the products. In less than one month following installation, mineral wool products can save the entire quantity of energy used for their manufacture. After 50 years of use, which is common for buildings, the amount of energy saved can be 1000 times greater than that consumed during production. If compared to typical CO2 emissions from fossil fuel derived power generation, after 50 years use, a product can also save 1000 times the quantity of CO2 emitted during its production. At higher temperatures, for example, in pipes, boilers and process plant, the savings can be significantly higher, and the environmental return on the investment can be days rather than weeks.

Chapter 1
Manufacture of Glass 33
1.9 High temperature insulation wools 1.9.1 Sector overview [41, ECFIA 1998] [116, ECFIA 2008] [143, ECFIA November 2008]
In this document, only the production of ‘amorphous’ high temperature insulation glass wools (HTIW) by melting mineral substances is discussed. Some wools (e.g. polycrystalline alumina wools-PCW) can be produced by the sol-gel method which is a chemical process, but these activities do not fall within the definitions given in Sections 3.3 or 3.4 of Annex I to Directive 2008/1/EC and therefore will not be considered in this document. There are currently (2010) four production plants in the EU and the estimated production in 2005 was approximately 42 750 tonnes (representing 0.11 % of the total glass industry and 1.2 % of the mineral wool sector), arising predominantly from the UK, France and Germany. There are three companies operating in the EU: Thermal Ceramics (one production installation), Unifrax (two production installations), and Rath (one installation). The geographical distribution of the production installations is given in Table 1.18.
Table 1.18: Distribution of HTIW installations in Member States Member State Number of installations
France 2 Germany 1 United Kingdom 1 Total 4
1.9.2 Products and markets [41, ECFIA 1998] [116, ECFIA 2008] [70, VDI 3469-1 2007] [71, VDI 3469-5 2007][129, EN 1094-1 2008] [176, TRGS 619 2007]
There are basically two types of inorganic high temperature insulation wools (HTIWs). In addition to the most commonly applied amorphous wools (AES and ASW/RCF), polycrystalline alumina wool (PCW) is available. Strictly speaking, AES wools belong to the mineral wool group on the basis of their chemical compositions. However, because of the specificity of their use in the high temperature applications field, they are grouped under the HTIW products. Amorphous high temperature insulation wool with up to 58 % Al2O3 content can be produced in a melting process. According to the European Standard EN 1094-1 (Insulating refractory products-Part 1: Terminology, classification and methods of test for high temperature insulation wool products-see www.cen.eu/cenorm/index.htm), the amorphous HTIW dealt with in this document can be classified as follows:
• aluminium-silicate glass wools (ASW) or also known as refractory ceramic fibres (RCF) ◦ aluminium-silicate glass wool (high purity) ◦ aluminium-silicate-zirconium glass wool.
• alkaline earth silicate glass wool (AES):
◦ calcium-silicate glass wool ◦ calcium-magnesium-silicate glass wool ◦ calcium-magnesium-zirconium-silicate glass wool ◦ magnesium-silicate glass wool.

Chapter 1
34 Manufacture of Glass
The calcium-magnesium-zirconium-silicate glass wool is no longer produced but it is still in place in installations. All products of HTIW share similar characteristics including:
• low bulk density • low heat storage capacity • low thermal conductivity, and • almost unlimited thermal shock resistance. ASW/RCF products are especially suitable for achieving considerable energy savings in high temperature applications of between 600 °C and up to 1400 °C. AES (alkaline-earth-silicate) wools consist of amorphous fibres produced by melting a combination of CaO, MgO, SiO2 and ZrO2. These products are generally used at application temperatures of <1200 ºC. Figure 1.2 shows the most popular high temperature insulation wools for applications between 600 and 1800 ºC.
High temperature insulation wool HTIW
Aluminium-silicate glass wool or
Refractory ceramic fibres (RCF)
Polycrystalline wool(PCW)
Alkaline earth silicate glass wool (AES)
Aluminium-silicatewool
Aluminium-silicate-zirconium wool
Alumina-based wool
Calcium-magnesium-silicate wool
Calcium-magnesium-zirconium-silicate wool
Magnesium-silicate wool
Calcium-silicate woolCalcium-silicate wool
Source: [71, VDI 3469-5 2007] [116, ECFIA 2008] [129, EN 1094-1 2008]
Figure 1.2: Most popular high temperature insulation wools for above 600 °C and up to 1800 °C
Amorphous aluminium-silicate wool (ASW/RCF) is mainly used as a high temperature insulation material (600 – 1400 °C) for industrial appliances (90 % for furnace lining and industrial insulation, 8 % for automotive use, and 2 % for fire protection). Alkaline-earth-silicate glass wool (AES) is mainly used for domestic appliances (33 %), industrial insulation (45 %), fire protection (12 %) automotive (4 %) and other applications (6 %). The main product forms are bulk wool, blanket (felt or modules), board, paper, vacuum formed articles, and textiles. All the mentioned products originate from bulk wool. Many of the products are sold into traditional heavy industries such as chemical, petrochemical, iron and steel, ceramics, glass, non-ferrous metals, cement, etc. HTIW products have a relatively high value and can be economically transported to most markets in the world. Besides the use for furnace installations, the products are often converted into or incorporated into other products such as automotive catalytic converters, diesel particulate filters, [177, VDI 3677 Part 1, draft edition 2009] gaskets, piston linings and heat shields. Around 30 – 40 % of primary products are used as components in secondary applications.
Chapter 1
Manufacture of Glass 35
1.9.3 Commercial considerations [41, ECFIA 1998] [116, ECFIA 2008]
The HTIW industry produces niche products mainly for industrial applications. When compared with the overall mineral wool production sector, this is a tiny industry (1.2 %) and even smaller compared with the glass sector as a whole (0.11 %). In 2008, there were only three companies producing amorphous HTIW in the EU as a result of a consolidation within the sector. The main factor affecting the HTIW industry is the cost of production (energy, raw materials and labour). The estimated cost of a new factory of typical capacity is EUR 6 – 8 million. Furnaces are electrically heated and have a lifetime of 10 to 20 years; costs for a new furnace are estimated at EUR 100 000 – 200 000. Refurbishing of furnaces (electrodes, lining, etc. as applicable) occur about every three months implying about EUR 20 000 in maintenance costs. The main factors affecting the industrial users of the products are the benefits derived from energy savings, reduced CO2 emissions, higher quality of their products and more flexibility of the aggregate in which HTIW is used. A significant amount of production is exported and imports are relatively low. On account of the significant benefits mentioned above, when compared with other refractory materials (like bricks and castables), HTIW products are especially suitable for achieving considerable energy savings and a reduction of greenhouse gases (i.e. CO2). As an example, energy savings of up to 30 % have been reported when applying HTIW modules in the steel industry compared to conventional linings. Competition exists for some low-temperature applications (<800 °C) from mineral wool, and for special very high-temperature applications (>1300 °C) from polycrystalline alumina wools (PCW). Stone and glass wool products are substantially cheaper than those made from ASW/RCF and AES wools, whereas those produced from polycrystalline alumina wools are more expensive. Owing to the unique thermal and physical properties of HTIWs, there is no immediate competitive threat from substitutes. Requirements of the application itself and technical conditions in the production process determine what product is the most appropriate, also in comparison to insulating fire bricks and castables.
1.9.4 Main environmental issues [116, ECFIA 2008]
Unlike other sectors of the glass industry, the HTIW sector exclusively uses electrical resistant furnaces and consequently direct emissions from the furnaces are very low and readily controlled (filters for dust removal). The main environmental issue is the emission of particulate matter into air, which, in the case of downstream activities, may contain fibrous dust. This is dealt with by air filtration systems. Under the definitions of the Dangerous Substances Directive 67/548/EEC (see Regulation (EC) No 1272/2008), aluminium silicate glass wool/refractory ceramic fibres (ASW/RCF) have been classified as a Category 2 carcinogen; taken over into the Classification, Labelling and Packaging (CLP) Regulation (EC) No 1272/2008. AES wools are exonerated from this classification. Based on their classification, fibre emissions in the work place and to the environment must be carefully controlled.

Chapter 1
36 Manufacture of Glass
Generally, waste levels are relatively low. There are low levels of aqueous emissions which contain suspended solids. Some organic compounds may arise from secondary processing operations. Emissions levels of HTIW production plants are very low. The installations in the EU are all fitted with dust abatement equipment where necessary.
1.10 Frits 1.10.1 Sector overview [47, ANFFECC 1999]
The frits sector is usually associated with the ceramic industry, but falls within the scope of this document because it is covered under the definition in Section 3.4 of Annex I to Directive 2008/01/EC. Production in the EU was estimated at 1.25 million tonnes for the year 2005, making frits one of the smallest sectors of the glass industry. The number of employees is difficult to establish because, for many companies, frits production is only a small part of the business. The sector covers the production of frits for glazes and enamels, which are used for decorating ceramic materials and metals. Glass frits or ceramic frits amount to about 95 % of the total frits production (ceramic and enamel). It is estimated that there are around 50 installations in the EU, with the majority being located in Spain and Italy. Spain is the largest producer in the world, accounting for over 80 % of total EU production. The geographical distribution of frits installations with a total capacity of >20 tonnes/day located in Europe is shown in Table 1.19.
Table 1.19: Distribution of frits installations with a total capacity of >20 tonnes/day (2008 estimation)
Member State Number of installations Spain 21 Italy 9 Germany 5 Czech Republic 2 France 2 The Netherlands 2 Poland 2 United Kingdom 2 Portugal 1 Belgium 1 Austria 1 Total 48 (estimated) Source:[99, ITC-C080186 2008]
The distribution of the production capacity for the installations located in Spain which represents the majority of the frits sector is shown in Table 1.20.
Table 1.20: Number of frits installations located in Spain in specified production ranges (estimates)
Production range (tonnes/day) <50 50 to 150 >150
Number of installations in each range 4 12 5
Source: [98, ANFFECC Position of the Frit Sector 2005][99, ITC-C080186 2008]
Chapter 1
Manufacture of Glass 37
1.10.2 Products and markets [47, ANFFECC 1999] [9, IPC Guidance S2 3.03 1996]
The principal application of glass frits is in the manufacture of ceramic glazes and pigments. These glazes, when applied to the surface of ceramic bodies such as tiles and tableware, and then fired, provide an impervious, protective and decorative coating. Frits may be sold in the pure form to the ceramic ware manufacturers who create their own glazes, or the frits manufacturers may produce and supply the glazes themselves. Across the sector, typically over half of the frits manufactured are used internally in the production of glazes. Enamel frits are used in the manufacture of enamel glazes, the principal application of which is the coating of metal surfaces to provide a chemically and physically resistant covering. The principal market for enamels is in the manufacture of cooking equipment, and as a coating for hobs, ovens, grills, etc. Other applications for enamels include storage tanks, silos, baths, electronic components and signs. Enamel frits represent only around 5 % of frits production. Frits are relatively high value, low-volume products and transport costs generally comprise a relatively small proportion of the total product price. Worldwide consolidation in the industry is resulting in relatively fewer but larger plants serving wider international markets. Although this is a leading and strategic sector in the EU, the threat involved in the possibility of producing frits outside the EU should be considered, since the environmental regulations, the cost of the raw materials and the social and economic conditions may enhance their involvement in the market against the frits produced in the EU.
1.10.3 Commercial considerations [47, ANFFECC 1999] [9, IPC Guidance S2 3.03 1996]
The volume of frits production has increased considerably, with Spain showing an increase in sales during the last few years. There is fierce international business competition with countries outside the EU. While a large number of frits produced in the EU are consumed within the EU, exports to countries outside the EU are also a major market for ceramic frits producers. The production of ceramic frits is a well-established industry that has been supplying the ceramic sector for many years. Competition from other types of glazes that do not contain frits is scarce because of their lack of suitable technical properties. Alternative materials, such as plastic coatings, have been developed for tableware, but these suffer from the same leachability problems as raw glazes, particularly in the presence of organic acids, which are commonly found in food. It is not known to what extent plastic coatings may influence the market for fritted tile glazes. Threats to enamel glazes from substitutes are small. Alternatives, such as paints, could potentially be used in similar applications, but they cannot match the properties of enamels in terms of heat, chemical and scratch resistance, and ‘cleanability’.
Chapter 1
38 Manufacture of Glass
1.10.4 Main environmental issues The main environmental issue associated with frits production is that the production process is energy intensive and requires a high temperature. This condition results in the emissions of combustion products which include nitrogen oxides due to the oxidation of atmospheric nitrogen at the high temperature of the furnace, and from the volatilisation of materials used in the batch composition. Furnace emissions also contain dust that arises from the volatilisation and subsequent condensation of volatile materials, the composition of which may contain different elements depending on the type of raw materials and substances used in the batch composition such as traces of chlorides, fluorides and metals. In principle, technical solutions are possible for minimising all of these emissions, but each technique involves relevant financial and environmental implications which should be thoroughly evaluated in order to determine its viability. Water is used mainly for cooling in the fritting process and in installation cleaning processes. Water is always used in closed circuits. Waste levels are very low, arising mainly from the solids collected from the water circuits. In many cases, waste from dust abatement equipment can be recycled to the furnace.

Chapter 2
Manufacture of Glass 39
2 APPLIED PROCESSES AND TECHNIQUES The first three general sections of this chapter cover the common raw material and melting considerations that apply to most of the sectors in the glass industry. The following sections then describe separately the specific issues for each of the sectors. Three of the sectors, namely stone wool, frits and high temperature insulation wools, differ in some of the materials and techniques utilised. These differences have been covered in the sections relating to each sector.
2.1 Materials handling The diversity of the glass industry results in the use of a wide range of raw materials. The majority of these materials are solid inorganic compounds, either naturally occurring minerals or man-made products. They vary from very coarse materials to finely divided powders. Liquids and, to a lesser extent, gases are also used within most sectors. The gases used include hydrogen, nitrogen, oxygen, sulphur dioxide, propane, butane and natural gas. These are stored and handled in conventional ways for example, via direct pipelines, dedicated bulk storage, and cylinders. A wide range of liquid materials are used, including some which require careful handling such as phenol and strong mineral acids. All standard forms of storage and handling are used within the industry, e.g. bulk storage, intermediate bulk containers (IBCs), drums and smaller containers. Potential techniques for minimising emissions from liquid storage and handling are discussed in Chapter 4. Very coarse materials (i.e. with a particle diameter of >50 mm) are only used in stone wool production. These materials are delivered by rail or road haulage and conveyed either directly to silos or stockpiled in bays. Storage bays can be open, partially enclosed or fully enclosed; there are examples of all three within the sector. Where coarse material is stored in silos they are usually open and are filled by a conveyor system. The materials are then transferred to the furnace by means of enclosed conveyor systems. Materials are mixed simply by laying them on the feeder conveyor simultaneously. Granular and powdered raw materials are delivered by rail or road tanker and are transferred either pneumatically or mechanically to bulk storage silos. Pneumatic transfer of the materials requires them to be essentially dry. Displaced air from the silos is usually filtered. Lower-volume materials can be delivered in bags or kegs and are usually gravity fed to the mixing vessels. In large continuous processes, the raw materials are transferred to smaller intermediate silos from where they are weighed out, often automatically, to give a precisely formulated ‘batch’. The batch is then mixed and conveyed to the furnace area, where it is fed to the furnace from one or more hoppers. Various feeder mechanisms are found in the industry ranging from completely open systems to fully enclosed screw fed systems. To reduce dust during conveying and ‘carryover’ of fine particles out of the furnace, a percentage of water can be maintained in the batch, usually 0 – 4 % (some processes, e.g. borosilicate glass production, use dry batch materials). The water content can be introduced as steam at the end of the mixing operation but the raw materials may have an inherent water content. In soda-lime glass, steam is sometimes used to keep the temperature above 37 °C and prevent the batch from being dried by the hydration of the soda ash. Due to its abrasive nature and larger particle size, cullet is usually handled separately from the primary batch materials and may be fed to the furnace in measured quantities by a separate system.

Chapter 2
40 Manufacture of Glass
In discontinuous processes, the batch plant is much smaller and is often manually operated. Following mixing, the batch can be stored in small mobile hoppers each containing one charge for the melter. Sometimes, several charges will be made up of different formulations and stored close to the melter for use during a specific melting period. As with large scale melting, the mixed batch cannot be stored for too long before use because the different components can settle out, which makes it difficult to obtain an homogenous melt. The presence of water in the batch helps to mitigate this tendency.
2.2 Glass melting Melting, the combination of the individual raw materials at high temperature to form a molten glass, is the central phase in the production of glass. There are numerous ways to melt glass depending on the desired product, its end use, the scale of operation, and the prevailing commercial factors. The glass formulation, raw materials, melting technique, fuel choice and furnace size will all depend on these factors. The residence time of the glass melt in the furnace varies significantly by the type of glass produced. The minimum residence time is a crucial parameter for ensuring glass quality. Normally, the higher the quality of glass produced, the longer the residence time, in order to ensure a perfect homogenisation and elimination of possible stones, bubbles, etc. which would affect the properties of the final product. The difference in residence time of the glass melt in the furnace is directly associated with the specific energy consumption; therefore, for a given capacity of the melting furnace, the type of glass produced can be associated with a significantly different energy consumption.
2.2.1 Raw materials for glass making [19, CPIV 1998] [22, Schott 1996] [66, APFE UPDATE IPPC Glass BREF 2007][100, ICF BREF revision 2007]
The most important glass making raw materials are given in Table 2.1.
Table 2.1: Important glass making raw materials Glass-forming materials Silica sand, process cullet, post-consumer cullet Intermediate and modifying materials Soda ash (Na2CO3), limestone (CaCO3), burnt lime (CaO), dolomite (CaCO3.MgCO3), burnt dolomite (CaO.MgO), feldspar, nepheline syenite, potassium carbonate, fluorspar, alumina, zinc oxide, lead oxide, barium carbonate, strontium carbonate, basalt, anhydrous sodium sulphate, calcium sulphate and gypsum, barium sulphate, sodium nitrate, potassium nitrate, boron-containing materials (e.g. borax, colemanite, boric acid), antimony oxide, arsenic trioxide, blast furnace slag (mixed calcium, aluminium, magnesium silicate and iron sulphide) Colouring/decolouring agents Iron chromite (Fe2O3.Cr2O3), iron oxide (Fe2O3), cobalt oxide, selenium/zinc selenite, carbon, sulphides (pyrite).
A detailed table on raw materials is given in Section 3.2.1. Sand is the most important raw material for glass making, being the principal source of SiO2. It is a common raw material but most deposits are not of sufficient purity for glass making. The melting point of sand is too high for economic melting and a fluxing agent, usually sodium oxide, is needed to reduce the melting temperature.
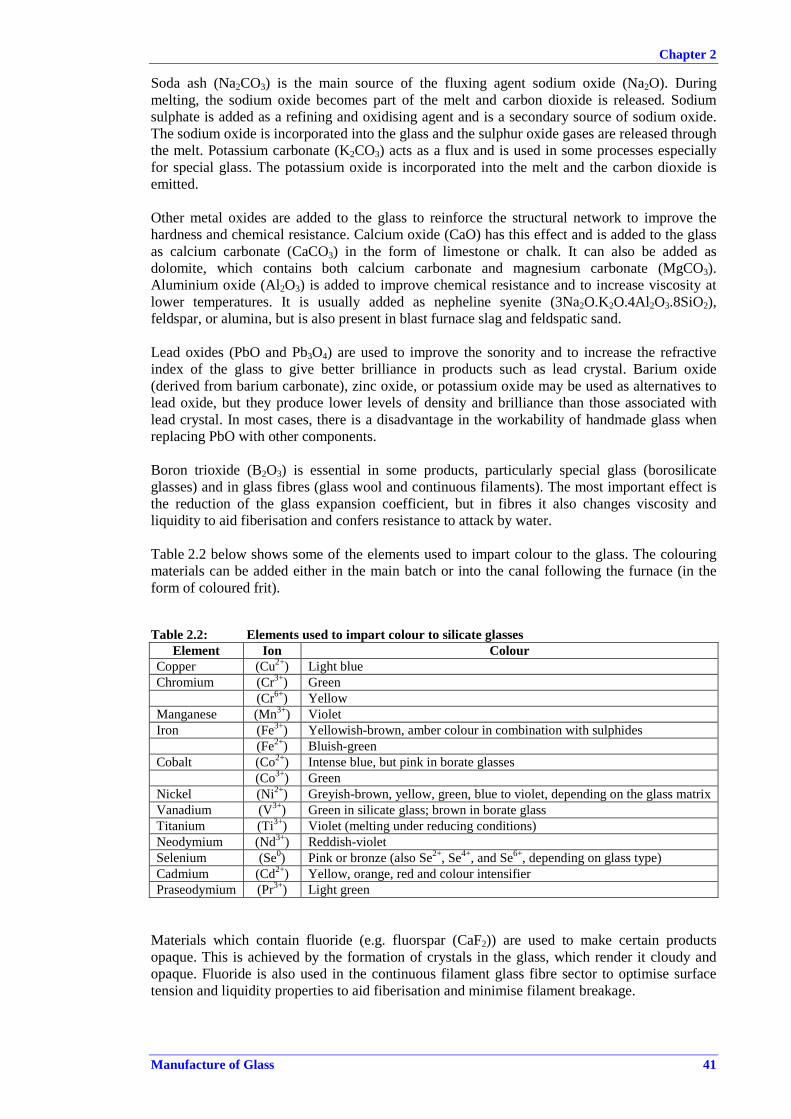
Chapter 2
Manufacture of Glass 41
Soda ash (Na2CO3) is the main source of the fluxing agent sodium oxide (Na2O). During melting, the sodium oxide becomes part of the melt and carbon dioxide is released. Sodium sulphate is added as a refining and oxidising agent and is a secondary source of sodium oxide. The sodium oxide is incorporated into the glass and the sulphur oxide gases are released through the melt. Potassium carbonate (K2CO3) acts as a flux and is used in some processes especially for special glass. The potassium oxide is incorporated into the melt and the carbon dioxide is emitted. Other metal oxides are added to the glass to reinforce the structural network to improve the hardness and chemical resistance. Calcium oxide (CaO) has this effect and is added to the glass as calcium carbonate (CaCO3) in the form of limestone or chalk. It can also be added as dolomite, which contains both calcium carbonate and magnesium carbonate (MgCO3). Aluminium oxide (Al2O3) is added to improve chemical resistance and to increase viscosity at lower temperatures. It is usually added as nepheline syenite (3Na2O.K2O.4Al2O3.8SiO2), feldspar, or alumina, but is also present in blast furnace slag and feldspatic sand. Lead oxides (PbO and Pb3O4) are used to improve the sonority and to increase the refractive index of the glass to give better brilliance in products such as lead crystal. Barium oxide (derived from barium carbonate), zinc oxide, or potassium oxide may be used as alternatives to lead oxide, but they produce lower levels of density and brilliance than those associated with lead crystal. In most cases, there is a disadvantage in the workability of handmade glass when replacing PbO with other components. Boron trioxide (B2O3) is essential in some products, particularly special glass (borosilicate glasses) and in glass fibres (glass wool and continuous filaments). The most important effect is the reduction of the glass expansion coefficient, but in fibres it also changes viscosity and liquidity to aid fiberisation and confers resistance to attack by water. Table 2.2 below shows some of the elements used to impart colour to the glass. The colouring materials can be added either in the main batch or into the canal following the furnace (in the form of coloured frit).
Table 2.2: Elements used to impart colour to silicate glasses Element Ion Colour
Copper (Cu2+) Light blue Chromium (Cr3+) Green
(Cr6+) Yellow Manganese (Mn3+) Violet Iron (Fe3+) Yellowish-brown, amber colour in combination with sulphides
(Fe2+) Bluish-green Cobalt (Co2+) Intense blue, but pink in borate glasses
(Co3+) Green Nickel (Ni2+) Greyish-brown, yellow, green, blue to violet, depending on the glass matrix Vanadium (V3+) Green in silicate glass; brown in borate glass Titanium (Ti3+) Violet (melting under reducing conditions) Neodymium (Nd3+) Reddish-violet Selenium (Se0) Pink or bronze (also Se2+, Se4+, and Se6+, depending on glass type) Cadmium (Cd2+) Yellow, orange, red and colour intensifier Praseodymium (Pr3+) Light green
Materials which contain fluoride (e.g. fluorspar (CaF2)) are used to make certain products opaque. This is achieved by the formation of crystals in the glass, which render it cloudy and opaque. Fluoride is also used in the continuous filament glass fibre sector to optimise surface tension and liquidity properties to aid fiberisation and minimise filament breakage.

Chapter 2
42 Manufacture of Glass
An increasingly important raw material in glass making is glass cullet (broken glass), both in-house cullet and external or foreign cullet. Virtually all processes recycle their in-house cullet, but for some processes, quality constraints mean it may not be possible to secure a supply of foreign cullet of sufficient quality and consistency to make its use economically viable. In most continuous filament glass fibre production the internal cullet is not recycled, while in the container glass sector, cullet usage at over 80 % of the batch is sometimes used. Cullet requires less energy to melt than virgin raw materials, and every 1 tonne of cullet replaces approximately 1.2 tonnes of virgin material in the batch formulation of most soda-lime-silica glasses. In order to guarantee the quality of the cullet suitable for the melting process and for the characteristics of the final product, the presence of ceramics, glass ceramics, metals, organic matter, etc. must be avoided or limited. The emissions of some pollutants can be directly related to the usage of cullet. More information about cullet usage can be found in Section 4.8.3.
2.2.2 The melting process [22, Schott 1996]
The melting process is a complex combination of chemical reactions and physical processes. This section only represents a brief summary of some of the important aspects of the process. Melting can be divided into several phases which all require very close control. Heating The conventional and most common way of providing heat to melt glass is by burning fossil fuels above the batch blanket or batch piles and above the molten glass. The batch material is continuously fed into and then withdrawn from the furnace in a molten condition. The temperature necessary for melting and refining the glass depends on the precise formulation, but is between 1300 and 1550 ºC. At these temperatures, heat transfer is dominated by radiative transmission, in particular from the furnace crown, which is heated by the flames to up to 1650 ºC, but also from the flames themselves. In each furnace design, heat input is arranged and controlled in order to generate temperature differences in the glass melt and to induce recirculating free convection flows within the molten glass to ensure a consistent homogeneity of the finished glass fed to the forming process. The mass of molten glass contained in the furnace is held constant, and the mean residence time is in the order of 24 hours of production for container furnaces and 60 – 72 hours for float glass furnaces. Primary melting Due to the low thermal conductivity of the batch materials, the melting process is initially quite slow allowing time for the numerous chemical and physical processes to occur. As the materials heat up, the moisture evaporates, some of the raw materials decompose and the gases trapped in the raw materials escape. The first reactions (decarbonisation) occur at around 500 ºC. The raw materials begin to melt at between 750 and 1200 ºC. First the sand begins to dissolve under the influence of the fluxing agents. The silica from the sand combines with the sodium oxide from the soda ash and with other batch materials to form silicates. At the same time, large amounts of gases escape through the decomposition of the hydrates, carbonates, nitrates and sulphates; giving off water, carbon dioxide, oxides of nitrogen, and oxides of sulphur. The glass melt finally becomes transparent and the melting phase is completed. The volume of the melt is about 35 – 50 % of the volume of the virgin batch materials due to the loss of gases and the elimination of interstitial spaces. Fining and homogenisation In general, the glass melt must be completely homogenised and free of bubbles before it can be formed into products. The complete dissolution and even distribution of all components and the elimination of the bubbles from the molten glass are essential for most glass products. The
Chapter 2
Manufacture of Glass 43
elimination of the bubbles from the melt is defined as the (re)fining process, consisting of primary fining (bubble growth, bubble ascension and gas stripping from the melt and secondary fining (dissolution of bubbles in the melt during controlled cooling). Just after melting or fusion of the raw materials, a viscous melt with dissolved gases (air, CO2)and smaller (seeds) or larger gas bubbles (blisters) will be formed. For most homogeneous glass products (flat glass, tableware, continuous filament glass fibres, display glass, containers, tubes, etc.), all or almost all of these bubbles should be eliminated or removed to achieve the required glass quality. The removal of gases from glass melts is not limited to the elimination of bubbles, blisters and seeds from the molten glass, but also includes the stripping of dissolved gases from glass melts. Effective stripping of gases from the molten glass, such as nitrogen and CO2, will reduce the risk of ‘reboil’ (formation of new bubbles in the melt) and blister formation downstream of the primary fining process, for instance by interaction of the melt with refractory materials. An increased bubble size and consequently an increased bubble ascension in the melt enhance the removal of these bubbles, bringing them to the glass melt surface during primary fining. The gas release during primary fining will support the diffusion of fining gases into existing bubbles in the glass melt, which will start growing and increasing their ascension rate (bubble ascension rates increase with the square of the bubble diameter); this will increase the size of the bubbles and therefore the Stokes ascension velocity in the viscous melt. The ascension rate is proportional to the reciprocal value of the glass melt viscosity, and glass viscosity is strongly determined by the glass melt temperature and therefore decreases with temperature. The growing bubbles will also take up other dissolved gases from the melt, such as water vapour, CO2 and N2 (stripping). The mechanism of the primary fining of a glass melt includes the removal of bubbles by bubble growth and enhanced bubble ascension in the melt in combination with gas stripping (the removal of dissolved gases from the melt by gas absorption of the bubbles). The secondary fining process takes place during controlled cooling of the molten glass, when reabsorption of the remaining bubbles occurs resulting in a reduction of bubble size or complete bubble dissolution. Because of the low viscosity at high temperatures and the decomposition of fining agents above the onset temperature for fining, the primary fining process takes place in the highest temperature zones of the glass melt tank. The release of fining gases, essential for the primary fining process depends on the temperature, the fining agent content of the batch and melt, and the oxidation state. Fining agents are added to the raw material batch and generally dissolve in the molten glass. At elevated temperatures (above the temperature at which the batch has been melted) the fining agent should decompose and form dissociation gases (O2, SO2) or the fining agent may evaporate from the melt (forming vapours that diffuse into the existing bubbles/seeds). The most used fining agent applied in the glass industry is sodium sulphate, forming SO2 and O2 gas upon decomposition. Other fining agents include oxides of arsenic and antimony, forming oxygen gas, or sodium chloride forming NaCl vapours. In order to be able to release oxygen gas during fining, arsenic and antimony need to be present in the melt in the most oxidised state; in some cases, for this purpose, nitrates need to be added to the batch composition. The oxidation state (redox state) will determine the valency state of the polyvalent ions in the melt and glass product. The valency state is important not only for the fining process but also for determining the colour of glass, since polyvalent ions such as chromium, iron, copper, and sulphur may give the glass a certain colour depending on their valency state. The redox state of the glass melt can be modified by means of nitrates and sulphates (oxidising agents) or carbon (a reducing agent). The choice of the fining agent (chemical fining) depends on the type of glass to be produced. Some glasses may not contain sulphates (i.e. display glasses) or need fining agents that only release their fining gases at very low (hand-blown glasses) or very high temperatures

Chapter 2
44 Manufacture of Glass
(where viscosity level is sufficiently low typically <50 Pa⋅s). Also the oxidation state at which the glass should be melted to obtain the required colour will determine the choice of the fining agents; some fining agents are only effective at very highly oxidised conditions. Therefore, the selection of fining agents depends on the temperatures in the melt, the redox state of the glass and environmental considerations. Sulphate fining typically takes place at temperatures above 1300 ºC in most soda-lime-silica glass melts, depending on the batch redox state (for instance, depending on the presence and level of sulphate and carbon in the batch formulation). When changing the atmospheric condition of the furnace, for instance after conversion from air to oxygen firing, an adjustment of the batch composition is often necessary. Sodium sulphate is the most frequently used fining agent, particularly for normal flat glass, most container glass, soda-lime-silica tableware glass, continuous filament glass fibre (E-glass), and soda-lime-silica lighting glass types. Sodium sulphate decomposes into sodium oxide (which is incorporated into glass) and gaseous oxides of sulphur and oxygen gas which can be absorbed into the glass, or released with the furnace waste gases. Homogenisation of the molten glass can also be aided by introducing bubbles of steam, oxygen, nitrogen or more commonly air through equipment in the bottom of the tank. This encourages circulation and mixing of the glass and improves heat transfer. Some processes, for example the production of optical glass, may use stirring mechanisms in the melting tank, working-end or feeders to obtain the high degree of homogeneity required. Another technique for use in small furnaces (especially special glass) is known as plaining; and involves increasing the temperature of the glass so it becomes less viscous and the gas bubbles can rise more easily to the surface. The maximum crown temperatures encountered in glass furnaces are: container glass 1600 ºC, flat glass: 1620 ºC, special glass: 1650 ºC, continuous filament glass fibre: 1650 ºC, and glass wool: about 1400 ºC (but may be higher) [103, Beerkens, Fining glass. Boron 2008]. Redox state of glass As already mentioned above, the redox state of glass is an important technological aspect of the glass melting process, having an influence on the fining stage of the glass melt, the colour of the glass and its infrared absorption characteristics (heat absorption). The redox state of the glass is often measured by determining the equilibrium oxygen pressure (pO2) of the melt (partial pressure in equilibrium with the dissolved oxygen). The amount of dissolved oxygen in the melt depends mainly on the presence and quantity of oxidising agents (supplying oxygen) or reducing agents (reacting with oxygen and absorbing it) in the batch formulation. Among the oxidising agents, the most important are sulphates, nitrates and polyvalent ions in their most oxidised state (e.g. Fe2O3, Sb2O5, As2O5, SnO2, CeO2). Typical reducing agents are organic compounds (mainly present in the external cullet), carbon, sulphides and reduced forms of polyvalent ions. A difference in the redox state of the melt may result in a significant colour change in the glass. For instance, the presence of ferric iron (Fe3+) produces a yellowish-brown colour, while the presence of ferrous iron (Fe2+) will give the glass a bluish-green colour. The redox state and the presence of certain polyvalent ions in the melt may have an effect on the quantity of heat absorbed by the glass and, consequently, on the melting and forming process. For the production of several types of glasses, oxidising conditions are necessary; therefore, additional oxidants such as nitrates or extra amounts of sulphates are needed in the batch formulation. When external recycling cullet is used in the batch containing reduced glasses (e.g. amber glass) or organic contaminants (food and/or drink residues, paper, plastics), an extra amount of oxidant is often required in order to maintain or correct the colour of the glass and to provide the necessary fining properties to the batch formulation.

Chapter 2
Manufacture of Glass 45
Other glasses need reducing conditions, such as amber glass and special green colours. In these cases, a highly oxidised atmosphere in the furnace may negatively affect the glass colour. Melting conditions that cause variations in the redox state of the glass often result in a significant enhancement of the volatilisation phenomena from the melting furnace, with a consequently potential increase of solid and gaseous emissions. This phenomenon may be particularly evident for the sulphur oxides emissions. Reduction at the glass melt surface, generated by reducing flames, can enhance the evaporation of alkali (increased corrosion of superstructure materials) and increase the levels of dust formulation in the flue-gases. Conditioning A conditioning phase at lower temperatures follows the primary melting and fining stages. During this process, all remaining soluble bubbles are reabsorbed into the melt. At the same time, the melt cools slowly to a working temperature of between 900 and 1350 ºC. In batch melting, these steps occur in sequence, but in continuous furnaces, the melting phases occur simultaneously in different locations within the tank. The batch is fed at one end of the tank and flows through different zones in the tank and forehearth where primary melting, fining, and conditioning occur. The refining process in a continuous furnace is the most delicate of the melting phases. Glass does not flow through the tank in a straight line from the batch feeder (doghouse entrance) to the throat and feeders or canals where the glass reaches the typical working/forming temperatures. It is diverted following different possible trajectories in the tank, dependent on the free convection and forced convection flows, including recirculation flows and static melts (dead water zones). The batch pile, or the cold mixture of raw materials, is not only melted at the surface, but also from the underside by the molten glass bath. Relatively cold, bubbly glass forms below the bottom layer of batch material and sinks to the bottom of the tank. Appropriate convection currents must bring this material to the surface, since fining occurs in tank furnaces primarily at the surface of the melt where bubbles need to rise only a short distance to escape. If thermal currents flow too fast, they inhibit fining by bringing the glass to the conditioning zone too soon. Guiding walls or weirs can be built into the inner tank structure to create ideal glass flow paths.
2.3 Melting techniques [19, CPIV 1998]
This section summarises the most important melting techniques used within the glass industry. Different techniques are used within the stone wool and frits sectors, and these techniques are discussed separately within the specific sections for each sector. The choice of the melting technique will depend on many factors but particularly on the required capacity, the glass formulation, fuel prices, existing infrastructure and environmental performance. For example, as a general guide, (to which there are inevitably exceptions) the criteria below are normally applied. • For large capacity installations (>500 t/d) cross-fired regenerative furnaces are almost
always employed. • For medium capacity installations (100 to 500 t/d), regenerative end port furnaces are
favoured, though cross-fired regenerative, recuperative unit melters, and in some cases oxy-fuel or electric melters may also be used according to circumstances.
• For small capacity installations (25 to 100 t/d), recuperative unit melters, regenerative end port furnaces, electric melters and oxy-fuel melters are generally employed.
Table 2.3 gives an estimate of the different types of furnaces which exist in the EU, with the numbers and capacities of each type.

Chapter 2
46 Manufacture of Glass
Table 2.3: Estimate of EU furnace types in 2005 (for installations >20 t/day) Type of furnace
Number of units
(%) of Total
Melting capacity (t/yr)
Average melting capacity (t/d)
End-fired 225 35.8 16 100 000 196 Cross-fired 145 23.1 20 300 000 384 Electric 43 6.85 800 000 51 Oxygen 35 5.6 1 600 000 125 Recuperative 120 19.1 3 300 000 75 Other types 60 9.55 900 000 41 Total 628 100 43 000 000 188 Source: [130, CPIV 2008]
Glass furnaces are generally designed to melt large quantities of glass over a typical lifetime of 10 – 12 years and in some cases up to 20 years or more and range in output from 20 up to 1 000 tonnes of glass per day. The glass is contained in a tank constructed of blocks of appropriate refractory materials and generally of overall rectangular form closed by a vaulted ceiling or crown. Electrical furnaces tend to be more square with a flat ceiling and open on one side, for batch access. The refractory blocks are maintained in position by an external steel framework. There are many furnace designs in use, and they are usually distinguished in terms of the method of heating, the combustion air preheating system employed, and the burner positioning. Glass making is a very energy-intensive activity and the choice of energy source, heating technique and heat-recovery method are central to the design of the furnace. The same choices are also some of the most important factors affecting the environmental performance and energy efficiency of the melting operation. The three main energy sources for glass making are natural gas, fuel oil and electricity. In the first half of the XXth century, many glassmakers used producer gas made by the reactions of air and water with coal at incandescent temperatures. The use of natural gas is increasing in the glass industry due to its economy, high purity, ease of control and the fact that there is no requirement for storage facilities. Compared to fuel-oil, it is associated with lower emissions of sulphur dioxide and CO2 but it is often associated with higher NOX emissions. The opinion generally held within the industry is that oil flames, being more radiant than gas flames, give better heat transfer to the melt. In addition, the different heat capacities of the related waste gases lead to a different energy loss through the flue-gas, when comparing gas with oil firing. On the other hand, most fuel-oil types used for the melting process need preheating, up to 110 – 120 °C, in order to obtain a sufficiently low viscosity level for transfer, transport and injection (atomisation) through the burner nozzles. Many large furnaces are equipped to run on both natural gas and fuel oil. The change of fuel requires only a straightforward change of burners. In many cases, gas supply contracts are negotiated on an interruptible basis during peak demand, which necessitates the facility for fuel changeover. The main reason for the periodic change between gas and fuel oil is the prevailing relative prices of the fuels. In order to enhance control of the heat input, it is not uncommon for predominantly gas-fired furnaces to burn oil on one or two ports. The use of a mix of fuel and gas is also becoming more and more common; in this case, a suitable single burner is applied. The third common energy source for glass making is electricity. Electricity can be used either as the exclusive energy source or in combination with fossil fuels; this is described in more detail in other relevant sections in the document. Electricity can be used to provide energy in three basic ways: resistive heating, where a current is passed through the molten glass; induction heating, where heat is induced by the change in a surrounding magnetic field; and the use of heating elements. Resistive heating is the only technique that has found commercial application within the glass industry, and it is the only technique considered within this document.
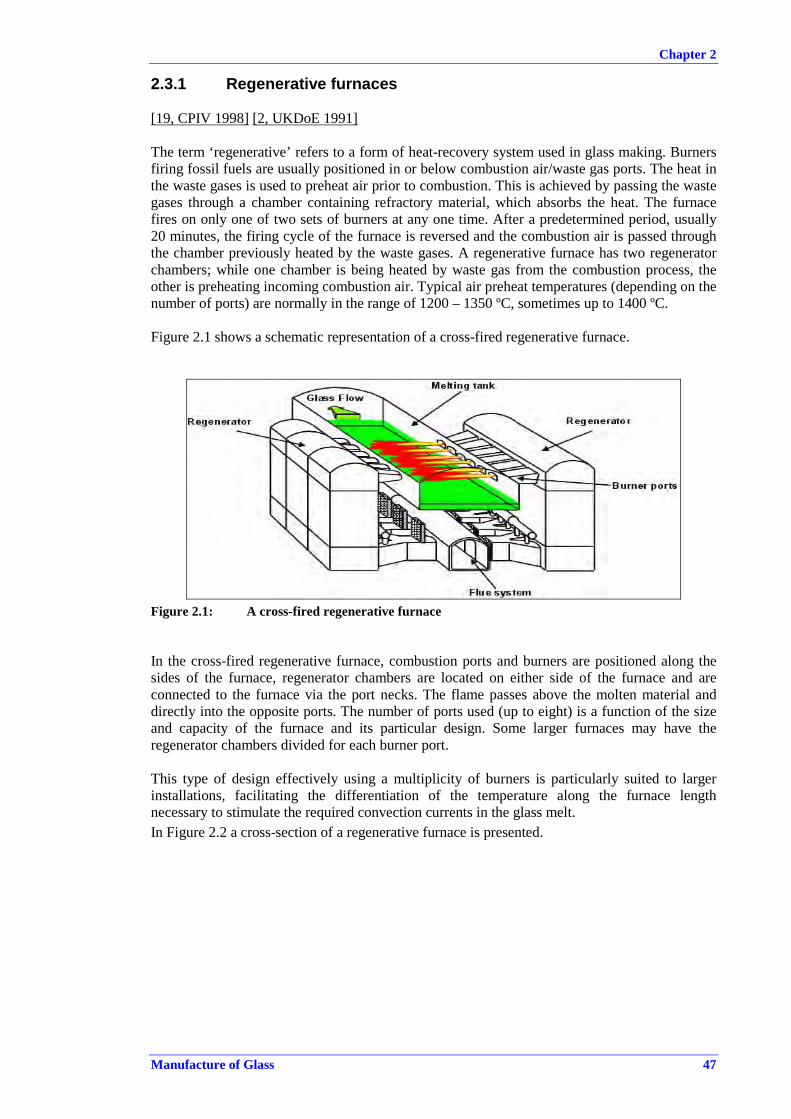
Chapter 2
Manufacture of Glass 47
2.3.1 Regenerative furnaces [19, CPIV 1998] [2, UKDoE 1991]
The term ‘regenerative’ refers to a form of heat-recovery system used in glass making. Burners firing fossil fuels are usually positioned in or below combustion air/waste gas ports. The heat in the waste gases is used to preheat air prior to combustion. This is achieved by passing the waste gases through a chamber containing refractory material, which absorbs the heat. The furnace fires on only one of two sets of burners at any one time. After a predetermined period, usually 20 minutes, the firing cycle of the furnace is reversed and the combustion air is passed through the chamber previously heated by the waste gases. A regenerative furnace has two regenerator chambers; while one chamber is being heated by waste gas from the combustion process, the other is preheating incoming combustion air. Typical air preheat temperatures (depending on the number of ports) are normally in the range of 1200 – 1350 ºC, sometimes up to 1400 ºC. Figure 2.1 shows a schematic representation of a cross-fired regenerative furnace.
Figure 2.1: A cross-fired regenerative furnace
In the cross-fired regenerative furnace, combustion ports and burners are positioned along the sides of the furnace, regenerator chambers are located on either side of the furnace and are connected to the furnace via the port necks. The flame passes above the molten material and directly into the opposite ports. The number of ports used (up to eight) is a function of the size and capacity of the furnace and its particular design. Some larger furnaces may have the regenerator chambers divided for each burner port. This type of design effectively using a multiplicity of burners is particularly suited to larger installations, facilitating the differentiation of the temperature along the furnace length necessary to stimulate the required convection currents in the glass melt.
In Figure 2.2 a cross-section of a regenerative furnace is presented.

Chapter 2
48 Manufacture of Glass
Main fuel combustion air
To stack
Main fuel combustion air
To stack
Figure 2.2: Cross-section of a regenerative furnace
In the end-fired regenerative furnace, the principles of operation are the same; however, the two regenerative chambers are situated at one end of the furnace each with a single port. The flame path forms a U shape returning to the adjacent regenerator chamber through the second port. This arrangement enables a somewhat more cost-effective regenerator system than the cross-fired design but has less flexibility for adjusting the furnace temperature profile and is thus less favoured for larger furnaces. In general, end-fired furnaces are more energy efficient than cross-fired furnaces for two main reasons: firstly, the number of burner ports is lower, reducing the amount of energy loss through the ports, which can be rather high; secondly, the residence time of the combustion gases in the end-fired furnace is higher than in a cross-fired furnace, allowing more time for the flames to radiate the energy to the batch blanket and the glass melt. Figure 2.3 shows a schematic representation of a single pass end-fired regenerative furnace.
Figure 2.3: Single pass end-fired regenerative furnace

Chapter 2
Manufacture of Glass 49
Figure 2.4 shows a plan view of an end-fired regenerative furnace
Figure 2.4: Plan view of an end-fired regenerative furnace
Most conventional glass container plants have either end-fired or cross-fired regenerative furnaces, and all float glass furnaces are of a cross-fired regenerative design. Preheat temperatures are normally in the range of 1300 – 1350 ºC, with higher values up to 1400 ºC, leading to very high thermal efficiencies.
2.3.2 Conventional recuperative furnace [19, CPIV 1998]
The recuperator is another common form of heat recovery system usually used for smaller furnaces. In this type of arrangement, the incoming cold air is preheated indirectly by a continuous flow of waste gas through a metal (or, exceptionally, ceramic) heat exchanger. Air preheat temperatures are limited to around 800 ºC for metallic recuperators, and the heat recovered by this system is thus lower than for the regenerative furnace. The lower direct energy efficiency may be compensated for by additional heat recovery systems on the waste gases, either to preheat raw materials or for the production of steam. However, one consequence is that the specific melting capacity of conventional recuperative furnaces is limited to 2 tonnes/m2/day compared to typically 3.2 tonnes/m2/day for a regenerative furnace in the container glass sector. This lack of melting capacity can be partially compensated for by the use of electric boosting. Although originally unit melters (or direct fired) furnaces were not necessarily equipped with recuperators, this is now exclusively the case and the term ‘unit melter’ has become synonymous with the conventional recuperative furnace. The burners are located along each side of the furnace. The convective flow patterns generated will preferably bring the hot combustion gases above the relatively cold batch blanket, before the gases exit the combustion chamber through the exhaust port. This would give the maximum heat transfer to the batch and the glass melt. This type of furnace is primarily used where a high flexibility of operation is required with a minimum initial capital outlay, particularly where the scale of operation is too small to make the use of regenerators economically viable. Recuperative furnaces are more appropriate for small capacity installations although higher capacity furnaces (up to 400 tonnes per day) are not uncommon.
Chapter 2
50 Manufacture of Glass
Special design furnaces, such as LoNOX® and Flex® melters are also recuperative-type furnaces with various additional features, which are better described in Section 4.4.2.3.
2.3.3 Oxy-fuel melting This technique involves the replacement of the combustion air with oxygen (>90 % purity). The elimination of the majority of the nitrogen from the combustion atmosphere reduces the volume of the waste gases which are composed almost entirely of carbon dioxide and water vapour, by about two thirds. Therefore, energy savings are possible because it is not necessary to heat the atmospheric nitrogen to the temperature of the flames. The formation of thermal NOX is greatly reduced, because the only nitrogen present in the combustion atmosphere is the residual nitrogen in the oxygen, nitrogen in the fuel, nitrogen from nitrate breakdown, and that from any parasitic air. In general, oxy-fuel furnaces have the same basic design as unit melters, and have multiple lateral burners and a single waste gas exhaust port. However, furnaces designed for oxygen combustion do not utilise heat-recovery systems to preheat the oxygen supply to the burners. Although oxy-fuel combustion technology is well established for some sectors of the glass industry (e.g. continuous filament glass fibre, some special glass types), it is still considered a developing technology by other sectors because of potentially high financial risks. However, considerable development work is being undertaken and the technique is becoming more widely accepted as the number of plants increases. This technique is discussed further in Section 4.4.2.5.
2.3.4 Electric melting [19, CPIV 1998] [9, IPC Guidance S2 3.03 1996] [2, UKDoE 1991] [71, VDI 3469-5 2007]
An electric furnace consists of a refractory lined box supported by a steel frame with electrodes inserted either from the side, from the top or, more usually, from the bottom of the furnace. The energy for melting is provided by resistive heating as the current passes through the molten glass. It is, however, necessary to use fossil fuels when the furnace is started up at the beginning of each campaign. The furnace is operated continuously and has a lifetime of between 2 and 7 years. The top of the molten glass is covered by a layer of batch material, which gradually melts from the bottom upwards, hence the term ‘cold-top’ melter. Fresh batch material is added to the top of the furnace, usually by a conveyor system that moves across the whole surface. Most electric furnaces are fitted with bag filter systems and the collected material is recycled to the melter. The technique is commonly applied in small furnaces particularly for special glass. The main reason for this is that the thermal efficiency of fossil fuel fired furnaces decreases with furnace size and heat losses per tonne of melt from small furnaces can be quite high. Heat losses from electric furnaces are much lower in comparison and for smaller furnaces the difference in melting costs between electrical and fossil fuel heating is therefore less than for larger furnaces. Other advantages of electric melting for small furnaces include lower rebuild costs, comparative ease of operation and better environmental performance in terms of direct emissions. A full economic and environmental assessment should however include indirect emissions. There is an upper size limit to the economic viability of electric furnaces, which is closely related to the prevailing cost of electricity compared with fossil fuels. Electric furnaces can usually achieve higher melt rates per square metre of furnace, and the thermal efficiency of electric furnaces (based on the energy delivered to the furnace, not on the primary energy necessary to generate the electricity) is two to three times higher than fossil fuel fired furnaces.

Chapter 2
Manufacture of Glass 51
However, for larger furnaces, this is often not sufficient to compensate for the higher costs of electricity. The absence of combustion in electric melting means that the waste gas volumes are extremely low, resulting in low particulate carryover and a reduced size of any secondary abatement equipment. The emissions of volatile batch components are considerably lower than in conventional furnaces due to the reduced gas flow and the absorption and reaction of gaseous emissions in the batch blanket. The main gaseous emissions are carbon dioxide from the carbonaceous batch materials. However, if a global view is taken, the environmental benefits associated with the use of electric melting should be considered against the releases arising at the power generation plant, and the efficiencies of power generation and distribution. A complication with electric melting is the use of sodium nitrate or potassium nitrate in the batch. The general view in the glass industry is that nitrate is required in cold-top electric furnaces to provide the necessary oxidising conditions for a stable, safe and efficient manufacturing process. The problem with nitrate is that it breaks down in the furnace to release nitrogen oxides. This is not the case for all glasses that are produced with electric melting. As an example, for high temperature insulation glass wools (ASW/RCF and AES) the batch formulation does not require the use of nitrates.
2.3.5 Combined fossil fuel and electric melting [19, CPIV 1998] [9, IPC Guidance S2 3.03 1996]
There are two principal approaches to the use of this technique: predominantly fossil fuel firing with an electric boost; or predominantly electrical heating with fossil fuel support. Clearly the proportion of each type of heat input can be varied with each technique. Electric boosting is a method of locally adding extra heat to the glass melt in a melting furnace by passing an electric current through electrodes positioned in the sidewalls (horizontal electrodes) or through the bottom (vertical electrodes) of the tank. Mostly, rod shaped electrodes are used, but electrode plates are also applied within the glass industry. The technique is commonly used within fossil fuel fired furnaces in the glass industry. Traditionally, it is used to increase the throughput of a fossil fuel fired furnace to meet periodic fluctuations in demand, without incurring the fixed costs of operating a larger furnace. The technique can be installed while a furnace is running, and it is often used to support the pull rate of a furnace as it nears the end of its operating life or to increase the capacity of an existing furnace. Electric boosting can also be used to reduce the direct emissions of the furnace by substituting electrical heating for combustion for a given glass pull rate. Usually 5 to 20 % of the total energy input would be provided by electric boost although higher figures can be achieved. However, a high level of electric boost is not used as a long-term option for base level production due to the high operating costs associated with it. Variable levels of electric boost are frequently used in coloured glass due to the poor radiant heat transfer in green and amber glass. In the case of electric boosting, the electrodes provide extra heat especially in the lower layers of the glass melt in the tank. A less common technique is the use of gas or oil as a support fuel for a principally electrically-heated furnace. This simply involves firing flames over the surface of the batch material to add heat to the materials and to aid melting. The technique is sometimes referred to as over-firing and is often used to overcome some of the operational difficulties encountered with 100 % electric melting.

Chapter 2
52 Manufacture of Glass
2.3.6 Discontinuous batch melting [22, Schott 1996]
Where smaller amounts of glass are required, particularly if the glass formulation changes regularly, it can be uneconomical to operate a continuous furnace. In these instances, pot furnaces or day tanks are used to melt specific batches of raw material. Most glass processes of this type would not fall under the control of the Directive because they are likely to have less than 20 tonnes per day of melting capacity. However, there are a number of examples in the domestic glass and special glass sectors where capacities above this level exist, particularly where more than one operation is carried out at the same installation. A pot furnace is usually made of refractory brick for the inner walls, silica brick for the vaulted crown and insulating brick for the outer walls. Basically, a pot furnace consists of a lower section to preheat the combustion air (either a regenerative or a recuperative system), and an upper section which holds the pots and serves as the melting chamber. The upper section holds six to twelve refractory clay pots, in which different types of glass can be melted. There are two types of pots: open pots and closed pots. Open pots have no tops and the glass is open to the atmosphere of the furnace. Closed pots are enclosed and the only opening is through the gathering hole. With open pots, the temperature is controlled by adjusting the furnace firing; with closed pots, firing is at a constant rate, and the temperature is controlled by opening or closing the gathering hole. The capacity of each pot is usually in the range of 100 to 500 kg, with a lifetime of 2 to 3 months under continuous operation. The furnace is heated for 24 hours each day but the temperature varies (glass temperature only for closed pots) according to the phase of the production cycle. Generally, the batch is loaded into the pots in the late afternoon and melted in the evening; the temperature is increased overnight to refine the melt so the glass can be processed the next morning. During melting, the temperature climbs to between 1300 and 1600 °C, depending on the glass type, and during the removal and processing of the glass, the furnace temperature is in the range of 900 to 1200 °C. Day tanks are further developed from pot furnaces to have larger capacities, in the region of 10 tonnes per day. Structurally they more closely resemble the quadrangle of a conventional furnace, but are still refilled with batch each day. The melting is usually done at night and the glass goes into production the next day. They allow a change in glass type to be melted at short notice and are primarily used for coloured glass, crystal glass, soft special glasses and frits (ceramic and enamel frit).
2.3.7 Special furnace designs [59, SORG 1999] [60, SORG 1999]
The attention paid to limiting NOX emissions has led some furnace designers to propose unit melter type furnaces that integrate various features intended to permit lower flame temperatures. The best known of this type of furnace is the LoNOX
® melter. The LoNOX
® melter is a recuperative-type furnace which uses a combination of shallow bath refining and raw material preheating to achieve reduced NOX levels, potentially without the penalty of reduced thermal performance. The shallow bath refiner forces the important critical current path close to the surface of the glass bath, thereby reducing the temperature differential between it and the furnace superstructure. The furnace can be operated at lower temperatures than a comparable conventional furnace. This technique is described more fully in Section 4.4.2.3.
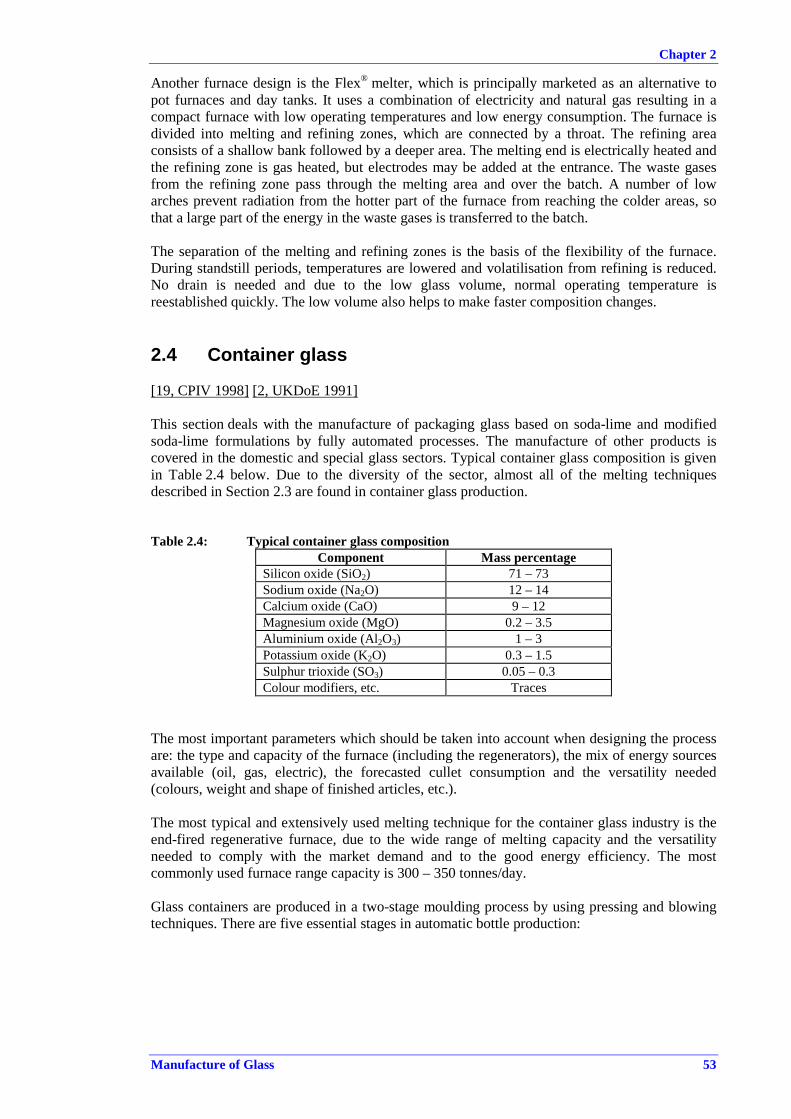
Chapter 2
Manufacture of Glass 53
Another furnace design is the Flex® melter, which is principally marketed as an alternative to pot furnaces and day tanks. It uses a combination of electricity and natural gas resulting in a compact furnace with low operating temperatures and low energy consumption. The furnace is divided into melting and refining zones, which are connected by a throat. The refining area consists of a shallow bank followed by a deeper area. The melting end is electrically heated and the refining zone is gas heated, but electrodes may be added at the entrance. The waste gases from the refining zone pass through the melting area and over the batch. A number of low arches prevent radiation from the hotter part of the furnace from reaching the colder areas, so that a large part of the energy in the waste gases is transferred to the batch. The separation of the melting and refining zones is the basis of the flexibility of the furnace. During standstill periods, temperatures are lowered and volatilisation from refining is reduced. No drain is needed and due to the low glass volume, normal operating temperature is reestablished quickly. The low volume also helps to make faster composition changes.
2.4 Container glass [19, CPIV 1998] [2, UKDoE 1991]
This section deals with the manufacture of packaging glass based on soda-lime and modified soda-lime formulations by fully automated processes. The manufacture of other products is covered in the domestic and special glass sectors. Typical container glass composition is given in Table 2.4 below. Due to the diversity of the sector, almost all of the melting techniques described in Section 2.3 are found in container glass production.
Table 2.4: Typical container glass composition Component Mass percentage
Silicon oxide (SiO2) 71 – 73 Sodium oxide (Na2O) 12 – 14 Calcium oxide (CaO) 9 – 12 Magnesium oxide (MgO) 0.2 – 3.5 Aluminium oxide (Al2O3) 1 – 3Potassium oxide (K2O) 0.3 – 1.5 Sulphur trioxide (SO3) 0.05 – 0.3 Colour modifiers, etc. Traces
The most important parameters which should be taken into account when designing the process are: the type and capacity of the furnace (including the regenerators), the mix of energy sources available (oil, gas, electric), the forecasted cullet consumption and the versatility needed (colours, weight and shape of finished articles, etc.). The most typical and extensively used melting technique for the container glass industry is the end-fired regenerative furnace, due to the wide range of melting capacity and the versatility needed to comply with the market demand and to the good energy efficiency. The most commonly used furnace range capacity is 300 – 350 tonnes/day. Glass containers are produced in a two-stage moulding process by using pressing and blowing techniques. There are five essential stages in automatic bottle production:

Chapter 2
54 Manufacture of Glass
1. obtaining a piece of molten glass (gob) at the correct mass and temperature; 2. forming the primary shape in a first mould (blank mould) by pressure from compressed
air (blow) or a metal plunger (press); 3. transferring the primary shape (parison) into the final mould (finish mould); 4. completing the shaping process by blowing the container with compressed air to the
shape of the final mould; 5. removing the finished product for post-forming processes. The molten glass flows from the furnace along a forehearth to a gathering bowl (spout) at the end. From the bottom of the gathering bowl, one to four parallel streams of glass are formed through appropriately sized orifices. These glass streams, modulated by a mechanical plunger system, are cut into accurate lengths by a shear mechanism to form primitive, sausage shaped, glass ‘gobs’. The complete system for forming the gobs is termed the ‘feeder mechanism’. Gobs are cut simultaneously from the parallel glass streams and are formed simultaneously in parallel moulds on the forming machine. These are termed single, double, triple or quadruple gob machines, the latter being adapted to high-volume productions of smaller containers. Double gob machines are the most common. Container glass furnaces feed two or more such forming machines, each via a dedicated forehearth. A mixture of water and soluble oil is sprayed onto the shears to ensure they do not overheat and that the glass does not stick to them. From the feeder mechanism, the gobs are guided by a system of chutes into the blank moulds on the forming machine. The forming process is carried out in two stages as shown in Figure 2.5. The initial forming of the blank may be made either by pressing with a plunger, or by blowing with compressed air, depending on the type of container. The final moulding operation is always by blowing to obtain the finished hollow shape. These two processes are thus respectively termed ‘press and blow’ and ‘blow and blow’. The formed containers are presented for post-forming production stages on a continuous conveyor. Press and blow forming is particularly adapted to producing jars, but is also widely used for producing lightweight bottles. Blow and blow forming is more versatile and is preferred for producing standard weight bottles and more complex forms. Simplified diagrams of the two main forming processes are shown in Figure 2.5.

Chapter 2
Manufacture of Glass 55
Figure 2.5: Blow and blow forming and press and blow forming
During the forming process, the glass temperature is reduced by as much as 600 °C to ensure that the containers are sufficiently solidified when taken away by conveyor. The extraction of heat is achieved with high volumes of air blown against and through the moulds. To prevent the glass from sticking to the moulds, various high temperature graphite-based release agents are applied manually and automatically to specific mould parts (‘swabbing’). The moulds require periodic cleaning and maintenance. Glass flow from the forehearth must be held constant in order to maintain the necessary temperature stability, viscosity and homogeneity of the glass fed to the forming process. If the forming process is interrupted on one of the sections, the gobs of hot glass are diverted by chutes to the basement, where they are cooled with water, fragmented, and returned to the batch house along with all other production rejects to be recycled as process cullet. The earliest automatic machines were of rotating design, and although forming machines for tableware still use this principle, container production is carried out almost exclusively by the more flexible, in line individual section machines (IS). The IS machine consists of multiple individual container-making units (sections) assembled side by side. Each section has mould cavities corresponding to the number of gobs to be formed in parallel. The gobs are delivered sequentially to the different sections via a scoop and trough system (gob distributor and delivery). Typically IS machines are made up of 6 to 20 sections, depending on the volume and the type of market served. One major advantage of IS machines is the possibility of independently stopping the sections for adjustments or replacing mould parts. Automatic container manufacture can be used to produce bottles and jars of almost any size, shape and colour. The simpler the shape, the faster the production rate; lightweight round beer bottles are produced at up to 750/minute on IS 12 section quadruple gob machines.

Chapter 2
56 Manufacture of Glass
Rapid cooling of the containers on the outside surface creates high differential stresses in the glass and consequent fragility. To eliminate these, the containers are passed through a continuous annealing oven (lehr), where they are reheated to 550 °C then cooled under controlled conditions to prevent further stresses being set up. Lehrs are heated by gas or electricity but once brought to the operating temperature, the heat from the incoming containers provides the majority of the heating energy. Once sufficiently cooled, all containers are inspected automatically with automatic rejection for out-of-tolerance and other quality concerns. After inspection, the product is assembled onto pallets either in cartons or in bulk and packed and stored before shipment to the customer. The overall efficiency of the production is measured as a ‘pack to melt’ ratio, i.e. the tonnage of containers packed (for shipment) as a percentage of the tonnage of glass melted in the furnace. Installations making containers for foodstuffs and beverages generally attain pack to melt ratios of between 85 and 94 %. Higher-value perfume and pharmaceutical products are subject to more stringent controls, and pack to melt ratios average around 70 %. To improve the performance of the products, surface coatings can be applied either immediately after forming while the articles are still at a temperature of over 500 °C (‘hot-end coating’, often with SnO2), or after annealing (‘cold-end coating’, polymeric coating). Practically always a combination of hot-end and cold-end treatments are employed. In general, the coatings are applied to the outside surface of the containers. Glass containers are conveyed through various inspections, packaging, unpacking, filling and repackaging systems. To prevent damage between containers and to enable them to slide through guide systems without damage, lubricating treatments can be applied to the product at the cold end of the annealing lehr. The materials used are food-safe oleic acid and polyethylene-based products applied by spraying a dilute aqueous suspension, or by contact with vapours. These treatments do not, in general, give rise to significant environmental emissions. Hot surface coatings, usually a very fine coating of tin oxide or titanium oxide, can be applied to the glass containers immediately after leaving the forming machine. In combination with subsequent lubricating cold surface coating, this prevents glass surface damage during subsequent handling. The metal oxide coating acts as a substrate to retain the lubricating organic molecules on the glass surface, and this permits a high level of scratch resistance to be developed with simple food-safe lubricants. The hot-end treatment also improves mechanical resistance. The treatments themselves must be invisible and are thus extremely thin. The thickness of the hot surface treatment is generally <0.01 µm. To obtain uniform coatings of this thickness, the treatment is made by chemical vapour deposition (CVD), using the anhydrous chlorides of tin or titanium, or specific organo-metallic compounds. The quantity of material involved is low, in the order of 2 to 10 kg/day per production line according to production speed. Once manufactured, glass containers may, in certain cases, go through a secondary process to add decoration and identifying characteristics before being sent to the customer. This can take the form of a pressure sensitive or heat-shrink label or heat-applied ceramic decoration.
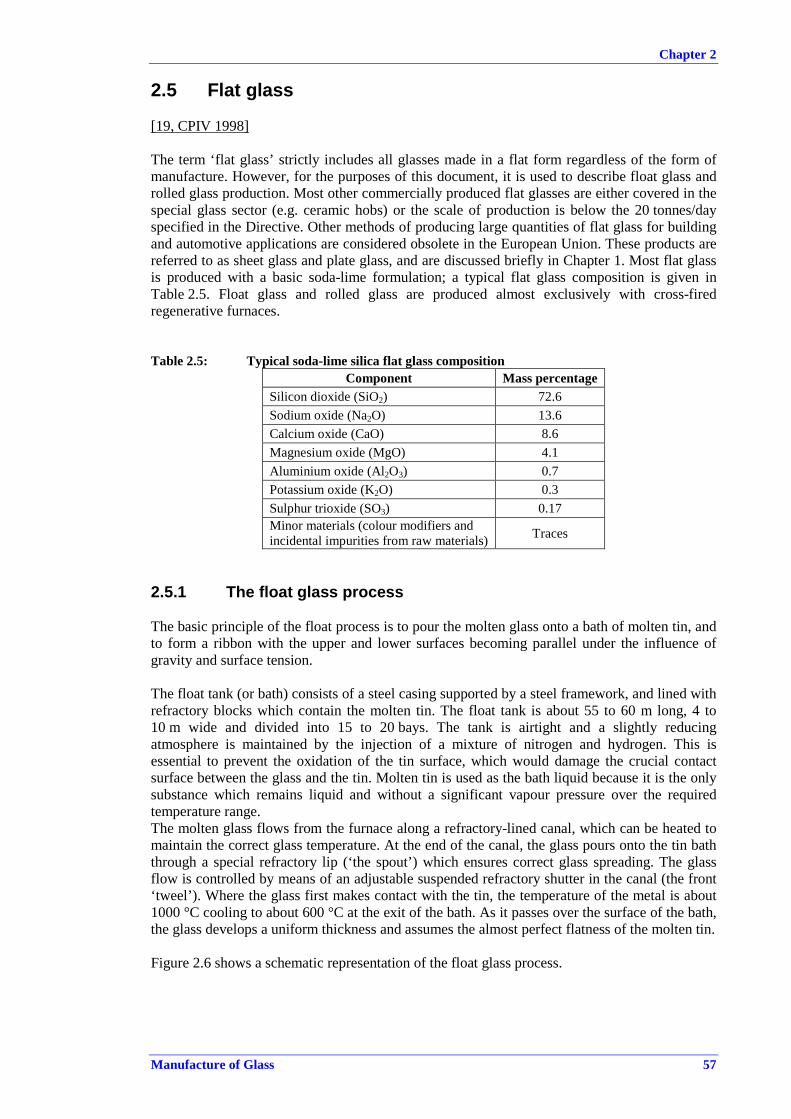
Chapter 2
Manufacture of Glass 57
2.5 Flat glass [19, CPIV 1998]
The term ‘flat glass’ strictly includes all glasses made in a flat form regardless of the form of manufacture. However, for the purposes of this document, it is used to describe float glass and rolled glass production. Most other commercially produced flat glasses are either covered in the special glass sector (e.g. ceramic hobs) or the scale of production is below the 20 tonnes/day specified in the Directive. Other methods of producing large quantities of flat glass for building and automotive applications are considered obsolete in the European Union. These products are referred to as sheet glass and plate glass, and are discussed briefly in Chapter 1. Most flat glass is produced with a basic soda-lime formulation; a typical flat glass composition is given in Table 2.5. Float glass and rolled glass are produced almost exclusively with cross-fired regenerative furnaces.
Table 2.5: Typical soda-lime silica flat glass composition Component Mass percentage
Silicon dioxide (SiO2) 72.6 Sodium oxide (Na2O) 13.6 Calcium oxide (CaO) 8.6 Magnesium oxide (MgO) 4.1 Aluminium oxide (Al2O3) 0.7 Potassium oxide (K2O) 0.3 Sulphur trioxide (SO3) 0.17 Minor materials (colour modifiers and incidental impurities from raw materials) Traces
2.5.1 The float glass process The basic principle of the float process is to pour the molten glass onto a bath of molten tin, and to form a ribbon with the upper and lower surfaces becoming parallel under the influence of gravity and surface tension. The float tank (or bath) consists of a steel casing supported by a steel framework, and lined with refractory blocks which contain the molten tin. The float tank is about 55 to 60 m long, 4 to 10 m wide and divided into 15 to 20 bays. The tank is airtight and a slightly reducing atmosphere is maintained by the injection of a mixture of nitrogen and hydrogen. This is essential to prevent the oxidation of the tin surface, which would damage the crucial contact surface between the glass and the tin. Molten tin is used as the bath liquid because it is the only substance which remains liquid and without a significant vapour pressure over the required temperature range. The molten glass flows from the furnace along a refractory-lined canal, which can be heated to maintain the correct glass temperature. At the end of the canal, the glass pours onto the tin bath through a special refractory lip (‘the spout’) which ensures correct glass spreading. The glass flow is controlled by means of an adjustable suspended refractory shutter in the canal (the front ‘tweel’). Where the glass first makes contact with the tin, the temperature of the metal is about 1000 °C cooling to about 600 °C at the exit of the bath. As it passes over the surface of the bath, the glass develops a uniform thickness and assumes the almost perfect flatness of the molten tin. Figure 2.6 shows a schematic representation of the float glass process.

Chapter 2
58 Manufacture of Glass
Figure 2.6: The float glass process
Inside the float tank are several pairs of water-cooled top rollers, adjustable in direction, height, penetration and angle. These rollers catch the glass sheet on both edges by cog-wheels and draw it in length and width. The rate of glass flow and the rotation speeds of the rollers help to govern the thickness of the glass, typically from 1.5 to 19 mm. The glass has a maximum natural thickness on the tin surface, and graphite barriers can be introduced in order to produce the thicker glasses. At the exit of the float bath, the glass ribbon is taken out by lift-out rollers, and is passed through a temperature-controlled tunnel, the lehr, to be annealed. At the beginning of the lehr, SO2 is sprayed on both sides of the ribbon, providing a surface treatment to protect the glass against the contact of the rollers. The lehr is divided into sections in which there is heating and indirect or direct cooling by forced and natural convection. Glass is thus gradually cooled from 600 to 60 °C in order to reduce residual stresses caused during the forming process to an acceptable level. This operation needs time and space, and from the pouring of glass onto the float bath to the cutting line, there is a continuous 200 m ribbon of glass. The cooled glass ribbon is cut on-line by a travelling cutter; the angle of the cutter against the line depends on the speed of the line (90 ° if it is not moving). The edges of the ribbon that bear roller marks are cut off and recycled to the furnace as cullet. The glass sheets are then inspected, packed and stored, either for sale or for secondary processing. On-line coatings can be applied to improve the performance of the product (e.g. low-emissivity glazing). On-line coating processes are case specific and the total number of plants within the industry with on-line coating facilities is very low. A moving ribbon of glass is coated whilst hot by the impingement onto its surface of silica or tin compounds where they react to form the required film. The process generally consists of two separate coating stages, a silicon-based undercoat and a separate topcoat, e.g. fluorine-doped tin oxide. Due to the nature of the chemicals used, emissions of acid gases and fine particulates can arise, which are generally treated in a dedicated abatement system.

Chapter 2
Manufacture of Glass 59
2.5.2 The rolled process (patterned and wired glass) A schematic representation of the rolled glass process is shown in Figure 2.7 below.
Figure 2.7: The rolled glass process
Rolled glass is formed by a continuous double-roll process. Molten glass at about 1000 °C is squeezed between water-cooled steel rollers to produce a ribbon with a controlled thickness and surface pattern. The glass is conveyed from the melting furnace into a forehearth in order to reach the required temperature upstream of the roller pass. Depending on the furnace capacity and the desired output, one or two machines can be fed from one furnace. The rotating rollers pull molten glass into the pass, from which it emerges as a ribbon of thickness determined by the separation between the rollers. A typical ribbon width is about 2 metres. In passing through the water-cooled rollers, heat is extracted. Control of the temperature at the interface is essential to the correct operation of the process and the quality of the product. When emerging from the rollers, the ribbon is viscous enough to avoid significant narrowing and to be carried forward over moving rollers for about 2 metres. There it is further cooled and carried forward into the annealing lehr at about 600 °C. In this process, the rollers serve three functions: to form the ribbon, to imprint the chosen pattern, and to remove heat. The rollers must be very accurately machined with perfect axial symmetry and a uniform pattern without any defect over the whole roller surface. The range of patterns produced is very wide so that frequent changes must be made to meet market demands. Thus, one important consideration of machine design is the ease with which a pattern roller can be changed. The most usually adopted solution is to set up two rolling machines side by side on a switch rail. In this way, the new pattern rollers can be mounted in the spare machine ready to be pushed into place when the changeover is needed. This operation requires the flow of glass to be stopped by means of a metallic boom placed in the canal upstream of the rollers.

Chapter 2
60 Manufacture of Glass
The rolling process has been extended to produce wire-reinforced glass. There are two different techniques employed. In the first, two canals are used to provide two flows of glass to the forming machine, but in the second method, only one flow of glass and one canal are required. A wire mesh is fed down from a roll suspended above the machine and guided into the ‘bolster of glass’ that is formed by the glass flow entering the space between two rollers. Specification, control and conditioning of the wire mesh are of great importance for the quality of the product.
2.6 Continuous filament glass fibre [19, CPIV 1998] [9, IPC Guidance S2 3.03 1996] [131, APFE 2008]
The most widely used composition to produce continuous filament glass fibre is E-glass, which represents more than 98 % of the sector output. The typical E-glass composition for general applications is shown in Table 2.6. For glass fibre yarn products the ASTM D578-00 certified composition, shown in Table 2.7, is preferred. Other compositions are also used to produce continuous filaments, but only very small quantities are produced in the EU. The melting techniques used for these other formulations are very specific and are not generally representative of the techniques used in the sector as a whole. For the purposes of this document, only E-glass production is considered.
Table 2.6: Typical E-glass composition for glass fibre products used in general applications Component % by Weight
B2O3 0 to 10 CaO 16 to 25 Al2O3 12 to 16 SiO2 52 to 56 MgO 0 to 5 Total alkali metal oxides 0 to 2 TiO2 0 to 1.5 Fe2O3 0.05 to 0.8 Fluoride 0 to 1.0
Table 2.7: Typical E-glass composition for glass fibre yarn products used in printed circuit boards and aerospace
Component % by Weight B2O3 5 to 10 CaO 16 to 25 Al2O3 12 to 16 SiO2 52 to 56 MgO 0 to 5 Na2O and K2O 0 to 2 TiO2 0 to 0.8 Fe2O3 0.05 to 0.4 Fluoride 0 to 1.0
The glass melt for continuous filament glass fibre has generally been produced in cross-fired, air-fossil fuel, recuperative furnaces. Whilst there are still some furnaces with oxygen boost, there has been a major trend towards 100 % oxy-fuel fired furnaces, up from 43 % of the furnaces operating in Europe in 2005. Both air-fuel and oxy-fuel furnaces can be equipped with electric boost (50 % of furnaces were equipped in 2005). Regenerative furnaces are not used

Chapter 2
Manufacture of Glass 61
within the sector due to the relatively small furnace sizes, and because borate condensation may occur at the temperature in the regenerators causing severe problems. The most commonly used glass formulation in this sector is E-glass, which has a very low alkali content resulting in low electrical conductivity. At the time of writing (2010) it is not considered economically viable to melt E-glass using 100 % electric melting.
The molten glass flows from the front end of the furnace through a series of refractory-lined, gas-heated canals to the forehearths. In the base of each forehearth there are several ‘bushings’ for delivering the melted glass to the nozzles in the bushing bottom plate for fiberising. Bushings are complex box-like structures with a perforated metal plate (bushing plate) at the base, with several hundred calibrated holes (bushing tips) and are manufactured from noble metals, such as platinum-rhodium alloys. The bushing is electrically heated and its temperature is precisely regulated over the whole surface in order to obtain a consistent rate of flow of molten glass from each hole. The glass flowing through the bushing tips is drawn out and attenuated by the action of a high-speed winding device to form continuous filaments. Specific filament diameters in the range of 5 to 24 µm are obtained by precisely regulating the linear drawing speed (which may vary from 5 to 70 m/s). Directly under the bushing, the glass filaments undergo a drastic cooling by the combined effect of water-cooled metal fins, high airflow, and water sprays. The filaments are drawn together and pass over a roller or belt, which applies an aqueous mixture, mainly of polymer emulsion or solution to each filament. The coating is also referred to as binder or size and serves one or both of two purposes: protecting the filaments from their own abrasion during further processing and handling operations; and/or for polymer reinforcements, ensuring good adhesion of the glass fibre to the resin. The binder content on the filaments is typically in the range of 0.5 to 1.5 % by weight. The coating material will vary depending on the end use of the product. Typical coating components include: film formers (e.g. polyvinyl acetate, starch, polyurethane, epoxy resins), coupling agents (e.g. organofunctional silanes), pH modifiers (e.g. acetic acid, hydrochloric acid, ammonium salts), and lubricants (e.g. mineral oils, surfactants). The coated filaments are gathered together into bundles called strands that go through further processing steps, depending on the type of reinforcement being made. The strands can undergo either conventional or direct processing. In conventional processing, the strands are wound onto the rotating mandrel of the winder to form ‘cakes’ of up to 50 kg in weight. The cakes containing the binder of up to 1.5 % and water of up to 15 % are labelled and pass forward for fabrication. For some applications, the cakes can be processed wet, but for most they have to pass through drying ovens. The ovens are heated by gas, steam, electricity, or indirectly by hot air. The main products are chopped strands, rovings, chopped strand mats, yarns, tissues, and milled fibres. Chopped strands are produced by unwinding the cakes and feeding the filaments into a machine with a rotating blade cylinder. The chopped strands are typically between 3 mm and 25 mm, and are conveyed into a variety of packages up to 1 tonne in weight. Rovings are produced by unwinding and combining the strands from multiple cakes, sufficient to achieve the desired weight of glass per unit length. Chopped strand mat is produced by chopping the strands unwinding from cakes, or rovings, in cylindrical choppers. The choppers are arranged so that chopped strands can be applied to a moving conveyor belt of up to 3.5 m wide. The strands are sprayed with a secondary binder, e.g. an aqueous solution of polyvinyl acetate or saturated polyester powder. Total binder content is in the range of 2 to 10 %. The conveyor takes the then wet mat through a drying and curing oven, and then through a pair of compaction rollers before winding the mat onto a mandrel. The mat can be made in various densities and widths and is packed into boxes with a typical weight of 50 kg.

Chapter 2
62 Manufacture of Glass
Yarn products are produced from either dried forming cakes or from wet cakes, where the drying of the strands takes place during the twisting operation. The yarn is made on a twisting machine (or twist frame) which holds up to 100 cakes. The strands is unwound from the cake, twisted into a yarn and wound onto a bobbin. This is a complex process similar to that used in the textile industry. Usually the twisting machine will produce only one yarn from a single strand, but (although less common) multiple wound yarns are also produced. The glass fibre tissue is produced by chopping the strands unwound from the cakes in cylindrical choppers, which feed either directly into a pulper or into intermediate bulk containers for later use. After dispersion in the pulper, the fibres are applied to a wire mesh conveyer belt by the wet-laid process. An aqueous solution of different types of resins, polyvinyl alcohol and latex is added as a binder at up to 20 % (dry content). The wire takes the web through a drying and curing oven before winding the tissue onto a tambour. The glass fibre tissue can be made in various densities and widths. Milled fibres are made by milling cakes or chopped strands into lengths of 50 – 300 µm. The milled fibres are conveyed into a variety of packages from 20 kg up to 1 tonne. Chopped strands, rovings, and continuous filament mats can also be produced by direct processes. Chopped strands are produced by directly introducing the strand, following coating, into a high-speed chopper. The strands are collected and, depending on the product use, either packaged wet or are dried. Direct rovings are produced using a bushing plate with a particular number of holes of different diameters, corresponding to the desired product. The filaments can be coated and the roving dried in the normal way. Continuous filament mat is produced by directly laying the strands onto a moving conveyor and spraying them with an aqueous or powder binder. A special device is used to ensure correct deposition of the filaments on the conveyor. The mat passes through a drying oven and compaction rollers, before being wound onto a mandrel and packed.
2.7 Domestic glass [28, Domestic 1998]
This sector is one of the most diverse sectors of the glass industry, involving a wide range of products and processes. Processes range from intricate handmade activities producing decorative lead crystal, to the high volume, highly mechanised methods used to make lower-value bulk consumer products. The majority of domestic glass is made from soda-lime glass with formulations close to those of container glass. However, the formulations are generally more complex due to specific quality requirements and the more varied forming processes. As with container glass, colouring agents can be added either in the furnace or in the feeder. The other main types of domestic glass are: • opal (opaque) glasses which contain fluoride or phosphate • full lead crystal, lead crystal and crystal glass, with official definitions (formulation and
properties) provided by Council Directive 69/493/EEC on crystal glass • borosilicate glass which contains boron, particularly adapted for cookware due to a very
low thermal expansion coefficient • glass-ceramics for cookware with an even lower expansion coefficient. The wide range of products and processes means that virtually all of the melting techniques described in Section 2.3 are likely to be used within the sector, from pot furnaces to large regenerative furnaces. Unlike in container production, external cullet is not widely used due to quality constraints, but internal cullet is universally used.

Chapter 2
Manufacture of Glass 63
The forming processes fall into two main categories: automatic processing and handmade or semi-automatic processing. Automatic processing is similar to that in the container glass sector. Glass from the furnace is fed via one or more forehearths to the forming machine, where the articles are formed using moulds. The precise forming technique depends on the dimensions of the product being made. The four main techniques are: ‘press and blow’, ‘blow and blow’, pressing, and spinning. The ‘press and blow’ and ‘blow and blow’ techniques are essentially the same as for the container glass sector (see Section 2.4) and so are not described further here, although the design of the machines and operating conditions (speed, quality requirements) differ. The pressing process is relatively simple and is used for articles which are quite shallow and where the mouth is wider than or of equal width to the base. It involves pressing a hot glass gob between a mould and a plunger, as shown in Figure 2.8. The inlet temperature of the glass melt will vary depending on the formulation, but for soda-lime glass it is typically 1150 °C. In Figure 2.8 below a schematic representation of the pressing process for the formation of glass articles is shown.
Figure 2.8: The pressing process for the formation of glass articles
The spinning process is used to produce circular articles such as plates and shallow bowls. A hot glass gob is dropped into the mould, which is then rotated and the article is formed by the resulting centrifugal force.
Figure 2.9: The spinning process for the formation of glass articles
The formed articles are generally fire-finished and polished to obtain the required surface quality. Very high temperatures are often necessary and are provided by means of oxy-gas, or in some cases, oxygen-hydrogen firing. These processes have the advantage of a lower specific energy consumption, easy use and a reduction of exhaust gas volumes. Following firing, the

Chapter 2
64 Manufacture of Glass
articles pass through an annealing lehr and may have surface coatings applied. The annealing and cold coating operations are comparable to those for container glass and so are not described further (see Section 2.4). In some cases, articles do not pass through an annealing lehr but through a tempering furnace in order to increase their resistance to mechanical and thermal shock. The production of certain articles involves separately joining two or more parts after local remelting. This applies to stems and feet for glasses and handles for cups and glasses. These items are made separately by pressing, drawing or extrusion. Glass stems are often drawn from the bulb of the glass and only the foot is added separately. For handmade articles, glass is gathered by a person with a hollow pipe, either directly from the furnace or from a feeder. A small hollow body (the parison) is made by giving a short puff into the pipe, and the shape is then formed by turning in a wooden or metal mould. The items are carried to an annealing lehr to eliminate any internal tensions and are fire finished, polished and reheated. In semi-automatic production, some steps of the process (gathering, forming, and handling) are carried out with machines or robots. In general, the manufacture of handmade articles is likely to only fall under the Directive 2010/75/EU where it is carried out at an installation where other glass making activities are undertaken. Following the production of the basic items, they can be subjected to one or more cold finishing operations. Some of these are outlined below. Cutting involves carving precise preselected patterns on the blank glass articles using diamond impregnated wheels. This process can be carried out either by hand or automatically depending on the product. Water (sometimes dosed with lubricants, etc.) is used as a coolant for cutting and also removes the fine glass particles produced. The water is treated and either discharged or recycled. The edges of the articles are sometimes ground and polished using similar but less specialised techniques. Glass cutting produces a grey, unfinished surface on the glass. The glass surface is restored to its original appearance by immersion in a polishing bath of hydrofluoric and sulphuric acids. The acids smooth the glass surface because the rough areas are dissolved more readily due to their greater surface area. A white ‘skin’ (composed of lead sulphate) is formed on the surface of the glass. After rinsing in hot water, the glass is restored to a sparkling condition. Fumes of HF and SiF4 are released from the surface of the polishing bath. These fumes are treated in scrubbing towers. During this operation, hexafluorosilicic acid (H2SiF6) is formed, with typical concentrations of up to 35 %, and the acidic washing water is then neutralised. As an alternative, H2SiF6 can be recovered and, where feasible, used as a feedstock in the chemical industry. The acidic rinse-water also requires periodic neutralisation. Alternative techniques to acid polishing are under development, e.g. mechanical polishing, and high-temperature polishing either with flames or lasers. A great variety of other techniques can be used to create attractive patterns. These include: decorating with enamels, frosting by sandblasting or acid etching, and engraving. The volumes of and associated emissions from these operations are small in comparison with the main processing stages.
2.8 Special glass [26, Special 1998][2, UKDoE 1991][22, Schott 1996][132, Special 2008]
The special glass sector is extremely diverse, covering a wide range of products that can differ considerably in terms of composition, methods of manufacture and end uses. Also, many of the products could be considered to overlap with other sectors, especially the domestic glass sector for borosilicate glasses. In the past the main product of the special glass sector was represented by cathode ray tube glass; at the time of writing (2010) this type of production has almost vanished within the EU; while the main production consists of glass tubes and bulbs.
Chapter 2
Manufacture of Glass 65
Most other products are of relatively low volume and often significantly below the 20 tonnes/day threshold. However, many of these low-volume products are manufactured at installations where the total production of all operations exceeds this figure. Table 2.8 gives the compositions of the main glass products of the special glass sector. Some of the glass compositions vary widely from product to product and the figures given in the table should only be considered as a guide. This section outlines the main production methods used within the special glass sector. Due to the diversity of the sector, a wide range of melting techniques is used; however, the low volumes of production mean that most furnaces are quite small. The most common techniques are recuperative furnaces, oxy-gas furnaces, electric melters and day tanks. In some cases, regenerative furnaces are also used, for example in CRT glass. It should be noted that the melting temperatures of special glasses can be higher than for more conventional, mass produced compositions. Borosilicate glass and glass ceramics, in particular necessitate melting temperatures of more than 1650 °C. These high temperatures and complex formulations can lead to higher environmental emissions per tonne than, for example, soda-lime products. The lower scale of production coupled with higher temperatures, also means that energy efficiency is generally lower, and furnace lifetimes are generally shorter in this sector. The high-quality requirements of certain products such as optical glass and ceramic glass mean it is necessary to construct (or cover) components from the refining section onwards with platinum, to prevent contamination. As in the other sectors, following melting and refining, molten glass flows from the furnace along temperature-controlled forehearths to the downstream forming apparatus. The main forming techniques used within the special glass sector are: • press and blow production (borosilicate glass, tableware and kitchen products) • rotary-mould (past-mould) process (borosilicate glass, lamp units) • blow down (or settle blow) process (borosilicate glass, domestic glass) • rolling (ceramic flat glass) • pressing (CRT glass and lamp units) • ribbon process (light bulbs) • spinning process (borosilicate glass) • tube extrusion by Danner and Vello processes (glass tubing including lighting) • casting (optical glass blocks and some special products) • drawing process (down draw for thin film glass like display glass, up draw for
borosilicate glass) • floating (borosilicate glass) Press and blow, and blow and blow production processes are essentially the same as those described for the container glass sector (see Section 2.4). The rolling process used to produce articles such as ceramic hobs for cookers is a scaled-down version of the process described for the flat glass sector, but with plain rollers. These processes are not described further here and reference should be made to earlier sections (see Section 2.5.2). In the pressing process, the glass is in contact with all parts of the metallic mould material. The pressing mould consists of three parts: the hollow mould, a plunger, which fits into the mould leaving a space which determines the thickness of the glass wall, and a sealing ring which guides the plunger when it is removed from the mould. A glass gob is fed into the mould and is hydraulically or pneumatically pressed by the ring-guided plunger until the glass is pressed into all areas of the mould. The plunger and the mould remove much of the heat from the glass, and after solidification, the plunger is withdrawn. Most pressing machines operate on turntables which usually have between 4 and 20 moulds with a maximum of 32; the most common for CRT glass is 11. The turntable takes the glass step by step through the loading, pressing, cooling and removal stages.

Chapter 2
66 Manufacture of Glass
Light bulbs can be produced using the ribbon process. A ribbon of glass is formed by rolling molten glass between two water-cooled rollers. Upon leaving the rollers, the ribbon of glass is carried through the machine on a series of orifice plates, which form a continuous belt pierced with holes. As the ribbon moves forward, a continuous chain of blow heads meet it from above, each blow head coinciding with a hole in the belt. A puff from the blow head blows the glass through the hole and the glass forms into a bulb inside a rotating mould, which meets and closes around it from below. Moving forward on the ribbon, the shaped bulb is released from its mould, cooled by air and then released from the ribbon and transferred to a conveyor belt. This carries the bulbs through an annealing lehr, and onto cooling, inspection and packing. Production rates in excess of 1 000 bulbs a minute can be achieved. Extrusion can be used for glasses with a steep viscosity curve or for glasses with a tendency to crystallise in order to produce items with very close dimensional tolerances. It is an economical method of making various types of full or hollow profiles with sharp edged cross-sections for industrial use. By using laminate extrusion methods, two or three types of glass can be combined to produce, for example, components sheathed with chemically-resistant glass. The most widely used method for the continuous drawing of glass tubing is the Danner process. A continuous strand of molten glass flows onto a slightly angled, slowly-rotating refractory core called the Danner mandrel. At the lower end of the mandrel a hollow bulb forms from which the tubing is drawn. Air is blown through the hollow mandrel, the shaft maintaining a hollow space in the glass. After being redirected horizontally, the solidifying tube is transported on a roller track to the pulling unit, behind which it is cut into 1.5 m lengths, or sometimes longer. These machines can produce more than 3 m per second of glass tubing. The Vello process is the second most widely used process and has about the same rate of output as the Danner process. The glass from the furnace flows along the forehearth and downward through an orifice (ring), with the hollow space in the glass being maintained by a pipe with a conical opening (bell) located within the ring. The still soft tube is redirected horizontally and is drawn off along a roller track, cooled and cut as in the Danner process. A variation on the Vello process is the down-draw process, which can be used to produce tubing with diameters of up to 360 mm. The glass is drawn downwards through a vacuum chamber, and is passed through a sealed iris diaphragm, a circular shutter which can be adjusted to different apertures. A fourth process is the up-draw process, where the glass tube is drawn vertically upwards from a rotating bowl. The drawing area is shielded by a rotating ceramic cylinder, one end of which is submerged in the glass. The hollow space is formed by means of an air jet placed below the surface of the glass. This technique is particularly useful for producing tubing with thick walls and large diameters. Optical glass can be either cast into blocks or extruded into cylinders to form the blanks, which are sold for further processing. Moulds are usually made from refractory materials. Water glass is now included in the Large Volume Inorganic Chemicals-Solids and Others Industry (LVIC-S) BREF (http://eippcb.jrc.es/reference/)
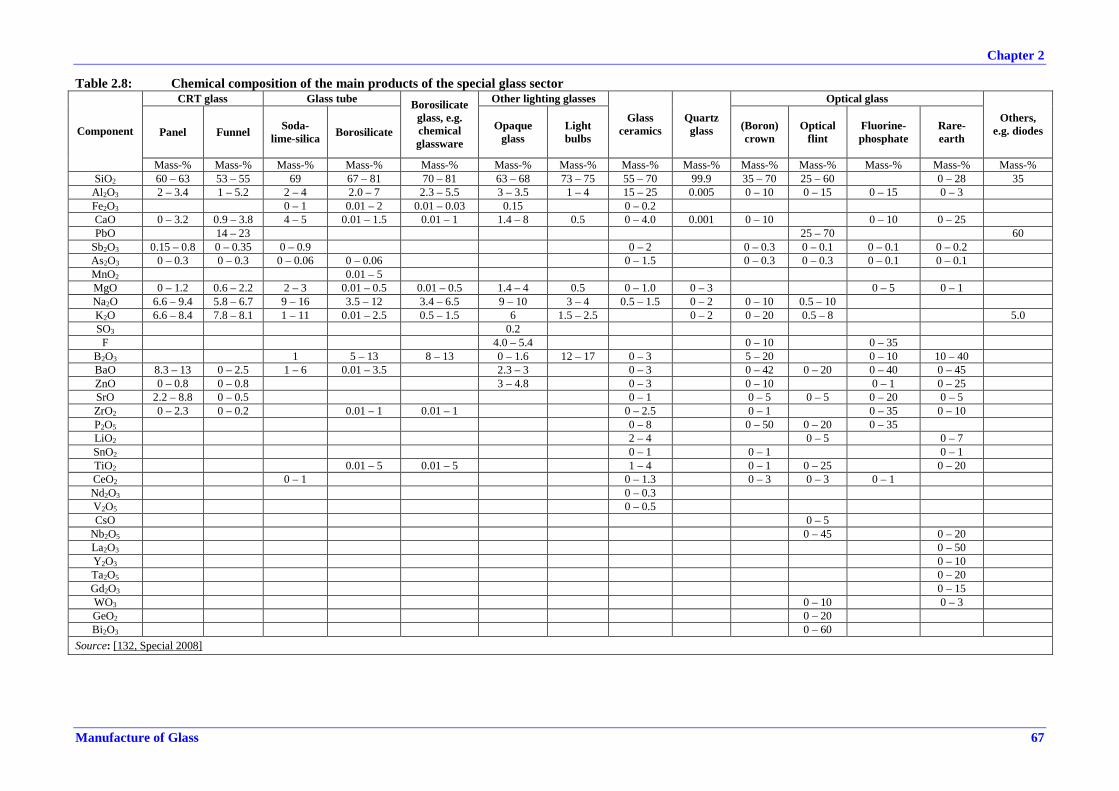
Chapter 2
Manufacture of Glass 67
Table 2.8: Chemical composition of the main products of the special glass sectorCRT glass Glass tube Other lighting glasses Optical glass
Panel Funnel Soda-lime-silica Borosilicate
Borosilicateglass, e.g.chemicalglassware
Opaqueglass
Lightbulbs
Glassceramics
Quartzglass (Boron)
crownOptical
flintFluorine-phosphate
Rare-earth
Others,e.g. diodesComponent
Mass-% Mass-% Mass-% Mass-% Mass-% Mass-% Mass-% Mass-% Mass-% Mass-% Mass-% Mass-% Mass-% Mass-%SiO2 60 – 63 53 – 55 69 67 – 81 70 – 81 63 – 68 73 – 75 55 – 70 99.9 35 – 70 25 – 60 0 – 28 35
Al2O3 2 – 3.4 1 – 5.2 2 – 4 2.0 – 7 2.3 – 5.5 3 – 3.5 1 – 4 15 – 25 0.005 0 – 10 0 – 15 0 – 15 0 – 3Fe2O3 0 – 1 0.01 – 2 0.01 – 0.03 0.15 0 – 0.2CaO 0 – 3.2 0.9 – 3.8 4 – 5 0.01 – 1.5 0.01 – 1 1.4 – 8 0.5 0 – 4.0 0.001 0 – 10 0 – 10 0 – 25PbO 14 – 23 25 – 70 60
Sb2O3 0.15 – 0.8 0 – 0.35 0 – 0.9 0 – 2 0 – 0.3 0 – 0.1 0 – 0.1 0 – 0.2As2O3 0 – 0.3 0 – 0.3 0 – 0.06 0 – 0.06 0 – 1.5 0 – 0.3 0 – 0.3 0 – 0.1 0 – 0.1MnO2 0.01 – 5MgO 0 – 1.2 0.6 – 2.2 2 – 3 0.01 – 0.5 0.01 – 0.5 1.4 – 4 0.5 0 – 1.0 0 – 3 0 – 5 0 – 1Na2O 6.6 – 9.4 5.8 – 6.7 9 – 16 3.5 – 12 3.4 – 6.5 9 – 10 3 – 4 0.5 – 1.5 0 – 2 0 – 10 0.5 – 10K2O 6.6 – 8.4 7.8 – 8.1 1 – 11 0.01 – 2.5 0.5 – 1.5 6 1.5 – 2.5 0 – 2 0 – 20 0.5 – 8 5.0SO3 0.2
F 4.0 – 5.4 0 – 10 0 – 35B2O3 1 5 – 13 8 – 13 0 – 1.6 12 – 17 0 – 3 5 – 20 0 – 10 10 – 40BaO 8.3 – 13 0 – 2.5 1 – 6 0.01 – 3.5 2.3 – 3 0 – 3 0 – 42 0 – 20 0 – 40 0 – 45ZnO 0 – 0.8 0 – 0.8 3 – 4.8 0 – 3 0 – 10 0 – 1 0 – 25SrO 2.2 – 8.8 0 – 0.5 0 – 1 0 – 5 0 – 5 0 – 20 0 – 5ZrO2 0 – 2.3 0 – 0.2 0.01 – 1 0.01 – 1 0 – 2.5 0 – 1 0 – 35 0 – 10P2O5 0 – 8 0 – 50 0 – 20 0 – 35LiO2 2 – 4 0 – 5 0 – 7SnO2 0 – 1 0 – 1 0 – 1TiO2 0.01 – 5 0.01 – 5 1 – 4 0 – 1 0 – 25 0 – 20CeO2 0 – 1 0 – 1.3 0 – 3 0 – 3 0 – 1Nd2O3 0 – 0.3V2O5 0 – 0.5CsO 0 – 5
Nb2O5 0 – 45 0 – 20La2O3 0 – 50Y2O3 0 – 10Ta2O5 0 – 20Gd2O3 0 – 15WO3 0 – 10 0 – 3GeO2 0 – 20Bi2O3 0 – 60
Source: [132, Special 2008]

Chapter 2
68 Manufacture of Glass
2.9 Mineral wool [27, EURIMA 1998] [9, IPC Guidance S2 3.03 1996] [89, EURIMA Suggestions 2007][133, EURIMA Contributions November 2008]
Mineral wool manufacture consists of the following stages: raw material preparation; melting; fiberisation of the melt, binder application; product mat formation, curing, cooling, and product finishing. Mineral wool can be divided into two main categories: glass wool and the stone/slag wool. The products are used in essentially the same applications and differ mainly in the raw materials and melting methods. Following the melting stage, the processes and environmental issues are essentially identical. The characteristic formulations of mineral wool are given in Table 2.9. Note that iron oxides, TiO2 and P2O5 are not intended or required components of the glass and arise as casual impurities. Therefore, the levels obtained in the glass and stone wool will depend upon the quality of the raw materials and the values indicated in the table are the extremes of the ranges found.
Table 2.9: Typical mineral wool compositions Mineral
wool SiO2Alkaline oxides
Earth alkaline oxides B2O3
Iron oxides Al2O3 TiO2 P2O5
Glass wool 57 – 70 12 – 18 8 – 15 0 – 12 <0.5 0 – 5 Trace 0 – 1.5 Stone wool 38 – 57 0.5 – 5 18 – 40 Trace 0.5 – 12 0 – 23 0.5 – 4 0 – 1.5 Slag wool 38 – 52 0.5 – 3 30 – 45 Trace 0 – 5 5 – 16 <1 Trace
2.9.1 Glass wool A typical plant for the production of glass wool is shown in Figure 2.10.
Figure 2.10: A typical glass wool plant

Chapter 2
Manufacture of Glass 69
The raw materials for glass wool manufacture are mainly delivered by road tankers and pneumatically conveyed into storage hoppers. Each process will use a range of raw materials and the precise formulation of the batch may vary considerably between processes. The basic materials for glass wool manufacture include sand, soda ash, dolomite, limestone, sodium sulphate, sodium nitrate, and minerals containing boron and alumina. Most processes also use process cullet as a raw material. This is shattered glass, which has been produced by quenching the molten stream from the furnace in water when the fiberising operation has been interrupted. Process cullet has the same precise formulation as the final product, and is readily recycled back to the furnace. Other forms of glass cullet, e.g. container glass and soda-lime-silica flat glass are also extensively used as a feedstock. This type of material is more difficult to recycle and its use depends heavily on cost, composition, purity and consistency of supply. One limiting factor in the use of cullet as a raw material is represented by glass-ceramics. As for other types of glass, the presence of glass-ceramics in recycled cullet is becoming an increasing problem. Several manufacturers also recycle processed fibrous waste and the dust collected from the furnace waste gas stream to the melter. The fibrous nature of much of the waste makes it impracticable to recycle without further treatment. Glass furnace raw materials are charged as powders or in granular form and so waste material must be ground or pelletised before charging. This is usually achieved by some form of milling operation. The waste product and the filtered waste contain significant levels of organic binder. In a glass furnace, the carbon content of the waste presents a number of potential problems including: reduced heat transfer; foaming; destabilisation of melting conditions; and alteration of the furnace chemistry. These problems can be mitigated but there is a limit to the amount of waste that can be recycled back to the furnace. Furthermore, it can be necessary to add sodium or potassium nitrate as an oxidising agent, and the decomposition of these materials can add significantly to the emissions of nitrogen oxides. The various raw materials are automatically weighed out and blended to produce a precisely formulated batch. The blended batch is then transferred to an intermediate storage hopper before it is added to the furnace. The furnace (with a few rare exceptions) will either be an electrically-heated furnace, a traditional gas-fired recuperative furnace, or less commonly an oxy-gas furnace. These techniques are described in Section 2.3 above. A stream of molten glass flows from the furnace along a heated refractory-lined forehearth and pours through a number (usually one to ten) of single orifice bushings into specially designed rotary centrifugal spinners. Primary fiberising takes place by means of centrifugal action of the rotating spinner with further attenuation by hot flame gases from a circular burner. This forms a veil of fibres with a range of lengths and diameters randomly interlaced. The veil passes through a ring of binder sprays that release a solution of phenolic resin-based binder and mineral oil onto the fibres to provide integrity, resilience, durability and handling quality to the finished product. The binder is highly diluted with water to enable it to adequately coat the fibres which have a very high surface area. The water acts as a carrier for the binder and is then evaporated. The resin-coated fibre is drawn under suction onto a moving conveyor to form a mattress of fibres. This mattress passes through a gas-fired oven at approximately 250 °C, which dries the product and cures the binder. The product is then air-cooled and cut to size before packaging. Edge trims can be granulated and blown back into the fibre veil, or they can be combined with the surplus product to form a loose wool product. Some products are produced without oven curing, e.g. microwave cured, hot pressed, uncured or binder-free products. Also, certain laminated products are made by the application of a coating, e.g. aluminium foil or glass tissue which is applied on-line with an adhesive.

Chapter 2
70 Manufacture of Glass
Water is sprayed into much of the downstream process ducting to prevent the build-up of fibre and resinous material, which could cause fires or blockage; and to remove entrained material from the flue-gas. Water is also used for cleaning the collection belt and other parts of the plant. The process water system is generally a closed loop; it is collected, filtered and reused for duct sprays, cleaning water and binder dilution. A typical glass wool process water circuit is shown in Figure 2.11 below. A significant portion of water evaporates from the following production operations: binder spraying, waste gas scrubbing, cooling and equipment cleaning.
Sanitary water Internal treatment plant
Filtration plant
Collection reservoir
Collection reservoir (pit)
Process wash water:- Fume scrubbing/duct
sprays- Equipment cleaning
Cooling water
Cullet quenching water
Binder plant
Wet-fibrous scrap Clean water
blow-down
Clean waterblow-down
Clean or polluted sanitary water
Internal treatment plant
Clean waterblow-down
Evaporation
Natural sources
City mains
Forming Curing
Figure 2.11: Typical glass wool process water circuit
A global water balance for a typical glass wool plant in normal operation gives a consumption of 3 to 5 m3 of water per tonne of wool produced (see also Section 3.8.3). Almost all of this water leaves the plant as steam or gas-borne water droplets, either through the stacks or through general evaporation. However, water is constantly recirculated within the process wash water system so that the internal flow of water actually used in the glass wool process is much higher and may reach up to 100 m3/tonne of glass. The majority of this water flow (typically 70 %) is used in the forming sections and their associated pollution control equipment. This process wash water contains dissolved organics and solids (mainly fibres). Undissolved solids are removed in a plant by using cyclones, fixed or vibrating screen filters, centrifugal filters or similar equipment. In order to prevent an over-concentration of the dissolved organics, a proportion of water is abstracted from the process wash water, refiltered and introduced to the binder mix to be combined with the product. By this means, an equilibrium of dissolved solid content is established for a given binder formulation and product binder content. The characteristics of wash water are periodically monitored, particularly because the efficiency of flue-gas scrubbing depends upon the concentration of dissolved solids; variations can be important, depending on such parameters as the formulation and quantity of binder used and the weather/season of the year.
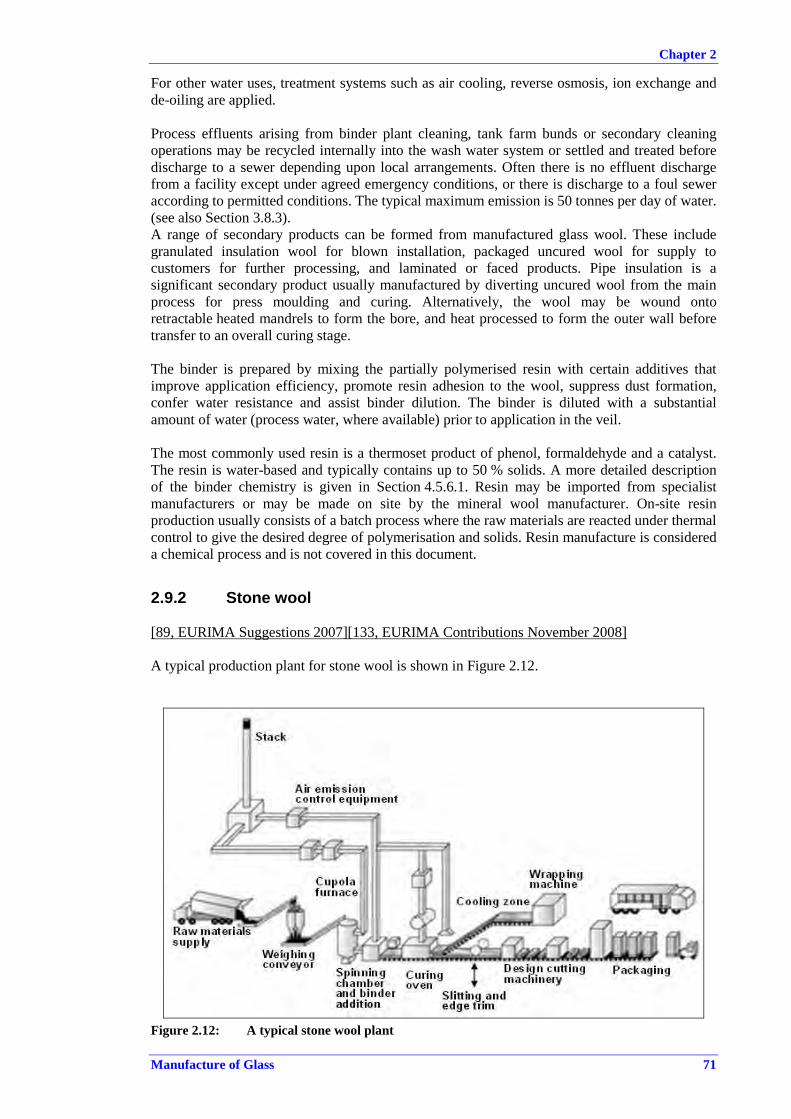
Chapter 2
Manufacture of Glass 71
For other water uses, treatment systems such as air cooling, reverse osmosis, ion exchange and de-oiling are applied. Process effluents arising from binder plant cleaning, tank farm bunds or secondary cleaning operations may be recycled internally into the wash water system or settled and treated before discharge to a sewer depending upon local arrangements. Often there is no effluent discharge from a facility except under agreed emergency conditions, or there is discharge to a foul sewer according to permitted conditions. The typical maximum emission is 50 tonnes per day of water. (see also Section 3.8.3). A range of secondary products can be formed from manufactured glass wool. These include granulated insulation wool for blown installation, packaged uncured wool for supply to customers for further processing, and laminated or faced products. Pipe insulation is a significant secondary product usually manufactured by diverting uncured wool from the main process for press moulding and curing. Alternatively, the wool may be wound onto retractable heated mandrels to form the bore, and heat processed to form the outer wall before transfer to an overall curing stage. The binder is prepared by mixing the partially polymerised resin with certain additives that improve application efficiency, promote resin adhesion to the wool, suppress dust formation, confer water resistance and assist binder dilution. The binder is diluted with a substantial amount of water (process water, where available) prior to application in the veil. The most commonly used resin is a thermoset product of phenol, formaldehyde and a catalyst. The resin is water-based and typically contains up to 50 % solids. A more detailed description of the binder chemistry is given in Section 4.5.6.1. Resin may be imported from specialist manufacturers or may be made on site by the mineral wool manufacturer. On-site resin production usually consists of a batch process where the raw materials are reacted under thermal control to give the desired degree of polymerisation and solids. Resin manufacture is considered a chemical process and is not covered in this document.
2.9.2 Stone wool [89, EURIMA Suggestions 2007][133, EURIMA Contributions November 2008]
A typical production plant for stone wool is shown in Figure 2.12.
Figure 2.12: A typical stone wool plant

Chapter 2
72 Manufacture of Glass
The most common melting technique for the production of traditional stone wool is the coke-fired hot blast cupola which may be compared to a steelmaking blast furnace in operation. This technique melts a combination of alumino-silicate rock (usually basalt) with limestone or dolomite and, sometimes, with blast furnace slag. The rocks are in lump form to allow the formation of an air-permeable column of material in the furnace, which allows heat transfer processes to be maintained. The batch may also contain recycled process or product waste bonded into briquettes of similar approximate size to the lump of rocks. The cupola consists of a cylindrical steel mantle (tube), which may be refractory lined and is closed at the bottom. A representation of a hot blast cupola furnace is shown in Figure 2.13.
Figure 2.13: A typical hot blast cupola furnace
The whole furnace surface is water cooled by means of an open, convective cooling water loop. The raw materials, briquettes and coke in lump form, are charged to the top of the cupola in alternate layers, or as a mixed batch and fill the furnace tube. The coke in the bottom of the furnace is ignited and forms a combustion zone where the stone materials are melted. Air, usually preheated from a downstream heat exchanger and sometimes oxygen enriched, is injected into the combustion zone of the cupola, about 1 to 2 metres from the bottom through tubes (tuyères) in the furnace wall. This is the hottest part of the cupola at approximately 2000 °C. The molten material gathers at the bottom of the furnace and flows out of a notch and along a short trough positioned above the spinning machine. Material above the combustion zone, which has been preheated by gases rising in the furnace, then falls into the zone and is replaced by freshly-charged raw materials at the furnace top. By this means, the cupola is able to produce molten rock almost continuously for two or three weeks before being emptied of its contents and reset. Basalt and, to a lesser extent, blast furnace slag contain ferric iron (Fe3+) and ferrous iron (Fe2+). Under reducing conditions in some areas of the cupola, the ferric/ferrous iron is reduced to metallic iron. This collects in the bottom of the cupola and would damage the expensive spinning machine if it were allowed to build up to the point where it flowed from the notch. To prevent this, the iron is periodically drained (tapped) by piercing the base of the cupola. The iron may be collected by means of a special mould which can be properly positioned in order to gather it before it falls into the waste area under the cupola and mixes with stone waste. In this way, the possibility of external recycling of the separated iron may be facilitated.

Chapter 2
Manufacture of Glass 73
In hot blast cupolas, any loose fibrous or dusty material might be carried out of the top of the cupola by rising hot air as it is charged. As indicated previously, loose materials may also adversely affect the porosity of the bed and disrupt the flow of blast air. The accepted solution to this problem is to mill the material and produce briquettes of comparable size to the other raw materials. Cement is the usual binder for the briquettes but this can lead to higher emissions of sulphur dioxide due to the sulphur in the cement. However, briquetting provides other advantages, e.g. lower energy use and the ability to add other fine materials to the batch, particularly other wastes such as foundry sand. The melt falls onto the rapidly-rotating wheels of the spinning machine, and is thrown off in a fine spray producing fibres. Air is blasted from behind the rotating wheels to attenuate the fibres and to direct them onto the collection belt to form a mattress. An aqueous phenolic resin solution is applied to the fibres by a series of spray nozzles on the spinning machine. The collection belt is under strong extraction and performs three functions; it draws the fibre onto the belt, it removes the polluted air in the fiberising chamber, and it helps to distribute the phenolic binder across the mattress. The phenolic resin provides strength and shape to the product as in glass fibre insulation. The primary mat is layered to give the required product weight per unit area. The long-chamber forming process that generates the product-specific weight in a single stage can also be used but is much less common. The mat passes through a fossil fuel fired oven at approximately 250 °C, which sets the product thickness, dries the product and cures the binder. The product is then air-cooled and cut to size before packaging. Pipe insulation and some secondary products may be manufactured in the way described for the glass wool process in Section 2.9.1. Water can be sprayed into the ducting to prevent resin and fibre build-up, to reduce the risk of fires, and to remove entrained material from the flue-gas. It is also used for a variety of cleaning operations. As in the production of glass fibre insulation, the process water is collected, filtered and reused. Stone wool can also be produced using flame furnaces and immersed electric arc furnaces. The other process operations including fiberising are the same. The design and operation of flame furnaces used for stone and slag wool manufacture is basically comparable to the flame furnaces used for glass wool manufacture. The furnace consists of a refractory tank heated by fossil fuel burners, either cross-fired or end-fired. Melting areas of up to 100 m2 are possible. Again metallic iron is reduced from the raw materials and iron tapping is necessary, e.g. by an orifice bushing located at the bottom of the furnace. An immersed electric arc furnace for stone wool manufacture consists of a cylindrical steel mantle, which can be refractory lined, and is cooled by means of either oil or water. The electrodes are immersed into the molten mass from the top of the furnace, providing energy for melting by resistive heating. The raw materials are inserted from above to provide a material blanket over the melt surface (cold-top). Due to the electrode arrangement, however, there is always an open melt bath around the electrodes. Alternatively, the electric furnace can operate with only partial coverage of the melt surface (hot-top). Graphite electrodes are used and, as a result, a small amount of free metallic iron is reduced from the raw materials. Iron tapping is necessary, but at a much lower frequency (once per week or less) than for cupola furnaces.

Chapter 2
74 Manufacture of Glass
2.10 High temperature insulation glass wools (ASW/RCF and AES)
[9, IPC Guidance S2 3.03 1996][71, VDI 3469-5 2007] [116, ECFIA 2008][129, EN 1094-1 2008]
Both types of wools, alkaline earth silicate (AES) and amorphous aluminium silicate wools: refractory ceramic fibres (ASW/RCF) are produced by means of the same technological process: electric resistance melting. On account of the alkalis and alkaline earths added to the raw material, the melting temperatures for AES glass wools lie below 1600 °C. In contrast, as a consequence of the high purity of the raw materials, in ASW/RCF glass wool the melting temperatures are around 2000 °C. The process can be divided into two parts: the production of wools and the conversion of the wools into articles and products. Typical chemical compositions for amorphous HTIW (ASW/RCF and AES) are shown in Table 2.10.
Table 2.10: Typical chemical composition ranges for ASW/RCF and AES, in mass percentage
Typical chemical composition ranges for AES expressed as oxide mass percentage
Product type SiO2 CaO+MgO ZrO2Calcium silicate glass wools 70 – 80 18 – 25 Calcium magnesium silicate glass wools 60 – 70 25 – 40 Calcium magnesium zirconium silicate glass wools 60 – 70 25 – 40 3 – 7 Magnesium silicate glass wools 70 – 80 18 – 27
Typical chemical composition ranges for ASW/RCF expressed as oxide mass percentage
Product type SiO2 Al2O3 ZrO2Aluminium silicate glass wools (high purity) 48 – 54 46 – 57 Aluminium zirconium silicate glass wools 47 – 50 35 – 36 15 – 17
Oxides of aluminium, calcium, magnesium, silicon and zirconium are delivered in bulk road tankers and pneumatically transferred to bulk storage silos. Smaller volume raw materials, including organic additives, are received in, and dispensed from, drums or sacks. The bulk raw materials are transferred from storage to the blending plant where they are mixed to give the required composition. The blended material is transferred to the furnace, where it is melted by electrical-resistance heating at temperatures of up to 2000 ºC for ASW/RCF and 1600 ºC for AES. The furnaces are about 1 metre deep and 2 – 3 metres in diameter, and have an open top, which is covered in a layer of unmelted batch materials. Amorphous high temperature insulation wool is produced by blowing or spinning melt (see Figure 2.14, Figure 2.15, and Figure 2.16).

Chapter 2
Manufacture of Glass 75
Source: [71, VDI 3469-5 2007]
Figure 2.14: Parallel blowing method
Source: [71, VDI 3469-5 2007]
Figure 2.15: Horizontal blowing method
Source:[71, VDI 3469-5 2007]
Figure 2.16: Spinning process

Chapter 2
76 Manufacture of Glass
A molten stream of the melt flows from the furnace to fall either onto high-speed rotating wheels, which throw off a spray of fibres into a collecting chamber, or alternatively, in front of a high-pressure air jet which attenuates the molten material into fibres. In neither case are binders added to the fibres, but a small amount of lubricant may be added which aids needling. If the wool production is interrupted, the molten stream is not stopped, it is quenched in water and, where practicable, reused in the process. The wool is drawn from the collecting chamber on to a continuously moving belt to which a vacuum can be applied. As the resulting wool comes off, the lay down belt can be removed, baled and bagged, or allowed to continue down the production line to make a blanket. This material can be baled as product or needle felted to knit the fibres together for additional strength. The needle-felted product can be passed through an oven to remove lubricants before being rolled up as a blanket or cut into sized pieces. Further downstream processing may also be carried out. The vacuum forming process consists of supplying a wet colloidal mixture of starch, latex, silica or clay to appropriately shaped moulds. The moulded shape is usually dried in a gas-fired oven, and may be buffed or trimmed and cut to size before packing and dispatch. Papers, felts and boards may also be produced. This involves the laying down of an aqueous suspension of fibres onto a vacuum drum, followed by oven drying. A mixture of binders and additives may be added to the aqueous suspension.

Chapter 2
Manufacture of Glass 77
2.11 Frits [9, IPC Guidance S2 3.03 1996] [47, ANFFECC 1999] [92, ITC - C071603 2007][98, ANFFECC Position of the Frit Sector 2005] [134, ANFFECC 2008]
Glass frits are used as a raw material in the production of ceramic glaze. This is a vitreous coating applied to a ceramic body and fused by the application of heat. Similarly, enamel frits are a raw material used in the production of enamel. This is applied to metals for decorative and/or protective purposes. Glazes and enamels may be applied either dry or wet; the latter predominates and is usually in the form of a slip or slurry. The process of fritting consists of melting water-soluble raw materials into an insoluble glass, thereby making it easier to keep these materials uniformly distributed in the glaze or enamel suspension during subsequent processing. Furthermore, some of the raw materials used in the manufacture of glazes or enamels are both toxic and soluble. The conversion of these materials into an insoluble glass minimises the dissolution of toxic substances and therefore their potential for release to the environment.
2.11.1 The frits production process Frits are prepared by melting raw materials in a melting furnace, at high temperatures of up to 1550 ºC. The material is then quenched in water, thus turned into a solid, insoluble, fragmented material. A variety of raw materials are used for the production of frits, for providing body (clay, feldspar, quartz, etc.), and for melting and inducing the formation of glass (soda ash, potash, borax, etc.). In addition, opacifiers (titanium oxides and zirconium oxides, fluorine compounds) and colouring agents (oxides, elements or salts) are used for giving the desired appearance to the enamels. The production of ceramic frits (glass frits) is about 95 % of the total production of the sector (ceramic frits and enamels). A schematic representation of the frit production process is shown in Figure 2.17.
Figure 2.17: Schematic representation of the frits production process

Chapter 2
78 Manufacture of Glass
2.11.2 Melting furnaces used in frits production Continuous melting furnaces are mostly used in the ceramic frits industry, while discontinuous furnaces are rarely used. The choice of the type of furnace depends on the scale of production and the product formulation. The usual process involves producing a wide range of frit formulations in small melting furnaces, requiring high flexibility in order to adapt to the frequent changes in production. Most modern frit furnaces are generally operated with natural gas and there are different combustion possibilities depending on the oxygen content used for the combustion. In addition to traditional natural air-gas combustion, a significant number of furnaces use oxy-fuel combustion (mainly in Italy), accounting for about 15 % of the total furnaces in Europe. The enrichment of combustion air with variable amounts of oxygen, in order to provide a higher temperature in the melting furnace and, eventually, increase the production rate, is widely used particularly in Spain. The selection between different combustion options depends on the type of formulation/product and on the temperature needed for the melting process. Furnaces for the production of frits are normally operated under a slightly negative pressure to ensure both an oxidising atmosphere and the flowing of the melt. This condition allows parasite air to enter the furnace, making it difficult to optimise the fuel/air (oxygen) ratio for environmental purposes. Most furnaces are equipped with a heat-recovery system, except for the oxy-fuel fired ones. The combustion air is preheated up to 470 – 570 °C. After the heat exchanger, the temperature of the flue-gases is still too high for entering a depollution unit (normally a bag filter), therefore an addition of fresh air is necessary for cooling. In most cases, the flue-gases released by the melting furnaces are collected to a single depollution system or they are grouped, on the basis of the characteristics of the batch formulations, to a number of depollution units present at the installation. The combination of flue-gases from different furnaces using diverse combustion techniques (oxy-fuel, enrichment with oxygen, fuel/air) results in a flue-gas at the stack with a high concentration of oxygen, which is normally between 14 and 19 %, but can be higher. Typical melting furnaces for frits production, with oxygen-enriched, fuel/air combustion, and heat recovery and oxy, and oxy-fuel combustion are shown in Figure 2.18 and Figure 2.19.
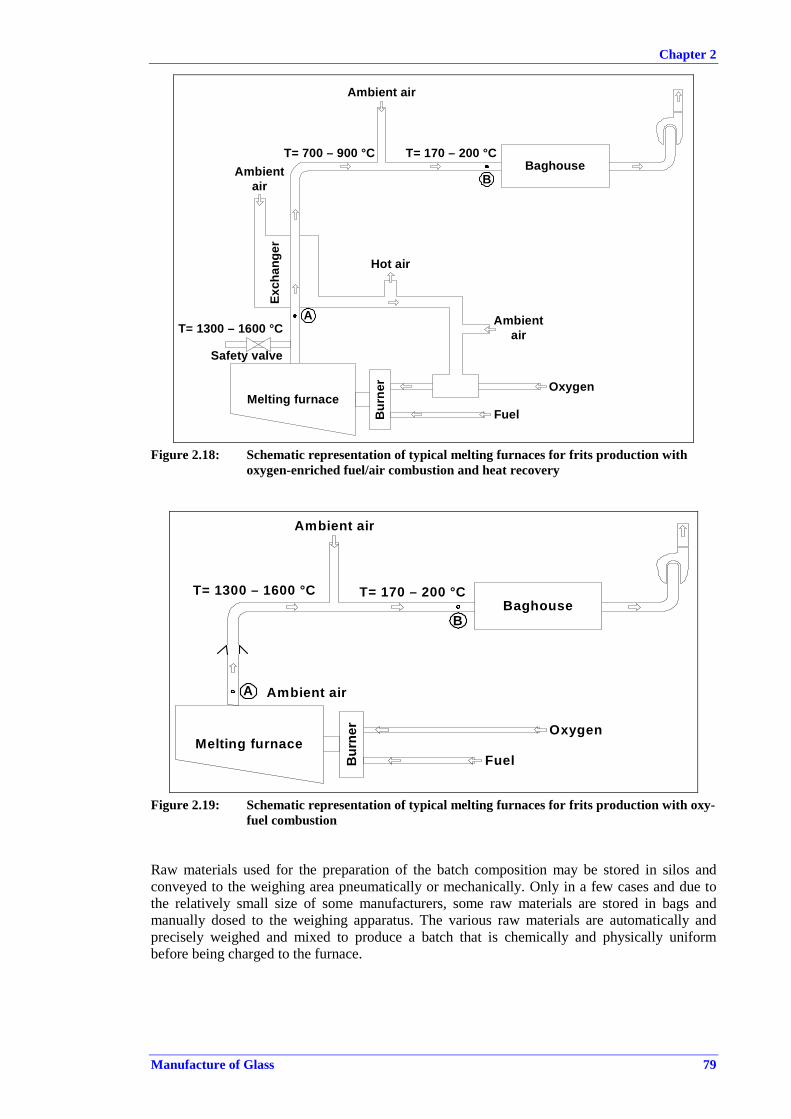
Chapter 2
Manufacture of Glass 79
Melting furnaceB
urne
r
Baghouse
Ambient air
Ambientair
Ambientair
T= 700 – 900 °C
T= 1300 – 1600 °C
Exch
ange
rHot air
T= 170 – 200 °C
A
Oxygen
Fuel
Safety valve
B
Figure 2.18: Schematic representation of typical melting furnaces for frits production with oxygen-enriched fuel/air combustion and heat recovery
Melting furnace
Bur
ner
Baghouse
Ambient air
Ambient air
T= 1300 – 1600 °C T= 170 – 200 °C
A
Oxygen
Fuel
B
Figure 2.19: Schematic representation of typical melting furnaces for frits production with oxy-fuel combustion
Raw materials used for the preparation of the batch composition may be stored in silos and conveyed to the weighing area pneumatically or mechanically. Only in a few cases and due to the relatively small size of some manufacturers, some raw materials are stored in bags and manually dosed to the weighing apparatus. The various raw materials are automatically and precisely weighed and mixed to produce a batch that is chemically and physically uniform before being charged to the furnace.
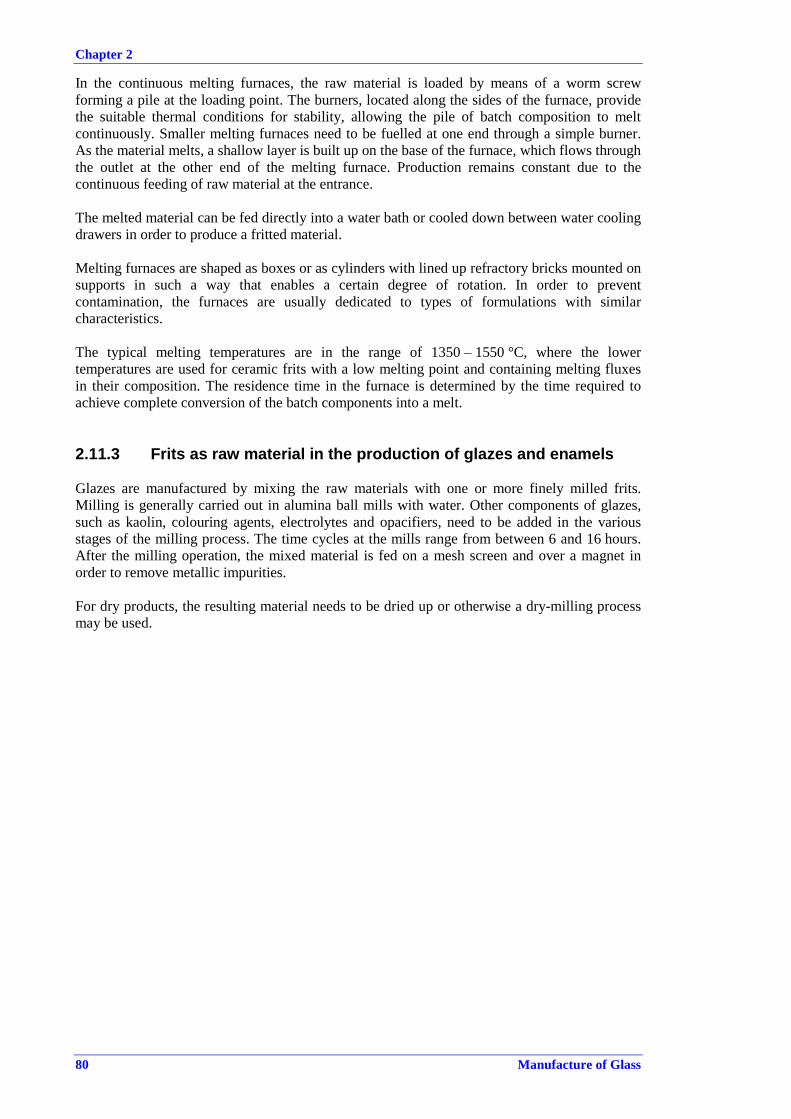
Chapter 2
80 Manufacture of Glass
In the continuous melting furnaces, the raw material is loaded by means of a worm screw forming a pile at the loading point. The burners, located along the sides of the furnace, provide the suitable thermal conditions for stability, allowing the pile of batch composition to melt continuously. Smaller melting furnaces need to be fuelled at one end through a simple burner. As the material melts, a shallow layer is built up on the base of the furnace, which flows through the outlet at the other end of the melting furnace. Production remains constant due to the continuous feeding of raw material at the entrance. The melted material can be fed directly into a water bath or cooled down between water cooling drawers in order to produce a fritted material. Melting furnaces are shaped as boxes or as cylinders with lined up refractory bricks mounted on supports in such a way that enables a certain degree of rotation. In order to prevent contamination, the furnaces are usually dedicated to types of formulations with similar characteristics. The typical melting temperatures are in the range of 1350 – 1550 °C, where the lower temperatures are used for ceramic frits with a low melting point and containing melting fluxes in their composition. The residence time in the furnace is determined by the time required to achieve complete conversion of the batch components into a melt.
2.11.3 Frits as raw material in the production of glazes and enamels Glazes are manufactured by mixing the raw materials with one or more finely milled frits. Milling is generally carried out in alumina ball mills with water. Other components of glazes, such as kaolin, colouring agents, electrolytes and opacifiers, need to be added in the various stages of the milling process. The time cycles at the mills range from between 6 and 16 hours. After the milling operation, the mixed material is fed on a mesh screen and over a magnet in order to remove metallic impurities. For dry products, the resulting material needs to be dried up or otherwise a dry-milling process may be used.
Chapter 3
Manufacture of Glass 81
3 PRESENT CONSUMPTION AND EMISSION LEVELS 3.1 Introduction This chapter provides information on the ranges of consumption and emission levels that are encountered within the glass industry across the scope of processes and techniques described in Chapter 2. The input and output are discussed for the industry as a whole, and then a more specific consideration is made for each sector. The key emission characteristics, emission sources and energy issues are identified in this chapter and discussed further for each technique in Chapter 4. The information in this chapter is intended to allow the emission and consumption figures for any particular installation being considered for a permit to be viewed in context against other processes in the same sector or in the glass industry as a whole. The majority of raw materials for the glass industry are naturally occurring minerals or synthetic inorganic substances. Most of the minerals used occur naturally in abundance and in general there are no major environmental issues associated with the provision of these materials. However, one of the considerations of the Directive is to minimise the consumption of raw materials commensurate with BAT. The synthetic raw materials are generally manufactured in industries that are subject to separate regulation. Process residues and post-consumer materials are very important as raw materials for the glass industry particularly in the container glass and mineral wool sectors. The main environmental concerns for the glass industry as a whole are emissions to air and energy consumption. Glass making is a high-temperature, energy-intensive process, and the energy is provided either directly by the combustion of fossil fuels, by electrical heating or by a combination of both techniques. In general, the most significant emissions include nitrogen oxides, particulate matter, sulphur dioxide, halides (fluorides and chlorides) and in some cases metals. Water pollution is not a major issue for most installations within the glass industry, although clearly there are exceptions. Water is used mainly for cleaning and cooling and is generally readily treated or reused. Process waste levels are relatively low with many solid waste streams being recycled within the process. The glass industry is extremely diverse and the summary given above is clearly a very broad generalisation. There are exceptions for specific processing options or for individual plants, and the environmental priorities can differ between sectors. Where these exceptions are inherent in a particular sector they are discussed in the relevant section. However, it is not possible to cover all eventualities for all plants and certain emissions not considered in this document may be encountered at a particular installation. Therefore, the information on process emissions given here should not be considered exhaustive. The information presented in this section relates to the whole range of plant sizes and operations but does not include special modes such as start-up and shutdown. Some of the lowest emission values relate to the operation of only one plant, which achieves these figures for site-specific reasons and the results are not necessarily indicative of BAT for the sector. Emissions can vary greatly between sectors and between individual installations. The main factors are: inherent differences in the raw materials and products for each sector, the process selection (particularly the melter option), the process scale and the degree of abatement implemented. When considering the emissions from different sectors and installations, it is important to consider, in addition to the emission concentrations, the overall amount of any substance emitted and the mass emitted per tonne of product or melt.

Chapter 3
82 Manufacture of Glass
Some of the emissions data presented in this chapter is necessarily quite general and may contain quite wide ranges. These ranges are representative but do not necessarily provide enough detail for comparison with a particular installation under consideration. For this reason, a number of case studies that are representative of the given ranges or which represent examples of performance within a particular sector are presented throughout the document, in the relevant sections.
3.2 General overview of the glass industry This section gives a qualitative discussion of those issues that are common to most processes and sectors within the glass industry. The specific issues relating to each sector are covered in the later sections, which, where possible, present quantitative information for consumption and emission levels. More detailed considerations of the mechanisms of formation of the substances emitted and of the factors affecting the emission levels are given, where appropriate, in Chapter 4.
3.2.1 Process inputs [66, APFE UPDATE IPPC Glass BREF 2007]
The core process inputs can be divided into four main categories: raw materials (those materials which form part of the product), energy (fuels and electricity), water, and ancillary materials (processing aids, cleaning materials, water treatment chemicals, etc.). Energy issues are dealt with separately in Section 3.2.3. The glass industry as described in the scope of this document includes many different processes with a wide range of products, raw materials and processing options. It is not possible within a document of this type to cover all the process inputs even within the sector-specific sections. Therefore, this document concentrates on the most common inputs within the industry and those that have the greatest effect on the environment. Glass industry raw materials are largely solid inorganic compounds, either naturally occurring minerals or synthetic products. They vary from very coarse materials to finely ground powders. Liquids and gases are also widely used, both as ancillary materials and as fuels. Table 3.1 lists the most common raw materials used for the production of glass. Due to the wide range of potential raw materials, this table should be viewed as indicative only and not as exhaustive. The raw materials used in product forming and other downstream activities (e.g. coatings and binders) are more specific to each sector and are discussed in later sections. An increasingly important raw material for melting is recycled dust from process abatement systems. The composition of the dust will depend on the nature of the process and whether any absorbents are used.

Chapter 3
Manufacture of Glass 83
Table 3.1: Common raw materials utilised in the glass industry Raw material Form Description Source/comments
Glass-forming materials
Silica sand Granular Principal source of SiO2
Quarried either as granular sand or as sandstone, which is subsequently crushed, graded and treated to remove impurities. High purity is required
Process cullet (internal cullet) Granular Glass
Recycled glass from the manufacturing process. Glass composition identical to the glass produced
Post-consumer cullet (external cullet)
Granular Glass
Recycled glass from collection schemes. Preliminary purification and sorting of the post-consumer glass is normally needed. Cullet purity and colour homogeneity can be variable
Intermediate and modifying materials
Sodium carbonate (Soda ash-Na2CO3)
Granular Principal source of Na2O
Manufactured from natural salt using the Solvay process in Europe, and so contains some NaCl. Natural sodium carbonate also imported from the US. African sources rarely used in Europe
Limestone (CaCO3) and burnt lime
Granular Principal source of CaO
Natural material quarried/mined, crushed and graded. In the stone wool sector, limestone is used in larger pieces, usually >50mm in diameter
Dolomite (CaCO3.MgCO3)and burnt dolomite
Granular Source of CaO and MgO
Natural material quarried, crushed and graded. In the stone wool sector, dolomite is used in larger pieces, usually >50mm in diameter
Nepheline syenite (3Na2O.K2O.4Al2O3.8SiO2)
Granular Principle source of aluminium oxide in clear glass
Quarried, crushed and graded. Low in iron content. Major sources in the world: Norway, China and Canada
Oxides of aluminium Granular Source of Al2O3
Used in high temperature insulation wools (i.e ASW/RCF)
Zirconium oxide Granular Source of ZrO2Used in high temperature insulation wools (ASW/RCF)
Potassium carbonate Granular Source of K2OUsed in special glass (lead crystal, TV glass, etc.) and is a synthetic product
Colemanite Powder Source of boron Natural borate from Turkey, used in continuous glass filaments
Borax Granular Source of boron Synthetic sodium borate, mainly from California, US
Boric acid (H3BO3) Granular Source of boron Synthetic product mainly used in continuous glass filaments
Feldspar Granular Source of Al2O3Main source of alumina in coloured soda-lime glass. Natural product
Fluorspar (CaF2) Granular Source of fluorine Natural product used mainly in opal glass
Lead oxides Powder Source of PbO PbO carriers in lead crystal glass and special glass
Barium carbonate Granular Source of BaO Manufactured product used mainly in special glass
Basalt Granular Aluminosilicate In the stone wool sector, it is used in larger pieces usually >50mm in diameter
Anhydrous sodium sulphate Granular
Refining and oxidising agent, source of Na2O
Manufactured product
Calcium sulphate and gypsum Granular
Refining and oxidising agent, secondary source of CaO
Natural material or manufactured product

Chapter 3
84 Manufacture of Glass
Raw material Form Description Source/comments
China clay Powder Source of alumina Natural product used mainly in continuous filament glass fibre
Sodium nitrate Granular Refining and oxidising agent, source of Na2O
Manufactured product
Potassium nitrate Granular Refining and oxidising agent, source of K2O
Manufactured product
Antimony oxide Powder Refining and oxidising agent
Manufactured product, mainly special glass formulations
Arsenic trioxide Powder Refining and oxidising agent
Manufactured product, mainly special glass and lead crystal formulations
Slag (Ca, Al, Mg, Fe silicate and sulphide)
Granular
Source of aluminium oxide, modifying oxides, refining agents, fluxes and colouring agents
By-product of blast furnace. Particle size must be adjusted to raw material of glass
Carbon Granular or powder Reducing agent
Manufactured or processed natural product, small amounts used to produce a glass with a reduced oxidation state when manufacturing green, amber and sometimes clear glass
Sodium chloride Crystals Fining agent Used in some borosilicate glasses Colouring agents
Iron chromite (Fe2O3.Cr2O3)
Powder Colouring agent Quarried, crushed and graded. Iron chromite is the colouring agent used for producing green container glasses and coloured flat glass
Iron oxide (Fe2O3)
Powder Colouring agent Manufactured product used mainly as a colouring agent in green and amber glasses
Titanium oxide Powder Colouring agent Manufactured product used mainly as a colouring agent in amber borosilicate glasses
Cobalt oxide Powder Colouring agent Manufactured product used both as a decolouriser and as a colourant to produce blue glass
Selenium metal/zinc or sodium selenite Powder Colouring agent
Manufactured product, also trace quantities used as a decolouriser (colour corrector). Large quantities used for bronze glass
Source: [19, CPIV 1998] [66, APFE UPDATE IPPC Glass BREF 2007]
The glass industry as a whole is not a major consumer of water, the main uses being cooling, cleaning and batch humidification. Some sectors use water for other purposes, which are discussed further in the sector-specific sections. Where practicable, water circuits are closed loops with make up of evaporative losses. Water can be taken either from the mains supply or from natural sources. The term ‘ancillary materials’ is used to describe those substances which are used in the manufacture of the products but which do not form part of the final product; for example, the tin and hydrogen used in float glass baths, oxygen in oxy-fuel fired systems, sulphur dioxide in flat glass (and occasionally container glass) surface treatment, and the cutting compounds and polishing acids used in lead crystal production. These types of materials are generally quite specific to each sector and are discussed in later sections. The impact of these materials on process emissions will vary from case to case. Some can be quite significant, e.g. acid polishing, while others are very low, e.g. tin emissions from float baths. Glass making is an energy-intensive process and therefore fuels can form a significant input into the processes. The main energy sources within the glass industry are fuel oil, natural gas and electricity. Energy and fuel issues are discussed in Section 3.2.3 and in the sector-specific sections.

Chapter 3
Manufacture of Glass 85
3.2.2 Process outputs The core process outputs can be divided into five main categories: product, emissions to air, liquid waste streams, solid process residues, and energy. Liquid and solid waste streams can be recycled or disposed of, depending on the process-specific issues. In general, glass installations do not have significant co-product or by-product streams. However, it is becoming increasingly common for material that would otherwise be disposed of as a waste stream to be converted into a saleable (or no cost) form, for use as either a feedstock for other processes or as an end-product. In general, glass making involves the melting of a significant amount of materials such as metal oxides, carbonates, sulphates and nitrates. Upon melting, these substances decompose and release gases such as carbon dioxide, water vapour, and oxides of sulphur and nitrogen. The batch materials may also contain moisture (between 0 and 4 %, either physically or chemically incorporated), and as the material is heated, water vapour is released. In general, between 3 and 20 % of the batch weight may be emitted as gases. Where high levels of cullet are used, the figure will be at the lower end of this range (1 tonne of cullet replaces approximately 1.2 tonnes of virgin raw material for the production of soda-lime-silica glasses). Other outputs from the processes can include noise and odours. Noise arises from a range of activities including: fans, motors, material handling, transport belts of glass products, vehicle movements, engineering activities, and compressed air systems. Noise is not considered to be a particular problem in the glass industry. However, noise sources clearly exist and could lead to problems with any close residential areas. In general, any problems are readily dealt with by good design and where necessary, noise abatement techniques. Certain pollution control techniques can also require noise control, which can add to the overall cost of the technique. Odours are not generally a problem within the glass industry, but they can arise from certain activities and measures may be required to avoid problems off site. The main activities that can be associated with odour problems are mineral wool curing, cullet preheating and sometimes oil storage.
3.2.2.1 Emissions to air Raw materials All of the sectors within the glass industry involve the use of powdered, granular or dusty raw materials. The storage and handling of these materials represents a significant potential for dust emissions. The movement of materials through systems incorporating silos and blending vessels results in the displacement of air, which if uncontrolled, could contain very high dust concentrations. This is particularly true if pneumatic transfer systems are used. The transfer of materials using conveyor systems and manual handling can also result in significant dust emissions. Many processes in the glass industry involve the use of cullet (either internal or external) which may require sorting and crushing prior to use in the furnace. Like all similar processes, this has the potential for dust emissions. The level of emissions will depend on factors such as the design of the facility, whether the extraction is filtered before discharge, how well buildings are sealed, etc. Some processes also involve the use of volatile liquids, which can result in releases to air from tank breathing losses and from the displacement of vapours during liquid transfers. Melting For many of the processes falling within the scope of this document, the greatest potential for environmental pollution arises from the melting activities. In general, the main environmental pollutants arising from melting are:

Chapter 3
86 Manufacture of Glass
• the products of fossil fuel combustion and the high-temperature oxidation of nitrogen in the combustion atmosphere (i.e. sulphur dioxide, carbon dioxide, and nitrogen oxides)
• particulate matter arising mainly from the volatilisation and subsequent condensation of volatile batch materials
• gases emitted from the raw materials and melt during the melting processes. Where 100 % cold-top electrical heating is used, the emissions of combustion products and thermally-generated NOX are eliminated and particulate emissions arise principally from batch carryover. The partial substitution of fossil fuel firing with electrical heating will reduce direct emissions from the installation, depending on the level of substitution and the particular combustion conditions. Oxy-fuel firing greatly reduces the level of nitrogen in the furnace and so reduces the potential for NOX formation. There are usually off-site emissions associated with the generation of electricity and oxygen, which should be taken into consideration when assessing the overall environmental impact. The furnaces encountered within the glass industry, and within each sector, vary considerably in size, throughput, melting technique, design, age, raw materials utilised, and the abatement techniques applied. Therefore, there is considerable variation in the emissions reported. There are also significant differences in the methodologies used for measuring emissions, and this can make direct comparisons of some actual data misleading. The minimum values are not always necessarily indicative of the best techniques and may only reflect more favourable operating conditions (e.g. high-volume stable production, or low-emission compositions) or plants with lower output. Clearly many of the lower releases represent those modern plants with advanced abatement measures, or ‘clean’ technologies. This issue has been taken into account in the determination of BAT-AELs which are discussed more fully in Chapters 4 and 5. Air emissions are normally presented as concentrations (mg/Nm3) or mass emissions (kg/tonne of glass). All values given in concentrations refer to standard conditions: dry gas, temperature 273 K, pressure 1013 hPa. Unless stated otherwise, the standard conditions for the figures presented throughout the sections of Chapter 3 and the following chapters are given in Table 3.2.
Table 3.2: Reference conditions of emission data Operating conditions Unit Reference conditions
Melting activities Conventional furnaces (continuous melters) mg/Nm3 8 % oxygen by volume
Conventional furnaces (discontinuous melters) mg/Nm3 13 % oxygen by volume
Oxy-fuel fired furnaces kg/tonne melted glass The use of specific mass emissions (kg/tonne melted glass) is more appropriate. However, if emission concentrations are reported, the correction to a reference oxygen is not applicable
Electric furnaces kg/tonne melted glass or mg/Nm3
The correction of emission concentrations to a reference oxygen is not applicable
Frit melting furnaces (1) kg/tonne melted glass or mg/Nm3
Concentrations refer to 15 % oxygen by volume.
The specific mass emissions refer to one tonne of melted frit All types of furnaces kg/tonne glass The specific mass emissions refer to one tonne of melted glass
Non-melting activities All processes mg/Nm3 No correction for oxygen
All processes kg/tonne glass The specific mass emissions refer to one tonne of produced glass
(1) The use of concentrations (mg/Nm3) or mass emissions (kg/t glass) depends on the operating conditions (oxy-firing, oxygen-enriched air/gas firing-see Table 5.1).
The main emissions arising from melting activities within the glass industry are summarised in Table 3.3.

Chapter 3
Manufacture of Glass 87
Table 3.3: Summary of emissions to atmosphere arising from melting activities Emission Source/Comments
Particulate matter
Volatilisation of batch components from the molten glass and subsequent condensation into submicron dust particles. Carryover of fine material in the batch Product of combustion of some fossil fuels
Nitrogen oxides Thermal NOx due to high melting temperatures and prompt NOX formation Decomposition of nitrogen compounds in the batch materials Oxidation of nitrogen contained in fuels
Sulphur oxides
Sulphur in fuel Decomposition of sulphur compounds in the batch materials in particular from the fining process with sulphates Oxidation of hydrogen sulphide in hot blast cupola operations
Chlorides/HCl Present as an impurity in some raw materials, particularly synthetic sodium carbonate and external cullet NaCl used as a raw material (fining agent) in some special glasses
Fluorides/HF
Present as a minor impurity in some raw materials, including external cullet Added as a raw material in the production of enamel frit to add certain properties to the finished product Added as a raw material in the continuous filament glass fibre sector to influence the forming process (surface tension) and in some glass batches to improve melting, or to produce certain properties in the glass, e.g. opalescence Where fluorides are added to the batch, typically as fluorspar, uncontrolled releases can be very high
Heavy metals (e.g. V, Ni, Cr, Se, Pb, Co, Sb, As, Cd)
Present as minor impurities in some raw materials, post-consumer cullet, and fuels Used in fluxes and colouring agents in the frits sector, in particular for enamel frits (predominantly lead and cadmium) Used in some special glass formulations (e.g. lead crystal and some coloured glasses) Selenium is used as a colourant (bronze glass), or as a decolourising agent in some clear glasses and may generate both gaseous and solid emissions
Carbon dioxide Combustion product Emitted after decomposition of carbonates in the batch materials (e.g. soda ash, limestone)
Carbon monoxide Product of incomplete combustion, particularly in hot blast cupolas
Hydrogen sulphide Formed from raw material or fuel sulphur in hot blast cupolas due to the reducing conditions found in parts of the furnace
Heavy metal and trace element emission concentrations can be significant from some processes, and are generally present in the dust. Table 3.4 gives the classification groups generally used for metals emissions on the basis of their estimated relative potential environmental impact (see TA Luft 1986, French and Italian legislations).
Table 3.4: Classification of metals and their compounds Group 1 metals
and their compounds Group 2 metals and
their compounds Arsenic Antimony Cobalt Lead Nickel Chromium III Selenium Copper Chromium VI Manganese Cadmium Vanadium
Tin
Some actual examples of emission levels, taken from [42, VDI 1997][162, ICG-TC 13 2006],are shown in Table 3.5, which reports illustrative maximum figures for heavy metals not indicative of the use of BAT.

Chapter 3
88 Manufacture of Glass
Table 3.5: Potential heavy metal emissions from glass processes without abatement Metal Container glass Flat glass Lead crystal
glass Vanadium (when firing fuel oil) Up to 4 mg/Nm3 Up to 2 mg/Nm3
Nickel (when firing fuel oil) Up to 0.5 mg/Nm3 Up to 0.4 mg/Nm3
Chromium, total (green glass) Up to 3 mg/Nm3
Selenium, total (green container glass) Up to 0.8 mg/Nm3
Selenium, gaseous (flint hollow glass) Up to 14 mg/Nm3
Selenium, total (flint hollow glass) Up to 25 mg/Nm3
Selenium, total (float bronze glass) Up to 80 mg/Nm3
Lead Up to 4 mg/Nm3 Up to 1 mg/Nm3 Up to 700 mg/Nm3
Cadmium Up to 0.3 mg/Nm3 Up to 0.1 mg/Nm3
Antimony Up to 10 mg/Nm3
Arsenic Up to 20 mg/Nm3
Source: [42, VDI 1997] [162, ICG-TC 13 2006]
Downstream activities This term is used to describe activities undertaken following melting, for example, forming, annealing, coating, processing, etc. The emissions from downstream activities can vary greatly between the different sectors and are discussed in the sector-specific sections. Although many of the sectors share some similar melting techniques, the downstream activities tend to be exclusive to each sector. In general, emissions to air can arise from: • the coating application and/or drying (e.g. mineral wool, continuous filament glass fibre,
container glass, and some flat glass) • any activities performed on the materials produced such as cutting, polishing, or
secondary processing (e.g. mineral wool, domestic glass, special glass, HTIW) • some product-forming operations (e.g. mineral wool, and HTIW). Diffuse/fugitive emissions Diffuse and fugitive emissions may be associated with different operations of the glass manufacturing process; however, in general, they do not represent a main concern for the sector. The main sources of diffuse/fugitive emissions common to all the sectors of the glass industry are related to the following areas: • material storage and handling • the charging area of the furnace (doghouse) • the melting furnace. Material storage and handlingSolid emissions may arise from sand and/or cullet deposited in open spaces and leakages from storage silos. Gaseous emissions may arise from the storage and handling of volatile liquids and/or gaseous chemicals, mainly related to downstream activities or flue-gas treatments (i.e. ammonia storage). Information regarding the prevention and minimisation of diffuse/fugitive emissions from storage can be found in the Reference Document on Emissions from Storage (EFS BREF) [121, EC 2006]. In general, the impact of diffuse and fugitive emissions in the working area is managed by Health and Safety regulations at work, which include awareness and compliance. Occupational exposure limit values (OELs) have been set for a select number of substances at the European level, while many other OELs are based on national or international legislations and threshold limit value lists (e.g. European OSHA; ACGIH, US; MAK, Germany, etc.). Diffuse emissions of respirable crystalline silica (silica sand, an essential component of the batch formulation for glass manufacturing, could give rise to respirable crystalline silica particles) are the subject of a European Social Dialogue Agreement: ‘Agreement on workers’ health protection through the good handling and use of crystalline silica and products containing it’, signed in 2006 [135, NEPSI 2006] [169, NEPSI-Good Practice Guide 2006].

Chapter 3
Manufacture of Glass 89
Charging area of the furnace (doghouse)Solid and gaseous emissions may arise from carryover, evaporation and decomposition phenomena from the charging of the batch formulation into the melting furnace. In general, the charging area (doghouse) is kept closed as much as possible in order to prevent both air infiltration and diffuse emissions. In some cases the doghouse area may be equipped with extraction systems that discharge outside or, less frequently, inside the building, close to the roof; in other cases, for specific types of furnaces, the doghouse is totally enclosed. Melting furnaceDiffuse emissions may arise from combustion gases of the fossil fuel and from evaporation/condensation phenomena of the volatile components in the batch formulation. The melting furnace may not be totally sealed due to inspection holes, burner ports, and slits between the refractory bricks. An estimate of the volume of fugitive gases can be assessed through a mass balance of a significant pollutant, e.g. sulphur dioxide, proving that the amount of waste gases leaking from the furnace is quite low compared to the total waste gas volume produced during melting.
3.2.2.2 Emissions to water In general, emissions to the water environment are relatively low and there are few major issues that are specific to the glass industry. In general, water is used mainly for cleaning and cooling and can be readily recycled or treated using standard techniques. Most activities will use some liquids, often limited to water treatment chemicals, lubricants or fuel oil. All liquid raw materials pose a potential threat to the environment through spillage or containment failure. In many cases, basic good practice and design is sufficient to control any potential emissions. Specific issues relating to aqueous emissions are discussed in the sector-specific sections. As an example, a typical flow chart of water distribution in the container glass manufacturing industry is shown in Figure 3.1.
Preparation (unit operation, mixing)
Fresh water stream10 – 40 %
Separation(purges, supernatant) Output wastewater
10 – 40 %
Sludge, residue vapour
Glass processing:cooling 30 – 40 %forming, cleaning and utilities 60 – 70 %
Recycled water stream 6 – 90 %
Input water stream
Output water stream
Source:[101, Bruno D. BATwater 2007]
Figure 3.1: Typical water distribution in a container glass plant
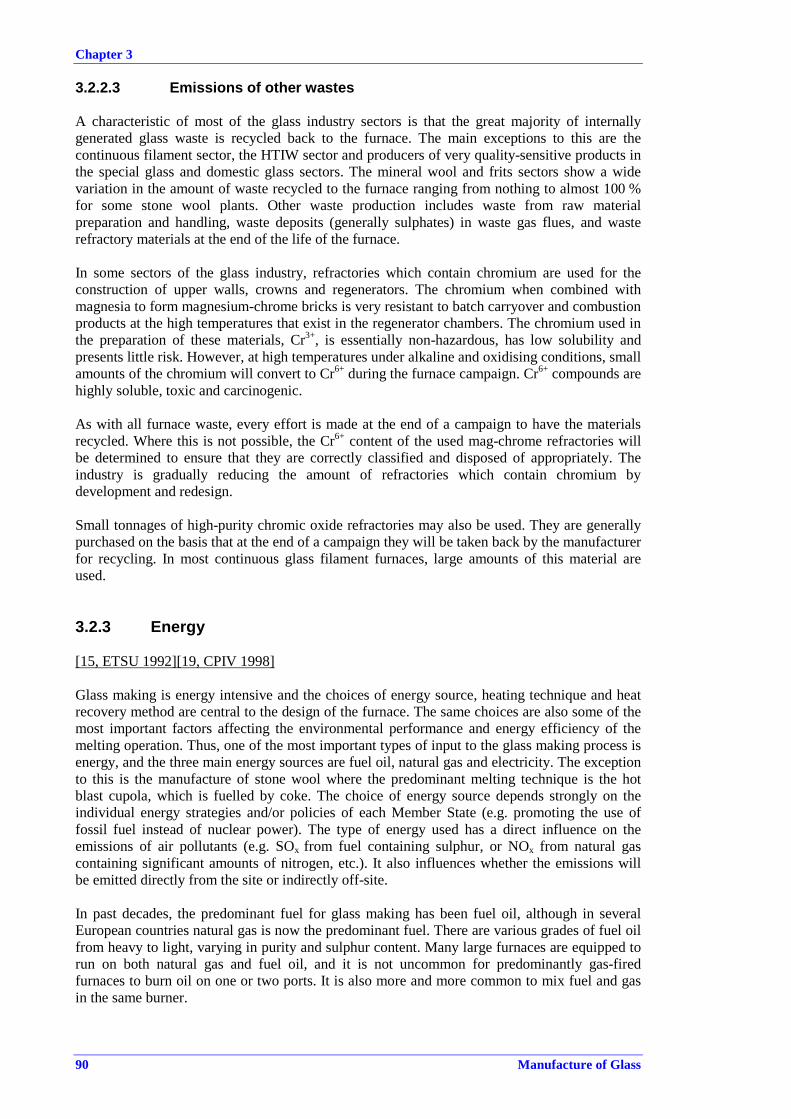
Chapter 3
90 Manufacture of Glass
3.2.2.3 Emissions of other wastes A characteristic of most of the glass industry sectors is that the great majority of internally generated glass waste is recycled back to the furnace. The main exceptions to this are the continuous filament sector, the HTIW sector and producers of very quality-sensitive products in the special glass and domestic glass sectors. The mineral wool and frits sectors show a wide variation in the amount of waste recycled to the furnace ranging from nothing to almost 100 % for some stone wool plants. Other waste production includes waste from raw material preparation and handling, waste deposits (generally sulphates) in waste gas flues, and waste refractory materials at the end of the life of the furnace. In some sectors of the glass industry, refractories which contain chromium are used for the construction of upper walls, crowns and regenerators. The chromium when combined with magnesia to form magnesium-chrome bricks is very resistant to batch carryover and combustion products at the high temperatures that exist in the regenerator chambers. The chromium used in the preparation of these materials, Cr3+, is essentially non-hazardous, has low solubility and presents little risk. However, at high temperatures under alkaline and oxidising conditions, small amounts of the chromium will convert to Cr6+ during the furnace campaign. Cr6+ compounds are highly soluble, toxic and carcinogenic. As with all furnace waste, every effort is made at the end of a campaign to have the materials recycled. Where this is not possible, the Cr6+ content of the used mag-chrome refractories will be determined to ensure that they are correctly classified and disposed of appropriately. The industry is gradually reducing the amount of refractories which contain chromium by development and redesign. Small tonnages of high-purity chromic oxide refractories may also be used. They are generally purchased on the basis that at the end of a campaign they will be taken back by the manufacturer for recycling. In most continuous glass filament furnaces, large amounts of this material are used.
3.2.3 Energy [15, ETSU 1992][19, CPIV 1998]
Glass making is energy intensive and the choices of energy source, heating technique and heat recovery method are central to the design of the furnace. The same choices are also some of the most important factors affecting the environmental performance and energy efficiency of the melting operation. Thus, one of the most important types of input to the glass making process is energy, and the three main energy sources are fuel oil, natural gas and electricity. The exception to this is the manufacture of stone wool where the predominant melting technique is the hot blast cupola, which is fuelled by coke. The choice of energy source depends strongly on the individual energy strategies and/or policies of each Member State (e.g. promoting the use of fossil fuel instead of nuclear power). The type of energy used has a direct influence on the emissions of air pollutants (e.g. SOx from fuel containing sulphur, or NOx from natural gas containing significant amounts of nitrogen, etc.). It also influences whether the emissions will be emitted directly from the site or indirectly off-site. In past decades, the predominant fuel for glass making has been fuel oil, although in several European countries natural gas is now the predominant fuel. There are various grades of fuel oil from heavy to light, varying in purity and sulphur content. Many large furnaces are equipped to run on both natural gas and fuel oil, and it is not uncommon for predominantly gas-fired furnaces to burn oil on one or two ports. It is also more and more common to mix fuel and gas in the same burner.

Chapter 3
Manufacture of Glass 91
The third common energy source for glass making is electricity, which can be used either as the only energy source or in combination with fossil fuels. Resistive electrical heating is the only technique to have found widespread commercial application within the glass industry. Indirect electric heating has only been used for very small tanks and pot furnaces or for heating part of a tank (e.g. the working end or the forehearth). In general, the energy necessary for melting glass accounts for over 75 % of the total energy requirements of glass manufacture. Other significant areas of energy use are forehearths, the forming process, annealing, factory heating and general services. The typical energy use for the container glass sector, which accounts for around 53 % of the EU output is for the furnace 79 – 82 %; the forehearth 6 %; the compressed air 4 %; the annealing lehr 2 %; and other 6 %. It should be noted that throughout this document, the energy figures relate to energy at the point of use, and are not corrected to primary energy.
Although there are wide differences between sectors and individual plants, the example for container glass can be considered broadly indicative for the industry. The main exception to this generalisation is the mineral wool sector where the fiberising operation and the curing oven are also major energy consumers. Within the container glass sector, the production of flaconnage represents a specific case, with about 50 % of the total energy consumption used for melting due to the particular quality requirements of the final product. As discussed earlier, fuel oil and natural gas are the predominant energy sources for melting, with a small percentage of electricity. Forehearths and annealing lehrs are heated by gas or electricity, and electrical energy is used to drive air compressors and fans needed for the process. General services include water pumping, steam generation for fuel storage and trace heating, humidification/heating of batch, and heating buildings. Some furnaces have been equipped with waste heat boilers to produce part or all of the steam required. In order to provide a benchmark for process energy efficiency, it is useful to consider the theoretical energy requirements for melting glass. The theoretical energy requirements for the melting of the most common glasses from batch formulations without cullet recycling is given in Table 3.6. The calculation assumes all available heat is fully utilised and has three components: • the heat of reaction to form the glass from the raw materials • the heat required, enthalpy, to raise the glass temperature from 20 to 1500 °C and • the heat content of the gases (principally CO2) released from the batch during melting. The theoretical levels given in Table 3.6 only relate to the energy required to melt the glass formulations. Additional energy will be required to refine, form and finish the glass, and for other ancillary services such as compressed air.

Chapter 3
92 Manufacture of Glass
Table 3.6: Theoretical energy requirements for the melting of common glasses from batch formulations without cullet recycling
Heat of reaction
Enthalpy of glass
Enthalpy of gases emitted
Theoretical energy requirement Type of glass
GJ/tonne GJ/tonne GJ/tonne GJ/tonne Soda-lime (flat/container glass) 0.49 1.89 0.30 2.68
Borosilicate (8 % B2O3)
0.41 1.70 0.14 2.25
Borosilicate (13 % B2O3)
NA NA NA 2.4
Crystal glass (19 % PbO) 0.40 1.69 0.16 2.25
Crystal glass (24 % PbO) NA NA NA 2.1
Crystalline glass with Barium 1.02 1.91 0.31 3.24
NA = not available. Source: [15, ETSU 1992] [102, ARC Energy requirement 2008]
The actual melting energy requirements experienced in the various sectors vary widely from about 3.3 to over 40 GJ/melted tonne. This figure depends very heavily on the furnace design, scale, method of operation and type of glass. However, the majority of glass is produced in large furnaces and the energy requirement for melting is generally below 8 GJ/tonne. Energy consumption is considered further for each sector where information is available. In general, energy is supplied to the melting furnace by: • combustion of fuel • preheating of combustion air • electric power • sensible heat of fuels, oxygen or excess air • (preheated) batch. Because glass making is such an energy intensive, high-temperature process, there is clearly a high potential for heat loss. Substantial progress with energy efficiency has been made in recent years and some processes (e.g. large regenerative furnaces) are approaching the theoretical minimum energy consumption for melting, taking into account the inherent limitations of the processes. A modern regenerative container furnace will have an overall thermal efficiency of around 50 % (maximum 60 %), with waste gas losses of around 30 %, and structural losses making up the vast majority of the remainder. This efficiency compares quite well with other large-scale combustion activities particularly electricity generation which typically has an efficiency in the range of 35 – 45 %. Structural losses are inversely proportional to the furnace size, the main reason being the change in surface area to volume ratio. Electrically heated and oxy-fuel fired furnaces generally have better specific energy efficiencies than fossil fuel furnaces, but have associated drawbacks which are discussed later in this document. A typical energy output distribution for the production of the most common industrial glasses is reported in Table 3.7.

Chapter 3
Manufacture of Glass 93
Table 3.7: Examples of energy output distribution for the production of the most common industrial glasses
Type of glass Flat glass Container glass
Type of furnace Float, regenerative cross-fired
Regenerative, end-fired
Pull rate 600 tonnes/day 260 tonnes/day Cullet 25 % 83 % Total energy consumption (GJ/tonne melted glass)
6.48 GJ/tonne melted glass
3.62 GJ/tonne melted glass
Water evaporation (batch humidity) 1 % 1.5 % Endothermic reactions 6 % 2.4 % Sensible heat glass melt (net) 33 % 44.2 % Wall heat losses 15 % 18.3 % Cooling and leakage heat losses 9 % 3.7 % Flue-gas losses from bottom regenerator 32 % 27.6 % Regenerator heat losses (structure) 4 % 2.3 % Source: [97, Beerkens Energy Balances 2006]
Some of the more general factors affecting the energy consumption of fossil fuel fired furnaces are outlined below. For any particular installation, it is important to take account of site-specific issues which will affect the applicability of the general information given below. These factors also affect the emissions per tonne of glass of those substances which relate directly to the amount of fossil fuel burned, particularly CO2, SO2 and NOX. The main site-specific issues are given below. a. The capacity of the furnace significantly affects the energy consumption per tonne of
glass melted, because larger furnaces are inherently more energy efficient due to the lower surface area to volume ratio.
b. The furnace throughput is also important, with most furnaces achieving the most energy efficient production at peak load. Variations in furnace load are largely market dependent and can be quite wide, particularly for some container glass and domestic glass products.
c. As the age of a furnace increases, its thermal efficiency usually declines. Towards the end of a furnace campaign, the energy consumption per tonne of glass melted may be up to 20 % higher than at the beginning of the campaign.
d. The use of an electric boost improves the energy efficiency of the furnace. However, when the cost of electricity and the efficiency of electrical generation and distribution are taken into account, the overall improvement is lower (or even negative). An electric boost is generally used to improve the melting capability of the furnace rather than to improve energy efficiency.
e. The use of cullet can significantly reduce energy consumption because the chemical energy required to melt the raw materials has already been provided. As a general rule, every 10 % increase in cullet usage results in an energy savings of 2 – 3 % in the melting process.
f. Oxy-fuel firing can also reduce energy consumption, particularly in smaller furnaces. The elimination of the majority of the nitrogen from the combustion atmosphere reduces the volume of the waste gases leaving the furnace by 60 – 70 %. Therefore, energy savings are possible because it is not necessary to heat the atmospheric nitrogen to the temperature of the flames; most oxy-fuel furnaces are not equipped with heat recovery systems.
The site-specific issues reported above do not take into account some important off-site issues which affect the applicability of the different melting techniques, in particular the cost of electricity and the efficiency of electrical generation and distribution.

Chapter 3
94 Manufacture of Glass
Energy efficiency is a very complex issue that is dealt with further in the sector-specific sections of this chapter and in Chapter 4. Since the 1960s, the glass industry as a whole has reduced specific energy consumption by approximately 1.5 % per year. Today this figure is lower, as the thermodynamic limits are approached. Table 3.8 gives useful examples of specific energy consumption for a range of modern, energy efficient glass furnaces.
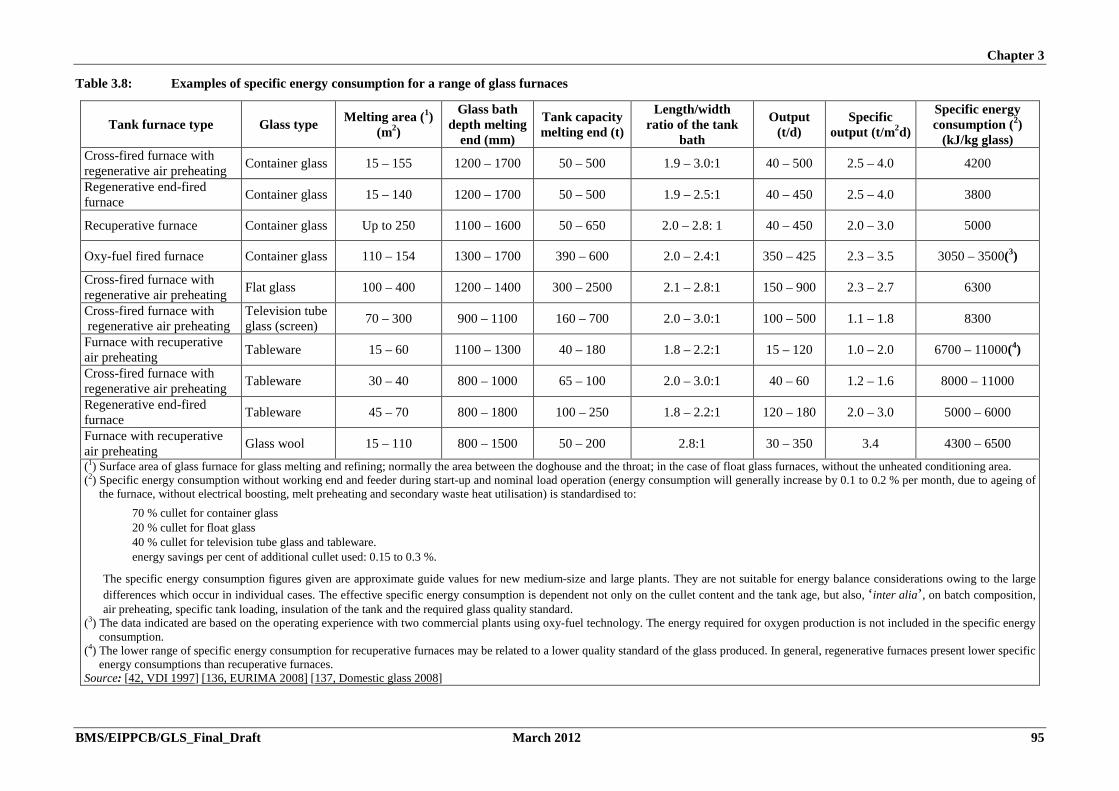
Chapter 3
BMS/EIPPCB/GLS_Final_Draft March 2012 95
Table 3.8: Examples of specific energy consumption for a range of glass furnaces
Tank furnace type Glass type Melting area (1)(m2)
Glass bathdepth melting
end (mm)
Tank capacitymelting end (t)
Length/widthratio of the tank
bath
Output(t/d)
Specificoutput (t/m2d)
Specific energyconsumption (2)
(kJ/kg glass)Cross-fired furnace withregenerative air preheating Container glass 15 – 155 1200 – 1700 50 – 500 1.9 – 3.0:1 40 – 500 2.5 – 4.0 4200
Regenerative end-firedfurnace Container glass 15 – 140 1200 – 1700 50 – 500 1.9 – 2.5:1 40 – 450 2.5 – 4.0 3800
Recuperative furnace Container glass Up to 250 1100 – 1600 50 – 650 2.0 – 2.8: 1 40 – 450 2.0 – 3.0 5000
Oxy-fuel fired furnace Container glass 110 – 154 1300 – 1700 390 – 600 2.0 – 2.4:1 350 – 425 2.3 – 3.5 3050 – 3500(3)
Cross-fired furnace withregenerative air preheating Flat glass 100 – 400 1200 – 1400 300 – 2500 2.1 – 2.8:1 150 – 900 2.3 – 2.7 6300
Cross-fired furnace withregenerative air preheating
Television tubeglass (screen) 70 – 300 900 – 1100 160 – 700 2.0 – 3.0:1 100 – 500 1.1 – 1.8 8300
Furnace with recuperativeair preheating Tableware 15 – 60 1100 – 1300 40 – 180 1.8 – 2.2:1 15 – 120 1.0 – 2.0 6700 – 11000(4)
Cross-fired furnace withregenerative air preheating Tableware 30 – 40 800 – 1000 65 – 100 2.0 – 3.0:1 40 – 60 1.2 – 1.6 8000 – 11000
Regenerative end-firedfurnace Tableware 45 – 70 800 – 1800 100 – 250 1.8 – 2.2:1 120 – 180 2.0 – 3.0 5000 – 6000
Furnace with recuperativeair preheating Glass wool 15 – 110 800 – 1500 50 – 200 2.8:1 30 – 350 3.4 4300 – 6500
(1) Surface area of glass furnace for glass melting and refining; normally the area between the doghouse and the throat; in the case of float glass furnaces, without the unheated conditioning area.(2) Specific energy consumption without working end and feeder during start-up and nominal load operation (energy consumption will generally increase by 0.1 to 0.2 % per month, due to ageing of
the furnace, without electrical boosting, melt preheating and secondary waste heat utilisation) is standardised to:• 70 % cullet for container glass• 20 % cullet for float glass• 40 % cullet for television tube glass and tableware.• energy savings per cent of additional cullet used: 0.15 to 0.3 %.
The specific energy consumption figures given are approximate guide values for new medium-size and large plants. They are not suitable for energy balance considerations owing to the largedifferences which occur in individual cases. The effective specific energy consumption is dependent not only on the cullet content and the tank age, but also, ‘inter alia’, on batch composition,air preheating, specific tank loading, insulation of the tank and the required glass quality standard.
(3) The data indicated are based on the operating experience with two commercial plants using oxy-fuel technology. The energy required for oxygen production is not included in the specific energyconsumption.
(4) The lower range of specific energy consumption for recuperative furnaces may be related to a lower quality standard of the glass produced. In general, regenerative furnaces present lower specificenergy consumptions than recuperative furnaces.
Source: [42, VDI 1997] [136, EURIMA 2008] [137, Domestic glass 2008]

Chapter 3
96 Manufacture of Glass
3.2.4 Noise In the glass manufacturing process, noise may be a significant issue for some sectors, particularly in the container and domestic glass production sectors. Prevention and reduction of noise is not always practicable and precautions are normally taken to protect workers where noise levels cannot be reduced. The noise levels within the installation represent mainly an occupational health issue; the effect of noise on operators is not within the scope of this document. An assessment of the environmental impact of the glass plant should be made in relation to the proximity of the plant to sensitive receptors. The significant sources of noise emissions are the following: • compressed air for cooling • fan for combustion air • fan for waste gas extraction • forming machines (e.g. container, domestic and special glass sectors) • transport belts for glass products • cutting operations (e.g. flat and special glass) • grinding, polishing operations (e.g. domestic and special glass). The noise levels (in decibels) are equipment/plant-specific and may exceed the value of 85 dBA in some areas of the installation. The most common noise abatement techniques are: • the enclosure of noisy equipment/operations in separate structures • the use of embankments to screen the source of the noise.
3.3 Container glass [19, CPIV 1998] [64, FEVE 2007] [126, FEVE 2009]
As described in Chapter 1, container glass is the largest sector of the EU glass industry representing between 50 – 60 % of total production (58 % in 2007). In 2005, there were approximately 300 furnaces operating at approximately 170 installations. Furnace types include cross-fired regenerative, end-fired regenerative, recuperative, electrical, and oxy-gas fired furnaces; and the sizes also vary widely from less than 50 000 tonnes per year (10 000 for perfume bottle production) to over 150 000 tonnes per year. Production from an installation with several furnaces can be more than 1 000 tonnes per day. Clearly, such a large and varied sector leads to significant variations in the amount and types of process inputs and outputs. However, products of this sector are almost exclusively manufactured using soda-lime or modified soda-lime formulations, and so the variation in glass making raw materials is limited. The ratio of raw material input to melt produced will vary depending on the level of cullet used, which affects the amount of gases lost from the raw materials upon melting. Degassing and drying of the raw materials can account for between 3 and 20 % of the input, and 1 tonne of cullet replaces approximately 1.2 tonnes of virgin raw materials. Pack to melt ratio can range from under 50 % for some special complex perfume container products to over 90 % for high-volume standard container products with most glass process waste recycled back into the furnace.

Chapter 3
Manufacture of Glass 97
Table 3.9 gives an overview of the major inputs to and outputs from the process. The emissions represent typical mid-range furnaces. This is a composite of data from expert judgement and values from a survey carried out by the European Container Glass Federation (FEVE). Values reported should only be considered indicative. More precise data on energy consumption and emissions are given in Section 3.3.2.2.
Table 3.9: Overview of major container glass production inputs and outputs (indicative values refer to one tonne of melted glass)
Inputs Units/tonne (glass melted) Range (mean value)
Post-consumer cullet tonne 0 - 0.85 (0.40) Silica sand tonne 0.04 - 0.66 (0.35) Carbonates tonne 0.02 - 0.40 (0.20) Minor mineral ingredients tonne 0.002 - 0.05 (0.02) Furnace refractory materials tonne 0.005 - 0.01 (0.008)Packaging materials tonne 0.040 - 0.080 (0.045)Moulds and other tonne 0.004 - 0.007 (0.005)Energy, fuel/gas total (*) GJ 4 - 14 (6.5) Energy, electricity total (*) GJ 0.6 - 1.5 (0.8) Water m3 0.3 - 10 (1.8)
Outputs Finished, packed products tonne 0.75 - 0.97 (0.91)
Atmospheric emissions CO2 kg 300 - 1000 (430) NOX kg 0.2 - 4.4 (2.0) SOX kg 0.2 - 4.1 (1.3) Dust (without secondary abatement) kg 0.2 - 0.6 (0.3) Dust (with secondary abatement) kg 0.002 - 0.05 (0.017)HCl (without secondary abatement) kg 0.02 - 0.08 (0.029)HCl (with secondary abatement) kg 0.005 - 0.06 (0.027)HF (without secondary abatement) kg 0.001 - 0.022 (0.007)HF (with secondary abatement) kg 0.00005 0.007 (0.002)Metals (without secondary abatement) kg 0.0002 - 0.015 (0.004)Metals (with secondary abatement) kg 0.00006 - 0.002 (0.001)H2O (evaporation and combustion) tonne 0.3 - 10 (1.8)
Waste water m3 0.2 - 9.9 (1.6) Waste to recycling tonne 0.002 - 0.006 (0.005)Other waste tonne 0.003 - 0.015 (0.005)(*) Total energy (furnace and other) for a typical plant operating with fossil fuel fired furnaces. Source: [19, CPIV 1998] [64, FEVE 2007]

Chapter 3
98 Manufacture of Glass
3.3.1 Process inputs A summary of the materials used in the container glass sector is shown in Table 3.10.
Table 3.10: Materials utilised in the container glass sector Description Materials
Glass forming materials Silica sand, process cullet, post-consumer cullet Glass intermediate and modifying materials
Sodium carbonate, limestone, dolomite, blast furnace slag, feldspar, nepheline syenite, potassium carbonate, filter dust
Glass oxidants and fining agents Sodium sulphate, carbon, sodium nitrate or potassium nitrate
Glass colouring and decolouring agents
Iron chromite, iron oxide, iron sulphide, cobalt oxide, cerium oxide, selenium or zinc selenite
Product coating agents (hot coating)
Inorganic or organic metal chlorides. Predominantly tin tetrachloride, titanium tetrachloride and monobutyltin trichloride
Product lubricants Polyethylene-based lubricants and fatty acids (e.g. oleic acid) Fuels Fuel oil, natural gas, electricity, butane, propane Water Mains supply and local natural sources (wells, rivers, lakes, etc.)
Ancillary materials
Packaging materials including plastics, paper, cardboard, and wood. Mould lubricants, generally high-temperature graphite-based release agents. Machine lubricants, predominantly mineral oils. Process gases, oxygen and sulphur dioxide. Water treatment chemicals for cooling water and waste water.
Source: [ 19, CPIV 1998 ]
The largest inputs to the process are the silica-containing materials (sand and glass cullet) and the carbonates (soda ash, dolomite and limestone). The raw materials for the glass batch are blended in the correct proportion to produce the range of glass compositions identified in Section 2.4. In most container glass compositions, silicon, sodium and calcium, conventionally expressed as oxides, account for over 90 % of the glass (SiO2 71 – 73 %, Na2O 12 – 14 % and CaO 10 – 12 %). The silicon dioxide is derived mainly from glass cullet and sand. Sodium oxide is derived mainly from glass cullet and soda ash; and calcium oxide mainly from glass cullet, limestone and to a lesser extent, dolomite. Many container glass processes utilise a substantial level of glass cullet in the batch materials, with the sector average at approximately 50 %, made up of internal cullet and post-consumer cullet. The use of post-consumer cullet varies greatly (from 0 to >80 %) but almost all processes will recycle their internal cullet which is usually around 10 % of the batch. The inputs of the other glass making materials, particularly sand, soda ash, limestone and dolomite, will vary depending on the amount of cullet used and its composition. The use of product surface treatment materials, i.e. coatings and lubricating treatments, varies from process to process. However, the amount of material used is very low relative to glass making raw materials, generally in the order of a few kilograms per day per production line (see Section 3.3.2.3 and Section 4.5.1). The fuels used will vary from process to process, but in general, fuel oil, natural gas and electricity are used for glass melting, either separately or in combination. Forehearths and annealing lehrs are heated by gas or electricity, which are also used for heating and general services. Light fuel oil, propane and butane are sometimes used as backup fuels.

Chapter 3
Manufacture of Glass 99
The main uses of water in the container glass sector are for cooling circuits and cleaning. Water is frequently used (generally as steam) to humidify the batch materials (0 to 4 % moisture) to avoid raw material separation and to reduce dust carryover from the furnace. Cooling water is used, usually in closed or open circuits, to cool various pieces of equipment and the hot glass from production rejects, with corresponding losses from evaporation and purges. Actual water consumption and water vapour emissions may vary according to local conditions (e.g. climate, geographical location and the hardness of water input).
3.3.2 Emissions to air 3.3.2.1 Raw materials In most modern container glass processes, silos and mixing vessels are fitted with filter systems which reduce dust emissions to below 5 mg/Nm3. Mass emissions from both filtered and unfiltered systems will depend on the number of transfers, the granule size, and the amount of material handled.
3.3.2.2 Melting In the container glass sector, the greatest potential environmental emissions are emissions to air from the melting activities. The substances emitted and the associated sources are identified in Section 3.2.2.1. The majority of furnaces in this sector are heated predominantly with fossil fuels, both natural gas and fuel oil. However, due to the large size and wide distribution of the sector, there is a particularly wide range of furnaces in operation giving rise to a very wide range of emission levels. This is clearly indicated in the tables presented in this section, which detail furnace characteristics and reported emission levels from a statistical survey from members of the European Container Glass Federation (FEVE). The data are reported for up to 244 fossil fuel furnaces and four all-electric furnaces for the reference year 2005. This thus represents approximately 80 % of installations in the EU-27. In the tables, emission ranges are divided as appropriate into those with and without the use of primary measures and secondary techniques. Note that the reported emission data corresponds to analyses made in the context of reporting requirements in the countries/regions where the installations are located, and the sampling and measurement techniques used are not homogeneous. They refer to a limited timeframe, generally less than three hours, and thus will be sensitive to transient operating conditions. Furthermore, when standardised methods are used, the uncertainty of them is not taken into account in expressing the results. For these reasons, data presented in Table 3.13, Table 3.14, Table 3.15, Table 3.16 and Table 3.17 can only be considered indicative of the range of actual emissions at the time of the survey. In order to give an improved indication of the representativeness of the reported emission values, data are given as both mean average/minimum/maximum over the entire data set (100 % data) and the mid-90th percentile of the values (i.e. 5 to 95 %). It should also be stressed that the implementation of initial IPPC based permits was ongoing at the time of the survey. In particular, the installation of dust abatement equipment was increasing during the years 2003 – 2005. Since 2005, a significant number of new abatement systems have been commissioned. The process is foreseen to continue and many new installations were foreseen at the time of the survey in 2005. Table 3.11 presents the statistical distribution of furnace sizes and types from the FEVE survey, concerning the situation in 2005.

Chapter 3
100 Manufacture of Glass
Table 3.11: Statistical data on furnace sizes and type from the FEVE survey (2005 values) Glass melted (tonne/day) (1)Furnaces size by type Reported
data Nº
values Mean Min. Max. All product types All furnace types 100 % 248 233 22 521 Cross-fired, regenerative 100 % 55 289 130 520 End-fired, regenerative 100 % 152 229 40 521 Recuperative 100 % 29 185 22 376 Oxy-fuel combustion 100 % 8 180 75 305 Electric 100 % 4 61 40 100 Bottle/jar production All furnace types 100 % 222 249 56 521 Cross-fired, regenerative 100 % 55 289 130 520 End-fired, regenerative 100 % 138 240 56 521 Recuperative 100 % 23 214 80 376 Oxy-fuel combustion 100 % 5 242 200 305 Electric 100 % 1 100 100 100 Flaconnage production All furnace types 100 % 20 80 22 300 End-fired, regenerative 100 % 10 97 40 300 Recuperative 100 % 5 69 22 127 Oxy-fuel combustion 100 % 2 76 76 76 Electric 100 % 3 47 40 60 Mixed bottles/flaconnage production All furnace types 100 % 6 147 75 245 End-fired, regenerative 100 % 4 171 98 245 (1) Glass production (in tonnes melted glass/day) is representative of the furnace operating conditions corresponding to the emissions data provided. Source: [126, FEVE 2009]
End-fired regenerative furnaces represent >60 % of the sample, covering practically the whole range of production rates. Only eight oxy-fuel combustion furnaces (3.2 % of the total) were reported. The values highlight in particular the difference in average of melted glass for flaconnage furnaces, equivalent to ∼80 tonnes/day, compared with the mainstream bottle and jar production, with an average of ∼250 tonnes/day. In Table 3.12 the statistical data on total cullet rates used for different glass colours are reported. Data refer to a survey carried out by FEVE for the year 2005. Total cullet rates given in Table 3.12 are expressed as total cullet per tonne of melted glass. The values do not correspond to the EU recycling rates for several reasons. EU data relate to collected glass, not to cullet used in the EU glass manufacturing installations. The glass collected will invariably contain a percentage of impurities (up to 5 %). Not all glass collected is used again for container glass production. The EU data do not include internal cullet. Not all glass produced in the EU will be reused in the EU; not all glass used in the EU will be produced in the EU.

Chapter 3
Manufacture of Glass 101
Table 3.12: Statistical data on total cullet rates for the EU container glass furnaces, reported from the FEVE survey for different glass colours (2005 values)
Total cullet rate per furnace (% total cullet/melted tonnes glass)(1)Cullet rates Reported data Nº
Values Mean (2) Min. Max. Flint (colourless) 100 % 123 33 5 74 Amber 100 % 37 49 15 81 Green 100 % 76 72 30 96 Other colours 100 % 13 55 20 85 (1) Total cullet rates per furnace are expressed as total cullet per melted tonne (internal + external). The
values do not relate to recycled glass usage rates in the EU (see text given in the introduction to the table).
(2) The mean values given are the arithmetical mean of individual furnace cullet rates and do not represent the overall mean total cullet rates.
Source: [126, FEVE 2009]
Cullet rates vary greatly over the whole range from 5 to 96 % and are limited in practice by the availability of cullet of suitable quality. This is particularly the case for colourless ‘flint’ glass for which the level of coloured glass cullet impurities must be compatible with the colour specifications required for the final product. Some markets demand very high purity colourless glass (termed ‘extra flint’) such as for perfume and certain premium spirits and this implies correspondingly high-purity requirements of all raw materials. Thus, in this case, the recycling rate is generally limited to internal cullet which corresponds to the low-end values observed (all glass colours and flint). In most cases, green glass is the least sensitive to such limitations and thus incorporates the highest cullet rates. Cullet quality and availability are further discussed in Section 4.8.3. It must be stressed that the cullet rate of a particular furnace (or glass colour) must be considered in the wider regional, national or international context of the supply and demand of recycled post-consumer glass. The cullet rate has a major systematic impact on melting energy for any melting technology or furnace size and, as already stated, in many cases is limited by external factors, in particular suitable cullet availability. In Table 3.13 the melting energy for different furnace types and the size ranges are presented from a FEVE survey concerning the year 2005. Specific melting energy values have thus been corrected to 50 % cullet using the relation given elsewhere in this document (-2.5 % energy for every 10 % increase in cullet). For the correction, the overall melting energy consumption (EM) from each furnace in the survey (net calorific value for the fossil fuels + direct electrical energy) was multiplied by a factor corresponding to the total cullet rate (CT) to obtain the energy consumption corrected to 50 % cullet (EM50). The approximate formula used for the calculation is shown below:
EM50 = EM/{1 + [(50 - CT) x 0.025]/10} where: EM50 (GJ/melted tonne) = energy consumption corrected to 50 % cullet EM (GJ/melted tonne) = overall melting energy consumption CT (%) = total cullet rate. To enable a basic comparison between air-fuel and oxy-fuel combustion, the electrical energy required to produce the oxygen must be taken into account in the determination of specific melting energy. To remain consistent with the computation of electrical energy consumption in this section, the energy employed for the production of oxygen is given as used at the glass plant. The corresponding amount is estimated on the basis of a (conservative) fixed ratio of electrical energy for oxygen production equivalent to 0.07 GJ per GJ net calorific value from

Chapter 3
102 Manufacture of Glass
fossil fuel energy used by the furnace. This computation is already included in the calculation of melting energy corrected to 50 % of total cullet. However, it should be noted that an energy consumption of 0.07 GJ at the point of use corresponds to about 0.2 GJ of primary energy needed to generate this amount of electricity.
Table 3.13: Specific melting energy for different furnace types and size ranges from the FEVE survey (2005 data)
Furnace size by type
Specific melting energy corrected to 50 %
total cullet rate (GJ net calorific
value/melted tonne) Unit
Reported data
Nº values
Mean Min. Max. End-fired 100 % 153 4.8 3.4 10.7 <100 tonnes/day 100 % 12 6.9 5.5 11.7 100 – 250 tonnes/day 100 % 81 4.8 3.4 6.7 250 – 400 tonnes/day 100 % 54 4.3 3.4 9.5 >400 tonnes/day 100 % 6 4.1 3.4 5.1 Cross-fired 100 % 56 4.6 3.3 6.6 <100 tonnes/day - 0 - - - 100 – 250 tonnes/day 100 % 17 5.0 3.3 6.6 250 – 400 tonnes/day 100 % 31 4.5 3.7 5.8 >400 tonnes/day 100 % 7 4.4 3.5 5.2 Recuperative 100 % 29 6.3 4.1 11.6 <100 tonnes/day 100 % 5 9.1 5.9 11.6 100 – 250 tonnes/day 100 % 14 5.8 4.1 6.8 250 – 400 tonnes/day 100 % 10 5.6 4.3 7.3 >400 tonnes/day - 0 - - - Oxy-fuel combustion 100 % 8 4.4 3.5 5.2 Oxy-fuel combustion + O2 production(1) 100 % 8 4.7 3.8 5.5 Electric 100 % 3 3.3 2.9 3.6 (1) The electrical energy required to produce oxygen has been taken into account; however, the primary
energy to produce the electricity has not been taken into account. Source: [64, FEVE 2007]
Equivalent average values for specific melting energy are observed when comparing end-fired, cross-fired and oxy-fuel fired furnaces. For the latter, the estimated electrical energy required for oxygen production (no primary energy) is taken into account (see Table 3.13 and also Figure 3.4). As anticipated, higher specific melting energy values are observed for smaller furnaces and this is particularly the case for the production of flaconnage for which the trend curves of the total melting energy are given in Figure 3.2. The curves presented in the figure show that melting energy consumption increases rapidly with the decreasing of the furnace size. Flaconnage furnaces can be regenerative, recuperative, electric or oxy-fuel fired, depending on different factors: investment capacity, available space, foundation load and other local circumstances. In Figure 3.2, the mean, minimum and maximum values are given as the sum of fossil fuel consumption (net calorific value) plus direct electrical energy (used for boosting). All electric furnaces have not been included. Moreover, it should be noted that the curves presented in Figure 3.2 do not take into account the indirect energy consumption necessary to produce oxygen or electricity.

Chapter 3
Manufacture of Glass 103
Source:[126, FEVE 2009]v
Figure 3.2: Trend curves for the total melting energy in flaconnage production from the FEVE survey (2005 data–primary energy for electric boosting or oxygen production is not included)
In the reference year of the survey (2005) 41 % (101 furnaces of 247) of the container glass furnaces in the FEVE study were equipped with secondary abatement. In all cases, the secondary abatement consists of dust abatement by an electrostatic precipitator (77 furnaces) or a bag filter (24 furnaces), generally combined with an upstream desulphurisation stage to remove acid gaseous pollutants (SOX, HF, HCl) and to avoid acidic sulphated condensates which may damage the filtering equipment. The installation of electrostatic precipitators (ESPs) or bag filters has been pursued in the industry since that time, in line with the progressive implementation of the Directive and related permits. At the time of writing (2010) a greater number of furnaces have been equipped with ESPs or bag filters. Emission data related to the furnaces of the FEVE survey are reported in Table 3.14, Table 3.15, Table 3.16, Table 3.17 and Table 3.18. Data presented should be evaluated on the basis of the note given below. 1. Values quoted are from real emission measurements representing particular conditions in
each case. Data from discontinuous and continuous measurements, hourly, daily average values may be included in the result of the survey concerning 248 furnaces covered by different regional and/or national regulations regarding the monitoring of emissions; therefore, measurement strategies and techniques are not homogeneous and are not standardised.
2. Data are given in each case both as reported (100 % values) and as the mid-90th percentile (i.e. 5 % – 95 % of the values); the latter being intended to exclude, to some extent, spurious data points.
3. Data expressed as concentrations corrected to 8 % O2 do not include oxy-fuel fired and all electric furnaces.
4. Data expressed as emission factors do not include all electric furnaces. For oxy-fuel fired furnaces, emission factors are presented as reported, while for air-fuel fired furnaces, emission factors have been calculated using conversion factors derived from standard specific dry waste gas volumes at 8 % O2, equivalent to 385 Nm3/GJ for natural gas and 400 Nm3/GJ for fuel oil, with a correction for the contribution of process CO2 emissions
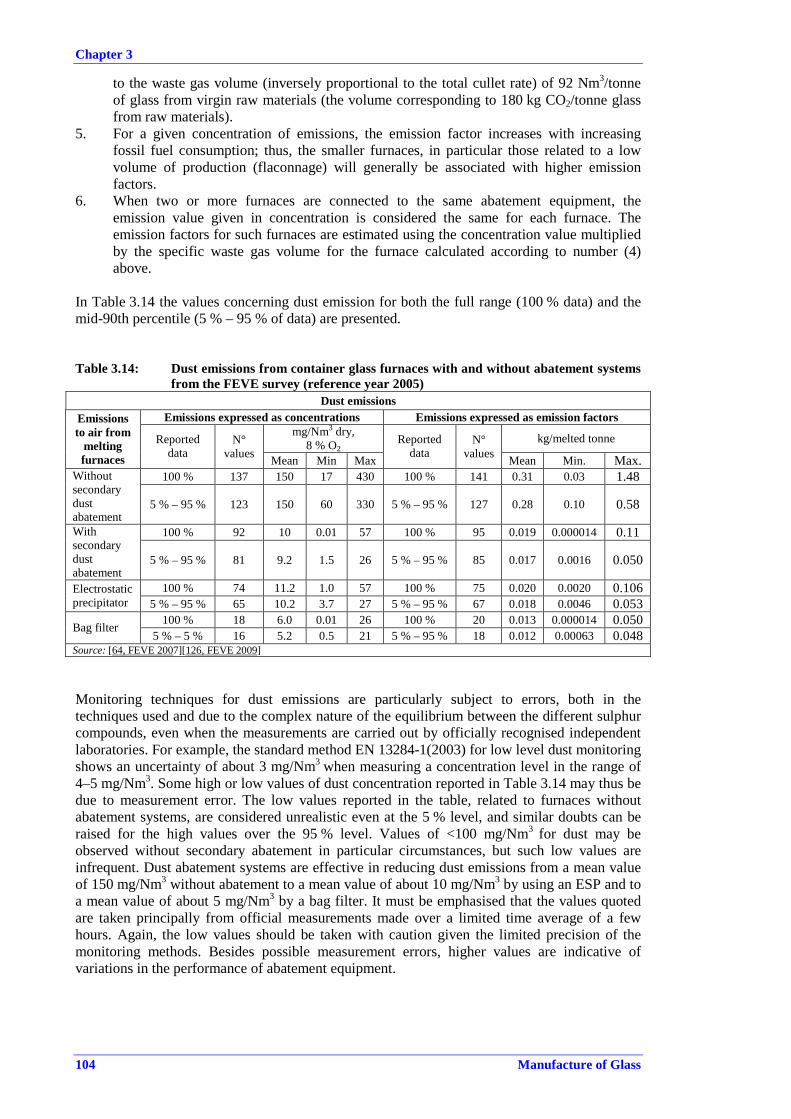
Chapter 3
104 Manufacture of Glass
to the waste gas volume (inversely proportional to the total cullet rate) of 92 Nm3/tonne of glass from virgin raw materials (the volume corresponding to 180 kg CO2/tonne glass from raw materials).
5. For a given concentration of emissions, the emission factor increases with increasing fossil fuel consumption; thus, the smaller furnaces, in particular those related to a low volume of production (flaconnage) will generally be associated with higher emission factors.
6. When two or more furnaces are connected to the same abatement equipment, the emission value given in concentration is considered the same for each furnace. The emission factors for such furnaces are estimated using the concentration value multiplied by the specific waste gas volume for the furnace calculated according to number (4) above.
In Table 3.14 the values concerning dust emission for both the full range (100 % data) and the mid-90th percentile (5 % – 95 % of data) are presented.
Table 3.14: Dust emissions from container glass furnaces with and without abatement systems from the FEVE survey (reference year 2005)
Dust emissions Emissions expressed as concentrations Emissions expressed as emission factors
mg/Nm3 dry, 8 % O2
kg/melted tonne
Emissions to air from
melting furnaces
Reported data
N°values Mean Min Max
Reported data
N°values Mean Min. Max.
100 % 137 150 17 430 100 % 141 0.31 0.03 1.48 Without secondary
dust abatement
5 % – 95 % 123 150 60 330 5 % – 95 % 127 0.28 0.10 0.58
100 % 92 10 0.01 57 100 % 95 0.019 0.000014 0.11 With secondary dust abatement
5 % – 95 % 81 9.2 1.5 26 5 % – 95 % 85 0.017 0.0016 0.050
100 % 74 11.2 1.0 57 100 % 75 0.020 0.0020 0.106 Electrostatic precipitator 5 % – 95 % 65 10.2 3.7 27 5 % – 95 % 67 0.018 0.0046 0.053
100 % 18 6.0 0.01 26 100 % 20 0.013 0.000014 0.050 Bag filter 5 % – 5 % 16 5.2 0.5 21 5 % – 95 % 18 0.012 0.00063 0.048
Source: [64, FEVE 2007][126, FEVE 2009]
Monitoring techniques for dust emissions are particularly subject to errors, both in the techniques used and due to the complex nature of the equilibrium between the different sulphur compounds, even when the measurements are carried out by officially recognised independent laboratories. For example, the standard method EN 13284-1(2003) for low level dust monitoring shows an uncertainty of about 3 mg/Nm3 when measuring a concentration level in the range of 4–5 mg/Nm3. Some high or low values of dust concentration reported in Table 3.14 may thus be due to measurement error. The low values reported in the table, related to furnaces without abatement systems, are considered unrealistic even at the 5 % level, and similar doubts can be raised for the high values over the 95 % level. Values of <100 mg/Nm3 for dust may be observed without secondary abatement in particular circumstances, but such low values are infrequent. Dust abatement systems are effective in reducing dust emissions from a mean value of 150 mg/Nm3 without abatement to a mean value of about 10 mg/Nm3 by using an ESP and to a mean value of about 5 mg/Nm3 by a bag filter. It must be emphasised that the values quoted are taken principally from official measurements made over a limited time average of a few hours. Again, the low values should be taken with caution given the limited precision of the monitoring methods. Besides possible measurement errors, higher values are indicative of variations in the performance of abatement equipment.

Chapter 3
Manufacture of Glass 105
The factors which may influence the efficiency of secondary abatement systems (ESP and bag filters) are discussed in Section 4.4.1.2 and Section 4.4.1.3. In Table 3.15 the values concerning sulphur oxides emissions (SOX) for both the full range (100 % data) and the mid-90th percentile (5 % – 95 % of data) are presented. SOX emissions from container glass melting follow sulphur mass balance considerations, with inputs coming from the sulphur content of fuels (in particular heavy fuel oil), sulphates added to the batch formulation and, depending on the glass type, sulphur entering the furnace with the external cullet. Only part of the sulphur added to the batch formulation (raw materials plus cullet) is incorporated into the glass products; the excess will be released with the waste gases or deposited as filter dust. Emission data in Table 3.15 are thus divided into gas-fired, fuel oil-fired and mixed fuel-fired furnaces, bearing in mind that the fuel choice is considered outside the scope of BAT selection, being dependent upon the different strategies and energy policies of the Member States. For natural gas-firing furnaces, the sulphur content of the fuel is negligible and SOX emissions effectively represent the contribution from the batch formulation (raw materials plus external cullet), with a very wide range of emission values, as can be seen in Table 3.15. Although, both the minimum and maximum values reported over the 100 % range (3 and 2100 mg/Nm3,respectively) appear clearly erroneous with respect to realistic mass balance considerations. The batch component of the balance is seen to vary significantly even over the mid-90th percentile range, from concentrations of about 100 mg/Nm3 to 1000 mg/Nm3 with a mean value of about 500 mg/Nm3.
Data from the FEVE survey indicate that filter dust is fully (or more than 90 %) recycled into the glass melt for 80 % of furnaces equipped with secondary dust abatement systems; while, for the remaining 20 %, dust recycling is not applied at all. Filter dust recycling may be restricted by limits imposed by the chemical compatibility of the dust with the required glass quality and possible handling difficulties due to the physical nature of dust. From data presented in Table 3.15, it may also be observed that where secondary abatement for dust is installed, the minimum emission values appear to increase (with a corresponding effect on the mean values), even for the mid-90th percentile range. This trend may be attributed to higher starting SOX emission levels for the installations with a scrubbing system and, partly, to the effect of recycling filter dust. An opposite effect is apparently observed with the data reported for fuel oil-fired furnaces, although in this case, the effect of the differences in the sulphur content of fuel oil will also affect the resultant values. This possible masking effect is more clearly seen in the values for mixed fuel-firing furnaces, where the lower values for furnaces with secondary dust abatement also correspond to furnaces with a higher proportion of natural gas in the fuel mix (for the data submitted, the mean proportion of natural gas for furnaces equipped with dust abatement is equivalent to 79 % versus 53 % for the furnaces without dust abatement techniques). On a statistical basis, fuel oil-firing is observed to contribute on average approximately 800 mg/Nm3 to mean emission values per furnace, with respect to natural gas-firing, which would correspond to an average sulphur content of fuel oil of less than 1 % for the furnaces in the FEVE survey.
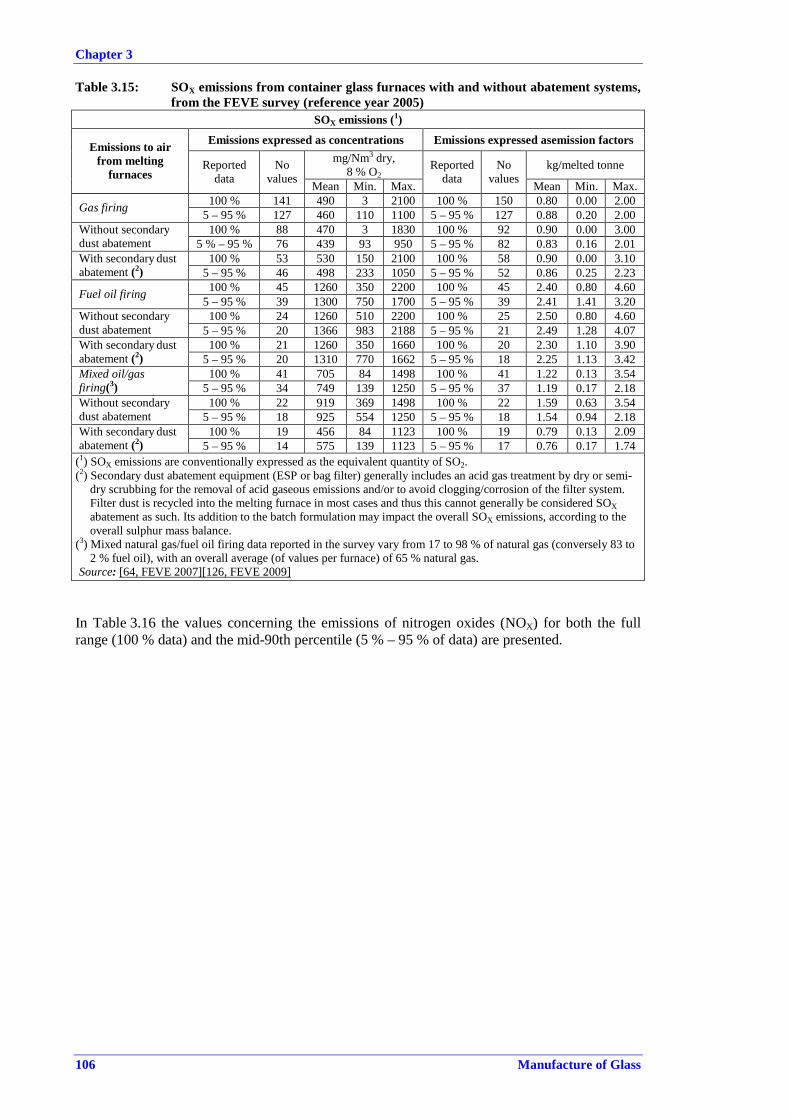
Chapter 3
106 Manufacture of Glass
Table 3.15: SOX emissions from container glass furnaces with and without abatement systems, from the FEVE survey (reference year 2005)
SOX emissions (1)
Emissions expressed as concentrations Emissions expressed asemission factors mg/Nm3 dry,
8 % O2kg/melted tonne
Emissions to air from melting
furnaces Reported
data No
values Mean Min. Max.
Reported data
No values Mean Min. Max.
100 % 141 490 3 2100 100 % 150 0.80 0.00 2.00 Gas firing 5 – 95 % 127 460 110 1100 5 – 95 % 127 0.88 0.20 2.00 100 % 88 470 3 1830 100 % 92 0.90 0.00 3.00 Without secondary
dust abatement 5 % – 95 % 76 439 93 950 5 – 95 % 82 0.83 0.16 2.01 100 % 53 530 150 2100 100 % 58 0.90 0.00 3.10 With secondary dust
abatement (2) 5 – 95 % 46 498 233 1050 5 – 95 % 52 0.86 0.25 2.23 100 % 45 1260 350 2200 100 % 45 2.40 0.80 4.60 Fuel oil firing 5 – 95 % 39 1300 750 1700 5 – 95 % 39 2.41 1.41 3.20 100 % 24 1260 510 2200 100 % 25 2.50 0.80 4.60 Without secondary
dust abatement 5 – 95 % 20 1366 983 2188 5 – 95 % 21 2.49 1.28 4.07 100 % 21 1260 350 1660 100 % 20 2.30 1.10 3.90 With secondary dust
abatement (2) 5 – 95 % 20 1310 770 1662 5 – 95 % 18 2.25 1.13 3.42 100 % 41 705 84 1498 100 % 41 1.22 0.13 3.54 Mixed oil/gas
firing(3) 5 – 95 % 34 749 139 1250 5 – 95 % 37 1.19 0.17 2.18 100 % 22 919 369 1498 100 % 22 1.59 0.63 3.54 Without secondary
dust abatement 5 – 95 % 18 925 554 1250 5 – 95 % 18 1.54 0.94 2.18 100 % 19 456 84 1123 100 % 19 0.79 0.13 2.09 With secondary dust
abatement (2) 5 – 95 % 14 575 139 1123 5 – 95 % 17 0.76 0.17 1.74 (1) SOX emissions are conventionally expressed as the equivalent quantity of SO2.(2) Secondary dust abatement equipment (ESP or bag filter) generally includes an acid gas treatment by dry or semi-
dry scrubbing for the removal of acid gaseous emissions and/or to avoid clogging/corrosion of the filter system. Filter dust is recycled into the melting furnace in most cases and thus this cannot generally be considered SOXabatement as such. Its addition to the batch formulation may impact the overall SOX emissions, according to the overall sulphur mass balance.
(3) Mixed natural gas/fuel oil firing data reported in the survey vary from 17 to 98 % of natural gas (conversely 83 to 2 % fuel oil), with an overall average (of values per furnace) of 65 % natural gas.
Source: [64, FEVE 2007][126, FEVE 2009]
In Table 3.16 the values concerning the emissions of nitrogen oxides (NOX) for both the full range (100 % data) and the mid-90th percentile (5 % – 95 % of data) are presented.

Chapter 3
Manufacture of Glass 107
Table 3.16: NOX emissions from container glass furnaces for different fuel types and furnace techniques, from the FEVE survey (reference year 2005)
NOX emissions(1)Emissions expressed as
concentrations Emissions expressed as
emission factors mg/Nm3 dry,
8 % O2kg/melted tonne
Emissions to air from melting furnaces Reported
data N°
values Mean Min. Max.
Reported data
N°values Mean Min. Max.
Unabated (without specific primary measures) Fuel Type Furnace type
100 % 144 1211 384 3355 100 % 144 2.30 0.60 9.30All All 5 – 95 % 127 1171 685 2100 5 – 95 % 128 2.15 1.05 4.40100 % 99 1259 384 3355 100 % 99 2.46 0.57 9.32Gas-fired All
5 – 95 % 88 1222 700 2300 5 – 95 % 88 2.32 1.13 4.57100 % 25 1170 840 1990 100 % 25 2.00 1.20 3.20Fuel oil-fired All
5 – 95 % 20 1139 850 1538 5 – 95 % 21 1.94 1.31 3.08100 % 20 1025 547 2324 100 % 20 1.87 0.91 5.13Mixed gas/oil
fired All 5 – 95 % 18 980 588 1687 5 – 95 % 18 1.75 0.93 2.97100 % 83 1165 384 3355 100 % 83 2.2 0.57 9.3 All End-fired
5 – 95 % 73 1121 671 1993 5 – 95 % 73 2.0 0.96 4.0 100 % 41 1391 650 2850 100 % 41 2.5 1.10 5.6 All Cross-fired
5 – 95 % 37 1356 814 2324 5 – 95 % 37 2.4 1.43 4.5 100 % 20 1037 725 1725 100 % 20 2.5 1.23 8.3 All Recuperative 5 – 95 % 18 1016 785 1699 5 – 95 % 18 2.3 1.50 4.0
Primary measures (not including oxy-fuel combustion) 100 % 86 915 424 2112 100 % 86 1.83 0.65 5.57All All
5 – 95 % 76 884 521 1680 5 – 95 % 76 1.72 0.83 3.85100 % 48 1000 420 2100 100 % 50 1.90 0.30 5.00Gas-fired All
5 – 95 % 42 977 605 1725 5 – 95 % 44 1.86 0.72 3.88100 % 19 750 430 1730 100 % 19 1.70 0.30 5.60Fuel oil-fired All
5 – 95 % 17 710 521 941 5 – 95 % 17 1.53 0.65 3.38100 % 19 852 427 1655 100 % 19 1.49 0.80 3.76Mixed gas/oil
fired All 5 – 95 % 17 830 543 1600 5 – 95 % 17 1.39 0.83 3.02100 % 65 925 424 2112 100 % 65 1.8 0.65 5.6 All End-fired
5 – 95 % 58 902 543 1725 5 – 95 % 57 1.7 0.83 3.8 100 % 12 1029 643 1680 100 % 12 2.1 0.80 4.4 All Cross fired
5 – 95 % 10 1003 714 1600 5 – 95 % 10 1.9 0.99 3.7 100 % 9 687 427 1256 100 % 9 1.7 0.95 3.4 All Recuperative
5 – 95 % 7 643 428 925 5 – 95 % 7 1.6 1.06 2.2 Secondary abatement (SCR) 100 % 4 460 460 460 100 % 4 0.81 0.69 0.95
Oxy-fuel combustion 100 % 8 0.54 0.23 0.88(1) NOX emissions are conventionally expressed as the equivalent quantity of NO2.Source: [64, FEVE 2007][126, FEVE 2009]
Primary measures for NOX emissions reduction (e.g. Low-NOX burners, staged combustion, flue-gas recirculation) were reported for about 35 % of the furnaces in the data collection. An overall, apparent emission reduction on the mean value (all furnace and fuel types) from about 1200 mg/Nm3 to ∼900 mg/Nm3 is observed between values reported with and without the application of primary measures. However, the wide range of reported values in both cases is indicative of the variety of situations encountered in practice. Some furnaces in the 100 % data set, without primary measures, are thus reported with low values of less than 600 mg/Nm3 or 1.0 kg/tonne melted glass, which can be attributed to specific, favourable operating conditions and furnace configuration not necessarily representative of normal operation. The comparison of emission data for different fuel types and furnace technologies tends to confirm that fuel oil or mixed gas oil firing gives lower NOX emissions than natural gas firing

Chapter 3
108 Manufacture of Glass
and that end-fired or recuperative furnaces tend to give lower NOX emissions than cross-fired furnaces. The influencing factors which may explain these effects are described in Section 4.4.2. High values (>1500 mg/Nm3) should only be observed in special cases, e.g. where nitrates are required as a refining/oxidising agent, or for certain existing furnace configurations where high local flame temperatures and/or uncontrolled air leakage into the flames are difficult to avoid. Secondary abatement of NOx (by SCR) was only installed in one EU container plant (four furnaces connected to a common SCR system) in the reference year (2005). Data from the eight oxy-fuel fired furnaces in the survey are presented only as specific mass flows due to the impossibility to compare concentrations on a common basis (8 % O2) with those of air-fuel fired furnaces and, as anticipated, values of less than 1 kg/tonne of melted glass are reported. In Table 3.17 the values concerning emissions of HCl and HF for both the full range (100 % data) and the mid-90th percentile (5 % – 95 % of data) are presented.
Table 3.17: HCl and HF emissions from container glass furnaces with and without abatement systems, from the FEVE survey (reference year 2005)
HCl and HF emissions
Emissions expressed as concentrations Emissions expressed as emission factors
mg/Nm3 dry, 8 % O2
kg/melted tonne Emissions to air from
melting furnaces Reported data
N°values Mean Min. Max.
Reporteddata
N°values Mean Min. Max.
HCl 100 % 206 17 1.0 107 100 % 215 0.03 0 0.17 All values
5 – 95 % 185 16 1.1 37 5 – 95 % 193 0.028 0.0023 0.071100 % 116 17 1.0 48 100 % 121 0.030 0.0007 0.116Without secondary dust
abatement 5 – 95 % 99 17 1.4 39 5 – 95 % 109 0.029 0.0018 0.079100 % 90 17 1.0 107 100 % 94 0.029 0.0018 0.170With secondary dust
abatement (1) 5 – 95 % 80 16 3.7 29 5 – 95 % 84 0.027 0.0047 0.059HF
100 % 204 3.0 0.00 74 100 % 211 0.0072 0.0002 0.267All values 5 – 95 % 178 2.5 0.39 11 5 – 95 % 189 0.0046 0.00068 0.021
100 % 116 5.0 0.00 74 100 % 121 0.0103 0.00040 0.267Without secondary dust abatement 5 – 95 % 105 3.7 0.41 14 5 – 95 % 109 0.0066 0.00074 0.022
100 % 88 2.0 0.00 13 100 % 92 0.0029 0.00004 0.028With secondary dust abatement (1) 5 – 95 % 78 1.4 0.20 4 5 – 95 % 82 0.0024 0.00045 0.007(1) Secondary dust abatement equipment (ESP or bag filter) generally includes an acid gas treatment by dry or semi-dry
scrubbing for the removal of acid gaseous emissions and/or to avoid clogging/corrosion of the filter system. The absorption of HCl and HF depends on the type of reagent used. Filter dust is recycled into the melting furnace in most cases and thus this cannot generally be considered HCl/HF abatement as such.
Source: [64, FEVE 2007][126, FEVE 2009]
For HCl, low values (<10 mg/Nm3) may be observed where low chloride sodium carbonate (from natural deposits) and high cullet levels are employed. Note that in the case of high local recycling rates associated with the recycling of filter dust, gaseous chloride will progressively build up in the raw waste gas, particularly when flue-gas containing HCl from ‘hot-end’ surface treatment is treated together with the furnace flue-gases in the same system. In this case, the secondary dust abatement (ESP or bag filter with upstream waste gas treatment stage using an alkaline reagent) is not necessarily associated with the lowest emission values, particularly as the conditions used for the removal of SOx may not be optimal for the abatement of HCl with the same absorbing reagent. The removal efficiency of alkaline reagents towards the different gaseous pollutants (SOx, HCl, HF) is discussed in Section 4.4.3.3.

Chapter 3
Manufacture of Glass 109
Fluoride is an incidental impurity in certain natural raw materials. It may be present as an impurity in recycled glass (e.g. from opal glass which contains fluoride that, although excluded by cullet specifications, may be present in small quantities). No generalities can be made about low values although these may be associated with both low levels of recycled glass and/or secondary abatement. As for HCl, secondary abatement systems consisting of ESPs or bag filters with an upstream waste gas treatment stage using an alkaline reagent and filter dust recycling, depending on the absorbing agent used, could be associated with low or high values of HF, which correspond to particularly favourable or unfavourable cases, depending on several parameters (e.g. type of reagent, operating conditions, input level, etc.). In Table 3.18 the values concerning the emissions of metals for both the full range (100 % data) and the mid-90th percentile (5 % – 95 % of data) with and without abatement systems are presented. Low values for metals (<1 mg/Nm3) may be observed on unabated waste gases in favourable cases, particularly low cullet levels (for lead impurities), fuel oil-firing with low vanadium or gas firing and in the absence of selenium in raw materials (which is the case for all except certain white flint glasses). High values (>5 mg/Nm3) are generally associated with high cullet rates (lead), fuel firing or white flint glass production (selenium).
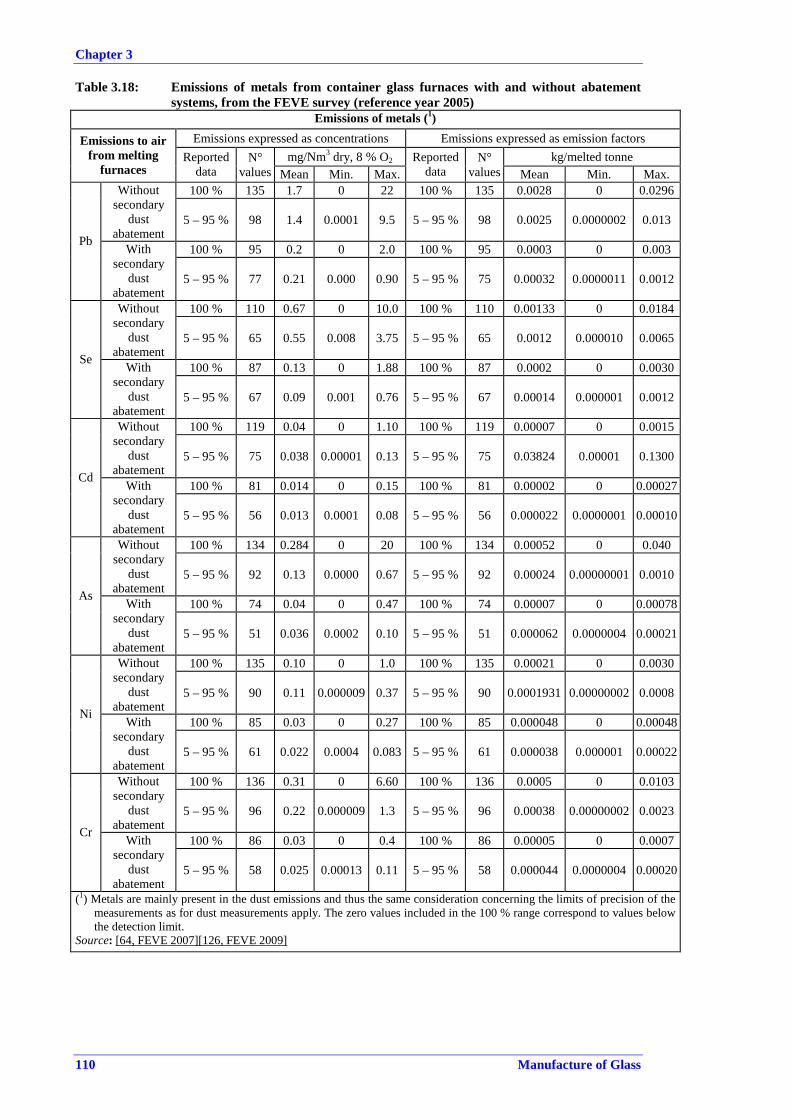
Chapter 3
110 Manufacture of Glass
Table 3.18: Emissions of metals from container glass furnaces with and without abatement systems, from the FEVE survey (reference year 2005)
Emissions of metals (1)Emissions expressed as concentrations Emissions expressed as emission factors
mg/Nm3 dry, 8 % O2 kg/melted tonne Emissions to air
from melting furnaces
Reported data
N°values Mean Min. Max.
Reported data
N°values Mean Min. Max.
100 % 135 1.7 0 22 100 % 135 0.0028 0 0.0296Without secondary
dust abatement
5 – 95 % 98 1.4 0.0001 9.5 5 – 95 % 98 0.0025 0.0000002 0.013
100 % 95 0.2 0 2.0 100 % 95 0.0003 0 0.003 Pb With
secondary dust
abatement 5 – 95 % 77 0.21 0.000 0.90 5 – 95 % 75 0.00032 0.0000011 0.0012
100 % 110 0.67 0 10.0 100 % 110 0.00133 0 0.0184Without secondary
dust abatement
5 – 95 % 65 0.55 0.008 3.75 5 – 95 % 65 0.0012 0.000010 0.0065
100 % 87 0.13 0 1.88 100 % 87 0.0002 0 0.0030Se With
secondary dust
abatement 5 – 95 % 67 0.09 0.001 0.76 5 – 95 % 67 0.00014 0.000001 0.0012
100 % 119 0.04 0 1.10 100 % 119 0.00007 0 0.0015Without secondary
dust abatement
5 – 95 % 75 0.038 0.00001 0.13 5 – 95 % 75 0.03824 0.00001 0.1300
100 % 81 0.014 0 0.15 100 % 81 0.00002 0 0.00027Cd
With secondary
dust abatement
5 – 95 % 56 0.013 0.0001 0.08 5 – 95 % 56 0.000022 0.0000001 0.00010
100 % 134 0.284 0 20 100 % 134 0.00052 0 0.040 Without secondary
dust abatement
5 – 95 % 92 0.13 0.0000 0.67 5 – 95 % 92 0.00024 0.00000001 0.0010
100 % 74 0.04 0 0.47 100 % 74 0.00007 0 0.00078As With
secondary dust
abatement 5 – 95 % 51 0.036 0.0002 0.10 5 – 95 % 51 0.000062 0.0000004 0.00021
100 % 135 0.10 0 1.0 100 % 135 0.00021 0 0.0030Without secondary
dust abatement
5 – 95 % 90 0.11 0.000009 0.37 5 – 95 % 90 0.0001931 0.00000002 0.0008
100 % 85 0.03 0 0.27 100 % 85 0.000048 0 0.00048Ni With
secondary dust
abatement 5 – 95 % 61 0.022 0.0004 0.083 5 – 95 % 61 0.000038 0.000001 0.00022
100 % 136 0.31 0 6.60 100 % 136 0.0005 0 0.0103Without secondary
dust abatement
5 – 95 % 96 0.22 0.000009 1.3 5 – 95 % 96 0.00038 0.00000002 0.0023
100 % 86 0.03 0 0.4 100 % 86 0.00005 0 0.0007Cr With
secondary dust
abatement 5 – 95 % 58 0.025 0.00013 0.11 5 – 95 % 58 0.000044 0.0000004 0.00020
(1) Metals are mainly present in the dust emissions and thus the same consideration concerning the limits of precision of the measurements as for dust measurements apply. The zero values included in the 100 % range correspond to values below the detection limit.
Source: [64, FEVE 2007][126, FEVE 2009]

Chapter 3
Manufacture of Glass 111
3.3.2.3 Downstream activities The application of hot surface coatings and cold surface treatments can give rise to emissions of fumes and vapours, principally HCl and tin compounds. Hot surface treatment of glass containers (outer surface) is typically done with tin tetrachloride, organic tin (monobutyltin trichloride) or titanium tetrachloride, aimed at creating a very thin tin oxide or titanium oxide layer on the surface of the glass. In special cases, the treatment of the inner surface of glass containers is performed, in particular for the production of containers destined to come into contact with certain pharmaceutical products for which a treatment with SO3 is applied in order to effectively eliminate the leachable sodium/calcium ions from the glass surface. In other specific cases, 1.1-difluoroethane is injected into the bottles/flacons immediately after forming, in order to create a modified inner contact surface acting as a barrier to ionic migration. This has marginally been employed to avoid the appearance of bloom (on the inside surface) on certain clear glass containers over long storage times in high-humidity climates. The amount of material involved is very low. The levels of emissions will vary between processes and will depend on many factors, in particular the amount of air used in the suction hoods, generally employed to capture the excess vapours. Typical emission values associated with the use of hot surface coating activities with tin chloride, without abatement, are generally in the range reported in Table 3.19.
Table 3.19: Typical unabated emission values from surface coating activities with tin chloride for container glass
Typical emission concentrations Typical emission factors Pollutant mg/Nm3 g/tonne melted glass Gaseous chlorides, as HCl 15 – 300 3 – 30 Total particulate matter 5 – 50 1 – 70 Tin, as Sn (gaseous + particulate) 1 – 30 0.2 – 0.8 Source: [84, Italy Report 2007]
Note that in a significant number of installations, emissions from the hot-end treatment hoods are treated in the same abatement system as the furnace waste gas. In other cases, where the emissions from hot-end surface coating are treated separately, the typical concentration levels are <10 mg/Nm3 for particulate matter, <5 mg/Nm3 for Sn and <30 mg/Nm3 for HCl. Typical emission values from treatment activities of the inner surface of glass containers with SO2/SO3, before undergoing a specific flue-gas treatment (normally, by wet scrubbing), are normally in the range reported below, in Table 3.20.
Table 3.20: Typical unabated emission values from surface treatment of container glass with SO3
Typical emission concentrations Typical emission factors Pollutant mg/Nm3 g/tonne melted glass
Sulphur oxides, as SO2 200 – 900 100 – 600 Source: [84, Italy Report 2007]
SOX concentration levels after treatment are normally in the range of <100 – 200 mg/Nm3
expressed as SO2.

Chapter 3
112 Manufacture of Glass
Mass emissions from downstream activities are, in general, quite low, due to the low amounts of substances used, and concentrations will depend heavily on the amount of extraction air applied. Methods for controlling these emissions are discussed in Section 4.5.1.
3.3.2.4 Diffuse/fugitive emissions The main sources of diffuse/fugitive emissions specific to the container glass sector concern the doghouse area of the furnace, forehearth channels, forming area and the surface treatment operations. A specific issue of the doghouse area is related to carryover of batch composition (dust emissions) and the decomposition of organic materials that may be present in the cullet. Combustion gases and evaporation products may be released from the forehearth channels. In the forming area, the forming machines are highly mechanised which can give rise to mists of lubricating oils. Combustion gases may arise from the thermal treatment of the moulds and from the annealing lehr. Cold-end surface treatments may produce organic mists, i.e. polyethylene and oleic acid. All of these specific issues are normally managed by health and safety regulations at work; they are controlled according to workplace exposure levels and do not represent significant emissions to air.
3.3.3 Emissions to water [19, CPIV 1998]
As discussed earlier, the main uses of water in this sector are cleaning, cooling water systems, hot glass rejects cooling and batch humidification. The aqueous emissions are limited to the cooling water system purges, cleaning waters and surface water run-off. The cleaning waters do not present any particular issues that would not be common with any industrial facility, i.e. inert solids and potentially oil. Cooling system purges will contain dissolved salts and water treatment chemicals. Surface water quality will depend on the degree of drainage segregation and site cleanliness. Only the circuit for cooling and fragmenting hot glass rejects is particular to the sector. This recycled water may contain fine particles of glass from fragmentation and from the action of mechanical scraper systems used to dredge the glass from the water troughs. The chutes bringing the glass to the collection system may also bring small quantities of oil from the machines and oil or soluble oil/water mixtures used in the shear and delivery mechanisms. The circuit thus generally includes a solids and oil separator, which also serves to give suitable thermal inertia to the system during mould changing or incidents on forming machines, when large quantities of glass must be cooled. Separated glass solids are usually recycled in the raw materials. Open circuit cooling is generally used to allow for more rare, severe incidents when large quantities of hot glass must be cooled (a major furnace leakage or other incident causing the interruption of forming operations). Excluding domestic waste water, discharges generally contain only glass solids, some oil contamination, and cooling water system treatment chemicals. Simple pollution control techniques such as settlement, screening, use of oil separators, and neutralising can be found within the sector.
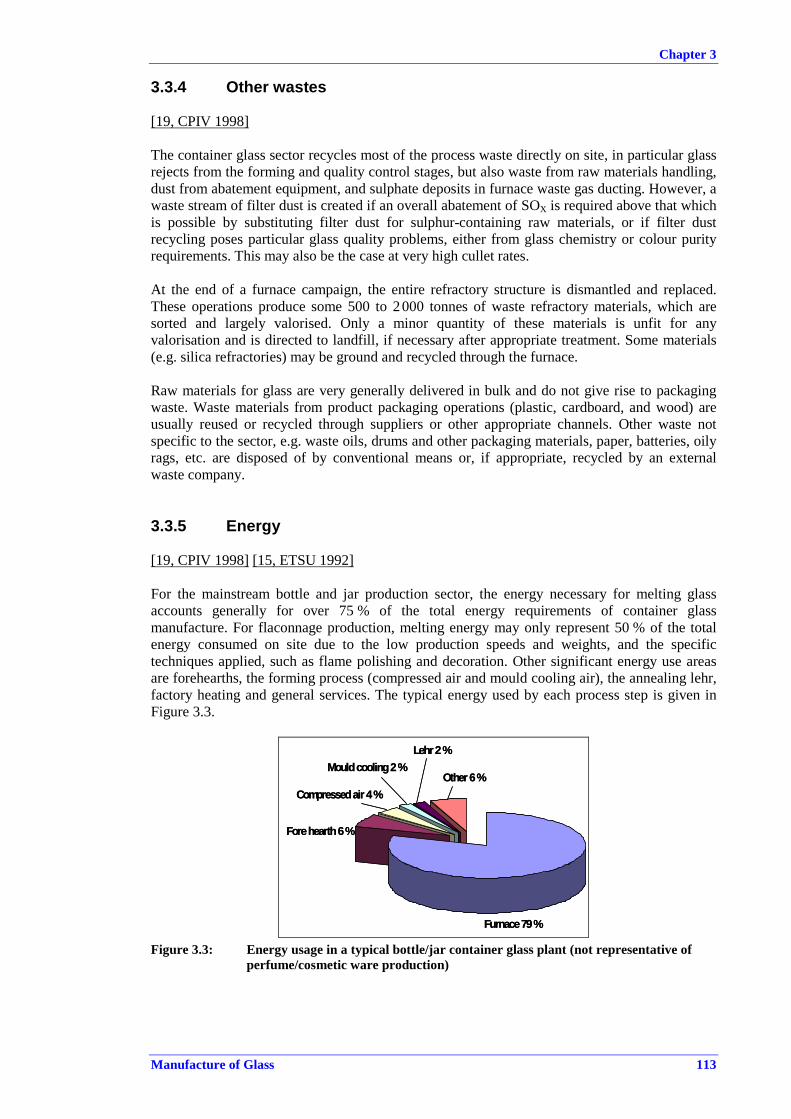
Chapter 3
Manufacture of Glass 113
3.3.4 Other wastes [19, CPIV 1998]
The container glass sector recycles most of the process waste directly on site, in particular glass rejects from the forming and quality control stages, but also waste from raw materials handling, dust from abatement equipment, and sulphate deposits in furnace waste gas ducting. However, a waste stream of filter dust is created if an overall abatement of SOX is required above that which is possible by substituting filter dust for sulphur-containing raw materials, or if filter dust recycling poses particular glass quality problems, either from glass chemistry or colour purity requirements. This may also be the case at very high cullet rates. At the end of a furnace campaign, the entire refractory structure is dismantled and replaced. These operations produce some 500 to 2 000 tonnes of waste refractory materials, which are sorted and largely valorised. Only a minor quantity of these materials is unfit for any valorisation and is directed to landfill, if necessary after appropriate treatment. Some materials (e.g. silica refractories) may be ground and recycled through the furnace. Raw materials for glass are very generally delivered in bulk and do not give rise to packaging waste. Waste materials from product packaging operations (plastic, cardboard, and wood) are usually reused or recycled through suppliers or other appropriate channels. Other waste not specific to the sector, e.g. waste oils, drums and other packaging materials, paper, batteries, oily rags, etc. are disposed of by conventional means or, if appropriate, recycled by an external waste company.
3.3.5 Energy [19, CPIV 1998] [15, ETSU 1992]
For the mainstream bottle and jar production sector, the energy necessary for melting glass accounts generally for over 75 % of the total energy requirements of container glass manufacture. For flaconnage production, melting energy may only represent 50 % of the total energy consumed on site due to the low production speeds and weights, and the specific techniques applied, such as flame polishing and decoration. Other significant energy use areas are forehearths, the forming process (compressed air and mould cooling air), the annealing lehr, factory heating and general services. The typical energy used by each process step is given in Figure 3.3.
Furnace 79 %
Lehr 2 %Mould cooling 2 %
Compressed air 4 %
Fore hearth 6 %
Other 6 %
Furnace 79 %
Lehr 2 %Mould cooling 2 %
Compressed air 4 %
Fore hearth 6 %
Other 6 %
Figure 3.3: Energy usage in a typical bottle/jar container glass plant (not representative of perfume/cosmetic ware production)
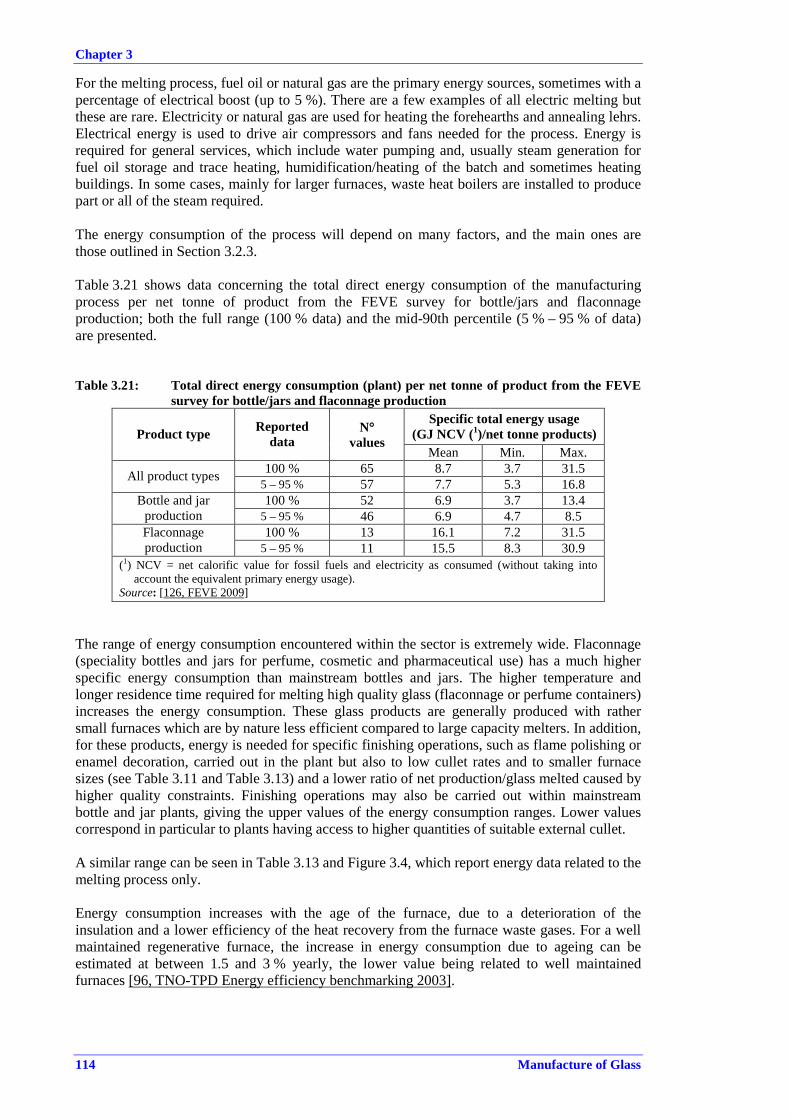
Chapter 3
114 Manufacture of Glass
For the melting process, fuel oil or natural gas are the primary energy sources, sometimes with a percentage of electrical boost (up to 5 %). There are a few examples of all electric melting but these are rare. Electricity or natural gas are used for heating the forehearths and annealing lehrs. Electrical energy is used to drive air compressors and fans needed for the process. Energy is required for general services, which include water pumping and, usually steam generation for fuel oil storage and trace heating, humidification/heating of the batch and sometimes heating buildings. In some cases, mainly for larger furnaces, waste heat boilers are installed to produce part or all of the steam required. The energy consumption of the process will depend on many factors, and the main ones are those outlined in Section 3.2.3. Table 3.21 shows data concerning the total direct energy consumption of the manufacturing process per net tonne of product from the FEVE survey for bottle/jars and flaconnage production; both the full range (100 % data) and the mid-90th percentile (5 % – 95 % of data) are presented.
Table 3.21: Total direct energy consumption (plant) per net tonne of product from the FEVE survey for bottle/jars and flaconnage production
Specific total energy usage (GJ NCV (1)/net tonne products) Product type Reported
data N°
values Mean Min. Max.
100 % 65 8.7 3.7 31.5 All product types 5 – 95 % 57 7.7 5.3 16.8 100 % 52 6.9 3.7 13.4 Bottle and jar
production 5 – 95 % 46 6.9 4.7 8.5 100 % 13 16.1 7.2 31.5 Flaconnage
production 5 – 95 % 11 15.5 8.3 30.9 (1) NCV = net calorific value for fossil fuels and electricity as consumed (without taking into
account the equivalent primary energy usage). Source: [126, FEVE 2009]
The range of energy consumption encountered within the sector is extremely wide. Flaconnage (speciality bottles and jars for perfume, cosmetic and pharmaceutical use) has a much higher specific energy consumption than mainstream bottles and jars. The higher temperature and longer residence time required for melting high quality glass (flaconnage or perfume containers) increases the energy consumption. These glass products are generally produced with rather small furnaces which are by nature less efficient compared to large capacity melters. In addition, for these products, energy is needed for specific finishing operations, such as flame polishing or enamel decoration, carried out in the plant but also to low cullet rates and to smaller furnace sizes (see Table 3.11 and Table 3.13) and a lower ratio of net production/glass melted caused by higher quality constraints. Finishing operations may also be carried out within mainstream bottle and jar plants, giving the upper values of the energy consumption ranges. Lower values correspond in particular to plants having access to higher quantities of suitable external cullet. A similar range can be seen in Table 3.13 and Figure 3.4, which report energy data related to the melting process only. Energy consumption increases with the age of the furnace, due to a deterioration of the insulation and a lower efficiency of the heat recovery from the furnace waste gases. For a well maintained regenerative furnace, the increase in energy consumption due to ageing can be estimated at between 1.5 and 3 % yearly, the lower value being related to well maintained furnaces [96, TNO-TPD Energy efficiency benchmarking 2003].

Chapter 3
Manufacture of Glass 115
Figure 3.4 shows statistical data on melting energy (GJ per tonne melted glass corrected to 50 % cullet) by furnace type and size range. This figure clearly indicates higher consumption for smaller furnaces, in particular for pull rates below 100 tonnes/day, although this effect is compounded with the product type which is usually associated with smaller furnaces, i.e. high-quality glasses for flaconnage. For a given size range, end-port furnaces appear slightly more energy efficient than cross-fired furnaces, which would correspond in particular to the slightly greater surface for structural heat losses. Data for oxy-fuel fired furnaces, including the electrical energy necessary for oxygen production, indicate an equivalent energy efficiency to that of regenerative furnaces in the larger size range. The percentage of cullet used in the batch composition has a high and systematic influence on the furnace energy consumption. To enable comparison of different furnace types under comparable conditions, their consumptions have been standardised to 50 % cullet (see the introduction to Table 3.13 for details).
Source:[64, FEVE 2007]
Figure 3.4: Mean energy consumptions in glass container furnaces expressed in GJ/tonne melted glass and standardised to 50 % cullet (2005)
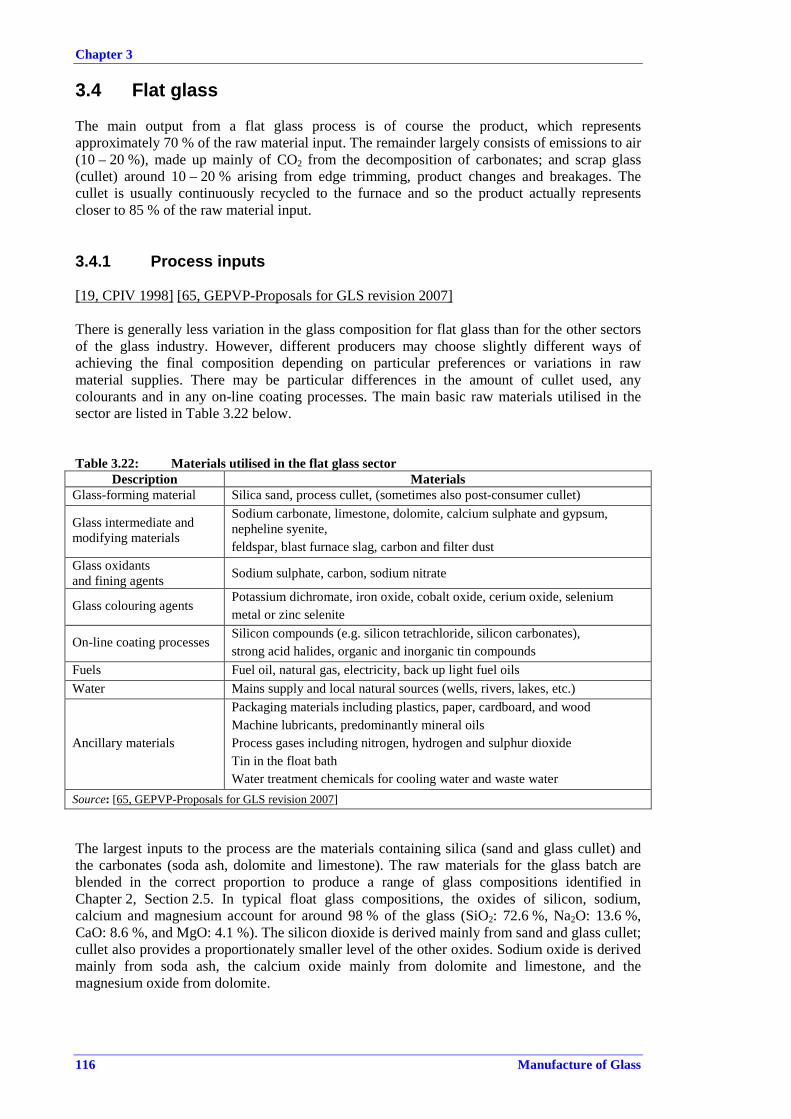
Chapter 3
116 Manufacture of Glass
3.4 Flat glass The main output from a flat glass process is of course the product, which represents approximately 70 % of the raw material input. The remainder largely consists of emissions to air (10 – 20 %), made up mainly of CO2 from the decomposition of carbonates; and scrap glass (cullet) around 10 – 20 % arising from edge trimming, product changes and breakages. The cullet is usually continuously recycled to the furnace and so the product actually represents closer to 85 % of the raw material input.
3.4.1 Process inputs [19, CPIV 1998] [65, GEPVP-Proposals for GLS revision 2007]
There is generally less variation in the glass composition for flat glass than for the other sectors of the glass industry. However, different producers may choose slightly different ways of achieving the final composition depending on particular preferences or variations in raw material supplies. There may be particular differences in the amount of cullet used, any colourants and in any on-line coating processes. The main basic raw materials utilised in the sector are listed in Table 3.22 below.
Table 3.22: Materials utilised in the flat glass sector Description Materials
Glass-forming material Silica sand, process cullet, (sometimes also post-consumer cullet)
Glass intermediate and modifying materials
Sodium carbonate, limestone, dolomite, calcium sulphate and gypsum, nepheline syenite, feldspar, blast furnace slag, carbon and filter dust
Glass oxidants and fining agents Sodium sulphate, carbon, sodium nitrate
Glass colouring agents Potassium dichromate, iron oxide, cobalt oxide, cerium oxide, selenium metal or zinc selenite
On-line coating processes Silicon compounds (e.g. silicon tetrachloride, silicon carbonates), strong acid halides, organic and inorganic tin compounds
Fuels Fuel oil, natural gas, electricity, back up light fuel oils Water Mains supply and local natural sources (wells, rivers, lakes, etc.)
Ancillary materials
Packaging materials including plastics, paper, cardboard, and wood Machine lubricants, predominantly mineral oils Process gases including nitrogen, hydrogen and sulphur dioxide Tin in the float bath Water treatment chemicals for cooling water and waste water
Source: [65, GEPVP-Proposals for GLS revision 2007]
The largest inputs to the process are the materials containing silica (sand and glass cullet) and the carbonates (soda ash, dolomite and limestone). The raw materials for the glass batch are blended in the correct proportion to produce a range of glass compositions identified in Chapter 2, Section 2.5. In typical float glass compositions, the oxides of silicon, sodium, calcium and magnesium account for around 98 % of the glass (SiO2: 72.6 %, Na2O: 13.6 %, CaO: 8.6 %, and MgO: 4.1 %). The silicon dioxide is derived mainly from sand and glass cullet; cullet also provides a proportionately smaller level of the other oxides. Sodium oxide is derived mainly from soda ash, the calcium oxide mainly from dolomite and limestone, and the magnesium oxide from dolomite.

Chapter 3
Manufacture of Glass 117
In all but exceptional cases, flat glass plants recycle all internal cullet directly to the furnace. Flat glass is generally processed into other products for the building and automotive industries and the cullet coming from this further transformation is also recycled in many cases. The amount of recycled cullet is generally limited by the availability of cullet of the correct quality and chemical compatibility. The total cullet introduced in the furnace is typically around 20 % but can range from 10 to 40 % for a float furnace, and to over 80 % for other types of flat glass. Increasingly, waste glass from fabrication processors is reused or recycled to flat glass production units, but slightly contaminated waste can be used by glass container manufacturers or manufacturers of other types of glass products. Probably 95 % of waste glass from processors is recycled one way or another. On-line coating processes are very specialised and case specific. Table 3.22 lists some of the typical raw materials used in these processes. In common with other parts of the glass industry, the main uses of water are cooling, cleaning and batch humidification. Flat glass is mostly produced in a continuous ribbon (float glass), emerging from the annealing lehr at temperatures of over 200 °C. Most of the water consumed in the factory is used for cooling/washing this hot ribbon, and is not contaminated although it may contain some Na2SO4. Actual water consumption and water vapour emissions may vary according to local conditions (e.g. ambient temperature and the hardness of water input). Flat glass furnaces are almost exclusively fired on fuel oil or natural gas, in some cases with an electrical boost of up to 10 % of the energy input. Oxy-fuel boosting can also be used. There are some small-scale electrical furnaces for specialist applications, and there are three oxy-fuel fired furnaces in the US. At the end of 2008, an oxy-fuel fired furnace for the production of float glass started operating in France. The application of oxy-fuel combustion to the flat glass manufacturing sector does not present any significant technical obstacles. The potential drawbacks consist of high costs for specialist refractory design and the cost of oxygen directly related to the price of electricity. At the time of writing (2010), these are the main factors that limit the application of oxy-fuel technology to the flat glass manufacturing sector.
3.4.2 Emissions to air [19, CPIV 1998] [65, GEPVP-Proposals for GLS revision 2007]
3.4.2.1 Raw materials In most modern flat glass processes, silos and mixing vessels are fitted with filter systems which reduce dust emissions to below 5 mg/Nm3. Mass emissions from both filtered and unfiltered systems will clearly depend on the number of transfers and the amount of material handled.
3.4.2.2 Melting In the flat glass sector, the greatest potential environmental emissions are emissions to air from the melting activities. The substances emitted and the associated sources are identified in Section 3.2.2.1. Almost all of the furnaces in this sector are fossil-fuel fired (both natural gas and fuel oil), cross-fired regenerative furnaces. The overview of the furnaces equipped with systems for the control of air pollution in the flat glass sector is presented in the Table 3.23. Data presented in the table refer to a situation where the abatement of dust applied to the sector, generally coupled with a scrubbing system for acid gaseous pollutants (SOX, HF, HCl), consists of 34 electrostatic precipitators and one bag filter. The control of NOX consists of SCR applications, Fenix technology, control of combustion parameters (primary measures) and the 3R technique.

Chapter 3
118 Manufacture of Glass
Table 3.23: Overview of air pollution control (APC) systems installed in the flat glass sector in Europe
Abatement of dust, SOX, HCl, HF, metals Control/abatement of NOXYear
APC(1) Equipped APC(1) Equipped
Total numberof furnaces
EU-15 2000 16 33.3 % 8 16.7 % 48
EU-25 2005 28 51.9 % 22 40.7 % 53 EU-27 2007 35 60.3 % 28 48.3 % 58 (1) APC= air pollution control systems. Source: [65, GEPVP-Proposals for GLS revision 2007] [127, Glass for Europe 2008]
A summary of the range of emissions to air is given in Table 3.24 below. This table shows figures separately for furnaces without any abatement systems and furnaces with primary and/or secondary abatement techniques installed. The data cover both gas and oil-fired furnaces making clear float glass under normal operating conditions and show measurements from 2005. Data reported are the result of a survey from members of the European flat glass trade association (Glass for Europe) and concern the EU-25. The statistical analyses of data might have produced results that show significant differences from the previous survey carried out within members of EU-15 for the elaboration of the first version of the BREF. Note that sampling and measurement techniques used for the collection of data are not uniform and when standardised methods are used, the uncertainty of them is not taken into account in expressing the results.
Table 3.24: Emission levels from flat glass furnaces with and without abatement systems
Substance Unabated furnaces in mg/Nm3
(kg/tonne glass melted)
Abated Furnaces primary/secondary methods in mg/Nm3
(kg/tonne glass melted)
Oxides of Nitrogen (as NO2)
1250 – 2870 (2.9 – 7.4) 495 – 1250 (1.1 – 2.9)
Oxides of sulphur (as SO2)
365 – 3295 (1.0 – 10.6) 300 – 1600 (0.5 – 4.0)
Particulate matter 80 – 250 (0.2 – 0.6) 5.0 – 30 (0.02 – 0.08)
Fluorides (HF) <1.0 – 25 (<0.002 – 0.07) <1.0 – 4.0 (<0.002 – 0.01)
Chlorides (HCl) 7.0 – 85 (0.06 – 0.22) 4.0 – 40 (<0.01 – 0.1)
Metals other than Se (Ni, V, Co, Fe, Cr) <1.0 – 5.0 (<0.001 – 0.015) <1.0 (<0.001)
Selenium (coloured glass) 30 – 80 (0.08 – 0.21) <5 (<0.015)
NB: Reference conditions are: dry, temperature 0 °C (273 K), pressure 101.3 kPa, 8 % oxygen by volume. Source: [65, GEPVP-Proposals for GLS revision 2007]
The term ‘unabated furnaces’ refers to furnaces operating normally with no specific primary or secondary pollution control technology. For unabated furnaces, the highest emissions of NOX were from highly loaded gas-fired plants, and the lowest are from oil-fired plants. The abated furnaces are equipped with primary measures like the Fenix process or by secondary measures like SCR (selective catalytic reduction) or 3R (addition of hydrocarbons fuel oil or natural gas, for the chemical reduction of NOX).

Chapter 3
Manufacture of Glass 119
The highest emissions of SOX for unabated furnaces are from oil-fired plants and the lowest are from gas-fired plants. The highest emissions of particulate matter for unabated furnaces are from oil-fired plants, and the lowest are from low loaded gas-fired plants with high cullet levels. The particulate matter emitted from an uncontrolled furnace is mainly derived from the condensation in the waste gases of soda and sulphate compounds volatilised from the melt. The main component of the particulate matter is sodium sulphate, a relatively harmless soluble compound. The other minor components are derived from the raw materials, the furnace structure, and fuel oil if it is used. For unabated furnaces, the highest emissions of HCl and HF are from plants with relatively high levels of chlorides and fluorides in the raw materials. The highest emissions of metals from unabated furnaces are from oil-fired plants (the nickel and vanadium content of the fuel oil) or those using colouring agents (Se, Co, Fe and Cr), and the lowest are from gas-fired plants producing clear glass. The ranges of emissions of SOX, dust, HCl, HF and metals from abated furnaces are associated with installations operating particulate abatement systems (an electrostatic precipitator and, in one case, a bag filter), in combination with acid gas scrubbing, in order to meet local permit requirements. Under these conditions, emissions of metals are often beneath detection limits. When tinted glasses containing selenium as the colourising agent are produced, the uncontrolled emissions of selenium are typically between 30 and 80 mg/Nm3. The emissions are normally less than 5 mg/Nm3 with values in the range of 1–3 mg/Nm3 when secondary measures are applied (filtration combined with acid gas scrubbing). Very few experiences exist today on the abatement of selenium emissions from float glass furnaces, especially in the case of fuel-fired furnaces. The efficiency of the control equipment depends on the type of reagent and the presence of other gaseous pollutants (concurrent species to be absorbed) in the flue-gas, such as SOX, with the consequence of competitive parallel reactions.
3.4.2.3 Downstream activities Because of the air-tight sealing of the tin bath section, the emissions of tin vapour from the float bath have been found to be very low and these are generally monitored only to ensure low workplace exposure levels. This issue is not considered further in this document. Hot treatment of the flat glass surface at the exit of the float bath is normally carried out with the purpose of improving the chemical resistance of glass. The process requires the use of SO2with subsequent gaseous emissions, typically in the range of 150 – 300 mg/Nm3 (0.02 – 0.04 kg/tonne glass melted) [84, Italy Report 2007]; however, in the case of special productions the emissions may be higher. The on-line coating processes applied to flat glass are very case specific and the raw materials used and the pollutants emitted will vary. Among the coating technologies, one of the most important is on-line pyrolytic chemical vapour deposition (CVD) involving the use of a gaseous chemical mixture which reacts with the hot surface of the glass leading to the deposition of a coating which bonds to the glass. A variety of materials consisting in general of metals and oxides are deposited on the glass surface. The coating application by the sputtering of metals from metal targets onto the glass surface is generally performed off-line at very low pressure in dedicated vacuum chambers. Emissions will typically contain acid gases (HF, HCl) and fine particulate matter (e.g. oxides of silicon and tin).

Chapter 3
120 Manufacture of Glass
In general, downstream activities do not generate a significant source mass emission, although, they are usually subject to the general local environmental legislation and abatement systems are installed accordingly. Limited information is available concerning emissions levels from these activities. Typical emission limit values applied are, for example, HCl: 10 to 30 mg/Nm3,HF: 5 mg/Nm3 HF, particulate matter: 20 mg/Nm3, and tin compounds: 5 mg/Nm3.
The production of mirrors represents another important downstream activity for the flat glass sector. The process and related emission levels will not be discussed here since it is already covered in the Surface Treatment Using Organic Solvents (STS) BREF [139, European Commission 2007].
3.4.2.4 Diffuse/fugitive emissions The main source of diffuse/fugitive emissions in the flat glass sector is related to the batch charging area of the melting furnace. Emissions of dust from batch carryover, combustion gases which contain volatile compounds present in the batch formulation are the main issues. Selenium used for colouring the glass may be present in the emissions from the charging area. Extraction systems are often used to discharge emissions from the charging area into the atmosphere and bag filters are applied to remove dust.
3.4.3 Emissions to water As discussed earlier, the main uses of water in this sector are cleaning, cooling, and batch humidification. The aqueous emissions are limited to the cooling water system purges, cleaning waters and surface water run-off. The cleaning waters do not present any particular issues that would not be common with any industrial facility, i.e. inert solids and oil. Cooling system purges will contain dissolved salts and water treatment chemicals. Surface water quality will depend on the degree of drainage segregation and site cleanliness. Excluding domestic waste water, discharges generally only contain glass solids, potentially some oil contamination, and chemicals from cooling water system treatment. Simple abatement techniques such as settlement, screening, oil separators, and neutralising can be found within the sector.
3.4.4 Other wastes Wherever possible, batch plant dusts are returned to the raw material silos and reused in the process. Reject batches are gradually fed back into the process by the inclusion of small amounts in subsequent batches wherever possible. Typically 99 % of the glass waste from the end of the glass making process, trims, rejects and damaged glass, is returned to be remelted. At the end of a furnace campaign, the refractory structure (sometimes not the regenerators) is dismantled and replaced. As in the container glass sector, as much of this material as is practicable is recovered for reuse or sale. The issues concerning materials which contain chromium are discussed in Section 3.2.2.3. Most glass raw materials are generally delivered in bulk and do not give rise to packaging waste. Waste materials from product packaging operations (plastic, cardboard, wood, etc.) are usually reused or recycled if practicable. Other wastes not specific to the sector are disposed of by conventional means.

Chapter 3
Manufacture of Glass 121
3.4.5 Energy [19, CPIV 1998][15, ETSU 1992]
The energy usage distribution for a typical float glass process is shown in Figure 3.5, but energy usage in particular processes may vary slightly. It can be seen that over three quarters of the energy used in float glass plants is spent on melting glass. Forming and annealing takes a further 5 % of the total. The remaining energy is used for services, control systems, lighting, factory heating, and post-forming processes such as inspection and packaging. The distribution presented in Figure 3.5 does not include downstream activities such as coating application, cutting, thermal toughening, ion exchange treatments, mirror production, etc. which may be carried out outside the installation.
Furnace 83 %
Other 10 %Cutting 2 %
Forming/Lehr 5 %
Furnace 83 %
Other 10 %Cutting 2 %
Forming/Lehr 5 %
Figure 3.5: Energy usage distribution for a typical float glass process
Float glass furnaces are almost exclusively fired on heavy fuel oil or natural gas, sometimes with an electrical boost of up to 10 %. Many furnaces have the capacity to fire on either oil or gas, or potentially both at the same time on different burners. There are some examples of electrical furnaces, but these are small scale and for specialist applications. There are also three oxy-fuel fired furnaces in the US, which began operation in 1998, and a new one started operations in 2009 in France. Forehearths (in rolled glass) and annealing lehrs are heated by gas or electricity. Electrical energy is used to drive air compressors and fans needed for the process. General services include water pumping, usually steam generation for fuel storage and trace heating, humidification/heating of the batch and sometimes heating buildings. In some cases, larger furnaces have been equipped with waste heat boilers to produce part or all of the steam required. A limited number of furnaces are equipped with turbines and generators to produce electricity from steam. The energy consumption of the process will depend on many factors, the main ones being those outlined in Section 3.2.3. The range of energy consumption encountered within the sector is quite narrow, if compared with other sectors, because there is relatively little variation in the type of furnace used. Specific energy consumption depends strongly on the size of the furnace; a furnace with more than 800 tonnes/day of melted glass requires about 10 – 12 % less energy compared with a furnace producing about 500 tonnes/day. The ageing of the furnace leads to an increase of energy consumption equivalent to 1 – 1.3 % per year, on average. Within the EU-27 installations, energy levels for melting are typically between 5.2 and 8.7 GJ/tonne of melted glass, mainly depending on the size and age of the installation, with an average value of 7.5 GJ/tonne of glass. Values as low as 5.0 GJ/tonne of melted glass can be achieved at the beginning of the furnace campaign for very high capacity furnaces. The specific energy requirements for the process as a whole are generally less than 8.0 GJ/tonne [75, Germany-HVG Glass Industry report 2007].

Chapter 3
122 Manufacture of Glass
3.5 Continuous filament glass fibre The major output mass flow is the product, which may be from 55 – 80 % of raw material input. The losses arise through emissions to air, solid residues, and aqueous wastes. The molten glass represents around 80 – 85 % of the furnace raw material input. Most of the loss is made up of gaseous emissions particularly CO2 from the decomposition of carbonates. Waste fibre and drain glass can be between 10 and 30 % of process inputs. Table 3.25 below shows a typical input/output summary for the manufacture of continuous filament glass fibre.
Table 3.25: Overview of the continuous filament glass fibre sector inputs and outputs Amount/tonne of product
Input Unit Output UnitRaw materials for glass Silica 300 – 457 kg Colemanite 0 – 250 kg Calcium carbonate 300 – 411 kg Clay 395 – 544 kg Fluorspar 0 – 20 kg Others (dolomite, burnt lime, boric acid, etc.) 3 – 153 kg Emissions to air Dust without abatement system 1.4 – 2 kg Dust with low or boron-free formulation as reduction measure <0.14 – 0.35 kg
Dust with end-of-pipe abatement system 0.02 – 0.24 kg CO2 from raw materials decomposition 0 – 200 kg CO2 from combustion 450 – 1000 kg Water vapour from combustion/raw material decomposition 180 – 800 kg Water from drying processes 75 – 200 kg NOX (as NO2) from air fuel 2.7 – 16.5 kg NOX (as NO2) from oxy-fuel 0.3 – 2.0 kg SOX (as SO2) 0.05 – 8 kg HF <0.5 kg HCl 0.03 – 0.12 kg Water from evaporative, cooling 3200 kg VOC in forming area, ovens. 0.1 – 0.5 kg Binder products balance
(As supplied) Polymers (~50 % solid) 20 – 40 kg (As supplied) Silane 1 – 2 kg (As supplied) Lubricants 1 – 5 kg (As supplied) Others 0 – 10 kg (Dry solids) Binder on glass 4 – 20 kg (Dry solids) Binder in waste water 1 – 13 kg (Dry solids) Binder in solid waste <1 kg
Binder in air (see VOC above) kg Water balance Total 4000 – 15000 kg
Added for binder <200 kg For cooling (added) >1500 kg For spraying, cleaning >3000 kg In waste glass 10 – 20 kg In sewage 2000 – 11000 kg In air by evaporation (ovens, cooling towers, etc.) 1500 – 4000 kg
Solid wastes (dry solids) Fibre glass 60 – 250 kg Binder wastes 1 – 13 kg
Energy Total 10 – 25 GJ Energy for melting (furnace + refiner + forehearths) 7 – 18 GJ Source: [19, CPIV 1998] [66, APFE UPDATE IPPC Glass BREF 2007]

Chapter 3
Manufacture of Glass 123
3.5.1 Process inputs The chemical composition of the fibre varies depending on the glass type and the end use, and is usually expressed in terms of the oxides of the elements it contains. It is difficult to identify a “typical” batch composition beyond that given in Table 3.25 above. The basic raw materials are selected and blended to give the final desired glass compositions following melting. The raw materials present a fine granulometry in order to obtain a very high level of homogeneity of the batch and the melt. The typical glass types and composition ranges are shown in Section 2.6. Table 3.26 below shows the main raw materials used to achieve these compositions.
Table 3.26: Materials utilised in the continuous filament glass fibre sector Description Materials
Glass-forming materials Silica sand
Glass intermediate and modifying materials
Calcium carbonate, calcium oxide, alumina silicate, colemanite, calcium borate, borax, boric acid, feldspar, fluorspar, calcium sulphate, sodium carbonate, potassium carbonate, sodium sulphate, zinc oxide, titanium oxide or rutile, zirconium oxide, dolomite and iron oxide
Coating materials
The coating material will vary depending on the end use of the product. Typical coatings are: film formers (e.g. polyvinyl acetate, starch, polyurethane, epoxy resins); coupling agents (e.g. organo-functional silanes); pH modifiers (e.g. acetic acid, hydrochloric acid, ammonium salts); and lubricants (e.g. mineral oils, surfactants)
Binders for secondary products Polyvinylacetate, saturated polyester powders, phenolic resin powders Fuels Fuel oil, natural gas, electricity Water Mains supply and local natural sources (wells, rivers, lakes, etc.)
Ancillary materials Packaging materials including plastics, paper, cardboard, etc. Process gases, oxygen Water treatment chemicals for cooling water and waste water
The largest inputs to the process are the silica sand, the alkali/alkali earth metal carbonates and oxides, alumina and the boron-containing materials. In E-glass composition, the oxides of silicon, sodium, potassium, calcium, magnesium, boron and aluminium account for over 95 % of the glass. The dominant oxides and the main materials from which they are derived are: SiO2(53 – 60 % sand), CaO + MgO (20 – 24 % limestone, dolomite), B2O3 (0 – 10 % colemanite, borax, etc.), Al2O3 (11 – 16 % alumina), and Na2O + K2O (<2 % soda ash/potash). Coating materials represent a very small proportion of the product mass, typically 0.5 to 2 %. They consist mainly of aqueous polymer solutions, typically 50 % solids, and smaller amounts of the other materials specified in Table 3.26. Water is used for cooling, cleaning, coating preparation and in some cases for wet scrubbing systems. One of the main characteristics of the manufacture of continuous filament glass fibre is the need for a large amount of water for cooling. Each bushing needs water to reduce the temperature of the filament very quickly from 1250 °C to ambient temperature. This cooling is achieved by transferring heat to metallic bars close to the bushing tips, and cooling by circulating water, passing cold air through the filaments, and by water sprays. Cooling water is also required around the furnace and the forehearths, generally in semi-closed circuits and total flows are typically several thousands of m3/h. Significant amounts of water are also used in coating preparation and wash down in the forming/winding area. The total water consumption per tonne of finished product is typically between 4 and 20 m3, cooling system losses account for around 20 % of this figure.

Chapter 3
124 Manufacture of Glass
3.5.2 Emissions to air 3.5.2.1 Raw materials In most modern processes, silos and mixing vessels are fitted with filter systems which reduce dust emissions to below 5 mg/Nm3. Mass emissions from both filtered and unfiltered systems will clearly depend on the number of transfers and the amount of material handled.
3.5.2.2 Melting [19, CPIV 1998] [66, APFE UPDATE IPPC Glass BREF 2007]
In the continuous filament glass fibre sector, the greatest potential environmental emissions are emissions to air from the melting activities. The major substances emitted and the associated sources are identified in Section 3.2.2.1. In 2005, 57 % of the furnaces operating in this sector were natural gas-fired recuperative furnaces, some with an oxygen boost and/or an electric boost (oil-firing is now rare and mostly limited to use as a back-up fuel during periods of gas shortages through peak demands). A growing number of furnaces are now 100 % oxy-fuel fired (43 % in 2005), many of them with electric boosting. Dust emissions from the melting process are predominantly composed of alkali and alkaline earth sulphates and borates (e.g. sodium/potassium/calcium sulphate and sodium/potassium/calcium borate). While the final glass product contains about 6 – 8 % boron (as B2O3), dust emissions may be constituted by 85 – 90 % boron compounds produced by volatilisation and condensation phenomena. The use of high levels of boron oxides in the formulation of the batch composition, in conjunction with a low or high concentration of alkali oxides, determines the formation mechanism of the dust emissions and the possible presence of significant amounts of gaseous boron compounds in the flue-gases (HBO2 and H3BO3). The different behaviour of low-alkali glasses, such as E-glass, and other types of borosilicate glasses is described in Section 4.4.1.1. Particularly in the production of boron-containing E-glass, high levels of boron are emitted in the gaseous form at temperatures as low as 60 °C and, as a consequence, the definition of the emission levels for dust and gaseous boron species may be difficult. In this case, the efficient abatement of boron from the flue-gases requires the application of a suitable scrubbing technique, since the filtration of dust removes only part of the boron. The example presented in Table 3.27 shows the mass flow of boron compounds measured before and after waste gas treatment, for a production installation equipped with a dry-scrubber plus a bag filter, and an additional wet scrubbing system for the abatement of gaseous boron compounds.
Table 3.27: Distribution of boron compounds at different temperatures and treatment stages of the flue-gases
Waste gas temperature
Total particulate
Total boron compounds (particulate and gaseous)
expressed as B2O3°C
Samplingconditions
kg/h kg/h 189 Untreated waste gas 3.14 11.2 164 After bag filter 0.30 7.25 108 After bag filter and wet scrubbing 0.29 2.96
Source: [84, Italy Report 2007]
A summary of the range of emissions to air is given in Table 3.28, where data related to the application of both primary and secondary abatement techniques are presented.

Chapter 3
Manufacture of Glass 125
Table 3.28: Emission levels from continuous filament glass fibre furnaces
Substance Primary abatement techniques
in mg/Nm3 (1)(kg/tonne melted glass)
Secondary abatement techniques in mg/Nm3
(kg/tonne melted glass) Nitrogen oxides (as NO2)with air-fuel firing 600 – 1600 (2.7 – 7.2) No examples of secondary
abatement Nitrogen oxides (as NO2)with oxy-fuel firing (0.3 – 1.9) No examples of secondary
abatement
Sulphur oxides (as SO2)
150 – 1200 (0.75 – 6.0) (gas-fired);
up to 3000 (15) (oil-fired)
No examples of secondary abatement
Particulate matter (<0.14 – 0.35) 5 – 50 (0.02 – 0.24)
Fluorides (HF)
<20 (<0.09) (No added fluoride) 50 – 400 (0.25 – 2.0)
(added fluoride)
<20 (<0.1)
Chlorides (HCl) <10 (<0.05) <10 (<0.05) Metals group 1 (As, Co, Ni, Cd, Se,CrVI)(2)
<1(<0.0045) <1(<0.0045)
Metals groups 1+2 (As, Co, Ni, Cd, Se,CrVI, Sb, Pb, CrIII, Cu, Mn, V, Sn)(2)
<3 (<0.014) <3 (<0.014)
(1) Values given in concentration (mg/Nm3) refer to the following conditions: dry, temperature 0 °C (273K), pressure 101.3 kPa, 8 % oxygen by volume.
(2) See definition of metals group 1 and group 2 in Table 3.4, Section 3.2.2.1. Source: [66, APFE UPDATE IPPC Glass BREF 2007]
The primary techniques applied for the reduction of dust emissions consist of low-boron or boron-free batch formulations. With the use of boron-free formulations and a good control of batch carryover, emission values for particulate matter below 0.14 kg/tonne melted glass may be achieved with oxy-fuel fired furnaces. Values as low as 0.03 kg/tonne glass have been reported; however, the specific operating conditions for obtaining these low values are not known. Higher emission levels (up to 0.35 kg/tonne glass) may be observed when raw materials giving decrepitation effects are used (i.e. dolomite). Without the application of primary or secondary measures, particulate matter levels can reach up to 2 kg/tonne melted glass. Emissions of nitrogen oxides from air-fuel fired furnaces show lower values in terms of specific emission factors (kg/tonne melted glass) with increasing furnace output and the use of electric boosting. The better performers are in the range of approximately 3.0 to 5.0 kg/tonne melted glass. Oxy-fuel firing is widely used within the sector (about 50 % of the melting furnaces), while secondary abatement techniques (i.e. 3R, SCR, SNCR) are not applied. Emissions of fluorides are directly related to the use in the batch formulation of compounds which contain fluorine, used as melting flux or to improve the fiberisation process. In some cases, fluoride is added as a raw material to meet the quality requirement of the final glass product. The amount of fluorine considered necessary will depend on a variety of specific technical factors related to furnace and fibre-forming design, throughput and filament diameter requirements of the finished product. When fluorine-based compounds are not intentionally added to the batch formulation, the levels of HF achieved are dependent on the impurities of reliable and economically available supplies of raw materials, in particular alumina silicate and kaolin, with low variable levels of fluoride. Whatever the origin, a portion of the fluoride will be emitted in the waste gases from the furnace. The final HF concentration in the flue-gases can vary significantly depending on the level of fluoride in the batch and the abatement measures used.

Chapter 3
126 Manufacture of Glass
3.5.2.3 Downstream activities [19, CPIV 1998]
Emissions to air from coating applications are usually quite low, due to the general low volatility of the coating materials and the low glass temperatures at the point of application. However, the airflows in the forming area are very high to ensure adequate cooling of the glass and some carryover of droplets or evaporation of organic compounds occurs. In most cases, the extracted cooling air is treated by water scrubbing systems prior to release or partial recycling into the forming area. The high volume of cooling air means that emission concentrations are generally quite low. Limited measurements (including the use of coatings with higher solvent levels) have shown volatile organic compounds (VOC) concentrations from very low levels up to 20 mg/Nm3.
The coating materials are generally water based and the fibre cakes are often dried in ovens. The drying process will give rise to emissions of water vapour and any substances volatile at the drying temperatures. The coatings are chemically bonded to the glass during the drying process and emissions levels are generally relatively low. However, the coating formulations and so the emissions can vary widely and only a limited number of measurements are available concerning the drying process. These show VOC emissions ranging from barely detectable levels to a maximum of 70 mg/Nm3, which equated (in this example) to less than 100 g/h. Emissions can also arise from secondary processing to produce mats and tissues, which involve the use of binders that must be cured or dried. Again, very little information is available and this indicates a wide variation depending on the techniques and substances used. Maximum reported VOC emissions were 150 mg/Nm3 and 270 g/h. Limited information is available concerning the typical emission concentrations from downstream activities, in particular from coating and drying operations. Emission concentrations related to measurements carried out after a wet scrubbing system show values of <20 mg/Nm3 for particulate matter (containing organic and inorganic compounds), <20 mg/Nm3
for formaldehyde and <30 mg/Nm3 for ammonia [84, Italy Report 2007].
The storage and handling of coating materials may also give rise to emissions of dusts or volatile organic compounds (VOC), but these are generally very low and can be controlled by good practice and local extraction.
3.5.2.4 Diffuse/fugitive emissions The main sources of diffuse/fugitive emissions in the continuous filament glass fibre sector are related to the batch charging area of the melting furnace, the forehearth channels and in the storage and preparation of the coating formulations. The sector uses very fine raw materials due to requirements of batch and glass homogeneity. Nonetheless, the batch charging area is normally kept closed as much as possible and the potential emissions from batch carryover and combustion gases are expected to be very low. Ventilation and extraction systems are often used on the forehearth channels in order to discharge solid and gaseous emissions externally. Storage and preparation of the coating formulation involve the use of organic compounds such as polyvinyl acetate, polyurethane, and epoxy resins. Specified, enclosed spaces for these operations are normally created, in order to limit the exposure of the workers to the potential emissions.

Chapter 3
Manufacture of Glass 127
3.5.3 Emissions to water [19, CPIV 1998]
Emissions arise from the forming area, binder preparation, cleaning, cooling, tissue/mat binder application, and from water-based scrubbing systems. The main source of emissions is the forming area. Due to the high speed of the winders (centrifugal action) and the movement of the filaments during the forming process, a proportion of the applied binder is thrown off and squeezed out. This is collected in the immediate area together with the water used to periodically clean the forming and winding area. The water sprayed onto the filaments is also collected in the same place. Emissions can arise in the binder preparation area from spillages and leaks, which drain to the waste water system. The high-volume cooling water systems require a purge stream, which will contain low levels of water treatment chemicals. Most scrubbing systems in use are recirculating water scrubbers, which require either a purge stream or periodic discharge and replacement of the scrubbing medium. The total water consumption per tonne of finished product is typically 4 to 20 m3, and cooling system losses (purge and evaporation), account for around 20 % of this figure. With the clear exception of evaporative losses, most of this water is discharged as waste water. The general practice within the sector is to discharge to a sewage treatment works or to treat water on site. In the case of a discharge to a sewage treatment plant, emission levels at the point of discharge may be significantly higher than the values presented in Table 5.5 as achievable emission levels. The waste water pollutant concentrations are usually very low (less than 0.2 % solid content before any treatment), due to the dilution by wash down water, and their content is mostly biodegradable. The chemicals used do not contain any heavy metals or dangerous listed substances, but the actual composition varies widely from site to site due to the great variety of binder compositions. For some products, a chrome-based coupling agent is still used, but this is being gradually phased out. An example of water balance typical of a continuous filament glass fibre installation is presented in Figure 3.6.

Chapter 3
128 Manufacture of Glass
Figure 3.6: Example of water balance for a continuous filament glass fibre installation
3.5.4 Other wastes [19, CPIV 1998]
Wastes can arise in the batch plant from reject batches and spillages or leakages. The process is very sensitive to raw material quality and in general such wastes are sent to landfill (5 to 50 tonnes per year). The molten glass delivered by the melter to the forehearths may include small quantities of impurities (unmelted particles), which have the potential to cause bushing filament breaks and thus waste glass fibres. In order to reduce such breaks, drain bushings can be installed at the bottom of the channel feeding the forehearths to withdraw a small flow of glass that contains these denser unmelted particles. When drain bushings are used, this drain glass is typically 1 to 5 % of the melted glass. The drain glass can be processed into cullet and either recycled internally or used in other applications. The internal recycling of this material is not usually desirable because it involves returning to the furnace the separated impurities that will flow back to the bushings. This could lead to a gradual build-up of unmeltable material and potentially a higher level of drain glass. Waste glass and fibre also arise due to product changeover, package changeover, and filament breakage, when the glass is still flowing but cannot be converted into saleable product. The manufacture of very low-diameter filaments (from 5 to 25 µm) is difficult without some level of breakage. Consequently, the quantity of waste glass fibre can be relatively high, and usually forms one of the main waste streams from the process. The amount of waste can be between

Chapter 3
Manufacture of Glass 129
10 and 25 % of the total amount of molten glass that flows out of the furnace, depending on the type of forming process and on the diameter of the filaments. These quantities can be greatly increased when problems occur with raw materials, or in the performance and stability of the furnace. The waste fibre contains up to 25 % water and dilute binder. The conversion of cake to finished product results in an amount of waste which varies depending on the products, from 3 to 10 %. The unusable material is mostly from the inside and outside of the cakes, the fuzz, the damaged and reject material, the test samples, the mat trimmings, etc. Commonly the waste contains coating material at a level from 0.5 to 10 % (up to 20 % for tissues), and may contain up to 15 % water. The dust collected in abatement equipment cannot always be recycled to the furnace. If dry or wet scrubbing techniques are applied, this may be more difficult, requiring additional measures such as blending or processing.
3.5.5 Energy [19, CPIV 1998][15, ETSU 1992]
The direct energy usage distribution for a typical continuous filament glass fibre process is shown in Figure 3.7. Energy usage in particular processes may vary depending on the size of the melter and the type of downstream processes. Generally over three quarters of the energy is used for melting. Forming, including bushing heating and product conversion account for around 15 % of energy use, and the remaining energy is used for services, control systems, lighting, and factory heating. In 2005, most furnaces in this sector were gas-fired recuperative-type furnaces, some with an electric boost (up to 20 % of melting energy). In the same year, oxy-fuel melters were representing about 46 % of the total number of furnaces, while in 2007 the share of this type of furnaces was between 50 and 55 %. There are also examples of oil-fired furnaces and oxygen-enriched firing furnaces. The air preheat temperature of recuperative furnaces is lower than that of regenerative furnaces and the energy requirements are consequently higher per tonne of glass. In this sector, the electrical conductivity of the glass is very low, and currently 100 % electric melting is not considered economically or technically practicable.
Furnace 80 %
Other 5 %Forming 4 %
Conversion 11 %
Figure 3.7: Direct energy usage in a typical continuous filament glass fibre production process

Chapter 3
130 Manufacture of Glass
The energy consumption of the process will depend on many factors, the main ones being outlined in Section 3.2.3. Energy consumption for melting is typically 7 to 18 GJ/tonne of melt, although for some small furnaces producing specialised compositions, this can be up to 30 GJ/tonne. Overall energy consumption is usually in the range of 10 to 25 GJ/tonne of product, the lower end of the range being associated with large oxy-fired furnaces. The indirect energy consumption related to the production of oxygen and/or the generation of electricity is not included in the data presented above. Overall, the average energy usage per tonne of glass, based on 2007 data (APFE members production), is equivalent to 16.5 GJ/tonne of finished product, of which 12.4 GJ/tonne are from fossil fuel (mainly natural gas) and 4.1 GJ/tonne are from electricity. This translates into CO2 direct emissions of about 770 kg CO2/tonne product (fossil fuel + process emissions). Maximum crown temperatures in continuous filament glass fibre furnaces are typically around 1650 ºC, which is up to 50 ºC higher than for container glass furnaces and up to 250 ºC higher than for glass wool furnaces. The higher melting temperatures contribute to the relatively high specific energy consumption in this sector.
3.6 Domestic glass [28, Domestic 1998] [68, Domestic Glass Data update 2007]
As described in Chapters 1and 2, the domestic glass sector is very diverse, producing a wide range of products from different compositions and furnace types. Therefore, there is quite a wide variation in the process inputs and outputs. As in all other sectors, the main output from the process is the product. In soda-lime-silica glass production, the net glass product represents typically 50 to 90 % (average 85 %) of the raw material input, with lower values of around 40 % for the production of high-quality stemware. For lead crystal, the pack to melt ratio is 35 to 80 % (average 75 %). The lower figure for lead crystal is due to a range of factors such as more cutting and polishing, and higher quality constraints. The other types of domestic glass (crystal, opal, borosilicate and glass ceramic) have values between the two extremes. Table 3.29 below summarises the main input and output parameters for soda-lime, crystal and lead crystal. The values for the other domestic glass types lie between the examples given. Data reported are the result of a survey from members of the European domestic glass association and concern the EU-25. It should be noted that since the year 2000, the sector has been affected by strong market evolution with the result that other types of crystal have been produced and important crystal producers from new EU Member States are included in the data collection (e.g. Czech Republic), with a significant change in both the formulations and the technologies used for production. These are the reasons for an extended range of emissions values reported in Table 3.29.

Chapter 3
Manufacture of Glass 131
Table 3.29: Overview of domestic glass sector inputs and outputs Soda-lime glass(1) Crystal and lead crystal Units/tonne of
glass melted Range (mean value)
Range (mean value)
Inputs Energy, oil/gas GJ 5 – 14 (9) 0.5 – 5 (3) Energy, electricity GJ 1 – 4 (2.5) 1 – 6 (4) Silica sand tonne 0.65 – 0.75 (0.6) 0.20 – 0.50 (0.42) Carbonates tonne 0.3 – 0.42 (0.34) 0.08 – 0.20 (0.14) Lead oxide tonne 0 – 0.30 (0.18) (2)Minor mineral ingredients tonne 0.02 – 0.08 (0.04) 0.005 – 0.02 (0.01) Internal cullet tonne 0.15 – 0.5 (0.25) 0.25 – 0.65 (0.35) Packaging materials tonne 0.06 – 0.20 (0.1) 0.06 – 0.20 (0.1) Moulds and other tonne 0.001 – 0.003 (0.002) 0.001 – 0.003 (0.002) Water m3 2 – 9 (7) 2 – 55 (11) Hydrofluoric acid (100 %) kg/t glass acid polished (3) 40 – 130 (65) Sulphuric acid (96 %) t/t HF (100 %) (3) 1 – 10 (5) Sodium hydroxide t/t HF (100 %) (3) 0 – 0.2 (0.1) Calcium hydroxide t/t HF (100 %) (3) 1 – 10 (4) Fresh washing water t/t HF (100 %) (3) 0.025 – 0.07 (0.05) Outputs Finished, packed products tonne 0.4 – 0.9 (0.85) 0.35 – 0.8 (0.75) Emissions to air CO2NOXSOXDust H2O
kg
150 – 1000 (700) 0.2 – 6 (2.5)
0.1 – 1.0 (0.5) 0.001 – 0.3 (0.2) 60 – 500 (300)
150 – 400 (300) 0 – 11 (2.7)
0.1 – 0.3 (0.2) 0.001 – 0.3 (0.03)
60 – 250 (120)
Waste water m3 2 – 9 (6) 2 – 54 (11) Internal cullet tonne 0.15 – 0.4 (0.25) 0.25 – 0.65 (0.35) Waste to recycling kg 10 – 60 (30) 10 – 60 (30) Other waste kg 6 – 50 (10) 6 – 50 (10) Waste to recycling: PbSO4 or PbCO3 CaSO4
t/t HF (100 %) (3)t/t HF (100 %) (3)
0.2 – 1.5 (0.8) 2 – 20 (7.5)
Waste to deposition: Cutting sludge Heavy metal sludge
t/t HF (100 %) (3)t/t HF (100 %) (3)
0.3 – 0.7 (0.45) 0.1 – 0.5 (0.3)
(1) These data relate to conventional furnaces (i.e. not electrical). (2) With regard to lead oxide input, the range includes all the crystal and lead crystal glass formulations classified
according to Council Directive 69/493/EEC. (3) With regard to acid polishing, the consumption of 100 % hydrofluoric acid is the best reference parameter because
it takes into account the surface/volume ratio. Consumption of 100 % HF/tonne of glass acid polished will depend on the surface area/volume ratio and consequently on the types of articles being polished.
Source: [68, Domestic Glass Data update 2007]

Chapter 3
132 Manufacture of Glass
3.6.1 Process inputs The inputs to the process will vary depending on the product made and the required glass composition. The main glass types are soda-lime, lead crystal, crystal, borosilicate, opaque, and glass ceramics. The main raw materials utilised within the sector are outlined in Table 3.30.
Table 3.30: Materials utilised in the domestic glass sector Description Materials
Glass-forming materials
Silica sand, process cullet, boron-containing raw materials (e.g. borax, ulexite, boric acid, colemanite)
Glass intermediate and modifying materials
Sodium carbonate, potassium carbonate, barium carbonate, limestone, dolomite, alumina, nepheline syenite, arsenic, antimony carbon, lead oxide, fluorspar, titanium dioxide
Glass oxidants and fining agents Sodium sulphate, sodium nitrate, potassium nitrate
Glass colouring and decolouring agents
Oxides of chromium, iron, cobalt, copper, manganese, nickel, cadmium and selenium or zinc selenite, cerium
Product coating agents
Inorganic or organic metal chlorides. Predominantly tin tetrachloride, titanium tetrachloride and monobutyl tin trichloride
Product lubricants Polyethylene-based lubricants and fatty acids (e.g. oleic acid) Fuels Fuel oil, natural gas, electricity, butane, propane, acetylene Water Mains supply and local natural sources (wells, rivers, lakes, etc.)
Ancillary materials
Packaging materials including plastics, paper, cardboard, and wood. Mould lubricants, generally high-temperature graphite-based release agents. Machine lubricants, predominantly mineral oils. Process gases including oxygen and hydrogen. Polishing materials, mainly strong mineral acids (HF, H2SO4) also NaOH. Decorating materials, enamels, sands. Water treatment chemicals for cooling water and waste water.
The raw materials for the glass batch are blended in the correct proportion to produce the desired glass composition. For soda-lime glass, the oxides of silicon, sodium and calcium account for over 90 % of the glass (SiO2: 71 – 73 %, Na2O: 12 – 14 % and CaO: 10 – 12 %). The silicon dioxide is derived mainly from sand and cullet. Sodium oxide is derived mainly from soda ash, and calcium oxide mainly from limestone. A typical composition range for lead crystal is SiO2: 54 – 65 %, PbO: 25 – 30 %, Na2O or K2O: 13 – 15 %, plus other various minor components. In crystal glass formulations, lead oxide is partially or totally replaced by barium, zinc or potassium oxides, the limits being defined in Directive 69/493/EEC. Borosilicate glasses are produced using a higher percentage of silicon compounds than of boron compounds (expressed as boron trioxide, B2O3). A typical composition is 70 – 80 % SiO2, 7 –15 % B2O3, 4 – 8 % Na2O or K2O, and 2 – 7 % Al2O3. The boron content in the borosilicate
glass composition is derived from borax or other boron-containing materials (boric acid, ulexite, colemanite), and the aluminium oxide is derived mainly from alumina. The composition of opaque glasses are generally expressed as constituted mainly of the oxides of silicon, sodium, calcium, aluminium and potassium, but they also contain around 4 – 5 % of fluoride derived from minerals such as fluorspar. The predominant oxides of ceramic glass are silicon, aluminium, sodium and calcium with lower levels of magnesium, barium, zinc, zirconium, lithium and titanium. The use of cullet within the sector varies, most processes will recycle internal cullet, but external cullet is not normally used due to quality considerations. The domestic glass sector uses different types of refining agents and oxidising agents: nitrates, sulphates, and in some specific cases arsenic and antimony compounds (typically As: 0.1 – 1 % and Sb: 0.1 – 0.4 % of the batch) and cerium compounds (0.2 – 0.5 % of the batch). Selenium is also used as a decolourising agent and is typically <0.005 % of the batch composition. In lead crystal production, it is generally necessary to polish the glass after cutting.

Chapter 3
Manufacture of Glass 133
The most common way of doing this is by dipping the glass in a mixture of strong hydrofluoric and sulphuric acid, and then rinsing it with water. Some products receive surface treatments similar to those in the container glass sector described in Section 3.3.
The fuels used will vary from process to process, but in general, natural gas, fuel oil and electricity are used for glass melting, either separately or in combination. Forehearths and annealing lehrs are heated by gas or electricity, which are also used for heating and general services. Light fuel oil, propane and butane are sometimes used as back-up fuels and for surface finishing (also acetylene). Oxygen is also used for the furnace or downstream processes. In general, the main uses of water in the domestic glass sector are for cooling circuits and cleaning. Cooling water is used, usually in closed or open circuits, to cool various pieces of equipment with corresponding losses from evaporation and purges. Water is also used in specific downstream steps of the process (cutting, polishing, washing, etc.) and for wet scrubber systems. Therefore, actual water consumption may vary according to local conditions (e.g. ambient temperature and the hardness of water input).
3.6.2 Emissions to air [28, Domestic 1998]
3.6.2.1 Raw materials In most modern domestic glass processes, silos and mixing vessels are fitted with filter systems which reduce dust emissions to below 5 mg/Nm3. Mass emissions from both filtered and unfiltered systems will depend on the number of transfers and the amount of material handled. However, a characteristic of this sector is that some batch plants are relatively small and due to the specialised nature and lower volumes of some of the products, there is a higher level of manual (and semi-manual) handling and transfer. Emissions from these activities will depend on how well systems are controlled; this is discussed further in Chapter 4. Clearly where materials containing potentially more toxic compounds (e.g. lead oxide, arsenic, etc.) are handled, there is the potential for emissions of these substances. Usually specific controls are used to prevent emissions (e.g. dust extraction and pneumatic handling) and consequently emissions levels are usually very low.
3.6.2.2 Melting [28, Domestic 1998] [68, Domestic Glass Data update 2007]
In the domestic glass sector, the greatest potential environmental emissions are emissions to air from the melting activities. The main substances emitted and the associated sources are identified in Section 3.2.2.1. In this sector, there is a wide range of products and most of the melting techniques described in Chapter 2 can be found. Energy used for the production process can be natural gas, oil or electricity. A summary of the range of emissions to air is given in Table 3.31. These data are for emissions from soda-lime, crystal and lead crystal furnaces only. Due to the limited available data, emissions from borosilicate glass for domestic use (cookware) could not be reported. Data reported are the result of a survey from members of the European domestic glass manufacturers association and concern the EU-25. The statistical analyses of data might have produced results that show significant differences from the previous survey carried out within members of the EU-15 for the elaboration of the first version of the BREF. These figures taken together are considered to represent the full range of the sector, with emissions from other glass types falling between the examples.

Chapter 3
134 Manufacture of Glass
Table 3.31: Summary of emissions to air from domestic glass furnaces Substance Soda-lime-silica glass (1) Crystal and lead crystal
mg/Nm3
(mean value)
kg/tonne of melted glass (mean value)
mg/Nm3 (1)(mean value)
kg/tonne of melted glass (mean value)
Nitrogen oxides (as NO2)(2)
300 – 2100(2)(1100)
0.2 – 6 (2.5)
300 – 2300 (840)
0.2 – 11 (2.7)
Sulphur oxides (as SO2)
80 – 310 (180)
0.1 – 1.0 (0.5)
60 – 130 (80)
0.1 – 0.3 (0.2)
Particulate matter 0.5 – 220 (90)
0.001 – 0.3 (0.2)
0.1 – 13 (4)
0.001 – 0.3 (0.03)
Fluorides (HF) 0.2 – 5 (2) 0.1 – 10
(2) <0.003
Chlorides (HCl) 0.1 – 20 (10) 0.2 – 2
(1) <0.004
Metals (including lead) <5 0.05 – 0.5
(0.2) <0.01
(1) These data relate to conventional furnaces (i.e. not electrical). (2) Some high results relate to the use of nitrates in the batch or to other specific conditions (e.g. very low pull
rate). Source: [68, Domestic Glass Data update 2007]
Emission levels for a particular furnace can depend on many factors, such as batch composition, abatement techniques utilised, and the age of the furnace. Emissions of fluorides, lead and other metals are directly related to the use of compounds containing these substances in the batch. In general, heavy metals are emitted as particulate matter and are associated with glass products with a high metals contents (e.g. lead crystal glass) or, more rarely, with the use of cullet which contains heavy metals. In some cases, fluoride is added as a raw material to meet the requirement of the glass composition; in others it is an impurity of some raw materials. Some of the material will be incorporated into the glass but some will inevitably be emitted to the air. Fluorine is usually emitted as HF, and metals can be emitted as fumes or more commonly are contained in the particulate matter.
3.6.2.3 Downstream activities Soda-lime products may have surface treatments applied. The treatments and emissions are similar to those described for container glass in Section 3.3.2.3. Many products are fire-finished; however, this operation does not give rise to emissions other than the flame combustion products. Acid polishing of lead crystal products can lead to emissions of acid fumes (HF and SiF4) which are usually treated in scrubbing towers circulating water or an alkali solution (e.g. sodium hydroxide). The fumes from the acid bath react in the water to give hexafluorosilicic acid (H2SiF6) at concentrations of up to 35 %. This acidic water must be neutralised before discharge or, in some circumstances, can be recovered for use in the chemical industry. Gaseous emissions measured after the scrubbing system used to treat the acid fumes show concentration values of below 5 mg/Nm3 HF. More details regarding the technical aspects of the treatment systems applied to the sector are further discussed in Section 4.5.4. Grinding and cutting activities can give rise to dust emissions. These are usually controlled by cutting under liquid or with local air extraction.

Chapter 3
Manufacture of Glass 135
3.6.2.4 Diffuse/fugitive emissions The main sources of diffuse/fugitive emissions specific to the domestic glass sector concern the doghouse area of the furnace, the forehearth channels, the forming area and the fire-finishing operations. Emissions from the batch charging area (doghouse) are related to the carryover of batch composition (dust emissions) and combustion gases from the furnace. When electric furnaces are used, for instance for the production of lead crystal glass or opal glass, the doghouse area is often equipped with an extraction system to convey the emissions to a bag filter or, in fewer cases, to a wet scrubbing system. Combustion gases and evaporation products may be released from the forehearth channels. When colouring of the glass is performed in the feeder, diffuse emissions from the forehearth channels may be significant due to the presence of heavy metals. In the forming area, mists of mineral oil and other lubricating products may be released. Combustion gases may arise from the thermal treatment of the moulds and from the annealing lehr. Fire-finishing operations are quite common and produce combustion gases which are normally released in the ambient atmosphere. These specific issues are normally managed according to the health and safety regulations at work and do not represent significant emissions to air. In some special circumstances, the extraction and treatment of diffuse emissions from the forehearth channels may be necessary in order to limit the exposure levels to heavy metals in the workplace.
3.6.3 Emissions to water [28, Domestic 1998] [101, Bruno D. BATwater 2007]
As with other sectors of the industry, in the domestic glass sector, the main water uses are for cooling and cleaning purposes, and aqueous emissions are limited to the cooling water system purges, cleaning waters and surface water run-off. The cleaning waters do not, in general, present any particular issues that would not be common to any industrial facility, i.e. inert solids and potentially oil. Cooling system purges will contain dissolved salts and water treatment chemicals. Surface water quality will depend on the degree of drainage segregation and site cleanliness. However, the production of certain products, in particular glasses which contain lead, can give rise to other direct emissions, which may contain lead or other compounds. The main potential sources of contaminated waste water include: cleaning waters from areas where batch material may have been spilled (which may contain lead, arsenic, antimony, etc.) and from the water used in the cutting and grinding of the products. Most processes will utilise techniques to remove solids, e.g. settlement, precipitation, and flocculation, to comply with local requirements. Acid polishing also results in emissions to water. After dipping the glass in acid, it has a layer of lead sulphate and hexafluorosilicates on the surface. This is washed off with hot water which will become acidic and will contain lead sulphate. Depending on the chemicals used to neutralise this water, the lead sulphate may further react, e.g. to form CaSO4 with Ca(OH)2changing the form of the lead (to precipitate).

Chapter 3
136 Manufacture of Glass
The polishing process also results in a small proportion of the glass dissolving, which is partially precipitated from the acid bath as a mixture of salts that, after separation, gives an ‘etching sludge’. This sludge is processed by filtering and washing in order to obtain lead sulphate or by reaction with calcium or sodium carbonate in order to obtain lead carbonate. Both products can be reused as raw materials (reintroduced into the batch) or recovered in other processes. However, in general, due to technical reasons (risk of damage to batch mixing devices and furnace refractory materials), the resulting sludge is deposited at special landfills. The liquid fraction from the processing of the etching sludge gives an acidic solution which can be reused in the polishing process. Typical concentrations measured at discharge point are presented in Table 3.32 below.
Table 3.32: Typical concentrations measured in water at discharge point, after treatment Parameter Measured value (mg/l)
Total suspended solids ≤50 Pb <0.05 Sb <0.1 F <6 SO4
2- <1000 Hydrocarbons <1 Source: [84, Italy Report 2007]
[110, Austria, Domestic glass plants 2007]
3.6.4 Other wastes Most glass waste (cullet) is recycled back to the furnace and waste levels are generally quite low. General wastes from packaging and furnace repairs are similar to other sectors. Waste from dust control systems and dry scrubbing are generally recycled back to the furnace. In lead crystal production, the sludges separated from the waste water system must be disposed of where they cannot be reused. The formation of the sludge is discussed in Section 3.6.3 above and figures are given in Table 3.29.
3.6.5 Energy [15, ETSU 1992]
The consideration of energy consumption in this sector is quite difficult due to its diversity and the wide range of melting techniques employed. High-volume production of soda-lime tableware has much in common with container glass production (see Section 3.3.5) and shows comparable energy usage distribution. However, a higher proportion of energy use is associated with downstream operations (e.g. fire-polishing and finishing). Specific energy consumption for melting is higher in this sector than for container glass. This is because furnaces tend to be smaller, melting temperatures are slightly higher, and residence time in the furnace is up to 50 % longer. The energy values normally refer only to the primary process and do not include downstream activities such as engraving, cutting, polishing, welding, etc. Typical energy values for these downstream activities can reach 5 to 10 GJ/tonne of glass produced. The energy usage distribution for a typical soda-lime-silica glass tableware production is shown in Figure 3.8 and examples of specific energy consumption are presented in Table 3.8 of Section 3.2.3. When electric melting is applied the typical energy consumption for melting is in the range of 4 to 7 GJ/tonne glass, with values as low as 3.4 GJ/t. For conventional furnaces the energy consumption for melting is in general in the range of 4.8 to 10 GJ/tonne of melted glass. For the production of high-quality tableware in rather small volumes, the energy requirements are higher (similar to flaconnage compared to bottles for the packaging sector).

Chapter 3
Manufacture of Glass 137
45 % Melting energy
22 % Forming and downstream processes
28 %Annealing/tempering lehr
5%Other (includes building heating)
Source:[140, Domestic Glass 2008]
Figure 3.8: Energy usage in soda-lime-silica glass tableware production
Some other processes within the sector, particularly lead crystal production, are carried out on a much smaller scale and pot furnaces may be used. The energy usage distribution for lead crystal glass production differs significantly from one plant to another, with a variation in the energy required for the melting process from 16 to 85 % of the total energy consumption. The overall energy consumption for lead crystal manufacture can be even higher (up to 28 GJ/tonne of finished product), when the calculated theoretical energy requirement for melting from normal raw materials is only around 2.5 GJ/tonne. The difference can be due to many factors, but the main ones are given below. • High-quality requirements may lead to high reject levels. The pot is slowly dissolved by
the glass, leading to cords and stones in the product. • The glass is frequently hand worked and the yield from forming may be below 50 %, and
the articles may need reheating during forming. • The pots have to be ‘founded’ or fired up to a high temperature before use, and they have
a very limited lifetime compared to continuous furnaces. Electric melting of lead crystal allows for the use of high-quality refractories, which give a much higher glass quality and therefore lower reject rate and better yield. The continuous nature of electric melting and the fact that there are not hot flue-gases from combustion often result in a more efficient automated forming. However, the overall energy demand including the downstream activities can lead to energy consumption close to the figure of 25 GJ/tonne of product.
3.7 Special glass The special glass sector is very diverse with a wide range of products, glass formulations and process techniques. Many installations do not meet the 20 tonnes/day criteria specified in Directive 2008/1/EC unless they are associated with other furnaces. Therefore, it is not practicable or indeed necessarily useful to try to summarise the full range of emissions from the whole sector. More than 53 % of the sector capacity are bulbs and tubes and about 9 % are glass ceramics. This section attempts, where possible, to cover the entire sector, but quantitative information is only provided for glass ceramics, borosilicate glass tubes and soda-lime glass for lamp bulbs. The production of water glass is now covered in the Large Volume Inorganic Chemicals - Solids and Others Industry (LVIC-S) BREF [138, EC 2007]; for this reason this particular product will not be included in this section.

Chapter 3
138 Manufacture of Glass
3.7.1 Process inputs [26, Special 1998]
The chemical composition of the special glass varies depending on the glass type and the end use, and is generally expressed in terms of the oxides of the elements it contains. It is difficult to identify ‘typical’ batch compositions for such a diverse sector. The basic raw materials are selected and blended to give the final desired glass compositions following melting. The typical glass types and composition ranges are shown in Section 2.8. Table 3.33 shows the main raw materials used to achieve these compositions. More detailed information is given for the inputs of glass ceramics, borosilicate glass tubes and soda-lime glass bulbs in Table 3.34, where data concerning four specific example processes are reported.
Table 3.33: Materials utilised in the special glass sector Description Materials
Glass-forming material Silica sand and high-purity quartz sand, process cullet
Glass intermediate and modifying materials
Sodium carbonate, potassium carbonate, limestone, dolomite, alumina, aluminium hydroxide, zirconium oxide, borax, boric acid (pure for some applications), carbon, lead oxide, titanium oxide, tin oxide, strontium carbonate, lithium carbonate, barium carbonate, spodumene, fluorspar, nepheline syenite, feldspars, sodium chloride, phosphates
Glass oxidants and fining agents
Sodium sulphate, sodium nitrate, potassium nitrate, arsenic (As2O3), antimony (Sb2O3), carbon
Glass colouring agents Iron chromite, iron oxide, cobalt oxide, selenium or zinc selenite, cerium Fuels Fuel oil, natural gas, electricity, butane, propane, acetylene Water Mains supply and local natural sources (wells, rivers, lakes, etc.)
Ancillary materials
Packaging materials including plastics, paper, cardboard, and wood Mould lubricants, generally high-temperature graphite-based release agents Machine lubricants, predominantly mineral oils Process gases including nitrogen, oxygen, hydrogen and sulphur dioxide Water treatment chemicals for cooling water and waste water

Chapter 3
Manufacture of Glass 139
Table 3.34: Overview of inputs and outputs for example glass ceramic, borosilicate glass tubes and soda-lime glass lamp bulbs processes
Glass Ceramic
Glass tubes (borosilicate)
Glass lamp bulbs (soda-lime)
Type of furnace Oxy-fuel Oxy-fuel Cross-fired regenerative
Cross-fired regenerative
Furnace capacity
30 – 65 t/d 10 – 55 t/d 10 – 55 t/d 50 – 150 t/d
Inputs Units/tonne melted glass
Energy, gas GJ 5.5 – 11 10 – 15 14 – 17 5 – 14 Energy, electricity GJ 1 – 8 SiO2 (calculated) kg 660 – 685 740 – 760 740 – 760 400 – 700 Al(OH)3(calculated) kg 310 – 340 22 – 26 22 – 26
CaO, CaCO3 kg 18 – 22 18 – 22 100 – 400 K2O, K2CO3 kg 20 – 100 Na2CO3, Na2O kg 22 – 28 22 – 28 100 – 300 CaF2 kg 3 – 7 3 – 7 TiO2 kg 12 – 45 Li2CO3(calculated) kg 85 – 110
B2O3 kg 220 – 240 220 – 240 10 – 100 NaNO3, KNO3 kg 9.5 – 15 20 – 25 20 – 25 50 – 250 ZrO2 kg 12 – 45 ZnO kg 12 – 45 Minor mineral ingredients kg 3.5 – 10 1 – 2 1 – 2 0.5 – 20
Internal cullet kg 250 – 550 200 – 400 150 – 350 100 – 500 Water m³ 1.5 – 2.5 1.7 – 2.8 1.7 – 2.8 Closed water circuit Outputs Emissions to air Waste gas abatement system Bag filter Bag filter/ESP Bag filter/ESP ESP
CO2 kg 410 – 500 900 – 1150 950 – 1300 400 – 600 NOX (as NO2) kg 3.6 – 6.5 5 – 8 7 – 12 0.1 – 6 SOX (as SO2) kg 0.02 – 0.07 0.02 – 0.07 0.01 – 0.05 HCl kg 0.02 – 0.08 0.02 – 0.08 0.02 – 0.08 HF kg 0.002 – 0.004 0.002 – 0.004 Dust kg 0.001 – 0.08 0.001 – 0.08 0.001 – 0.08 0.001 – 0.08 Heavy metals kg 0.003 – 0.02 0.001 – 0.02 0.001 – 0.02 Waste water m³ 0.8 – 1.5 1 – 1.6 1 – 1.6 closed water circuit Source: [141, Special glass 2008]
3.7.2 Emissions to air 3.7.2.1 Raw materials In most special glass processes, silos and mixing vessels are fitted with filter systems which reduce dust emissions to below 5 mg/Nm3. Mass emissions from both filtered and unfiltered systems will clearly depend on the number of transfers and the amount of material handled. However, a characteristic of this sector is that some batch plants are relatively small and due to the specialised nature and lower volumes of some of the products, there is a higher level of manual (and semi-manual) handling and transfer. Emissions from these activities will depend on how well systems are controlled. Clearly where materials containing potentially more toxic compounds (e.g. lead oxide, arsenic, etc.) are handled, there is the potential for emission of these substances.

Chapter 3
140 Manufacture of Glass
3.7.2.2 Melting In the special glass sector, the greatest potential environmental emissions are emissions to air from melting activities. The main substances emitted and the associated sources are identified in Section 3.2.2.1. The wide range and specialised nature of the products of the special glass sector lead to the use of a wider range of raw materials than encountered in most other sectors. For example: CRT funnels and some optical glasses contain high levels of lead of over 20 % and up to 70 %; certain glass compositions may involve the use of specialised refining agents such as oxides of arsenic and antimony; and some optical glasses can contain up to 35 % fluoride and 10 % arsenic oxide. Emissions of fluorides, lead, arsenic and other metals are directly related to the use of compounds which contain these substances in the batch. Due to the diverse nature of the sector, most of the melting techniques described in Chapter 2 can be found. However, the low volumes of production mean that most furnaces are quite small, and the most common techniques are the use of recuperative furnaces, oxy-gas furnaces, electric melters and day tanks. Regenerative furnaces are also used; for example, they were applied for the production of CRT glass and now, more rarely, in the production of borosilicate glass tubes or other glass types (e.g. soda-lime silica glass bulbs). The melting temperatures of special glasses can be higher than for more conventional mass-produced compositions. CRTs, borosilicate glass and glass ceramics, in particular, require melting temperatures of more than 1650 °C. These high temperatures and complex formulations can lead to higher emissions per tonne than for example, soda-lime products. The higher temperatures favour higher rates of volatilisation and NOX formation, and the greater use of nitrate-oxidation agent or sulphate fining agents can result in higher NOX, SO2, and metal emissions. The lower scale of production coupled with higher temperatures also means that energy efficiency is generally lower. Emission levels for a particular furnace can depend on many factors, but principally batch composition, furnace type, abatement techniques utilised, the operation of the furnace and the age of the furnace. Emission levels expressed in kg/tonne of melted glass product are given in Table 3.34 for four different example processes.
3.7.2.3 Downstream activities Emissions from activities downstream of the furnace are very case specific and must be considered for each site. However, there are some general issues. Several types of products may require cutting, grinding and polishing, which could lead to emissions of dust and for some products (e.g. optical glass and CRT funnels and panels), lead may be present in the emissions. These operations are usually carried out under liquid or have air extraction and dust filtration. Thus emission levels are generally very low.
3.7.2.4 Diffuse/fugitive emissions The main sources of diffuse/fugitive emissions specific to the special glass sector may vary with the type of glass article produced. They usually concern the doghouse area of the furnace, forehearth channels, forming area and fire-finishing operations. Emissions from the batch-charging area (doghouse) are related to carryover of batch composition (dust emissions) and combustion gases from the furnace, and are in common with the container and domestic glass sectors.

Chapter 3
Manufacture of Glass 141
When discontinuous furnaces are used for the production of glasses with batch formulations which contain potentially harmful raw materials (e.g. compounds of As, Sb, Pb, F), an extraction system may be present over the charging area of the pot furnace or day tank, conveying the diffusing waste gases to a treatment system. Combustion gases and evaporation products may be released from the forehearth channels. In the forming area, mists of mineral oil and other lubricating products may be released. Combustion gases may arise from the thermal treatment of the moulds and from the annealing lehr. Fire-finishing operations produce combustion gases which are normally released in the ambient atmosphere. Measures to avoid any leakage, spilling and fugitive emissions, together with the control of ammonia usage, are normally applied when SCR and SNCR techniques for NOX abatement are operated in special glass installations. In general, these sources do not give rise to significant emissions to air and most issues are managed according to health and safety regulations.
3.7.3 Emissions to water As with other sectors of the industry, the major water uses include cooling and cleaning, and aqueous emissions will contain the cooling water system purges, cleaning waters and surface water run-off. In general, the cleaning waters do not present any particular issues that would not be common with any industrial facility, i.e. inert solids and potentially oil. Cooling system purges will contain dissolved salts and water treatment chemicals. Surface water quality will depend on the degree of drainage segregation and site cleanliness. However, the diversity of the sector means it is not possible to identify all of the potential emissions, and each case must be assessed specifically. The raw materials used for each product and the processing undertaken must be considered. Any potentially harmful raw materials used on site will have the potential to enter waste water streams, particularly where materials are handled and products are cut or ground. For example, the grinding and polishing of articles, such as CRT funnels and some optical glasses, may generate an aqueous stream which contains the grinding and polishing aids and fine glass containing lead. In general, solids will be removed and the liquid will be recycled as far as practicable, but there will be a certain level of discharge and a potential for spillage. Some quantitative data concerning the specific water consumption and discharges per tonne of melted glass are provided in Table 3.34 above for four example processes.
3.7.4 Other wastes In general, most internally-generated glass waste (cullet) is recycled back to the furnace and waste levels are generally quite low. General wastes from packaging and furnace repairs are the same as with other sectors. Waste from dust control systems and dry scrubbing are recycled to the furnace where practicable. In processes involving grinding and cutting, the sludges separated from the water circuits must be disposed of if they cannot be recycled or reused. Some quantitative data concerning the use of internal cullet back to the melting process is provided in Table 3.34 above, for four example processes.

Chapter 3
142 Manufacture of Glass
3.7.5 Energy For such a diverse sector, it is very difficult to give general information on energy consumption. In Table 3.34 specific energy consumption data for the melting furnaces are indicated for three different types of products, ranging from a minimum of 5 GJ/tonne up to 17 GJ/tonne of melted glass, depending on the type of product, furnace size and melting technique. A wide variation of energy consumption data may be observed depending on the batch formulation, the melting technique, and how the plant is designed and operated. Data in the range of 12 – 16 GJ/tonne of finished product have been reported in particular for soda-lime silica glasses [tm29 Infomil][30, Infomil 1998]. [75, Germany-HVG Glass Industry report 2007] [111, Austrian Special glass plant 2006].
The general description in Section 3.2.3 is applicable to this sector and the discussion of energy efficient techniques in Chapter 4 provides further information. Considerations specific to special glass are that the melting temperatures for special glasses are generally higher than those for mass produced glasses, and that special glass furnaces are, in general, smaller than in other sectors of the glass industry. Both of these factors result in higher CO2 emissions and higher specific energy consumption.
3.8 Mineral wool The information presented in this section relates to the whole range of plant sizes and operations but does not include special modes such as start-up and shutdown. Some of the lowest emission values relate to the operation of only one plant, which achieves these figures for site-specific reasons and the results are not necessarily indicative of BAT for the sector. The major output mass flow is the product, which may be from 55 to 85 % of material input, for stone wool processes, and 75 to 95 % for glass wool processes. An important factor in this is the recycling of process residues which significantly increases the efficiency of raw material utilisation. The losses arise through solid residues, aqueous wastes and emissions to air.
3.8.1 Process inputs The chemical composition of mineral wool can vary widely, and is conventionally expressed in terms of the oxides of the elements it contains. It is difficult to identify a ‘typical’ batch composition for any of the main types of mineral wool, i.e. glass wool, stone wool or slag wool. The basic raw materials are selected and blended to give the final desired glass compositions following melting. The percentage of each raw material in the batch can vary significantly, particularly where substantial amounts of recycled materials are used. The characteristic composition ranges for glass wool, stone wool and slag wool are shown in Table 2.9. The raw materials that may be used to achieve these compositions are shown in Table 3.35. In glass wool, the main oxides are silicon dioxide, boron trioxide, oxides of alkali metals (predominantly sodium and potassium) and oxides of alkali earth metals (predominantly calcium and magnesium). The most significant sources of silicon dioxide are sand and waste glass materials, i.e. external cullet (soda-lime-silica glass) and fibrous wastes. The most significant sources of alkali and alkali earth metal oxides are soda ash, potash, limestone and dolomite. Recycled glass (post-consumer soda-lime-silica flat and container glass or flat glass waste from flat glass production) is extensively used as a raw material for the production of glass wool.

Chapter 3
Manufacture of Glass 143
Table 3.35: Materials utilised in the mineral wool sector Description Materials
Glass wool Silica sand, process cullet, external cullet, process wastes, nepheline syenite, sodium carbonate, potassium carbonate, limestone, dolomite, sodium sulphate, borax, colemanite, ulexite
Stone/slag wool
Basalt, limestone, dolomite, blast furnace slag, silica sands, sodium sulphate, process waste, occasionally wastes from other processes, e.g. foundry sand
Binder materials
Phenol formaldehyde resin (in solution), phenol, formaldehyde and resin catalyst (if resin produced on site), ammonia, urea, mineral oil, silicone, silane, water
Fuels Natural gas, electricity, coke (stone/slag wool only), backup fuels (light fuel oil, propane, butane)
Water Main supply and local natural sources (wells, rivers, lakes, etc.)
Ancillary materials
Packaging materials including plastics, paper, cardboard, and wood. Machine lubricants, predominantly mineral oils. Process gases, nitrogen and oxygen. Water treatment chemicals for cooling water and waste water.
In stone/slag wool, the main oxides are silicon dioxide and oxides of alkali earth metals (predominantly calcium and magnesium). The silicon dioxide is derived principally from basalt, briquetted recycled material and blast furnace slag. The alkali earth metal oxides are derived from limestone, dolomite and briquetted recycled material. Some stone wool and slag wool have significant levels of aluminium oxide, derived from blast furnace slag, basalt and recycled materials. Some low-alumina formulations are produced from batches with significant levels of foundry sand and glass cullet rather than only basalt and slag. The proportion of mineral wool to binder will vary depending on the product application. Typically, mineral wool products contain 95 to 98 % by mass of fibre. Some very rare products will have a maximum of 20 % binder with 1 % mineral oil and 0.5 % of miscellaneous ingredients (e.g. silicone). Stone/slag wool products usually contain lower proportions of binder compared to glass wool products for similar applications. This is because densities of products fulfilling similar application requirements differ between glass wool and stone/slag wool. Stone wool may be up to twice the density of glass wool to achieve the same thermal insulation performance, particularly for low-density products. As with all processes in the glass industry, a significant mass of the raw materials will be released as gases upon melting. This will depend mainly on the amount of recycled material used, but for a typical mineral wool process, the ignition losses will be generally around 10 %. Higher levels may be observed if high levels of carbonaceous materials are used in the batch. Binder raw materials are generally manufactured liquid chemicals, although powdered solid chemicals are sometimes used. Binder formulations are generally considered confidential and are not disclosed. The phenolic resin can be either manufactured on site or bought from an external supplier. This will have little impact on the emissions from the mineral wool process itself, but clearly there are consumption and emission issues associated with resin manufacture. These issues are not covered within the scope of this document and reference should be made to appropriate guidance material for the chemical industry. Water can be used in the production process for cooling, cleaning, and for binder dilution and dispersion, though the extent and methods of use depend upon the manufacturing technique. The basic processes are net users of water with the potential for release of water vapour and droplets from the forming and curing areas. Also, the cullet quench system for glass wool processes will result in water evaporation. Most installations operate a closed-loop process water system with a high level of recycling. Water is brought into the process water system from the mains supply or naturals sources; rain water may also be used in the process. Some water is also brought in with raw materials, particularly binder raw materials. The overall water consumption for mineral wool manufacture is: 3 to 5 m3/tonne of product for glass wool; and 0.8 to 10 m3/tonne of product for stone wool (see also Section 2.9.1 and Figure 2.11).

Chapter 3
144 Manufacture of Glass
3.8.2 Emissions to air [27, EURIMA 1998] [89, EURIMA Suggestions 2007]
In the mineral wool sector, the emissions to air can be divided into three parts; raw materials handling, emissions from melting activities, and emissions from downstream processes or line operations (i.e. fiberising and forming, product curing, product cooling, and product finishing). Emissions from the downstream processes that are difficult to quantify are odours. Odours arise mainly from the curing operation and are thought to be caused by binder breakdown products. This section provides information on process emissions in concentration and mass per unit of output. In Table 3.36 the waste gas volumes for the main process activities are given from which it can be observed that the largest waste gas volume is associated with the fiberising and forming process.
Table 3.36: Waste gas volumes for the main process activities in the mineral wool sector
Process activity Unit Process exhaust volume (in thousands)
Raw materials handling
Nm3/h 1 to 5
Electric Nm3/h 5 to 20 Conventional gas-fired, glass wool Nm3/h 5 to 40 Oxy/gas-fired, glass wool Nm3/h 5 to 40 Combination, glass wool Nm3/h 5 to 40 Cupola Nm3/h 5 to 30 Immersed electric arc Nm3/h 3 to 10
Melting furnace
Conventional gas-fired, stone wool Nm3/h 10 to 50 Fiberising and forming Nm3/h 100 to 400 Product curing Nm3/h 5 to 40 Product cooling Nm3/h 10 to 40 Line
Product finishing Nm3/h 5 to 70 Source: [142, EURIMA August 2008]
3.8.2.1 Raw materials In most modern glass wool processes, silos and mixing vessels are fitted with filter systems which reduce dust emissions to below 5 mg/Nm3. Mass emissions from both filtered and unfiltered systems will clearly depend on the number of transfers and the amount of material handled. It should be noted that glass wool raw material batches tend to be dry and pneumatically conveyed. Therefore, the potential for dust emissions from raw material handling may be higher than in some other sectors. Stone wool processes generally use coarse raw materials with particle diameters of >50 mm. The materials are stored in silos or bays and are handled using manual systems and conveyors. There is the potential for windborne dust during storage and handling, particularly during dry weather. A range of techniques can be used to control dust emissions, e.g. enclosure of bays and conveyors and damping of stock piles. The level of releases is difficult to quantify and will depend largely on the amount of material handled and how well these techniques are applied. Production waste transformed into cement-bonded briquettes is often used in the batch formulation; typically it contains around 0.22 % sulphur and can be used at up to 100 % of the batch. A charge containing no cement briquettes and no blast furnace slag can reach values from 500 to 1000 mg/Nm3 SO2, and a charge containing 100 % cement briquettes will emit from 2000 to 2500 mg SO2 per Nm3. Variations are due to the different contents of sulphur in coke, controlling techniques applied, flue-gas volumes, oxidation states inside the cupola, and on variations in sulphur content of the volcanic rock (diabase) used in the process. In some

Chapter 3
Manufacture of Glass 145
Member States, total recycling of waste briquettes is not practiced, in order to limit SOx emissions and ensure concentration values of below 1500 mg/Nm3. In these cases, a recycling rate of about 45 % is applied and the exceeding waste is treated (Germany). In other cases, emissions in the range of 1400 – 1800 mg/Nm3 SO2 are reported in spite of high recycling rates, which are between 85 – 100 % (Denmark). The approach used by different Member States can be significantly diverse, based on the priority given to the outputs of the production cycle, the minimisation of waste and energy reduction versus SOx emission reduction. Figure 3.9 shows the expected concentration of SO2 based on the percentage of cement briquettes recycled with the batch charge in the cupola furnace. At the time of writing (2010), the recycling of cements briquettes of up to 100 % is widely applied in order to prevent a waste stream; otherwise, the waste is handled by an external recycling facility or disposed into landfill.
Source:[89, EURIMA Suggestions 2007]
Figure 3.9: Expected concentration of SO2 depending on the percentage of cement briquettes recycled with the batch charge in the cupola furnace
The lower line presented in Figure 3.9 is based on a low coke percentage (10 %), low sulphur content in the coke (0.6 %) and no sulphur in the diabase. The upper line represents a higher coke percentage (13 %), 0.7 % sulphur in the coke, and 0.05 % sulphur in the diabase. The sulphur content in the cement briquette is, in both cases, 0.22 %. The fraction of sulphur supplied with the batch formulation that is emitted is estimated at 50 % for the diabase, and 75 % for the coke and the briquette. These figures are based on experience and are mainly dependent on the oxidation states inside the cupola furnace. Uncertainty due to the variations in flow, etc., is around 20 %. Typically, an estimation of the final SO2 concentration may be calculated by means of the following equation: SO2 (mg/Nm3) = 750 + 15 × briquette share (%).
3.8.2.2 Melting [27, EURIMA 1998] [89, EURIMA Suggestions 2007]
Glass wool furnaces are predominantly air-gas-fired (usually with an electric boost), but with a substantial number of electrically-heated furnaces and a smaller number of oxy-gas-fired furnaces. Stone wool furnaces are nearly all coke-fired cupolas with a few examples of gas-fired or electrically-heated furnaces. The substances emitted and the associated sources are identified in Section 3.2.2.1. Where relevant to the pollution control techniques, the mechanism of emissions formation is discussed in more detail in Chapter 4.

Chapter 3
146 Manufacture of Glass
Stone wool cupola furnaces have several important differences from more conventional glass furnaces, which can affect the emissions from the process. One of the most significant is the fact that cupolas operate under strong reducing conditions. Therefore, emissions of NOX are relatively low; part of the sulphur released from the fuel or raw materials is reduced to hydrogen sulphide, and the level of carbon monoxide is high. Most processes have an afterburner system installed which oxidises the hydrogen sulphide to sulphur dioxide and the carbon monoxide to carbon dioxide. The coke and raw materials may contain higher levels of metals, chlorides and fluorides than in some other glass processes, giving rise to higher emissions of these substances. An increasingly important factor affecting the emissions from the melting process is the contribution from recycled materials. If fibre which contains binder is recycled to the furnace, the organic component must be considered. In glass wool furnaces, it may be necessary to add oxidising agents such as potassium nitrate, which may have the effect of increasing NOXemissions. When high amounts of recycled cullet are used in the batch formulation, manganese (IV) oxide might be employed as the oxidising agent. In stone wool processes, cement is often used for briquetting process residues, and when the briquettes are melted, there are consequent emissions of SO2 due to their sulphur content. Table 3.37 shows the full range of emissions from mineral wool melting furnaces in the EU-27, referring to the year 2005, with data given both in concentrations (mg/Nm3) and emission factors (kg/tonne of melted glass). Data presented in the table show a wide range of emissions related to all type of installations, with and without abatement techniques. A more detailed description of the emission ranges associated with each melting technique and operating condition is presented in Table 3.37–Table 3.41.
Table 3.37: Full range of emissions from mineral wool melting furnaces in the EU-27, for 2005 Glass wool
(100 % collected data) Stone wool
(100 % collected data) Type of furnace Electric Recuperative Oxy-gas Cupola Immersed
electric arc Fuel-fired
Substance (1) mg/Nm3
(kg/t) mg/Nm3
(kg/t) mg/Nm3
(kg/t) mg/Nm3
(kg/t) mg/Nm3
(kg/t) mg/Nm3
(kg/t) Particulate
matter 0.2 – 128
(0.001 – 0.4) 0.3 – 35
(0.03 – 0.1) 0.2 – 20
(0.001 – 0.016) 0.25 – 1700 (0.04 – 3.5)
4 – 12 (0.006 – 0.02)
10 (0.02)
SOX, as SO20.4 – 120
(0.001 – 0.02) 1 – 30
(0.002 – 0.5) 0.5 – 115
(0.002 – 0.32) 4 – 2600 (0.01-4.8)
335 – 350 (0.4 – 0.5)
285 (0.45)
NOX, as NO2 (2) 13 – 580 (0.5 – 2.0)
50 – 1200 (0.3 – 10.6)
9 – 240 (0.02 – 0.4)
35 – 615 (0.07 – 1.7)
80 – 150 (0.1 – 0.2)
815 (1.3)
HF 0.1 – 3.0 (0.001 – 0.01)
0.13 – 20 (0.001 – 0.05)
0.09 – 3.2 (0.001 – 0.01)
0.1 – 11 (0.001 – 0.02)
8(0.01)
1.2 (0.002)
HCl 0.1 – 4.5 (0.001 – 0.02)
0.2 – 7 (0.001 – 0.06
0.55 – 3 (0.001 – 0.003)
0.7 – 150 (0.001 – 0.26)
43 (0.05)
5(0.008)
Average No of results 9 7 5 32 2 1
(1) Concentration values refer to 273 K, 1013 hPa and dry gases. Emission factors are expressed in kg per tonne of melted glass.
(2) The lower levels of NOX are from oxy-gas fired furnaces. Source: [93, EURIMA data tables 80% 2007]
In Table 3.38, the values concerning dust emissions from electric and gas-fired furnaces applied in the production of glass wool are given. Data refer to measurements carried out one or more times on the melting furnaces of the survey, during the reference period (2005). For the full range of data (100 %), the average, minimum and maximum values are given. For a better understanding, values referring respectively to 75 % and 50 % of data are also presented, with the aim to exclude spurious data points as much as possible.

Chapter 3
Manufacture of Glass 147
Table 3.38: Dust emissions from melting furnaces for glass wool production (year 2005) Dust emissions from glass wool melting furnaces
mg/Nm3 dry gas Type of furnace Reported data
N°values Average Min. Max.
Electric furnace 100 % 15 33 0 188 75 % 37 No secondary abatement 50 % 9
100 % 19 36 0 274 75 % 47 With bag filter 50 % 20
100 % 9 9 0 17 75 % 15 With ESP 50 % 9
Gas/air- fired furnace 100 % 7 189 8 651 75 % 552 No secondary abatement 50 % 29
100 % 33 20 2 90 75 % 27 With ESP 50 % 15
Gas/oxygen- fired furnace 100 % 21 5 1 19 75 % 6 With ESP 50 % 4
100 % 27 7 1 76 75 % 8 With electric boosting and ESP 50 % 3
Source: [142, EURIMA August 2008]
Values reported in Table 3.38, being the result of a survey carried out within the glass wool production sector, are related to different measuring protocols and operating conditions with the consequence that some data may be contradictory or inconsistent. As an example, the difference between dust emission concentrations from unabated and abated electric furnaces seems quite marginal; this is probably due to the relatively low dust concentration measured (in many cases) on unabated electric furnaces, which are of the same order of magnitude as the typical concentrations measured after a depollution system. In Table 3.39, the values concerning SOX emissions from electric and gas-fired furnaces for glass wool production are presented. Data refer to measurements carried out on one or more occasions on the melting furnaces covered by the survey during the reference period (2005). The full range of data (100 %) is given with the average, minimum and maximum values. It can be observed that SOX emissions are significant only in the case of fuel-fired furnaces. As for the dust emission concentration values, the data reported in Table 3.39 for electric furnaces may present inconsistencies due to the low levels of SOX emissions to be measured. Concerning the case of gas/oxygen-fired furnaces, the use of electric boosting causes a reduction of the flue-gas volume with a consequent, possible increase of the emissions given in concentration (mg/Nm3). A different trend might have been observed if emission data were given in kg/tonne melted glass; however, this information is not available.

Chapter 3
148 Manufacture of Glass
Table 3.39: SOX emissions from melting furnaces for glass wool production (year 2005) SOX emissions from glass wool melting furnaces
mg/Nm3, dry gas (as SO2)Type of furnace Reported data
N°values Average Min. Max.
Electric furnace No secondary abatement 100 % 8 2 1 6 With bag filter 100 % 12 5 0 13 With ESP 100 % 8 3 0 14 Gas/air-fired furnace No secondary abatement 100 % 7 34 1 133 With ESP 100 % 32 22 0 119 Gas/oxygen-fired furnace With ESP 100 % 17 10 0 63 With electric boosting and ESP 100 % 27 28 2 98 Source: [142, EURIMA August 2008]
In Table 3.40, the values concerning NOX emissions from electric and gas-fired furnaces for glass wool production are given. Data refer to measurements carried out one or more times on the melting furnaces of the survey during the reference period (2005).
Table 3.40: NOX emissions from melting furnaces for glass wool production (year 2005) NOX emissions from glass wool melting furnaces
mg/Nm3, dry gas (as NO2)Type of furnace (1) Reported data
N°values Average Min. Max.
Electric furnace 100 % 15 204 36 429 75 % 245 No secondary abatement 50 % 175
100 % 21 234 4 670 75 % 442 With bag filter 50 % 468
100 % 9 514 13 1071 75 % 970 With ESP 50 % 232
Gas/air-fired furnace 100 % 7 410 93 1031 75 % 429 No secondary abatement 50 % 356
100 % 31 636 110 1580 75 % 800 With ESP 50 % 601
Gas/oxygen-fired furnace 100 % 20 119 7 244 75 % 170 With ESP 50 % 116
100 % 27 215 82 691 75 % 242 With electric boosting and ESP 50 % 154
(1) The reference to different categories of operating conditions (no secondary abatement, with ESP and with bag filter, etc.) is made only for consistency with emission data reported in Table 3.37and Table 3.38, being derived from the same source of information. No influence on NOX emissions is expected from the application of a filtration system; while, an increase of the concentration of NOX emissions (mg/Nm3) might be observed when electric boosting is applied, being associated with a reduction of the flue-gas volume.
Source: [142, EURIMA August 2008]

Chapter 3
Manufacture of Glass 149
For the full range of data (100 %), the average, minimum and maximum values are given. For a better understanding, values referring respectively to 75 % and 50 % of data are also presented, with the aim to exclude spurious data points as much as possible. Values presented in Table 3.40 represent different operating conditions; in particular, the quantity of nitrates that may be added to the batch composition, when high levels of external cullet are used, may vary significantly. For these reasons, a comparison of the data presented in the table is difficult and the data should be assessed together with additional information on the specific operational parameters. In Table 3.41, the values concerning other emissions (HCl, HF, CO) from electric and gas-fired furnaces for glass wool production are presented. Data refer to measurements carried out on one or more occasions on the melting furnaces of the survey, during the reference period (2005). The full range of data (100 %) is given with the average, minimum and maximum values. From the table it can be observed that HCl, HF emissions from glass wool melting furnaces are generally low.
Table 3.41: HCl, HF and CO emissions from melting furnaces for glass wool production (year 2005)
Emissions of HCl, HF and CO from glass wool melting furnaces (100 % reported data)
mg/Nm3, dry gas (1)Type of furnace Substance N° values Average Min. Max.
Electric furnace HCl 12 2 0 7 HF 12 0.6 0.1 2.8 No secondary abatement CO 6 63 24 110 HCl 6 3 0 7 HF 3 0.7 0.1 1.0 With bag filter CO 6 55 17 176 HCl 7 2 0 7 HF 8 0.7 0.1 3.1 With ESP CO 4 264 114 638
Gas/air-fired furnace HCl 4 6 5 7 HF 4 2.4 0.6 3.3 No secondary abatement CO 3 165 61 280 HCl 32 3 0 19 HF 32 3.0 0.1 20.0 With ESP CO 8 7 1 20
Gas/oxygen-fired furnace HCl 16 1 0 5 HF 16 0.4 0 2.6 With ESP CO 7 42 3 121 HCl 27 3 0 32 HF 27 0.8 0.1 2.3 With electric boosting and ESP CO 19 36 2 241
(1) Data relate to different measuring and operating conditions. Due to the relatively low initial concentrations of HCl and HF emissions, a dry scrubbing system may not be applied in combination with the ESP or bag filter.
Source: [142, EURIMA August 2008]
In the production of stone wool, the use of coke, diabase and cements briquettes involves a wider range of emissions and substances to be released into the atmosphere. Data concerning emissions from cupola furnaces and immersed arc electric furnaces are presented in Table 3.42 and Table 3.43.

Chapter 3
150 Manufacture of Glass
In Table 3.42, emission values concerning the main pollutants (dust, SOX, NOX, HCl and HF) from melting furnaces applied in the production of stone wool are given. Data refer to measurements carried out on one or more occasions on the melting furnaces of the survey, during the reference period (2005). For the full range of data (100 %), the average, minimum and maximum values are given. For a better understanding, values referring to 75 % and 50 % of data are also presented, with the aim to exclude spurious data points as much as possible. The difference observed between SOX emissions from cupola furnaces and immersed arc electric furnaces is due to the recycling of cement briquettes, which may vary from 0 % up to 100 %.
Table 3.42: Dust, SOx, NOx, HCl and HF emissions from melting furnaces for stone wool production (year 2005)
Emissions from stone wool melting furnaces mg/Nm3 dry gas Substance/type
of furnace Reported data N° values Average Min. Max.
Dust emissions 100 % 274 38 0 783 75 % 42 Cupola furnace (1)50 % 11
100 % 10 28 4 57 75 % 42 Immersed arc electric
furnace 50 % 25 SOX, as SO2
100 % 353 1220 0 5555 75 % 1590 Cupola furnace 50 % 1143
100 % 12 318 177 503 75 % 435 Immersed arc electric
furnace 50 % 320 NOX, as NO2
100 % 349 244 0 769 75 % 350 Cupola furnace 50 % 225
100 % 11 201 68 407 75 % 283 Immersed arc electric
furnace 50 % 160 HCl
100 % 184 29 0 156 75 % 35 Cupola furnace 50 % 14
100 % 6 39 18 53 75 % 49 Immersed arc electric
furnace 50 % 47 HF
100 % 186 2.5 0 40.0 75 % 3 Cupola furnace 50 % 1
100 % 6 11 5.0 21.0 75 % 14 Immersed arc electric
furnace 50 % 11 (1) Lower values are associated with the use of a bag filter. Source: [142, EURIMA August 2008]
In Table 3.43, emission values are presented concerning other pollutants associated with the production of stone wool (H2S, CO, CO2, metals). Data refer to measurements carried out on one or more occasions on the melting furnaces of the survey during the reference period (2005).

Chapter 3
Manufacture of Glass 151
For the full range of data (100 %), the average, minimum and maximum values are given. For a better understanding, values referring to 75 % and 50 % of data are also presented, with the aim to exclude spurious data points as much as possible. From the table, it can be observed that cupola furnaces equipped with a waste gas incinerator present much lower concentrations of CO emissions, when compared to immersed arc electric furnaces; on the other hand, the associated CO2 emissions increase due to the oxidation of most of the carbon monoxide (CO) present in the waste gas.
Table 3.43: Emissions of H2S, CO, CO2 and metals emissions from melting furnaces for stone wool production (year 2005)
Emissions from stone wool melting furnaces mg/Nm3 dry gas Substance/type of furnace Reported data N° values Average Min. Max.
H2S100 % 97 1 0 11 75 % 1 Cupola furnace (1)50 % 0
100 % 4 1 0 2 75 % 2 Immersed arc electric furnace 50 % 1
CO 100 % 80 36 0 260 75 % 33 Cupola furnace (1)50 % 17
100 % 11 880 7 3126 75 % 990 Immersed arc electric furnace 50 % 859
CO2100 % 150 228505 170 410400 75 % 233081 Cupola furnace 50 % 232181
100 % 8 59750 45802 79509 75 % 66717 Immersed arc electric furnace 50 % 58037
Metals (group 1) (2)100 % 48 0.2 0 1.1 75 % 0.3 Cupola furnace 50 % 0.1
100 % 2 0.2 0.1 0.4 75 % Immersed arc electric furnace 50 % 0.4
Metals (group 2) (2)100 % 38 0.5 0 14 75 % 0.1 Cupola furnace 50 % 0.03
100 % 2 1.1 0.8 1.3 75 % Immersed arc electric furnace 50 % 1.3
(1) Values refer to cupola furnaces equipped with a waste gas incinerator. (2) Metals are grouped on the basis of their potential environmental impact (see Section 3.2.2.1): Group 1 (As,
Co, Ni, Cd, Se, CrVI); Group 2 (Sb, Pb, CrIII, Cu, Mn, V, Sn). Source: [142, EURIMA August 2008]

Chapter 3
152 Manufacture of Glass
3.8.2.3 Downstream activities [27, EURIMA 1998] [89, EURIMA Suggestions 2007]
As discussed in Section 2.9, mineral wool products usually contain a proportion of phenolic resin-based binder. The binder solution is applied to the fibres in the forming area and is cross-linked and dried in the curing oven. The forming area waste gas will contain particulate matter, phenol, formaldehyde and ammonia. Emissions of HCN have been found in the exhaust gases of the curing oven at stone wool production installations; however, no data are available. The particulate matter consists of both organic and inorganic material, often with a very small particle size. Lower levels of VOC and amines may also be detected if they are included in the binder system. Due to the nature of the process, the gas stream has a high volume and high moisture content. The releases from the oven will consist of volatile binder materials, binder breakdown products, water vapour and combustion products from the oven burners. After exiting the oven, the product is cooled by passing a large quantity of air through it. This gas is likely to contain mineral wool fibre and low levels of organic material. Product finishing involves cutting, handling and packaging, which can give rise to dust emissions. An important factor that has a major impact on emissions from forming, curing and cooling is the level of binder applied to the product, as higher binder content products will generally result in higher emission levels. Binder-derived emissions depend essentially on the mass of binder solids applied over a given time, and therefore, high binder content, and to a lesser extent high-density products, may give rise to higher emissions. Products are normally classified as low, medium and high density, covering a range of between 10 and 80 kg/m3, with a binder content of 5 – 12 %. As reported in Section 3.8.2, Table 3.35, the waste gas volume associated with fiberising and forming operations is much higher than that of product curing (about 10 times higher). Table 3.44 below shows the full range of emissions from downstream activities for glass wool plants in the EU referring to the year 2005 with values given both in concentrations (mg/Nm3)and emission factors (kg/tonne of product).

Chapter 3
Manufacture of Glass 153
Table 3.44: Full range of emissions from downstream activities in the glass wool production sector for the year 2005
Emissions from glass wool downstream activities(1)Combined fiberising, forming and curing
Fiberising and forming Product curing Product cooling Substance
mg/Nm3
(kg/t product) mg/Nm3
(kg/t product) mg/Nm3
(kg/t product) mg/Nm3
(kg/t product) 4.4 – 128 11.4 65.2 12.5 Particulate
matter (0.11 – 5.23) (0.68) (0.27) (0.04) 0.25 – 20 1.63 0.81 Phenol (0.009 – 0.93) (0.093) (0.0034) 0.3 – 16 1.71 1.13 Formaldehyde (0.04 – 0.48) (0.091) (0.014) 6 – 130 21.95 109 Ammonia (0.3 – 6.5) (1.13) (0.69)
7.7 5.82 Oxides of Nitrogen (NOX) (0.2) (0.18)
2 – 47.5 11.2 20.1 Volatile organic compounds (0.11 – 2.76) (0.56) (0.09)
5236 Carbon dioxide (194) Average number of results 15 3 3 1
(1) Data refer to all types of emission control techniques. Source: [93, EURIMA data tables 80% 2007]
Table 3.45 below shows the full range of emissions from downstream activities of stone wool plants in the EU for the year 2005, with values given both in concentrations (mg/Nm3) and emission factors (kg/tonne melted glass).
Table 3.45: Full range of emissions from downstream activities in the stone wool production for the year 2005
Emissions from stone wool downstream activities(1)Combined
fiberising, forming and curing
Fiberising and forming
Product curing
Product cooling Substance
mg/Nm3
(kg/t product) mg/Nm3
(kg/t product) mg/Nm3
(kg/t product) mg/Nm3
(kg/t product) 3 – 40 2 – 102 0.5 – 65 3.2 – 61.8 Particulate matter (0.08 – 1.8) (0.06 – 1.7) (0.001 – 0.68) (0.008 – 0.41) 2 – 40 0.11 – 40 0.05 – 60 0.05 – 17 Phenol (0.09 – 1.8) (0.0035 – 1.36) (0.0004 – 0.27) (0.0002 – 0.12) 3 – 11 0.3 – 15 0.1 – 25 0.05 – 12 Formaldehyde (0.12 – 0.28) (0.06 – 0.43) (0.00025 – 0.09) (0.0007 – 0.04)
12 – 67 0.3 – 113 0.3 – 347 1 – 30 Ammonia (0.47 – 2.44) (0.009 – 3.04) (0.005 – 2.35) (0.007 – 0.16) 16 – 80 6.2 – 125 15 – 300 43.3 Oxides of
nitrogen (NOX) (0.4 – 3.56) (0.16 – 5.36) (0.04 – 1.37) (0.12) 1 – 7.4 6 Volatile organic
compounds (0.01 – 0.13) (0.02) 0.07 – 0.09 0.05 – 0.08 0.04 – 0.35 Amines (0.0013 – 0.0017) (0.0001 – 0.0002) (0.0001 – 0.0002)
Average number of results 2 23 29 15
(1) Data refer to all types of emission control techniques. Source: [93, EURIMA data tables 80% 2007]

Chapter 3
154 Manufacture of Glass
A detailed description of the emission levels related to the application of the different abatement techniques applied to the glass wool and stone wool productions is given in Section 4.5.6, Table 4.40.
3.8.2.4 Diffuse/fugitive emissions The main sources of diffuse/fugitive emissions in the mineral wool sector are related to the batch charging area and forehearth channels (for glass wool only), the storage and preparation of the coating formulations and the cutting, handling and packaging operations. The melting furnaces used in stone wool production are totally enclosed and do not present potential diffuse/fugitive emissions and there is no presence of forehearths. Local exhaust ventilation systems are often used to supply the necessary ventilation to the working area near the melting furnace with consequent discharge of the potential diffuse/fugitive emissions internally or externally. Dedicated and enclosed spaces are normally adopted for the storage and preparation of coating formulations in order to limit the exposure of the workers to potential emissions. Local exhaust ventilation systems are used for the cutting, handling and packaging of the finished products.
3.8.3 Emissions to water Under normal operating conditions, the processes are net consumers of water and aqueous emissions are very low. Most processes operate a closed-loop process water system, and where practicable cooling water blow-down and cleaning waters are fed into that system. If they are incompatible or if the volumes are too great, they may have to be discharged separately, but many plants have a holding tank to accommodate volume overloads, which can then be bled back into the system. At some plants, clean warmed cooling water is discharged to a sewer or a natural watercourse. Small amounts of contaminated waste water may arise from chemical bunds, spillages and oil interceptors, etc. and these are usually discharged to the process water system, transported for off-site treatment, or discharged to a sewer. The large volume of the process water system causes a potential for contamination of clean water circuits such as surface water and cullet quench water. If systems are poorly designed or not properly controlled, more serious emissions may arise. If wet scrubbing techniques are used, particularly chemical scrubbing, the effluent may not be compatible with the process water system, giving rise to a further waste stream. An example of the water circuit for the glass wool production is presented in Section 2.9.1, Figure 2.11.

Chapter 3
Manufacture of Glass 155
3.8.4 Other wastes [27, EURIMA 1998] [89, EURIMA Suggestions 2007]
The main sources of solid waste for mineral wool production are given below. • Spillages from batch raw materials handling. • Process cullet produced by quenching hot melt in water during fiberising machine bypass
in glass wool production. • Unfiberised melt from stone wool processes during fiberising machine bypass. • Dust collected from abatement systems, mainly electrostatic precipitators and bag filters. • Shot from stone wool fiberising. This is heavy, non-fibrous and semi-fiberised material
that is too heavy to reach the collection belt and is collected below the fiberising machine. Around 10 to 20 % of the melt hitting the fiberising machine forms shot.
• Product edge trims. • Waste wool created during product changeovers, line stoppages or out-of-specification
products. • Waste from stone wool filters, which has a high organic content, often around 50 %. • Iron and melt from stone wool cupola tap outs. • Mixed melt and stone from cupola shutdowns. • Solid waste from process water circuit filtration. This represents 0.5 to 2.0 % of process
throughput; it consists of fibre, binder solids and up to 50 % moisture. • Packaging waste and other general waste. • Refractory waste from furnace rebuilding. In glass wool production, it is common to recycle batch spillages, glass wool cullet, and dust collected from abatement systems directly to the furnace. Part of the glass wool waste cannot be recycled directly to the melting furnace due to the presence of organic binder unless appropriately treated for the removal of the organic fraction. In stone wool processes, shot, bypass melt, and dust from abatement systems are generally recycled if a briquetting process is in use. Fibrous waste can be recycled by grinding and including it in the briquettes, but again this only occurs if a briquetted recycling system is in operation at the installation. However, edge trims are usually shredded and recycled to the forming area and, in some cases, the dry waste product can be shredded to produce a blowing wool product. Cupola shutdown and tap out waste can theoretically be recycled through the briquetting system, but this is not common. This material is inert and can be used as filling material (e.g. road fill). The metallic iron which accumulates at the bottom of the cupola can be collected with an appropriate special mould before it mixes with stone waste, in order to avoid separation, which would cause dust emissions, and facilitate the possibility of external recycling of the material. The metallic iron from the waste can be sold as scrap iron, but there is little financial incentive to do this. The high levels of recycling for the different wastes associated with the production cycle might cause emissions of metals from the melting process of stone wool. An estimate of the percentage of waste recycled in the mineral wool sector is not currently available. However, Table 3.46 below gives an indication of current practice; some plants apply recycling while others do not.

Chapter 3
156 Manufacture of Glass
Table 3.46: Mineral wool sector solid waste generation and disposal Glass wool Stone and slag wool
Total waste generated as a percentage of product output 0 – 15 % 20 – 60 % Percentage of total waste recycled 5 – 100 % 5 – 100 % Percentage of total wasted disposed of off-site 0 – 100 % 0 – 100 %
3.8.5 Energy [27, EURIMA 1998][15, ETSU 1992] [89, EURIMA Suggestions 2007]
The predominant energy sources for glass wool melting are natural gas and electricity. Stone wool is predominantly produced in cupola furnaces which are fuelled by coke and there are some examples of gas-fired and electrically-heated furnaces. Natural gas is also used in substantial quantities for fiberising and curing. Electricity is used for general services and light fuel oil, propane and butane are sometimes used as backup fuels. There are a number of oxy-gas- fired furnaces applied to the sector. The three main areas of energy consumption are melting, fiberising and curing. The split can vary greatly between processes and is very commercially sensitive. Table 3.47 shows the total energy consumption in mineral wool production, with a breakdown into the main process areas. The values for fiberising, curing and other consumption are estimates.
Table 3.47: Energy use in mineral wool production Glass wool Stone/slag wool Energy distribution GJ/tonne finished product GJ/tonne finished product
Total energy consumption 9 – 20 7 – 14 % of total energy % of total energy
Melting 20 – 45 60 – 80 Fiberising 25 – 35 2 – 10 Curing 25 – 35 15 – 30 Other 6 – 10 5 – 10 Source:[89, EURIMA Suggestions 2007]
Direct energy consumption for electrical melting is in the range of 2.7 to 5.5 GJ/tonne finished product. Energy consumption for electrical melting is approximately one third of that required for 100 % air-gas melting and the relative energy consumption of each process stage can be estimated accordingly. With these values, the inherent error in such an estimate is very high, but they give an indication of the energy consumption. A significant percentage of external cullet (mainly soda-lime-silica glass) is commonly used in the batch composition in glass wool production with a consequent high influence on the furnace energy consumption. However, there are many technical constraints to the use of cullet, such as a suitable chemical composition and the presence of contaminants (organic materials, bulk metals, etc.).

Chapter 3
Manufacture of Glass 157
3.9 High temperature insulation wools [9, IPC Guidance S2 3.03 1996] [41, ECFIA 1998] [143, ECFIA November 2008]
The main output for high temperature insulation wools production is bulk wool and blankets. The yield from raw materials to melt is generally greater than 90 % and the yield from melt to finished product (blanket/bulk) ranges from 55 to 95 %. However, it is important to note that the yield from melt to finished product is an estimate and may vary according to the type, nature, volume and duration of the production. In particular, the lowest level corresponds to specific and more technically difficult productions.
3.9.1 Process inputs High temperature insulation wool includes amorphous alkaline earth silicate glass wool (AES) and aluminium silicate glass wool: refractory ceramic fibres (ASW/RCF). Polycrystalline wools (PCW) are not covered in this document, due to the different chemical processes applied for production. There are two main product formulations for aluminium silicate wools: high purity alumina-silicate and zirconia alumina-silicate and four main product formulations for AES wools: calcium-silicate glass wool, calcium-magnesium-silicate wool, calcium-magnesium-zirconium-silicate wool, magnesium silicate wool, the compositions of which are given in Section 2.10. The main raw materials are given in Table 3.48; they are a combination of natural (usually processed) and synthetic substances.
Table 3.48: Materials utilised in the high temperature insulation wools sector Description Materials
Raw materials for melting
Oxides of aluminium, calcium, magnesium, silicon and zirconium. Also smaller levels of oxides of potassium, sodium, titanium, iron and chromium utilised in the amorphous high temperature wools sector
Secondary processing
For vacuum forming, a wet colloidal mixture of starch, latex, silica or clay is used. Other activities may use similar substances and sometimes fillers and organic polymers or resins
Fuels Electricity, natural gas, and sometimes light fuel oils (backup, heating) Water Mains supply and local natural sources (wells, rivers, lakes, etc.)
Ancillary materials
Packaging materials including plastics, paper, cardboard, and wood. Mineral oils (fibre coating and other general uses). Water treatment chemicals for cooling water and waste water
The raw materials for the melt are blended to give the required compositions on melting. In general, over 90 % of the composition of ASW/RCF is derived from silicon dioxide, aluminium and zirconium. Silicon dioxide is derived mainly from high-grade silica sand; aluminium oxide (alumina) can occur naturally but is usually derived by processing bauxite. Zirconium dioxide occurs naturally as baddeleyite or can be manufactured. Other components such as calcium oxide and magnesium oxide used for AES are derived from raw material such as dolomite and lime. Waste materials are recycled if possible either directly to the furnace as powders and sometimes into the products as wool. Secondary processing can be very specific. The substances identified in Table 3.48 for vacuum forming are common but others may vary widely. The main uses of water in the high temperature insulation wool sector are for cooling circuits and cleaning. Cooling water is used, usually in closed circuits, to cool various pieces of equipment with corresponding losses from evaporation and purges. Water is also used in vacuum forming operations and for boards and papers. Actual water consumption and water

Chapter 3
158 Manufacture of Glass
vapour emissions may vary according to local conditions (e.g. ambient temperature and the hardness of water input). The energy source for melting is exclusively electricity but natural gas is often used for downstream activities, particularly drying.
3.9.2 Emissions to air 3.9.2.1 Raw materials In most modern high temperature insulation wool processes, silos and mixing vessels are fitted with filter systems which reduce dust emissions to below 5 mg/Nm3. Mass emissions from both filtered and unfiltered systems will depend on the number of transfers, and the amount of material handled.
3.9.2.2 Melting Emissions from melting are generally very low consisting mainly of dust from raw materials used in the batch composition charged to the furnace. The raw materials are usually very pure and consist almost exclusively of oxides; therefore, there is little degassing and no significant emissions of gaseous compounds. Most furnaces are served by an extraction system that vents via a bag filter. Dust emissions are generally below 20 mg/Nm3.
3.9.2.3 Downstream activities Dust and fibrous dust releases can be generated from a number of areas within the process which include: fiberisation and collection, needling, lubricant burn-off, slitting, trimming, cutting, packaging, and areas of secondary processing. All areas where particulate or fibrous dust releases may be generated are usually served by an efficient extraction system which vents to a fabric filter system. Dust emissions are generally below 20 mg/Nm3 and fibre emissions are in the range of 1 – 5 mg/Nm3. Low levels of organic emissions may also occur from some secondary processing activities, in particular from drying, and the related emission levels are usually less than 50 mg/Nm3.
3.9.2.4 Diffuse/fugitive emissions The main source of diffuse/fugitive emissions in the high temperature insulation wool sector is related to the cutting, handling and packaging operations. Storage of lubricants used to soften the wools (polyethylene glycol solution) may represent a minor source of diffuse/fugitive emissions in the case of spillage. Normally, cutting operations are performed with machines equipped with a vacuum system that conveys fibrous dust to a bag filter. Packaging and handling operations are carried out by applying a vacuum suction to the cardboard boxes. The specific issues related to the potential diffuse emissions of fibrous dust are normally managed by health and safety regulations at work and they are controlled according to workplace exposure levels. In particular, exposure to aluminium silicate glass wool (ASW/RCF) is carefully controlled in the workplace, this material being classified as a Category 2 carcinogen (see Commission Directive 2009/2/EC).

Chapter 3
Manufacture of Glass 159
3.9.3 Emissions to water As discussed earlier, the main uses of water in this sector are cleaning, cooling, and for vacuum forming and other secondary processing. The aqueous emissions are limited to the cooling water system purges, cleaning waters and surface water run-off. The cleaning waters do not present any particular issues that would not be common with any industrial facility, i.e. inert solids and oil. Cooling system purges will contain dissolved salts and water treatment chemicals. Surface water quality will depend on the degree of drainage segregation and site cleanliness. Water used for vacuum forming is recycled with a purge, which may contain low levels of organic substances. Simple abatement techniques such as settlement, screening, oil separators, and neutralisation can be found within the sector.
3.9.4 Other wastes [41, ECFIA 1998] [143, ECFIA November 2008]
Waste levels are generally low in the HTIW sector. Wherever possible, waste materials (batch, edge trims, etc.) are recycled either directly to the furnace (which requires processing for wools) or into the products. At the end of a furnace campaign (in general, every six months), the refractory structure is dismantled and replaced. The material generated from dismantling can be used in other productions processes after milling into powder (e.g. for brick production and as sandblasting material). About 95 % of the powdered material and other solid waste are reused. Waste is also produced in the form of the material collected in the dust abatement equipment. In general, this material is not recycled directly to the furnace. Potential contamination and uncertainty over composition make this difficult but some initiatives are underway to address the issue. Due to the nature of the material, it can be expensive to dispose of and this helps to provide an incentive to finding alternatives, so the tendency to produce waste is decreasing due to the price increase for waste disposal, energy and raw material. Most mineral raw materials are delivered in bulk (via silo tracks) and do not give rise to packaging waste. Waste materials from product packaging operations (plastic, cardboard, wood, etc.) are usually reused or recycled if practicable. Other waste non-specific to the sector is disposed of by conventional means, or recycled where local or national schemes permit it. The EU ASW/RCF and AES sector as a whole produces around 700 – 900 tonnes per year of waste which contains fibres, and 100 – 700 tonnes of other waste.
3.9.5 Energy [41, ECFIA 1998]
There is little information available on energy use within the ASW/RCF and AES sector. Melting is exclusively electrically heated with very low volatile losses. Therefore, the direct melting efficiency (excluding off-site issues) is quite high, although the composition has a high melting energy requirement and the furnaces are relatively small. The energy consumption ranges from 6.5 – 16.5 GJ/tonne of melted product. The energy consumption for the other activities ranges from 3.5 – 9.5 GJ/tonne product (based on 75 % conversion of raw materials to finished product).

Chapter 3
160 Manufacture of Glass
3.10 Frits [98, ANFFECC Position of the Frit Sector 2005] [99, ITC-C080186 2008]
The main extract from melting in the production of frits is a vitreous substance, with a wide array of different formulations depending on the appearance, properties and applications. When compared with the original raw material employed, the final result after melting represents 85 – 90 % of the original weight, depending on the formulation. Most of this weight loss is due to the CO2 and H2O emissions occurring during the melting process. The ceramic frits manufacturing process does not produce any wastes; and the only material to be recycled is generally the dust collected in the abatement systems, which has no significant impact upon the product, although it implies planning and frequent recycling. Therefore, the basic yield in terms of final product is very high, since in most cases the product is just cooled with water (although it can also be air-cooled), and the only losses are the solids that initially cannot be separated from the cooling water.
3.10.1 Process inputs [47, ANFFECC 1999] [98, ANFFECC Position of the Frit Sector 2005] [91, ITC - C071304 2007] [144, ITC November 2008]
The listing of the main raw materials used in the most common formulations is shown in Table 3.49 along with the indicative values of their percentage in the batch composition. The exact values vary depending on the formulation; however, the ones shown below can be considered an indication.
Table 3.49: Main raw materials utilised in frit production Frit type Raw materials Approximate % in batch
Zirconium compounds 7.7Feldspar 26.8Quartz 25.9Boric acid 6.8Zinc oxide 8.4Dolomite 8.4Calcium carbonate 13.4
Ceramic/glass frits
Potassium nitrate 2.6Borax 19.1Quartz 42Sodium nitrate 7.8Sodium fluorosilicate 1.2Potassium fluorosilicate 7.8Sodium phosphate 3.2
Enamel frits
Titanium oxide 18.9Red lead (Pb3O4) 50Quartz 19.8Zinc oxide 15.1Low melting point frits
Boric acid 15.1
Water is used for cooling and cleaning purposes, but also to cool and break up the melted glass (quenching), as well as for the wet cooling process. All of the water circuits are closed circuits and have their corresponding evaporation losses. The other water losses are the water content of the product and the water contents of the solids collected from the water circuit in contact with the melted material. The water consumption is estimated at 0.5 – 3 m3/tonne of ceramic frits. Natural gas is used as a fuel, with the most common oxidising agent being air in an oxidising atmosphere.

Chapter 3
Manufacture of Glass 161
3.10.2 Emissions to air 3.10.2.1 Raw materials All silos and mixing vessels are fitted with filter systems which reduce dust emissions to below 30 mg/Nm3. Dust emissions in any system, with or without filters, depend on the number of transfers, the granule size, and the amount of material being processed. Although quite rare and only in low levels, some frit processes involve the use of raw materials which contain lead or other heavy metals, particularly for enamel frits. All the necessary measures are already in place so that emissions from these substances can be minimal.
3.10.2.2 Melting The frits sector produces air emissions during melting activities because this is a process requiring a high temperature and an intense use of energy. The substances released and the associated sources are identified in Section 3.2.2.1. All of the furnaces in this sector are fired with natural gas and emissions of sulphur oxides are less than 200 mg/Nm3 depending on the sulphate level of the batch. Table 3.50 below shows the typical emission levels from this sector; no statistical breakdown is available.
Table 3.50: Typical emission levels from melting furnaces for the frits sector Concentration mg/Nm3 (1) (2)
Mass emission kg/tonne melt (1)Substance
Average values Average values Dust <40 <0.2 Nitrogen oxides (as NO2) 1600 (3) 12 (3)Sulphur oxides (as SO2) <200 <1 Chlorides (HCl) <10 <0.050 Fluorides (HF) <5 <0.025 Metals (Group 1+2) <5 <0.025 Metals (Group 1) <1 <0.01 (1) Data refer to production capacities of ≥20 tonnes/day. (2) Emission concentrations refer to an oxygen concentration of 15 %. (3) Values refer to a mixed production (formulations with and without nitrates). These values would be
hard to maintain when high levels of nitrates are used in the batch formulation for all furnaces conveyed to one stack.
Source: [99, ITC-C080186 2008] [84, Italy Report 2007]
Dust emissions depend on the efficiency of the abatement system applied, since production plants are normally fitted with filtration systems. Emissions of nitrogen oxides depend mainly on the combustion system (air/fuel, oxygen-enriched air, oxy-fuel) and the nitrates content in the raw materials used for the preparation of the batch composition. The high variability in products and manufacturing techniques used in the frits sector does not enable a clear correlation between these factors and NOX emissions to be established. It can be considered that 1 kg of nitrates added to the batch composition (sodium, potassium or calcium nitrate) produces around 0.5 kg of NO2, so that every 1 % of nitrate used in the batch produces a maximum of about 5 kg of NO2 per tonne of melted frits, if complete transformation of nitrates into NO2 is considered. The degree of transformation of nitrates is not easy to predict, but it can be estimated to be from 30 to 80 % of the maximum value (see Section 4.4.2.2). NOX emissions from combustion are influenced by the different melting techniques applied and the excess air maintained in the furnace for operational reasons.
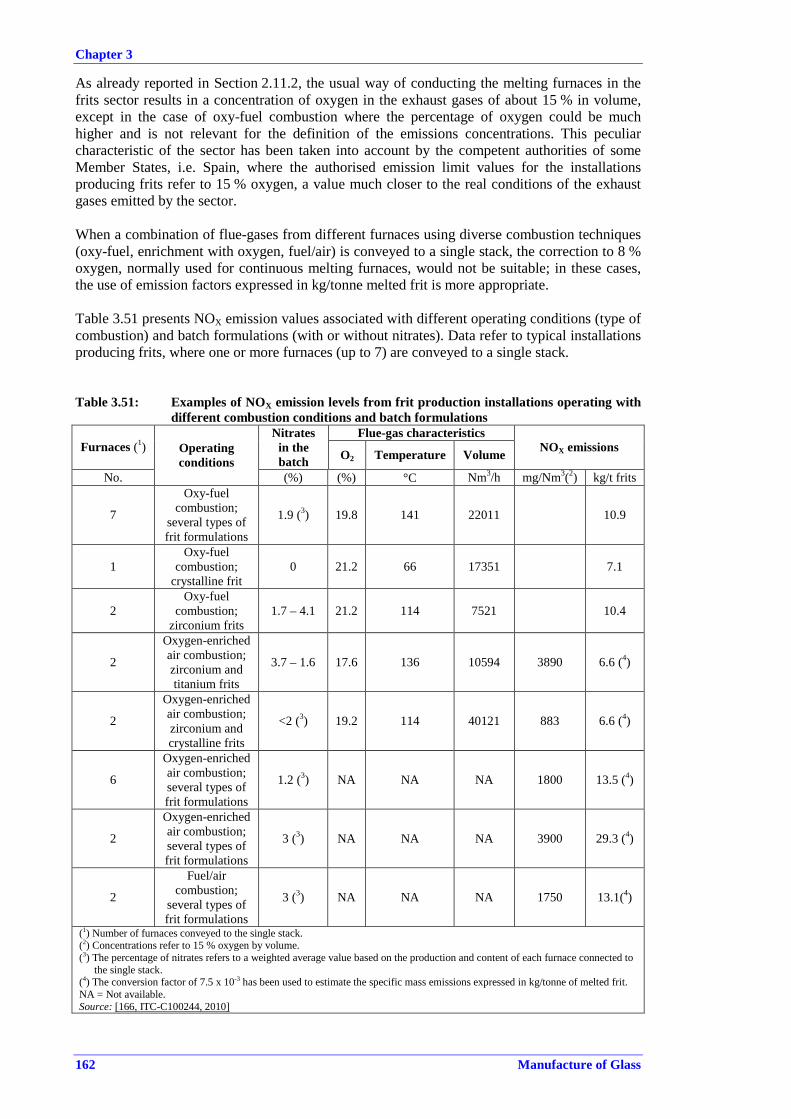
Chapter 3
162 Manufacture of Glass
As already reported in Section 2.11.2, the usual way of conducting the melting furnaces in the frits sector results in a concentration of oxygen in the exhaust gases of about 15 % in volume, except in the case of oxy-fuel combustion where the percentage of oxygen could be much higher and is not relevant for the definition of the emissions concentrations. This peculiar characteristic of the sector has been taken into account by the competent authorities of some Member States, i.e. Spain, where the authorised emission limit values for the installations producing frits refer to 15 % oxygen, a value much closer to the real conditions of the exhaust gases emitted by the sector. When a combination of flue-gases from different furnaces using diverse combustion techniques (oxy-fuel, enrichment with oxygen, fuel/air) is conveyed to a single stack, the correction to 8 % oxygen, normally used for continuous melting furnaces, would not be suitable; in these cases, the use of emission factors expressed in kg/tonne melted frit is more appropriate. Table 3.51 presents NOX emission values associated with different operating conditions (type of combustion) and batch formulations (with or without nitrates). Data refer to typical installations producing frits, where one or more furnaces (up to 7) are conveyed to a single stack.
Table 3.51: Examples of NOX emission levels from frit production installations operating with different combustion conditions and batch formulations
Flue-gas characteristics Furnaces (1)
Nitrates in the batch O2 Temperature Volume NOX emissions
No.
Operating conditions
(%) (%) °C Nm3/h mg/Nm3(2) kg/t frits
7
Oxy-fuel combustion;
several types of frit formulations
1.9 (3) 19.8 141 22011 10.9
1Oxy-fuel
combustion; crystalline frit
0 21.2 66 17351 7.1
2Oxy-fuel
combustion; zirconium frits
1.7 – 4.1 21.2 114 7521 10.4
2
Oxygen-enriched air combustion; zirconium and titanium frits
3.7 – 1.6 17.6 136 10594 3890 6.6 (4)
2
Oxygen-enriched air combustion; zirconium and crystalline frits
<2 (3) 19.2 114 40121 883 6.6 (4)
6
Oxygen-enriched air combustion; several types of frit formulations
1.2 (3) NA NA NA 1800 13.5 (4)
2
Oxygen-enriched air combustion; several types of frit formulations
3 (3) NA NA NA 3900 29.3 (4)
2
Fuel/air combustion;
several types of frit formulations
3 (3) NA NA NA 1750 13.1(4)
(1) Number of furnaces conveyed to the single stack. (2) Concentrations refer to 15 % oxygen by volume. (3) The percentage of nitrates refers to a weighted average value based on the production and content of each furnace connected to
the single stack. (4) The conversion factor of 7.5 x 10⁻³ has been used to estimate the specific mass emissions expressed in kg/tonne of melted frit. NA = Not available. Source: [166, ITC-C100244, 2010]
Chapter 3
Manufacture of Glass 163
3.10.2.3 Downstream activities Emissions to air from downstream processes are very low. The vast majority of milling is carried out wet, but dry milling could give rise to dust emissions if not abated.
3.10.2.4 Diffuse/fugitive emissions The main sources of diffuse/fugitive emissions in the frit sector are related to the batch charging area of the melting furnace, dry or wet milling and the packaging of the product. The batch charging area is normally completely enclosed and the potential emissions from batch carryover and combustion gases are expected to be very low. In general, the operation of milling (wet or dry) and the packaging of the product are carried out under extraction followed by a bag filter system, in order to ensure air quality in the working area; in these circumstances, diffuse emissions are expected to be very low.
3.10.3 Emissions to water Emissions to water consist of normal cooling, cleaning and surface run-off emissions. The quenching and milling circuits are usually closed with freshwater top-up but sometimes have a purge to prevent the build-up of salts. Emission levels are very low but may contain suspended solids and in some circumstances heavy metals may be present in the suspended solids. The metals are usually bound in the glass and can be removed by solids separation techniques. In some cases, depending on the receiving water, the emission levels at the point of discharge may be significantly higher than the values presented in Table 5.5. In such cases a possible external use of the waste water in the ceramic industry is anticipated.
3.10.4 Other wastes Waste levels are generally very low. The main processing waste is the solid material (mainly frits) separated from the water circuits. This material is not usually recycled because the composition is too variable. In most plants, the waste to good production ratio will be in the region of 0.5 – 3 %. Most mineral raw materials are delivered in bulk and do not give rise to packaging waste. Waste materials from product packaging operations (plastic, cardboard, wood, etc.) are usually reused or recycled if practicable. Other waste non-specific to the sector is disposed of by conventional means, or recycled where local or national schemes permit. At the end of a furnace campaign, the refractory structure is dismantled and replaced. Where practicable, this material is recovered for reuse or sale.

Chapter 3
164 Manufacture of Glass
3.10.5 Energy Frits furnaces are normally very small compared to other furnaces used in the glass industry. Only a few individual furnaces have a capacity exceeding 20 tonnes per day. All existing furnaces are natural gas-fired, and there are no known examples of electrical melting on a commercial scale. There are usually several furnaces in an installation, each producing different frits formulations. Energy use per tonne of melted frits is comparable to other sectors (above 13 GJ/tonne, corresponding to 300 Nm3 of gas per tonne of frits). Oxy-fuel fired furnaces show lower values in the range of 9 – 13 GJ/tonne of frits. The energy consumed in other processes is usually low, given that there are few downstream activities and products are not usually dried. A significant number of furnaces use oxygen as the oxidising agent which can result in energy savings and reduced emissions. However, the energy required for oxygen production should be taken into account in the estimation of the total energy consumption per tonne of frits. Moreover, the indirect emissions associated with the production of oxygen, together with additional cross-media effects (i.e. wear of refractory materials) should be considered.

Chapter 4
Manufacture of Glass 165
4 TECHNIQUES TO CONSIDER IN THE DETERMINATION OF BAT
4.1 Introduction This chapter describes techniques (or combinations thereof), and associated monitoring, considered to have the potential for achieving a high level of environmental protection in the activities within the scope of this document.
It covers environmental management systems, process-integrated techniques and end-of-pipe measures. Waste prevention and management, including waste minimisation and recycling procedures are also considered. Furthermore, techniques for reducing the consumption of raw materials, water and energy are covered.
Annex III to the Directive lists a number of criteria for determining BAT, and the information within this chapter will address these considerations. As far as possible, a standard structure as shown in Table 4.1 is used to outline the information gathered concerning each technique, to enable a comparison of techniques and the assessment against the definition of BAT given in the Directive.
This chapter does not necessarily provide an exhaustive list of techniques which could be applied in the sector and other techniques may exist or may be developed, which could be considered for the determination of BAT for an individual installation.

Chapter 4
166 Manufacture of Glass
Table 4.1: Information for each technique described in this chapter Heading within the sections Type of information included
Description A brief technical description using, as appropriate, chemical or other equations, pictures, diagrams and flowcharts.
Achieved environmental benefits
The main potential environmental benefits to be gained through implementing the technique (including reduced consumption of energy; reduced emissions to water, air and land; raw material savings; as well as production yield increases, reduced waste, etc.).
Cross-media effects
Relevant negative environmental effects due to implementing the technique, allowing a comparison amongst techniques in order to assess the impact of the technique on the environment as a whole. This may include issues such as:
• consumption and nature of raw materials and water • energy consumption and contribution to climate change • stratospheric ozone depletion potential • photochemical ozone creation potential • acidification resulting from emissions to air • particulate matter in ambient air (including microparticles and metals) • eutrophication of land and waters resulting from emissions to air or water • oxygen depletion potential in water • persistent/toxic/bioaccumulable components (including metals) • generation of residues/waste • limitation of the ability to reuse or recycle residues/waste • generation of noise and/or odour • increased risk of accidents.
The reference document on Economics and Cross-media Effects (ECM) should be taken into account.
Operational data
Actual and plant-specific performance data (including emission levels, consumption levels - of raw materials, water, energy and amounts of residues/wastes generated). Any other useful information on:
• how to design, operate, maintain, control and decommission the technique • emission monitoring issues related to the use of the technique • sensitivity and durability of the technique • issues regarding accident prevention.
Applicability
An indication of the type of plants or processes in the sector to which the technique cannot be applied as well as constraints to implementation in certain cases, considering, e.g. plant age, (new or existing), factors involved in retrofitting (e.g. space availability), plant size (large or small), techniques already installed and type or quality of product.
Economics
Information on the costs (capital/nvestment, operating) and any possible savings (e.g. reduced raw material or energy consumption, waste charges) or revenues including details on how these have been calculated/estimated. Economic information relevant to new build and retrofit to existing installations will be included. This should allow for identifying, where possible, the overall economic impact of the technique.
Driving force for implementation
Where applicable, specific local conditions, requirements (e.g. legislation, safety measures) or non-environmental triggers (e.g. increased yield, improved product quality, economic incentives - e.g. subsidies, tax breaks) which have driven or stimulated the implementation of the technique to date.
Example plants Reference to plant(s) where the technique has been implemented and from which information has been collected and used in writing the section. An indication of the degree to which the technique is in use in Europe or worldwide.
Reference literature
Literature or other reference material (e.g. books, reports, studies, websites) that was used in writing the section and that contains more detailed information on the technique. When the reference material consists of a large number of pages, reference will be made to the relevant page(s) or section(s).

Chapter 4
Manufacture of Glass 167
This chapter has eight main sections, which cover: 1. Melting technique selection 2. Materials handling 3. Techniques for controlling emissions to air from melting activities 4. Techniques for controlling emissions to air from non-melting activities 5. Techniques for controlling emissions to water 6. Techniques for minimising other wastes 7. Energy 8. Environmental management systems. The main environmental impact of the glass industry as a whole arises due to emissions to air from melting activities. Techniques to reduce these emissions are described in Sections 4.2, 4.3 and 4.4, the latter being the largest and most detailed section of this chapter. Most of the techniques described are relevant to the majority of installations in the glass industry and share a common basis. For this reason, Section 4.4 is structured with a substance-based approach and for each substance, the various emissions reduction techniques are described. The techniques have been described in the section relating to the substance on which they have the greatest effect, but there are inevitably positive and negative multi-substance effects for many of the techniques. Where appropriate, the effects on other substances have been described and cross-referenced to other sections. In various parts of the document the terms ‘primary and secondary abatement measures’ are used. These terms help to categorise some of the techniques. In general, primary techniques are those which reduce or prevent the formation of the pollutants; and secondary techniques are those which act on the pollutants to render them less harmful (e.g. by converting them to other species) or to collect them in a form that can be reused, recycled or disposed of. Some of the techniques described may not fall conveniently into either category, and where appropriate this is made clear in the text. To be able to compare and assess the performance of the various techniques, emission data are presented, as far as information is available, together with the operating parameters of the installation, the sampling procedure and the averaging period. Data on emissions may be expressed as absolute or concentration values, and relative to actual production or production capacity. The most relevant economic aspects of each of the techniques will be described to identify, where possible, the overall economic impact of any given technique. Various expressions may be used for costs and consumption, referring to units of production or time. An important consideration for this chapter is that a technique, which is successful in one application, may have very different implications if used in a different sector or even at a different installation in the same sector. The costs, environmental performance and associated advantages and disadvantages can differ widely for different sectors and for individual installations. For each technique, its availability and likely applicability in a range of situations is discussed. When evaluating a technique, it is also important to consider that certain equipment may become less efficient over time and there may be a tendency for some but not all types of emissions to increase. Whereas this relative increase is likely to be small, due account should be taken of the normal and predicted ageing characteristics when considering the emission levels that can be achieved, bearing in mind that the substitution of equipment might require delay until rebuild. Therefore, the operator should monitor carefully the emission characteristics of the plant, maintain the plant regularly and timely prepare the rebuild when necessary.

Chapter 4
168 Manufacture of Glass
In assessing the applicability of any technique described in this chapter to a continuous melting process, it is necessary to consider whether it can be applied to the furnace during the campaign, or if it can only be applied (or is best applied) at a rebuild. An important feature of the glass industry is the fact that furnaces have a limited operational life, after which time they must be repaired or rebuilt, to varying degrees. In general, fossil fuel-fired furnaces producing container glass, flat glass, glass wool, and continuous filament glass fibre, operate continuously today with a typical lifetime between 10 and 20 years and in some cases up to 20 years. Special glass and domestic glass fossil fuel-fired furnaces usually operate continuously for 3 to 8 years. Electrically heated furnaces tend to have shorter operating lives in all applications, i.e. 2 to 7 years. Some other furnaces such as cupola furnaces and batch melters for glass frits production are operated for much shorter periods, from a few days to several weeks. There are two main categories of rebuild for continuous processes. • In a ‘normal’ rebuild, the refractory of the furnace and, where appropriate, the
regenerators are repaired by the full or partial replacement of the material. The furnace frame is not significantly adjusted and the furnace dimensions remain basically unchanged. Where there is no significant change in furnace requirements or technology, this is the most common type of rebuild between campaigns.
• A ‘complete’ rebuild usually involves major adjustments or replacement of the furnace and all linked equipment and installations. This can be comparable to the construction of a new furnace although, in many cases, much of the existing infrastructure and particularly the regenerators may be retained. This type of rebuild is less common and is usually undertaken where a major change in furnace requirements (e.g. significantly increased melting area or major changes in firing capacity) or technology is involved. A complete rebuild generally involves significantly higher costs than a normal rebuild.
During a furnace campaign, the opportunity to modify the furnace is limited. Although hot repairs to replace or shore up damaged refractories are often undertaken, and burner modifications or replacement can also be relatively straightforward. Major changes affecting melting technology are usually most economically implemented if coincided with furnace rebuilds. This can also be true for complex secondary abatement measures. However, many improvements to the operation of the furnace, including the installation of secondary techniques, are possible during the operating campaign. Where appropriate, these issues are discussed in the consideration of the applicability of the various techniques. The distinction between a ‘normal’ rebuild and a ‘complete’ rebuild is not absolute and there are a number of increments between the simplest normal rebuild and the complete demolition and total replacement of a furnace. For example, a small repair can be carried out either hot or cold to repair specific damage or to introduce a minor modification. Also minor rebuilds may occur where a scheduled cold repair is made but most of the refractory is retained and only damaged parts replaced. The most important difference, which affects both the cost and the freedom to implement new technology, is whether there is a significant change to the furnace frame and therefore its dimensions. For specific cases, in particular for furnaces with more frequent rebuilds and lower capital costs, the advantages of coordinating environmental improvements and furnace repairs are less significant; however, even in these cases, environmental improvements may be more economical if coordinated with other operations and investments planned for the melting furnace.

Chapter 4
Manufacture of Glass 169
4.2 Melting technique selection The melting techniques used within the glass industry are described in Chapter 2. They range in size from small pot furnaces to large regenerative furnaces producing up to 900 – 1 000 tonnes of glass per day. The choice of melting technique depends on many factors but particularly the required capacity, the glass formulation, the required glass quality, fuel prices, oxygen price levels, local electricity price and existing infrastructure. The choice is one of the most important economic and technical decisions made for a new plant or for a furnace rebuild. The overriding factors are the required capacity and the glass type. The choice between a regenerative or a recuperative furnace is normally based on economical and technical reasons. Therefore, the environmental aspects are only discussed briefly here. The choice between conventional air-fuel firing and electrical or oxy-fuel melting is an important factor in determining BAT and these techniques are described separately. Similarly other specific melting techniques, e.g. the LoNOX
melter, are discussed separately in the substance-specific sectors. Each of the techniques described in Chapter 2 has its inherent advantages, disadvantages and limitations. For example, at the time of writing (2010), the best technical and most economical way of producing high volume float glass is from a large cross-fired regenerative furnace; although oxy-fired float glass furnaces may provide an economic alternative depending on the oxygen price level. The alternatives are either still not proven in the sector or compromise the economics or technical aspects of the business (e.g. electric melting or recuperative furnaces). For glass sectors with similar characteristics (e.g. container and domestic glass), a melting technique may be viable for one sector and not for the other on the basis of technical and economical considerations. The environmental performance of the furnace is a result of a combination of the choice of melting technique, type and quality requirement for the glass, the method of operation, and the provision of secondary abatement measures. From an environmental perspective, melting techniques that are inherently less polluting or can be controlled by primary means are generally preferred to those that rely on secondary abatement. However, the economic and technical practicalities have to be considered and the final choice should be an optimised balance. The environmental performance of the various melting techniques will differ greatly depending on the glass type being produced, the method of operation and the design. For example, the emissions (before secondary abatement) from a recuperative furnace producing TV glass with added nitrate and nearing the end of a campaign, will bear little resemblance to the emissions from a newly built recuperative continuous filament glass fibre furnace which has optimised geometry, formulation and firing. Specific product quality requirements in different sectors might also influence the environmental performance of a furnace. These factors make a direct quantitative comparison of the various melting techniques difficult and of limited value, and the sections below only summarise the main environmental considerations for each of the techniques described in Chapter 2. The differences in emissions from the different furnace types are discussed, where appropriate, in the substance-specific sections of this chapter. Electric melting differs from the other techniques described below, because it is a fundamental change in technology and has very significant effects on direct emissions. Electric melting is presented as one of the specific techniques for consideration in determining BAT. However, due to its impact on all emissions, it does not fit conveniently into the substance-based approach of this chapter; therefore, it is presented separately in this section. Other melting techniques that differ from the conventional fuel/air furnaces and present a very significant effect in particular on nitrogen oxides emissions are covered in Section 4.4.2. This is the case of oxy-fuel melting and special furnace designs which are covered in Sections 4.4.2.5 and 4.4.2.3 respectively.

Chapter 4
170 Manufacture of Glass
A summary of the different specific energy consumptions, in relation to the adopted melting technique, is given in Table 3.13 and Figure 3.4 for the container glass sector, classified by furnace type and size. Regenerative furnaces These furnaces are generally more energy efficient than other conventional fossil fuel-fired furnaces due to the more efficient combustion air preheating system. The low energy use per tonne of glass melted leads to reductions in many of the pollutants associated with combustion. However, the high preheat temperatures favour higher NOX formation. These furnaces have shown very good results with primary emission control techniques, particularly for NOX. Of the two types of regenerative furnace, the end-fired furnaces tend to show better energy efficiency and lower emissions. However, on cross-fired regenerative furnaces, it is possible to adjust the hotspot location, to achieve the production of a good quality glass even in large size furnaces, due to a better control of the mass flows of molten glass. The replacement of a cross-fired furnace would only be possible at a complete rebuild. Assuming that it is possible to build such a furnace in the available space, the additional costs associated with a complete rebuild may outweigh any operating environmental or economic benefits. The high capital cost of regenerative furnaces means they are normally only economically viable for large-scale glass production (generally >100 tonnes per day although there are examples of smaller furnaces). For production rates of >500 tonnes per day, cross-fired furnaces are generally used to obtain good heat control along the full length of the furnace. Recuperative furnaces These furnaces are less energy efficient than regenerative furnaces, but still recover a substantial amount of heat via the recuperator system. Further improvements in energy efficiency are possible using further techniques, e.g. electric boost, waste heat boilers, gas preheating, and batch/cullet preheating. Preheat temperatures are lower than in regenerative furnaces and good results can be achieved with primary NOX controls. Although, in general NOX emissions expressed in concentrations (mg/Nm3) show lower values for recuperative furnaces (see average values in Table 3.15), specific emissions of regenerative and recuperative furnaces, expressed in kg NOX/tonne glass are comparable, with the exception of special design recuperative furnaces (LoNOX
furnace). Combined fossil fuel and electric melting There are two principal approaches to the use of this technique, predominantly fossil fuel firing with an electric boost or predominantly electrical heating with a fossil fuel support. Provision for electric boosting is installed in many furnaces and can contribute 2 – 20 % of total energy input. Generally in container and float glass furnaces, the amount of electric boosting is very limited (<5 %) due to the cost of electricity. Electric boosting will reduce the direct emissions from the furnace by the partial substitution of combustion by electrical heating for a given glass pull rate. As discussed in Section 4.2.1 below, if a more holistic view is taken, the reductions achieved on-site should be considered against the emissions associated with power generation. The high costs associated with electric boost mean that it is not generally a practicable long-term emissions reduction option for base level production. It is an operational tool, the use of which is determined by economic and technical issues. Electric boost can be used in association with techniques such as low-NOX burners to improve melting and reduce emissions, but it is not a cost-effective option when used in isolation. Electric boost can also be used to improve the convective currents within the furnace, which helps heat transfer and can aid the primary fining. However, the evaluation of the overall environmental benefits of electric boost should take into account the efficiency of electricity production at the power plant.

Chapter 4
Manufacture of Glass 171
Fossil fuel over-firing on a predominantly electrically heated furnace is a much less commonly used technique. It allows many of the environmental benefits of electric melting to be realised by overcoming some of the technical and economical limitations of the technique. The use of the burners increases the melting rate of the raw materials. Clearly there are emissions associated with the fuel combustion and these will depend on the ratio of the heat supply. Many of the emissions reduction techniques discussed in this chapter can be applied in these furnaces, including low-NOX burners and oxy-fuel melting. Discontinuous batch melting The technique traditionally used for low volume discontinuous melting is the pot furnace, although other techniques such as day tanks and the Flexmelter are becoming more common. The choice of technique will usually depend on the logistics of the specific installation, particularly the scale of production, the number of different formulations produced, and customer requirements. Many of the primary abatement measures described in this chapter will be applicable to these furnaces to a greater or lesser degree. The most effective techniques are likely to be the optimisation of batch formulations and combustion techniques. Due to the design of pot furnaces the techniques will generally give better results for day tanks and semi-continuous furnaces. Where the use of day tanks or continuous/semi-continuous melting is practicable, better energy efficiency and lower emissions will usually be achieved. Stone wool melting The most commonly used technique for stone wool melting is the hot blast cupola, although there are examples of electric melting and gas-fired furnaces. In several cases these other options have been designed as full-scale developmental plants to study the long-term viability of the techniques, or they have been chosen due to particular local circumstances. The hot blast cupola has a number of operational advantages and is the preferred technique within the sector. The alternatives either do not show any substantial environmental advantages or are not proven to be technically and economically viable for wider application.
4.2.1 Electric melting Description The technique is described in Section 2.3.4 because it is a basic melting technique common in several sectors. Electric melting has important effects on pollutant emissions and so is also discussed in this chapter as a ‘primary’ abatement measure. Achieved environmental benefits The complete replacement of fossil fuels in the furnace eliminates the formation of combustion products at the installation level (but electricity generation should be accounted for); namely, oxides of sulphur (when fuel oil is used), thermal NOX, and carbon dioxide (CO2) The remaining emissions arise from particulate carryover and the decomposition of batch materials, particularly CO2 from carbonates, NOX from nitrates and SOX from sulphates. In most cases where electric melting is applied, sulphate use in the batch composition is quite low, since the use of other refining and oxidising agents is more common (e.g. nitrates). There may also be low levels of halide emissions, e.g. hydrogen fluoride (HF), or metals where these substances are present in the raw materials. However, emissions can be significant from formulations with added fluorides. The emissions of all volatile batch components are considerably lower than in conventional furnaces due to the reduced gas flow and the absorption, condensation and reaction of gaseous emissions in the batch blanket which usually covers the whole surface of the melt. The furnaces are usually open on one side and there are significant air currents due to the gaseous emissions and the heat from the melt. It is usually necessary to provide some form of ventilation to allow dust, gases and heat to escape without entering the work place. This is achieved either by natural draught or by extraction. The waste gas emitted by natural draft will
Chapter 4
172 Manufacture of Glass
have a very low volume but may have a high dust concentration, and poor dispersion characteristics. Dust emissions can be controlled by extraction to a dust abatement system, which due to the low volumes involved is usually a bag filter. This arrangement results in very low dust emissions and also allows for the treatment of HF emissions by dry scrubbing if necessary. See Sections 4.4.1.3 and 4.4.3. The actual emissions achieved will depend greatly on the batch formulation, and due to the low waste gas flows, a comparison of emission concentrations can be misleading. However, as a broad indication, overall direct emissions are reduced by a factor of between 10 and 100 compared to a conventional air-fuel-fired furnace of comparable pull rate. Some actual quantitative data are given in Section 3.8.2.2 for mineral wool installations, and in the example installations presented in this document. Cross-media effects Direct emissions from the furnace are greatly reduced using electric melting and the thermal efficiency is very high. However, when considering the overall environmental performance of the technique, the environmental impact of power generation can offset most of the advantages. A full quantitative analysis is impossible within the scope of this document. The environmental issues associated with electricity generation are very complex, and differ widely across the EU and sometimes between installations. Electricity can be supplied from the national supply or from a local or dedicated supply, which can affect both the cost and the efficiency of supply. If the power is taken from the national grid network, it can be from a wide variety of sources. Power generation from coal, oil, gas, nuclear, hydro and other renewable sources all have very different environmental issues associated with them. The difference in thermal efficiency between electric melting and fossil fuel melting is also reduced when the efficiency of electricity generation is considered (primary energy). Again it depends very much on the source of electricity, but for a traditional fossil fuel-fired power plant, the efficiency from primary fuel to point of electricity use is in the region of 30 – 35 %. For a combined cycle natural gas turbine plant, the figure would be closer to 50 %. Indirect emissions of CO2 and NOXx associated with the production of electric energy have been estimated for a small furnace producing 20 tonnes/day of non-lead crystal glass. In this particular case, the reduction of 14 tonnes/year of NOX emissions, achieved by switching from a fossil fuel-fired furnace to electric melting furnace, is completely offset by the amount of indirect emissions accounted for in the production of electricity, equivalent to 15 – 16 tonnes NOX/year and 6 300 tonnes/year of indirect CO2 emissions. This is not always the case; for lead crystal glass furnaces, the net NOX and CO2 emissions (indirect + direct emissions) are slightly lower for the electric furnace than for the fossil fuel-fired one, but the difference between the two is rather small. [94, Beerkens - APC Evaluation 2008]
Due to the low waste gas volumes associated with the technique, the cost of any downstream abatement equipment is greatly reduced and the low volumes of collected dust can be readily recycled. The low volatile loss also reduces the consumption of raw materials, which reduces both emissions and costs. This is particularly beneficial for some of the more expensive and/or toxic components such as lead oxides, fluorides, arsenic compounds, borax, etc. Operational data In general, electric melting produces a very homogenous high quality glass, in particular, in the case of special glasses in which batch formulations contain volatile components. For some domestic and special glass applications, this can be one of the primary reasons for choosing electric melting.

Chapter 4
Manufacture of Glass 173
However, cold-top electric furnaces have a smaller operating tonnage ‘window’ than conventional furnaces. For example, a 40 tonnes/day cold-top electric furnace would typically operate well between 36 – 44 tonnes/day. When a lower tonnage is required for a specific machine production rate, the electric furnaces are difficult to control, and the higher pull must be maintained (side drain); therefore, more glass is being melted than the required amount for production needs, resulting in higher production costs. On the contrary, a 40 tonnes/day conventional furnace could operate at 25 – 30 tonnes/day, if needed, with very few problems. The traditional view within the glass industry is that sodium nitrate or potassium nitrate are required in cold-top electric furnaces to provide the necessary oxidising conditions for a stable, safe and efficient manufacturing process. The use of nitrates directly affects the emissions of NOX and although not necessary for all applications, this can reduce some of the environmental benefits of electric melting. The use of nitrates as oxidising agents becomes more important where waste material which contains organic compounds is recycled to the melter. The use of high external cullet levels (or other recycled materials) can sometimes cause odour problems. A summary of the main advantages and disadvantages associated with the application of electric melting is shown in Table 4.2:
Table 4.2: Main advantages and disadvantages of electric melting Advantages
• Very low direct emissions • Potentially increased melting rate per m2 of furnace area • Improved direct energy efficiency • In some cases lower raw material costs • In some cases electric melting gives a better quality and more homogenous glass • Reduced capital cost and furnace space requirements • Potentially simpler operation
Disadvantages
• High operating cost • Reduced campaign length • Not currently technically and economically viable for very large-scale glass production • Less flexible and not adapted to large pull variations for high quality glasses • Associated environmental implications of electricity generation
An example installation is presented in Table 4.3 for the production of domestic glass, particularly crystal and lead crystal.

Chapter 4
174 Manufacture of Glass
Table 4.3: Example installation for the application of electric melting in the domestic glass sector (crystal and lead crystal glass)
Operating conditions
Furnace 1 Furnace 2 Type of furnace Cold top electric furnace Cold top electric furnace Furnace age 4 yrs 7 yrs
Capacity 27 t/d 15 t/d (magnesium crystal
glass) 20 t/d (lead crystal glass)
Average production 25 t/d (2006) 15.8 t/d (2005)
Type of glass Lead crystal glass Magnesium crystal glass, lead crystal
Cullet Internal only Internal only Use of filter dust Yes Yes
Melting: 4.32 GJ/t melted glass Melting: 7.20 GJ/t melted glass Specific energy
consumption (1) Total: 7.70 GJ/t melted glass; 15.4 GJ/t finished product
Total: 10.58 GJ/t melted glass; 21.16 GJ/t finished product
Flue-gas volume (2) 15000 – 20000 Nm3/h (dry gas at operating O2 content)
15000 – 20000 Nm3/h (dry gas at operating O2
content) Associated emission levels (3)Particulate matter (4) 2.8 mg/Nm3
NOX (nitrates in the batch)(5) 420 – 560 mg/Nm3 (8.1 kg/t) 340 – 460 mg/Nm3 (10.4 kg/t)
SO2 (5) Not relevant - no sulphur in the batch composition
HCl (5) <3 mg/Nm3
HF (5) <1 mg/Nm3
Sb (5) Gaseous <0.01 mg/Nm3. Particulate <0.01 mg/Nm3
Pb (5)Gaseous <0.01 mg/Nm3 (below
detection limit) Particulate 0.04 mg/Nm3
(1) Data reported refer to energy at the point of use and are not corrected to primary energy. (2) The high flue-gas volume is due to a maximised volume of extracted air. (3) Abatement measures/techniques applied: bag filter for each furnace; the fumes from hot-end glass processing (volatilisation of lead) are extracted. (4) Average of three half-hour continuous measurements. (5) Single measurements every two years (half-hour mean values) Source: [110, Austria, Domestic glass plants 2007]
Applicability Electric melting is applicable in many parts of the glass industry and is used in several sectors including high temperature insulation wools, mineral wool, special glass, domestic glass and, to a lesser extent, in container glass generally for low tonnages for the production of flaconnage. Electric melting can clearly only be installed at a furnace rebuild. There are no known full-scale examples of electric melting in the flat glass or frits sectors. The technique is commonly used for the production of potentially highly volatile, polluting glasses (e.g. lead crystal and opal glass) and for high value added products. The wider use of the technique is limited by the operating costs and by some technical considerations. As discussed above, the main constraint is the operating cost and, depending on a range of factors, this sets an upper size limit on the economic viability.

Chapter 4
Manufacture of Glass 175
At the time of writing the document (2010), the technique is not in use for large volume glass production (>300 tonnes per day) and so cannot be considered fully proven either technically or economically. The application of electric melting to the production of continuous filament glass fibre is not considered to be currently economically or technically viable, since E-glass often used for this type of product has a low alkali content resulting in very low electrical conductivity. An experimental float glass line with an electrically heated furnace was in operation in the UK from 1989 to 2000. This plant was built to demonstrate the principle of cold top electric melting for float glass production. The plant has operated successfully on this pilot scale and it has been used to produce a range of exotic glasses, the emissions from which would have been very difficult to control from a conventionally-fired furnace. The application demonstrated that operating a full-scale float glass line (>500 tonnes per day) with an all-electric furnace is not currently economically viable due to the high operating costs. The furnace is no longer in operation. Economics The economic viability of electric melting depends mainly on the price differential between electricity and fossil fuels. At the time of writing (2010), average electricity costs per unit of energy are 4 to 5 times the cost of fuel oil. Electricity costs can vary by up to 100 % between Member States, but fossil fuel prices tend to show less difference. Fuel prices and their variations are discussed in Section 4.4.3.1. Electric furnaces are very thermally efficient; in general, they are 2 to 4 times better than air-fuel-fired furnaces. The comparison for large, energy efficient furnaces is at the lower end of this range, and for smaller furnaces at the upper end. Electric furnaces have much lower capital costs than conventional furnaces which, when annualised, partially compensate for the higher operating costs. However, the furnaces have shorter campaign lives before they require rebuild or repair, i.e. 2 to 7 years compared to 10 to 20 years for conventional furnaces. The electric furnace can be more competitive in the range of 10 to 50 tonnes/day, because of the higher specific heat losses of air-fuel furnaces.
General conclusions on the costs of electric melting versus fossil fuel-fired melting cannot be made; all cost considerations need to be done on a case-specific basis since several parameters need to be taken into account (location, different energy sources and prices, furnace capacity, production flexibility, furnace lifetime, glass quality to be achieved, stability of the process, etc.), in particular when comparing all electric furnaces to regenerative, recuperative and oxy-fired furnaces. As an example, the comparison between an all-electric melting furnace of about 30 tonnes/day, in the tableware/crystal glass sector, and a recuperative unit melter furnace shows that the electric furnace requires a higher investment cost of about EUR 3 million, due to its shorter lifetime, but lower operating costs (EUR 350 000 less). In this particular case, slightly lower costs per tonne of molten glass are reported. Based on current practice, the following is proposed as a very general indicative guide to the size of electrical furnaces which may be viable, i.e. those which can potentially be a practicable alternative (there are inevitably exceptions due to local circumstances): • Furnaces below 75 tonnes per day are generally viable. • Furnaces in the range 75 – 150 tonnes per day may be viable in some circumstances. • Furnaces greater than 150 tonnes per day are generally unlikely to be viable. The financial considerations can also be greatly affected by site-specific factors including: prevailing energy costs; product quality requirements, available space, costs of alternative abatement measures, prevailing legislation; ease of operation; and the anticipated operating life of alternative furnaces.
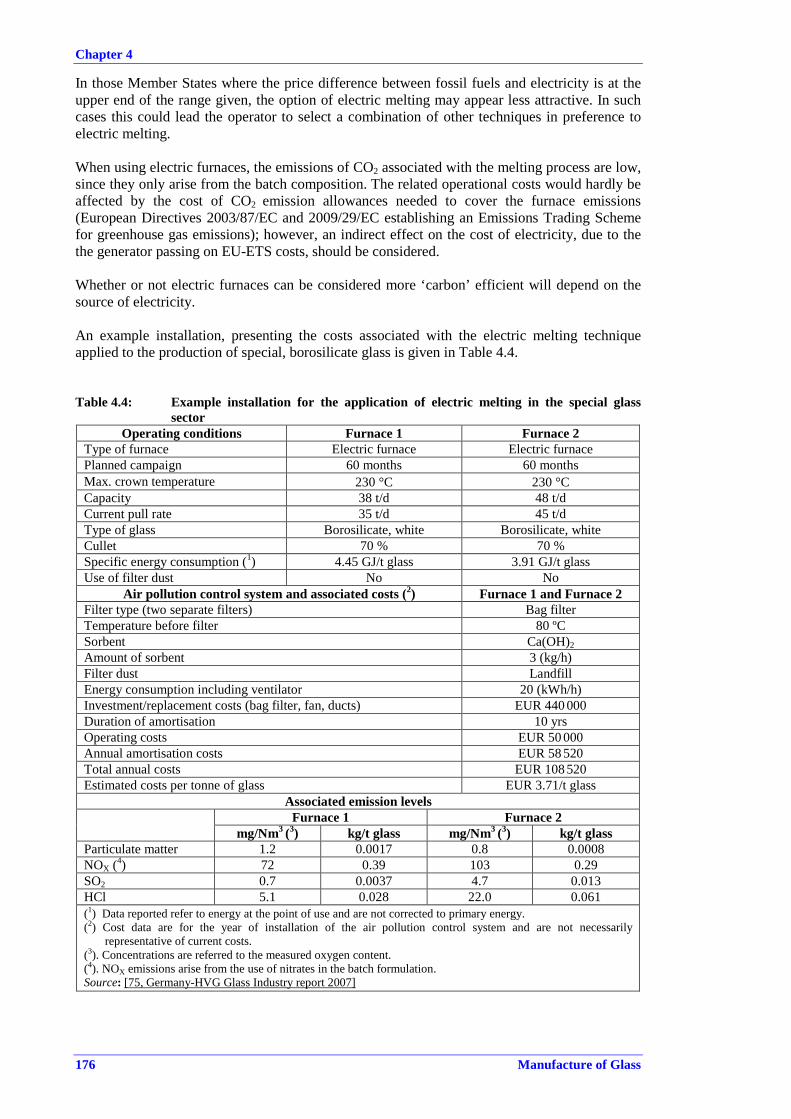
Chapter 4
176 Manufacture of Glass
In those Member States where the price difference between fossil fuels and electricity is at the upper end of the range given, the option of electric melting may appear less attractive. In such cases this could lead the operator to select a combination of other techniques in preference to electric melting. When using electric furnaces, the emissions of CO2 associated with the melting process are low, since they only arise from the batch composition. The related operational costs would hardly be affected by the cost of CO2 emission allowances needed to cover the furnace emissions (European Directives 2003/87/EC and 2009/29/EC establishing an Emissions Trading Scheme for greenhouse gas emissions); however, an indirect effect on the cost of electricity, due to the the generator passing on EU-ETS costs, should be considered. Whether or not electric furnaces can be considered more ‘carbon’ efficient will depend on the source of electricity. An example installation, presenting the costs associated with the electric melting technique applied to the production of special, borosilicate glass is given in Table 4.4.
Table 4.4: Example installation for the application of electric melting in the special glass sector
Operating conditions Furnace 1 Furnace 2 Type of furnace Electric furnace Electric furnace Planned campaign 60 months 60 months Max. crown temperature 230 °C 230 °CCapacity 38 t/d 48 t/d Current pull rate 35 t/d 45 t/d Type of glass Borosilicate, white Borosilicate, white Cullet 70 % 70 % Specific energy consumption (1) 4.45 GJ/t glass 3.91 GJ/t glass Use of filter dust No No
Air pollution control system and associated costs (2) Furnace 1 and Furnace 2 Filter type (two separate filters) Bag filter Temperature before filter 80 ºC Sorbent Ca(OH)2Amount of sorbent 3 (kg/h) Filter dust Landfill Energy consumption including ventilator 20 (kWh/h) Investment/replacement costs (bag filter, fan, ducts) EUR 440 000 Duration of amortisation 10 yrs Operating costs EUR 50 000 Annual amortisation costs EUR 58 520 Total annual costs EUR 108 520 Estimated costs per tonne of glass EUR 3.71/t glass
Associated emission levels Furnace 1 Furnace 2
mg/Nm3 (3) kg/t glass mg/Nm3 (3) kg/t glass Particulate matter 1.2 0.0017 0.8 0.0008 NOX (4) 72 0.39 103 0.29 SO2 0.7 0.0037 4.7 0.013 HCl 5.1 0.028 22.0 0.061 (1) Data reported refer to energy at the point of use and are not corrected to primary energy. (2) Cost data are for the year of installation of the air pollution control system and are not necessarily
representative of current costs. (3). Concentrations are referred to the measured oxygen content. (4). NOX emissions arise from the use of nitrates in the batch formulation. Source: [75, Germany-HVG Glass Industry report 2007]

Chapter 4
Manufacture of Glass 177
Driving force for implementation The thermal efficiency of an electric furnace is better than the equivalent conventional furnace. Waste gas volumes are very low (only gases from batch decomposition). The use of electricity might be locally favoured, in the framework of a non-carbon-based energy policy. Example plants Schott, Mainz, Germany – Special Glass. British Gypsum Isover Ltd, Runcorn, UK – Glass Wool. SGD, Mers-les-Bains, France – Container Glass (flaconnage) Bormioli Luigi, Parma, Italy – Domestic Glass Bormioli Rocco e Figlio, Bergantino, Italy – Container borosilicate glass (flaconnage). Reference literature [65, Glass for Europe-Proposals for GLS revision 2007] [94, Beerkens - APC Evaluation 2008]
4.2.2 Operation and maintenance of furnaces Description The operation and maintenance of the melting furnace is a primary technique for minimising the environmental impact due to glass furnace ageing. This technique is normally applied to regenerative long life furnaces, but some of these recommendations can also be applied to other furnaces. Conventional glass melting furnaces (fuel-fired furnaces) can be in operation for a long period of time and the tendency is to increase this period more and more; on average over 12 years and up to 18 years in many cases. Throughout the furnace life, refractory wearing and ageing as well as movements of the refractory structure (expansion and contraction) happens and consequently losses of heat and energy efficiency, along with cracks in the furnace superstructure, can be produced. Cracks can cause infiltration of parasitic air (depending, e.g. on the furnace pressure). Therefore, it is very important to establish the permanent supervision and monitoring of the furnace to ensure that the necessary maintenance is carried out for minimising the ageing effects and for optimising the operating conditions and their parameters. The most important operations for refractory maintenance are: • to ensure at all times that the furnace and regenerator walls are sealed to avoid parasitic
air infiltrations; • to close and/or seal all furnace openings (e.g. peepholes, other holes for monitoring
probes, dog houses and burner blocks) when not in use; • to improve heat transfer in regenerative furnaces, clean checkers when necessary, and to
provide adequate maintenance of the heat exchangers in recuperative furnaces; • to keep the maximum insulation possible for the current furnace condition. Regarding furnace operations, the established parameters must be kept constant depending on the production process and the primary techniques used by making the following adjustments, for instance: • positioning burners and ensuring that they are sealed with burner blocks; • controlling the stabilised flame conditions, e.g. length, brightness and temperature
distribution; • controlling air/fuel ratio. Furnace monitoring and control is essential for obtaining the best results. An adequate maintenance programme should be established for the equipment used.

Chapter 4
178 Manufacture of Glass
Achieved environmental benefits The most important benefits of this technique are the energy consumption and NOX emissions reduction. Another benefit can be the reduction of dust emissions by decreasing carryover due to better positioning of the burners and better flame conditions. In a well maintained furnace, ageing produces an increase in energy consumption that can be estimated for regenerative furnaces of between 1.5 and 3 % yearly, due to less insulation and less efficiency in the heat exchange. Poor maintenance can significantly increase these consumptions. Parasitic air infiltrations reduce energy efficiency because this air is not preheated and also because of a change in the combustion conditions. Also, the additional nitrogen coming into the furnace with the air increases NOX production in an uncontrolled way. Special attention should be taken with the oxy-fired furnaces in order to prevent air infiltrations caused by a poor sealing of the furnace and/or the burner blocks which would generate NOX formation. In addition to the reduction of NOX emissions and energy consumption, this technique can improve productivity and the quality of the glass produced because it can increase the melting stability. Information assessing these improvements is not available yet. In general, in a well-maintained furnace, the lifetime of all components (e.g. furnace crown, the palisades, the regenerator crown, the regenerator packing) increases. Cross-media effects A solid waste stream is produced from the cleaning of checkers, which might be contaminated with refractory materials and/or metals. In this case, the dust (mainly sodium sulphate) cannot be recycled back to the melting furnace and the solid waste will have to be disposed of. The application of measures to control the air/fuel ratio may cause the presence of significant concentrations of CO in the regenerators. A combustion with air below the stoichiometric ratio and very reducing flue-gases (indicated by high CO concentration values) may lead to deposition and condensation of aggressive salts in the regenerators with possible damage to the refractory material of the checkers and consequently the operational life of the furnace may be reduced. Operational data Monitoring furnace parameters and closing all the furnace holes should be included in the good practices of furnace operation. The monitoring schedule will depend on the furnace (e.g. type, size, age, wear, type of checkers), the type of glass melted and produced, the type of fuel used (oil or gas), etc. As an example, a monitoring schedule could be as follows: • for parasitic air entries (holes, fissures): daily visual inspection and action (to seal) when
necessary; • for regenerators: visual inspections to be carried out regularly by plant operators; clean
checkers when necessary. Applicability This technique can be applied during the life of existing or new furnaces. It is more useful for all oxy-fired furnaces, recuperative and regenerative furnaces. It can also be considered for other furnaces, but requires a specific assessment in every case. Many modern glass manufacturing companies have already achieved environmental benefits and energy reduction due to proper furnace maintenance, operational procedures and controls.

Chapter 4
Manufacture of Glass 179
Economics The costs associated with the application of this technique include the training of qualified personnel for supervision and maintenance, the purchase of necessary equipment, such as cameras, sensors for oxygen and for temperature measurements. If sulphate dust is sent to landfill, an additional cost will be incurred. However, maintenance costs do not compare to the benefits obtained from the energy savings, better quality products and greater productivity. The achievable energy savings result in lower costs for CO2 allowances within the framework of the Emission Trading Scheme (ETS) Directive. Driving force for implementation Legal requirements for NOX emissions can be more difficult to accomplish at the end of the life of a furnace. Only maintaining the furnaces in the best possible condition can reduce the increase of these emissions. Example plants Most large glass container companies, such as Saint-Gobain, Owens-Illinois (O-I), Ardagh Glass are applying this technique to their furnaces. Also in the flat glass sector most companies (e.g. AGC, Pilkington NSG Group, Saint-Gobain) apply this technique to their furnaces. Reference to literature [75, Germany-HVG Glass Industry report 2007] [78, DUTCH Oxy-firing furnaces 2007][79, TNO OxyFiring2005ATIVFinal 2005] [85, Spanish BAT Glass Guide 2007]
4.3 Techniques for materials storage and handling The diversity of the glass industry results in the use of a wide range of raw materials. The majority of these materials are solid inorganic compounds, either naturally occurring minerals or manufactured products. They vary from very coarse materials to finely divided powders. Liquids and, to a lesser extent, gases are also used within most sectors.
4.3.1 Techniques for materials storage Bulk powder materials are usually stored in silos, and emissions can be minimised by using enclosed silos, which are vented to suitable dust abatement equipment such as fabric filters. Where practicable, collected material can be returned to the silo or recycled to the furnace. Where the amount of material used does not require the use of silos, fine materials can be stored in enclosed containers or sealed bags. Stockpiles of coarse dusty materials can be stored under cover to prevent windborne emissions. Attention must be paid to the storage of external cullet, being a potential source of dust, fugitive emissions and odour deriving from the organic residues contained in the secondary raw material; although, external cullet is treated before delivery by specialised companies to conform with specific quality requirements. Where dust is a particular problem, some installations may require the use of road cleaning vehicles and water damping techniques. Volatile raw materials can be stored so as to minimise emissions to air. In general, bulk storage temperatures should be kept as low as practicable and temperature changes due to solar heating, etc. should be taken into account. For materials with a significant vapour pressure, or for odorous substances, specific techniques may be necessary for reducing releases arising from tank breathing or from the displacement of vapour during liquid transfers.
Chapter 4
180 Manufacture of Glass
Measures/techniques for reducing losses from storage tanks at atmospheric pressure include the following: • use of tank paint with low solar absorbency • control of temperature • tank insulation • inventory management • use of floating roof tanks • use of vapour return transfer systems • use of bladder roof tanks • use of pressure/vacuum valves, where tanks are designed to withstand pressure
fluctuations • application of a specific release treatment, e.g. adsorption, absorption, condensation • subsurface filling. Additional information regarding techniques for materials storage which prevent and minimise diffuse/fugitive emissions can be found in the Reference Document on Emissions from Storage (EFS BREF) [121, EC 2006] (see also Section 3.2.2.1 in this BREF).
4.3.2 Techniques for materials handling The general techniques used for materials handling are described in Section 2.1. There are very few issues regarding emissions to air from materials handling that are specific to the glass industry. Therefore, this section only summarises those techniques, which are generally considered to constitute good practice when handling these types of materials. Where materials are transported by above ground conveyors, some type of enclosure to provide wind protection is necessary to prevent substantial material loss. These systems can be designed to enclose the conveyor on all sides. Where pneumatic conveying is used, it is important to provide a sealed system with a filter to clean the transport air before release. To reduce dust during conveying and carryover of fine particles out of the furnace, a percentage of water can be maintained in the batch, usually 0 – 4 %. Some processes (e.g. borosilicate glass production) use dry batch materials, and where dry materials are used, the potential for dust emissions is higher and, therefore, greater care is needed. In general, dust from flue-gas treatment systems is very fine and may contain significant amounts of unreacted alkaline reagent which could present corrosive and/or irritant characteristics. Consequently, the handling and storage of this material may require particular care. An area where dust emissions are common is the furnace feed area. The main measures/techniques for controlling emissions in this area are listed below: • Moistening of the batch. • Application of a slightly negative pressure within the furnace (only applicable as an
inherent aspect of operation, in particular to melting furnaces for frits manufacturing, see Section 2.11.2). It should be noted that negative pressure may have a detrimental impact on furnace energy efficiency as it will allow cool air into the furnace. In practice, a slightly positive pressure, around 5 Pa, is generally applied to all glass melting furnaces.
• Use of raw materials that do not cause decrepitation phenomena (mainly dolomite and limestone). These phenomena consist of minerals that ‘crackle’ when exposed to heat, with a consequent potential increase of dust emissions.
• Provision of extraction, which vents to a filter system, (common in cold top melters). • Use of enclosed screw feeders. • Enclosure of feed pockets (cooling may be necessary).

Chapter 4
Manufacture of Glass 181
Dust emissions can occur directly to the air or may occur within the process buildings. Where this occurs, dust can build up within the building and can lead to fugitive emissions by the movement of air currents in and out of the building. In potentially very dusty areas such as batch plants, the buildings can be designed with the minimum of openings and doors, or dust curtains can be provided where necessary. In the furnace buildings, it is often necessary to ensure a degree of natural cooling and so vents, etc. are provided. It is important to ensure a good standard of housekeeping and that all dust control measures (seals, extraction, etc.) are properly functioning. Areas of the process where dust is likely to be generated (e.g. bag opening, frits batch mixing, fabric filter dust disposal, etc.) can be provided with extraction which vents to a suitable abatement plant. This can be important at smaller installations where a higher degree of manual handling takes place. All of these techniques are particularly relevant where more toxic raw materials are handled and stored, e.g. lead oxide and fluorine compounds (see also Section 3.2.2.1 and sector-specific sections in Chapter 3). Reference to literature [121, EC 2006]
4.4 Techniques for controlling emissions to air from melting activities
4.4.1 Particulate matter For the purposes of this document, the term ‘particulate matter’ is taken to mean all material that is solid at the point of measurement, and for emissions from melting activities is considered to be synonymous with the term dust. Both of these terms are used interchangeably throughout this chapter. The term ‘total particulate matter’ is taken to mean all inorganic and organic solid (with no lower size limit) and liquid materials (droplets and aerosols) that may be present in the flue-gases. The temperature at the point of measurement is particularly important for glass furnaces because some of the materials that form dust (particularly borates) can be volatile at quite low temperatures. Also the nature of the dust from these processes makes accurate measurement very difficult. The nature of the dust emissions from glass furnaces varies for different processes, but depends mainly on the furnace design and operation, and on the glass composition. The three primary sources of dust from melting are: • batch material carryover • volatilisation and reaction of substances from batch materials and the glass melt • metal impurities in the fuels. A secondary source of dust emissions related to the melting process is represented by solid products deriving from the chemical reaction between gaseous pollutants and alkaline reagents used for waste gas treatment. For fossil fuelled furnaces, the volatilisation and subsequent reaction/condensation of volatile materials released from the hot glass surface represents by far the largest proportion of the overall dust emissions. In general, 80 to 95 % of the dust emissions will be produced in this way. It is therefore important to ensure that any volatile species have been condensed before the waste gas is treated or measured. This is not a problem for sodium sulphate (melting point approximately 884 °C) but is a consideration for flue-gases which contain borates.

Chapter 4
182 Manufacture of Glass
Carryover of batch materials usually accounts for less than 5 % of the final emissions from a modern, well-operated furnace. This dust is made up of the components of the batch, and is dominated by the lightest materials. Metal impurities in fuels (vanadium and nickel) will contribute to dust emissions, but at a level generally significantly below 5 % of the total. These impurities arise mainly with fuel oil, which may also add a small amount of ash to the total. Metal impurities also occur in cullet and other raw materials. The mechanisms of material volatilisation and particulate formulation are not fully understood for all glass types. In particular, for SO2-rich flue-gases (oil-fired furnaces) the mechanism of particulate formation is rather complex at temperatures below 400 °C, with different compounds that can be formed (sodium hydrogen sulphate (NaHSO4), sodium pyrosulphate (Na2S2O7 )and sulphuric acid (H2SO4)) which could heavily affect the reliability of particulate concentration measurements if not taken into account. Approximately 90 % of all glass produced in the EU is soda-lime glass, and most information is available for these compositions. Dust from soda-lime glass furnaces is predominantly composed of sodium sulphate. Up to 98 % of the dust is made up of soluble materials; of this, 80 – 90 % is sodium sulphate. The remainder will depend on the precise glass composition, but will contain mainly sulphates, particularly potassium sulphate (K2SO4). The insoluble fraction contains mainly silica, with lower levels of metals (e.g. Al, Fe, and Cr). If external cullet is used, the dust may contain other components (e.g. Pb). The particle diameter is generally in the range of 0.02 to 1 µm, but the small particulates readily agglomerate into larger particles. Recent studies showed that particulate matter in the emissions from a flat glass furnace is composed of particles with a diameter in the range of 0.02 to 2 µm with a median diameter of 1.3 µm in both untreated and cleaned waste gas (See: Glass International, September 2009 - Particle size range in the waste gas of flat glass furnaces) [178, Glass International September 2009]. A number of different volatilisation processes can be distinguished and are discussed in Section 4.4.1.1 below. For glasses that contain substantial levels of boron in the composition (e.g. continuous filament glass fibre, glass wool, and borosilicate glass), borates are a major component of the emitted dust. The remainder will be made up of sulphates, silica and other compounds (e.g. dolomite, lime) dependent on batch components and impurities. Since the batch compositions may differ strongly for the different types of glasses, the resulting dust emissions are also diverse and follow different formation mechanisms. The main boron species evaporating from glass melts are sodium metaborate (NaBO2), potassium metaborate (KBO2) and metaboric acid (HBO2). In mineral glass wool production, the batch composition contains high levels of boron oxide but also large amounts of sodium oxide that, during melting, evaporate and subsequently form solid sodium metaborate (NaBO2) at temperatures of below 900 °C, down to 650 – 700 °C. Small quantities of boron are emitted in gaseous form, mainly as metaboric acid (HBO2). The chemical composition of dust is mainly represented by alkali borates with lower levels of boric acids. The situation is different for other glass types which contain boron. For boron glasses with low alkali content (e.g. E-glass which contains boron, for continuous filament glass fibre), the low concentration of alkali oxides (typically around 1 % in mass) affects the mechanism of dust formation leading to a dominant evaporation of metaboric acid (HBO2). During flue-gas cooling, while almost all sodium and potassium will condensate to form sulphates (generated by the presence of SO2 from fining the glass melt with sodium sulphate) and, to a lesser extent, alkali borates, gaseous boron compounds may react to form other species such as boric acid (H3BO3): HBO2 + H2O→ H3BO3 [167, Hans van Limpt (TNO) 2007]. Boric and metaboric acid show low condensation temperatures and they may still be present (in particular, boric acid) in a gaseous form in the flue-gases at filtration temperatures. In this case, most boric acid species will be present in the flue-gas as gaseous compounds at temperatures below of 200 °C, but also as low as 60 °C.

Chapter 4
Manufacture of Glass 183
In the case of borosilicate glasses, the formation mechanism of dust strongly affects the capability of filtration systems to remove boron species present in the flue-gas. The composition of the waste gas, the operating temperature of the filter system, the type of absorbing agent and the point of injection upstream of the filter system are extremely important for capturing gaseous boron compounds. In many cases, when gaseous boron compounds are present in the flue-gas of the melting furnace, the particulate content (as measured) strongly depends on the measuring method applied and on the temperature of the waste gas at the sampling point. For these reasons, in order to distinguish between particulate and gaseous boron compounds in the flue-gas, a specific measuring procedure should be applied (see Section 8.3.2). At the time of writing (2010) there are several ongoing and planned research activities concerning the reduction of gaseous boron compounds in the flue-gases of borosilicate glasses. In lead glass (TV and crystal glass), lead volatilisation will produce lead oxide or sometimes lead sulphate condensations. In cold top electric melters, the emissions of dust are much lower and arise almost exclusively from batch material carryover. The absence of the high temperature combustion atmosphere precludes the formation of particulate matter by reactive volatilisation. In stone wool cupola furnaces, the dust emissions are a combination of raw material dust, combustion products, and condensed volatiles released during melting. The emissions to air of metals from glass processes are largely contained in the particulate matter. For this reason, metals are not treated separately in this chapter but are discussed in respect to dust emissions and, where appropriate, references are made to other sections. However, in some circumstances there can be significant gaseous metal emissions, for example, selenium from bronze or decolourised glasses, lead from some lead crystal or special glass processes, or from impurities in the external cullet (particularly lead, see below). The main sources of metals are impurities in raw materials, cullet and fuel, and the use of specific substances and additives in the batch formulation utilised to impart specific properties (e.g. lead oxides, and colourants/decolourants). External cullet is an important source of metal contamination particularly for lead (container glass cullet presents historical contamination from lead glasses subject to EU Packaging and Packaging Waste Legislation-Directive 94/62 with an average alert value at 200 ppm) but also for other metals; for example, mercury contamination can occur if cullet contains mercury vapour light tubes. Information on metal emission levels is given in the sector-specific sections in Chapter 3 and in Table 3.5. There are three main approaches for controlling emissions of metals either within the dust or as gaseous components. 1. Raw material selection to minimise contamination and where practicable to use
alternative additives. Raw material selection includes specifications on cullet quality. Where only internal cullet is used due to the limited availability of external cullet, emissions of metals may be much easier to control.
2. Dust abatement techniques, particularly bag filter systems and electrostatic precipitators. Where emissions contain significant metal concentration, up to 70 – 80 % of total dust (i.e. lead crystal glass production), high efficiency dust abatement systems can generally reduce both dust and metal emissions.
3. Gaseous metal emissions (e.g. selenium) can be substantially reduced by the use of dry or semi-dry scrubbing techniques in combination with dust abatement (see Section 4.4.3.3).
In some instances, and particularly in Germany, a major factor in the driving force for the installation of dust abatement combined with dry or semi-dry scrubbing has been the reduction of metal emissions.
Chapter 4
184 Manufacture of Glass
The factors involved when determining BAT for dedusting at glass furnaces are the following: • the environmental impact of the dust • primary and secondary abatement techniques in relation to BAT • the economy of scale and related cost considerations. Environmental impact of the dust The relevant aspects of dust emissions from an environmental point of view are the emissions of dust in general, the potential emissions of (heavy) metals and the emissions of fine particulate matter. As reported above, in soda-lime glasses the main component of the dust is sodium sulphate (up to 95 %). Sodium sulphate is not considered harmful in itself [68, Domestic Glass Data update 2007] [168, CPIV - Health Risk Assessment 2009]. However, the emission of particles with a diameter of less than 10 µm (PM10) and less than 2.5 µm (PM2.5), which is generally the case for emissions from glass furnaces, presents a potential for causing health problems and environmental damage and, therefore, receives increasing attention from the environmental policy makers. Several species of metals may also be found in the particulate matter from glass furnaces. The main components of concern are selenium (Se), lead (Pb), chromium (Cr), copper (Cu), vanadium (V), nickel (Ni), antimony (Sb), arsenic (As), cadmium (Cd), zinc (Zn) and manganese (Mn). The emissions of these components strongly depend on the quantity and quality of recycled glass (cullet) used, whether or not fuel oil is used and the addition of metals to the batch formulation for colouring and/or decolourising the glass. A final point of consideration is the potential condensation of gaseous components after the stack, which can occur especially in glasses which contain boron, where a portion of the gaseous boron compounds may pass through the dust abatement equipment and condense after being emitted to the atmosphere. Primary and secondary abatement techniques in relation to BAT A description of the available primary and secondary techniques for the reduction of dust emissions from glass furnaces is given in Sections 4.4.1.1 – 4.4.1.6 Within the glass industry, secondary abatement techniques (e.g. electrostatic precipitators and bag filters) are widely applied and 100 % of the furnaces in some Member States are fitted with secondary abatement for dust. So far, the need to reduce emissions of fine particulate matter, acid components and (heavy) metals has made the application of secondary measures the best option in terms of emissions to air. On the other hand, the implementation of secondary measures involves substantial financial costs, and a certain degree of environmental cost. In general, the positive aspects of primary techniques are overshadowed in a technical sense by the much better performance of secondary abatement techniques and the lack of prospect of reaching such low values with primary measures in the near future. In addition, the exclusive use of primary techniques for reducing dust emissions could limit the flexibility of the operational conditions of the furnace in terms of quality of the feed materials (low impurities: fluorides, chlorides, heavy metals), type of fuel (low sulphur and heavy metals) and production changes (coloured or decoloured glasses). Economy of scale and related cost considerations In general, secondary abatement techniques for dust in the glass industry are considered to be accessible, technically viable and, in the vast majority of cases, economically viable.

Chapter 4
Manufacture of Glass 185
However, as for any secondary technique, the economy of scale is an important aspect. It means that for small furnaces, in particular for small or very small tableware (domestic glass) furnaces below 80 tonnes/day producing high quality soda-lime glassware where the metal content of the emissions is very low, relative costs (costs per Nm3 of flue-gas treated or per tonne of melted glass) are generally higher than for large furnaces (see Tables 8.3 and 8.4 in Section 8.1.7). The costs depend on the application and particularly the volume of waste gas. Specific costs per tonne of melted glass may vary significantly depending on the type of glass produced and the size of the furnace. The economy of scale may have to be taken into account when determining BAT on a general level together with the environmental benefits: removal of fine particulate matter, metals (if present) and acid gas scrubbing (if present), and the cross-media effects due to waste generation (if recycling is not possible), energy consumption and indirect emissions from the use of electric energy and alkaline reagents.
4.4.1.1 Primary techniques [19, CPIV 1998] [31, CPIV 1998]
Description A glass furnace is a very dynamic environment and any changes to the chemistry or operating conditions can have consequential effects within the melting process, and on other emissions. For this reason it is important to consider all the primary techniques described in this document as a package rather than simply as individual techniques. However, for clarity, the techniques have necessarily been described separately, but consequential effects have been discussed where possible. A low level of emissions from material carryover is achieved by maintaining a level of moisture in the raw materials and by controlling the batch blanket coverage, particle size, gas velocity and burner positioning. For those processes which require dry batch materials, and/or very fine batch materials, dust emissions from carryover may be slightly higher. However, the contribution to the overall emissions will still be minor compared to the volatile species contribution. Issues relating to dust arising from material charging are dealt with in Section 4.3 above.
Because the dust emissions arise mainly from volatile species, the primary abatement techniques discussed here concentrate on this source. From dust analyses of soda-lime furnaces, it can be concluded that sodium species are the major components leading to dust formation in flue-gases. Volatile species from the batch (e.g. NaCl) and from the melt (e.g. NaOH) react with sulphur oxides to form sodium sulphate (Na2SO4) which condenses in the waste gas below 1100 °C. In most cases, sodium sulphate is used as the fining agent. The dissociation of the sodium sulphate in the molten glass leads to sulphur oxide concentrations, which are much higher than the sodium component concentrations in the combustion chamber and in the flue-gases. With respect to Na2SO4 formation, the oxides of sulphur from fuel combustion or batch sulphate are available in stoichiometric excess compared to the volatilised sodium, which is the governing parameter for dust formation. The main sources of sodium are the cullet or soda ash and, to a minor extent, sodium sulphate. However, the use of high amounts of sodium sulphate in the batch composition causes an increase in dust emissions. In very sulphur-lean gases, sodium chloride, sodium fluoride, sodium carbonate and sodium hydroxide particles can be formed during the cooling of the flue-gases to below 900 °C. This is not common, and can only occur when natural gas is used and when sodium sulphate is replaced by another fining agent, like antimony. This is never the case for container or flat glass but could happen in special applications. A number of different volatilisation processes can be distinguished in soda-lime glass.

Chapter 4
186 Manufacture of Glass
• Reactive volatilisation from the molten glass surface. The sodium oxide (Na2O) in the silicate melt reacts at the surface with water vapour: Na2O (melt) + H2O → 2 NaOH (g). This type of volatilisation may be the major source of dust emissions in soda-lime glass furnaces.
• Volatilisation of the NaCl present as an impurity in synthetic soda. This volatilisation leads not only to sodium sulphate dust but also to HCl formation.
• Volatilisation of sodium sulphate from the surface of molten glass. • Reactive volatilisation by chemical reactions at the batch blanket surface with
components in the furnace atmosphere. The water vapour in the combustion chamber is thought to be important for the reaction of soda ash to form sodium hydroxide vapours, with similar reactions for potassium compounds: Na2CO3 + H2O→ 2NaOH(g) + CO2.
• Volatilisation of raw material components from the surface of the batch blanket (e.g. sand, feldspars, lime, soda ash, dolomite and sodium sulphate) is generally very low. Vapour pressures are very low below 1200 °C, and above 1000 °C; the single components have already reacted to form silicates.
• Volatilisation of sodium compounds in gas bubbles during the fining process is also of relatively minor importance.
• In the case of the recycling of external cullet (container glass furnaces), emissions of lead components (PbO, PbCO3, PbSO4) might take place because of lead glass, mirror fragments and metallic lead contaminants in the cullet. This is not the case of soda-lime glass in the domestic sector where, in general, only internal cullet is used due to quality demands. In these cases, the level of cullet used in the batch formulation is process-dependent and can be limited.
The situation is different for other glass types. As already explained in Section 4.4.1, for boron glasses containing low alkali, reactive volatilisation is thought to be the main source of particulate matter. The composition of emitted dust varies significantly depending on the alkali content of the batch formulation and the fining agent. Dust formation by volatilisation occurs very readily for glasses which contain boron and the concentration of unabated emissions is generally higher than for soda-lime glasses. In some cases they are more than ten times higher. The types of volatilisation mechanisms described for soda-lime glass are the general basis of volatilisation in most other glasses, but clearly there is variation depending on the chemistry.
The most important factors affecting volatilisation are temperature, water vapour content in the furnace atmosphere, reducing gases just above the melt or batch blanket and the velocities of the gases at the surface of the melt. The availability of reactive species is also an important factor, particularly sodium and sulphates in soda-lime glass, and boron in boron glasses. However, this factor is often limited by the glass chemistry. A particular situation occurs when oxy-fuel combustion is applied for the melting process. The reduced flue-gas volume with lower flue-gas velocities and the significantly different composition of the combustion gases in contact with the glass melt (much higher concentration of water vapour and CO2) affect the volatilisation processes resulting, in general, in higher concentrations of the evaporated species and more aggressive furnace atmospheres; however, total dust emissions in terms of kg/tonne glass will often decrease, although this effect strongly depends on the furnace design, type and positioning of the burners. The most important primary measures that can be taken to reduce dust emissions are outlined below. a. Raw material modifications Sodium chloride can be a significant factor in emissions of dust and chlorides. It is used in some special glasses as a refining agent, but is more commonly present as a low level impurity in soda ash made by the Solvay process. Pressure from the glass industry has led soda ash producers to lower NaCl levels significantly (now generally around 1 kg/tonne). A further significant

Chapter 4
Manufacture of Glass 187
reduction in the short term would probably require further processing and therefore an increase in price. Natural soda ash is available which is virtually NaCl-free, but this material is generally more expensive in the EU due to taxes and transport costs from the countries of origin. The main supply of natural soda ash comes from the US. In most furnaces, the batch sulphate levels have been reduced to the minimum commensurate with good fining and maintaining the correct oxidation state of the glass. Alternatives to sodium sulphate can pose a greater environmental problem, e.g. arsenic and antimony-based fining agents. Further progress in this area is not expected to yield substantial emissions reductions. The limiting factor is thought to be the concentration of the sodium-containing vapours, but for gas-fired furnaces, very reduced sulphate concentrations would limit the reaction in the gas phase. In glasses containing boron, the boron is essential to the forming of the products and the product characteristics. In recent years, substantial reductions have been made in boron levels, but further progress is becoming difficult without affecting the productivity, energy consumption and quality. Boron-containing materials are relatively expensive and every effort is made to reduce consumption. At the time of writing no credible alternatives to boron are available and the difficulties have led many operators to install secondary abatement techniques, particularly for glass wool and borosilicate furnaces. In general, abated dusts are recycled to the furnace. A number of companies in the continuous filament glass fibre sector have developed glass compositions that have low levels of boron and fluorine or only contain these elements due to trace levels in the raw materials. Emissions of particulate matter below 0.14 kg/tonne melted glass have been reported, to be compared with values of around 2 kg/tonne melted glass for formulations containing boron where no primary measures are applied, which demonstrate the importance of boron in the dust formation. This type of glass requires a higher melting temperature, is more difficult to fiberise, and the long-term effects on refractory life have yet to be determined. The details of the technique are proprietary, and therefore, although extremely promising, the technique cannot yet be considered as generally available. Progress varies between the different companies, but several of these formulations are now marketable. b. Temperature reduction at the melt surface The surface temperature of the glass melt is an important factor in particulate formation, as more volatile species are generated at higher temperatures. A correlation between crown temperature, the glass melt surface temperature and particulate formation has been shown in soda-lime furnaces. Reduction of furnace temperature must be balanced with glass quality, the productivity of the furnace, and other environmental aspects such as the NOX concentration in the flue-gas. Measures which have the greatest effect in reducing dust emissions per tonne of glass are those which improve the energy efficiency and particularly the heat transfer to the glass. The main points are given below. • Furnace design and geometry to improve convective currents and heat transfer. These
modifications can only be implemented at the furnace rebuild. Larger furnaces are generally more energy efficient also resulting in lower emissions per tonne of glass.
• Use of electric boost which helps to reduce the crown temperature by putting energy directly into the melt and improving convective currents. The positioning of the electrodes is important, but this is difficult to change except at the furnace rebuild. The use of electric boost is usually limited by the cost of electricity.
• The increased use of cullet which will reduce the melting energy requirement allowing operation at a lower temperature and lower fuel usage. Also, because cullet has already been melted its use helps to reduce the level of some of the volatile and reactive species, which contribute to dust formation, e.g. sodium chloride and batch sulphates. This is particularly relevant in oil or mixed oil/gas-fired furnaces where a reduction in the fuel requirement, due to the use of cullet, reduces SO2 levels. Cullet usage is limited by the availability of cullet at the correct quality, composition and affordability. For example, container glass furnaces use 5 – 95 % cullet (internal and external), soda-lime domestic

Chapter 4
188 Manufacture of Glass
glass and flat glass furnaces generally 10 – 40 % (usually only internal), and continuous filament glass fibre furnaces rarely use any cullet.
c. Burner positioning Another important factor in the rate of volatilisation from the melt is the rate of replacement of the gases above the melt. A high gas velocity or a high level of turbulence at the surface of the melt will increase the rate of volatilisation. Progress has been made with burner positioning to optimise combustion air velocity and direction, and fuel velocity and direction. Further work has also been carried out involving combining these changes with modifications to the furnace, with the aim of reducing the flue-gas velocity over the glass melt and batch blanket, with a reduced stripping effect on volatile components of the batch formulation. Changes that involve modifications to furnace design can only be implemented at furnace rebuild, and other changes are sometimes most effective when implemented with furnace redesign. When changing the positioning of the burners, it is important to avoid reducing flames touching the melt, since this would increase dust emissions and would promote refractory attack in the superstructure, with possible effects on the glass quality. d. Conversion to gas firing (or very low sulphur oils) Conversion from fuel oil firing to natural gas firing may give substantial reductions in dust emissions. The reasons for this are probably the particular condensation reactions for particulates with gas firing than with oil, although in some cases the reduced SOX levels might also be a factor. For example, the flat glass sector has reported dust emission reductions in excess of 25 % for the conversion from oil to gas firing. The flat glass sector has also reported a significant effect from reducing the sulphur content of the oil (20 mg/Nm3 reduction in dust per 1 % reduction in oil sulphur content). A similar effect was observed in domestic glass with low sulphur oil (<1 %). Conversion to natural gas firing is discussed in more detail in Section 4.4.3.1. The main points are summarised below: • the majority of plants are already equipped to use either fuel, although some may not
have access to a natural gas or a fuel oil supply; • costs of the technique will depend mainly on the prevailing fuel prices; • the lower emissivity of gas flame compared to fuel oil flames reduces the heat transfer to
the melt and may increase energy consumption; • natural gas firing can result in higher NOX emissions compared with oil firing; • some cases of mixed combustion, using both types of fuels simultaneously in one furnace
may enable reduced dust emissions without notably increasing the furnace energy consumption and NOX emissions.
e. Other techniques Emissions from cold top electric furnaces can be minimised by reducing airflows and turbulence during charging, and by raw material grain size and moisture optimisation. Primary measures are rarely implemented for dust emissions from stone wool cupolas with the exception of the briquetting of the production waste added into the batch formulation. The main action that could be taken would be washing the raw materials to remove dust. However, most cupolas are fitted with bag filters and so there is little incentive to apply additional primary measures, because they are very unlikely to change the need for secondary measures. The main advantages and disadvantages of primary techniques for the reduction of dust emissions are shown in Table 4.5.

Chapter 4
Manufacture of Glass 189
Table 4.5: Main advantages and disadvantages of primary techniques for dust reduction Advantages
• Low cost • Focus on prevention rather than abatement • Techniques do not involve the use of energy or the potential solid wastes that can be associated
with secondary techniques Disadvantages:
• Primary measures/techniques do not generally meet the emission levels associated with secondary techniques such as electrostatic precipitators.
• Primary measures/techniques place additional operating constraints on the process
Achieved environmental benefits The emission levels achievable using primary techniques alone are difficult to quantify, because of the wide range of factors that can affect the results and the wide variation in furnace types and glass formulations. For flame-fired furnaces, the lowest emission levels, using only primary abatement techniques, are achieved by furnaces producing soda-lime glasses. Average mass emissions are around 0.4 kg/tonne of glass melted, and the majority of the emission concentrations fall into the range of 100 – 300 mg/Nm3. There are some furnaces achieving less than 100 mg/Nm3 for dust, but these are not common. At the time of writing, few plants have dust emission levels of below 100 mg/Nm3 without secondary abatement, and 100 – 200 mg/Nm3 (≤0.4 kg/tonne of glass) is considered currently achievable with primary measures. It is unlikely that these figures could be achieved for compositions other than soda-lime glass. In general, for other compositions the optimisation of primary techniques could be expected to reduce emissions by 10 – 30 % of the starting value associated with a condition when no specific measures are applied to limit dust emissions. Primary measures combined with secondary measures (filtering systems, wet scrubbers) reduce the amount of dust to be removed from the flue-gases and to be recycled or disposed of. Cross-media effects In general, the techniques described prevent emissions without using additional chemicals/substances so the cross-media effects are assumed to be positive. However, a modification of the raw materials used for the preparation of the batch composition, with the scope of reducing volatile components, could result in an increase of specific energy consumption. For instance, the addition of water to the batch composition to suppress carryover or the substitution of a raw material with one less volatile but requiring a higher melting temperature normally results in an increase of energy consumption. A temperature reduction at melt surface might affect the quality of glass, leading to higher rates of rejected finished articles and higher specific energy consumption per unit of saleable product. A different positioning of the burners applied to minimise volatilisation phenomena might cause a decrease in the energy efficiency of the furnace with a consequent increase of specific emissions from combustion; in addition, a modification of the evaporation/condensation phenomena of the deposited salts may occur with potential damage to the refractories exposed to the flue-gas. The conversion from fuel oil firing to natural gas firing is normally associated with an increase of NOx emissions and specific energy consumptions.

Chapter 4
190 Manufacture of Glass
Operational data Included in the descriptions. Applicability The techniques described are considered to be generally applicable to all parts of the industry within the constraints identified. However, techniques successfully implemented in one furnace may not have the same effects for other furnaces. The reduction achieved will depend on the starting level of dust emissions. Moreover, the introduction of more than one of the techniques presented in this section will not necessarily provide a cumulative level of reduction. In the short to medium term, primary measures for dust abatement are likely to achieve more significant reductions for soda-lime formulations than for other glass types. An exception may be represented by the continuous filament glass fibre produced with low or boron-free formulations. Economics Very little information is available on the costs of primary techniques, but the industry has reported that the costs of the measures implemented to date (2010) are considered to be low. Indeed those techniques that reduce energy usage may result in cost savings. Primary measures can involve varying costs depending on the level and time scale of the application. The measures are an overall package and it is the optimisation of the package that determines the costs and results. For example, the use of low chloride or natural soda ash is unlikely to reduce dust emissions to levels comparable to secondary abatement, and depending on other factors the costs may be disproportionate to the benefits. However, it is one aspect of the package of measures, the costs and results of which, must be considered as a whole. Driving force for implementation The implementation of primary measures for the reduction of dust emissions is often based on economic and operational benefits deriving from the application of the selected techniques, such as avoiding the clogging of regenerators, corrosion or damage of the materials, reducing volatilisation and the consequent loss of valuable raw materials, etc. Example plants The application of some of the primary techniques described in this section is common within the glass industry. Reference literature [19, CPIV 1998] [31, CPIV 1998] [103, Beerkens, Fining glass. Boron 2008]
4.4.1.2 Electrostatic precipitators Description The electrostatic precipitator (ESP) is capable of operating over a wide range of conditions of temperature, pressure and particulate burden. It is not particularly sensitive to particle size, and can collect particulates in both wet and dry conditions. The ESP consists of a series of high voltage discharge electrodes and corresponding collector electrodes. Particles are charged and subsequently separated from the gas stream under the influence of the electric field generated between the electrodes. The electrical field is applied across the electrodes by a small direct current at a high voltage (up to 80 kV). In practice, an ESP is divided into a number of discrete zones (up to five fields can be used) as shown in Figure 4.1.

Chapter 4
Manufacture of Glass 191
Figure 4.1: Electrostatic precipitator
Particles are removed from the gas stream in four stages: • application of an electrical charge to the particles • migration of the particles within the electrical field • capture of the particles onto the collecting electrode • removal of the particles from the surface of the electrode. The discharge electrodes must be rapped or vibrated to prevent material build-up and their mechanical strength must be compatible with transmission of the rapping blow or vibration. The mechanical reliability of the discharge electrodes and their supporting frame is important as a single broken wire can short out an entire electrical field of the precipitator. In wet precipitators, the collected material is removed from the collector plates by flushing with a suitable liquid, usually water, either intermittently or by continuous spray irrigation. The performance of an ESP follows the Deutsch-Anderson equation, which relates dust collection efficiency to the total surface area of collector electrodes, the volumetric flowrate of the gases and the migration velocity of the particles. For a given material, maximising the surface area of the collector electrodes and the residence time in the electrical fields are two of the most important parameters. Also, the larger the distance between collecting electrodes, the higher the voltage that can be applied. This distance is dependent on the supplier design. In order to allow the applied voltage to be varied in the inlet and outlet zones, a good current rectifier design is necessary, which includes the use of separate rectifier sections for each zone or portion of a zone of the ESP. This allows the applied voltage to be varied in the inlet and outlet zones, in order to take account of the reduced particulate load towards the outlet, and allows operation of the zones at progressively higher voltages. Good design is also influenced by the use of automatic control systems, which ensure that the optimum high-tension (HT) voltage is applied to the electrodes. Fixed HT power supplies are unlikely to provide optimal collection efficiencies. The resistivity (the inverse of the conductivity) of the particulate material is particularly important. If it is too low, the particles reaching the collector electrode lose their charge easily and particulate re-entrainment can occur. When the particulate has too high a resistivity, an insulating layer is formed on the electrode, which hinders normal corona discharge and leads to
Chapter 4
192 Manufacture of Glass
reduced collection efficiency. Most particulates encountered in the glass industry have a resistivity within the correct range. However, if necessary collection can be improved by conditioning the particulate, e.g. ammonia and sulphur trioxide can be used, but this is not generally necessary in glass processes. The resistivity can also be reduced by reducing the gas temperature or by adding moisture to the gas. Achieved environmental benefits ESPs are very effective in collecting dust in the range of 0.1 to 10 µm, and overall collection efficiency can be 95 – 99 % (depending on inlet concentration and ESP size). Actual performance varies depending mainly on waste gas characteristics, ESP design and age, but emission concentrations in the range of 5 to 10 mg/Nm3 can be achieved. For existing ESPs, the possibilities for significant upgrading can be limited, due to construction (space restrictions) and operating restrictions (gas velocity in the ESP) and in such cases the achieved performance may be in the range of 20 – 30 mg/Nm3, however, in most cases an upgrade to emission concentrations of about 15 mg/Nm3 should be possible. Although an important factor, the performance does not depend exclusively on the number of electrical fields applied. A two-stage ESP of one design may be as efficient as a three-stage ESP of a different design or in a different application, and the choice will depend on the necessary performance level. An important factor to the performance of the ESP is the installation of a dry scrubber before the filter. Depending on the SOX emission levels to achieve, the quantity of alkaline added to the system could be very high. The concentration of dust in the flue-gas could increase up to 10 times from the original value. In this case, the dry scrubber represents the main source of dust. As a consequence, the performance of the filter might be affected by the quantity of alkaline reagent added to the system. Specific concerns about the performance of the ESPs are, for instance, the presence of heavy metals in the flue-gas which may require higher levels of abatement to be achieved. A high performance filter can considerably reduce metal emissions, including boron. However, for flue-gases which contain boron compounds, the positioning of the filter and, consequently, whether or not condensation of boric acid takes place before or after the filter may have a significant effect on the efficiency of ESPs in collecting the dust generated by the melting furnace (see Section 4.4.1.1). Cross-media effects The use of electrostatic precipitators involves an increase in energy consumption, but this is low compared with the energy consumption of the furnace, less than 1 % (which is equal to 1 – 3 % of energy cost). There will be a resultant environmental effect at the point of electricity generation, which will depend on the source of the electricity. The indirect emissions associated with the use of electricity are estimated to be in the range of 8 – 17 kg CO2 per tonne of melted glass, 0.02 – 0.04 kg NOX per tonne of melted glass and 0.06 – 0.14 kg SO2 per tonne of melted glass, depending on the capacity of the installation (see also Section 8.1.7, Table 8.7 for specific estimated data).
Additional indirect emissions are associated with the production of alkaline reagents used for the scrubbing process (see Section 4.4.1.3). In many applications within the glass industry, it will be necessary to remove acid gases prior to treatment. This will usually be achieved by dry or semi-dry scrubbing which creates a solid material stream up to ten times greater than the dust abated. If this can be recycled to the furnace there will be an overall reduction in the consumption of raw materials; if not, there will be a waste stream to dispose of. In practice, the collected dust can be recycled in most cases and, depending on the sorbent chosen, the material can replace a portion of the other raw materials particularly sodium sulphate (and where appropriate materials containing fluoride and lead). Problems could occur in the container glass sector where the sulphate requirements may be low, due to high cullet levels and for reduced glasses, where the sulphur solubility could be very low.

Chapter 4
Manufacture of Glass 193
This could limit the potential for recycling dust especially if a high sulphur fuel oil is used, and a portion of the collected dust would have to be disposed of off-site. A further problem could occur if multiple furnaces producing different types and/or colours of glass are attached to a single ESP. In some sectors, the ability to recycle the collected dust may be limited by product quality constraints and glass chemistry, for example, where a very high optical quality is required. Additional limitations to the possibility of recycling filter dust are present when dry batch preheating is applied, due to the fine dust which can cause severe carryover and plugging of the regenerators. The recycling of filter dust with high concentrations of NaCl, normally originated from treating the waste gases with sodium-based absorption agents, can cause damage to the refractories in the combustion chamber and/or in the regenerators, depending on the temperature and the composition of the checkers. The costs of disposing of a dust that cannot be recycled (including the costs for classification of the residue) and the costs of lower sulphur fuels (e.g. low sulphur oil or natural gas) might have to be compared in many circumstances (particularly for container glass) in order to evaluate whether it would be more convenient for an operator to change fuels rather than create a solid waste stream for disposal. One of the main purposes of the acid gas scrubbing phase is often to condition the gas for the ESP, in order to avoid corrosion, with consequently lower overall acid gas emissions. If the filter dust is recycled, a dynamic equilibrium between sulpur input and output will form. In the glass industry, the majority of the particulate matter emitted is formed by reactive volatilisation. It is therefore important to ensure that the gas stream is below the particulate formation temperature, which depends on the species present. The major constituent of dust from soda-lime silica glass production is sodium sulphate with a formation temperature at ≈ 800 °C; while for borosilicate glasses, the complete condensation of boron species may occur well below 200 °C. In regenerative furnaces, the waste gas temperature is generally around 400 °C and cooling is not usually required either to condense volatiles or to achieve the ESP operating limits. In recuperative furnaces, the waste gas temperature is usually around 800 °C and cooling is required, both to condense the particulate matter and to cool the gas to the limits of the ESP. As already reported above, for glasses which contain boron (e.g. glass wool, continuous filament glass fibre), it may be necessary to reduce the gas temperature to below 200 °C prior to abatement, whilst ensuring that condensation and the associated risk of corrosion are minimised in the system. The waste gas temperature from oxy-fuel furnaces is usually >1000 °C and substantial cooling is required.

Chapter 4
194 Manufacture of Glass
A summary of the main advantages and disadvantages associated with the use of ESPs is shown in Table 4.6.
Table 4.6: Main advantages and disadvantages of electrostatic precipitators Advantages:
• High dust removal efficiency • Collected dust is generally in a form that permits reuse • Low pressure drop relative to bag filters, and so operating costs are relatively low • Can form part of an integrated treatment system e.g. with scrubbers and SCR • ESPs are not easily blocked due to high load or moisture content, which can be a problem
with fabric filters • In general (i.e. not restricted to the glass industry), there is more operating experience at
high temperatures than for bag filters • Can be designed to allow the addition of further fields at a later date
Disadvantages:
• Energy use. Although the energy used to operate the filter is relatively low compared to the total furnace energy (<1 %), costs are more significant because they use electricity compared to cheaper fossil fuel. Also, there will be an impact due to indirect emissions associated with the use of electricity (CO2 and other emissions at the power station)
• Solid waste streams generated are not always possible to recycle • Many processes require acid gas scrubbing and in these cases an absorbent is consumed.
Indirect emissions are associated with the use of alkaline reagents (production cycle of the material)
• ESPs can involve higher capital costs than other systems such as bag filters • It is critical to maintain plant operations within the design conditions or performance can
drop considerably • Safety precautions must be observed in the use of high voltage equipment • ESPs can be very large and the space requirement must be considered
Operational data The average dust concentration in the clean gases downstream of an air pollution control system is generally low. In most applications, a well designed two or three stage ESP could be expected to achieve less than 10 mg/Nm3 and less than 0.03 kg dust per tonne of glass melted. However, the dust reduction efficiency can vary over time and operating conditions. As an example, Figure 4.2 shows the variability of the results of spot measurements for dust emissions made monthly from an oil-fired float glass furnace equipped with an ESP and operating with a dry scrubbing stage using Ca(OH)2. In the example, the average annual values (red dots) are often below 10 mg/Nm3 but spot measurements (blue dots) could go up to 30 mg/Nm3. These variations are due to the functioning of the filter but may also depend on the variation of the inlet gas characteristics (temperature, dust composition, etc.) due to process variations (e.g. changes of pull and of type of glass). This is also the case during plate cleaning operations, when dust concentrations may show a temporary increase. In many applications, ESPs can achieve figures below these levels either due to favourable conditions or because high efficiency designs are used. Emission levels for ESPs lower than 5 mg/Nm3 are measured in a number of installations; however, except where favourable conditions exist, to guarantee performance at this level would generally involve costs higher than those identified in this section. It should be noted that in regenerative furnaces with alternate firing cycles, representative data should always be an average of the emissions produced during two firing cycles or a multiple of the cycle time.

Chapter 4
Manufacture of Glass 195
Source: [163, Glass for Europe 2009]
Figure 4.2: Results of dust emissions (monthly spot measurements) from an oil-fired float glass furnace equipped with an ESP and dry scrubbing with Ca(OH)2
The application of an ESP is common, in particular at installations with a high production capacity (high flue-gas volume) and/or with more than one furnace. At the time of writing (2010), many large furnaces/installations were equipped with continuous particulate or opacity monitoring. To achieve the best performance from an ESP, it is essential that the gas flow through the unit is uniform and that no gas bypasses the electrical fields. Correct design of inlet ducting and the use of flow distribution devices within the inlet mouthpiece, must achieve uniform flow at the inlet to the precipitator. In general, the operating temperature must be kept below 430 °C. The performance of an ESP will reduce during prolonged operation. Electrodes can rupture, become misaligned or scaly, and regular overhaul is necessary, particularly in older equipment. In applications where the gas stream may contain significant concentrations of acid gases (particularly SOX, HCl and HF), it is generally considered necessary to use some form of acid gas scrubbing prior to the ESP. This usually consists of dry or semi-dry scrubbing using calcium hydroxide, sodium carbonate or sodium bicarbonate. These techniques are discussed in Section 4.4.3.3. The acid gases arise from the cullet, the raw materials and from the sulphur contained in fuel oil used for combustion and without acid gas removal, the ESP could suffer severe corrosion problems. With some glasses containing boron, the alkali also helps to precipitate volatile boron compounds. If waste gases do not contain high levels of acid gases (i.e. gas firing and low sulphur raw materials), pretreatment may not be necessary, e.g. in most glass wool processes. In the flat and container glass sectors, dust emissions associated with the use of an ESP, combined with an acid gas scrubbing system, are in the range of 10 – 20 mg/Nm3. These values are observed for dry scrubbing systems with hydrated lime and a relatively low removal

Chapter 4
196 Manufacture of Glass
efficiency of SOX between 25 – 33 % but also when operating with better SOX removal efficiencies in the range of 50 – 95 %, depending on the type of alkaline reagent, the type of scrubbing system, the flue-gas temperature and the molar ratio of injected reagent versus SOX +HCl + HF present in the flue-gases (see Section 4.4.3.3). The amount of dust generated by the filter system may vary significantly, depending on the requested removal efficiency for the acid gases. As a consequence, a solid waste stream needs to be handled either by recycling the dust into the batch formulation or disposing of it into a landfill (see Sections 4.4.3.3 and 4.7). Some examples of dust emission levels associated with the use of electrostatic precipitators are presented in Table 4.7.
Table 4.7: Dust emission levels associated with the use of ESPs for example installations Total
production Dust emissions
AELs (1) (2)
Production Fuel/melting technique Tonnes/day
ESP characteristics
mg/Nm3,dry gas at 8 %
O2
kg/t glass
Container glass
Soda-lime green/white Natural gas 470
1 field-dry scrubbing with Ca(OH)2
17 (3) 0.027
Soda-lime Natural gas 640 5 fields-dry scrubbing with Ca(OH)2
7.6 0.016
Flint Natural gas 275 3 fields-no scrubbing system
23.8 0.037
Amber Fuel oil + natural gas 297
2 fields-dry scrubbing with Ca(OH)2
1.2 0.0019
White/amber Fuel oil 547 2 fields-dry scrubbing with Ca(OH)2
18 0.027
Emerald green/UV green Natural gas 367
2 fields-dry scrubbing with Ca(OH)2
27 0.040
Flat glass
White/coloured Fuel oil 259 2 fields-dry scrubbing with NaHCO3
3.0 0.0048
White Fuel oil + natural gas 700
4 fields-dry scrubbing with Ca(OH)2
1.5 0.0031
White Natural gas 600 3 fields-dry scrubbing with Ca(OH)2
30 0.084
Domestic glass Not specified Fuel oil 110 Not specified 16.5 0.034 Special glass
Not specified Fuel oil + natural gas 170
2 fields-dry scrubbing with Ca(OH)2
20 0.127
(1) Emission levels represent average values of discontinuous measurements (30 – 60 minutes). (2) For low concentration values, the uncertainty of the measuring method is normally of the same order
of magnitude as the measured value (see Section 8.3.2). (3) Monthly average value of continuous measurements. Source: [75, Germany-HVG Glass Industry report 2007] [84, Italy-Report 2007]
[86, Austrian container glass plants 2007] [120, CTCV 2009]
Chapter 4
Manufacture of Glass 197
Applicability In principle, this technique is applicable to all new and existing furnaces in all glass sectors. In the case of existing installations, an upgrade of the filter with additional fields can be carried out only when the melting furnace is under repair, on condition that the necessary space is available. Similarly, the setting up of an ESP is generally required to be carried out during a cold repair or the rebuild of the furnace(s). A regular maintenance of the ESP is important to ensure a high performance of the system. ESPs are not used with stone wool cupolas due to the explosion risk associated with carbon monoxide present in the flue-gases. Economics The major factors affecting ESP costs are: • waste gas volume • required efficiency • number of fields • waste gas conditioning • if acid gas scrubbing is required, efficiency of the scrubber and scrubbing agent
(i.e. hydrated lime, sodium hydrogen carbonate, sodium carbonate) • plant characteristics (space availability, layout, required site preparation, etc.) • the costs for energy, electricity, water and manpower • dust disposal costs (if not possible to recycle). Each additional electrical field over two will increase capital costs by about 10 – 15 %, but the total increase of these complete air pollution control (APC) systems, including scrubber and operational costs, is only about 5 %. Costs associated with the installation of ESPs are likely to be higher for existing plants than for new plants, particularly where there are space restrictions and where the location of the filter at relatively long distances would require additional piping (often to be insulated). For electric furnaces and smaller conventional furnaces (<200 tonnes per day) the high capital costs may lead operators to choose alternative techniques, particularly bag filters. Specific costs can be significantly higher for smaller productions and for oil-fired furnaces, although this also depends on the degree of SOx reduction to be achieved. As an example, Figure 4.3 shows the specific costs of air pollution control systems (APC) consisting of filtering and dry scrubbing with the use of Ca(OH)2, related to four different situations for float glass furnaces, depending on the melting pull rate and assuming the total disposal of all filter dust. The cost estimation has been based on the following achievable emission levels: • dust emissions are considered in the range of 10 – 20 mg/Nm3, with possible values
ranging from 5 and 10 mg/Nm3 depending on the design of the ESP and the operation (e.g. temporarily higher values associated with the removal of deposition layers from electrode plates);
• a limited SOX emission reduction of 25 – 33 % is assumed as the standard operating condition, using a dry scrubbing system with hydrated lime.

Chapter 4
198 Manufacture of Glass
Average melting pull in tonnes/day
Spec
ific
cost
sA
PCin
EUR
/tonn
em
olte
nflo
atgl
ass
ESP natural gas 33 % SOx reduction
ESP fuel oil 0.9 % sulphur
25 % SOx reduction
ESP natural gas 50 % SOx reduction
Bag filter gas fired33 % SOX reduction
ESP natural gas 33 % SOx reduction
ESP fuel oil 0.9 % sulphur
25 % SOx reduction
ESP natural gas 50 % SOx reduction
Bag filter gas fired33 % SOX reduction
5
5.5
6
6.5
7
7.5
8
8.5
400 500 600 700 800 900 1000
A
B
C
D
A
B
C
D
Source: [94, Beerkens - APC Evaluation 2008]
Figure 4.3: Specific costs per tonne molten glass for air pollution control by dry scrubbing and filters, with total disposal of filter dust, for float glass furnaces depending on melting pull
Based on the methodology reported in Section 8.1, cost data have been estimated for different furnace capacities and SOX emission reduction efficiencies, and for the two options of a complete filter dust recycling or the total disposal as a waste. Data are based on real costs (e.g. quotations from suppliers) and calculated values [94, Beerkens - APC Evaluation 2008].
For a typical initial emission level of 800 – 1000 mg/Nm3 of SOX for gas-fired and 1800 – 2000 mg/Nm3 of SOX for oil-fired furnaces and assuming a limited SOX emission reduction of about 30 % achieved under dry-scrubbing conditions with hydrated lime, the cost data given below have been estimated. Float glass production • The total investment costs for an air pollution control system (ESP + dry scrubbing stage)
may vary between EUR 3.9 and 5.5 million, depending on the size of the furnace (500 – 900 tonnes/day).
• The operational costs vary between EUR 375 000 and 575 000 per year, in the case of complete filter dust recycling and from EUR 685 000 to 11 400 000 per year in the case of total disposal of the filter dust.
• The specific costs may vary between EUR 3.9 and 4.8 per tonne of melted glass when the filter dust is completely recycled to the furnace; the lower value is associated with larger furnaces (900 t/d) and the higher value with smaller furnaces (450–500 t/day). In the case of total disposal of the filter dust, the specific costs per tonne of melted glass are about EUR 1.5 – 2 higher. A higher SOX removal efficiency (about 50 %), achieved by adding more hydrated lime, would cause an additional cost of EUR 1 per tonne of melted glass for gas-fired furnaces and EUR 2.5 per tonne of melted glass for oil-fired furnaces, in the case of total disposal of the filter dust. The specific cost increase would be much lower if the filter dust were completely recycled to the furnace (about EUR 0.2 – 0.3 per tonne of melted glass).
Chapter 4
Manufacture of Glass 199
• The specific costs per kg of pollutant removed may vary between EUR 9 and 15 per kg of dust removed and between EUR 0.45 and 0.7 per kg of SO2 removed, depending on the capacity of the furnace and operating conditions.
Container glass production • The total investment costs for an air pollution control system (ESP + dry scrubbing stage)
may vary between EUR 2.2 and 4.7 million per furnace, depending on the size of the furnace (133 – 560 tonnes/day). In practice, in the container glass sector the air pollution control systems frequently treat the waste gases from more than one furnace.
• The operational costs may vary between EUR 166 000 and 673 000 per year, the lower value being associated with a gas-fired furnace and filter dust recycling and the higher value being associated with an oil-fired furnace with total disposal of the filter dust.
• The specific costs per tonne of melted glass are comparable to the values indicated for the float glass production.
• The specific costs may vary between EUR 10 and 24 per kg of dust removed and between EUR 0.5 and 1.2 per kg of SO2 removed, depending on the capacity of the installation and operating conditions.
Domestic glass production • The total investment costs for an air pollution control system (ESP + dry scrubbing stage)
may vary between EUR 1.2 and 2 million, depending on the size of the furnace (35 – 180 tonnes/day).
• The operational costs may vary between EUR 43 500 and 247 000 per year, the lower value being associated with small gas-fired furnaces (35 t/d) and filter dust recycling and the higher value being associated with larger gas-fired furnaces (180 t/d) with total disposal of the filter dust.
• The specific costs per tonne of melted glass may be much higher than those for the container glass sector. Values between EUR 7.7 and 16.7 per tonne of melted glass have been estimated, depending mainly on the size of the furnace.
• The specific costs may vary between EUR 20 and 44 per kg of dust removed and between EUR 1 and 2.2 per kg of SO2 removed, depending on the capacity of the installation and operating conditions.
The methodology used for the estimation of cost data, together with a summary of the estimated costs concerning the application of ESPs in combination with dry scrubbing systems to the flue-gases of glass melting furnaces are shown in Section 8.1.7, Table 8.7 where data concerning APC applied before 2007, and systems implemented in 2007 and 2008 are presented. The figures given above may vary by plus or minus 15 % for capital costs and 30 % for operating costs, depending on a number of site-specific factors. For installations that do not require acid gas scrubbing, the capital costs will be approximately 15 – 20 % lower and operating costs 30 – 40 % lower. The infrastructure costs will vary depending on the size of the ESP and on the local circumstances for each installation (including the number of furnaces connected to the ESP and the distances from the furnaces to the ESP). As mentioned above, ESPs can be quite large and on existing installations, substantial civil work may be necessary where space is restricted. A summary of actual cost data related to example installations producing different glass types (container, flat, special glass and mineral wool) under diverse operating conditions, is given in Table 4.8

Chapter 4
200 Manufacture of Glass
Table 4.8: Summary Examples of actual costs of electrostatic precipitators applied to the glass manufacturing of flat, container, special glass and mineral wool
Flat glass(1) Flat glass(2) Container glass (3) Special glass(4) Glass wool(5)
Type of furnace Cross-fired, regenerative
Float, cross-fired
Cross-fired, regenerative
Cross-fired, regenerative Oxy-fuel fired
Fuel Fuel oil Natural gas + light fuel oil Natural gas Natural gas +
light fuel oil Natural gas
Furnace capacity 350 t/day 800 t/day 350 t/day 220 t/day 206 t/day
Actual pull rate 259 t/day 700 t/day 275 t/day 170 t/day 199 t/day
Electric boosting Yes Yes Yes Yes Yes
Type of glass White, extra
white, bronze, yellow
White Flint Borosilicate glass tubes C-glass
Cullet 30 % 35 % 60 % 25 % 66 % Specific energy consumption
5.71 GJ/t glass
5.20 GJ/t glass
3.78 GJ/t glass
16.44 GJ/t glass
3.55 GJ/t glass
ESP fields 2 4 3 2 2Temperature before filter 300 °C 300 °C 200 °C 350 °C Not available
Type of sorbent NaHCO3 Ca(OH)2 None (3) Ca(OH)2 None Amount of sorbent 55 – 80 kg/h (6) 15 kg/h 22 kg/h Reuse of filter dust in the batch formulation 100 % 100 % 100 % 0 % 100 %
Energy consumption for ESP, including ventilator
125 kWh/h 320 kWh/h 194 kWh/h 250 kWh/h Not available
Service interval Annually Annually As required Not specified Not specified Cost data (7)
Investment costs EUR 2.2 million
EUR 2.5 million
EUR 1.5 million
EUR 2.8 million
EUR (8)0.91 million
Duration of amortization 10 yrs 10 yrs 10 yrs 10 yrs 8 yrs
Operating costs EUR/year 205 000
EUR/year 238 000 EUR/year 120 000 EUR/year
275 000 EUR/year (8)
60 000 Annual amortisation costs
EUR/year 292 600
EUR/year 331 500 EUR/year 199 500 EUR/year
372 400 EUR/year 158 750
Total annual costs EUR/year 497 600
EUR/year 569 500 EUR/year 319 500 EUR/year
647 400 EUR/year 218 750
Estimated costs per tonne of glass EUR 5.26/t glass EUR 2.23/t
glass EUR 3.18/t glass EUR 10.4/t glass
EUR 3.01/t glass (8)
Associated emission levels (AELs) Half-hour
average values Half-hour
average values Half-hour average
values Half-hour
average values Measured data
are not available
mg/Nm3, dry gas at 8 % O2
Dust: 3.0 SOX: 1150 HCl: 7.0 HF: 3.7
Dust: 1.5 SOX: 1327
HCl: 25 HF: 0.5
Dust: 23.8 SOX: 386 HCl: 4.8 HF: 3.0
Dust: 20 SOX: negligible
HCl: 9 HF: 4
Dust: <5 SOX: negligible
HCl: <1 HF: <1
kg/t glass
Dust: 0.0048 SOX: 2.78 HCl: 0.017 HF: 0.009
Dust: 0.0031 SOX: 2.72 HCl: 0.051 HF: 0.001
Dust: 0.037 SOX: 0.60
HCl: 0.0075 HF: 0.005
Dust: 0.127 SOX: negligible
HCl: 0.057 HF: 0.015
Dust: <0.01 SOX: negligible HCl: <0.0015 HF: <0.0015
(1).The installation is equipped with a heat recovery system, before and after the ESP. (2).The installation is equipped with a heat recovery system. (3).The installation is equipped with a batch preheater. (4). The installation is equipped with the SCR technique for NOX reduction. (5). Emissions data indicate the expected levels on the basis of measurements carried out at similar plants. (6). The amount of sorbent depends on the type of glass produced. (7) Cost data are for the year of installation of the air pollution control system and are not necessarily representative of
current costs. (8). Recent cost data (2008) for a 150-250 t/day furnace capacity are the following: investment costs: EUR 1.5 million to 2.0
million, operating costs: EUR 80 000 – 200 000 per year, specific costs: EUR 4.5 – 5.5 per tonne melted glass. Source: [75, Germany-HVG Glass Industry report 2007] [115, EURIMA-ENTEC Costs evaluation 2008]
Chapter 4
Manufacture of Glass 201
Driving force for implementation The accomplishment of the legal emission limits is the most important driving force for the implementation of this technique. An additional factor in the driving force for the installation of dust abatement is the requirement to reduce metal emissions and/or gaseous emissions (SOX, HF, HCl, etc.), which often involve the use of a solid reagent and the production of high levels of particulate emissions. Example plants There are many examples of ESPs used successfully within the glass industry; more than 90 furnaces in Germany and more than 40 in Italy are fitted with ESPs mostly combined with acid gas scrubbing, and also in the other European countries. ESPs are the most common filter used in the glass industry; this technique has been favoured by the industry particularly for large-scale glass installations. In 2007, more than 60 % of all float furnaces were equipped with an electrostatic precipitator. Since 2005, existing float glass installations have been equipped with the abatement system during a cold repair of the furnace. Reference literature [33, Beerkens 1999] [64, FEVE 2007] [94, Beerkens - APC Evaluation 2008] [ 75, Germany-HVG Glass Industry report 2007 ]
4.4.1.3 Bag filters Description Fabric filter systems are used for many applications within the glass industry, due to their high efficiency in controlling the fine particulate matter. Their use in container glass flue-gas filtration is now more common, due to the use of modern and reliable fabrics and control systems. However, due to their potential to blind in certain circumstances, they are not the preferred choice in all applications. In many cases there are technical solutions to these difficulties, but there may be an associated cost. The basic principle of fabric filtration is to select a fabric membrane which is permeable to gas but which will retain the dust. Initially, dust is deposited both on the surface fibres and within the depth of the fabric, but as the surface layer builds up, it itself becomes the dominating filter medium. As the dust cake thickens, the resistance to gas flow increases, and periodic cleaning of the filter media is necessary to control the pressure drop over the filter. The direction of gas flow can be either from the inside of the bag to the outside, or from the outside of the bag to the inside (see Figure 4.4).

Chapter 4
202 Manufacture of Glass
Source: [70, VDI 3469-1 2007]
Figure 4.4: Bag (fabric) filter scheme
The most common cleaning methods of a bag filter include reverse airflow, mechanical shaking, vibration and compressed air pulsing. Often a combination of these methods is used. The normal cleaning mechanisms do not result in the fabric returning to its pristine condition. It is not beneficial to over clean the fabric because the particles deposited within the depth of the fabric help to reduce the pore size between the fibres, thus enabling high efficiencies to be achieved. Fabric filters are designed on the basis of anticipated filtration velocity which is defined as the maximum acceptable gas velocity flowing through a unit area of fabric (expressed in m/s). Filtration velocities generally lie in the range of 0.01 to 0.06 m/s according to the application, the filter type and the cloth. The filter design must optimise the balance between pressure drop (operating cost) and size (capital cost). If the filtration velocity is too high then the pressure drop will be high and the particles will penetrate and blind the fabric. If the filtration velocity is too low the filter will be efficient but very expensive. Because of the tendency of particles present in the waste gas downstream of glass tank furnaces to adhere to the filter material, cleaning of precipitated particles from the filter material may sometimes be difficult. Achieving satisfactory continuous operation can be assisted by the tendency of the particles to agglomerate, by continuously recycling a partial stream of particles cleaned off the filter material to the dirty gas stream. The use of hydrated lime in gas scrubbing enhances this effect. Fabric material selection must take into account the composition of the gases, the nature and particle size of the dust, the method of cleaning to be employed, the required efficiency and the economics. The gas temperature must also be considered, together with the method of gas cooling, if any, and the resultant water vapour and acid dew point. Characteristics of the fabric to be considered include maximum operating temperature, chemical resistance, fibre form and type of yarn, fabric weave, fabric finish, abrasion and flex resistance, strength, collecting efficiency, cloth finishes and cloth permeability.

Chapter 4
Manufacture of Glass 203
Achieved environmental benefits Bag filters are highly efficient dust collection devices and a collection efficiency of 95 – 99 % would be expected. Particulate emissions of between 0.5 and 5 mg/Nm3 can be achieved and levels below 5 mg/Nm3 could be expected in many applications. This generally equates to significantly less than 0.008 kg per tonne of glass melted and less than 0.02 kg/t glass in some specific cases, such as borosilicate glasses or modified soda-lime glasses. However, it should be noted that in cases of discontinuous measurements, the uncertainty of the standard methods (see EN 13284-1: 2003) is of the same order of magnitude as the measured value; therefore, the low concentration data reported should be evaluated cautiously. The necessity of achieving such low levels can be important if dust released from the process contains a significant amount of metals (approaching or exceeding typical emission limit values). The removal of boron compounds from the waste gases may be more efficient with the use of a bag filter which can be operated at relatively low temperatures (see Section 4.4.1). In the mineral wool sector, in particular for stone wool cupola furnaces, it is reported that the application of bag filters on existing installations achieves concentrations of below 10 mg/Nm3
for dust emissions only in about 60 % of the cases. If a scrubbing stage is applied in combination with the bag filter, this will usually result in lower overall acid gas emissions (see Sections 4.4.3 and 4.4.4.2). If the dust is recycled, some of the acid gases will be reemitted. However, a dynamic equilibrium will form where, generally, the uptake in the glass will be higher, some raw material levels may be reduced, and the overall emissions will be lower. For some gaseous pollutants and specific circumstances, the efficiency of dry scrubbing can be higher with bag filters than ESPs, because further absorption can take place on the filter cake, which is on the bags, or during recycling of part of the dust, within mechanisms found in modern bag filtration systems. Cross-media effects The use of bag filters involves consumption of electricity for pressurised air and for the fans and control systems, corresponding to less than 1 % of the energy consumption of the furnace. The indirect CO2 emissions related to the use of electricity will depend on the source of production at the generation plant. The estimated emissions for a 500 tonnes/day float glass furnace are about 2 500 tonnes CO2/year (approximately 2.5 – 3 % of glass furnace CO2 annual emissions). Estimated data for a container glass furnace of 300 tonnes/day indicate that the indirect CO2emissions associated with the use of a bag filter can be up to 3 % of the annual glass furnace CO2 emissions (from combustion and from raw materials). For tableware furnaces, the indirect CO2 emissions are about 200 – 250 tonnes/year, for a capacity of 30 – 40 tonnes/day and 600 tonnes/year for larger furnaces of 180 – 200 tonnes/day (about 3 % of the total CO2 emissions of the furnace). The indirect emissions associated with the use of electricity are estimated to be in the range of 10 – 26 kg CO2 per tonne of melted glass, 0.025 – 0.045 kg NOX per tonne of melted glass and 0.09 – 0.16 kg SO2 per tonne of melted glass, depending on the capacity of the installation (see also Section 8.1.7, Table 8.7, for specific estimated data). As is the case with ESPs, additional indirect emissions are associated with the production of alkaline reagents used for the scrubbing process (sodium bicarbonate, sodium carbonate, calcium hydroxide). Values are estimated in the range of 60 – 200 tonnes CO2/year for container glass furnaces with a capacity of 200 – 600 tonnes/day (<0.5 % of the total CO2 emissions of the furnace), and up to 300 – 600 tonnes CO2/year for large float glass furnaces of 500 – 900 tonnes/day capacity (about 0.5 % of the total CO2 emissions of the furnace).

Chapter 4
204 Manufacture of Glass
If a scrubbing stage is incorporated with the technique, a solid waste stream is generated that must either be recycled to the furnace or disposed of. As for the application of ESPs, the production of solid waste can be a major cross-media effect when dust recycling is not possible and external disposal is necessary. The same limitations presented in Section 4.4.1.2 for the recycling of filter dust are valid when a bag filter is applied. A summary of costs and cross-media effects for air pollution control systems applied to melting glass furnaces is shown in Table 8.7, Section 8.1.7. Operational data As is the case with electrostatic precipitators, the dust reduction efficiency of a bag filter can vary over time and operating conditions (see Section 4.4.1.2, operational data). It is essential to maintain the waste gas temperature within the correct range for a bag filter system. The gas must be maintained above the dew point of any condensable species present (e.g. H2SO4 or water) and below the upper temperature limit of the filter medium. If the temperature is too low condensation occurs, which can cause bag blinding and/or chemical attack of the fabric material. If the temperature is too high, the filter material can be damaged requiring expensive replacement. Conventional filter fabrics usually have a maximum operating temperature of between 130 and 220 °C and in general, the higher the operating temperature, the higher the cost. In most glass processes, the waste gas temperature is between 450 and 800 °C. Therefore, the gas must be cooled before the filter by dilution, quenching or by a heat exchanger. If the flue-gases are likely to contain acidic species (in particular oil-fired furnaces), then it is considered necessary to install a scrubbing stage upstream of the filter, to prevent acid condensation which would damage certain bag materials and the filter housing. For flue-gases containing boron, the scrubbing stage helps precipitate volatile boron species and may make the dust easier to collect without blockages. Although fabric filters are sensitive materials, the technology has improved and modern filters are now suitably robust. Proper control systems exist which allow a good control of the temperature in order to prevent bag fabric damage giving overall good reliability. A well developed technical procedure, combined with a reliable continuous electronic control system, is required to prevent avoidable damage to the filter fabric. Modern bag filter systems contain over 1 000 bags. Damage to a small number of bags does not normally significantly effect filtration efficiency. Continuous dust monitoring systems on the stack effectively identify any potential problem. A summary of the main advantages and disadvantages associated with the use of bag filters is shown in Table 4.9.
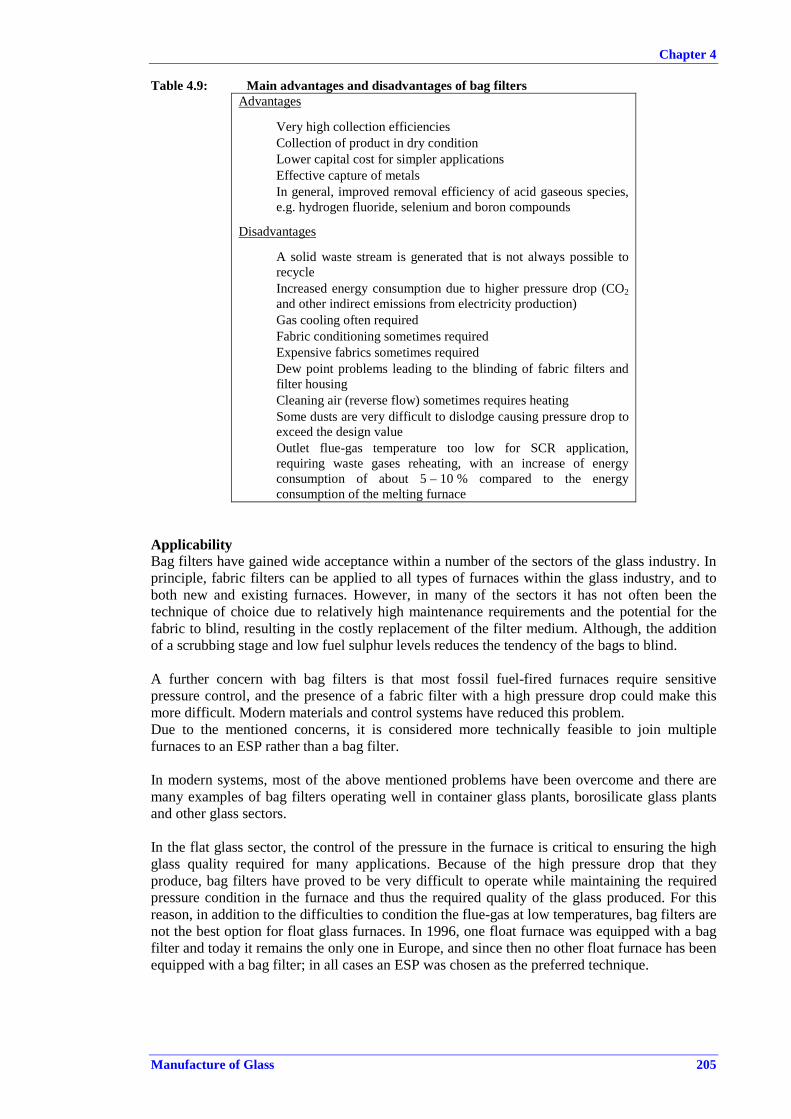
Chapter 4
Manufacture of Glass 205
Table 4.9: Main advantages and disadvantages of bag filters Advantages
• Very high collection efficiencies • Collection of product in dry condition • Lower capital cost for simpler applications • Effective capture of metals • In general, improved removal efficiency of acid gaseous species,
e.g. hydrogen fluoride, selenium and boron compounds
Disadvantages
• A solid waste stream is generated that is not always possible to recycle
• Increased energy consumption due to higher pressure drop (CO2and other indirect emissions from electricity production)
• Gas cooling often required • Fabric conditioning sometimes required • Expensive fabrics sometimes required • Dew point problems leading to the blinding of fabric filters and
filter housing • Cleaning air (reverse flow) sometimes requires heating • Some dusts are very difficult to dislodge causing pressure drop to
exceed the design value • Outlet flue-gas temperature too low for SCR application,
requiring waste gases reheating, with an increase of energy consumption of about 5 – 10 % compared to the energy consumption of the melting furnace
Applicability Bag filters have gained wide acceptance within a number of the sectors of the glass industry. In principle, fabric filters can be applied to all types of furnaces within the glass industry, and to both new and existing furnaces. However, in many of the sectors it has not often been the technique of choice due to relatively high maintenance requirements and the potential for the fabric to blind, resulting in the costly replacement of the filter medium. Although, the addition of a scrubbing stage and low fuel sulphur levels reduces the tendency of the bags to blind. A further concern with bag filters is that most fossil fuel-fired furnaces require sensitive pressure control, and the presence of a fabric filter with a high pressure drop could make this more difficult. Modern materials and control systems have reduced this problem. Due to the mentioned concerns, it is considered more technically feasible to join multiple furnaces to an ESP rather than a bag filter. In modern systems, most of the above mentioned problems have been overcome and there are many examples of bag filters operating well in container glass plants, borosilicate glass plants and other glass sectors. In the flat glass sector, the control of the pressure in the furnace is critical to ensuring the high glass quality required for many applications. Because of the high pressure drop that they produce, bag filters have proved to be very difficult to operate while maintaining the required pressure condition in the furnace and thus the required quality of the glass produced. For this reason, in addition to the difficulties to condition the flue-gas at low temperatures, bag filters are not the best option for float glass furnaces. In 1996, one float furnace was equipped with a bag filter and today it remains the only one in Europe, and since then no other float furnace has been equipped with a bag filter; in all cases an ESP was chosen as the preferred technique.

Chapter 4
206 Manufacture of Glass
Filter blockages due to fabric blinding have been a particular concern in fossil fuel-fired glass wool furnaces (and some other boron-containing glasses), because of the sticky nature of the fine particulate matter, which without a dry scrubbing stage makes it difficult to avoid blockages. The furnaces are usually gas-fired with very low concentrations of acid species, and therefore, with a well maintained bag filter, a scrubbing stage may not be considered necessary. This significantly reduces capital and operating costs and makes dust recycling much easier. However, the use of a scrubbing stage favours the absorption and condensation of volatile species, e.g. boron and selenium compounds. A further concern with bag filters is that most fossil fuel-fired furnaces require sensitive pressure control, and the presence of a fabric filter with a high pressure drop could make this more difficult. Modern materials and control systems have reduced this problem. The technique is widely used in conjunction with electric furnaces, stone wool cupolas, frit furnaces and furnaces for high temperature insulation wools (HTIW) and to a lesser extent for container glass furnaces. In many smaller fossil fuel-fired furnaces, bag filters have been chosen as the technique to operate with scrubbing systems which are installed to reduce acid gas emissions. Furthermore, the lower capital costs of bag filters compared with electrostatic precipitators can be very attractive, offsetting the expenses associated with higher maintenance and the risk of bag blinding. The application of bag filter systems does not represent the best option when the use of SCR is foreseen, due to the generally low operating temperatures, which are not suitable for the operational conditions of the catalyst. Economics In general, investment costs can be lower for a bag filter system than for ESPs but running costs can be higher. However, for large gas volumes, the specific costs of bag filters combined with a dry scrubbing stage are comparable or even higher than for an ESP plus a scrubber system. This is mainly the case for float glass furnaces or for situations where several container glass furnaces are connected to a single air pollution control system. The major factors affecting bag filter costs are: • waste gas volume • filter surface area (depending on requested efficiency) • fabric material (glass fibre, polyamide, polyimide, etc.) • waste gas conditioning to the filter operating temperature • if acid gas scrubbing is required, efficiency of the scrubber and type of scrubbing agent
(i.e. hydrated lime, sodium bicarbonate, sodium carbonate) • plant characteristics (space availability, layout, required site preparation, etc.) • the costs for energy, electricity, water and workforce • dust disposal costs (if not possible to recycle). Cost estimations for different furnace capacities and SOX removal efficiencies have been made on the basis of the methodology reported in Section 8.1, taking into account the two options of a complete filter dust recycling or the total disposal as a waste. Data are based on real costs (e.g. quotations from suppliers) and calculated values [94, Beerkens - APC Evaluation 2008].
An emission concentration for dust in the range of <5 – 10 mg/Nm3 has been taken into account together with a typical initial emission level of 800 – 1000 mg/Nm3 of SOX for gas-fired and 1800 – 2000 mg/Nm3 of SOX for oil-fired furnaces and assuming a limited removal efficiency of SO2 of about 30 % achieved under dry-scrubbing conditions with hydrated lime, unless otherwise specified. The estimated cost data are reported below.

Chapter 4
Manufacture of Glass 207
Float glass production • The estimated total investment cost for a bag filter + dry scrubbing stage is equivalent to
EUR 2.7 million for a 500 tonnes/day gas-fired furnace and EUR 4.5 million for an oil-fired furnace when semi-dry scrubbing is applied in combination with the bag filter.
• The operational costs are estimated in the range of EUR 700 000 to 930 000 per year, depending on the type of fuel and the possibility to recycle the filter dust.
• The estimated specific costs expressed per tonne of melted glass may vary from EUR 7 to 9.5 per tonne of melted glass, depending on the fuel and considering the total disposal of the filter dust.
• The specific costs may vary between EUR 12 and 21 per kg of dust removed and from EUR 0.6 to 1 per kg of SO2 removed, depending on the capacity of the furnace and operating conditions (type of fuel and filter dust disposal).
Container glass production • The total investment costs for an air pollution control system (bag filter + dry scrubbing
stage) may vary between EUR 1.2 million and 2 million, depending on the size of the furnace (200 – 600 tonnes/day).
• The operational costs may vary between EUR 160 000 and 526 000 per year, the lower value being associated with a 200 t/d gas-fired furnace and filter dust recycling and the higher value being associated with an oil-fired furnace with total disposal of the filter dust.
• The specific costs per tonne of melted glass may vary between EUR 2.7 and 7.3, the lower value being associated with a large furnace (600 t/d) and recycling of filter dust and the higher value with an oil-fired furnace of 290 t/d and disposal of the filter dust.
• The specific costs may vary between EUR 13 and 23 per kg of dust removed and between EUR 0.65 and 1.2 per kg of SO2 removed, depending on the capacity of the installation and operating conditions.
• Higher investment costs, around EUR 2.3 million, are expected for air pollution control systems consisting of a bag filter + a semi-dry scrubbing stage applied on a 350 t/d furnace. In this case, the specific costs per tonne of melted glass are in the order of EUR 5 – 6.5.
Domestic glass production • The total investment costs for an air pollution control system (bag filter + dry scrubbing
stage) may vary between EUR 0.77 and 1.15 million, depending on the size of the furnace (30 – 200 tonnes/day).
• The operational costs may vary between EUR 65 000 and 174 000 per year, the lower value being associated with a small gas-fired furnace (30 t/d) and the higher value being associated with a larger gas-fired furnace (180 t/d), both with filter dust recycling.
• The specific costs per tonne of melted glass may vary between EUR 3.8 and 13.8, depending mainly on the size of the furnace: the lower value being associated with larger furnaces and the higher value with a 30 t/d furnace.
• The specific costs per kg of pollutant removed may vary from EUR 23 to 35 per kg of dust removed and from EUR 1.2 to 1.8 per kg of SO2 removed, depending on the capacity of the installation and operating conditions.
Figure 4.5 shows some estimated cost data for bag filters plus dry scrubbers applied to container glass furnaces.
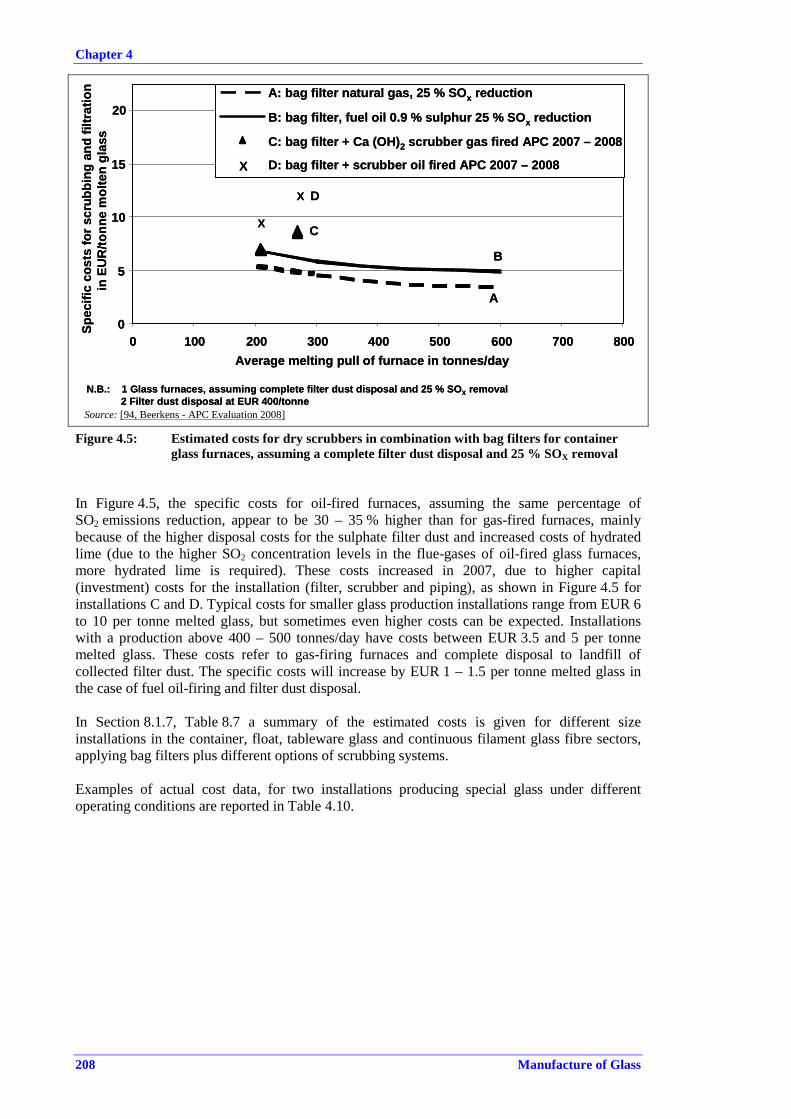
Chapter 4
208 Manufacture of Glass
X
N.B.: 1 Glass furnaces, assuming complete filter dust disposal and 25 % SOX removal2 Filter dust disposal at EUR 400/tonne
0
5
10
15
20
0 100 200 300 400 500 600 700 800
Spec
ific
cost
sfo
rscr
ubbi
ngan
dfil
trat
ion
inEU
R/to
nne
mol
ten
glas
s
A
Average melting pull of furnace in tonnes/day
B
C
D
X
A: bag filter natural gas, 25 % SOx reduction
B: bag filter, fuel oil 0.9 % sulphur 25 % SOx reduction
C: bag filter + Ca (OH)2 scrubber gas fired APC 2007 – 2008
D: bag filter + scrubber oil fired APC 2007 – 2008 X
X
N.B.: 1 Glass furnaces, assuming complete filter dust disposal and 25 % SOX removal2 Filter dust disposal at EUR 400/tonne
0
5
10
15
20
0 100 200 300 400 500 600 700 800
Spec
ific
cost
sfo
rscr
ubbi
ngan
dfil
trat
ion
inEU
R/to
nne
mol
ten
glas
s
A
Average melting pull of furnace in tonnes/day
B
C
D
X
A: bag filter natural gas, 25 % SOx reduction
B: bag filter, fuel oil 0.9 % sulphur 25 % SOx reduction
C: bag filter + Ca (OH)2 scrubber gas fired APC 2007 – 2008
D: bag filter + scrubber oil fired APC 2007 – 2008 X
A: bag filter natural gas, 25 % SOx reduction
B: bag filter, fuel oil 0.9 % sulphur 25 % SOx reduction
C: bag filter + Ca (OH)2 scrubber gas fired APC 2007 – 2008
D: bag filter + scrubber oil fired APC 2007 – 2008 X
Source: [94, Beerkens - APC Evaluation 2008]
Figure 4.5: Estimated costs for dry scrubbers in combination with bag filters for container glass furnaces, assuming a complete filter dust disposal and 25 % SOX removal
In Figure 4.5, the specific costs for oil-fired furnaces, assuming the same percentage of SO2 emissions reduction, appear to be 30 – 35 % higher than for gas-fired furnaces, mainly because of the higher disposal costs for the sulphate filter dust and increased costs of hydrated lime (due to the higher SO2 concentration levels in the flue-gases of oil-fired glass furnaces, more hydrated lime is required). These costs increased in 2007, due to higher capital (investment) costs for the installation (filter, scrubber and piping), as shown in Figure 4.5 for installations C and D. Typical costs for smaller glass production installations range from EUR 6 to 10 per tonne melted glass, but sometimes even higher costs can be expected. Installations with a production above 400 – 500 tonnes/day have costs between EUR 3.5 and 5 per tonne melted glass. These costs refer to gas-firing furnaces and complete disposal to landfill of collected filter dust. The specific costs will increase by EUR 1 – 1.5 per tonne melted glass in the case of fuel oil-firing and filter dust disposal. In Section 8.1.7, Table 8.7 a summary of the estimated costs is given for different size installations in the container, float, tableware glass and continuous filament glass fibre sectors, applying bag filters plus different options of scrubbing systems. Examples of actual cost data, for two installations producing special glass under different operating conditions are reported in Table 4.10.

Chapter 4
Manufacture of Glass 209
Table 4.10: Examples of actual costs of bag filters applied to the special glass sector in two installations
Special glass Installation No 1 (1)
Special glass Installation No 2
Type of furnace Electric melting Oxy-fired Fuel Natural gas Furnace capacity 86 t/day 50 t/day Actual pull rate 80 t/day 40 t/day Electric boosting yes Type of glass Borosilicate, white Borosilicate Cullet 70 % 60 %
Specific energy consumption (2)4.18 GJ/t glass (average of two
furnaces) 6.72 GJ/t glass
Temperature before filter 80 °C 105 °CType of sorbent Ca(OH)2 Ca(OH)2Amount of sorbent 3 kg/h 15 kg/h Reuse of filter dust in the batch formulation 0 % 0 %
Energy consumption for filtration system, including ventilator 20 kWh/h 34 kWh/h
Investment costs (3) EUR 440 000 EUR 1.5 million Duration of amortisation 10 yrs 15 yrs Operating costs EUR 50 000/yr EUR 83 109/yr Annual amortisation costs EUR 58 520/yr EUR 126 000/yr Total annual costs EUR 108 520/yr EUR 209 109/yr Estimated costs per tonne of glass EUR 3.71/t glass EUR 14.32/t glass Associated emission levels (AELs)
Half-hour average values
Half-hour average values
mg/Nm3, dry gas
Dust: 1.2 (4)SOX: 0.7 HCl: 5.1 HF: 0.3
Dust: 0.8 (4)SOX: 4.7 HCl: 22.0 HF: 0.3
Dust: 0.3 (4)SOX: 5.6 HCl: 6.9 HF: 0.45
kg/t glass
Dust: 0.0017 SOX: 0.037 HCl: 0.028 HF: 0.0018
Dust: 0.0008 SOX: 0.013 HCl: 0.061 HF: 0.0009
Dust: 0.0027 SOX: 0.054 HCl: 0.066 HF: 0.0043
(1) Data refer to an installation with two electric furnaces; the indicated production capacity is the sum of the two furnaces.
(2) Data reported refer to energy at the point of use and are not corrected to primary energy. (3) Cost data refer to the filtration and dry scrubbing system. Values are for the year of installation of the air
pollution control system and are not necessarily representative of current costs. (4) Low concentration values are related to spot measurements which may be associated with particularly
favourable conditions. The uncertainty of the measuring method is normally of the same order of magnitude as the measured value (see Section 8.3.2).
Source: [75, Germany-HVG Glass Industry report 2007]
Driving force for implementation Complying with the legal emission limits is the most important driving force. An additional factor in the driving force for the installation of a bag filter system combined with dry or semi-dry scrubbing might be the reduction of metal emissions (Pb, Se, etc.) and/or gaseous emissions (SO2, HCl, HF, etc.). When metals are associated with the dust emissions, bag filters can be a good solution. For volatile metals such as selenium and arsenic, the lower operating temperatures of bag filters promote good capture of the metals.
Chapter 4
210 Manufacture of Glass
Example plants For container glass, more than 16 plants were equipped with bag filters in 2005 and there were many more in other glass sectors. In the EU-27, only one flat glass installation applies a bag filter. References to literature [33, Beerkens 1999] [64, FEVE 2007] [70, VDI 3469-1 2007] [94, Beerkens - APC Evaluation 2008][86, Austrian container glass plants 2007] [110, Austria, Domestic glass plants 2007]
4.4.1.4 Mechanical collectors Description The term mechanical collectors is used to describe techniques which use mechanical forces (gravity, inertia, centrifugal) to separate the dust from the gas stream, for example: • Cyclones-spinning motion imparted to gas, and dust separated by centrifugal force; • gravity settlers – gas enters a large chamber reducing gas velocity and causing dust to
settle out; • baffle chambers – baffles cause gas to change direction and dust to settle out; • louvers-banks of small baffles split and change the direction of gas flow causing dust to
settle out. These techniques have poor collection efficiencies for small particles, in particular with diameters smaller than 10 µm, and due to the low particle size of most dusts encountered in the glass industry, they are rarely used. The exception to this is the cyclone, which can be found in some applications, particularly as a pretreatment stage for other techniques. The operating principles and main advantages and disadvantages are summarised below. However, because they are not considered an effective technique for furnace emissions, cyclones are not described in detail. The cyclone is an inertial gas cleaning device. Dust becomes separated from the gas stream when the direction of gas flow is changed and the dust continues in the original direction by virtue of its inertia and is then deposited on a collection surface. There are two types of cyclones; reverse flow and straight through. Reverse flow cyclones are the most common, and consist of a cylindrical shell with a conical base, a dust collection hopper and air inlets and outlets. There are two main types of reverse flow cyclones; tangential and axial. These classifications arise from the geometry of the air inlet. The inlet gas stream is channelled into a vortex and centripetal forces sustain the circular motion. Particles above a critical size are thrown from the inlet spiral into a wider circular path and are deposited on the cyclone wall. The airflow carries the dust to the collection hopper, and at the base of the cone the gas flow reverses and clean gas passes back along the centre of the cyclone in the outlet spiral. In general, the efficiency of a cyclone increases for corresponding increases in: density of particulate material, inlet velocity, cyclone length, number of gas revolutions, ratio of body diameter to outlet diameter, particle diameter, amount of dust, and smoothness of the cyclone wall. Efficiency decreases with increases in: gas viscosity, gas density, temperature, cyclone diameter, gas outlet diameter, inlet gas duct width, and inlet area. Achieved environmental benefits Cyclones are widely used in many industries and are particularly suitable for collecting particles with diameters greater than 10 µm. Depending on design, medium/high efficiency cyclones give collection efficiencies of 45 – 90 % at 10 µm, and 5 – 30 % at 1 µm. They are frequently placed preceding more expensive technologies, in order to remove coarse material from the gas stream and hence reduce the dust burden entering the main abatement equipment.

Chapter 4
Manufacture of Glass 211
A summary of the main advantages and disadvantages associated with the use of cyclones is shown in Table 4.11.
Table 4.11: Main advantages and disadvantages of cyclones Advantages:
• Low capital and operating costs (including maintenance) • Moderate pressure drop • Low space requirement, relative to other techniques • Capable of operation with high dust loading • Can be used with a wide range of gases and dusts • Can be operated at high temperatures and pressures • Manufacture possible in a wide range of materials Disadvantages:
• Low collection efficiency on small particles • Light materials or needle-shaped materials difficult to remove • Plugging can result where dew points are encountered • Explosion relief for flammable materials is difficult • Potential problems with abrasive dusts
Applicability This technique is rarely used alone within the glass industry, with the exception of the mineral wool sector where cyclones are often used in combination with other depollution systems to treat the waste gases from downstream activities. In general, cyclones are used to remove the coarse material with the aim of reducing the dust entering the main abatement system.
4.4.1.5 High-temperature filter media Description One of the problems with conventional bag filters is the need to maintain the waste gas temperature within the operating range of the filter material. When the temperature goes above the upper temperature limit, the filter has to be bypassed or the gas cooled, e.g. by dilution. Conventional filter materials have a temperature limit of 120 – 180 °C, with some materials up to 250 °C (glass fibre). The costs of the materials increase significantly for materials capable of operating above 180 °C. In some applications, high-temperature media have been used, but these filters are not normal bag filters and usually are similar to candle filter designs. High-temperature filters have been used successfully for abating emissions from some stone wool cupolas but are no longer used due to either high costs or the plant having shut down. The most common high-temperature filters used in other industries are ceramic or high-temperature wool candles for the removal of dust. These filters are made of aluminium-silicate materials and can be applied to temperatures up to 1000 °C. A new type of filter is now available, which combines the technology of ceramic candles with embedded catalyst for the removal of NOX.This is still considered an emerging technique, therefore it is discussed in Section 6.7. Achieved environmental benefits Dust concentrations of <10 mg/Nm3 have been reported with the application of high temperature ceramic filters. More recent information is related to the application of advanced ceramic and catalytic ceramic filters for the removal of multiple pollutants (see Section 6.7). A summary of the main advantages and disadvantages associated with the use of high-temperature filters is presented in Table 4.12.

Chapter 4
212 Manufacture of Glass
Table 4.12: Main advantages and disadvantages of high-temperature filters Advantages:• Can be operated at high temperatures, up to 1000 °C• In general, high resistance to acid gases • High filtration efficiency; up to 99.9 % • No need to reduce the flue-gas temperature with dilution air • Heat recovery systems can be positioned after the filter (cleaned gas) at high temperatures
Disadvantages:• Rigid and expensive materials • High costs for maintenance and damage repairs • Low chemical resistance to HF at high humidity and low temperatures
4.4.1.6 Wet scrubbers Description Wet scrubbing systems can be used to control both gaseous and particulate emissions; although their application is, in general, more efficient for the removal of gaseous pollutants. Whilst the basic technology for both of these is similar, the design criteria for particulate or gas removal are very different. However, to keep down capital costs, wet scrubbing systems are often used to control mixed emissions of particulates and gases. The design is inevitably a compromise, but may represent BAT where separate control systems are prohibitively expensive. Wet scrubbing systems can also be prone to blockage by insoluble particles, and waste slurry is generated. The technique is described in more detail in Section 4.5.6.1.2 for mineral wool non-melting activities, particularly in the forming area applications, and in Section 4.4.3.4 for removal applications of acid gases (SOX, HCl, HF, boron compounds, etc.). In some applications venturi scrubbers may be considered. These systems have a high-pressure drop and consequently they have high power consumption and operating costs. Although good removal efficiencies can be achieved with venturi scrubbers, this technique is considered both technically and economically impracticable in most cases, due to the size of the glass processes. However, the removal of dust emissions by wet scrubbing may find application in some specialised operations, particularly if gaseous emissions also need to be removed. For most glass furnaces, wet scrubbing is not likely to be a useful technique or the most optimum technique for cost-effective particulate matter abatement. Achieved environmental benefits Performance data concerning the application of wet scrubbing systems on conventional glass melting furnaces are not available. The performance of wet scrubbers applied to an electric furnace producing special glass is shown in Section 4.4.3.4 A summary of the main advantages and disadvantages associated with the use of wet scrubbers is presented in Table 4.13.

Chapter 4
Manufacture of Glass 213
Table 4.13: Main advantages and disadvantages of wet scrubbers Advantages:
• Simultaneous removal of particulate matter and gaseous pollutants • Smaller space requirement Disadvantages:
• Generation of a waste water stream to be treated • High efficiencies only with high-pressure drops and high energy consumption • Difficulties and high costs for recovering dust/sludge to reuse in the batch formulation
Economics An estimation of the investement and operating costs related to the application of wet scrubbing systems to glass melting furnaces is summarised below [94, Beerkens - APC Evaluation 2008].
• For an oxy-fired furnace of 100 – 150 tonnes/day producing E-glass, the investment is estimated at EUR 2.65 million, with annual operating costs of EUR 286 400 and a specific cost ranging from EUR 14.4 to 21.5 per tonne melted glass, based on the cost of dust disposal ranging from EUR 100 to 400 per tonne of dust.
• For a conventional air/gas furnace of 100 – 150 tonnes/day producing E-glass, the investment is estimated at EUR 2.96 million, with annual operating costs of EUR 300 000 and a specific cost ranging from EUR 15.7 to 20.5 per tonne melted glass, based on the cost for dust and sludge disposal ranging from EUR 100 to 400 per tonne of dust.
Example plants A very limited number of wet scrubber applications are in operation in the glass industry, particularly in the domestic glass and continuous filament glass fibre sectors. They are: • Bormioli Luigi, Parma, Italy, domestic glass (electric furnaces) • PPG Industries Fibre Glass, Hoogezand, the Netherlands, continuous filament glass fibre. References to literature [94, Beerkens - APC Evaluation 2008]
4.4.2 Nitrogen oxides (NOX)
[88, FEVE Proposal Ch.4-NOX 2007]
The term ‘nitrogen oxides (NOX)’ includes nitric oxide (NO) and nitrogen dioxide (NO2)expressed as the NO2 equivalent. Nitrous oxide (N2O) is not a normal pollutant within the glass industry, and is not covered in the term ‘NOX’. The three main sources of NOX emissions from glass melting activities are raw materials, fuel and thermal NOX. A fourth source, prompt NOX(from the reaction of nitrogen by a complex route with short-lived hydrocarbon radicals) is relatively insignificant. When nitrates are present in the batch materials, NOX will be emitted as the materials melt. In general, the majority of the nitrogen component is emitted as NOX and is not incorporated into the glass. For example, when sodium nitrate (NaNO3) is melted, the sodium component is incorporated into the glass as Na2O and the rest of the compound is released as gases (NOX, O2and N2).

Chapter 4
214 Manufacture of Glass
Fuel NOX arise from the oxidation of nitrogen and nitrogen compounds present in the fuel, but the overall contribution is low in comparison with thermal NOX. With natural gas firing, fuel NO is effectively zero. However, nitrogen can be added to natural gas to control the Wobbe index and the calorific value. This is of particular importance for thermal NOx in oxy-fired furnaces and is discussed in Section 4.4.2.5. Due to the high temperatures in glass furnaces (up to 1650 °C and up to 2500 °C in the flame), the major source of NOX is thermally generated NOX, arising from the oxidation of nitrogen in the combustion atmosphere at temperatures above 1300 °C. The main sources of the nitrogen are combustion air, atomising air (in oil-fired furnaces), nitrogen content in the natural gas (in the case of oxy-fuel combustion), and air leakage into the furnace. The predominant species is NO (90 – 95 %) formed by the overall reaction N2 + O2 → 2NO. Levels of NO2 are very low, and most NO2 detected in the emissions results from atmospheric oxidation of NO. The conditions in the furnace are such that nitrous oxide (N2O) is not detected in the emissions. In electrically heated furnaces, NOX arises from batch material breakdown only. In stone wool cupolas there is an overall reducing atmosphere and NOX emissions are generally very low. Emissions may arise if an afterburner system is installed. The purpose of such a system is to oxidise carbon monoxide and hydrogen sulphide. In fossil fuel-fired furnaces, if all other factors are equal, thermal NOX emissions are reduced if fuel consumption is reduced. Therefore, techniques that improve energy efficiency generally result in lower overall NOX emissions expressed in kg NOX/tonne of melted glass. However, the concentration of the emissions is not always reduced, particularly if waste gas volumes are also lower. The reduction in thermal NOX is a result of a combination of factors but principally, lower temperatures and reduced combustion air levels. Techniques that reduce NOX emissions but are primarily intended to reduce energy consumption are described in Section 4.8 and are not discussed here.
4.4.2.1 Combustion modifications Description The formation of thermal NOX is determined by a series of chemical reactions and is qualitatively described by the formula shown below.
[ ] [ ] [ ] 5.0225.0 exp ON
TB
TA
dtNOd x ××
−=
Where A and B are rate constants, T is the flame temperature (K) and t is the residence time at temperature T (seconds). All gases (NOX, N2, O2) are given in concentrations (gmol/m3). Therefore, the main factors influencing NOX formation are flame temperature, oxygen content in the reaction zone and the residence time in the high temperature zone of the flame. The primary control measures for NOX seek to generate those conditions least favourable for NOXformation, i.e. to avoid the simultaneous presence of nitrogen and oxygen at high temperatures. The main techniques to minimise thermal NOX are summarised below. a. Reduced air: fuel ratio The leakage of air into the furnace, particularly around burner nozzles and through the batch material feeder can lead to increased NOX levels. The burner block is relatively easy to seal and measures can be taken to prevent air ingress at the batch feed area. These measures are relatively cheap and quite effective. The NOX reduction clearly depends on the starting level but can be up to 10 %. Generally, furnaces operate with an excess of air of 5 – 10 % (e.g. 1 – 2 % excess oxygen) to ensure complete combustion. By reducing the air/fuel ratio to near stoichiometric levels,
Chapter 4
Manufacture of Glass 215
significant NOX reductions can be achieved and the technique can also result in significant energy savings; although a slight excess of air is normally required in order to prevent significant losses of fining agent from the batch and to ensure the glass quality. To implement the technique effectively, it will be necessary to monitor the NO, CO and O2 levels in the waste gas. If combustion is substoichiometric, carbon monoxide levels and refractory wear may increase, and the redox level of the glass may be altered thus affecting the glass quality. When firing using fuel oil, the air levels in the furnace may be further reduced by using natural gas, high pressure or steam as an alternative to air for oil atomisation. This reduces oxygen levels and so reduces peak flame temperatures. Results with this technique have been mixed, with very little benefit seen in some applications. This type of change must be implemented carefully and incrementally to avoid problems and to achieve the best results. In some cases (e.g. recuperative furnaces), if the stoichiometry of the furnace as a whole is considered, some burner positions may fire with excess fuel in the hottest parts of the furnace, and others with slightly excess air in cooler parts. Overall, the ratio will be close to stoichiometric. b. Reduced combustion air temperature The flame temperature can be lowered by reducing the combustion air preheat temperature. For example, the combustion air temperatures in recuperative furnaces are significantly lower than in regenerative furnaces, resulting in lower flame temperatures and lower NOX concentrations. However, the lower preheat temperature results in a lower furnace efficiency (lower specific pull), lower fuel efficiency and thus higher fuel demand and potentially higher emissions (kg/tonne of glass) of NOX, CO2, oxides of sulphur, particulate, etc. Thus overall, this technique is unlikely to be of environmental or economic benefit. c. Staged combustion If the fuel and air/oxygen are injected at the same place in the burner, a flame is produced with a hot oxidising primary zone close to the port and a cooler secondary zone further away. The majority of the NOX is produced in the hottest zone. Therefore, by reducing the proportion of either the air or the fuel injected at the burner, the maximum temperature and the NOXformation are reduced. The remaining fuel, air or oxygen is added later in the combustion zone. The application of this principle is the basis of staged combustion, in both cases air staging or fuel staging. Air staging involves firing substoichiometrically and then adding the remaining air or oxygen into the furnace to complete combustion. There are several ways of achieving air or oxygen staging. First experiences by hot air staging have been problematic. The techniques of blowing air staging (BAS) and oxygen-enriched air staging (OEAS) have been developed in the US. As of 2010, there is no available information regarding applications of the air staging process. Fuel staging is based on the following principle: a low impulse gas flame (around 10 % of the total energy) is developed in the port neck. This secondary flame will cover the root of the primary flame, reducing the oxygen content of the primary flame and its core temperature. Therefore, NOX formation is reduced. This technique has been applied widely by the glass industry and is commonly used in most conventional furnaces. At the time of writing (2010), no further improvements were foreseen by using this method.

Chapter 4
216 Manufacture of Glass
d. Flue-gas recirculation Waste gas from the furnace can be reinjected into the flame to reduce the oxygen content and therefore the temperature and the NOX formation efficiency. Difficulties have been encountered by applying this technique in the glass industry at full scale. An innovative application based on internal recirculation of the flue-gases (called ‘flameless combustion’ or ‘flameless oxidation’), has been in operation since 2007 on a recuperative furnace producing special glass (lighting) at the Osram plant, Augsburg, Germany. The system applied is based on the use of special ‘Glass-FLOX®’ technology burners with automatic recirculation of the waste gas. In this case, flue-gas recirculation takes place directly in the combustion chamber; the combusted gases are used to dilute the FLOX® flames. The application shows a reduction efficiency of NOX emissions in the range of 46 – 59 % from the initial value. However, this application is still considered an emerging technique and is described in Section 6.1. e. Low-NOX burners This is a term used to cover a range of proprietary or glass company burner systems designed to minimise NOX formation. These systems can vary in principle and can incorporate a range of features, including some of those described above and others listed below. Systems for gas firing will differ in some ways from those for oil firing. The main features of low-NOX burner systems are given below. • Slower mixing of fuel and air to reduce peak flame temperatures (flame shaping). • Minimum injection velocities that still allow complete combustion (delayed but complete
combustion). • Increased (radiation) emissivity of the flame, with optimisation of the heat transfer to the
glass melt. Therefore, a lower temperature level can still provide the required energy for melting due to the high flame luminosity (effective emission of heat).
• Different nozzles and nozzle designs enable to generate multiple fuel jets per burner; some jets are shielded from the air by other fuel jets, creating soot to improve heat transfer and cooling of the flame, with a consequent reduction of NOX formation. The production of soot may represent a potential problem for the quality of glass.
• Complete combustion with the minimum air/fuel ratio. f. Fuel choice The general experience within the glass industry is that gas-fired furnaces result in higher NOXemissions than oil-fired furnaces. The differences vary widely between furnace type and application but a variation of 25 – 40 % between gas-fired and oil-fired operating conditions is not uncommon. In general, about 5 % energy consumption savings are observed when using fuel oil instead of natural gas.The main reason for this is that gas flames have a lower thermal emissivity than fuel oil flames, requiring higher flame temperatures to enable the same heat transfer to the glass melt and thus more favourable conditions for NOX formation. However, as the industry has developed more experience with gas firing and furnace designs have changed, the difference in NOX emissions and fuel requirements for the two fuels has reduced. In some applications (e.g. container glass), fuel efficiency and NOX emissions of gas-fired furnaces are progressively approaching those associated with fuel oil firing, due to a suitable flame adjustment. However, a comparison between the energy performance obtained with fuel oil and natural gas depends strongly on the furnace and the burner design. To some extent, mixed oil-gas firing maintains the advantages in terms of oil flame radiation while using a proportion of natural gas and is increasingly used in some sectors. As already stated, the nitrogen content of natural gas is generally negligible, but nitrogen can be added in different percentages which may vary from region to region. The addition of nitrogen to natural gas may be necessary to control its calorific value and Wobbe index, which needs to be maintained constant, for instance for safety reasons in household (domestic) applications. This practice occurs in the Netherlands on its natural gas supply net with 11 – 14 % nitrogen in the gas composition. In the UK, the concentration of nitrogen in gas supplied may vary between 0.1 and 5.7 % around the country according to the national grid and this is also the case for

Chapter 4
Manufacture of Glass 217
other Member States, e.g. Portugal, Italy. This source of nitrogen will have a particularly significant effect on NOX emissions from oxy-fuel fired furnaces. The choice between gas and fuel oil is very dependent on the prevailing economic conditions and energy polices of the Member States. It is also reliant on the fuel being available which will vary geographically and also seasonally depending on the security of supply issues. As an example, in Portugal, natural gas is the prevailing fuel in the container glass sector and very little electricity is used. Achieved environmental benefits The indicative emissions reductions that can be achieved using these combustion modification techniques are given in the description for each technique. The effects of these techniques are not cumulative, as there are generally different ways of achieving the same broad objectives. Therefore, a 10 % reduction arising from one technique cannot simply be added to 10 % from another technique. The overall emission reductions for optimised combustion systems vary widely from less than 10 % to greater than 70 %. For a furnace where little or no work has been done using these techniques, reductions in NOX emissions of 40 – 60 % could be expected in most applications. The actual emission levels achievable with these techniques will vary considerably depending on the starting point, the age and design of the furnace, and particularly on the rigour with which they are applied and monitored. A great deal can be achieved with relatively simple measures if they are properly applied. During the last decade, the glass industry has made substantial progress in minimising the formation of NOX emissions by means of combustion modifications and a great deal of resources have been devoted to the work. Aggregated data for the year 2005 concerning the application of primary techniques to container glass furnaces are presented in Table 3.15, where an average NOX emission concentration of 1000 mg/Nm3 is reported for gas-fired furnaces and an average value of 750 mg/Nm3 for oil-fired furnaces. See also data regarding example installations presented in Table 4.15. Cross-media effects The main cross-media effect associated with the application of most of the described techniques is the emissions of carbon monoxide (CO), due to local substoichiometric combustion conditions in the furnace, with potential problems in the recuperators and regenerators where CO is generally oxidised to CO2.
At times, the completion of combustion might take place in the upper part of the regenerators, causing a temperature increase, which generates higher levels of SOX emissions, due to the volatilisation/decomposition phenomena of the sulphates deposited on the surface of the regenerators. Local reducing conditions may also be responsible for an increased evaporation from the glass melt, with higher levels of particulate emissions. Moreover, an early decomposition of sulphates used in the batch with a consequent loss of efficiency of the fining process and higher levels of SOX emissions can occur. The fuel switch from natural gas to oil for improving the emissivity of the flame and for decreasing NOX emissions would lead to a significant increase of SOX emissions, associated with the sulphur content of the fuel oil. In addition, an effect on CO2 emissions would derive from the use of fuel oil, due to its higher carbon intensity.

Chapter 4
218 Manufacture of Glass
Operational data In general, end-fired regenerative furnaces generally give lower NOX emissions than cross-fired regenerative furnaces (see Section 4.2) and the techniques described in this section are generally more successful for end-fired furnaces. In the container glass sector, emission levels of 700 – 1100 mg/Nm3 and 0.9 – 2 kg/tonne of glass have been achieved for cross-fired furnaces. For end-fired furnaces concentration values of 550 – 800 mg/Nm3 and less than 1.5 kg/tonne of glass have been achieved. A limited number of figures have been reported below these levels, for certain applications. Results on recuperative furnaces are more varied, but this may be due to the more variable use of these furnaces. Results comparable to (or sometimes lower than for) regenerative furnaces have been achieved with container glass and continuous filament glass fibre recuperative furnaces. In general, carbon monoxide emissions (measured in the stack) associated with the application of combustion modification techniques to air/fuel-fired glass furnaces are expected to be below 100 mg/Nm3.
A yearly average value of 38 mg/Nm3 (0.107 kg/tonne melted glass) of CO emissions is reported for a float glass furnace of 650 tonnes/day capacity operating with low sulphur fuel oil. The corresponding average value for NOX emissions is 733 mg/Nm3 (2.07 kg/tonne melted glass). Both CO and NOX emissions concentrations refer to continuous measurements. A CO emission level of 30 mg/Nm3 has been reported for a recuperative furnace with a melting capacity of 400 tonnes/day, operated with natural gas or a mixed fuel oil/gas combustion and producing container glass. The furnace applies low-NOX burners, achieving NOX emission levels of about 500 mg/Nm3 (1 kg/t). Both CO and NOX emission concentrations are the result of spot measurements. [165, France 2010]
The application of primary techniques to the glass frits sector is not expected to obtain the same results as for the other glass sectors, due to the peculiar characteristics of the small size furnaces which normally operate in oxidising conditions (excess air for combustion, oxygen enrichment) and with a number of batch formulations which contain significant amounts of nitrates (see Section 3.10.2.2). A summary of the main advantages and disadvantages associated with the application of combustion modifications is shown in Table 4.14.
Table 4.14: Main advantages and disadvantages of combustion modifications Advantages:
• Low relative costs • Substantial reductions in NOX emissions are achievable for most types of furnaces • Applicable to new and existing furnaces (although sometimes only at repair) • These techniques can often result in significant energy savings • The lower furnace temperatures and energy use also result in lower overall emissions Disadvantages:
• Substantial expertise required to obtain the best results (both during startup and normal operation) • Modified furnace design may be required to obtain the best results • Care must be taken to prevent glass quality problems due to redox changes • CO levels must be controlled to avoid prevent refractory damage. Moreover, CO levels must be
controlled to excessive evaporation from the glass melt and to prevent early decomposition of sulphates in the batch blanket
• The more reducing atmosphere may cause an increase of SO2 emissions due to enhanced evaporation and decomposition phenomena

Chapter 4
Manufacture of Glass 219
Some examples of NOX emission levels associated with the application of combustion modifications to the melting furnace are presented in Table 4.15.
Table 4.15: Examples of NOX emission levels associated with the application of combustion modifications
Container glass (1)
Container glass (2) Flat glass (2) Flat glass (2) Domestic
glass
Fuel Natural gas Natural gas + fuel oil Fuel oil Natural gas +
fuel oil Fuel oil
Type of furnace Cross-fired, regenerative
End-fired, regenerative
Cross-fired, regenerative
Cross-fired, regenerative
End-fired, regenerative
Total melting capacity 350 t/day 300 t/day 350 t/day 800 t/day 125 t/day
Actual pull rate 275 t/day 297 t/day 259 t/day 700 t/day 110 t/day Electric boosting No Yes Yes Yes No
Type of glass Flint Amber Cast glass Float glass Not specified Cullet 60 % 72 % 30 % 35 % 40 %
Type of primary measure
Reduced fuel/air ratio;
sealing measures;
furnace design; burners
modification
Reduced fuel/air ratio;
sealing measures;
lambda adjustment,
furnace design; burners
modification
Reduced fuel/air ratio;
sealing measures;
lambda adjustment,
furnace design; burners
modification
Reduced fuel/air ratio;
sealing measures;
lambda adjustment,
furnace design; burners
modification
Sealing measures;lambda adjustment
Specific energy consumption 3.78 GJ/t glass 4.21 GJ/t glass 5.71 GJ/t glass 5.20 GJ/t glass 4.97 GJ/t glass
Associated emission levels (NOX emissions) mg/Nm3, dry gas at 8 % O2
909 507 780 750 827
kg/t melted glass 1.42 0.82 1.89 1.54 1.71
(1) The furnace is equipped with a batch and cullet preheater. (2) The furnaces are equipped with a heat recovery system. Source: [75, Germany-HVG Glass Industry report 2007]
Applicability In principle (and subject to the limitations stated above), these techniques are applicable to all conventional fossil fuel-fired furnaces. Most of the techniques can be applied to both existing and new furnaces. However, the benefits of some techniques (e.g. low-NOX burners) may only be fully realised when combined with the optimum furnace design and geometry, which can only be achieved for a new furnace. The success achieved with these techniques may also depend on the degree of operator expertise and scientific resource. To optimise the systems requires a sustained period of gradual experimentation and monitoring and a high degree of technical expertise and experience. For those operators that do not possess these resources, specialist consultants offer services for furnace combustion modifications and optimisation. This development work of course adds to the costs of the techniques. The degree to which these techniques can be applied will also vary depending on product and process requirements. For example, in some domestic or container glass (luxury bottles or

Chapter 4
220 Manufacture of Glass
flaconnage) production, the product quality constraints demand a highly oxidised, very clear glass. This involves higher residence times, higher temperatures, and the use of oxidising agents, all of which contribute to higher NOX emissions and limit the use of some of the techniques described above. This example is discussed further in Section 4.4.2.2 below. The tendency of all glass sectors is to continuously improve the process by extending the use of these techniques when possible; and to try to determine the emission levels that could be expected in the future with primary techniques. Economics Costs comprise the purchase of adjustable burners, more expensive refractory materials for the regenerators, oxygen sensors (for cross-fired furnaces, more oxygen sensors and a more complex control system are required compared to end-port fired regenerative furnaces), a control unit for air-fuel ratio, maintenance, and workforce to modify and check burner settings. Burner exchanges and changes in burner blocks will typically cost EUR 50 000 to 100 000 for end-port fired furnaces and up to EUR 300 000 to 400 000 for cross-fired furnaces. The costs for an oxygen sensor system are typically between EUR 20 000 and 25 000 for end-port firing, and EUR 60 000 and 125 000 for cross-fired furnaces [94, Beerkens - APC Evaluation 2008].
In the case of furnace design changes, extra investment costs for the refractory materials and steel construction have to be taken into account and this may amount to EUR 2 million for float glass furnaces and EUR 700 000 for end-fired container glass furnaces. The costs of combustion modifications are relatively low and can sometimes be offset by lower operating costs from energy savings. The costs for burners represent replacement costs (not the additional costs) and for a new furnace, the extra costs would be very low. Air-staged combustion systems can be substantially more expensive. These primary techniques combined with formulation optimisation are, in general, much cheaper than secondary abatement techniques. Comparative costs are presented in Section 8.1.7. Driving force for implementation The improvement and implementation of primary measures for the reduction of NOX emissions is based on the principle that actions taken to avoid the formation of NOx have, in general, a better overall environmental impact than end-of-pipe techniques, including a lower economic impact and a potential for energy savings with consequential reduction of other pollutants, e.g. CO2. While it is technically feasible to introduce both primary and secondary measures on the same furnace, a full economic and cross-media assessment of whether it is environmentally or economically justified should be undertaken. In particular, if primary measures have achieved or are foreseen to achieve a certain level of emissions, the decision of whether additional expenditure on secondary measures is justifiable should be made by considering first what can be achieved by these primary measures. Example plants In 2005 in the container glass sector, more than 76 furnaces were applying primary techniques. Other glass sectors are also successfully applying one or more of these techniques. Many furnaces in Europe and US apply adjustable burners and oxygen sensors to control the combustion process (air-fuel ratio). This applies to the container glass, domestic glass, float glass and special glass sectors. Reference literature [33, Beerkens 1999] [64, FEVE 2007] [94, Beerkens - APC Evaluation 2008] [88, FEVE Proposal Ch.4-NOX 2007] [ 117, GWI, VDI-Berichte Nr. 1988 2007 ] [118, CTCV Data for BREF revision 2007]

Chapter 4
Manufacture of Glass 221
4.4.2.2 Batch formulation Nitrates are used in glass manufacture as oxidising agents. By far, the most common nitrate used is sodium nitrate, but in some special glass applications, potassium or barium nitrate are also used. Sodium nitrate (NaNO3) is often used in conjunction with fining agents that require (e.g. As2O3, Sb2O3, CeO2) to be oxidised or maintained to their most oxidised state before the fining process starts (oxygen gas release from melt). Thus sodium nitrate indirectly takes part in the fining process although, in most applications, sodium sulphate would be the preferred fining agent. During the melting process the nitrates dissociate to form NO, NO2, N2, and O2. The O2 is used to oxidise the melt (particularly iron Fe2+ to Fe3+) to give a very clear glass, and to oxidise any organic components of the batch materials. The use of nitrates varies widely between the different sectors of the glass industry. They are rarely used in flat glass or container glass, except to produce some very high quality products (luxury bottles or flaconnage for perfumes and cosmetics), very colourless products or highly coloured glass, e.g. grey or bronze glass. Nitrates are used in the domestic glass sector for some high quality products, which require a high optical clarity and so low Fe2+ levels. Nitrates are widely used in the special glass sector for TV (cathode ray tubes), borosilicate, ceramic and optical glasses and the frits sector. [99, ITC-C080186 2008]
Electric furnaces producing very oxidised glasses or where raw materials containing organic compounds are melted (e.g. glass wool waste) may also require nitrates as oxidising agents. In glass wool production, nitrates are often used to compensate the oxygen consumption during burning of the organic material contained in the batch composition, particularly when high levels of recycled glass are added to the formulation. In frits production, nitrates are in the batch of many of the products in order to obtain the required characteristics. In all, an estimated 7 – 9 % of EU glass production involves the use of significant quantities of nitrates. Typical quantities of around 0.5 – 1 % nitrate are introduced, i.e. 5 – 10 kg NaNO3 per tonne of glass. For some processes, e.g. TV glass or frits, this can be up to 4 % or even higher. During melting, the main gases emitted are NO and O2 with only low levels of N2 and NO2. For 1 % of nitrate introduced in the batch, the maximum NOX emission is 5.4 kg/tonne of glass. This value is equivalent to approximately 2200 mg/Nm3 at 8 % O2, e.g. for a typical domestic glass furnace. The actual NOX emissions from nitrates vary from 30 to 80 % of this maximum, with a typical value under industrial conditions of around 50 – 65 % (although the full range of values is frequently found). The amount of NO emitted from nitrate depends on the heating rate, the redox state of the batch and the effect of the reducing gases (reducing flames) contacting the batch blanket which contains nitrates. Effective alternatives to nitrates are limited by environmental and economic considerations. For example, sulphates can be used but the required quantity is much higher, more than three times, and SO2 is emitted. Arsenic oxides can also be used, but these are being phased out wherever practicable for environmental reasons. Cerium oxide can be used in some cases but is many times more expensive than sodium nitrate. Some process modifications can also reduce the nitrate requirement, but these are generally prohibitive due to quality considerations, energy requirements, throughput restrictions or thermal NOX generation. In conclusion, the current opinion within the industry is that nitrate levels can be reduced by experimentation to the minimum commensurate with product and melting requirements, but due to economic and environmental reasons an effective alternative is still not currently available (as of 2010). In many Member States, the legislation has allowed a doubling of the normal NOX emissions limit for glasses requiring nitrate addition. This approach is not generally considered to be commensurate with the objectives of Directive 2008/1/EC. It makes no allowance for the wide variation in nitrate addition levels and provides little incentive to minimise nitrate usage.

Chapter 4
222 Manufacture of Glass
Furthermore, for processes adding only small amounts of nitrate, the doubling of the emission limit can mask high thermal NOX emissions and could reduce the incentive to optimise firing conditions. The addition of nitrates cannot be considered as an isolated feature of the melting process. In general, glasses that require nitrate also have other specific constraints linked to their use. For example, the melting process for soda-lime glass, tableware or luxury packaging differs from container glass production not only by the use of nitrates, but also by: residence time (at least 50 % longer), by the requirement for much more oxidising conditions in the melt and in the furnace, and by higher glass temperatures (between 50 and 100 °C higher). All of these issues contribute to higher NOX emissions per unit of glass production and can be up to two to three times higher than in container glass end-port-fired regenerative furnaces. The costs of the methods for reducing nitrate addition and the emission levels that can be achieved are very difficult to quantify; they depend greatly on the starting point and are very case specific.
4.4.2.3 Special furnace designs The concern over NOX emissions has led some furnace designers to propose recuperative type furnaces that integrate various features intended to permit lower flame temperatures and therefore lower NOX levels. The best known of this type of furnace is the LoNOX
® melter. Another available design is the Flex® melter, which was originally intended to be used in discontinuous applications but so far, most of the furnaces built are operated continuously. The Flex® melter is understood to have comparable NOX emissions to the LoNOX
® melter. A brief description of the Flex® melter is given in Section 2.3.7, but only the LoNOX
® melter is discussed in detail here. Also the design of regenerative type furnaces can be modified with the aim of reducing NOXemissions. However, detailed information about these applications is not available. In general, the important parameters concerning furnace design with respect to NOX formation/limitation are the following: • type of burners • number of burners in operation • angles of burners • angle of burner port • size of burner ports (which determines the air velocity entering the combustion chamber) • distance between the burner/burner port and the melt • height and size of the combustion chamber (in general, increased sizes are associated with
lower NOX emissions and slightly increased energy consumption of the glass furnace) • geometry of the flame in proportion to the combustion chamber. Description The LoNOX
® melter uses a combination of shallow bath refining and raw material preheating to achieve reduced NOX levels, potentially without the penalty of reduced thermal performance. Combustion air preheating is recuperative and two-stage raw material preheating is used to compensate for the reduction in combustion air preheating compared to a regenerative furnace. The waste gases from the main burners are passed over the raw materials entering the furnace, in an extensive premelting zone, before entering the recuperators. Upon exiting the recuperators, the waste gases are passed through an external cullet preheater, before finally leaving the system. The shallow bath refiner forces the important critical current path close to the surface of the glass bath, thereby reducing the temperature differential between it and the furnace

Chapter 4
Manufacture of Glass 223
superstructure. The furnace can be operated at lower temperatures than a comparable conventional furnace. The LoNOX
® melter is basically long and narrow and is divided into three parts. The first part is used to preheat, and then premelt the batch and cullet. Following this is the primary fining area, where the glass bath depth is reduced to 400 mm (or less). A deep refiner completes the tank. The heating is provided by gas or oil burners in the melting zone and, mainly, in the refining area. The waste gases are exhausted over the top of the batch and cullet in the first part of the furnace, with consequent material preheating. The furnace is divided by internal walls to ensure that the raw materials entering the furnace are not directly heated by radiation from the hotter part of the furnace. Therefore, a high temperature differential is maintained between the raw materials and the gases and efficient heat transfer is achieved. A small amount of electric boosting may be provided to assist the maintenance of convection currents in the preheating area and to avoid relatively low temperatures below the batch blanket. This effect is aided by bubblers installed near the end of the melting zone. The external cullet preheater is positioned after the recuperator and is an important part of the LoNOX
® melter. It is a direct heating system, where the hot waste gases and the cullet to be heated are in contact with each other. The cullet and the waste gas flow countercurrently. The cullet enters the tower construction at the top and slowly makes its way downwards to the exit; the waste gases enter at the bottom and are exhausted at the top. The preheater has internal louvre-type vanes, which distribute the waste gases more evenly through the column of cullet. The cullet residence time in the preheater is around five hours. The waste gases enter the preheater at typically 500 °C and exit at typically 200 °C. The cullet preheat temperature is typically around 350 °C. Achieved environmental benefits Due to the lower combustion temperatures, quite low-NOX levels have been achieved. Emissions below 500 mg/Nm3 are reported for the LoNOX
® melter, which equates to <1 kg NOXper tonne of glass melted. Lower emissions may be possible with increased operating experience and the application of combustion optimisation techniques. The technique can achieve good energy efficiencies; figures of approximately 3.3 GJ/tonne of glass melted were reported for a cullet ratio of 90 – 95 % and an electrical boost of 3 %. This figure, although not corrected for primary energy, compares favourably to modern regenerative furnaces, although cullet levels as high as 90 – 95 % may be difficult to maintain due to the lack of post-consumer cullet and this will impact on the energy performance figures. For normal operating conditions, specific energy consumption is similar to a comparable regenerative furnace. Data concerning the performance of a LoNOX
® furnace producing 358 tonnes per day of container glass, with 80 % cullet in the batch composition are reported, showing an energy consumption of 4.0 GJ/tonne glass (including electric boosting but not taking into account the total primary energy) and measured NOX emissions of 336 mg/Nm3 at 8 % oxygen. [75, Germany-HVG Glass Industry report 2007]
Cross-media effects The LoNOX
® furnace is designed to operate with high levels of cullet, which could cause an increase in the emissions of metals and acid gaseous components (SOx, HCl, HF) contained in the raw material. Due to the low glass depths, an inherent feature of the design is that it is a long, narrow furnace, and the area of the furnace can be significantly greater than a conventional recuperative furnace

Chapter 4
224 Manufacture of Glass
design for a specified pull rate. This increases the space requirements, the capital cost, and the construction material to be used for the furnace and to be disposed of at the end-of-life. As with all cullet preheating systems, there is the potential for emissions of organic species, including odorous substances and potentially dioxins/furans. Measurements have shown dioxin emissions to be below 0.1 ng/Nm3 I-TEQ. These issues are discussed further in Section 4.8. Operational data The data submitted are included with the description. Applicability The technique of special furnace designs relies on significant preheating of the batch composition, which is difficult to achieve without high cullet levels. These furnaces are only really viable when high levels of cullet are used, i.e. greater than 70 %. Therefore, at the time of writing (2010) this implies that the technique is only applicable to the container glass sector and to those furnaces with >70 % cullet. The technique can only be applied at a full rebuild. The dimensions of the tank (long and narrow) may also limit the applicability where there are space restrictions. Economics In 1998, it was estimated that for a 350 tonnes per day container glass furnace, the extra operating costs of this technique were negligible but the extra capital cost may be in the region of EUR 1.8 million. No other information is currently available. Driving force for implementation No data submitted. Example plants Wiegand & Söhne, Steinbach am Wald, Germany - container glass. Reference literature [60, SORG 1999][20, Ehrig et al. 1995] [ 75, Germany-HVG Glass Industry report 2007 ][7, Ind.duVerre 1996],
4.4.2.4 The FENIX process Description The FENIX process is based on the combination of a number of primary measures for the optimisation of combustion of cross-fired regenerative float furnaces and the reduction of energy consumption. In common with the combustion modification techniques described in Section 4.4.2.1, the optimisation of combustion for FENIX relates to: • the reduction of excess air; • the suppression of hotspots thanks to the homogenisation of flame temperatures; and a
controlled mixing of the fuel and combustion air, without giving rise to glass quality problems or carbon monoxide emissions.
The FENIX process also involves a complete modification of the combustion system and particularly the use of a new type of injector. These injectors are under patent registration and are different depending on the type of energy used (gas, heavy oil or mixed energy) and are associated with new furnace designs including: • overall dimensions (length, width, depth of glass), also depending on the pull rate • design of burner ports • regenerators (separate chambers).

Chapter 4
Manufacture of Glass 225
The technology can be implemented on furnaces using gas, heavy oil, or the mixing of the two energies. Combustion control is provided by: • minimising excess air through a reduction of the air for atomisation of fuel oil, special
designs of socket plates, elimination of cold air entrances and maintenance of furnaces; • reducing the fuel/air mixing rate in particular through the optimisation of the number, the
types and the positions (angles) of injectors in the port. The technique also includes a review of the furnace control system and the installation of monitoring methods for certain furnace parameters. In particular, oxygen probes are installed at the top of the regenerator chambers to provide better control of excess air levels. The main characteristics of the FENIX technique are described in the patent application [38, FENIX 1998] and the evolutions since 1998 are under patent registration. Achieved environmental benefits The FENIX process allows the continuous stabilisation of NOX emissions of between 700 and 800 mg/Nm3. For example, NOX emissions of the Stolberg plant, that runs a cross-fired float glass furnace (see Figure 4.6 below) have been stabilised below 800 mg/Nm3 since February 2005, which correspond to a specific emission coefficient of less than 1.7 kg of NOXper tonne of molten glass.
Source: [65, GEPVP-Proposals for GLS revision 2007]
Figure 4.6: NOX emissions from the FENIX process
Cross-media effects At the time of writing this document (2010), the cross-media effects had not been evaluated. Operational data As reported in the Glass BREF adopted in 2001, the first trial in the Aniche plant (France), at that time running with fuel oil, had been carried out following the modifications to the combustion system as described in the patent application [38, FENIX 1998] and had shown a performance of 510 – 580 mg/Nm3 (1.25 kg of NOX/tonne of molten glass) during a short period of tests. This furnace is now (2010) operating with 60 % gas and 40 % heavy oil and the NOX

Chapter 4
226 Manufacture of Glass
emissions have been stabilised consistently at a higher value than the one that was reached during tests, and are in the range of 700 – 800 mg/Nm3.
In the meantime, the Fenix process had also been applied to other furnaces with the same range of emissions (between 700 and 800 mg/Nm3) being achieved. Applicability The FENIX process requires careful application by a specialised team. It has been fully developed on at least nine furnaces of Saint-Gobain Glass in Europe. The technique can be available for float processes when directly integrated during the design and construction of the furnace. Saint-Gobain Glass stated in 2001 that they were ready to grant a non-exclusive licence under the FENIX technology to other glassmakers, provided that an agreement could be reached on the conditions of such a licence. However, the application of this technique requires a previous study of the furnace to be carried out by the supplier; this necessity could make the application to other glassmakers very difficult because of confidentiality issues. At the time of writing this document (2010), this technique has only been applied to cross-fired regenerative furnaces and, due to its specificities, it is improbable that it could be extended to other furnace technologies. The trends of the first results obtained in the Aniche plant that had been reported inside the Glass BREF of 2001 were reproduced on other furnaces, using other fuels, allowing for the conclusion that the NOX emission ranges of 700 – 800 mg/Nm3 could be stabilised consistently. Economics The capital costs, including the furnace modifications (upper cost of refractories), the new burners and the improved control systems amount to approximately EUR 1.5 million for the application to an existing furnace operating with at least part of the energy supply as fuel oil. For a new plant or rebuild, the extra costs would be lower, at around EUR 1 million. Consideration would also have to be given to any licence fee and the time and expertise required to implement the technique. Driving force for implementation No data submitted. Example plants Saint-Gobain Glass, Stolberg, Germany - float glass Saint-Gobain Glass Herzogenrath, Germany - float glass Saint-Gobain Glass, Chantereine, France - float glass Saint-Gobain Glass, Aniche, France - float glass. Reference literature [25, FENIX 1998] [65, GEPVP-Proposals for GLS revision 2007] [38, FENIX 1998]
4.4.2.5 Oxy-fuel melting Description Oxy-fuel melting involves the replacement of the combustion air with oxygen (>90 % purity). The technique can be used with either natural gas or oil as the fuel, although the use of gas is more common. The elimination of the majority of the nitrogen from the combustion atmosphere reduces the volume of the waste gases (composed mainly of CO2 and water vapour) by 70 – 85 % depending on oxygen purity. Oxy-fuel melting can be a very effective technique for NOX abatement and, with the exceptions described below, the technique can be considered technically proven.

Chapter 4
Manufacture of Glass 227
In general, oxy-fuel furnaces have the same basic design as recuperative melters, with multiple lateral burners and a single waste gas exhaust port. In the most modern furnaces, the geometry is optimised for oxy-fuel firing and NOX minimisation. Furnaces designed for oxygen combustion do not currently utilise heat recovery systems to preheat the oxygen supply to the burners, due to safety concerns. The technique potentially involves on-site energy savings, because it is not necessary to heat the atmospheric nitrogen to the temperature of the flames. Less combustion air has to be heated and therefore less energy is lost with the furnace waste gases. The potential energy savings depend greatly on the conventional furnace with which it is being compared. However, the overall energy savings should be evaluated taking into account the indirect energy related to the use of oxy-fuel combustion. When evaluating the performance of an oxy-fuel-fired furnace versus a conventional furnace (fuel-air), the efficiency of the waste gas heat recovery system (recuperator, regenerator, etc.) and the energy required to produce the oxygen must be taken into account. This complex issue is discussed later in this section. The formation of thermal NOX is greatly reduced because the main source of nitrogen in the furnace is much lower, although some nitrogen is still present in the combustion atmosphere. This is derived from the residual nitrogen in the oxygen (PSA, VSA/VPSA 4- 6 %, cryogenic <0.5 %), nitrogen in the fuel (natural gas with 2 – 15 % nitrogen), nitrogen from nitrate breakdown, and from any parasitic air. Due to the high flame temperatures any N2 present is more readily converted to NOX, and even low levels of N2 can prove quite significant. It is therefore important to minimise air ingress into the furnace. The furnace waste gas flow volume is 4 to 7 times lower compared to air-fired furnaces; their temperature can be very high (1200 – 1450 °C) and will usually require cooling. Due to the high water content and concentration of corrosive species (e.g. chlorides and sulphates), cooling is usually by dilution with air. Following dilution, waste gas volumes are generally in the region of 30 – 100 % of conventional furnace waste gas volumes depending on the degree of dilution necessary. Oxy-fuel melting requires different burner designs than those found in conventional air-gas firing. Since the introduction of the technique, the burner systems have undergone substantial development, from early modifications of existing designs for other oxy-fuel applications to the current, highly specialised low-NOX oxy-fuel burners developed specifically for glass making. These systems can feature some of the characteristics of other low-NOX high efficiency burners for conventional firing. Some of the important features of the main proprietary systems are summarised below: • burners with long, wide luminous flames giving uniform heat transfer • multiple oxygen injection per burner, to stage the combustion process • flat flames with wider coverage • delayed mixing of fuel and oxygen to reduce peak flame temperatures in the oxygen rich
zone • no water cooling • flame adjustability for momentum and shaping • multi-fuel use. The oxygen required for combustion can be supplied either by delivery to the site or by on-site production. Except for very small applications (e.g. some isolated frit furnaces), the amounts of oxygen required usually make it more economical to produce the oxygen on-site. However, if a site is situated close to an industrial oxygen pipeline it is usually more cost effective to obtain the oxygen directly from the pipeline. There are two main techniques for producing oxygen on-site, cryogenically or via an absorber system. The oxygen plant is usually owned and operated by the supplier who makes a charge for the oxygen supplied, although some operators will

Chapter 4
228 Manufacture of Glass
chose to have complete ownership of the oxygen plant. On-site oxygen plants are always provided with backup storage of liquid oxygen. Oxygen is produced cryogenically by compressing air and passing it through a purification unit to remove dust, water, carbon dioxide and trace contaminants. The purified air is then cooled and passed through a low-temperature distillation column where the separation takes place. The separated gases can be warmed in heat exchangers to provide gaseous oxygen and nitrogen and, if required, liquid oxygen can be taken from the colder parts of the system. The absorption process usually takes one of two forms; Pressure Swing Absorption (PSA) or Vacuum Pressure Swing Absorption (VSA/VPSA). Both of these are non-cryogenic systems and the separation takes place around ambient temperatures. Compressed air enters the bottom of one of two absorber vessels filled with zeolite, which absorbs most of the nitrogen. The oxygen is withdrawn from the top of the vessel until the zeolite becomes saturated with nitrogen. The air stream is then directed to the second vessel whilst the nitrogen in the first vessel is discharged to the air. In the vacuum system, the nitrogen is removed by vacuum and in the pressure system, it is vented under pressure. The vacuum system usually gives the highest efficiencies. The technique is usually much cheaper than receiving cryogenic oxygen by trucks, but has limited capacity compared to the cryogenic system and is usually chosen for medium level oxygen demands. Most sites supplying only one or two glass furnaces would opt for these techniques (PSA, VSA/VPSA). For multiple furnaces or for furnaces with high O2 demand (e.g. float glass), a cryogenic system may be preferred. The choice depends mainly on economic factors, which can be influenced by local conditions. In the case of float glass installations, cryogenic systems co-generate oxygen for the combustion and nitrogen for the float bath chamber. The technique of partial oxy-fuel heating has been in use in glass making for many years. Two different techniques have been tested: oxygen lancing which was an additional injection of O2 in a conventional air-fuel furnace in order to improve the heat transfer; or the addition of a pure oxy-fuel burner. The technique was used mainly to solve glass quality and furnace pull problems by positioning very hot flames accurately on the melt surface in order to increase temperature gradients and consequently to enhance the convective currents inside the melt. This also reduced the flow of waste gas, while feeding the same energy to the system. The technique was often used to extend the operating life of a furnace that was showing signs of deterioration or regenerator problems. The technique is still used in these ways today but the use is less common due to the problems of potentially increased NOX emissions arising from the high temperatures. ‘Zero-port oxygen burners’ are also used, for instance on float glass furnaces at the end of the furnace campaign to improve the melting of the batch blanket. Achieved environmental benefits It should be noted that concentrations of pollutants in the case of oxy-fired furnaces may show much higher values than those related to air-fuel furnaces, due to the reduced flue-gas volume. Correction of emission concentrations to 8 % oxygen is not meaningful for oxy-fired furnaces, since the oxygen content of the flue-gases includes both the possible excess of oxygen supplied for the combustion and the air entering the furnace and waste gas system. In these cases, the use of emission factors (kg/tonne glass) is more appropriate. This principle should apply even when a combination of flue-gases from different furnaces using diverse combustion techniques (oxy-fuel, enrichment with oxygen, air-fuel) is conveyed to a single stack, which is often the case for glass frits production installations, in order to avoid an incorrect estimation of the emissions.
The main environmental benefit of oxy-firing combustion is a significant potential reduction of NOX emissions (in terms of emission factors) with respect to an equivalent air-fuel-fired furnace without other primary or secondary abatement techniques, and which would generally be

Chapter 4
Manufacture of Glass 229
over 70 %. This figure clearly depends on the point of comparison and can be higher than 95 % and lower than 60 %. Specific emission values of around 0.5 kg NOX/tonne glass, depending on the specific energy consumption, type of natural gas, type/quality of oxygen and furnace age, are reported. In particular cases, emissions as low as 0.23 kg/tonne glass are achieved with the application of oxy-fuel firing (see Table 4.17) [75, Germany-HVG Glass Industry report 2007].
In the glass frits sector, the reported NOX reduction efficiency achieved with oxy-fuel fired furnaces is in the range of 20 – 45 %, due to the peculiar configuration and operating conditions of the melting furnaces (slight negative pressure) that allow parasite air to enter the furnace (see Table 3.51). Apart from the burner choice, the achievable levels depend significantly on the type of natural gas supplied to the combustion system which might contain high percentages of nitrogen, and other parameters reported in the section concerning the operational data, presented below. Oxy-fuel firing might also help to reduce overall emissions of volatile materials from the furnace (particulates, fluorides, chlorides, etc.) due to reduced gas flow over the melt and, in some cases, reduced turbulence, in spite of the high concentration of water vapour in the furnace atmosphere which stimulates the evaporation of alkali or boron. Particulate emissions in soda-lime glass can be reduced by 10 – 30 % from the starting emission levels (air-fuel), although this is not seen in all applications. Particulate emissions are most effectively reduced for glasses containing boron (up to 50 %), in particular for alkali-borate glasses. In the US, the motivation for conversion to oxy-fuel melting has, in several cases, been particulate reduction rather than NOX reduction. In cases where the adoption of oxy-firing results in a reduction in fuel usage, this will also lead to lower SO2, in terms of emission factors, when oil is used to fire the furnaces. However, SOX emissions can be increased if the sulphur retention in the glass decreases due to the modified equilibrium between the glass melt and the combustion gases. Direct emissions of CO2 are also reduced in proportion to any energy savings though the indirect CO2 emissions corresponding to the electrical energy required to produce the oxygen should also be taken into account together with the emissions of other pollutants generated at the power plant. Cross-media effects The main cross-media effect of oxy-fuel combustion is represented by the emissions generated upstream at the power generation plant for the electrical energy used for oxygen production. Oxygen production requires about 0.4 – 1 kWh/Nm3 and, according to primary energy sources, the related emissions will offset to a greater or lesser extent the potential NOX, CO2 and energy reductions obtained with the application of oxy-fuel firing for glass melting. As for all abatement measures that require the use of energy, the environmental benefits observed at the site level are partially eroded when indirect emissions are taken into account. In particular, the reported cross-media effects are the following: • NOX emissions indirectly related to oxygen production are reported to represent up to
10 to 15 % of the reduction of NOx direct emissions; • examples report an increase of CO2 emissions ranging from 35 to 230 %, compared to the
reduction of direct emissions obtained through energy savings; • on average, oxygen production by VSA/VPSA requires approximately 1.44 MJ/Nm3
which corresponds to about 24 % of the combustion energy of the furnace, when taking into account an electrical conversion efficiency of 33 % at the power plant (1 MJ combustion energy supplied to an oxy-fuel fired furnace is equivalent to 1.24 MJ primary energy).
• SOX, dust and other atmospheric emissions are associated with electricity generation.

Chapter 4
230 Manufacture of Glass
In general, it can be said that if the energy savings from oxy-fuel melting outweigh the costs of the oxygen production, then the reduced emissions will significantly outweigh the emissions associated with the oxygen production. In recuperative furnaces without additional energy recovery measures (waste heat boiler or cullet preheating), the average energy saving will be about 25 – 35 %, including the energy consumption for oxygen production. For large regenerative furnaces this value is in the range of 0 – 15 %. For highly efficient regenerative furnaces, this figure can be negative. Some examples concerning the evaluation of cross-media effects of oxy-fuel combustion applied to glass furnaces are presented below (data reported are calculated on the basis of the methodology indicated in Section 8.1). • For a container glass furnace of 225 tonnes/day, the direct decrease of NOX emissions is
80 tonnes/year and the NOX associated with oxygen production is 11 tonnes/year, thus net reduction is equivalent to 69 tonnes/year. The decrease of CO2 release from the furnace is equivalent to 1 942 tonnes/year, but oxygen production causes indirect CO2 emissions for 4444 tonnes/year. Besides, emissions of SO2 released from the average power plant amount to 30 tonnes/year.
• For a continuous filament glass fibre melting furnace, the direct NOX emissions reduction is 80 tonnes/year, but the indirect increase of NOX emissions (power plant) is almost 9 tonnes/year. The emissions of CO2 from the furnace decrease by 5 390 tonnes/year, while the indirect CO2 emissions increase by 3 530 tonnes/year.
A comparison of specific indirect emissions estimated for different glass furnaces and for different abatement pollution control techniques is presented in Section 8.1.7, Table 8.8. In the case of a potential rapid degradation of the refractory superstructure of the melting furnace, the generation of solid waste (refractory materials to be substituted) would represent an additional cross-media effect of the oxy-fuel combustion. Operational data The latest versions of oxy-fuel burners combined with optimised furnace design and operation are reported to give NOX emissions in the range of 0.3 – 0.8 kg NOX/tonne melted glass in the container glass sector, which generally equates to 200 – 500 mg NOX/Nm3.
In the glass frits sector, the achieved NOX emission reductions associated with the application of oxy-fuel melting are much lower. Data reported show emission levels in the range of 7 – 11 kg NOX/tonne of glass melted, to be compared with typical levels of around 13 kg/tonne glass or higher when conventional air-fuel furnaces and oxygen-enriched air-fuel furnaces are used. These values refer to productions whose batch formulation might contain significant levels of nitrates and where the requested operating conditions of the furnaces allow parasitic air to enter the combustion chamber (see Section 3.10.2.2). NOX emissions depend very strongly on the following factors: • the production process of oxygen; oxygen produced by PSA or VSA/VPSA systems still
contains a small percentage of nitrogen; • natural gas quality; in the EU, natural gas is often supplied with more than 10 % nitrogen; • the type of applied burners; stage combustion burners generally lead to lower NOX values
(<0.5 kg/tonne molten glass, in the container glass sector); • the energy consumption of the furnace; this determines the volume flow of flue-gases per
unit mass of glass melt and depends, among other things, on required glass quality, furnace size and cullet ratio in the batch;
• the quality of the fuel; some types of fuel may contain low quantities of organically-bound nitrogen.

Chapter 4
Manufacture of Glass 231
One of the most important issues related to this technique is the potential energy savings that can be achieved. As mentioned above, this can often be the deciding factor in the economic viability of the technique in a particular application. In considering the cost effectiveness of the technique, it must be compared not just with the furnace it replaces, but with all the available options and alternative abatement measures, taking into account the energy used for oxygen production. On-site energy savings can be greater than 50 % when small, thermally inefficient furnaces are converted to oxy-fuel firing. For a medium-sized recuperative furnace with no specialised energy saving measures, standard levels of insulation, and using only internal cullet, the energy use with oxy-fuel melting would be in the region of 20 – 50 % lower. However, for large, energy efficient regenerative furnaces with optimised thermal performance, the savings can be close to zero or can even be negative when primary energy is taken into account, with an increase of up to 5 %. In these cases, the on-site energy savings would not compensate for the cost of the oxygen. Each case is unique and must be considered with regard to its individual circumstances. As a general rule, oxy-fuel-fired furnaces should be very well insulated and sealed in order to avoid problems with corrosion and attack of the refractory superstructure by vapours from the glass melt. Oxy-fuel combustion might lead to an increased degradation but this depends on the refractory choice and on the operational parameters of the furnace. The main issue that could improve the economics of oxy-fuel melting is the recovery of heat from the waste gases. The high temperature of the waste gases improves the potential for heat recovery, but there are also a number of difficulties. The waste gases require cooling prior to any waste gas treatment in order to reach the operating temperature of the abatement equipment and to ensure that any particulate matter that will derive from volatile materials has been condensed. The nature of the waste gases from many furnaces limits the use of direct heat exchangers due to problems of fouling by condensed particulates and corrosion. These problems are increased by high waste gas concentrations associated with oxy-fuel firing. A particular problem exists in glasses which contain boron, where the flue-gases have to be cooled quickly to prevent the formation of sticky solids which are corrosive and readily cause fouling in ducting and abatement equipment such as electrostatic precipitators. For these reasons, in these cases cooling tends to be carried out by dilution with air. For the above reasons, the energy saving measures available for conventional furnaces (e.g. waste heat boilers, high-efficiency burners, and cullet preheating) have not been as widely applied for oxy-fuel furnaces. There is some experience with these techniques and at the time of writing (2010) it is understood that there are at least two furnaces fitted with waste heat boilers and very few oxy-fired furnaces apply cullet or batch preheating. A new technique for batch and cullet preheating, especially designed for oxy-fuel-fired furnaces, which allows to operate at much higher flue-gas temperatures, is expected to be tested in the near future in the US. Some developmental work has been done on preheating gas and oxygen supplies in France (2008), on an oxy-fired float glass furnace. More details are given in Chapter 6, Emerging Techniques, Section 6.2. However, as experience grows, more of these measures may be used in conjunction with oxy-fuel firing. There are no fundamental reasons why most of these techniques could not be used with oxy-fuel firing, but there are important technical issues that must be addressed and would take time to resolve (e.g. possible deterioration of refractory materials, colour changes in glass melt, foaming, etc). Oxy-fuel melting involves higher flame temperatures which in some applications can lead to higher pull rates per square meter of furnace size (up to 25 % increase). This is particularly

Chapter 4
232 Manufacture of Glass
important where there is a desire to increase the capacity of a furnace but where space is not available to accommodate a conventional furnace of the desired size. This situation is aided further by the absence of the preheating system. In some applications, the technique can also lead to better process control and improved glass quality. This is particularly so for some special glass processes that require high melting temperatures. However, the higher levels of oxygen and water vapour may affect the glass chemistry for some glass types, requiring changes to the batch composition. There is still concern about the higher refractory wear and therefore shorter furnace lifetimes. In some cases, it may also lead to a higher level of glass defects (e.g. due to crown dripping). In soda-lime glass, the high vapour pressure of water can cause high NaOH vapour pressures, which can contribute to refractory wear, particularly above the glass level. Refractory suppliers have been developing new materials, such as improved silica and MgO-Al2O3 spinel materials, as an alternative to expensive, fused-cast AZS or alumina materials. However, there is still a degree of financial risk associated with the oxy-fuel technique. The use of higher quality refractory materials can add to the capital cost of the furnace and there remain concerns that they may not be sufficiently resistant in all applications.
Reduced campaign lengths can have a very important financial impact on a plant particularly for larger furnaces such as in float glass. Experience to date (2010) varies from application to application from poor to very good. A great deal of work has been done in this area and the problem can be reduced greatly. Some borosilicate producers report extended furnace lifetimes and, in some applications, lower crown temperatures have been experienced following conversion. It has been proven that, in order to avoid sodium silicate formation and dripping when a silica crown is used, the temperature of the crown should be maintained all the time at a sufficiently high temperature (above 1460 – 1470 ºC). The new high emissivity burner systems are much more effective at transferring heat into the glass. Combined with careful design of the furnace, careful burner positioning and higher quality refractories, these burners make it easier to maintain operation within the thermal resistance limit of the refractories. Under these conditions, a soda-lime container glass furnace with silica crown was still operating in 2009 after 14 years (O-I Europe, Leerdam, Netherlands in operation since 1994). The technique of oxy-fuel melting is under constant development and furnaces designed using the latest techniques are likely to have greater campaign lengths than the earlier furnaces. In some applications problems with foaming have been reported. This can cause quality problems and reduce the efficiency and stability of heating. The high concentration of water vapour in the atmosphere of the furnace created by oxy-fuel promotes gas release from the melt with a potential improvement in fining (fewer seeds) but also much more foaming. The effect of the furnace atmosphere on foam stability is still not fully understood and is a topic for further investigations. In glass wool manufacturing, the high oxygen levels in the furnace can make it easier to recycle wastes containing organic materials without the use of nitrates. Although, oxygen-fired furnaces are considered proven technology, some possibilities remain for the optimisation of furnace geometry, crown height, burner location and height above the melt, positioning of exhaust ports which might improve energy efficiency and accordingly a reduction of CO2 emissions and energy costs. Other possibilities for recovering heat from the low volume flow, but very hot flue-gases, are batch preheating or natural gas preheating and other options for the use of the energy recovered which could be developed. The high concentration of CO2 in the flue-gas could potentially facilitate its capture. A summary of the main advantages and disadvantages associated with the application of oxy-fuel melting is shown in Table 4.16.
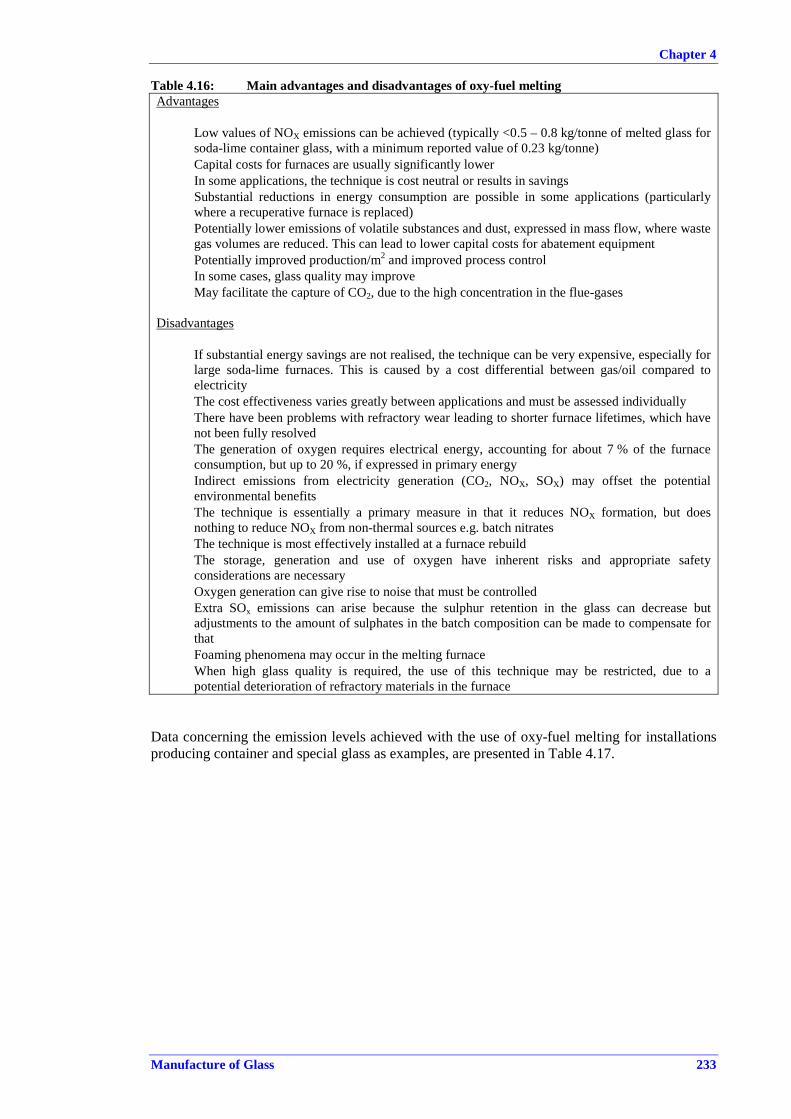
Chapter 4
Manufacture of Glass 233
Table 4.16: Main advantages and disadvantages of oxy-fuel melting Advantages
• Low values of NOX emissions can be achieved (typically <0.5 – 0.8 kg/tonne of melted glass for soda-lime container glass, with a minimum reported value of 0.23 kg/tonne)
• Capital costs for furnaces are usually significantly lower • In some applications, the technique is cost neutral or results in savings • Substantial reductions in energy consumption are possible in some applications (particularly
where a recuperative furnace is replaced) • Potentially lower emissions of volatile substances and dust, expressed in mass flow, where waste
gas volumes are reduced. This can lead to lower capital costs for abatement equipment • Potentially improved production/m2 and improved process control • In some cases, glass quality may improve • May facilitate the capture of CO2, due to the high concentration in the flue-gases Disadvantages
• If substantial energy savings are not realised, the technique can be very expensive, especially for large soda-lime furnaces. This is caused by a cost differential between gas/oil compared to electricity
• The cost effectiveness varies greatly between applications and must be assessed individually • There have been problems with refractory wear leading to shorter furnace lifetimes, which have
not been fully resolved • The generation of oxygen requires electrical energy, accounting for about 7 % of the furnace
consumption, but up to 20 %, if expressed in primary energy • Indirect emissions from electricity generation (CO2, NOX, SOX) may offset the potential
environmental benefits • The technique is essentially a primary measure in that it reduces NOX formation, but does
nothing to reduce NOX from non-thermal sources e.g. batch nitrates • The technique is most effectively installed at a furnace rebuild • The storage, generation and use of oxygen have inherent risks and appropriate safety
considerations are necessary • Oxygen generation can give rise to noise that must be controlled • Extra SOx emissions can arise because the sulphur retention in the glass can decrease but
adjustments to the amount of sulphates in the batch composition can be made to compensate for that
• Foaming phenomena may occur in the melting furnace • When high glass quality is required, the use of this technique may be restricted, due to a
potential deterioration of refractory materials in the furnace
Data concerning the emission levels achieved with the use of oxy-fuel melting for installations producing container and special glass as examples, are presented in Table 4.17.

Chapter 4
234 Manufacture of Glass
Table 4.17: NOX emission levels associated with the use of oxy-fuel melting in example installations
Container glass (1) Special glass Special glass Special glass (2)
Fuel Natural gas Natural gas Natural gas Natural gas Total melting capacity 300 + 350 t/day 50 t/day 50 t/day 40 t/day
Actual pull rate 222 + 280 t/day 40 t/day 50 t/day 40 t/day Electric boosting No Yes Yes Yes
Type of glass Brown, green Borosilicate Borosilicate, containers Glass ceramics
Cullet 66 % (average value) 60 % 40 % 50 %
Specific energy consumption (3)
4.20 GJ/t glass (average value) 6.72 GJ/t glass 10.37 GJ/t glass 12.31 GJ/t glass
Associated emission levels (AELs) 0.23 kg NOX/t glass 1.42 kg NOX/t
glass 6.67 kg NOX/t
glass (4) (5) 5.59 kg NOX/t glass (5)
(1). The installation consists of two furnaces. (2). The installation is equipped with a heat-recovery system, installed before a bag filter. (3). Data reported refer to energy at the point of use and are not corrected to primary energy. (4). The value has been calculated, based on the information provided (mass flow, flue-gas volume, melted glass, measured emissions concentration). (5). The batch formulation contains nitrates. Source: [75, Germany-HVG Glass Industry report 2007]
Applicability Although the principle of 100 % oxy-fuel melting is well established and can be considered applicable to the glass industry as a whole, the problems of implementation should not be underestimated. The technique is applied particularly in the continuous filament glass fibre and special glass sectors; its use in the glass industry as a whole has been limited by a number of factors. The technique is still considered associated with potentially high financial risk for larger capacity furnaces of >500 tonnes/day. A few issues still require further investigations, such as the choice of optimum refractory for the superstructure of the furnace, the prevention and stabilisation of foam formation and the heat recovery from the flue-gases. There are still foaming problems in several oxygen-fired furnaces that are not completely solved. [109, Schep, A decade of oxy-fuel 2003]
In general, it is beneficial to delay installation until the next furnace rebuild to maximise potential benefits and to avoid any anticipated operating problems. In principle, oxy-gas burners could be installed in many processes, except on end-port furnaces, without waiting until a cold repair. Hot installation may lead to energy savings and to an increased pull rate. However, it is unlikely to result in lower NOX emissions and may actually increase NOX levels; also there is a danger of accelerated refractory wear. In 1998 it was estimated that 5 – 10 % of the world’s glass production was made with oxy-fuel melting. Estimations made by the French oxygen producer Air Liquide, indicate that of the total glass production made by oxy-fuel, 25 % is produced in Europe and 56 % in North America. Since then, these figures have been changing with different trends between the sectors. Worldwide there are at least 200 industrial oxygen-fired glass furnaces. Especially in the continuous filament glass fibre sector and the special glass sector, oxy-fuel firing is widely applied. There are five oxy-fired float glass furnaces in the world (three in the US, one in Japan and one in Europe) and about 40 to 50 oxy-fired container glass furnaces, mainly implemented in the US.
Chapter 4
Manufacture of Glass 235
There are also several examples of oxy-fuel melters operating successfully in the mineral wool, special glass and frits sectors. The application of oxy-fuel combustion has encountered more problems in the domestic glass production sector, due to severe foaming that can affect the higher quality requirements for this type of glass. However, some installations are successfully operating with oxy-fired furnaces. Concerning the flat and container glass sector, the main barrier to the application of oxy-fuel combustion is represented by the high costs for oxygen and special refractory material required for the furnace. In Europe, at the time of writing (2010), one oxy-fired furnace was operating in the flat glass sector (cast glass), and one application on a float glass furnace started operations in France. Eight furnaces are operating for the production of container glass representing 3.2 % of the total European production of the sector (in Germany, the Netherlands, France and Italy). In the production of continuous filament glass fibre, more than 50 % of the melting furnaces operating in Europe are oxy-fired, some with electric boosting. In glass frits production, 15 % of the furnaces apply oxy-fuel melting. A significant number of European furnaces in mineral wool, domestic and special glass production (in particular for borosilicate glass tubes) are oxy-fired. The use of oxy-fuel combustion brings with it the potential cross-media effects that need to be taken into account, such as the environmental impact associated with the production of oxygen [ 99, ITC-C080186 2008 ].
Economics The financial aspects of oxy-fuel melting can vary greatly between the different sectors and from case to case. The costs are very difficult to predict, but some indicative figures are given in Section 8.1.7 where a comparison of NOX abatement technique costs is given. The main factors affecting costs are:
• the capital cost compared to the most likely alternative (including extra costs for more durable refractory materials (furnace crown and flue gas channels)
• the possible energy savings that can be achieved (very dependent on furnace size and design)
• the prevailing cost of oxygen for the installation • the potential effect on campaign length and the financial risk that entails. The relative merits of oxy-fuel melting vary widely from case to case and the decision to implement the technique can be strongly affected by other factors, for example, if an increase in pull rate is required without an increase in the size of the furnace, or if the plant is located close to a cheap source of oxygen. The economics can be affected to a certain extent by site-specific factors and each case must be considered based on its individual circumstances. An important factor in the capital cost is that oxy-fuel furnaces do not have a conventional combustion air preheat system and so the capital cost is generally lower than for a regenerative or recuperative furnace of comparable pull rate. This is most evident for new plants where the total cost of the preheating system is saved. The most advanced oxy-fuel burners are generally more expensive than advanced low-NOX burners and the costs of the oxygen control system are quite substantial. However, for most furnaces, the extra costs of the oxy-fuel burners and control systems are significantly lower than the savings for the preheating system. Concerns over the effect of the technique on refractory life lead to the use of more expensive materials for the furnace crown. If necessary, this extra cost could reduce the capital advantage significantly. In fact, initially (1990 – 1995) the lifetime of oxy-fuel-fired glass furnaces was expected to be shorter than that of traditional fuel-air-fired furnaces. However, in the European container glass sector, there are at least a few oxygen fired furnaces with the same lifetime. The design of the furnace, the quality of materials (especially the crown) and a very tight sealing of the superstructure are important factors that determine the furnace lifetime.

Chapter 4
236 Manufacture of Glass
The economic competitiveness of the technique depends mainly on the potential for energy savings and on the relative costs of alternative techniques for achieving comparable NOXemission levels. In many applications that require small to medium-sized furnaces, significant energy savings can be realised, which makes the technique more competitive. Indeed in some applications (particularly furnaces producing <50 tonnes per day) the energy savings alone may be sufficient motivation to install the technique. Larger conventional furnaces tend to be inherently more energy efficient and the potential reductions in overall energy consumption (including the energy for oxygen production), when changing or converting to oxy-firing, are much lower, which increases the overall cost (oxygen costs mainly) of the technique. On the other hand, larger furnaces require high quantities of oxygen, which are normally associated with a better price per m3.
Comparative costs have been calculated for oxy-fired furnaces with high duty silica crown (EUR 300 000 – 400 000 in extra costs) and for crowns constructed of fused cast materials (AZS or alumina). These fused cast materials may increase the costs for the crown of a float glass furnace by EUR 4 – 5 million. The elimination of air preheaters and consequent capital savings is not only the case in the most common glass sectors (container, continuous filament glass fibre, special glass, etc.) but also in the frits industry where the use of air preheating with recuperative heat exchangers is well established and applied to the majority of furnaces. For regenerative furnaces, the regenerator systems can date back to the first furnace built in that position, and they will be repaired, upgraded or replaced as necessary with each furnace rebuild. Therefore, although there is a significant savings it may not be as great as for a new plant. With recuperative furnaces, the recuperator is usually replaced with each furnace rebuild, but the supporting framework may be reused if the furnace design and position are largely unchanged. The capital savings for new plants may vary significantly among different installations. In general, savings in the region of 20 % for recuperative furnaces and 30 – 40 % for regenerative furnaces have been reported. If the supplier operates the oxygen plant, the capital cost is generally included in the oxygen charge and is not considered separately. The housing of the oxygen facility is usually provided by the glass company, but the cost is quite low. If the glass company chooses to operate the oxygen plant independently, the capital cost may be up to 10 % of the furnace cost. If the nitrogen by-product from oxygen generation can be used or sold, then it may contribute to reducing the overall costs. Several documents in the glass industry literature quote the costs of oxy-fuel firing as greater than or equal to SCR. However, this has not always been reflected in practice with some operators reporting cost-neutral conversions or in some cases savings on operating costs. Most of the positive results are from conversions of smaller non-regenerative furnaces, with relatively high specific energy consumption. Excluding concerns over refractory life, in most applications, the determining factor regarding the cost effectiveness of oxy-fuel firing will be the difference between the energy savings and the costs and the cross-media effects of oxygen compared to the costs and the cross-media effects of alternative NOX abatement techniques. This is case specific and while for many smaller furnaces the balance will be beneficial, for larger furnaces the savings are generally lower and the financial balance will depend much more on the specific circumstances and other factors (particularly the annualised capital cost) will become more important. The prevailing energy and particularly the oxygen costs (both of which are subject to variation) are also clearly important.

Chapter 4
Manufacture of Glass 237
In Figure 4.7 below, the total difference in specific melting costs comparing oxygen-gas-fired furnaces with conventional glass furnaces is shown. Estimated data concerning regenerative furnaces for float and container glass and small recuperative furnaces for tableware are reported (see Section 8.1 for the methodology and assumed costs used for the comparative study).
-30
-20
-10
0
10
20
30
40
50
0 0.05 0.1 0.15 0.2
Oxygen price in EUR per Nm3 pure O2
Extr
aco
sts
pert
onne
mol
ten
glas
s(E
UR
/tonn
e) Container glass 225 tonnes/day +5 % extra savings
Tableware recuperative furnace30 tonnes/day
Container glass 225 tonnes/day
Glass fibre 100 tonnes/day
Float glass furnace 500 tonnes/dayfused cast crown
Float glass furnace 500 tonnes/daysilica crown
Source: [94, Beerkens - APC Evaluation 2008]
Figure 4.7: Difference in specific melting costs after conversion from conventional furnaces to oxygen-firing for different glass production installations (container, float,continuous filament glass fibre and tableware)
In Germany, as of 2007, the current average costs for oxygen production were quoted to be in the range of EUR 0.04/m3 and EUR 0.07/m3, depending on the type of generation system used (cryogenic, PSA, VSA/VPSA) and the volume produced, and a final price at delivery point is reported between EUR 0.046 and 0.11 per m3. The electricity needed for the production of oxygen is between 0.4 and 1 kWh/m3, with a typical cost in the range of EUR 0.05 – 0.065 per kWh. [75, Germany-HVG Glass Industry report 2007].The price of oxygen may vary significantly up to a factor of two or more, depending on the amount of oxygen use in the installation. Specific costs related to the application of oxy-fuel melting have been estimated for different types of glass and furnace capacity. The achievable emission levels assumed for the calculation have been the following: • float glass: 1.5 – 2 kg NOX per tonne of melted glass • container glass: 0.5 – 0.9 kg NOX per tonne of melted glass • special glass (no nitrates in the batch): 1 – 1.5 kg NOX per tonne of melted glass. A summary of the results obtained is reported below: Container glass
The estimated costs for furnaces of different capacities (200 tonnes/day and 450 tonne/day), when comparing an end-port regenerative type furnace to an oxy-fired furnace, show a decrease in investment costs of between EUR 2 million for a small furnace and EUR 4.7 million for the larger furnace, with annual operating costs that increase by EUR 450 000 per year and EUR 1.5 million per year, respectively (also depending on the oxygen price, assuming EUR 0.06 per Nm3). The specific cost increase per tonne of melted glass is

Chapter 4
238 Manufacture of Glass
equivalent to EUR 3/tonne glass for the small furnace and EUR 5 – 5.25/tonne glass for the larger capacity furnace. The cost of NOX removal is estimated at EUR 3.4 – 4 per kg NOxfor the small furnace and EUR 5.5 – 6 per kg NOx for the one of larger capacity.
Flat glass
The costs estimation for the application of oxy-fuel combustion to a float glass furnace with a capacity of 500 tonnes/day shows a decrease in investment costs equivalent to EUR 7.5 million in the case of a silica crown for the furnace, reduced to EUR 3.5 million when fused cast material (AZS or alumina) is used for the crown. The operating costs would increase by EUR 2.7 million per year, including costs for CO2 allowances to comply with Directive 2003/87/EC, Emission Trading Scheme (ETS) (although these costs are difficult to calculate, being site-specific and subject to wide variations) and calculated on the basis of a cost for oxygen equivalent to EUR 0.06 per m3. The specific costs would increase by EUR 6.8 per tonne glass up to EUR 11.4 per tonne glass, depending on the type of material used for the furnace crown. A lower price for the oxygen would significantly reduce the cost increase per tonne of melted glass. For a price of EUR 0.045 per m3, the specific cost increase would be in the range of EUR 1.1 and 5.6 per tonne glass. The estimation for the float glass furnace results in a cost for NOX removal of between EUR 3 and 5 per kg NOxremoved.
Domestic glass
For tableware, the extra investment costs estimated for a furnace of 30 tonnes/day are equivalent to EUR 500 000, due to the high quality refractory material required for this type of glass. A decrease in operational costs is expected if the oxygen price is below EUR 0.12/m3. For an existing furnace of 70 tonnes/day, the conversion from regenerative configuration to oxy-fired resulted in a reduction of the investment costs equivalent to EUR 2.25 million. Operating costs increased by EUR 600 000 per year, equivalent to an increase of EUR 12 – 13/tonne of glass, based on an oxygen price of EUR 0.10 per m3.
Continuous filament glass fibre For a furnace of 100 – 120 tonnes/day, the increase of investment costs related to the conversion from a recuperative-type furnace to oxy-fuel combustion has been estimated at EUR 1.5 million, with a reduction of operating costs equivalent to EUR 250 000 per year, taking into account a price for oxygen of EUR 0.10 per m3. In this case, the specific costs per tonne of glass melted will increase by EUR 6 per tonne and the cost of NOX removal is equivalent to EUR 3 – 3.25 per kg NOX.
Glass wool For glass wool, the application of oxy-fuel combustion to a melting furnace of 125 tonnes/day, shows the specific melting costs of about EUR 100 per tonne of glass, calculated on the basis of capital/investment costs (including depreciation and interest costs) and operational costs (including energy, raw materials, CO2 allowances, waste disposal, etc.). The estimation is based on the price for oxygen at the delivery point equivalent to EUR 0.1 per m3 and a cost of electricity of EUR 0.091 per kWh including taxes. Above this furnace capacity, the application of fuel-air combustion appears to have a lower specific cost [115, EURIMA-ENTEC Costs evaluation 2008].
Examples of actual and estimated cost data are reported in Table 4.18 for installations producing different glass types under diverse operating conditions.

Chapter 4
Manufacture of Glass 239
Table 4.18: Examples of actual and estimated costs of oxy-fuel melting applied to the container and special glass sectors.
Container glass(1) Special glass(2) Special glass(3)Fuel Natural gas Natural gas Natural gas Furnace capacity 300 + 350 t/day 50 t/day 50 t/day Actual pull rate 222 + 280 t/day 40 t/day 50 t/day Electric boosting No Yes Yes Type of glass Brown/green Borosilicate Borosilicate
Cullet 66 % (average value) 60 % 40 %
Specific energy consumption (4)
4.20 GJ/t glass (average value) 6.72 GJ/t glass 10.37 GJ/t glass
Associated emission levels (AELs) 0.23 kg NOX/t glass 1.42 kg NOX/t glass 6.67 kg NOX/t glass
Associated costs (5)Oxygen production On-site, cryogenic Delivered, cryogenic On-site, cryogenic Electric energy cost EUR 0.05/kWh EUR 0.065/kWh EUR 0.065/kWh Delivery cost of oxygen EUR 0.046/m3 EUR 0.11/m3 EUR 0.065/m3
Natural gas price EUR 0.0193/kWh EUR 0.025/kWh EUR 0.025/kWh Specific costs for oxy-fuel melting
EUR 9.97/t glass (average value) ∼EUR 23/t glass
Total investment costs including amortisation of entire plant
EUR 34.2/t glass EUR 93.46/t glass EUR 90.73/t glass
Interest rate 6 % Service life 12 years Estimated investment costs for a comparable conventional regenerative furnace
EUR 40.2/t glass (6) EUR 120.13/t glass EUR 142.36/t glass
Estimated difference -15 % -22 % -36 % (1) The installation is equipped with two furnaces. A heat-recovery system is installed before the bag filter. Values for cullet usage and energy consumption are the mean average of the two furnaces. (2) Costs are estimated based on verbal communication from the site management. (3) Costs are estimated based on available information. Costs associated with the use of electric boosting are not included in the calculation. (4) Energy consumption data are not corrected for primary energy. (5) Cost data are for the year of installation of the air pollution control system and are not necessarily representative of current costs. (6) Costs include the amortisation of the entire plant. Source: [ 75, Germany-HVG Glass Industry report 2007 ]
Additional information concerning the comparison of estimated costs and cross-media effects of oxy-fuel firing with other techniques are reported in Section 8.1.7, Table 8.5 Table 8.7 and Table 8.9. Driving force for implementation Oxy-fuel melting is a primary technique that is applied to reduce NOX emissions and, in some specific cases, other atmospheric emissions (particulate). The application of oxy-fuel melting to some sectors of the glass industry (special glass, continuous filament glass fibre, mineral wool) is regarded as a good technical and economic option for the melting process. The reduction of energy consumption may be the driving force for the application of oxy-fuel melting to furnaces in these sectors.

Chapter 4
240 Manufacture of Glass
In the glass frits sector, the NOX removal efficiency associated with oxy-fuel combustion is about 20 – 45 %. Therefore, for this sector the technique is mainly considered a good alternative for the melting process. [99, ITC-C080186 2008].
Example plants Pilkington-LOF, Toledo, Ohio, US - float glass Ardagh Glass, Moerdijk, the Netherlands - container glass Ardagh Glass, Obernkirchen, Germany - container glass O-I Europe, Leerdam, the Netherlands - container glass O-I Europe, Schiedam, the Netherlands - container glass Vetrobalsamo, Sesto San Giovanni, Italy - container glass PPG Industries, Hoogezand, theNetherlands - continuous filament glass fibre PPG Fiber Glass, Wigan, UK - continuous filament glass fibre OCV Reinforcements - Vado Ligure, Italy - continuous filament glass fibre Gerresheimer Pisa, Pisa, Italy - borosilicate glass tubes Schott Glas, Mainz, Germany - special glass Philips Lighting, France, Poland, Netherlands - lighting glass Owens Corning Building Products (UK) Ltd, Cwmbran, UK - glass wool James Kent Ltd, Stoke-on-Trent, UK - frit SGD, Mers, France - container glass, flaconnage Orrefors Kosta Boda, Sweden - <5 tonnes/day crystal glass Verrerie de La Rochère, France - 17 tonnes/day soda-lime Nachtmann, Germany - 9 tonnes/day lead crystal. Reference literature [4, EPA 1994] [7, Ind.duVerre 1996] [30, Infomil 1998] [9, IPC Guidance S2 3.03 1996][33, Beerkens 1999] [18, Ercole 1998] [46, Illy et al. 1998] [19, CPIV 1998] [75, Germany-HVG Glass Industry report 2007] [78, DUTCH oxi-firing furnaces 2007] [79, TNO OxyFiring2005ATIVFinal 2005] [88, FEVE Proposal Ch.4-NOx 2007] [91, ITC - C0713042007] [92, ITC - C071603 2007] [94, Beerkens - APC Evaluation 2008] [79, TNO Oxy-firing 2005, ATIV Final 2005 ] [98, ANFFECC Position of the Frit Sector 2005] [99, ITC-C080186 2008] [ 115, EURIMA-ENTEC Costs evaluation 2008].
4.4.2.6 Chemical reduction by fuel (CRF) Chemical reduction by fuel (CRF) describes those techniques where fuel is added to the waste gas stream to chemically reduce NOX to N2 through a series of reactions. The fuel does not burn but pyrolyses to form radicals which react with the components of the flue-gas to form H2O and N2. The two main techniques that have been developed for use in the glass industry are the 3R process and the reburn process. Both of these techniques are currently restricted to regenerative furnaces. The 3R process has been fully developed for application within the industry but at the time of writing (2010), the reburn process has not yet demonstrated its industrial applicability in the glass industry. The process is based on a series of chemical reactions that take place between the injected fossil fuel and the nitrogen oxides present in the flue-gases. During the first stage of the process, hydrocarbon radicals (CHX) are formed mainly by thermal decomposition in the zone where the fuel (generally natural gas) is injected. The radicals react with NOX formed in the furnace to form other nitrogen species such as HCN and NH3. Once formed, these species rapidly react with other primary NO molecules to form molecular nitrogen (N2). After allowing the reburn fuel to mix and react with the combustion gases, burnout air is injected to complete combustion of the reburn fuel. In the burnout zone, any remaining reduced nitrogen species are completely converted to molecular nitrogen (N2) or back to NO.

Chapter 4
Manufacture of Glass 241
4.4.2.6.1 The 3R process Description The basis of the 3R process is the addition of a hydrocarbon fuel (e.g. natural gas or oil) in a controlled manner to the waste gas stream at the regenerator entrance. This fuel does not burn but dissociates and acts to chemically reduce the NOX formed in the furnace. The technology is designed for use in regenerative furnaces, where the regenerator provides the necessary conditions of temperature, turbulent mixing and residence time for the reactions to proceed. The process name ‘3R’ relates to reaction and reduction in regenerators. There are two main stages involved in the 3R process, deNOX and burnout. In the deNOX stage there are two principle mechanisms; the first involving the reaction between 3R fuel radicals and NO. The radicals (CHx) are formed very quickly as the fuel enters the regenerator. The main reactions occurring at this stage are: CH4 + OH/O/O2 → CHx + H2OCH4 → CHxCHx + NO → HxCN + O CHx + NO → HxCNO + H These reactions are very rapid and take place mainly in the upper regenerator chamber. They account for around 25 % of the NOX reduction. The second mechanism occurs as the waste gases pass down through the regenerator checker-work, where the residence time is relatively long. The CO and H2 (formed from primary and 3R fuels) have adequate time at a high enough temperature to reduce the majority of the remaining NO to N2. This reaction takes place throughout the regenerator system, but predominantly in the checkerwork and accounts for the majority of the NOX reduction achieved by 3R. The main reactions are: CO + NO → ½ N2 + CO2H2 + NO → ½N2+ H2O
The second stage of the process involves the burnout of reduced species, mainly unreacted CO and H2. These species are oxidised by the controlled supply of air into the flue-gases below the regenerator. The main reactions are given below. CO + ½ O2→ CO2CO + OH → CO2 + HCO + HO2 → CO2 + OH The 3R technique should be regarded as a secondary technique such as SCR and SNCR, since it does not prevent formation and not only reduces thermal NOX, but also NOX from other sources, such as raw materials. Achieved environmental benefits Depending on the installation, the emission levels achieved with the application of 3R on regenerative float glass and container glass furnaces are in the range of 1.0 – 1.5 kg/tonne of melted glass. An overall NOX reduction of between 70 – 85 % and NOX emission concentration levels down to 500 mg/Nm3 or lower can be achieved, according to data reported by the 3R technology supplier [65, GEPVP-Proposals for GLS revision 2007].
Cross-media effects The main drawbacks with 3R are that the use of hydrocarbon fuels to achieve the necessary NOX reduction involves an inherent cost and leads to an increase in CO2 emissions. This means it is attractive to combine 3R with more conventional primary NOX reduction measures in order

Chapter 4
242 Manufacture of Glass
to reduce the 3R fuel requirement. But in this case, the overall costs and cross-media effects would need to be taken into account, in particular per tonne of NOX abated. If a waste heat boiler is installed and it is possible to use the recovered energy on site or locally, most of the energy in the 3R fuel can be recovered. In such cases, the overall CO2 increase will be minimal; however, the use of 3R does not necessarily imply that a waste heat boiler would be cost effective overall, but where one is already installed (or intended to be installed) 3R results in a beneficial increase in the furnace load range over which the boiler can be utilised. Overall, this may lead to substantial savings in the site energy requirements and the use of other energy sources (e.g. fossil fuel boilers) can be reduced. An important limitation to the amount of energy that can be recovered is often given by the lack of demand for steam within the installation. As an example, in the container glass sector, generally boilers will only be found on sites using fuel oil (which needs heating) although in recent years there has been a move away from single point boilers to trace heating on many sites where fuel oil is used. With no waste heat recovery on the plant, the extra fuel required is generally around 7 % of the melting energy. This would result in increased CO2 emissions of 25 – 35 kg per tonne of glass melted or 4 – 6 tonnes per tonne of NOX abated. The estimated increase of emissions does not include the extra indirect emissions of CO2 (100 – 150 tonnes/year) and NOX associated with the use of additional electric energy needed for the increased capacity of the fans (additional waste gas volume). In practice, the precise fuel requirement to achieve the desired NOX reduction may vary depending on the specific conditions of the furnace. Damage to regenerators may occur if the 3R process is not properly applied and operated. Reducing flue-gases may lead to an increased corrosion resulting from condensation and deposition phenomena, depending on the type of refractory material used for the regenerator. Operational data The degree of NOX reduction achieved with 3R depends mainly on the amount of extra fuel added and can be tailored to meet various emission standards. For applications to air-fuel-fired float glass furnaces, the achieved NOX concentrations could be below 500 mg/Nm3 at 8 % O2 dry volume. However, the application should be carefully controlled, in particular when some type of refractory material is used. The main aspects of 3R technique are reported below. • The temperature window for injection of fuel is typically >1300 – 1400 ºC in the hot
exhaust gases entering the regenerators. • Eventually, all the injected hydrocarbons are converted into CO2 and H2O vapour,
depending on the amount of available oxygen. • Typical NOX emission reductions are, in general, in the range of 70 – 85 % from the
initial values, but lower reduction rates are also reported in relation to lower amounts of injected hydrocarbons.
• The quantity of extra fuel needed for the 3R process is about 7 – 10 % of the total amount used to provide energy to the melting furnace, but 8 % is the typical value. For a 500 tonnes/day float glass furnace, the additional fuel consumption is typically between 350 and 375 Nm3 natural gas/hour. For a 300 tonnes/day container glass furnace, the extra fuel is 125 – 150 Nm3 natural gas/hour.
• In terms of specific energy consumption, the increase due to the application of 3R is estimated to be about 0.5 GJ/tonne for float glass and 0.36 GJ/tonne for container glass.
• Additional aspects related to the application of 3R concern the refractory materials in the regenerator which may not be resistant towards reducing gases (CO, hydrocarbons and soot), salt deposits with reducing characteristics or high alkali metals concentrations. For the application of the 3R technique, some type of refractory materials must be avoided, in order to prevent potential damages to the regenerator and a reduced lifetime.

Chapter 4
Manufacture of Glass 243
A summary of the main advantages and disadvantages associated with the use of the 3R technique is shown in Table 4.19.
Table 4.19: The main advantages and disadvantages of the 3R technique Advantages
• Can achieve substantial NOX reductions • Applicable to most types of regenerative furnaces (no existing applications in end-fired furnaces) • No major changes to plant design or operation • Low capital costs • Can be applied without the need for a furnace shutdown • No chemical reagents required • Increased fuel usage can, in some cases, be compensated for by waste heat recovery • Reduces NOX from all sources Disadvantages
• Increased fuel usage (generally 7 %, but the increase can, in some cases, be reduced with waste heat recovery)
• Increased CO2 emissions (20 – 30 kg/t glass melted, but the increase can, in some cases, be reduced with waste heat recovery)
• Potential CO emissions • Concern over effect on regenerator refractory material in some applications • Not applicable to non-regenerative furnaces
Applicability The technique, as of 2009, was considered applicable only to regenerative furnaces, but it could be implemented at both new and existing plants and to furnaces firing on either oil or natural gas. The 3R process is mainly applied in the float glass industry, with very few applications in other sectors. There is a concern that the reducing atmosphere created in the regenerators could damage some types of refractory materials, particularly if higher temperatures are also experienced. Most experience with the technique has been gained with float glass furnaces, which tend to use high quality refractory materials in the regenerators. The likelihood of refractory damage is greater with lower quality refractories (e.g. those containing Ca, Fe and Cr) which are found in some container glass plants. This is very case specific but the replacement of existing refractories with materials of higher thermal and chemical resistance could involve substantial costs. The developers of the technique anticipate that regenerator modifications will not be necessary in the vast majority of cases. Economics The typical investment costs range from EUR 200 000 to 350 000, depending on the number of burner ports and the size of the furnace. The operational costs consist mainly of the extra costs for fuel (often natural gas) injected at the top of the regenerator chambers; therefore, they strongly depend on the fuel price. An additional cost consists of the licence fees to be paid for the use of the technology. The license fee formula is quite complex, but over the lifetime of the licence, this typically equates to about EUR 0.5 per tonne of melted glass.

Chapter 4
244 Manufacture of Glass
Float glass Estimated cost data associated with the application of the 3R process to float glass and based on a presumably achieved NOX emission level equivalent to <500 mg/Nm3, are given below. • The investment costs which vary with the size of the furnace, may range from about
EUR 310 000 (500 tonnes/day) to EUR 360 000 (900 tonnes/day). • The operating costs consisting of extra natural gas and the 3R licence may range from
EUR 1.06 million up to EUR 1.3 million per year. • Based on natural gas prices in 2007, the application of the 3R process results in a specific
cost of EUR 6 to 6.25 per tonne melted glass for a float glass furnace of 500 tonnes/day, and about EUR 5.5 per tonne melted glass for a 650 tonne/day furnace. The costs per kg NOX emissions reduction is EUR 1.4 – 1.8 per kg NOX removed. For float glass furnaces, the annual NOX emission reduction is typically 700 – 1 000 tonnes NOX/year, depending on the furnace size and the initial NOX emissions.
• Cost data do not include heat recovery by waste heat boilers. Container glass Estimated costs for the application of the 3R process to container glass furnaces are given below. • The investment costs range from EUR 185 000 (200 tonnes/day) to EUR 280 000
(600 tonnes/day). • Typical operational costs are EUR 300 000 per year for a 200 tonnes/day furnace capacity
up to EUR 780 000 per year for a 600 tonnes/day furnace capacity. This results in EUR 4 – 4.5/tonne melted glass for small and medium size container glass furnaces and EUR 3.75/tonne melted glass for very large furnaces.
• The costs calculated per kg of NOX emissions reduction are about EUR 2.5 per kg NOXremoved. For smaller container glass furnaces (200 – 300 tonnes/day) the achievable emissions reduction is about 125 – 150 tonnes/year of NOX emissions, and for a 600 tonnes/day furnace, more than 300 tonnes/year of NOX emissions can be reduced.
• Cost data do not include heat recovery by waste heat boilers. The rising cost of fuel, and penalties associated with the increased CO2 emission are likely to affect the use of 3R in the future. A summary of cost data and related achieved removal of NOX emissions for a number of 3R applications is presented in Section 8.1.7, Table 8.8 Driving force for implementation To comply with the legal limits and to benefit from the low required investment costs are the main driving forces for using this technique. Example plants In 2007, there were at least 14 furnaces with 3R equipment installed. The applications are mainly in the float glass sector and very few in other sectors. Container glass sector: Short term trials have been performed successfully at United Glass in St. Helens (this plant closed in 1998). The long-term impact of the process was not investigated.

Chapter 4
Manufacture of Glass 245
Float glass sector:
• Pilkington, Weiherhammer, Germany • Pilkington, Gladbeck, Germany • Pilkington, St. Helens, UK, float glass - three furnaces • Pilkington, Finland • Pilkington, Sweden • Pilkington, Marghera-Venice, Italy • Pilkington, US, two float glass furnaces • Guardian Industries, Luxembourg. Special glass sector: Samsung Corning, Korea (TV glass) Reference literature [40, Shulver et al. 1997] [65, GEPVP-Proposals for GLS revision 2007] [85, Spanish BAT Glass Guide 2007] [94, Beerkens - APC Evaluation 2008].
4.4.2.7 Selective catalytic reduction (SCR) Description SCR involves reacting NOX with ammonia in a catalytic bed at the appropriate temperature. Several catalysts are available, each operating over a slightly different temperature window. The most common catalysts are vanadium and titanium oxides (usually TiO2 and V2O5) impregnated onto a metallic or a ceramic substrate. Zeolite molecular sieves can also be used, with the reaction taking place in the microscopic porous structure. The performance of zeolites can be optimised by adding metals such as platinum or palladium to the structure. Whichever catalyst is used, it is important to maintain the correct operating temperature, usually 200 – 500 °C with the optimum 300 – 450 °C. The catalyst units used in the glass industry are modular honeycomb structures, although granular or plate forms are used in other industries. The size of the unit depends on the volume of waste gas being treated and the desired NOX reduction. The modular structure allows easy section replacement, or the addition of further catalyst. Catalyst lifetimes depend on many factors but particularly waste gas composition and plant design. Most suppliers will guarantee a lifetime of three years or more, and in most industrial applications 5 to 6 years could be expected without significant deterioration of activity. Systems are normally designed to achieve 75 – 95 % NOX reduction, although typical long-term removal efficiencies are maintained between 70 and 80 %. In theory, the NOX reduction efficiency increases with the NH3: NOX molar ratio, but this is usually kept as close as possible to 1:1 to minimise ammonia slippage. The NOX reacts with the NH3 according to the overall reactions given below. These reactions normally take place at around 950 °C (see Section 4.4.2.8, SNCR), but the presence of the catalyst lowers the temperature by absorbing the NH3 which reacts with the NO from the gas phase. The ammonia is injected upstream of the catalyst either as liquid NH3 or as an aqueous solution. Urea has been used in some applications but is not favoured by the glass industry.
The main oxidation-reduction reactions are the following: 4NO + 4NH3 + O2 → 4N2 + 6H2O6NO2 + 8NH3 → 7N2 + 12 H2O2NO2 + 4NH3 + O2 → 3N2 + 6 H2O

Chapter 4
246 Manufacture of Glass
Several undesirable reactions can also take place:
2NH3 + 2O2 → N2O + 3H2O2SO2 + O2 → 2SO3SO3 + NH3 + H2O→ NH4.HSO4
With SCR the production of N2O is very low and is not usually a problem. The formation of SO3 and the subsequent reaction to ammonium bisulphate (NH4HSO4) can be a problem, particularly with high sulphur fuels. The ammonium bisulphate can poison the catalyst and cause fouling and corrosion of the equipment. Some dusts containing alkali metals (e.g. MgO, CaO, Na2O, K2O) or heavy metals might also act as catalyst poisons. Although high dust systems exist, with glass processes, it is necessary to install a dust removal unit before the SCR unit. This unit must reduce the dust concentration to 10 – 15 mg/Nm3, and is almost always an electrostatic precipitator. The low operating temperatures of bag filters would require the waste gas to be reheated to the reaction temperature for the catalyst, which would add greatly to the operating costs and would generally be considered prohibitively expensive. It is also necessary to blow air through the catalyst bed (about every two hours) to prevent blinding and blockages by the remaining fine dust. The use of the ESP means that in many cases an acid gas scrubbing system must also be installed upstream of the ESP. Achieved environmental benefits The NOX emission levels achieved will depend mainly on the inlet concentration and on the amount of catalyst and ammonia used. The level of ammonia is usually kept below the ratio 1.1:1 to limit the potential for ammonia breakthrough. Emission concentrations below 500 mg/Nm3 are reported for some applications within the glass industry, e.g. in the container and flat glass sectors with the application of a two-layer catalyst. Higher values, around 700 mg/Nm3, are reported for installations where a one-layer catalyst is used. In theory, given a sufficient amount of catalyst, very low emission levels are possible but in practice there are many limiting factors which restrict performance. Without a high degree of primary NOX abatement measures, more typical glass furnace emissions would be in the range of 1200 – 2000 mg/Nm3, and an 80 – 90 % reduction would give values ranging from below 200 to 500 mg/m3 and 0.5 to 1.0 kg/tonne melted glass for the container glass sector and 1 to 1.5 kg/tonne for flat glass. If combined with the primary measures described in Section 4.4.2.1, very low figures could be anticipated but in this case, the overall costs and cross-media effects would need to be taken into account, in particular per tonne of NOX abated. In practice, as already reported above, the actual values for container and flat glass applications are in the range of 400 – 800 mg/Nm3, with removal efficiencies in the range of 70 – 80 %, depending on the initial concentration of NOX. For special glass productions using nitrates in the batch formulation, with an initial NOX concentration as high as 5000 mg/Nm3, values around 900 mg/Nm3 are reported with the application of the SCR technique. These figures are generally associated with an ammonia slippage in the range of 8 – 20 mg/Nm3; however, values of <30 mg/Nm3 are reported when NOX concentrations in the low end of the range are achieved or when only one-layer catalyst system is applied. Cross-media effects The main cross-media effects associated with the application of the SCR technique are the potential emissions of ammonia, the use of electrical energy and the production of solid waste at the end-of-life of the catalyst.

Chapter 4
Manufacture of Glass 247
The use of ammonia is associated not only with the slippage of unreacted solution but also with environmental and legal safety requirements for ammonia transport, storage and use (for the prevention and control of major accident hazards involving dangerous substances, see Directives 96/82/EC and 2003/105/EC). Indirect emissions related to the production of ammonia should also be considered. Ammonia slippage from the SCR system into the waste gases is normally below 30 mg/Nm3. Aconcentration of about 30 mg/Nm3 has been reported in the case of a one-layer catalyst SCR application on a float glass plant with a NOX starting level of 2400 mg/Nm3 and a removal efficiency of 71 %. A concentration of 33 mg/Nm3 has been reported for a two-layer catalyst application on a float glass furnace, in connection with a low short-term NOX concentration of about 340 mg/Nm3.Ammonia emissions of 20 mg/Nm3 have been reported for a special glass furnace with a starting concentration of 5278 mg/Nm3 and a reduction efficiency of 80 %. Normally an additional catalyst layer can reduce the ammonia slippage and increase the possibility of lowering NOx emissions (total NOx removal >80 %). However, the improved performance is obtained with an additional cost which should be taken into account. The use of electricity (for extra fan capacity and pressurised air to clean the catalyst modules and to atomise the ammonia solution in the flue-gas) and the consumption of ammonia are associated with indirect emissions related to their production. The estimation made for the SCR technique applied to float glass furnaces results in 1.8 – 2.5 tonnes per year of indirect NOXemissions and 800 – 1 500 tonnes CO2 per year, depending on the size of the float glass furnace. Indirect NOX emissions represent only 0.3 to 0.5 % of the amount of NOx reduced by SCR (600 – 1 300 tonnes/year for 500 – 600 tonnes/day float glass melting furnaces) and the indirect CO2 emissions are almost 1 % of the CO2 emissions of the glass furnace. Waste material is produced when the catalyst must be renewed after its lifetime. Typical catalyst lifetimes are 4 – 5 years (>10 years have been reported for container glass) and the volume of waste produced can be 20 m3 for a float glass furnace of 700 tonnes per day. Operational data In most applications within the glass industry, SCR is used to maintain compliance with the applicable local legislation, which is usually not lower than 500 mg/Nm3. NOX emissions levels of <500 mg/Nm3 (<800 mg/Nm3 for high inlet concentration) are normally achieved using SCR. Current operational data are affected by existing legislation concerning both NOX and residual ammonia emissions. In some industries, figures of <200 mg/Nm3 have been achieved, and it is not unreasonable to expect that figures around these levels could be achieved in some cases in the glass industry. However, it should be emphasised that at the time of writing (2010) these lower figures have not been achieved in practice in the glass industry and both the technical and economic implications should be considered. Most existing applications of the SCR technique within the glass industry have achieved reductions in the range of 70 – 80 % but 80 – 95 % could potentially be achieved, particularly with a new SCR installation, by means of larger catalyst volumes (e.g. a second layer of catalyst modules). At the time of writing (2010), container glass and flat glass furnaces were obtaining their best values of between 460 – 500 mg/Nm3 with this technique, without exceeding NH3concentrations of 30 mg/Nm3 downstream of the SCR. Data concerning example installations producing container, flat and special glass, where the SCR technique is used in combination with an ESP and a dry scrubbing stage, are shown in Table 4.20.
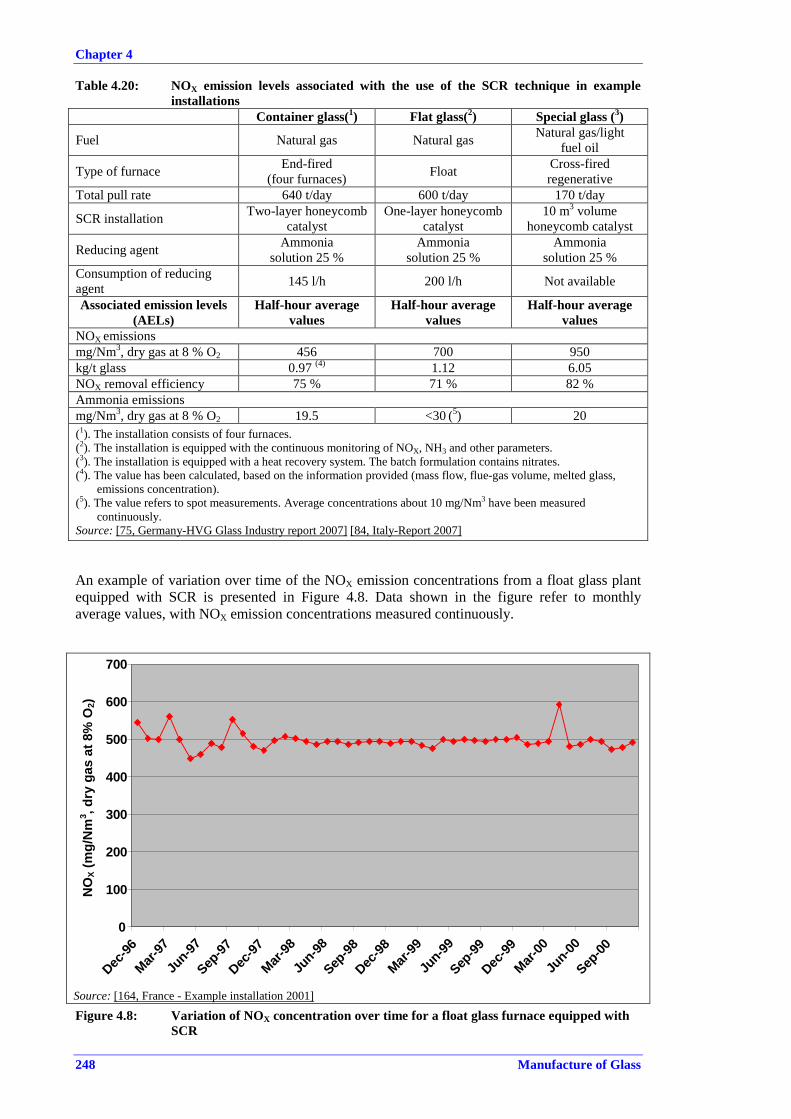
Chapter 4
248 Manufacture of Glass
Table 4.20: NOX emission levels associated with the use of the SCR technique in example installations
Container glass(1) Flat glass(2) Special glass (3)
Fuel Natural gas Natural gas Natural gas/light fuel oil
Type of furnace End-fired (four furnaces) Float Cross-fired
regenerative Total pull rate 640 t/day 600 t/day 170 t/day
SCR installation Two-layer honeycomb catalyst
One-layer honeycomb catalyst
10 m3 volume honeycomb catalyst
Reducing agent Ammonia solution 25 %
Ammonia solution 25 %
Ammonia solution 25 %
Consumption of reducing agent 145 l/h 200 l/h Not available
Associated emission levels (AELs)
Half-hour average values
Half-hour average values
Half-hour average values
NOX emissions mg/Nm3, dry gas at 8 % O2 456 700 950 kg/t glass 0.97 (4) 1.12 6.05 NOX removal efficiency 75 % 71 % 82 % Ammonia emissions mg/Nm3, dry gas at 8 % O2 19.5 <30 (5) 20 (1). The installation consists of four furnaces. (2). The installation is equipped with the continuous monitoring of NOX, NH3 and other parameters. (3). The installation is equipped with a heat recovery system. The batch formulation contains nitrates. (4). The value has been calculated, based on the information provided (mass flow, flue-gas volume, melted glass, emissions concentration). (5). The value refers to spot measurements. Average concentrations about 10 mg/Nm3 have been measured continuously. Source: [75, Germany-HVG Glass Industry report 2007] [84, Italy-Report 2007]
An example of variation over time of the NOX emission concentrations from a float glass plant equipped with SCR is presented in Figure 4.8. Data shown in the figure refer to monthly average values, with NOX emission concentrations measured continuously.
0
100
200
300
400
500
600
700
Dec-96
Mar-97
Jun-97
Sep-97
Dec-97
Mar-98
Jun-98
Sep-98
Dec-98
Mar-99
Jun-99
Sep-99
Dec-99
Mar-00
Jun-0
0
Sep-00
NO
X(m
g/N
m3 ,d
ryga
sat
8%O
2)
Source: [164, France - Example installation 2001]
Figure 4.8: Variation of NOX concentration over time for a float glass furnace equipped with SCR

Chapter 4
Manufacture of Glass 249
On the same float glass furnace, discontinuous measurements were performed by a certified laboratory, over a comparable time period. The results of the measurements are presented in Table 4.21 both in concentration (mg/Nm3, at 8 % O2) and mass emissions (kg/tonne melted glass).
Table 4.21: Results of discontinuous NOX emissions measurements from a float glass furnace equipped with SCR
NOx emissions (1)Date mg/Nm3, at 8 % O2 kg/tonne melted glass
Feb-97 485 1.15 Apr-98 419 1.01 Nov-98 372 0.91 Apr-99 433 1.04 Oct-99 375 0.92 Apr-00 343 0.84 Nov-00 411 1.00
(1) Values refer to discontinuous measurements carried out by a certified laboratory Source: [164, France - Example installation 2001]
The NH3 reagent used for the SCR process is often pre-evaporated and injected as vapour under pressure into the flue-gas upstream of the catalyst bed. Either liquid ammonia or an aqueous solution (usually 25 %) can be used. Liquid NH3 is a hazardous substance and there are important cost and safety issues associated with its storage and use, including neighbourhood awareness. Most glass processes do not use these types of chemicals and operators prefer to use an aqueous solution, which also requires careful storage and handling. Site-specific issues, in particular the proximity of housing and sensitive environments must be taken into account. The SCR operating temperature should be above 330 °C to avoid the formation of ammonium bisulphate (NH4•HSO4). This condensation/deposition product can foul the catalyst surfaces and the SCR installation leading to poor performance. When these phenomena do not occur, the lifetime of the catalyst should be at least 4 – 5 years for most glass furnaces and flue-gas characteristics, but much longer periods have been claimed (up to 10 – 12 years). The typical volume of catalyst needed for a float glass furnace of 700 tonnes/day molten glass (90 000 Nm3/h flue-gas volume) is 20 m3 (one layer). Normally, it is estimated that 0.008 m3 of catalyst is used per tonne of NOX emissions reduction, and a volume of 20 m3 used for a period of 4 – 5 years will reduce the total NOx emissions by about 2 500 – 3 000 tonnes over the period. The use of a double layer catalyst will improve the removal efficiency of NOX and lower the ammonia slippage. With one layer, the NOx reduction is about 75 – 80 %, for a certain ammonia dosing level. A higher ammonia dosing rate used with a single layer catalyst (1 – 1.3 metres in height) will increase ammonia slippage to values that may become unacceptable. A summary of the main advantages and disadvantages associated with the application of the SCR technique is shown in Table 4.22.

Chapter 4
250 Manufacture of Glass
Table 4.22: Main advantages and disadvantages of the SCR technique Advantages:
• Very high NOx reduction efficiency • Reduces NOx from all sources in the furnace, not only thermal NOx• May form part of an integrated air pollution control system • Several examples within the glass industry for different glass sectors • Performance guarantees often available from suppliers Disadvantages:
• Technical issues still to be resolved in some applications (e.g. some glasses which contain boron)
• Ammonia is consumed and partly emitted to the air. Cross-media effects related to ammonia production and the environmental and safety concerns associated with storage and handling.
• Energy is consumed by the system • Must be installed with dust abatement and acid gas scrubbing, low dust and SO2 levels are
required • Relatively high capital cost particularly for small plants • High space requirement • Relative cost benefit under erosion by developments of other less expensive techniques • Concerns persist over catalyst lifetimes • Possible interaction between SCR catalyst and other emissions (e.g. SO2)• The operating temperature limits the possibilities for heat recovery • Gas cooling may be required for recuperative furnaces • Due to a required minimum operating temperature, SCR is not compatible with the use of
bag filters unless the waste gas is reheated.
Applicability In principle, SCR can be applied to most new and existing processes in the glass industry. However, there are a number of issues that severely limit the applicability of the technique in certain cases. High levels of SO2 in the flue-gas can result in ammonium bisulphate formation causing a poisoning of the catalyst and corrosion. This is potentially also true for gas-fired furnaces with high sulphate levels. In order to avoid this problem, the flue-gas temperature must be maintained above 330 °C. One of the key aspects of the costs of SCR is the catalyst lifetime, which could be significantly reduced if poisoning occurs. SCR has been used in the power industry to treat gases with high SO2 concentrations, and the problem has been solved by the use of efficient flue-gas desulphurisation techniques upstream of the equipment. The SO2 removal efficiency of gas scrubbing systems generally used within the glass industry is unlikely to be adequate for SCR. More efficient SO2 removal would add substantially to the costs and would make it difficult to recycle the collected material to the furnace, thus creating a further waste stream. Further information is given in Section 4.4.3. However, successful experience has been reported with the use of SCR on oil-fired furnaces. This might suggest that the use of fuel oil is no longer a limiting factor for the implementation of SCR; however, this aspect needs to be investigated thoroughly. SCR requires a lot of space, particularly if the scrubbing and filter units are not already installed. On some existing plants where space is limited, this could add substantially to the cost of the technique or, in some cases, make it prohibitively expensive. Another important factor influencing the applicability of SCR is the temperature of the flue-gases. It is not generally practicable to use SCR in combination with a bag filter system because the low operating temperature, in the range of 180 – 200 ºC, would usually make it necessary to reheat the waste gas. The cost of reheating the gas to around 400 °C is generally prohibitively
Chapter 4
Manufacture of Glass 251
expensive, with an increase of energy consumption in the range of 5 – 10 % compared to the energy input of a glass melting furnace. Even in the case of ESP filtration, the temperature window might become too low due to large variations of production (e.g. the production of very thin float glass), negatively affecting the efficiency of the SCR system. SCR also requires very low dust levels (preferably <10 mg/Nm3) and if the existing ESP is not adequate, it will require upgrading or replacement. Apart from the limits of applicability described above, for the glass industry the overriding consideration for SCR is the cost compared with other techniques. In Section 8.1.7, the costs associated with the various techniques for NOX reduction are reported and compared. SCR is a relatively expensive technique compared to primary measures. All of these techniques have developed substantially in recent years, and in many applications where unabated emissions were below 2500 mg/Nm3 (i.e. where nitrates are not added or very high temperatures are required) SCR was not generally considered by the glass industry to be the most cost-effective technique for NOX emissions reduction, but the evolution of energy costs can make this technique attractive compared with other options (e.g. chemical reduction by fuel, or some oxy-fuel firing applications where inlet concentrations are very high).
Some tests are being carried out at the time of writing (2010) in a glass furnace using a special type of ceramic filter with an embedded catalyst (the CerCat flue-gas treatment system) that can resist temperatures of around 400 ºC. However, this technique is still considered emerging since only test trials have been carried out in the glass industry and data related to the application of this technique to full-scale industrial installations are not yet available (see Section 6.7). The SCR technique has been proven for certain glasses which contain high levels of boron (pharmaceutical borosilicate tubes), but has never been tried for glass wool or continuous filament glass fibre. The potential problem for these processes is the presence of volatile boron compounds, particularly boric acid, in the waste gases. These materials may condense to form salts or acidic materials down to 60 °C and, at the temperatures of SCR, are likely to be present in significant quantities. These materials could seriously affect the performance of the catalyst and would be difficult to remove by soot blowing. The application of SCR to installations producing domestic glass with high levels of potassium in the batch composition could be problematic due to a potential poisoning effect of the alkaline component on the catalyst. Economics The cost of SCR depends mainly on the size of the plant (the waste gas volume to be treated) and the desired NOX reduction efficiency. In general, the technique is considered to have high investment costs and moderately high operating costs. Also, because SCR is an integrated three stage abatement system, the cost of the technique depends greatly on whether the cost of the ESP and waste gas scrubber are included or not. In some cases, it could be argued that without the installation of SCR, the furnace might not require the dedusting equipment; although in the majority of cases this is an essential requirement. The existing cost information is not always easy to interpret and is quite case specific. The information available at the time of writing (2010) is summarised below. Based on the methodology reported in Section 8.1, cost data have been estimated for different types of production and furnace capacity. Data are based on real costs (e.g. quotations from suppliers) and calculated values [94, Beerkens - APC Evaluation 2008].

Chapter 4
252 Manufacture of Glass
The associated emission levels used for estimating the costs related to the application of SCR to the glass furnaces are in the range of 400 – 500 mg/Nm3 NOX.
Cost data presented below do not include the investment and operational costs related to the previously required installations of desulphuration and dedusting equipment. Float glass production • Typical investment costs comprise the catalyst, catalyst housing, a fan or the increased
fan capacity to overcome the pressure drop over the catalyst (about 10 mbar), extra ducts, ammonia solution storage, NOX monitoring and the safety measures for site preparation.
• The total investment cost may vary from EUR 1.9 million to 3.1 million, depending on the size of the furnace (500 – 900 tonnes/day); the higher figure is related to a 900 tonnes/day float glass production. The investment costs may differ from site to site depending on the total length of the ducts, flue-gas volume and safety measures to be taken.
• The operational costs are mainly constituted by ammonia solution (or urea), electricity, maintenance and catalyst. The given costs refer to SCR with one catalyst layer and cat-modules of a height of about 1.2 – 1.4 metres.
• On the basis of a starting NOX concentration of about 1800 – 2000 mg/Nm3 for gas-fired furnaces and 1400 mg/Nm3 for an oil-fired float glass furnace the annual operating costs for float glass furnaces range from about EUR 331 000 (furnace with a capacity of 500 tonnes/day) to EUR 450 000 (furnaces with a capacity of 900 tonnes/day). Ammonia consumption and related costs will increase for higher NOX concentrations in the unabated flue-gases. The typical additional production costs for float glass are about EUR 2.5/tonne melted glass. For smaller float glass production capacities (<600 tonnes/day) and gas-firing, these might be as high as EUR 3/tonne glass.
• The specific costs per kg NOX emissions reduction associated with the application of SCR to float glass furnaces, are about EUR 0.7 – 0.9 per kg NOX removed.
Container glass production • The typical investment costs may be in the range of about EUR 840 000 to 1.27 million,
depending on the size of the furnace; the higher value being for a furnace of 450 tonnes/day and the lower for a furnace capacity of about 200 tonnes/day. Additional investments may be required for upgrading the flue-gas abatement system (e.g. low particulate and SOX concentrations).
• The operational costs are about EUR 75 000 – 80 000 for a furnace of a 200 tonnes/day capacity and up to about EUR 136 000 per year for a larger furnace of 450 tonnes/day.
• The specific costs per tonne of melted glass would be about EUR 1.75 – 2.6. • The specific costs per tonne of melted glass are lower compared to float glass furnaces,
due to the lower specific energy consumption and reduced flue-gas volume. Depending on the size of the furnace, the additional costs for production are in the range of EUR 1.8 to 2.6 per tonne of melted glass, the lower values being for larger furnaces.
• The specific costs per kg NOX emissions reduction are higher compared with the float glass furnaces, in the range of EUR 1.3 – 1.7 per kg NOX removed, depending on the container glass furnace size. The specific costs increase with lower furnace capacity.
Domestic glass production No specific cost data are available concerning the application of SCR to installations in the domestic glass sector, since this technique is not currently applied to the sector. By extrapolation from cost data related to the application of SCR in the container glass sector, the costs described below have been estimated.

Chapter 4
Manufacture of Glass 253
• For a recuperative furnace of about 35 tonnes/day producing tableware the application of SCR would involve investment costs of about EUR 0.5 million (including site preparation, extra fan capacity, ammonia solution storage) and operational costs of up to EUR 40 000 per year. The specific costs per tonne of melted glass are estimated to be EUR 8. The NOX emissions reduction would be about 20 – 25 tonnes NOX per year with specific costs around EUR 4 – 4.5 per kg NOX removed.
• For a larger regenerative tableware furnace, the investment costs would be about EUR 750 000 to 800 000 and operational costs EUR 80 000 per year, with specific costs of almost EUR 5 per tonne melted glass and EUR 1.4 per kg NOX emission reduction.
In general, the addition of an extra layer of catalyst modules will normally increase the cost of SCR application by about EUR 0.6 to 0.8 per tonne melted glass and generate a further decrease of about 100 mg NOX/Nm3. The associated extra costs would be about EUR 2.2 per any additional kg NOX emissions reduction, including the extra costs for the catalyst plus extra electricity costs for the improved capacity of the fan. A summary of typical cost levels (investment, operating and specific costs per tonne of melted glass and per kg NOX emission reduction) for a number of float glass furnaces, container glass furnaces and the estimated costs for hypothetical applications of SCR on domestic glass furnaces is presented in Section 8.1.7, Table 8.8 A few examples of actual cost data associated with the use of SCR technique (in conjunction with an ESP and a dry-scrubbing stage) are reported in Table 4.23 for installations producing container, flat and special glass.
Table 4.23: Cost data associated with the use of SCR technique for example installations producing container, flat and special glass
Container glass (1) Flat glass Special glass (1)
Fuel Natural gas Natural gas Natural gas/light fuel oil
Total production capacity 640 t/day 600 t/day 220 t/day Associated emission levels (AELs)
456 mg/Nm3
0.97 kg/t glass 700 mg/Nm3
1.12 kg/t glass 950 mg/Nm3
6.05 kg/t glass
Emission control system SCR + ESP + dry
scrubbing with Ca(OH)2
SCR + ESP + dry scrubbing with Ca(OH)2
SCR + ESP + dry scrubbing with Ca (OH)2
Associated costs (2)Investment costs for SCR, including ammonia storage
EUR 2.35 million Not available EUR 1.5 million
Investment costs for ESP + dry scrubbing EUR 3.95 million Not available- EUR 2.8 million
Total investment costs EUR 6.3 million EUR 5.0 million EUR 4.3 million Duration of amortisation 13 years Not available 10 years Annual amortisation costs for SCR + ESP and dry scrubber
EUR 312 550/year + EUR 525 350/year Not available EUR 199 500/year +
EUR 372 400/year
Specific investment costs for catalyst EUR 2.00/t glass Not available EUR 9.34/t glass
Cost for ammonia supply EUR 106 000/year Not available Not available Specific investment costs for emission control system
EUR 5.61/t glass EUR 4.5/t glass EUR 19.77/t glass
(1). Costs include accessories, blower, pipeline, ammonia storage, etc. (2). Cost data are for the year of installation of the air pollution control system and are not necessarily
representative of current costs. Source: [75, Germany-HVG Glass Industry report 2007] [84, Italy-Report 2007]

Chapter 4
254 Manufacture of Glass
Driving force for implementation The main driving force is to comply with legal emission limit values. Example plants Table 4.24 shows a list of plants operating with the SCR technique with a summary of the operating parameters.
Table 4.24: Plants operating with the SCR technique and operating parameters
Plant name and location Gas volume Nm3/hour
Inlet mg/Nm3
Outlet mg/Nm3
Reduction(%)
NH3mg/Nm3
Schott-Rohrglas, Mitterteich, Germany (special glass)
60000 5000 1500 70 <20
Euroglas SA, Hombourg, France (float glass) 55000 2000 500 75 <5
AGC Flat Glass Europe, Cuneo, Italy (float glass) 70000 2400 700 71 <30
Ardagh, Bad Münder, Germany (container glass) 60000 1300 <460 >65 % 19.5
Quinn glass, Ince, UK (container glass) 50000 1100 <500 55 <30
In 2007, a total of seven SCR techniques were reported being in operation in the flat glass sector, including: • Euroglas SA, Hombourg, France (float glass) • Euroglas SA, G.Osterweddingen, Germany (float glass) • AGC Flat Glass Europe, Cuneo, Italy (float glass) • AGC Flat Glass Europe, Roux, Belgium (flat glass) • Interpane Vitrage France S.à.r.l. Seingbouse (float glass), starting in 2007 with SCR • AGC Flat Glass, Boussois, France. A few more applications were planned for the period 2008 – 2009. Reference literature [33, Beerkens 1999] [47, ANFFECC 1999] [7, Ind.duVerre 1996] [65, GEPVP-Proposals for GLS revision 2007] [64, FEVE 2007] [88, FEVE Proposal Ch.4-NOx 2007] [75, Germany-HVG Glass Industry report 2007] [94, Beerkens - APC Evaluation 2008] [84, Italy-ENEA Report 2007] [Schmalhorst, E.; Ernas, T.; Jeschke, R.: Experience with an SCR DeNOx plant for container glass furnaces. Glastech. Ber. Glass Sci. Technol. 70 (1997) no. 11 pp. 354-358].
4.4.2.8 Selective non-catalytic reduction (SNCR) Description In the Selective Non-Catalytic Reduction process (SNCR), also known as thermal DeNOX, the oxides of nitrogen in the flue-gas are reduced to nitrogen by reaction with ammonia or urea at high temperatures. In the glass industry, mainly ammonia and aqueous ammonia (typical 25 mass % aqueous solution) are used with some applications utilising urea. The chemical reactions involved are the same as those for SCR described in Section 4.4.2.7 above. However, the reactions take place at higher temperatures without the need for a catalyst. The operating temperature is within the range of 900 – 1050 °C, but the optimum temperature is around 950 °C for ammonia and 1000 ºC for urea.

Chapter 4
Manufacture of Glass 255
In some applications it has been suggested that the addition of hydrogen to the waste gas can assist the reaction at lower temperatures, but this type of application is not reported within the glass industry. In SNCR, the ammonia is injected closer to the furnace than in SCR, and usually involves a carrier gas. The efficiency of the technique depends on a range of factors, the main ones are: • temperature • initial NOX concentration • uniform reagent and flue-gas mixing • ammonia to NOX ratio; and • reaction time (1 – 2 seconds required) in the temperature window 900 – 1050 °C. In particular, it is important to ensure the correct temperature range since NH3 injection below 900 ºC leads to ammonia slippage and reduced efficiency, and above 1050 °C further NOX may be formed. It is also essential to ensure that the reagent is uniformly distributed in the flue-gas. In achieving the correct temperature, the positioning of the ammonia injectors is critical, but the zone with the correct temperature may not be accessible or may change with operating conditions (e.g. load changes). This change in location of the correct temperature zone can be catered for by the provision of further ammonia injectors, but this will add to the capital cost and will depend on the accessibility. Uniform distribution can be achieved by good ducting design and, if necessary, the use of baffle plates or other flow correction devices. The technique suffers some of the same potential operating problems as SCR, i.e. ammonia slip, N2O formation (higher with urea), and ammonium bisulphate formation. Ammonium bisulphate formation may be higher than in SCR because the operating temperature requires injection upstream of any filter and scrubbing system. There is no catalyst present but the ammonium bisulphate can cause caking problems. Due to the difficulties encountered to achieve uniform mixing between the reagent and the flue-gases within the required temperature window, the application of SNCR to regenerative-type furnaces is very limited. Achieved environmental benefits NOX reductions in the range of 40 – 70 % are commonly quoted for SNCR although figures above 80 % have been reported in some applications outside the glass industry. The main influencing factor will be the degree to which the performance-dependant factors can be optimised. In a well-controlled process where the optimum conditions can be achieved, reductions of 50 – 75 % are possible. Cross-media effects Ammonia emissions are one of the main concerns and can be a limiting factor on the efficiency of the technique. In addition to the legal requirements for ammonia transport and storage, safety measures are needed to prevent ammonia leakage and exposure to NH3 fugitive emissions during storage operations and before injection into the flue-gas stream. These safety isssues also have a financial impact. Indirect emissions associated with energy consumption for electricity (pressurised air, ammonia production) are also to be taken into account. The use of energy for the application of SNCR is about 1700 kWh/tonne NOX reduced, while the energy required to produce ammonia is estimated at 10 kWh/kg NH3. The contribution of indirect emissions (mainly CO2) from electricity production is very small compared to the emissions from the glass furnace, below 0.35 % of the total emissions.

Chapter 4
256 Manufacture of Glass
Operational data The final emissions concentration will depend on the initial value of NOX and so the best results will be obtained where the technique is combined with primary reduction measures. But in this case, the overall costs and cross-media effects would need to be taken into account, in particular per tonne of NOX abated. For example, an initial concentration of 1100 mg/Nm3 could be reduced to between 275 and 770 mg/Nm3, depending on the process conditions. A high initial concentration of 4000 mg/m3 could be reduced to between 1000 and 2800 mg/Nm3.
The typical operational data associated with the application of SNCR to glass melting furnaces are given below. For SNCR with the use of ammonia solution: • ammonia slippage: <10 mg/Nm3
• ammonia use: typically, about 0.75 kg NH3 is required per kg NOX removed (calculated as NO2), assuming a removal efficiency of 50 %, with resulting emissions from 0.5 to 1 kg NOx/tonne melted glass, for soda-lime container glass productions.
For SNCR with the use of urea: • ammonia slippage: 3 mg/Nm3
• urea use: typically, about 1.4 kg urea per kg NOX removed (calculated as NO2), assuming a removal efficiency of up to 40 %, with resulting emissions of 2.6 kg/tonne glass (special glass, TV screens with nitrates in the batch).
A summary of the main advantages and disadvantages associated with the application of the SNCR technique is shown in Table 4.25.
Table 4.25: Main advantages and disadvantages of the SNCR technique Advantages:
• Can achieve good NOX reduction efficiencies if correct conditions exist • Low capital cost compared to some alternatives • No catalyst required • Low energy requirements Disadvantages:
• Ammonia injection within the correct temperature window is essential, but sometimes difficult or impracticable to achieve (particularly for regenerative furnaces)
• Outside the operating temperature range, NH3 or increased NOX emissions can result • Uniform mixing is important and can be difficult to achieve • Ammonia is consumed and emitted, and the storage and handling of the material presents
environmental and safety concerns • Concern over possible damage to regenerator refractory material
Applicability In principle, the technique is applicable to all glass processes including new and existing plants. SNCR involves a lower investment cost and requires less space than SCR, making it more attractive for processes where space is limited. Also the technique can be operated without gas scrubbing and dust removal equipment. If the correct process conditions exist, SNCR is easier to retrofit to existing plants than SCR. However, the technique also has certain factors that limit its applicability within the glass industry. The most important of these is whether the reagent can be introduced at a point in the waste gas system where the correct temperature can be maintained for an adequate reaction time. This is of particular relevance in existing plants and for regenerative furnaces.

Chapter 4
Manufacture of Glass 257
In existing plants, the area where the correct temperature occurs may be difficult to access or may be in a position where the gas flow makes it difficult to achieve good mixing with the reagent. In many cases, these problems can be overcome or mitigated, but it can add significantly to the cost and can compromise the efficiency of NOX reduction. In regenerative furnaces, the correct temperature range usually occurs within the regenerators, which makes it very difficult to inject the ammonia effectively. This problem can be addressed by using split regenerators and injecting the ammonia in the connection. Split regenerators can be included in the design of a new plant, but for existing processes, splitting the regenerators can involve substantial costs and can only be done at a rebuild. Even when split regenerators are used, it is difficult to maintain the temperature window for SNCR due to the reversal of fire between the chambers that causes a cyclical temperature change, and pull rate changes in the furnace. Based on the difficulties mentioned above, in general, the SNCR technique is easier to implement with recuperative furnaces than with regenerative furnaces. In practice, SNCR is very unlikely to be used in existing regenerative furnaces; the costs and associated difficulties will usually lead the operator to choose an alternative means of reducing NOX emissions. In smaller recuperative furnaces, the relative costs of SNCR are quite high, and in many cases, industry are likely to favour other more cost-effective control measures, although this will depend on the required performance level. In Europe, at the time of writing (2010), the SNCR technique is applied in the special glass sector. Previous applications in the container glass sector (Germany) and the flat glass sector (US) are no longer in operation. Economics The estimated costs associated with SNCR applications on different size furnaces are reported below; the calculation has been based on presumable achievable emission levels of between 450 and 500 mg/Nm3 NOX.
Container glass production Typical investment costs for recuperative furnaces with capacities between 200 – 350 tonnes/day are in the range of EUR 680 000 – 900 000. Operational costs have been determined at EUR 74 000 per year for a 200 tonnes/day recuperative furnace, and up to EUR 97 000 per year for a larger furnace of 350 tonnes/year. Specific costs are in the range of EUR 1.9 – 2.3 per tonne of glass, with the higher figure associated with smaller furnaces (200 tonnes/day). The costs per kg NOX removed are EUR 2.1 – 2.5 per kg NOx removed, which are higher than for SCR applications due to the lower conversion efficiency of ammonia in the SNCR process.
Special glass production
For the application of SNCR to oxy-fuel-fired furnaces, using nitrates in the batch formulation, specific costs are estimated in the range of EUR 3 – 4 per tonne of glass and EUR 1 per kg NOX reduced. The relatively low cost per tonne of NOX reduced is due to the high initial concentration levels in the flue-gases of the oxy-fuel fired furnaces.
Continuous filament glass fibre
There is no knowledge of SNCR applications in this sector. An estimation of costs for a potential installation to a furnace of 100 tonnes/day indicates a capital investment of EUR 600 000 – 625 000, with operational costs of EUR 65 000 – 70 000 per year. The use of SNCR would increase the specific costs of production by EUR 4 – 4.25 per tonne of glass.
A comparison of cost data for SNCR with other available techniques for NOX removal is given in Section 8.1.7. Driving force for implementation Lower costs and less space requirement than for SCR application are the driving forces for the implementation of this technique.

Chapter 4
258 Manufacture of Glass
Example plants • Schott Glas AG, Mainz, Germany, applied to five oxy-fired furnaces (special glass) • Osram, Augsburg Germany (special glass, lighting glass).
References to literature [33, Beerkens 1999] [94, Beerkens - APC Evaluation 2008] [75, Germany-HVG Glass Industry report 2007 ] [Lubitz G: Langzeiterfahrungen mit dem SNCR-DeNOx-Prozess an einer rekuperativ beheizten Behälterglaswanne - Vortrag v. d. Fachausschuss VI d. DGG (Umweltschutz) am 10. März 2004 in Würzburg].
4.4.3 Sulphur oxides (SOX)
[89, EURIMA Suggestions 2007]
The term sulphur oxides (SOX) includes sulphur dioxide (SO2) and sulphur trioxide (SO3), expressed as the SO2 equivalent. Sulphur dioxide is by far the most prevalent oxide of sulphur in the glass industry and most of the following discussion relates to this species. Below about 200 °C, SO3 is usually in the form of an acid mist or vapour; therefore, sulphuric acid (H2SO4)is, in general, considered included by the term SOX, since it represents a condensation product of SO3. The two main sources of sulphur oxides emissions are the oxidation of sulphur in fuels and the decomposition/oxidation of sulphur compounds in batch materials. The retention of sulphur compounds in the glass is usually low (<0.35 % as SO3, in most industrial glasses) and in general, the majority of the sulphur entering the furnace is emitted to the atmosphere as SOX. Some of the SOX in the waste gas stream will react with other species to produce sulphates, which condense to form dust. The amount of sulphate in the dust varies depending on the glass type, but for most soda-lime glasses it is around 80 – 95 %, mainly sodium sulphate. This issue is discussed in more detail in Section 4.4.1. In electrically-heated furnaces, SO2 emissions tend to be very low and arise only from raw material decomposition. In stone wool cupolas, there is an overall reducing atmosphere and sulphur from the raw materials and fuel is emitted mainly as SOX and hydrogen sulphide (H2S). In EU installations, the waste gases are usually treated in an afterburner system, which oxidises the H2S to SO2.
In some sectors (e.g. HTIW, frits), sulphur oxides (SOx) are exclusively related to the impurities present in the raw materials and indirectly from the recycling of filter dust from the dust abatement systems [98, ANFFECC Position of the Frit Sector 2005].
4.4.3.1 Fuel selection Description In oil-fired processes, the main source of SOX is the oxidation of sulphur in the fuel. The amount of SOX derived from the batch materials varies depending on the glass type but in general, wherever fuel oil is burned, the SOX emissions from the fuel outweigh those from the batch materials. The most obvious way to reduce SOX emissions is to reduce the sulphur content of the fuel. Achieved environmental benefits The sulphur content of fuel oil is regulated by Council Directive 1999/32/EC, which sets a limit of 1 %, with possible derogations for specific circumstances. Two types of fuel oils with various

Chapter 4
Manufacture of Glass 259
sulphur grades are available: <1 % sulphur and <0.3 % sulphur. Natural gas is essentially sulphur free. Table 4.26 below shows typical ranges of SOX emissions from soda-lime glass furnaces, with fuel oil and natural gas, without the application of secondary measures for SOX reduction. The figures are only indicative and actual figures may vary significantly (e.g. see Table 3.15 in Section 3.3.2.2).
Table 4.26: Indicative ranges of SOX emissions from soda-lime glass furnaces for different fuels
Fuel SOX (as SO2) mg/Nm3
Natural gas 300 – 1000 1 % Sulphur fuel oil 1200 – 1800
Cross-media effects The general experience within the industry is that conversion to natural gas results in higher NOX emissions, 25 – 40 %, although with increased experience, the differential is narrowing. This issue is discussed in more detail in Section 4.4.2.1 (fuel choice). The use of natural gas is associated with lower specific emissions of CO2 compared with fuel oil; however, the specific energy consumption per tonne of melted glass might increase due to a lower emissivity/luminosity of the flame, a different flue-gas volume and heat capacity. Fuel oil needs to be heated up to 110 – 120 °C before being delivered to the burners, requiring additional energy consumption or the use of recovered heat. The conversion to a lower sulphur content fuel generally results in increased costs due to the higher fuel price. However, if the filter dust resulting from flue-gas desulphurisation cannot be recycled to the furnace, a cost reduction is expected due to lower quantities of dust to be disposed of into landfills. Operational data No additional data reported. Applicability The use of natural gas is extensive within the industry. For example, almost all fossil fuel-fired glass wool furnaces, most continuous filament glass fibre furnaces, all the glass frit furnaces, and more than 50 % of all container glass furnaces are fired on natural gas. The conversion to gas firing requires different burners, the gas supply system to the burners, and modifications to burner and fuel ports. A full conversion of existing furnaces to gas firing is not always possible, due to potential glass quality and furnace lifetime problems; in these cases a mixed firing may be applied. An increasing number of glass furnaces are equipped for using both types of fuels. However, the main influencing factor in selecting the fuel is the fuel price differential between gas and oil. In addition, the different strategies and energy policies of the EU Member States and the geographical availability of natural gas and fuel oil may affect the choice of fuel [157, European Commission - Green Paper 2000].
Economics As already stated above, the economics related to the selection of fuel are country specific and due to a potential geographical unavailability of some types of fuel, a general evaluation of costs is not meaningful.

Chapter 4
260 Manufacture of Glass
Hot blast cupolas used in stone wool production are heated by coke. The variation in the sulphur content of coke used by the sector is quite low (0.6 – 0.9 %) and depends on the source. Coke-derived SO2 usually represents 30 – 70 % of the total emissions, depending on the use of blast furnace slag and cement bonded waste. Low-sulphur coke can be expensive to transport unless the plant is located close to a convenient source, and the reduction in emissions is likely to be disproportionate to the cost. The sector does not utilise high-sulphur alternatives such as petroleum coke, and in many cases, the coke sulphur content will have been reduced as far as economically practicable. Driving force for implementation Specific local environmental conditions and consequently stringent limit values for SOXemissions might be the driving force for switching to low sulphur or sulphur-free fuel. Example plants None specified. Reference literature [88, FEVE Proposal Ch.4-NOX2007].
4.4.3.2 Batch formulation Description In conventional glass making, sulphates are the main source of SOX emissions from batch materials. Sulphates are the most widely used fining agents and are also important oxidising agents. By far the most common sulphate used is sodium sulphate, which during melting and fining dissociates to give gaseous SO2, O2 and Na2O which is incorporated into the glass. Sulphates of potassium and calcium are also widely used. In most glass furnaces, the levels of batch sulphates have been reduced to the minimum practicable levels, which vary depending on the glass type. As already stated in Section 4.4.3, the retention of sulphur compounds in the glass is usually low and may vary significantly by the type of glass produced. The conversion of a furnace from air-fuel-fired to oxy-fuel-fired can cause a decrease in the sulphate retention of the glass melt. In such cases, batch modifications may be required in order to provide the correct amount of fining agent for the melting process. The issues surrounding the reduction of batch sulphates are discussed in Section 4.4.1.1 and the issues relating to the recycling of filter/ESP dust are discussed in Section 4.4.3.3. Typical emissions associated with fining and oxidising agents are 200 – 800 mg/Nm3 and 0.2 – 1.8 kg/tonne of glass melted. In stone wool production, important sources of SO2 emissions (in addition to coke) are the use of blast furnace slag and cement bound briquettes in the batch. Slag usually contains 0.6 – 1.5 % sulphur by weight and the vast majority of the sulphur will be released as H2S and SO2. If an afterburner is used, the emissions will be largely oxidised to SO2. The options for purchasing blast furnace slag with low sulphur levels are few, and plants are usually restricted by their proximity to a very limited number of suppliers within economical transport distances. The percentage of slag in the batch varies greatly from close to 100 % for slag wool to zero in many normal stone wool plants. In most cases where slag is used, it composes less than 30 % of the total batch (excluding coke). The only application where its use is necessary to the product is in the production of white fibres for applications such as gun-sprayed fibres and ceiling boards. These applications represent only a small percentage of the total output of the sector, but certain plants may produce only these products. For a plant using around 30 % slag in the batch, the unabated SO2 emissions are in the region of 2 – 3 times higher than for a slag-free batch. It is estimated that at the time of writing (2010), approximately 10 % of European stone wool plants use blast furnace slag.

Chapter 4
Manufacture of Glass 261
The beneficial effect on the SO2 emissions of eliminating the use of slag is clear. However, the use of slag, in particular in the mineral wool sector, does convey a number of advantages, which are summarised below. • Lower energy use and reduced CO2 emissions, arising from the partial replacement of
limestone by slag. Energy consumption and CO2 emissions are typically 5 – 15 % lower with the use of slag than in a basalt-limestone charge.
• Depending on the material that is substituted, the charge may contain less iron, which reduces the required tap out frequency and can improve yields. There are fewer interruptions to production and a slight reduction in solid waste.
• In some cases, slag usage is claimed to improve the fiberising properties of the melt which can contribute to improved process efficiencies and lower waste levels by reducing shot.
• Blast furnace slag is a waste material that, if not utilised, is more likely to be disposed of to landfill. Furthermore, it replaces natural stone and reduces the demand for quarried materials.
• Slag is also generally cheaper than the materials it replaces. Achieved environmental benefits In general, the minimisation/optimisation of raw materials which contain sulphur in the batch formulation has an effect not only on SOX emissions, but also on dust formation. The recycling of filter dust can to some extent replace the addition of batch sulphate as a refining/oxidising agent and thus reduce the use of these primary raw materials. The optimisation of the amount of sulphates used in the batch may result in a reduced solid waste stream where this is produced by downstream SOX abatement system It is possible that most of the advantages described above could also be achieved by the increased utilisation of recycled process waste. A site-specific assessment of the impact of slag usage on pollution of the environment as a whole may be appropriate in some cases. However, in a general qualitative assessment, the advantages of using slag are unlikely to outweigh the emissions generated. If slag usage is required for product colour, its use can be minimised by the use of recycled internal process waste. If secondary SOX abatement measures are used, the environmental balance for slag usage could change. Cross-media effects In general, the minimisation/control of sulphur content in the batch formulation is not associated with cross-media effects. However, an excessive reduction of the amount of sulphur would generate quality problems on the final glass product. As an example, some dark colours for container glass used to guarantee the quality of the product must have a particular batch formulation which contains sulphur (e.g. wine bottles). The substitution of sulphur compounds with other materials providing the same fining effect may be difficult because of a higher environmental impact related to the alternative materials. The recycling of filter dust to the batch formulation can increase the emissions of SOX, as it is mainly constituted by sulphates. Operational data No additional data reported. Applicability Not reported. Economics Not reported.

Chapter 4
262 Manufacture of Glass
Driving force for implementation The containment of costs for the batch formulation, together with the minimisation of the initial levels of SOX emissions may be the driving force for the implementation of this technique. Example plants None specified. Reference literature [89, EURIMA Suggestions 2007] [30, Infomil 1998] [27, EURIMA 1998].
4.4.3.3 Dry or semi-dry scrubbing Description The reaction principles of dry and semi-dry scrubbing are the same. The reactive material (the absorbent) is introduced to and dispersed in the waste gas stream. This material reacts with the SOX species to form a solid, which has to be removed from the waste gas stream by an electrostatic precipitator or bag filter system. The absorbents chosen to remove SOX are also effective in removing other acidic gases, particularly halides (HCl and HF), but also other volatile compounds such as selenium, boric acid, etc. In some applications, the absorbent is injected directly into the waste gas ducting, but the techniques are substantially more efficient if a reaction tower (dry process) or reaction chamber (semi-dry process) are used. In the dry process, the absorbent is a dry powder (usually Ca(OH)2, NaHCO3,or Na2(CO)3) to which air can be added to assist dispersion. In the semi-dry process, the absorbent (usually Na2CO3, CaO or Ca(OH)2) is added as a suspension or solution and water evaporation cools the gas stream. In other industrial applications, the semi-dry process as described above is often referred to as semi-wet; however, within this document, the term ‘semi-dry’ is used exclusively, as it is the usual term used within the glass industry. The dry process is found more commonly in the glass industry than the semi-dry process. In general, the abatement rate depends strongly on the parameters described below. • Type of scrubber-The design of the scrubber may affect the contact between the gas
phase and the absorbing agent and the available reaction time. • Composition of the flue-gas-There is a different reactivity of waste gas pollutants with the
various absorbents and competing reactions occur between the different species, especially if the ratio of reactant to acidic gases is relatively low.
• Temperature of the flue-gas-The ideal temperature should be as close as possible to the dew point of the flue-gas (below 180 °C) or much higher (around 400 °C). The temperature range of 180 – 350 °C is not suitable for dry SO2 absorption by hydrated lime. One should keep in mind that flue-gas temperatures above 350 °C are also required for the correct functioning of an SCR unit (see Section 4.4.2.7 for more details).
• Humidity of the flue-gas. • Molar ratio of absorption agent/acid gases-It is normally necessary to have an over-
stoichiometric ratio of absorbent. The specific amount of absorption agent is often expressed by the molar ratio which can be defined in two ways:
◦ MR1 = molar ratio of absorbent over SOX abated ◦ MR2 = molar ratio of absorbent over total SOX input.
• Filtration system-Either the dry or the semi-dry process can be used in conjunction with electrostatic precipitators, but with bag filters the waste gases may require cooling. The most common scrubbing process used in the glass industry is the dry process in conjunction with an ESP using Ca(OH)2 as the absorbent. This is because Ca(OH)2achieves a relatively good abatement rate at a temperature of around 400 °C, which can be readily achieved in the waste gas without cooling and is within the operating range of an electrostatic precipitator. However, it should be noted that with bag filter systems the

Chapter 4
Manufacture of Glass 263
reagent may be injected into the flue-gas stream before the heat exchanger. This then allows reaction at around 350 – 400 °C, as with ESPs. Ideally the reaction temperature should be around 400 °C; in practice, temperatures in the range of 300 – 350 °C are more common, due to operational constraints. Where bag filter systems are used, the temperature has to be reduced to below 200 °C. Cooling can be achieved by a heat exchanger, or cooling air, and is also assisted in the semi-dry process by the evaporation of water. The use of bag filters generates a filter cake on the fabric, due to the deposited absorption reagent, which causes an increase of the pressure drop and normally improves the absorption of the acid gases.
• Type of reagent-The most used scrubbing agents within the glass industry are: hydrated lime (Ca(OH)2,) sodium carbonate (Na2CO3), sodium bicarbonate (NaHCO3), and less frequently sodium hydroxide (NaOH) and limestone (CaCO3). The chemical composition of the reagent is an important factor for determining the possibility of recycling the resulting solid products back to the melting furnace. The specific surface of the reagent, expressed as BET (m2/gram) is a determining factor for achieving a good reaction rate. Reagents are normally injected as fine powder with a specific surface area of up to 40 m2/g.
An additional option for the ‘dry scrubbing’ of acid gases consists of direct batch preheating. In this case the alkaline components of the batch composition have the function of absorption agents. The use of this technique is discussed in Section 4.8.5. Achieved environmental benefits The majority of installed SOX scrubbing systems operate with dry hydrated lime scrubbing at a temperature in the range of 300 – 400 °C which is the waste gas temperature obtained from an efficient regenerative type furnace. At these temperatures, a SOX reduction of around 30 – 40 % is generally achieved by using a good quality dry lime and an over-stoichiometric Ca(OH)2/SO2ratio. Better removal efficiencies can be achieved by using sodium bicarbonate or a solution of sodium carbonate, with a SOX reduction of around 60 % or higher, depending on the amount of reagent. A comparable or improved SOX reduction rate can be reached at temperatures of around 200 °C and with a humid atmosphere. This can be obtained by the injection of a water-dissolved sorbent in connection with bag filters. However, this semi-dry technology lowers the temperature of the waste gases to a level that is not generally compatible with secondary heat recovery or for downstream applications that require higher temperature levels (e.g. SCR or cullet preheating). In these cases, consideration could also be given to the conventional (or ‘true’) semi-dry process, although there is very little experience with this technique in the glass industry. This stresses the need for an integrated analysis prior to the application of desulphurisation, taking into account all effects, side-effects, costs and priorities (e.g. acidification policy, energy policy, waste policy, etc.). It must be noted that high stoichiometric rates of sulphur absorbent imply an increased load on downstream dust abatement equipment. In practice, the limited absorption improvement must be balanced against the technological requirement and any additional costs for an increased precipitator capacity. The scrubbing process is also effective for other gaseous acid pollutants, such as HCl and HF, with different reduction rates. Typical removal efficiencies correlated to the type of reagent and operating conditions are reported under ‘Operational data’, presented below. These techniques are effective in removing certain other pollutants, e.g. selenium compounds and boron acidic species such as HBO2 and H3BO3, but very limited information is available on the reduction levels. As an example, for a flat glass furnace producing bronze glass, equipped with a dry-scrubbing system operating with NaHCO3, the achieved removal efficiency is about 90 %, from the inlet value of 30 mg/Nm3 of selenium compounds to an outlet emission concentration of 3 mg/Nm3 (solid + gaseous). In order to achieve a lower level of selenium emissions (1 mg/Nm3) the quantity of alkaline reagent should be increased from 55 kg/h to
Chapter 4
264 Manufacture of Glass
120 kg/h with the consequent cross-media effect of waste generation with the consequent need to dispose of it. Cross-media effects In some examples within the glass industry, an important motivation for the installation of the techniques has been for the protection of dust abatement equipment or, in some cases (e.g. continuous filament, frits), for the removal of fluoride emissions. In specific cases, if dust or fluoride abatement is not required, it might be more economical to switch to gas firing rather than install these techniques. The use of scrubbing systems involves the use of electrical energy. The specific energy consumption is typically around 12 – 20 kWh/tonne melted glass with bag filters and 8 – 11 kWh/tonne melted glass for electrostatic precipitators. The techniques generate a significant amount of solid residue, but in most applications this material can be recycled to the furnace. Problems may be encountered particularly with oil-fired furnaces using high levels of cullet. If sodium carbonate is used as the absorbent, filter dust would be recycled in soda-lime glasses in place of a more valuable raw material, because of the substantial requirement for sodium carbonate. However, the high reduction rate of sodium carbonate and sodium bicarbonate towards HCl causes a significant enrichment in NaCl of the filter dust, which can generate problems when reintroduced into the furnace in the batch composition. The volatilisation of NaCl in the furnace leads to a chemical attack of the silica/silicate refractory materials in the furnace or regenerators. In general, for a certain type of glass, the uptake of sulphur in the melt is fixed, in order to guarantee the redox state and the colour of the glass. Therefore, the recycling of sulphate dust presents a quantitative limitation. At low levels of cullet, the collected sulphate will usually be less than that required for refining, and, for some specific cases, it may also be possible to increase the uptake of the sulphur from the collected dust in the glass (i.e. higher SO3 %). In these cases, the overall emissions are lowered and sodium sulphate consumption is reduced. If the sulphate collected is greater than the sulphate required in the batch then a solid waste stream is created for disposal off-site. Alternatively, if all the material is recycled in greater quantities than required, then the system becomes a closed loop reaching a dynamic equilibrium with the only sulphur sinks being the glass and the emissions to air. At high cullet levels, the requirement for the sulphate fining agent is much lower; therefore, unless a portion of the dust is removed, the SOX emissions increase and the overall benefit of SOX reduction is greatly reduced. The problem is most evident in reduced glasses, where the sulphur solubility is relatively low, and when high cullet levels are used. In practice, if this were to occur, the costs of the disposing of dust that cannot be recycled could be higher than the cost of lower sulphur fuels (e.g. low sulphur oil or natural gas). Therefore, in many circumstances, an operator would choose to change fuels rather than create a solid waste stream for disposal. However, a high cost differential between low sulphur fuel (particularly natural gas) and other fuels may make such an option economically unattractive. If calcium hydrate is used as the absorbent, most glass compositions will have a limit as to how much calcium can be recycled. Adjustments can normally be made to the batch composition to compensate for the filter dust, but in batches, with high cullet levels, the possibility to adjust the batch is limited. In high cullet batches, the calcium content may be greater than can be tolerated in the glass, creating a solid waste. In such a case, a solution can be a change of absorbent and a switch to sodium carbonate or bicarbonate, or a mixture of the different absorbents.
Chapter 4
Manufacture of Glass 265
In regions that have high cullet recycling rates, the system becomes even more of a closed loop as the levels of various compounds build up in the constantly recycling glass. This can be a problem for metals, fluorides and chlorides as well as sulphur. The presence of metals in the filter dust, particularly lead, can contribute to a progressive accumulation in the glass mass. For container glass, resulting concentrations might, in exceptional cases, be in the range of the threshold for heavy metals set by the Packaging and Packaging Waste Directive 94/62/EC for which glass has a derogation without a time limit. Where the volume of the collected material presents a problem for recycling, techniques are available to reuse a portion of the absorbent reducing the overall volume. Problems of inconsistent formulation of the collected dust are not usually an issue. Such problems can be overcome by careful analysis and, if necessary, stockpiling and blending the material before recycling. In stone wool production, the SOX reduction must take place after the waste gas incinerator and before the filter system. In most applications the filter system is positioned prior to the incinerator, which is designed to treat a clean gas. In these cases, the installation of the technique on existing plants will require an incinerator and an additional filter system. The expected investment will be EUR 4 – 5 million. The semi-dry process has not been proven as economically viable in this sector. The recycling of the material back to the furnace is more difficult in stone wool than in other sectors because the process does not require the addition of sulphates and the uptake of sulphur in the melt is low. Therefore, the majority of the pollutant would be reemitted. The recycling of filter dust into a stone wool cupola furnace requires the use of a briquetting system. When such a system is not available, a significant solid waste stream associated with the SOX removal will be generated. This means that the collected waste must be disposed of as a solid waste or, if possible, valorised. The landfilling of the waste generated by the flue-gas desulphurisation system is becoming increasingly difficult and may require pretreatment to avoid leaching. This cross-media effect often outweighs the environmental benefits of reducing the acid gas emissions (see a typical sulphur balance in Section 8.2). The choice of absorbent for stone wool is also limited if recycling is considered. The product requires very low soda levels so sodium carbonate and sodium bicarbonate can only be used if the collected material is not recycled. In stone wool production, an alternative to dry or semi-dry scrubbing could be the use of a venturi scrubber system. Good SOX removal efficiencies (90 – 95 %) can be obtained but the technique is less effective than a bag filter for dust abatement. Also an aqueous waste is generated and the material is difficult to recycle. A small number of installations have been operating this technique successfully for over 20 years. Operational data As mentioned above, the reductions achieved with these techniques depend on a number of factors including waste gas temperature, the amount and type of absorbent added (or more precisely, the molar ratio between reactant and pollutants) and the dispersion of the absorbent. The tables below give an estimation of efficiencies obtained with various absorbents and processes. The actual results achieved will vary from case to case and both higher and lower results have been experienced. In Table 4.27, indicative dry absorption efficiencies for the removal of the gaseous pollutants are presented. Due to the different absorption rates occurring within the cake on bag filters and the different operating temperatures associated with ESP and bag filters, separate data are given for the two types of filters.

Chapter 4
266 Manufacture of Glass
Table 4.27: Indicative dry absorption efficiencies with Ca(OH)2ESP Bag filter Pollutant ~ 400 °C 200 – 280 °C 130 – 240 °C
SO2 50 % 10 % 10 % SO3 80 % 90 % 95 % HCl 70 % 35 % 80 % HF 95 % 95 % 95 %
SeO2 90 % 70 % 90 %
More generally, references give the indicative results for the dry process with Ca(OH)2 reported in Table 4.28.
Table 4.28: Indicative SOX abatement rates for dry scrubbing with Ca(OH)2
SOX abatement rate Temperature 130 – 140 °C 170 – 180 °C
Molar ratio Ca/S =1 30 % 22 % Molar ratio Ca/S =2 50 % 40 % Molar ratio Ca/S =3 70 % 55 %
An abatement rate of 65 % has been reported in the case of a float furnace using dry scrubbing plus an ESP with a molar ratio MR1 of 4.4, using 180 kg/h of Ca(OH)2 at a temperature of around 400 °C. All the dust is recycled in the furnace. Experiences of the dry process with Na2CO3 as the absorbent are summarised in Table 4.29 for the temperature range 300 °C to 400 °C. The abatement rate ranges given are again indicative and largely dependent on temperature and on the quantity of absorbent used.
Table 4.29: Indicative SOX abatement rates for dry scrubbing with Na2CO3
Pollutant SOX abatement rate SO2 <50 % SO3 90 % HCl 50 – 75 % HF 10 – 40 %
SeO2 30 – 60 %
The results of experiences with NaHCO3 as the absorbent show a very good absorption rate for SOX especially for the lower temperature range, with up to 90 % SOX removal possible. As already described above, there are several parameters that have an influence on the abatement efficiency of acid gases released from a melting furnace. The actual removal rates may differ from the indicative ones. A comparison of removal efficiencies observed from field measurements for different types of alkaline reagents and diverse operating conditions is shown in Table 4.30.

Chapter 4
Manufacture of Glass 267
Table 4.30: Actual removal efficiencies of acid gaseous pollutants for dry scrubbing with different type of absorption reagent and operating conditions
Waste gas temperature
Stoichio- metric ratio
Removal efficiency(1)Reagent Type of depollution
system °C Reagent/SO2SOX(%)
HCl(%)
HF (%)
Hydrated lime 0.5 17 <5 62
0.65 22 56 70 Ca(OH)2
specific surface 14 m2/g
ESP + dry scrubbing (2) 335 2 37 95 97
0.5 26 56 72 0.7 34 65 81 1 40 78 89
Ca(OH)2specific surface
34 m2/g ESP + dry scrubbing (2) 335
1.7 43 95 97 Sodium hydrogen carbonate
0.2 7 24 <5 0.45 24 28 <5 NaHCO3 ESP + dry scrubbing (2) 342
2 56 51 17 0.3 32 76 28 0.4 44 83 39 NaHCO3
Bag filter + dry scrubbing (3) 200
0.5 45 93 63 (1) Data refer to average values of three half-hour measurements for each operating condition. (2) Installation with two oil-fired furnaces for container glass. (3) Installation with one gas-fired furnace for container glass. Source: [84, Italy-Report 2007]
The semi-dry process is used on a limited number of applications within the glass industry. In combination with a bag filter and the use of Na2CO3 solution as the absorbent, very high abatement rates have been reported. These indicative results are summarised in Table 4.31 below. The SO2 abatement of 95 % is the maximum possible percentage. On current industrial operation the range of reduction obtained is more usually 80 – 90 %.
Table 4.31: Indicative SOX abatement rates for semi-dry scrubbing with Na2CO3 solution Pollutant SOX abatement rate
SO2 90 – 95 % HCl >90 % HF >85 %
SeO2 >90 %
More generally in other industrial applications, references give the results shown in Table 4.32 below for the semi-dry process with Ca(OH)2. However, semi-dry applications using lime are not commonly found in the glass industry.
Table 4.32: SOX abatement rates for semi-dry scrubbing with Ca(OH)2
Molar ratio SOX abatement rate Ca/S =1 80 %
Ca/S =1.5 90 % Ca/S =2 92 %
Source: [49, ADEME 1999]

Chapter 4
268 Manufacture of Glass
An effect on NOX emissions has also been reported when using Na2CO3 or NaHCO3 in the semi-dry process. For NaHCO3 the optimal range is located between 120 – 160 °C. However, under normal representative conditions in the glass industry, only a moderate effect on NOXabatement rates has ever been observed. In summary, the reduction achieved depends on a number of factors related to the process and absorbent. Under favourable conditions, high abatement rates can be achieved; in the best case up to 95 % for total SOX expressed as SO2. The value for SO3 abatement rate is generally greater than 80 %. In continuous filament glass fibre production, for batch formulations containing boron, the abatement rates reported above are particularly difficult to achieve due to the deposition of boron compounds that evaporate from the glass melt on the surface of the dry alkaline reagent, with consequent deactivation. In these cases, the removal efficiency of the scrubbing stage may decrease considerably. The actual emission concentration or mass emission per tonne of glass will depend on the inlet concentration and the desulphurisation efficiency. These inlet concentrations depend on the following factors: • fuel sulphur input • glass type (colour, oxidation state and sulphur retention/content in the glass) • technological requirements for refining, quality and amount of sulphates • amount and type of cullet (internal or external, sulphur and contaminants content) • filter dust composition and recycling rate • combustion conditions (close to stoichiometric combustion conditions, for NOX reduction
by primary measures, may increase the SO2 content in raw waste gas). However, overall reduction of emissions requires the elimination (by internal or external recycling or landfill) of the solid waste stream of the sulphated dust produced. In the case of landfill, the cost for SOX reduction can be estimated at between EUR 0.5 and 1.2 per kg SO2removed depending on the context [76, TNO SO2 2007].
In practice, the complete recycling of filter dust, including this sulphated waste, is very frequently considered to be a reasonable environmental and economic option, where this is technically possible. In this case, the overall reduction of SOX emissions is limited (by mass balance considerations) to the reduction at the source obtained by substituting sulphate in the raw materials by filter dust. Clearly this is in addition to other appropriate primary measures to reduce overall sulphur input to the melt by the optimisation of sulphur levels in all feed materials (including cullet) wherever practicable. Therefore, in order to reduce acid gas emissions, it may be necessary to consider an external disposal route for a portion of the collected material. An external option for recycling or reuse would be preferable to landfill. However, in most cases there is no economically viable external reuse option for the material. Existing legislative requirements defining such materials as waste may act as additional barriers to external recycling. The determination of what represents the best protection to the environment as a whole can often be site-specific and may involve consideration regarding the disposal of the solid waste stream. With closed loop filter dust recycling, the SOX emission levels observed at the time of writing (2010), for natural gas firing furnaces, are generally in the range of 200 – 800 mg/Nm3 for glasses produced with a low cullet recycling rate, and 600 – 900 mg/Nm3 for the most common container glass production using high levels of external cullet. Emissions in the range of 800 – 600 mg/Nm3 with a fuel oil with 1 % sulphur can be achieved depending on the above-mentioned factors. Especially for glasses with a high percentage of cullet in the batch formulation and a low capacity for sulphur uptake (e.g. reduced glasses such as certain green and brown container glasses), values in the higher end of the range are expected. There are

Chapter 4
Manufacture of Glass 269
examples in the glass industry where the net desulphurisation efficiency is close to zero when the dust containing sulphur is fully recycled. However, in these situations the main goal was not desulphurisation, but the removal of HCl, HF, metals and dust. Nevertheless, even in these cases, lower levels may be obtained with the consequent creation of a sulphated waste stream for external disposal. Thus, when considering desulphurisation in the glass industry, it is important to take into account the possible counteracting effects and the jeopardising of other environmental targets. The most important environmental targets related to SO2 abatement are: • high cullet recycling rates • minimisation of waste production through internal or external dust recycling • waste heat recovery • other atmospheric emission reductions. Cullet recycling is an important environmental target because of energy savings, waste reduction and reduction in the consumption of natural resources. European Directive 94/62/EC sets targets for the recycling of packaging waste, including glass, with the result that most European Member States are recycling about 60 – 70 % of the container glass that is put on the market. For instance, for container glass furnaces, the legislative quota in Germany for cullet recycling is 75 % as an annual mean value and this quota is regularly exceeded. Where cullet is used with a higher sulphur content than the glass produced, the excess sulphur may result in increased SOX emissions. This is, for example, the case in green and brown reduced glasses that use mixed post-consumer cullet. Mixed post-consumer cullet is, in some cases, the only available source of this type of cullet to the producers and its sulphur content is higher than the product due to the presence of oxidised glass (flint glass, flat glass, certain green glasses) in the cullet mixture. The progressive improvement in selective cullet collecting and sorting will improve the situation. However, the oxidised coloured glass, like certain green glasses, can also have higher levels of sulphur because of their oxidation state, and colour sorting will be less effective in reducing the sulphur content in cullet when significant proportions of such glasses are present. Filter dust recycling is also an important target for reasons of waste prevention. Recycling of filter dust implies the substitution of some of the sulphate contained in the batch material. In principle, filter dust acts as a refining agent but it may be less effective in some cases and a 100 % substitution is not always possible. Depending on the different glass types (e.g. colour, oxidation state) the absorption of sulphate arising from filter dust sulphur varies and is sometimes limited. With respect to full filter dust recycling and in consideration of the above-mentioned variations, particular care has to be given to the sulphur mass balance and the scrubbing equipment should be designed to enable an appropriate selection of scrubbing agents. The recycling of filter dust may cause an increase of fine dust carryover during batch charging, especially when preheating of the batch is applied. A summary of the main advantages and disadvantages associated with the use of dry and semi-dry scrubbing techniques is shown in Table 4.33.

Chapter 4
270 Manufacture of Glass
Table 4.33: Main advantages and disadvantages of dry and semi-dry scrubbing techniques Advantages
• Substantial reductions in SOX emissions can be achieved (depending on the specific sulphur balance and recycling)
• Reduced emissions of other substances (chlorides, fluorides, selenium compounds, other acids, e.g. boric acid)
• In most glass melting facilities, the collected dust can be recycled, reducing the consumption of new raw materials. This is not the case for some productions, e.g. stone wool.
Disadvantages
• The technique consumes energy • May result in the generation of a solid residue which cannot always be recycled (especially at
high absorption efficiencies), due to an unbalance in the sulphur input-output, chloride accumulation or glass quality issues, thus increasing the waste levels. In most cases dust can be recycled but this requires adjustments to the process and can limit the overall SOX reduction efficiency. For some types of glass production, the solid residue is totally or partially disposed of to landfill. For stone wool, this dust cannot be recycled at all in the process, unless a briquetting system is in use
• In most cases this waste is considered hazardous (depending on chemical composition), and from locations where landfill areas do not exist, the waste has to be transported over long distances to other countries (e.g. to salt mines in Germany)
• Involves substantial capital and operating costs
Example installation data reporting achievable emission levels associated with the application of a dry scrubbing stage combined with a filter system, together with the main operating parameters, are presented in Section 4.4.1.2, Table 4.8 and in Table 4.34 below.
Table 4.34: Emission levels associated with the use of dry scrubbing combined with a filtration system in example installations
Container glass(1) Flat glass(2) (3)
Type of furnace End-fired, regenerative Float, cross-fired, regenerative
Fuel Natural gas + fuel oil Natural gas Furnace capacity 300 t/day 600 t/day Actual pull rate 297 t/day 600 t/day Electric boosting Yes Yes Type of glass Amber Clear Cullet 72 % 25 % Specific energy consumption 4.21 GJ/t glass Not specified Filter system ESP – 2 fields ESP – 2 fields Temperature before filter 400 °C Not specified Type of sorbent Ca(OH)2 Ca(OH)2Amount of sorbent 28 kg/h Not specified Reuse of filter dust in the batch formulation 100 % No-Disposal
Associated emission levels (AELs) Half-hour average values Half-hour average values
mg/Nm3, dry gas at 8 % O2
Dust: 1.2 SOX: 829 HCl: 25.0 HF: 3.3
Dust: <20 SOX: <300 HCl: <15 HF: <1
kg/t glass
Dust: 0.0019 SOX: 1.34
HCl: 0.0405 HF: 0.0053
Dust: <0.05 SOX: <0.75 HCl: <0.04 HF: <0.003
(1) The installation is equipped with a heat recovery system installed after the ESP. (2) Removal efficiencies for the gaseous pollutants: 36 % for SOX, 57 % for HCl and 83 % for HF. (3) Values given in kg/t have been calculated by applying the conversion factor 2.5 x 10⁻³ for flat
glass (see Table 5.2). Source: [75, Germany-HVG Glass Industry report 2007] [84, Italy Report 2007]

Chapter 4
Manufacture of Glass 271
Applicability In principle, the techniques are applicable to all processes (including new and existing) with waste gases which contain acidic substances. Due to the high dust loading, dust removal is essential. The dry process is much more widely used within the glass industry; because it has been the most cost-effective way of achieving the prevailing technical and regulatory requirements. The most commonly used absorbent is hydrated lime, Ca(OH)2.
The principles of these techniques are common regardless of the size of the installation. However, it should be recalled that the scale and therefore the actual cost, and possibly the cost effectiveness would vary significantly from application to application. In particular, there is limited experience with semi-dry scrubbing for smaller processes. Economics The costs for scrubber systems in combination with ESPs and bag filters are given in Sections 4.4.1.2 and 4.4.1.3. Sodium bicarbonate is substantially more expensive than the other absorbents and is not used as often. A summary of estimated costs for typical dry scrubbing applications is reported below. Data presented are based on the methodology described in Section 8.1. [94, Beerkens – APC Evaluation 2008].
Flat glass production
• Typical investment costs for dry scrubbing systems applied on a float glass furnaces are in the range of EUR 250 000 – 500 000, including filter dust removal and storage.
• The costs of a complete system comprising of an ESP combined plus dry scrubbing are about EUR 3.5 – 4 million for a furnace capacity of 500 tonnes/day and up to EUR 5.5 million for a larger furnace of 900 tonnes/day.
• For the application of a dry scrubbing system combined with a bag filter, the estimated investment costs are in the range of EUR 2 – 2.5 million.
• The associated specific costs are in the range of EUR 4 – 6.5 per tonne glass when an ESP is applied and EUR 4.5 – 7 per tonne glass with a bag filter.
Container glass production
• The investment costs for an ESP combined with dry scrubbing are in the range of EUR 1.5 to 3 million for furnace capacities between 300 tonnes/day and 600 tonnes/day; while the costs could exceed EUR 4 million for larger installations, above 750 tonnes/day (e.g. two or more furnaces connected to one filter).
• The application of a bag filter combined with dry scrubbing on a medium size furnace (<300 tonnes/day) involve investment costs in the range of EUR 700 000 to 1.25 million.
• The associated specific costs are expected to be in the range of EUR 4 – 7 per tonne melted glass with the use of bag filters and total disposal of dust and in the range of EUR 2.7 – 5.5 per tonne melted glass with the use of electrostatic precipitators, depending on the melting capacity of the installation. The higher values refer to smaller and more recent installations, while the lower levels are associated with gas-fired furnaces and complete recycling of the filter dust. Higher specific costs, in the range of EUR 10 – 16 per tonne melted glass, are expected for smaller furnaces (<150 tonne/day). The use of fuel oil instead of natural gas may account for an additional cost increase of about EUR 1.5 per tonne melted glass.
Other glass sectors
• For small furnaces, with capacity <40 tonnes/day, the estimated specific costs are expected to be in the range of EUR 10 – 14 per tonne melted glass with the use of bag filters and between EUR 15 and 17 per tonne melted glass with the use of electrostatic precipitators.

Chapter 4
272 Manufacture of Glass
Stone wool production
• For a stone wool cupola furnace with a capacity of 200 tonnes/day, the capital costs for dry-scrubbing, in addition to the standard technique of bag filters, are estimated at EUR 1.7 million with operating costs of EUR 340 000, considering the disposal of filter dust. In this case, the specific costs are estimated to be approximately EUR 9 per tonne melted glass. [115, EURIMA-ENTEC Costs evaluation 2008].
When semi-dry (quasi-dry) scrubbing systems are used, the estimated, associated costs are the following: Flat glass production 1. Typical investment costs for semi-dry scrubbing systems combined with a bag filter
applied on float glass furnaces are estimated to be in the range of EUR 4.5 – 5 million for a medium size furnace and up to EUR 7 million for large furnaces of up to 900 tonne/day.
2. For a gas-fired float furnace with filter dust recycling, the specific costs are in the range of EUR 6 – 8 per tonne glass, corresponding to EUR 0.75 per kg SOX removed and EUR 15 – 22 per kg dust removed. When fuel oil is used for combustion, specific costs are higher, due to the extra costs for the disposal of part of the filter dust, and are expected to be in the range of EUR 10 – 14 per tonne melted glass, about 50 – 100 % higher than the costs for dry scrubbing.
Container glass production • The investment cost for the application of a bag filter combined with semi-dry scrubbing
on a furnace with 350 tonnes/day capacity is about EUR 2.25 million. • The associated specific costs are expected to be in the range of EUR 5.5 – 6.5 per tonne
melted glass or higher. Stone wool production • For a stone wool cupola furnace with a capacity of 200 tonnes/day, the capital costs for
semi-dry scrubbing, in addition to the standard abatement technique of bag filters, are estimated at EUR 2.1 million, with operating costs of EUR 250 000, considering the disposal of filter dust. The associated specific costs are estimated to be approximately EUR 9.5 per tonne melted glass [115, EURIMA-ENTEC Costs evaluation 2008].
A comparison of estimated cost data for the application of a filtration system plus a scrubbing stage, together with the performance, advantages, disadvantages and boundary conditions of various scrubbing methods applicable for the removal of different gaseous pollutants (SOX, HF, HCl, boric acids and selenium compounds) from the flue-gases of glass melting furnaces is presented in Section 8.1.7. Driving force for implementation Compliance with the legal emission limits is, in general, the main driving force for implemention. The possibility of reducing emissions of acid gaseous pollutants, particularly SO2, HCl and HF, together with the necessity, in most but not all cases, of protecting the filter from corrosion are the driving forces for the application of these techniques. The need to reduce emissions of metals (e.g. selenium from flint glass or bronze flat glass) might be the driving force of some applications, when their prevailing presence in the flue-gas is in the form of gaseous compounds.
Chapter 4
Manufacture of Glass 273
Example plants There are many examples of these techniques being used for glass furnaces, particularly the dry-process in conjunction with an electrostatic precipitator or bag filter. Most of the furnaces in Europe where secondary dust abatement is fitted utilise these techniques. Very few applications are present in the stone wool production sector. Reference literature [49, ADEME 1999] [42,VDI 1997] [75, Germany-HVG Glass Industry report 2007] [76, TNO SO2 2007] [86, Austrian container glass plants 2007] [89, EURIMA Suggestions 2007][94, Beerkens - APC Evaluation 2008 ] [65, GEPVP-Proposals for GLS revision 2007]
4.4.3.4 Wet scrubbers Description In the wet scrubbing process, the gas species (such as HF, HCl, SO3, and SO2) are first dissolved in a liquid, based on the solubility of these gases in the selected liquid. The solubility increases with the alkalinity of the solution or suspension used. The dissolution rates of the gases can be improved by using reactive solutions and special packed towers, enabling an intimate contact between the flue-gas and the liquid phase. Generally, the liquid is an aqueous solution of ionic species that increases the gas solubility. The required excess of reactant in the solution to achieve high acid gas dissolution rates is very small. The rate is mainly determined by the absorption of gas by the liquid. The design of the reactor is important and often countercurrent gas/liquid flows are applied and a high level of turbulence is maintained in the gas flows to improve the contact. Sodium hydroxide or sodium carbonate solutions are often used for wet scrubbing, although sometimes suspensions or slurries of limestone/lime are applied. Downstream of the wet scrubber, the flue-gases are saturated with water and a separation of the droplets (containing absorbed gases) is required before discharging the flue-gases. The separated liquid may contain insoluble particles, dissolved material, the reaction products and non-reacted alkaline agent. The resulting liquid has to be treated by a waste water process and the insoluble matter is collected by sedimentation or by filtration to extract the solid material or sludge in a concentrated form. The concentrated sludge is often dried or part of the water is removed before disposal. In most cases it is very difficult to reuse the sludge as a raw material in a batch composition for glass. Typical reactions that occur during wet scrubbing are reported below. • Scrubbing process with a suspension of hydrated lime:
Ca(OH)2 (susp) + SO3� CaSO4 (susp) + H2O (g) Ca(OH)2 (susp) + 2HCl � CaCl2 (susp) + H2OCa(OH)2 (susp) + 2HF � CaF2 (susp) + H2OCa(OH)2 (susp) + 2HBO2� Calcium borates + H2OCa(OH)2 (susp) + 2H3BO3� Calcium borates + H2OCa(OH)2 (susp) + SeO2 + 1/2 O2 � CaSeO4 + H2O
(susp = suspension) (g = vapour/gas).
• Scrubbing process with a sodium carbonate solution:
Na2CO3 (sol) + SO2 +1/2 O2 � Na2SO4 (sol) + H2O + CO2Na2CO3 (sol) + 2HCl � 2NaCl (sol) + H2O + CO2Na2CO3 (sol) + 2HF � 2NaF (sol) + H2O + CO2Na2CO3 (sol) + H3BO3 � Sodium borates + H2O + CO2Na2CO3 (sol) + SeO2 +1/2 O2 � Na2SeO4 (sol) + CO2
(sol = solution).

Chapter 4
274 Manufacture of Glass
Achieved environmental benefits Removal efficiencies of more than 90 % are achievable with wet scrubbers depending on the amount of absorption agent used. Gaseous pollutants such as SO2, SO3, HF, HCl, H3BO3, HBO2and SeO2 might be removed by wet scrubbers from the flue-gases of glass melting furnaces. Cross-media effects The main cross-media effect is represented by the amount of waste water that needs to be treated before discharge. In addition, a solid waste (filter cake) or sludge is generated from the separation of the insoluble material from the waste water, by filtration or sedimentation followed by a pressing of the residue. Sludge can be separated in a dry or semi-dried form, depending on the system applied. Direct reuse of sludge or filter cake in the glass-forming batch is often not possible, but depends strongly on its chemical composition. In several cases the reuse or recycling of the filter cake or sludge into the glass batch formulation may cause the accumulation of species, such as chlorides, fluorides or sulphur, in the glass furnace due to the limited solubility of these components in the glass melt and the high removal efficiency from the flue-gases achieved for these components by using wet scrubbers. In addition, the reuse of sludge or filter cake may also involve handling problems. Energy consumption is associated with the use of wet scrubbers, including electricity for the injection of the alkaline reagent, cleaning of the filter, pneumatic transport of sludge/filter cake, electrostatic field (in the case of wet electrostatic precipitators), and use of the fan. Typical energy consumption for wet scrubbing systems is about 20 – 25 kWh/tonne glass. Indirect emissions associated with the use of electricity are estimated at about 550 – 660 tonnes CO2/year for an installation of 100 – 125 tonnes melted glass per day. Operational data The typical operating temperature used in the glass industry is between 50 and 80 °C. In most cases, the conversion efficiency of the applied absorption agents is very high and the stoichiometric amount of reagent is added according to the relative amount of SO2, HF, HCl, SO3, H3BO3, HBO2 and SeO2 present in the flue-gases.
However, the higher removal efficiency of gaseous pollutants achieved by wet scrubbing systems may be offset by a significant reduction of the abatement rate for particulate emissions compared to dry and semi-dry scrubbers in combination with filters. Applicability Wet scrubbers are not often used in the glass industry because of the higher costs and the waste water treatment aspects. The waste water treatment often produces sludge or a solid residue, containing the non-reacted material (e.g. lime), the reaction products and water. This sludge cannot always be used as a raw material for glass production and most of the water in the sludge has to be removed before transporting and discharging the waste material to an external disposal site.
Wet scrubbers are used in the mineral wool sector for cleaning gases of the forming area and curing oven. See Sections 4.5.6.1.2 and 4.5.6.2.2. There are applications of wet scrubbing systems to treat the flue-gases of cold-top electric furnaces. In a limited number of cases, wet scrubbers are used to treat the flue-gases from hot-end coating installations in the container glass industry to remove tin, organotin compounds and chlorides from the waste gases. This treatment may be used in addition to or instead of the more common procedure of combining the emissions from hot-end coating operations with the flue-gases from the melting furnace, as described in Section 4.5.1. In this case, the objective is to reduce the concentration of gaseous chlorides sent to the abatement system (dry scrubbing plus filter).

Chapter 4
Manufacture of Glass 275
Economics A cost estimation for the application of wet scrubbing systems to glass melting furnaces has been carried out, based on the methodology described in Section 8.1. The main results are reported below. • Investment costs for the application of wet scrubbing systems are about EUR 2 – 3
million for a flue-gas volume of 10000 – 15000 Nm3/h. Typical specific costs are in the range of EUR 15 – 20 per tonne melted glass or EUR 1 – 1.5 per kg SOx removed and EUR 15 – 25 per kg of dust removed. These costs include the operation of a filter which is considered necessary for the reduction of particulate emissions. In this case, the total costs for wet scrubbing are considerably higher than those for dry scrubbing plus a filter.
• The estimated investment costs for the application of wet scrubbing to an oxy-fuel-fired furnace or an air-fuel-fired recuperative furnace with a production capacity of 100 – 125 tonnes/day of continuous filament glass fibre are in the range of EUR 2.6 – 3.0 million, including sludge and waste water treatment. Annual operating costs are about EUR 300 000 per year, per furnace. The additional production costs are estimated to be between EUR 14 – 16 per tonne glass, considering a cost for disposal of EUR 100 per tonne of waste and excluding the costs for water treatment, which would add significantly to the specific value. These costs would significantly increase, up to EUR 20 – 22 per tonne melted glass if higher waste disposal fees (EUR 400/tonne waste), are applied. In this case, specific costs for SOx removal would be about EUR 1 – 1.65 per kg SO2removed and EUR 20 – 30 per kg dust removed.
• No cost data are available for applications in the tableware, container glass and float glass installations since the technique is not currently applied in these sectors.
Driving force for implementation A driving force for implementing a wet scrubbing system could be the need to minimise gaseous emissions that are particularly difficult to control with other techniques, such as boric acids. However, the significant cross-media effects associated with this technique jeopardise the application of wet scrubbing. Example plants A very limited number of applications operate in the glass industry. Some systems are applied to continuous filament glass fibre melting furnaces (two furnaces in the Netherlands) and to special glass production (e.g. in Germany and Austria). The technique is applied to a relatively small installation in Italy, in the domestic glass sector, for treating the flue-gases of six electric furnaces. Data concerning an example installation producing special glass are reported in Table 4.35.

Chapter 4
276 Manufacture of Glass
Table 4.35: Emission levels associated with the application of wet scrubbing to an electric furnace producing special glass in an example installation
Operating parameters Type of furnace Electric melting Furnace capacity 40 t/d Actual pull rate 32 t/d Furnace age 3.5 yrs Type of glass Soda-lime for headlights Cullet (only internal) 30 % Specific energy consumption (only melting) 4.50 GJ/t glass Total energy consumption (per tonne of melted glass) 7.11 GJ/t glass Waste gas treatment system Wet scrubber Emission levels (1)
mg/Nm3, dry gas kg/tonne melted glass Particulate matter 1.8 0.017 NOX (2) 159 1.54 SOx 2.3 0.022 HCl <0.2 <0.002 (1). Emission data refer to discontinuous measurements of a half-hour. (2). NOX emissions arise from nitrates in the batch formulation. Source: [111, Austrian Special glass plant 2006]
References to literature [94, Beerkens - APC Evaluation 2008]
4.4.4 Fluorides (HF) and chlorides (HCl) In this section, all gaseous fluorides and chlorides are expressed as hydrogen fluoride (HF) and hydrogen chloride (HCl) respectively. The vast majority of the halides emitted are in these forms. Emissions of HF and HCl arise from impurities in the batch materials or from batch materials that are selected because they contain these species in sufficient quantities to impart desired product qualities.
4.4.4.1 Reduction at source In most processes HF and HCl emissions arise from impurities in the batch materials, which are emitted upon melting. Many raw materials contain very low levels of fluorine and chlorine that have little impact on final emission levels. However, some raw materials, including external cullet, contain significant levels of these elements as impurities and the main substances of this type include: • synthetic soda ash, which has a residual NaCl content of approximately 0.05 – 0.15 % • dolomite, which can contain significant fluoride impurities • post-consumer glass cullet, which can contain a range of impurities at significant levels,
particularly chlorides, fluorides and metals. The amount of these substances varies depending on the purity of the cullet supply, but in regions with high recycling levels the species can gradually build up in the glass
• recycled dusts from abatement equipment contain fluoride and chloride salts, which can build up in the system
• some fuels (e.g. coke from certain sources) can contain chlorides • plastics in external recycling cullet which may contain chlorides.
Chapter 4
Manufacture of Glass 277
The chloride emissions from those processes using high synthetic soda ash levels in the batch (mainly soda-lime glass) are significantly higher than from, for example, glass wool or continuous filament glass fibre (see Chapter 3). Of those processes that do not intentionally include these materials in the batch, the highest emissions of HCl and HF tend to come from flat and container glass processes. The emission levels can be minimised by the careful selection of raw materials. The issues surrounding NaCl levels in soda ash are discussed in Section 4.4.1.1. A number of the other techniques discussed in Chapter 4 also have beneficial effects on HF and HCl emissions. These are mainly those techniques that reduce volatilisation by lowering temperatures, by reducing airflow and by minimising turbulence. These techniques include: • increased cullet usage, which lowers temperature and energy usage, and substitutes for
soda ash with its associated chloride impurity. Potentially, there is a paradoxical effect if cullet has high HCl or HF levels
• electric boost • improved furnace design and geometry • burner positioning • oxy-fuel melting • electric melting. A number of product types made within the glass industry use materials containing fluorides to impart specific properties to the material or to meet the requirement of the glass quality. The most important examples of this are discussed below. Continuous filament glass fibre The production of continuous filament glass fibre generally requires fluoride. The fluoride is added to optimise surface tension and liquidity properties, to aid fiberisation and to minimise filament breakage. These are important factors in the economic and environmental performance of the process. High breakage leads to reduced yield and increased waste. The main source of added fluoride is usually fluorspar (CaF2), but significant levels can also be present in china clay (alumina silicate). Efforts have been made in reducing or eliminating the quantity of added fluorides in the continuous filament glass formulations. In such cases, the only fluorides present in the glass melt originate from the tramp fluorides present in the mineral raw materials, mainly from kaolin clay. When adequate sources of the minerals are available (of suitable quality and which are economically viable), a careful selection of the raw materials allows for achieving emissions levels of <20 mg/Nm3 or 0.09 kg/melted tonne. The more recent development of boron-free E-glass, now produced by some companies in Europe having access to this proprietary technology, allows for ‘virtually’ eliminating the volatile components of the glass melt: no boron, low alkali (Na2O + K2O <1 %), low sulphate and low fluorides. A potential cross-media effect associated with the use of fluorine and boron-free formulations is a higher energy consumption resulting from the higher melting temperature. However, the absence of boron offers the possibility to use ‘a convective glass melting’ technique (‘crown burners’) to achieve a better transfer of the available heat to the glass melt. The developments in low-fluorine and low-boron glasses are the result of expensive development work and the technology is closely guarded by the companies that have developed it. Therefore, the technique is not available immediately to all operators. There are also lengthy and expensive product registration procedures that must be completed for new products with changes in the formulation.

Chapter 4
278 Manufacture of Glass
Frits manufacture Emissions of fluorides are directly related to the use of fluoride compounds in the batch. Fluorides are predominantly used in the production of enamel frits and are not usually present to any significant extent in the raw materials used for ceramic frits manufacturing. Some ceramic frits producers may periodically manufacture small quantities of enamel frits in the ceramic frit kilns, giving rise to fluoride emissions, but this constitutes a very small proportion of the overall production of the operators. The emission of fluorides is probably the most significant environmental impact of enamel frits production. Fluorides provide unique properties to the frits, such as improved thermal and chemical resistance and a reduced risk of blistering of the enamel coating. They are added to the batch as fluorspar, fluorosilicate, cryolite or sodium fluorosilicate. Most producers now offer some fluoride free or low-fluoride enamels, and the availability of these products is increasing. In general, fluoride free products represent less than 10 % of production, with low fluoride products at about 30 %. The fluoride in the batch cannot, generally, be reduced sufficiently to achieve emission levels comparable with scrubbing techniques or other types of frits. Opaque glasses Opaque glasses are made in the domestic, special and occasionally the container glass sectors. The addition of fluoride causes crystallisation in the glass giving the characteristic cloudy and opaque appearance. The majority of installations producing these products use dry scrubbing techniques to treat the HF emissions. No practicable alternatives are available that produce a comparable quality. In many cases, opaque glass is melted in cold-top electric furnaces. This lowers the emissions because a significant proportion of the fluoride is absorbed in the batch blanket and less fluoride is needed overall. Also, the use of electric melting greatly reduces the volume of waste gas to be treated. The special glass sector also produces fluorine crown glass, which is an optical product with a very high fluoride content. The production level of this glass is very low and in the EU it is always carried out with waste gas treatment. In general, measures to achieve reductions at the source are preferable to waste gas treatment. With glasses containing fluorine, measures to reduce fluorine levels can place severe restrictions on operating conditions and require substantial development resources. Where emission reductions are required by legislation, this has led many producers to favour waste gas treatment and particularly dry scrubbing.
4.4.4.2 Scrubbing techniques The scrubbing techniques applicable to these emissions are dry, semi-dry and wet scrubbing. These techniques and the emission levels achievable are discussed in Sections 4.4.3.3 and 4.4.3.4 above. The choice of absorbent is important and there is sometimes a need to trade off between the reduction of SO2 and the reduction of HF and HCl. In particular, there is a competing reaction between HCl/HF and SO2 with sodium carbonate. The optimum choice will depend on a number of issues including the relative levels of the different pollutants in the waste gas. The different removal efficiencies for the most common alkaline reagents applied within the glass manufacturing industry are presented in Table 4.27, Table 4.30 and Table 4.31. Another technique that could be technically and economically viable for very small scale processes (e.g. some frit furnaces) is wet scrubbing, using a packed bed scrubber circulating water or, more effectively, an alkali solution. The main drawback with this approach is that an aqueous waste stream is generated.

Chapter 4
Manufacture of Glass 279
4.4.5 Oxides of carbon Oxides of carbon include carbon dioxide (CO2) and carbon monoxide (CO). Carbon monoxide arises as a product of incomplete combustion and is rarely emitted from glass industry installations at a level to cause environmental concern. Significant levels are encountered in stone wool cupolas, but most plants are fitted with an afterburner to oxidise the emissions before release. Carbon dioxide arises from the combustion of fossil fuels or other organic materials, from the decomposition of carbonates, and from the oxidation of other raw materials which contain carbon (slag, carbon, etc.) present in the batch. Emissions of CO2 strongly depend on the energy efficiency of the melting process and may vary significantly when primary or secondary techniques are applied for the control of other pollutants, e.g. batch and cullet preheating, reburning or the 3R process, etc. Carbonates such as soda ash and limestone are the main sources of alkali metal oxides and alkali earth metal oxides in glass making. However, the use of burnt lime and dolomite in place of carbonates has been recently applied for some glass production. The only real alternative sources of these oxides are post-consumer waste and process waste, that is, cullet for glass processes and process wastes, recycled product and slag (for the stone wool production only). The issues surrounding these materials are discussed elsewhere in this document, but generally the main factor limiting their use is the availability of adequate quantities of the materials of sufficient quality and consistency of supply. High utilisation of these materials is generally limited to container glass and glass wool for the use of cullet and stone wool for slag utilisation. Carbon dioxide has well-known associated environmental effects, but it is not one of the main polluting substances listed in Annex II to Directive 2010/75/EU. The increasing use of recycled materials within the glass industry is driven by the need to save energy and to reduce waste, and the effect on the substitution of carbonaceous materials is an added benefit. Similarly, the reduction in emissions of CO2 derived from reduced fuel usage is driven by the need to reduce energy usage and operating costs, and by the pressure to lower NOX emissions. Many techniques discussed in this chapter have important implications for CO2 emissions, but no techniques beyond those considered for energy and other pollutants are presented for consideration in determining BAT for glass industry installations. Indirect emissions of CO2, in particular when electric energy is required in the production process and for operating the air pollution control systems should also be taken into account for assessing the overall contribution of the installation to oxides of carbon emissions. Carbon dioxide (and other greenhouse gas emissions) are regulated primarily by the ‘sister’ Directive (2003/87/EC) of the European Parliament and of the Council establishing a scheme for greenhouse gas emission allowance trading within the community (The European Union Emissions Trading Scheme Directive).
4.5 Techniques for controlling emissions to air from non-melting activities
This section covers those activities which are not related to melting or to materials handling. These activities include product forming and any activities carried out on the products which are generally considered to form part of the main process. In most of the activities in the glass industry, the melting of the raw materials is the first major activity carried out and so the subsequent activities are sometimes referred to in this document as ‘downstream’ activities. Due to the very sector-specific nature of the downstream activities, the discussion is presented on a sectorial basis.

Chapter 4
280 Manufacture of Glass
4.5.1 Container glass The main source of emissions to air from non-melting activities in container glass production is the hot-end coating operation. The coating, a very thin layer of metal oxide, is applied by passing the hot containers from the forming machine through a hood containing vapours of tin or titanium compounds. The most common materials used are anhydrous tin tetrachloride (SnCl4), monobutyltintrichloride (C4H9SnCl3) and anhydrous titanium tetrachloride (TiCl4). The emissions consist of HCl, oxychlorides, tin and titanium oxides (SnO2, TiO2) as fine particulates, and any unreacted coating materials. Minor emissions of volatile organic compounds (VOCs) could also arise from cold coating operations. These emissions are not considered to be very significant and are not discussed further in this document. The first step in reducing emissions is to minimise the usage of the coating commensurate with the product requirements. The use of the material can be further optimised by ensuring good sealing of the application areas to minimise losses. Currently, waste gases from hot-end coating operations are managed in four different possible ways: • extracted and emitted directly to the air • extracted and treated by secondary techniques, e.g. wet scrubbing or dry scrubbing and
filtration • combined with the waste gas from the furnace upstream of the scrubber and filter system • combining the waste gas with furnace combustion air. The discharge of waste gases from hot-end coating operations directly to the air is, in general, justified only by the relatively low mass flow or concentration of pollutants present in the flue-gas. In fact, in some circumstances, with the application of new generation hoods and distribution systems, emissions can be reduced below 5 mg/Nm3 metal compounds and below 30 mg/Nm3 HCl. However, this practice is applied only in specific cases; while in most installations, other options are used. The option to combine the waste gases with the furnace combustion air may have some effect on the glass chemistry and on the regenerator material; although this is not likely to be significant. Some installations in Europe apply this technique, combining the waste gas from the hot-end coating with the combustion air before entering the regenerator, although no information regarding these applications is currently available (as for 2009). The combination of flue-gases from hot-end coating with the waste gas from the furnace upstream of the air pollution control system is often applied where secondary abatement of the furnace waste gas is installed. From data supplied, this option is reported to be the most frequent technique used in practice for the treatment of hot-end waste gas. From an investigation concerning a total number of 125 plants, 25 out of 31 abatement installations for the treatment of hot-end coating waste gases were reported to be using this technique. Where the collected material is recycled, consideration may have to be given to the effects of metals on the glass and to the build-up of chloride and metals and their effect on the system. These considerations may limit the recycling of the dust in some cases. As discussed elsewhere in this document, wet scrubbers can be effective in reducing gaseous emissions but their effectiveness in treating fine dusts is limited by the pressure drop across the system. The performance will depend on the inlet composition, but a single stage scrubber may be sufficient for achieving compliance with local requirements. If further reductions are necessary, then either a bag filter followed by a packed bed scrubber, or a venturi scrubber followed by packed bed scrubber could be used. These techniques could be expected to reduce

Chapter 4
Manufacture of Glass 281
HCl to <10 mg/Nm3, but the efficiency for the removal of particulate matter and total metals is quite low due to the fine particles and the peculiar chemical properties of the reaction products generated by the application of tin or titanium chlorides. Where HCl is present as an aerosol, emissions of <10 mg/Nm3 could be expected. The costs of these alternatives will depend on the waste gas volume. Local circumstances may mean that comparable figures can be achieved with less sophisticated methods. Another significant source of emissions from hot-surface treatment operations is associated with the treatment of the inner surface of container glass, mainly destined to pharmaceutical uses, with SO3. In these cases, wet scrubbing is normally applied for SOX removal. Technical details concerning the use of wet scrubbers are given in Section 4.4.3.4 and Section 4.5.6.1.2.
4.5.2 Flat glass In general, the emissions to air from non-melting activities in flat glass production are very low and do not require abatement measures. If the float bath is correctly operated, there are no appreciable emissions of tin vapours. SO2 is used at the beginning of the lehr but again, if the process is properly operated, emissions are low. Typical concentrations and mass emissions are reported between 150 – 300 mg/Nm3 and 0.02 – 0.04 kg/tonne glass (see Section 3.4.2.3). The only other potential emissions are combustion products from natural gas heaters in the lehr. The exception to this is where online coating processes are carried out. The emissions from these processes are very case specific and an actual example is used here to describe the techniques that can be used. The atmospheric pressure chemical vapour deposition is a coating process which uses the following raw materials: tin tetrachloride (SnCl4), hydrofluoric acid (HF), methanol (CH3OH), and a silane (SiH4). There are two separate coating stages, a SiCO undercoat and a fluorine-doped tin oxide topcoat. Emissions from the undercoat stage pass through a thermal incinerator to destroy any organics, the waste gas is cooled and the solids (amorphous silica) are removed by a bag filter. The collected material is recycled to the furnace. In the topcoating stage, the waste gases, which contain halides and tin compounds, are passed through a high-temperature reactor to oxidise the tin compounds. The solid tin oxide is removed by an electrostatic precipitator and the halides are removed in a packed bed chemical scrubber. The emission levels achieved are: • particulates 15 mg/Nm3
• hydrogen chloride 5 mg/Nm3
• fluorine and its gaseous compounds as HF <1 mg/Nm3
• metals <5 mg/Nm3.
In general, the emissions from these types of activities can be controlled using one of the techniques listed below or a combination of them; in some cases, other, equally effective techniques may be appropriate: • dust abatement equipment consisting of a bag filter or ESP, although a bag filter is likely
to give lower emissions (1 – 5 mg/Nm3)• the filtration system can be combined with dry scrubbing • wet chemical scrubbing • high temperature oxidation, e.g. thermal incineration. Costs are site-specific but are not generally considered to be disproportionate to the results obtained.

Chapter 4
282 Manufacture of Glass
4.5.3 Continuous filament glass fibre Emissions to air from non-melting activities in this sector arise from four main sources: • application of the coating to the fibres • cake drying • cutting and milling • secondary processing. Emissions to air from the coating application are usually quite low due to the low volatility of the coating materials and the low glass temperatures at the point of application. An important aspect of this is the selection of coating materials with low levels of organic solvents. However, some volatile species will be present either as solvents or as by-products of the reactions. The coating materials used vary widely between products and installations, but material selection is the most effective method of reducing emissions. The high volumes of air necessary to cool the glass make it very difficult and expensive to control VOC emissions by secondary measures. The high airflows result in some carryover of droplets and encourage volatilisation of any VOCs present. Wet scrubbing systems are often used to control the waste gas but the effect on volatile substances will be limited to condensation. Wet electrostatic precipitators could also be used in this application but no examples of this are known. Costs of wet scrubbing and wet electrostatic precipitators will be similar to those quoted for the mineral wool sector. The emission levels achieved will depend entirely on the case-specific starting levels; some typical figures are given in Section 3.5.2.3. The wet cakes are usually dried in ovens and any species volatile at these temperatures will be emitted with the water vapour. In general, the molecular weights of the materials are quite high and a significant proportion of any volatile substances will have been emitted during the coating application. Little information is available on emission levels and currently the only technique used to minimise emissions is material selection. The waste gas volumes are quite small and standard control techniques could be used if significant releases were identified, for example, incineration, adsorption, and scrubbing. No cost information is available for these techniques in this application, but such techniques are readily available for low gas volumes. However, it will always be preferable to control such emissions by optimisation of the coating formulation before any abatement techniques are installed. Dust emissions arising from cutting and milling can be readily treated by extraction to a filter system. This is the standard technique used throughout the sector and emissions in the range of 1 – 5 mg/Nm3 can be achieved. Secondary processing can involve the use of further coating or binder materials. The emissions are very case specific and standard abatement techniques for VOCs and trace gases can be used if primary measures do not achieve the required performance level.
4.5.4 Domestic glass In the majority of domestic glass processes, there are no significant emissions to air from the activities downstream of the furnace. A number of burner systems are used to maintain the correct glass temperature for fire polishing and in the annealing lehr, but there are no significant emissions requiring specific controls. The exception to this is the production of articles that require cutting and polishing, particularly full lead crystal, lead crystal and crystal glass. The presence of lead in the dust generated during downstream activities requires a careful control of potential fugitive emissions in order to prevent health and safety issues for the workers.

Chapter 4
Manufacture of Glass 283
Cutting involves carving precise patterns on the blank glass articles using diamond impregnated wheels, either by hand or automatically. Other cutting and grinding activities such as edge grinding can also be carried out. Water is usually used as a coolant for cutting and to prevent dust emissions. Extraction may also be provided to remove any mist from the coolant. Where these activities are carried out under a liquid coolant, there are no appreciable emissions to air although a mist eliminator may be necessary on the extraction system. If dry cutting or grinding operations are carried out, the dust can be extracted and passed through an efficient bag filter system to give dust emissions in the range of 1 – 5 mg/Nm3. In the case of cutting and grinding operations carried out on lead crystal glass, emissions of Pb, after treatment (e.g. bag filter), are expected to be below 1 – 1.5 mg/Nm3.
Glass cutting produces a grey, unfinished surface on the glass. The glass surface is restored to its original appearance by immersion in a polishing bath of hydrofluoric and sulphuric acids, typically a solution with 30 % H2SO4 and 2 – 3 % HF at a temperature of <50 °C is applied. Fumes of HF and SiF4 are released from the surface of the polishing bath. The most effective way of treating these emissions is usually wet scrubbing either with water or a chemical solution. During this operation, hexafluorosilicic acid (H2SiF6) is formed (up to 35 %), and the acidic scrubber liquor requires neutralisation. As an alternative, H2SiF6 can be recovered and, where feasible, used as a feedstock in the chemical industry. The main concern about atmospheric emissions from acid scrubbing systems is hydrofluoric acid; values of <5 mg/Nm3 HF are normally achieved. Water resulting from the polishing operations is normally treated with hydrated lime to remove fluorides and sulphates. The sludge generated from water treatment consists of CaSO4 and low amounts of CaF2 and is treated externally for possible reuse (e.g. cement industry). Very low emission levels can be achieved with wet scrubbers in these applications (<5 mg/Nm3 of HF). Due to the very acidic nature of the emissions, there is a high solubility in water and chemical scrubbing is unlikely to be necessary. Chemical scrubbing results in lower water usage but prevents the recovery of H2SiF6 from the effluent. Alternative techniques to acid polishing have been recently developed, e.g. mechanical polishing, and high-temperature polishing either with flames or lasers, but at the time of writing (2010) information concerning the application of these techniques is not available.
4.5.5 Special glass In general, there are no significant emissions to air from standard downstream activities in this sector. TV glass production involves grinding and polishing activities but these are carried out under a liquid medium and should not give rise to any emissions to air. If TV glass or any other products undergo any dry cutting, grinding or polishing, the emissions can be controlled by extraction to a bag filter system to give dust emissions in the range of 1 – 5 mg/Nm3. This is a very diverse sector and there may be activities at some installations, which require site-specific consideration.
4.5.6 Mineral wool Emissions from non-melting activities in the mineral wool sector arise from four main activities: forming, curing, product cooling, and product machining and packaging. Data presented in Section 0 show that the emissions from forming and curing are the most significant. These emissions are largely related to the use of the phenolic resin-based binder system. The techniques in this section have been described separately for the forming area and the curing area. This is for convenience and because the nature of the waste gases differ. However, several of the techniques are applicable in both areas and, particularly in glass wool production, it can be advantageous to combine emissions for abatement. Where this is the case, the

Chapter 4
284 Manufacture of Glass
techniques are described most thoroughly for the forming area section and cross-references are made for curing. There are several important differences between line emissions from glass wool and stone wool processes and these are discussed in the sections relating to the techniques to which they are most relevant.
4.5.6.1 Forming area In the forming area, the glass or stone melt is fiberised and the binder is applied. The resin-coated fibre is directed onto a collection belt that is under suction. In glass wool processes, water is sprayed into the extraction ducting and into the fan. This performs two functions, the prevention of material build-up in the ducting and the removal of some particulate and gaseous components from the gas stream. Stone wool processes vary in their use of in-duct water sprays; some are comparable glass wool plants, but many use no water sprays at all. Stone wool cupola campaigns last only a few weeks and so there is an opportunity to clean out the ducting, and water sprays are not always deemed necessary. The forming area waste gas is likely to contain significant levels of particulate matter, phenol, formaldehyde and ammonia. The particulate matter consists of both inorganic and organic material, often sticky and with a very small particle size. Lower levels of VOCs and amines may also be detected if they are included in the binder system. Due to the nature of the process, the gas stream is slightly above ambient temperature, has a high volume and (if in-duct water sprays are used) is saturated with water. These properties, combined with the nature of the pollutants, limit the number of abatement techniques that may be applied. The releases can be affected significantly by a number of factors but particularly: • binder system chemistry • fiberising technique • operating conditions (temperature, airflow and moisture) • level of binder applied • the method of binder application. The optimisation of these parameters, in conjunction with in-duct water sprays can significantly reduce process emissions. The chemistry of the binder system is one of the most important factors and has major implications for the process water system and for forming, curing and cooling emissions (see Section 2.9.1 for additional information). The binder systems vary between operators and are not generally well understood outside of the sector. These systems can be very site-specific and may need to be considered on an individual basis. The section below summarises some of the main issues. Resin and binder chemistry considerations Optimisation of the chemistry of the binder system and the efficiency of the method of application can have a substantial effect on the releases to the environment. The binder also represents a high proportion of the cost of the final product. Therefore, the process operators consider developments in binder chemistry and application techniques to be highly confidential. The binder is made up of water, phenolic resin, urea, ammonium sulphate, ammonia, silane, mineral oil, silicone oil and possibly other ingredients particular to the individual process. The resin is essentially a phenolic resole consisting of a mixture of trimethylol phenol, dimethylol phenol, formaldehyde, minor reaction products of phenol and formaldehyde, and traces of phenol. The resin is water-based and is typically 50 % solids. An excess of formaldehyde is used in the reaction to achieve a low free-phenol level.

Chapter 4
Manufacture of Glass 285
Some resins are amine catalysed and can give rise to significant levels of gaseous amine in the waste gas. These emissions can be virtually eliminated by using other species as catalysts in resin production. A number of substances can be used but the precise details of optimised systems are generally considered as proprietary knowledge. By using non-amine catalysed resin systems, emission levels of amines of <5 mg/Nm3 can be achieved. If a company does not have sufficient in-house expertise to develop a non-amine catalysed resin, then such systems are readily available from specialist resin suppliers. Urea is reacted with the resin to extend the resin and to reduce free formaldehyde levels and it also has the effect of improving the fire resistance of the final product. The urea reacts with the free formaldehyde in the resin to form methylol ureas, which in turn will react with the active sites on the phenolic resin and take part in the cross-linking mechanism during curing. The urea is acting as a substitute for phenol and results in a cheaper binder. Therefore, there is an incentive for the operator to maximise the amount of urea in the resin, up to the point where product quality or processing parameters are adversely affected. Urea has two main drawbacks: it reduces the solubility of the resin, and it can break down in both the forming area and in the curing oven to form ammonia. Environmentally, the maximisation of urea usage is beneficial because it reduces formaldehyde releases, it replaces phenol, and the urea breakdown products are preferential to the phenolic derivatives and partial combustion products that would otherwise be emitted. Ammonia plays several important roles in the binder system and allows a degree of flexibility, which is important in optimising the process as a whole. Ammonia improves the solubility of the binder, enabling more urea to be added and allowing the binder to be stored for longer. It also helps to maintain the pH of the system in the correct range and reacts with any free formaldehyde. The nature of the process is such that higher than normal releases of ammonia may occur for short periods. The effects of reducing the ammonia levels in the process can be disproportionate to the effects on the rest of the process, and higher ammonia release levels may result in lower overall emissions. Ammonium sulphate is added to control the curing of the resin. Silane provides a vital interface between the inorganic glass and the organic binder. Silane hydroxyl groups interact with the glass oxides, and the organic functional group reacts with the resin to form a strong bond. Mineral and silicone oils are added to improve the product handling characteristics, to suppress dust formation, and to provide a degree of water repellence. When the binder is applied to the hot glass in the forming area, the volatile components (e.g. ammonia, formaldehyde, and phenol) will be vaporised and extracted to the release point. The level of volatile releases will be a function of the amount of unreacted volatile material in the binder, the dilution of the binder, the temperature in the forming hood and the temperature of the glass. The binder is applied as a fine spray and any droplets that are not retained on the mat will be released in the extracted air. The extent of binder retention on the product will depend on droplet size distribution, the mat thickness and the level of suction applied. Several alternatives to phenolic resin-based binders have been evaluated, but none have been found to give acceptable product quality.
4.5.6.1.1 Impact jets and cyclones Description An important factor in considering appropriate abatement systems for the forming area is the water content of the gas stream. The continuous nature of glass wool production requires the use of a cleaning mechanism to prevent the build-up of sticky organic material and fibre in the extraction ducting and in the fan. The normal technique applied is in-duct water spraying, which can take various forms. The discontinuous nature of stone wool cupola production (campaigns of one to three weeks) provides the opportunity to clean the ducting if required. Also stone wool

Chapter 4
286 Manufacture of Glass
production involves relatively less binder usage per unit volume of product and so the build-up is slower. Some stone wool processes utilise water sprays in the forming area, but this is largely due to operator preference or to site-specific operating requirements. Where water sprays are used to clean ducting, it is logical to optimise their use to also clean the waste gas. In this situation, the two objectives are entirely complementary; the more material removed from the waste gas, the more effective the cleaning function. The systems have generally been adapted beyond the minimum necessary to prevent unacceptable build-up in the ducting. Within the sector, the term ‘impact jets’ is used to describe this optimised technique. In order to optimise the efficiency of gas cleaning, the systems can apply the water in high volume and at a high pressure, but this does not produce a significant pressure drop. The design of the impact jets will differ between processes but is intended to optimise the efficiency of the technique, for both duct cleaning and waste gas scrubbing. To remove the entrained water from the waste gas, impact jets are always combined with cyclones (or other devices), which also have an effect on particulate levels depending on the design as described in Section 4.4.1.4. Particulate and droplet removal will occur by impaction/impingement and to a lesser extent by diffusion. Some systems may involve a narrowing of the duct to improve the removal efficiency, but the particulate removal efficiency is predominantly dependent on pressure drop, which is low for all these systems. In general, due to the low pressure drop in the system, the removal efficiency for fine particulate matter and droplets is quite low, while large particles and fibres are well removed. Gaseous substances will be partially absorbed by contact with the water. The efficiency of gas absorption depends on the difference between the partial pressure of the gas in the waste gas stream and the vapour pressure of the gas in the liquid, the solubility of the gas in the liquid,the surface area for contact, and to a lesser extent the contact time. There will also be a condensation effect, which can be important if the waste gas is warm. Process water is usually used for impact jets and already contains most of the substances present in the gas stream in varying quantities. This will particularly affect the efficiency of gaseous substance removal. The recycling process water is filtered before it is reapplied but will contain significant levels of soluble materials. The system is in dynamic equilibrium, and the process water system is described later in this document. Achieved environmental benefits The use of impact jets and cyclones allows for an easy removal of the solid material which is present in significant amounts in the flue-gases of the forming area in quite large and fibrous form. However, due to a low efficiency for the removal of fine particles, cyclones and impact jets are mainly used as a pretreatment technique. The final emissions are very dependent on the binder and process water chemistry and on the amount of binder applied. Cross-media effects Unless another technique such as packed bed scrubbing is used, cyclones (or sometimes an alternative device) are incorporated with impact jets to remove entrained water. This is necessary to reduce water consumption and to achieve acceptable levels of plume visibility and dispersion. Where other wet techniques are used (e.g. wet ESPs or packed bed scrubbing), impact jets are generally used upstream. Operational data The results that are achieved using this technique are given in Table 4.40.
Chapter 4
Manufacture of Glass 287
Applicability In principle, this technique is applicable to all glass wool and stone wool processes. It is not used in many stone wool plants because it is not deemed necessary for process cleaning, and could adversely affect other abatement techniques being used. For forming area emissions, impact jets and cyclones are used in approximately 90 % of glass wool plants and 10 % of stone wool plants. Economics Costs for this technique are given in Table 4.41 and depend largely on the airflow and plant size. The costs of the technique as an abatement measure are difficult to assess, because where impact jets are used, some form of cleaning mechanism is an inherent requirement of the process. The costs given in the table represent the total cost for the system. There are no examples of systems being implemented just to clean ducting; they are always installed for the dual purpose. It is estimated that the gas cleaning element represents 60 % of the total cost. However, this analysis is somewhat theoretical, because in most Member States, completely unabated emissions would not be permitted and other abatement costs would be incurred. Driving force for implementation In the forming area, a significant amount of the solid material is quite large and fibrous, and this can easily be removed by the impact jets and cyclones, especially for glass wool production. Example plants This technique is so widely applied that it is not useful to specify example plants. References to literature [89, EURIMA Suggestions 2007]
4.5.6.1.2 Wet scrubbers Description Wet scrubbing systems can be used to control both gaseous and particulate emissions. Whilst the basic technology for both of these is similar, the design criteria for particulate or gas removal are very different. However, to keep down capital costs, wet scrubbing systems are often used to control mixed emissions of particulates and gases. The design is inevitably a compromise, but may represent BAT where separate control systems are prohibitively expensive. Wet scrubbing is a well-documented technique and only the main principles and the issues specific to this sector are discussed here. Particle collection by liquid scrubbing occurs by three main mechanisms: inertial impaction, interception and diffusion. Trace gas removal by wet scrubbing occurs by absorption and, to a lesser extent, condensation. Absorption involves mass transfer between a soluble gas and a solvent in a gas-liquid contacting device. The particle collection efficiency of wet scrubbers is strongly dependent on the total energy usage, particularly on the pressure drop across the collection zone. If the liquid is evenly dispersed within the scrubber, similar pressure drops will often give similar efficiencies on the same dust for quite different scrubber designs. Thus, it is not possible to design a wet scrubber which has high efficiencies on particles of 1 µm and below, and which does not have a high pressure drop. High energy scrubbers can give good collection efficiencies for particles of <0.5 µm, but the high running costs mean that alternative techniques may be more economical. The efficiency of gas absorption depends on the difference between the partial pressure of the soluble gas in the waste gas stream and the vapour pressure of the gas in the liquid, the solubility of the gas in the liquid, the surface area for contact, and, to a lesser extent, the contact time. There will also be a condensation effect, which can be important if the waste gas is warm. Solubility obviously depends on the gas and the liquid. Water is suitable for absorbing soluble acidic gases such as hydrogen chloride, hydrogen fluoride, silicon hexafluoride, and for

Chapter 4
288 Manufacture of Glass
ammonia. Alkaline or acid solutions are suitable for absorbing less soluble gases, and in some applications, oxidising solutions can control organic odours. The surface area is determined by the packing material or droplet size. Packed bed scrubbers consist of an outer shell which contains a bed of packing material on support grids, liquid distributors, gas and liquid inlets and outlets, and a mist eliminator. Liquid is distributed continuously over the packing material forming a film, which provides a large surface area for gas/liquid contact. The dirty gas stream flows through the packed bed and the liquid and gas flow may be countercurrent, concurrent or cross-current. There are various types of packing material, which can be packed in random or regular arrangements. The liquid film over the packing material provides a large surface area for mass transfer. Countercurrent packed bed absorbers maximise the driving force for absorption because gas leaving the packed bed encounters fresh absorbing liquid. Packed beds can become blocked by insoluble particulate matter, scale and biological growth. In some applications, venturi scrubbers may be considered. The characteristic feature of a venturi scrubber is the constriction to the duct (venturi throat) causing an increase in gas velocity. Liquid is introduced to the scrubber and forms a film on the walls, which is atomised by the gas stream in the venturi throat. The efficiency of the venturi scrubber depends on the pressure drop, and consequently, they have high power consumption and operating costs. Venturi scrubbers are generally the most efficient wet scrubbing devices for particle collection, because they are suitable for submicron particles. They can also be used for trace gas removal, but efficiency is limited by low contact time. The most commonly used wet scrubbers within the sector are packed bed scrubbers, usually with impact jets upstream. The impact jets remove the larger particulate matter and so help to prevent blocking of the packing. Some operators have installed ionising wet scrubbers (IWS), which are intended to combine the advantages of the low capital cost of wet scrubbers, with the low operating costs of electrostatic precipitators. The IWS is basically a packed bed scrubber maintained in a neutral charge condition and preceded by an ionising section to charge the particles. The bed is normally composed of plastic packing. Gas velocities through the bed are low so as to ensure that the particles spend as much time as possible close to the packing elements. When the waste gas from the forming area comes into contact with water in an efficient scrubbing system, the following events will occur: • a proportion of the entrained particulate matter, predominantly the larger particles and
droplets will be held in suspension; • a proportion of any soluble resinous material will be absorbed by the water; • the volatile substances will form an equilibrium between the gaseous and aqueous phases. Process water is the most commonly used scrubber liquor within the sector. This presents the potential problem of maintaining sufficiently low concentrations of volatile materials in the scrubbing medium to facilitate efficient absorption, and to prevent release back to the gas phase. The mineral wool manufacturing process is a net consumer of water, and the performance of the scrubber can be improved by introducing the clean water top up into the system in the scrubber. This benefit can be optimised by using a combined multistage scrubbing process with the water flowing from stage to stage countercurrent to the gas stream. In this way, the dirtiest water is used to scrub the incoming (dirtiest) gas stream and clean water is used in the final scrubbing stage. A description of a typical water circuit for the production of glass wool is presented in Figure 2.11, Section 2.9.1. A possible solution to the problem would be to separate the scrubbing medium from the process water system and either use clean water with a sufficiently high purge to maintain efficient absorption or to chemically dose the scrubber liquor with substances that would react with the volatile species. However, there are important limitations to both of these approaches. The use of a clean water system for achieving a substantially better performance would cause the

Chapter 4
Manufacture of Glass 289
volume of the purge would be too great to recycle to the process water system, and would give rise to a new waste stream requiring separate treatment. The volume of water coming from the impact jets would exacerbate this problem. The water content and resinous nature of the substances contained in waste gas would cause blocking and scrubber liquor volume problems in a chemical scrubber unless a high volume purge is used. Due to the chemical content, none of this could be recycled to the process water system, again giving rise to a new waste stream requiring separate treatment. A further complication is that the chemical reagents necessary to remove phenol/formaldehyde and ammonia are incompatible and would require separate stages. Chemical scrubbing stages could be positioned in series with a process water scrubber, but this would greatly increase costs and unless it is extremely efficient, would not overcome the problems discussed. Also, when the aqueous waste stream is considered, the difference in overall emissions between such a technique and a process water scrubber with good process control is likely to be limited. Multistage scrubbing either in a combined unit or in separate units is, in theory, a potential option for the forming area and for combined forming and curing oven emissions. However, no mineral wool processes operate multistage scrubbers and so no information is available on their environmental performance, costs or potential operating problems. Therefore, the technique cannot currently be considered fully available. It could, however, be considered an option if line emissions are very high at a particular installation. Achieved environmental benefits The emission levels achievable with packed bed scrubbers (with process water as the scrubber liquor) in the mineral wool industry are given in Table 4.40. Cross-media effects An important consideration for wet scrubbers is the potential cross-media effect of creating an aqueous waste stream that requires treatment. In the mineral wool sector, this problem has been avoided by using process water as the scrubbing medium with 100 % recycling to the process water system. The use of clean water or chemical scrubbers would result in an aqueous waste stream (see Section 2.9.1, Figure 2.11). Operational data The removal efficiency is limited for particulate matter by the low pressure drop, and for gaseous substances by the use of process water as the scrubbing medium. Significantly lower emission levels for phenol, formaldehyde and ammonia would be expected with clean water scrubbing. The process water equilibrium is a critical factor and it is possible in some rare instances (e.g. a low binder product following a sustained period on a high binder product) that the efficiency of the scrubber could be negative for gaseous components. Several operators have used ionising wet scrubbers in recent years, but overall results have been disappointing. Improvements in efficiency over packed bed scrubbers have generally been less than 10 %. There is no experience of chemical or multistage scrubbing in this sector but experience in the chemical industry suggests that emissions of below 10 mg/Nm3 could be readily achieved for phenol, formaldehyde and ammonia, if the associated problems could be overcome. Compared with the data shown in Table 4.40, this only represents a significant improvement for ammonia. Applicability In principle, packed bed scrubbers circulating process water are applicable to all processes within the sector. The technique is not limited to new plants or substantial modifications, but costs are likely to be higher for existing installations. In some applications, particularly stone wool, other techniques can be used to achieve similar or lower emission levels.

Chapter 4
290 Manufacture of Glass
In glass wool production, slightly less than 20 % of installations use packed bed scrubbers, either for combined forming area and curing oven emissions or just for the forming area. In stone wool production, packed bed scrubbers are used for approximately 10 % of installations for forming area emissions and the same for the curing area. Emissions from the two areas are not generally combined in stone wool installations. Economics Costs for this technique are given in Table 4.41 and depend largely on airflow and plant size. Incorporation of an ionising stage as in the ionising wet scrubber (IWS) involves an increase in capital costs of approximately 75 %, and an approximate 10 % increase in operating costs. Multistage chemical scrubbing could be expected to cost up to twice the totals given in the table. The cost of a combined multistage scrubber would probably be more comparable to the IWS system. However, it would be necessary to completely separate the stages, which would add to the cost, and more expensive corrosion-resistant materials may be necessary.
Driving force for implementation A benefit of this technique is the opportunity to combine the forming area and curing oven emissions in a single treatment stage. The volume of the forming area waste gas is generally ten times greater than that of the curing oven. If implemented at the design stage, the combination of the waste gases does not add substantially to the overall cost of the technique. Example plants Knauf Insulation, St. Helens, UK URSA, Spain Isover Orange, France Reference literature [89, EURIMA Suggestions 2007]
4.5.6.1.3 Wet electrostatic precipitators Description The basic principles and operation of ESPs are described in Section 4.4.1.2. In wet precipitators, the collected material is removed from the plates of the collectors by flushing with a suitable liquid, usually water, either intermittently or by continuous spray irrigation. The three main types of ESPs are plate and wire, plate and plate, and tube and wire, and can all be operated wet. In plate types, the gas flow is horizontal; in tubular designs the gas flow is vertical with the liquid flow countercurrent to the gas. In some more robust designs, rods replace the wires. Some mechanism is usually installed to remove water droplets before discharge and either a demister, or sometimes the last field can be operated dry. Whilst in general dry precipitation is preferable, wet precipitators are useful for removing dust from wet gases with temperatures close to the dewpoint and for collecting liquid aerosols and sticky materials such as resinous particles and tars. The performance of wet precipitators is less dependent on particle properties as the moisture present in the gas precipitates readily and will assist the precipitation of a difficult dust. Tubular units are most commonly used in wet applications and it is easier to make them explosion-resistant if tars are present. However, tubular units generally have only a single electrical field and are less suitable for achieving very high efficiencies. All three types have been used in mineral wool manufacturing but the plate and wire, and tube and wire types are now preferred. Usually a deluge system is installed to extinguish fires. At the entrance of the wet electrostatic precipitator (WESP), the exhaust gases must be well distributed to produce a uniform and low gas velocity between all elements. The waste gas is conditioned by the impact jets upstream of the ESP; large fibrous material is removed and the

Chapter 4
Manufacture of Glass 291
gas is saturated and cooled. To ensure operation within the design parameters, clean water is also used; it is sprayed at the entrance to the ESP to ensure saturation and it is used to clean the electrodes. In glass wool processes, the volume of this water is generally low enough to be discharged to the process water circuit, and may represent the main top up in the circuit. In most stone wool processes, the evaporation potential from the forming process is much less and it is not possible to use such a volume of clean water. Achieved environmental benefits Wet ESPs are efficient in removing particulate matter, aerosols and droplets in the size range of 0.01 to 10 µm. Performance will depend on a number of factors, particularly the gas velocity. A new purpose-designed wet ESP would achieve a removal efficiency of >98 % for total particulate matter >1µm in diameter, although removal efficiency falls off rapidly for particles <1 µm. Performance may decline over the lifetime of the equipment and maintenance is very important. In general, WESPs show limited efficiency at removing gaseous substances. This depends very much on the product range, and the binder and process water chemistry. However, due to the high degree of saturation and the use of a substantial amount of clean water, some absorption of gaseous substances does occur. Data concerning an example installation producing glass wool are shown in Table 4.36. The plant is equipped with an advanced air pollution control system consisting of a WESP used in combination with a wet scrubber, a cyclone separator and biological treatment for the removal of organic pollutants.
Table 4.36: Solid and gaseous emissions from the forming area of a glass wool installation where a WESP is used
Glass wool production - Forming area Production capacity: 36 000 – 38 000 tonnes/year Flue-gas volume: 191707 Nm3/h Depollution system: wet scrubber, cyclone separator, suction ventilation, biological treatment with six vertical washing towers, three fields WESP
Emission levels (1) Mass flow (mg/Nm3) (kg/h)
Formaldehyde + phenol 4.3 0.82 Total organic compounds (TOC), as C 4.4 0.84 Particulate matter 21 4.03 Ammonia (NH3) 18 3.45 HF <0.02 <0.004 HCl 7 1.3 SO2 ∼ 3 ∼ 0.6 NOX (as NO2) 9.9 1.9 Copper (Cu) 0.0217 0.004 Manganese (Mn) 0.0381 0.007 Odourimetry 64 ouE/m3
(1) Emission values from discontinuous measurements (average value of 4 – 6 half-hour measurements, expressed at measured 20.5 % O2)Source: [112, Austrian glass wool plant 2006]
Cross-media effects A summary of the main advantages and disadvantages associated with the use of WESPs is presented in Table 4.37.
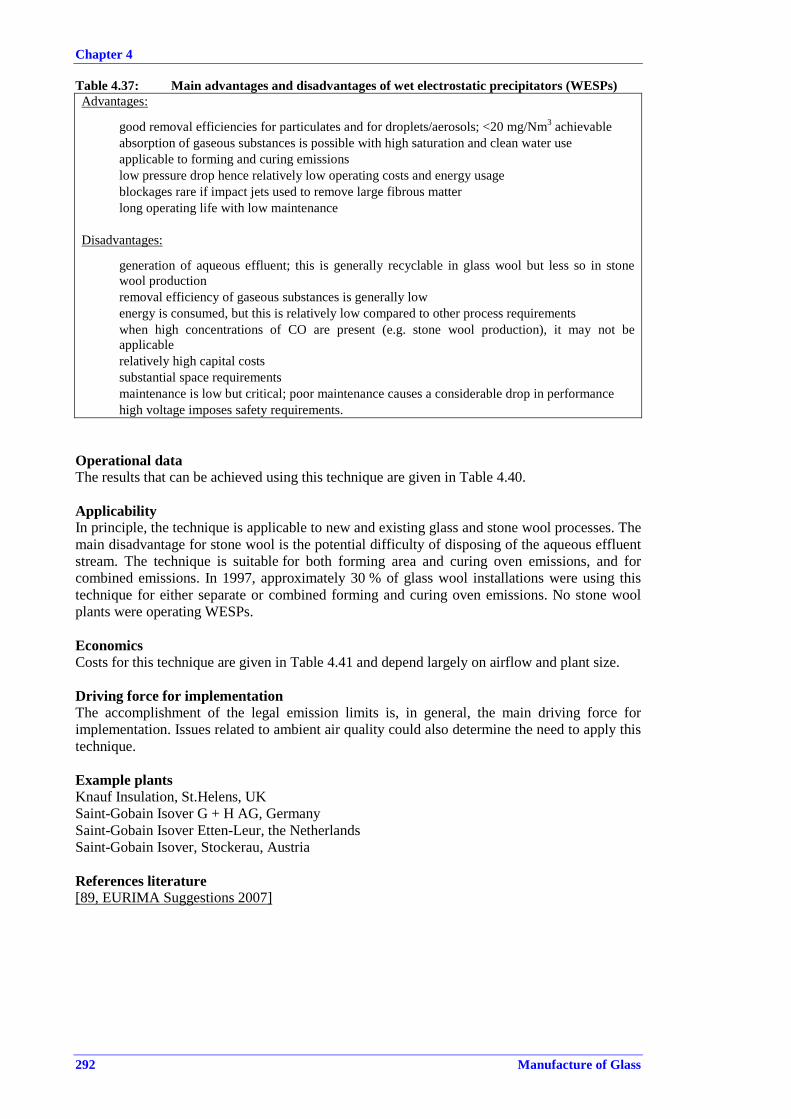
Chapter 4
292 Manufacture of Glass
Table 4.37: Main advantages and disadvantages of wet electrostatic precipitators (WESPs) Advantages:
• good removal efficiencies for particulates and for droplets/aerosols; <20 mg/Nm3 achievable • absorption of gaseous substances is possible with high saturation and clean water use • applicable to forming and curing emissions • low pressure drop hence relatively low operating costs and energy usage • blockages rare if impact jets used to remove large fibrous matter • long operating life with low maintenance Disadvantages:
• generation of aqueous effluent; this is generally recyclable in glass wool but less so in stone wool production
• removal efficiency of gaseous substances is generally low • energy is consumed, but this is relatively low compared to other process requirements • when high concentrations of CO are present (e.g. stone wool production), it may not be
applicable • relatively high capital costs • substantial space requirements • maintenance is low but critical; poor maintenance causes a considerable drop in performance • high voltage imposes safety requirements.
Operational data The results that can be achieved using this technique are given in Table 4.40. Applicability In principle, the technique is applicable to new and existing glass and stone wool processes. The main disadvantage for stone wool is the potential difficulty of disposing of the aqueous effluent stream. The technique is suitable for both forming area and curing oven emissions, and for combined emissions. In 1997, approximately 30 % of glass wool installations were using this technique for either separate or combined forming and curing oven emissions. No stone wool plants were operating WESPs. Economics Costs for this technique are given in Table 4.41 and depend largely on airflow and plant size.
Driving force for implementation The accomplishment of the legal emission limits is, in general, the main driving force for implementation. Issues related to ambient air quality could also determine the need to apply this technique. Example plants Knauf Insulation, St.Helens, UK Saint-Gobain Isover G + H AG, Germany Saint-Gobain Isover Etten-Leur, the Netherlands Saint-Gobain Isover, Stockerau, Austria References literature [89, EURIMA Suggestions 2007]

Chapter 4
Manufacture of Glass 293
4.5.6.1.4 Stone wool filters Description Conventional passive filtration processes (e.g. bag filters) are unsuitable for treating the waste gases from the forming area and curing oven operations. The adhesive and sometimes moist nature of the waste gas would lead to rapid blinding, even with intensive cleaning and maintenance. In stone wool activities where forming processes are often dry, stone wool slab filters can be employed. These consist of a steel or concrete housing in which stone wool slabs mounted on cassettes act as a filtration medium. This type of filter has good removal efficiency for particulate matter and binder droplets, but has a low efficiency for the removal of gaseous components. The filtering medium needs to be cleaned or exchanged periodically in order to maintain particulate removal efficiency and to prevent increased resistance to the airflow. The used filter slabs can usually be recycled to the furnace if a briquetting process exists on site. Operation can be on a semi-dry basis, but overall efficiency is greatly improved if the operation is dry. Neither system generates an aqueous waste stream and the moist filter slabs can also be readily recycled through a briquetting process. An earlier version of this design was based on a tower filter with stone wool rolls as the filter medium. This technique is less efficient and has been largely superseded by the slabs mounted on cassettes design. The tower filter design was more suitable for waste gases with more moist, higher binder content but could not handle waste gases treated with impact jets. Achieved environmental benefits Stone wool filters are very efficient in removing particulate matter and droplets/aerosols. The emission figures that can be achieved using this technique are given in Table 4.40. The technique does not have a significant effect on gaseous substances, but in combination with primary controls (e.g. dry operation) and low aerosol emissions, the levels shown in the table are achieved. This also leads to very low plume visibility from this type of filter (see also Section 4.5.6.2.5). Cross-media effects A summary of the main advantages and disadvantages associated with the application of stone wool filters is presented in Table 4.38.
Table 4.38: Main advantages and disadvantages of stone wool filters Advantages:
• good removal efficiencies for particulates; <20 mg/Nm3 is achievable • used filter slabs can be recycled to the process if facilities are available • no aqueous waste is generated • low capital costs • low pressure drop hence relatively low operating costs and energy usage Disadvantages:
• energy is consumed, but this is relatively low compared to other secondary techniques • limited removal efficiency for gaseous substances • not considered applicable for glass wool processes
Operational data No information submitted.

Chapter 4
294 Manufacture of Glass
Applicability This technique was mainly limited to stone wool process forming areas, although it is applied more and more in stone wool curing ovens (see Section 4.5.6.2.5). The technique is applicable to both new and existing stone wool processes. More than 90 % of stone wool processes use this technique for treating forming area waste gases, about 30 % use it for curing oven emissions, and nearly 40 % use it for the treatment of cooling gases. The limited use in the past for stone wool curing ovens was partly due to the high temperature of the gas, and partly due to the widespread use of incineration. However, currently, the use of a passive stone wool filter may be considered a preferable technique for curing ovens. There are no known applications of the technique in glass wool processes. The main reasons the technique is not used in glass wool processes are discussed below. The continuous nature of glass wool production requires the use of a continuous cleaning mechanism to prevent material build-up in the extraction ducting and in the fan. The normal technique applied is the use of impact jets. These are not generally used in stone wool production, because the discontinuous nature of the process provides the opportunity to clean the ducting. Also, stone wool production involves relatively less binder usage and so the build-up of material is slower. In the stone wool process, fibre is usually collected as a mat of constant thickness, which is then layered on a separate forming conveyor to give the desired product properties. The primary mat is thin, imposes only a small, constant pressure drop and enables a single and relatively low volume extraction system to be used. In glass wool manufacturing, a single conveyor forming system is used. The mat thickness increases along the forming conveyor and varies depending on the product. The change in differential pressure along the conveyor necessitates the use of several extraction systems of different capacities and the overall air extraction must have reasonably high pressure and be variable and controllable. The level and distribution of extraction is an important process control tool, which is frequently varied by process operators. The variable higher volume and higher pressure conditions of the glass wool waste gas are not ideal for filtration systems. The water saturated high binder content of glass wool forming area waste gas would cause the stone wool filter to block rapidly. This would necessitate frequent filter medium changes and would give rise to a high level of wet waste requiring recycling or disposal. A further complication with the use of mineral wool filters in glass wool processes is the greater difficulty in recycling the material to the furnace. Recycling fibrous wastes in mineral wool furnaces is discussed in Section 4.7. Economics Costs for this technique are given in Table 4.41 and depend largely on airflow and plant size. Capital costs are particularly low, and the low pressure drop leads to low operating costs compared with other conventional filter systems. Driving force for implementation Stone wool filters are very efficient in removing particulate matter and droplets/aerosols with relatively low investment and operating costs and low energy usage. Example plants Rockwool Lapinus, Roermond, Netherlands Partek Rockwool AB, Hällekis, Sweden Reference literature [89, EURIMA Suggestions 2007]

Chapter 4
Manufacture of Glass 295
4.5.6.2 Curing oven The wet product mat enters the oven which is at approximately 250 °C. The moisture is driven off along with any volatile material, and the binder begins to cure. The temperature and residence time in the oven is critical. The binder must be adequately cross-linked but not over cured or the product quality will suffer. The emissions from the oven will consist of volatile binder materials, binder breakdown products and combustion products from the oven burners. In general, glass wool products contain relatively higher binder levels than stone wool products, resulting in higher emissions. Oven emissions also tend to be odorous if not treated. The oven is usually gas-fired and under extraction. Oven emissions are sticky and represent a potential fire risk due to the deposition of combustible material in the extraction system, particularly in glass wool ovens. To prevent fires, the gas stream must either be water scrubbed or additional heat must be provided to destroy the sticky nature of the pollutants. In those processes without incineration, water is usually sprayed into the extraction ducting to prevent the build-up of resinous material, and to prevent fires. The water sprays will also remove some of the material entrained in the gas stream.
4.5.6.2.1 Impact jets and cyclones Description The technique is described in Section 4.5.6.1.1 above, but there are several other issues that should be considered. The waste gas from the oven has a much lower volume and a higher temperature than the forming area waste gas. Therefore, particularly in glass wool processes, the build-up of resinous material in the ducting represents a risk of fire and even explosion. The water sprayed into the gas has a substantial cooling effect and some substances are condensed from the waste gas. This does not necessarily mean the substances are removed and in the early parts of the system, material will be volatilised from the dirty process water. Achieved environmental benefits Due to the low pressure drop in the system, the removal efficiency for fine particulate matter is quite low; however, the use of impact jets and cyclones promotes condensation of some substances, preventing the build-up of residues in the ducting and the risk of fire, with consequent atmospheric emissions. As in the forming area, the system is a dynamic equilibrium and gaseous emissions are heavily dependent on the process water and binder chemistries. Cross-media effects Unless another technique is used to remove entrained water (e.g. packed bed, cyclone, demister), this technique can lead to high water consumption and emissions of mists. Operational data The emission levels that are achieved using this technique are given in Table 4.40. Applicability As for the forming area, in principle, this technique is applicable to all mineral wool processes. It is not used in many stone wool plants because it is not deemed necessary for process cleaning, and could adversely affect the performance of other techniques. Impact jets and cyclones are extensively applied for curing ovens in approximately 90 % of glass wool plants, often for combined forming and curing flue-gases. The technique is used as a pretreatment in conjunction with other techniques.

Chapter 4
296 Manufacture of Glass
Economics Costs for this technique are given in Table 4.41 and depend largely on airflow and plant size. The issues relating to how much of the cost can be considered as an abatement cost are the same as for the forming area.
Driving force for implementation Particularly in glass wool processes, the build-up of resinous material in the ducting represents a risk of fire and even explosion. The water sprayed into the gas has a substantial cooling effect and some substances are condensed from the waste gas. Example plants This technique is so widely applied that it is not useful to specify example plants. Reference literature [89, EURIMA Suggestions 2007]
4.5.6.2.2 Wet scrubbers The technique is described for the forming area in Section 4.5.6.1.2, and the discussion is equally applicable to oven emissions. The main considerations for curing oven emissions treated by wet scrubbers are that the volume is much smaller and pollutant concentrations differ; in general, particulate matter is lower, phenol is comparable but ammonia and formaldehyde are significantly higher. The emission levels achievable with packed bed scrubbers (with process water as the scrubber liquor) in the mineral wool industry are given in Table 4.40 (see Section 4.5.6.1.2 for discussion). Oven emissions are relatively higher in gaseous emissions compared to forming area emissions, so the overall efficiency may be higher. Again, this will depend on the amount of clean water used and the binder and process water chemistry. The costs for this technique are given in Table 4.41 and depend largely on airflow and plant size. The costs given are for combined forming and curing emissions. Most examples of curing oven emissions treated by wet scrubbers are for combined emissions, and due to the low volume, the extra cost is usually low. The variation in the cost given is largely related to airflow and a rough estimate for treating the curing oven emissions alone can be made by scaling down the cost, but the cost relationship is not linear.
In principle, the technique is applicable to all plants (see Section 4.5.6.1.2 for discussion).
4.5.6.2.3 Wet electrostatic precipitators The technique is described for the forming area in Section 4.5.6.1.3, and the discussion is equally applicable to oven emissions. The use of wet electrostatic precipitators (WESPs) to treat only oven emissions is not common and usually systems are for combined emissions. Due to the higher relative concentrations of gaseous and odorous substances in oven waste gas, a WESP would not be the first choice of abatement technique for oven emissions alone. However, when combined with forming area emissions and the inherent dilution this involves, a WESP can be a logical option. The emission levels achieved with this technique are given in Table 4.40 and the costs in Table 4.41. In principle the technique is applicable to both new and existing installations.

Chapter 4
Manufacture of Glass 297
4.5.6.2.4 Waste gas incineration Description Incineration is widely used for controlling organic emissions from industrial processes. It has the disadvantages of destroying the material (preventing recovery), often requiring energy addition and producing carbon dioxide and oxides of nitrogen. However, it can be designed to be energy efficient and may form an integrated part of the heat supply to drying or curing operations. Incinerators can be of two types: thermal incinerators (>750 °C), or catalytic incinerators (350 to 400 °C). Thermal incineration destroys organic compounds by thermal oxidation to carbon dioxide, water, oxides of sulphur and nitrogen, and other combustion products. The main requirements for effective combustion are given below. • Residence time in the combustion chamber must be sufficiently long to ensure complete
combustion. Destruction efficiency of 99 % will usually require a residence time of 1 to 4 seconds at the relevant temperature.
• The operating temperature should be 200 – 400 °C above the auto-ignition temperature of the most stable substance; typical operating temperatures are around 800 °C. Where the gas stream contains chlorinated and aromatic substances, temperatures must be increased to 1100 – 1200 °C, and rapid flue-gas cooling is required to prevent the formation of dioxins.
• Turbulence is necessary to provide efficient heat and mass transfer in the combustion zone, and to prevent ‘cool spots’. This is usually achieved by using burners that generate a swirling combustion flame and by incorporating baffles in the combustion chamber.
Catalytic incineration is unlikely to be a practicable option in this sector, because the high particulate loading and the presence of resinous materials would lead to catalyst poisoning. Achieved environmental benefits Incineration is an effective technique for removing organic substances from waste gas streams, but does not reduce inorganic particulate matter. Incineration uses energy and gives rise to emissions of CO2 and nitrogen oxides, which in the quantities emitted may be considered preferable to the substances destroyed and can increase the amount of energy to be recovered from the flue-gases. The waste gas from curing ovens also contains ammonia and other substances containing nitrogen, which are partially oxidised to produce nitrogen oxides. A well designed incinerator will reduce total organic compounds to below 10 mg/Nm3.Cross-media effects A summary of the main advantages and disadvantages associated with the application of waste gas incineration is presented in Table 4.39. The energy consumption associated with the use of waste gas incineration is equivalent to 200 m3 gas per kg phenol and formaldehyde removed, or 20 m3 per kg of ammonia removed. The consequent increase of CO2 emissions is estimated at about 400 kg per kg phenol/formaldehyde and 40 kg per kg ammonia.

Chapter 4
298 Manufacture of Glass
Table 4.39: Main advantages and disadvantages of waste gas incineration Advantages:
• High efficiency for the destruction of organic pollutants and odours • No aqueous or solid waste is generated
Disadvantages:
• Energy consumption is high. Methods for energy recovery from the flue-gases should be applied as far as technically possible
• Carbon dioxide and oxides of nitrogen are emitted. Part of the ammonia is converted into nitrogen oxides
• No removal efficiency for inorganic particulate matter • Significantly higher costs than combined treatment with forming emissions, where possible
Source: [89, EURIMA Suggestions 2007]
Operational data The emission figures that can be achieved using this technique are given in Table 4.40. Data concerning the energy consumption associated with the use of waste gas incineration are not available. Applicability At the time of writing (2010), the technique is only used to treat emissions from stone wool curing ovens, and 60 – 70 % of installations use this technique. Alternative options are described below. Due to the high volume, low concentration, low temperature, and sometimes high moisture content, the technique is considered to be prohibitively expensive for the forming area waste gas. In principle, the technique is equally applicable to new and existing processes. For both glass and stone wool, there is usually the option to combine curing oven emissions with forming area emissions for treatment by a single technique, which is often much more economical. In principle, there is no technical reason why glass wool curing oven emissions cannot be abated by incineration. However, it may not represent the most cost-effective solution. Economics Costs for waste gas incineration are given in Table 4.41 and depend largely on airflow and plant size. The economics of incineration depend greatly on the opportunities for heat recovery. The costs depend on a number of factors, but particularly: • volume of waste gas to be treated which determines the dimensions of the combustion
chamber; • temperature of the waste gas which affects the design of the combustion equipment and
auxiliary fuel requirements; • the calorific value of the gas which affects the auxiliary fuel requirements; • combustion temperature which determines the construction materials; • instrumentation; • heat recovery options; • the installation requirements; indoor, outdoor, ground level, rooftop, etc. Driving force for implementation The accomplishment of the legal emission limits for organic emissions and issues related to odour complaints from local residents may represent the driving force for implementation.

Chapter 4
Manufacture of Glass 299
Example plants Rockwool Lapinus, Roermond, Netherlands Partek Rockwool AB, Hällekis, Sweden Owens Corning, Queensferry, UK Reference literature [89, EURIMA Suggestions 2007]
4.5.6.2.5 Stone wool filters Description Stone wool filters can be used as a combined filtration system for the waste gases from forming and curing areas or as a separate filter from the curing area alone. A detailed description of the technique is given in Section 4.5.6.1.4. Achieved environmental benefits The filters will reduce organic and inorganic particulates effectively, but will not reduce gaseous emissions significantly. This will lead to increased emissions of organic components plus ammonia from the binder, but the energy consumption and the emissions of nitrogen oxides and CO2 will be reduced compared to an incinerator. The increased emissions of binder components are normally insignificant compared to the emissions from the forming area. Cross-media effects The stone wool filter will retain most of the particulates, organic and inorganic, but the gaseous components are only slightly reduced. Operational data The results concerning the use of stone wool filters are shown in Table 4.40, in comparison with other abatement techniques. Applicability Stone wool filters are used to treat emissions from stone wool curing ovens as an alternative to waste gas incinerators.The particulate concentration in the curing off-gas is normally very low, so several existing plants use only primary measures and a stack to treat the off-gas from curing ovens. The stack can either be a separate or a combined forming/curing stack. Economics Costs for this technique are given in Table 4.41 and depend largely on the waste gas volume and plant size. Driving force for implementation The removal of organic particulate matter and droplets/aerosols, in order to meet the legal emission limits for organic emissions may represent the driving force for implementation. Example plants No information submitted. Reference literature [89, EURIMA Suggestions 2007]

Chapter 4
300 Manufacture of Glass
4.5.6.3 Product cooling A large quantity of air (typically from 10000 to 40000 m3/h) must be passed through the product to cool it to an acceptable temperature after leaving the oven. This gas is likely to contain fibre, particles of cured binder, and low levels of organic fumes that may be odorous. This gas stream is not a major issue within the sector but it can cause local problems. There are three main methods for treating the gas, examples of all are found in the sector and all are accepted as available and affordable. All three can achieve relatively low emission levels and the preferred option will depend on local circumstances. In some cases, if emissions are very low, secondary abatement may not be necessary. The three techniques are: • use of a filter system to remove dust combined with a sufficient discharge velocity and
height to avoid ground level odours • use of a wet scrubbing system combined with adequate dispersion. A venturi type system
would give the lowest particulate and fume emissions • combining the cooling air with the forming area or the curing oven waste gas treatment
system. The combination option is probably the most environmentally and economically efficient method.
4.5.6.4 Product machining and packaging Mineral wool processes involve a number of product trimming, cutting and slitting operations, which generate dust emissions. The accepted way of treating these emissions is by efficient collection and extraction, and then the extracted air is passed through an efficient dust removal system, usually a bag filter (see also Section 3.8.2.4). Packaging operations are also potential sources of dust releases and should be treated in the same way. Gas volumes from these operations can vary widely (from 5000 to 70000 m3/h). In order to minimise capital and operating costs of abatement equipment, the extracted air volumes should be reduced to the minimum commensurate with good dust collection.
4.5.6.5 Odours arising from mineral wool production Technical odour assessment is difficult, expensive and potentially subjective, and there is little information available. However, mineral wool installations can be the source of odour complaints from local residents. This problem has declined in recent years due to improved operation and control but is still an issue for many installations. This section discusses odours from all parts of the process including melting. Conventional air-gas-fired, and oxy-gas-fired furnaces do not usually give rise to odour problems, even when recycled material is melted, due to the high temperatures. Cold-top electric melters rarely cause odour problems but can if mineral wool waste is being recycled. Binder materials can undergo partial thermal breakdown during the melting process, and some odorous substances may be emitted. This problem can be minimised by the addition of oxidising agents or pretreatment of the fibre. Cupola melting gives rise to significant emissions of odorous hydrogen sulphide. The accepted solution to this is combustion in an afterburner system, which also deals with any other odorous emissions from recycled material or raw materials.

Chapter 4
Manufacture of Glass 301
The main sources of odour are from the downstream operations, particularly forming and curing. Odours can also arise from product cooling, particularly from dense or high binder products or if a degree of over-curing has taken place. Odour from the individual chemicals used in the process is not considered to be very significant. Odour results predominantly from the chemical and thermal reactions of the organic binder used in the process. The characteristic smell is of ‘burned bakelite’. Complaints of formaldehyde or ammonia odours are very rare outside of the plant. Most odours are thought to arise from the curing oven, where the main chemical reactions and thermal processes take place. The drying process will also give rise to a certain amount of steam distillation of binder compounds and intermediates. The inside of most curing ovens shows a build-up of fibrous and resinous material which may also give rise to odorous compounds under the influence of the oven temperature. Small fires and localised instances of smouldering are also not uncommon in curing ovens and the smoke and fume emitted can be very odorous. Instances of odour can be greatly reduced by good oven maintenance and cleaning, wet scrubbing systems, adequate dispersion and provision for the rapid extinguishing of any fires. Incineration of curing oven waste gases is a very effective solution to the problem. The forming area activities can also result in the formation of odorous compounds particularly when the binder is sprayed onto the hot fibres. However, the atmosphere is cooler and therefore more moist than the curing oven, and the gas volumes are very much higher and concentrations of any odorous compounds are diluted. Although a significant mass of odorous compounds can be emitted from the forming area, an odour only ‘exists’ if the compound is in a concentration above the odour threshold, and so forming area emissions are generally less odorous than curing oven emissions. If forming area emissions do give rise to odours, they can be minimised by wet scrubbing and adequate dispersion. Problematic odours can be addressed by wet scrubbing using an oxidising agent, but this would have to be separate from the process water system. The issues of chemical wet scrubbing are discussed in Section 4.5.6.1.2. A summary of the general achievable values for emissions to air from the main non-melting activities in the mineral wool sector (fiberising, forming, curing and cooling) is presented in Table 4.40. Data shown in the table reflect actual measurements of working plants. Actual emissions depend not only on the abatement technique applied, but also on the binder content of the product being manufactured and the primary techniques applied. Consequently, data reported in the table show overlapping ranges of emissions for different abatement techniques. In Table 4.41, a summary of cost data is given for the application of abatement techniques to the main non-melting activities in the mineral wool sector. The abatement techniques are used according to the description given in the table. For instance, a WESP would always be combined with an impact scrubber and a cyclone placed before it to remove fibres and water; therefore, the costs indicated are as described.

Chapter 4
302 Manufacture of Glass
Table 4.40: General achievable values for emissions to air from non-melting activities in the mineral wool sector, applying different techniquesProcess/technique Emissions (1) in mg/Nm3 (kg/tonne product in brackets)
Particulate Phenol Formaldehyde Ammonia NOX CO2 VOCs (2) Amines (2)Combined fiberising, forming and curing
Cyclone 15 (0.6) 2 (0.08) 1 (0.04) 10 (0.4) 14 (0.56)
Impact scrubber + cyclone 9 – 64(0.6 – 3.2)
0.4 – 14(0.03 – 0.8)
0.7 – 6.4(0.06 – 0.25)
8 – 61(0.36 – 5.0)
3 – 28(0.13 – 1.7)
Impact scrubber + cyclone + WESP(3) 19 (1.21) 7.0 (0.46) 3.6(0.269) 56 (3.6) 20.3 (1.43)
Impact scrubber + cyclone + settlingchamber 18.1 (0.65) 1.31
(0.0465) 3 (0.1) 48.8 (1.81) 5236(194) 23.7 (0.89)
Stone wool filter (4) 18.3 (0.8) 18.8 (0.7) 6.5 (0.23) 39.3 (1.41) 48 (2)Combined fiberising and forming
Cyclone 14.5 (1.11) 1.88 (0.14) 1.65 (0.13) 19.5 (1.49) 9.3 (0.71)
Impact scrubber + cyclone + PBS (3) 11 (0.35) 0.75 (0.024) 1.4 (0.044) 30.9 (0.97) 2 (0.06) 20.7 (0.65)
Stone wool filter (4) 7 – 44(0.15 – 1.2)
0.5 – 14(0.01 – 0.25)
0.7 – 5.4(0.017 – 0.14)
6.7 – 64.2(0.18 – 1.4) 70.4 (2.75) 0.08 (0.0016)
Curing aloneCyclone 81 (0.33) 1.02 (0.0043) 1.4 (0.018) 125 (0.84) 14.4 (0.08)
Impact scrubber + cyclone + PBS(3) 1.9 (0.0048) 0.18 (0.0005) 0.03(0.00007) 44.3 (0.11) 42.7 (0.11)
Waste gas incineration (4) 3 – 29(0.01 – 0.16)
0.2 – 30(0.0004 – 0.1)
0.22 – 7.1(0.001 – 0.06)
6 – 90(0.05 – 0.24)
45 – 204(0.08 – 1.3)
16000 – 8000(35 – 81) 0.07 (0.0002)
Stone wool filter (4) 11 (0.25) 5.85 (0.019) 5.4 (0.022) 65 (0.28) 34 (0.12)
Incineration + stone wool filter (2) 13.5 (0.03) 1.2 (0.004) 5 (0.011) 83 (0.26) 225 (0.3) 0.3 (0.001)Cooling
Cyclone 12.5 (0.04)
Stone wool filter (4) 4 – 50(0.02 – 0.41) 5.5 (0.047) 3.89 (0.02) 18.3 (0.08) 43.3 (0.12)
(1) Emission data given as a range refer to a significant number of measurements (min. 9, max. 23). Single emission data refer to the average value of a limited number of measurements(min. 1, max. 4).
(2) Available data are limited.(3) WESP = wet electrostatic precipitator; PBS = packed bed scrubber.(4) These techniques apply only to stone wool production.Source: [93, EURIMA data tables 80% 2007]

Chapter 4
Manufacture of Glass 303
Table 4.41: Investment and operating costs of abatement techniques for non-melting activities in the mineral wool sect
Abatement technique
Installation capacity
(tonnes/day)
Investment cost (million EUR) (1)
Operating cost (million EUR per year)
(2)
Specific cost (EUR/tonne) (2)
Forming + curing Impact scrubber +
cyclone 50 1.1 0.15 16.5
Impact scrubber + cyclone + WESP 150 4.4 0.6 23.5
Impact scrubber + cyclone + wet
scrubbers 100 – 150 2.3
0.5 (100 t/d) 0.62 (150 t/d)
18.5 (150 t/d) 20.5 (100 t/d)
Stone wool filters 150 – 350 0.9 (200 t/d) 0.86 (200 t/d) 16 (200 t/d) Forming + curing + cooling
Impact scrubber + cyclone + wet
scrubbers + WESP 250 7.6 0.95 21
Dry + wet scrubbers + WESP (3) 250 13.7 0.73 28.5
Forming + cooling Stone wool filters 150 1.3 – 4.3 0.4 – 0.55 17 – 18.5
Forming only Impact scrubber +
cyclone 25 0.8 0.16 29
Cross flow scrubbers 100 3.1 0.15 15.5
Stone wool filters 150 – 350 1.0 (150 t/d) 8.4 (350 t/d)
0.55 – 0.6 8.5 – 17
Curing only Stone wool filter +
afterburner 150 – 200 0.8 – 1.3 0.2 (recycling) 0.4 (disposal)
5.5 (recycling) 14.5 (disposal)
Curing + cooling Waste gas
incineration (afterburner)
150 – 350 0.6 – 1.3 (150 – 250 t/d)
3.5 (350 t/d) 0.3 – 0.6 5.5 – 14
(1) Investment costs include annual investment depreciation, interest costs, site preparation, flue-gas treatment, waste treatment/removal, etc. (2) Operating and specific costs include maintenance, energy, chemical agents, CO2 allowances, waste disposal, water use, etc. (3) In the case of dry and wet scrubbers + wet electrostatic precipitator: investment costs include the wash-water recycling plant; specific costs exclude associated costs of the wash-water recycling plant. Source: [115, EURIMA-ENTEC Costs evaluation 2008]
4.5.7 High temperature insulation wools The principal environmental concern from non-melting activities related to the high temperature insulation wool (HTIW) sector is the release of particulate matter to the air which may include fibrous dust from high temperature insulation wool itself. In addition, some secondary processing operations may give rise to VOC emissions, especially during drying and curing operations. Particles and fibrous dust emissions can be generated from a number of areas within the process; these include areas for: fiberisation and collection, needling, lubricant burn-off, slitting, trimming, cutting, packaging, and areas of secondary processing.
Chapter 4
304 Manufacture of Glass
The technical possibilities for reducing emissions from downstream activities are normally based on the filtration of particulates with dedicated filters close to the source of release, where flue-gases are conveyed.
During the production of fibres, a lubricating agent is added to reduce the friction between the individual fibres to allow the needling process. Following fiberisation, the individual fibres are laid onto an air-permeable mesh belt made of woven wire in the collection chamber with the help of suction. The dust-laden gases are conveyed pneumatically through a pipeline into a fabric filter (dry separator) where the dust is removed. The fabric filters are cleaned pneumatically at certain intervals. The removed fibres and fibre dust are packed in sealable polyethylene bags and used partly as raw material for the vacuum-formed products or in alternative material recycling. As a result of the softening process, the dust emissions during needling of the web/mat are reduced. The dust produced at the needling machine is extracted directly at the machines. The extracted air is cleaned in filter separators. To remove the organic softening agent, the needled blanket undergoes thermal treatment prior to further processing. The waste and strips produced during trimming and any dust produced are extracted by suction, fed to a fabric filter in a closed system and packed as a product in polyethylene (PE) bags. Before the needled blanket is packed, it passes through a cooling zone in which ambient air is sucked through the mat to cool it down. Any dust produced in this process is collected in filtering separators. The material removed in all systems is used as a raw material for vacuum-formed parts or boards. All areas where particulate or fibrous dust release may be generated can be served by an efficient extraction system that vents to a fabric filter system. A well-designed and efficiently operated primary filtration system is capable of achieving emission levels in the range of 1 – 5 mg/Nm3 (<1 mg/Nm3 for fibres). Where a process relies on primary filters, some form of bag failure device will provide a safeguard. Many plants are fitted with alarmed pressure drop monitors, but these cannot be relied on exclusively. Filter systems with the extraction fan installed on the clean side of the fabric filter (negative pressure systems) are usually the preferred option. Positive pressure systems, with the fan on the untreated side may lead to leaks in the system downstream of the fan that could result in the release of material. Cleaning cycles for fabric filters can be optimised to ensure maximum filtration efficiency. In some applications, particularly those involving fibrous releases, shaker mechanisms can be more effective than reverse jet systems. Due to the nature of the collected material, it is important to ensure that it is handled and disposed of in a manner which prevents any release to the air or to water. In some cases, it may be possible to recycle the collected material to the furnace. Organic releases can be generated during lubricant burn-off or from curing or drying operations during secondary processing. Operational experience has shown that these releases tend to be very low. However, if emissions are significant (e.g. >100 g/hour) they can be controlled either by primary formulation measures or by standard abatement techniques, e.g. incineration or absorption.

Chapter 4
Manufacture of Glass 305
4.5.8 Frits Frits production does not present any significant specific emissions to air from downstream activities. Product grinding and milling is usually carried out wet, but dust control measures may be necessary if dry milling is carried out and potentially in dry product packaging areas. The most effective technique is likely to be extraction followed by a bag filter system.
4.6 Techniques for controlling emissions to water In general, emissions to water are relatively low and there are few major issues that are specific to the glass industry. This document does not cover those general water pollution issues that are common to many industrial processes and which are discussed in great detail in the technical literature. This section briefly summarises the general issues and, where appropriate, provides further information on those issues that are specific to the glass industry. In general, water is used mainly for cleaning and cooling and can be readily recycled or treated using standard techniques. The main potential sources of water pollution are identified below. • surface water drainage • spillages or leaks from raw material storage • drainage water from areas contaminated with liquid or solid materials • water used for product cleaning • cooling water and cooling water blow down from closed circuit systems • wet scrubber effluents. Excluding domestic waste water, discharges generally only contain glass solids, some oil contamination, some soluble glass making materials (e.g. sodium sulphate) and cooling water system treatment chemicals. Where any potentially harmful materials are used, measures can be taken to prevent them from entering the water circuit. Wherever practicable, closed cooling systems can be used and blowdown minimised. Standard pollution control techniques can be used to reduce emissions further if necessary; for example, settlement, screening, oil separators, neutralisation, and discharge to municipal waste water schemes. Standard good practice techniques can be used to control emissions from the storage of liquid raw materials and intermediates such as: • provision of adequately sized containment (bunding) • inspection/testing of tanks and bunding to ensure integrity • overfill protection (cut off valves, alarms, etc.) • positioning of vents and filling points within the bund or other containment. In general, the monitoring of water emissions is performed on composite samples taken over a period of two hours or a day (a daily average of four out of five samples is the reference in some Member States). Continuous measurements for pH and temperature are common. The issues considered specific to the glass industry are: • mineral wool process water systems • continuous filament glass fibre effluent • special glass (TV glass) • domestic glass (lead crystal, crystal glass) • frits cooling (quenching and milling circuits).
Chapter 4
306 Manufacture of Glass
Mineral wool Mineral wool processes are, under normal circumstances, net consumers of water with substantial amounts of water vapour emitted to air from the forming and, to a lesser extent, the curing operations. There are no inherent waste water discharges except the general issues mentioned above. Most processes operate a closed loop process water system (see Figure 2.11), and, where practicable, cooling water blow down and cleaning waters are fed into that system. Process cleaning waters and binder spillages are usually recycled to the process water circuit. The process water system has a limited volume but can be designed to include a holding tank to accommodate volume overloads, which can then be bled back into the system. Most of the materials used in the process are compatible with the process water chemistry. Small amounts of contaminated waste water may arise from chemical bunds, spillages and oil interceptors. Where such materials are not compatible with the process water system, they can be routed to a holding tank. Due to the very low volumes of these materials, they are usually disposed of to municipal waste water sewers or sent for off-site disposal. The techniques listed in Table 4.42 could be used but are unlikely to be economical for these very small volumes. The large volume of the process water system represents a potential for contamination of clean water circuits such as surface water and cullet quench water. Systems can be designed and operated to minimise this risk. For example, clean water systems should be sealed where they pass through areas where contamination may occur. Biological treatment is a technique that may be used in the mineral wool sector to degrade the organic compounds deriving from the binder application. Bioscrubbers using bacteria and washing towers reduce the amount of organic pollutants in the process waters. (see Table 4.36 in Section 4.5.6.1.3). Continuous filament glass fibre Emissions arise from the forming area, binder preparation, cleaning, cooling, tissue/mat binder application, and from water-based scrubbing systems. The main source of emissions is the forming area. Due to the high speed of the winders and movement of the filaments during the forming process, a proportion of the applied binder is thrown off and squeezed out. The main pollutants in the untreated waste water are the binder materials themselves. Careful handling procedures, particularly in the binder preparation area, can significantly reduce emission levels from the overall production processes. The pollutant species and concentrations will vary quite widely due to the variations in binder systems and operating practices. The waste water pollutant concentrations are sometimes quite low due to the dilution by wash down water, but they usually contain high levels of organic pollutants arising from binder materials. The effluent will usually require treatment either by discharge to municipal sewers or by treatment on site using an appropriate combination of the techniques listed in Table 4.42. If the effluent is to be disposed of directly to a watercourse, the most effective on-site treatment is likely to be biological treatment. However, careful design and operation of the treatment system is required because the effectiveness of biological treatment is sometimes compromised due to low concentrations and the high proportion of polymeric species. Special glass The special glass sector is very diverse and it is not possible to identify all potential emissions to water and the abatement techniques that are appropriate. Most of the activities in this sector only involve the general waste water issues described above. However, the manufacturing of certain products, particularly TV glass and optical glasses involves wet grinding or polishing operations. This gives rise to an aqueous stream containing the grinding and polishing aids (e.g. cerium oxide, silicon carbide) and fine glass that may contain lead. This waste stream can be treated by a combination of the standard solids removal techniques listed in Table 4.42 below. The lead in the glass is essentially insoluble and the total lead content will depend on the solids content.

Chapter 4
Manufacture of Glass 307
Domestic glass In general, the domestic glass sector has very low emissions to water. In common with other sectors in the industry, the major water uses include cooling and cleaning, and aqueous emissions will contain the cooling water system purges, cleaning waters and surface water run-off. However, certain activities, in particular the production of lead crystal and crystal glass have more specific associated emissions. • Water used in cutting operations contains cutting aids and quantities of fine glass
particles. This effluent can be treated using standard solids separation techniques. The water can be reused for cutting to minimise emissions levels, although a small volume would have to be bled off from the circuit. The lead contained in the glass is essentially insoluble.
• In the case of acid polishing, after dipping in acid, the glass has a layer of lead sulphate on the surface. This is washed off with hot water which will become acidic and will contain soluble lead sulphate. This effluent can be treated by a combination of chemical and physical techniques. The lead sulphate can be reacted to precipitate out the lead (e.g. with calcium carbonate to give lead carbonate) which can then be removed, usually by coagulation and flocculation followed by a physical separation. Using these techniques it should be possible to reduce lead levels to <0.5 mg/l.
• The acidic waste from the wet scrubbers will require neutralisation before discharge. Alternatively, hexafluorosilicic acid can be recovered and sold as a chemical feedstock. An addition of calcium carbonate to the acid waters may be used for the removal of fluorides deriving from the hydrofluoric acid solution used for polishing (see Section 3.6.2.3).
A list of possible techniques for waste water treatment is shown in Table 4.42.
Table 4.42: List of potential waste water treatment techniques for use in the glass industry Physical/chemical treatment
• screening • skimming • settlement • centrifuge • filtration
• neutralisation • aeration • precipitation • coagulation and flocculation
Biological treatment
• activated sludge • biofiltration
Frits Emissions to water consist of normal cooling, cleaning and surface run-off emissions. The quenching and milling circuits are usually closed with freshwater top-up but sometimes have a purge to prevent the build-up of salts. Emission levels are very low but may contain suspended solids which could include some elements that could make in situ treatment necessary in order to reuse this water in other operational processes. These elements are usually bound in the suspended solids and can be removed by solids separation techniques. In the case of boron, the parameter in purged water could be higher than standard values in other glass sectors, requiring other processing solutions [98, ANFFECC Position of the Frit Sector 2005].
Chapter 4
308 Manufacture of Glass
4.7 Techniques for minimising other wastes A characteristic of the glass industry is that most of the activities produce relatively low levels of solid waste. Most of the processes do not have significant inherent by-product streams. The process residues consist of unused raw materials and waste glass that has not been converted into the product. The main process residues encountered in the glass industry and the techniques used to control them are discussed below. Waste batch materials Waste batch materials arise from materials handling and storage and, where quality requirements allow for it, they can be readily recycled to the process. In cases where material has built up, it may not be of sufficient purity to recycle, but the amount of this type of material can be minimised by the techniques described in Section 4.3. Dust collected from waste gas streams In most cases dust collected from the waste gas streams can be internally recycled to the process. Recycled filter dust acts as a substitution for sulphur-containing virgin raw materials in glass productions using sulphate as fining agent. Where acid gas absorbents are used, they can usually be chosen to be compatible with raw materials to enable recycling although the batch composition may have to be adjusted. This issue is discussed further in Section 4.4.1. The use of filter dust in the batch formulation can be a source of long-term problems, due to carryover and potential corrosion of the refractory materials, and short-term problems related to the accumulation of sulphur and NaCl vapours in the flue-gases. In regenerative furnaces, a substantial amount of dust is deposited in the regenerators during the furnace campaign. During the rebuild/repair, this material is dug out and disposed of to an appropriately licensed site. It is not generally practicable to recycle this material. Melt not converted into product This waste stream arises mainly from interruptions to the forming processes, either malfunctions or product changes. The most commonly used and effective technique is to cool and shatter the melt in water and then to use the cullet formed in this way directly as a raw material. There are a number of examples where this is not practicable or is not practised. It is generally possible to remelt all rejected container glass. The main exception is where the glass has been contaminated, for instance by ceramic impurities from external cullet sources. In the float glass process, the interruptions to production usually occur after the float bath and so the waste is usually a solid glass, which can also be broken and recycled as cullet. Similarly, in continuous filament glass fibre production, interruptions generally occur after fibre formation and the waste material is fibre. A further source of this type of waste is drain glass, which involves withdrawing a flow of molten glass taken from the bottom of the channel to remove denser unmelted particles. If not removed, these particles can cause fiberising problems, which could result in expensive damage and increased waste. The internal recycling of this material is not usually desirable, because it involves returning the separated impurities to the furnace that will flow back to the bushings. This could lead to a gradual build-up of unmeltable material and potentially a higher level of waste due to fiberisation problems. In some cases it is possible to recycle this material in other sectors of the glass industry. In HTIW production, there has been little financial incentive to recycle the waste melt but the tendency is to recycle the maximum waste possible due to increasing costs for waste disposal and raw materials.

Chapter 4
Manufacture of Glass 309
In stone wool production, fine materials cannot be recycled to the cupola, because they would disrupt the airflow within the material bed. This problem can be overcome by briquetting the waste material to form pieces of comparable size to the standard raw materials. This technique is now widely used and can be considered as proven both economically and technically, although the economics will vary with scale. Stone wool shot (unfiberised particles) can also be recycled in this way (see Section 3.8.4). Waste products This category includes material that results out of the required specification, edge trims, waste products from changeovers, breakages, and quality samples. Wherever possible, measures to minimise this type of waste are preferable to recycling; for example, edge trims can be reduced to the minimum width. These measures usually also result in economic benefits. ‘Hard’ waste, for example flat glass edge trims and container glass rejects, are readily recycled as cullet following crushing. In some installations this may not occur either because of variations in product formulation or simply because it is not considered economically attractive. In theory, all ‘hard’ glass waste can be recycled in this way with the exception of very polluted glass or rejected glass with large defects (stones, cords) which need to be disposed of. In the mineral wool sector, such product wastes are fibrous and so cannot be recycled directly to the furnace. The solution to this is to mill or grind the material and then recycle it as a powder to tank furnaces or via the briquetting process for stone wool cupolas. Although apparently simple in principle, this technique is quite expensive and is only recently becoming economically viable due to increasing disposal costs. At the time of writing (2010), this technique is not commonly practised. A further problem in glass wool production is the organic content of the material, which must be oxidised in the furnace. This generally requires the increased use of nitrates that decompose to release NOX and sometimes MnO2, which is also used as oxidiser. Wherever possible, fibrous waste is processed and sold as blowing wool. Edge trim waste is usually shredded and recycled directly back to the fibre veil. There is a limit to the amount of waste that can be recycled in this way (edge trim only) and it cannot usually be done for products with high strength requirements. Fibrous waste from the HTIW sector involves the same issues as for mineral wool. The sector is recycling more and more of the fibrous waste and work on this issue is ongoing. The production of continuous filament glass fibre involves very high quality requirements and at the time of writing (2010), there are no known full-scale examples of waste fibre being directly recycled to the furnace. The problem is apparently related to the organic component of the fibre and handling of the fibrous materials. Solid waste from waste water systems In general, waste separated from the process water systems is not recycled and is disposed of to landfill. In some sectors, particularly domestic glass (lead crystal cutting sludge), initiatives are ongoing to recover and valorise these waste streams. In most sectors it is not financially viable to recover these wastes either because of the low volumes or due to unpredictable/contaminated composition. In the container glass sector, waste from cooling water systems is often internally recycled (fine particles of glass mixed with oil). The pretreatment of post-consumer waste (e.g. from bottle banks) is not discussed in this section because it is not a process waste stream and so is outside of the scope of the Directive in this respect. However, the recycling of cullet does have important effects on the process and is considered in Sections 4.4 and 4.8. Furthermore, in addition to reducing the specific energy consumption of the melting process, the practice lowers the consumption of virgin raw materials, which is a positive consideration under the Directive.

Chapter 4
310 Manufacture of Glass
4.8 Energy Glass making is a very energy-intensive process and the choices of energy source, heating technique and heat recovery method are central to the design of the furnace and to the economic performance of the process. The same choices are also necessary for some of the most important factors affecting the environmental performance and energy efficiency of the melting operation. In general, the energy necessary for melting glass may account for over 75 % of the total energy requirements of glass manufacture, with an average of about 65 % of the total energy input when considering all the sectors of the glass industry. The percentages indicated above refer to energy at the point of use and are not corrected to primary energy (see Section 3.2.3). A summary of the typical values achieved by applying the available techniques/measures for the minimisation of specific energy consumption is given in Table 4.43 where data presented for the different glass sectors are derived on the basis of the aggregated statistical data reported in Chapter 3 (e.g. for container glass the lower 50th percentile of the aggregated data has been used) and example installation values.
Table 4.43: Typical specific energy consumption values achieved by applying available techniques/measures for minimising the use of energy
Sector Furnace type/capacity GJ/tonne melted glass (1)
GJ/tonne finished product (2)
Container glass <100 t/d 5.5 – 7 >100 t/d 3.3 – 4.6 Bottles and jars Electric furnaces 2.9 – 3.6
<7.7
<100 t/d 7 – 9 Flacconage >100 t/d 4.8 – 6 <16
Flat glass All capacities 5 – 7 <8
Continuous filament glass fibre All capacities 7 – 14 <20
Domestic glass Conventional furnaces <100 t/d (3) 6.7 – 9.5 >100 t/d 5 – 6 Electric furnaces (4) 3.4 – 4.3
<24 for capacities <100 t/d (3)<18 for capacities >100 t/d
Special glass All products Electric furnaces (4) 3.9 – 4.5 Soda-lime glass 5 – 10 Borosilicate glass Conventional furnaces 10 – 15
<20
Mineral wool Glass wool All capacities 2.7 – 5.5 <14 Stone wool All capacities 4.2 – 10 <12 High Temperature Insulation Wool
All capacities 6.5 – 16.5 <20 Frits
Oxy-fired furnaces ≤9Air/fuel and enriched air/fuel fired furnaces ≤13
(1) Data refer to the furnace energy consumption. (2) Data refer to the overall energy consumption of the installation. (3) Values do not include installations equipped with pot furnaces or day tanks which energy consumption for the
melting process may be in the range of 10 – 30 GJ/tonne melted glass. (4) Data reported refer to energy at the point of use and are not corrected to primary energy.
Chapter 4
Manufacture of Glass 311
Values reported in Table 4.43 represent indicative figures for the specific sectors; however they might not cover the whole range of operating conditions of the melting furnace and all the downstream activities associated with a specific glass product. In fact, the cullet rate used in the batch formulation, the quality requirements for the glass melt and the pack-to-melt ratio may vary significantly within each sector with a consequent influence on the specific energy consumption. The correction to primary energy of the values presented (i.e. for electric melting, electric boosting, oxy-fuel firing) may also have a significant influence on the specific energy consumption levels. The cost of energy for melting is one of the largest factors in operational costs for glass installations and there is a significant incentive for operators to reduce energy use. Economic savings have traditionally been the motivation for implementing energy saving techniques, but recently the environmental aspects of energy use have increased in importance. In fossil fuel-fired furnaces, the energy use also affects the direct and indirect emissions per tonne of glass of those substances which relate directly to the amount of fossil fuel burned, particularly CO2, SO2and NOX, but also particulate matter. These issues are discussed in the substance-specific sections of this chapter. Energy use and the main factors affecting energy efficiency are discussed in Chapter 3, where specific energy consumption data are presented for each sector of the glass industry. This section discusses techniques for improving furnace efficiency.
4.8.1 Melting techniques and furnace design [19, CPIV 1998] [6, EEO 1995] [15, ETSU 1992]
The selection of the melting technique can have a great effect on energy efficiency. The choice is largely determined by a range of economic considerations. The main factor is the desired production rate and the associated capital and operating costs over the life of the furnace. An important aspect of the operating costs is the energy usage, and in general, the operator will choose the most energy-efficient design possible. In conventional fossil fuel-fired furnaces, the main difference in furnace design is whether the heat recovery system is based on regenerators or a recuperator. The differences in the design and operation are discussed in Chapter 2. One of the main factors in the choice is the furnace size, which is discussed further in Section 4.2. Regenerative furnaces achieve a higher combustion air preheat temperature for the combustion gases; up to 1300 – 1400 °C, compared with a maximum of 750 – 800 °C for recuperative furnaces, resulting in better melting efficiencies. The generally larger size of the regenerative furnaces also makes them more energy efficient than the smaller recuperative furnaces. This is because specific structural losses are inversely proportional to the furnace size, the main reason being the change in surface area to volume ratio. A modern regenerative container furnace will have an overall thermal efficiency of around 50 %, with waste gas losses of around 25 – 35 % (about 14 – 20 % when batch and cullet preheating is used), and structural losses making up the vast majority of the remainder. The thermal efficiency of a recuperative furnace without additional heat recovery will be closer to 20 – 30 %. Regenerative furnaces can be end-fired or cross-fired. The end-fired furnaces are theoretically more thermally efficient (up to 10 % higher), but temperature control is more limited and there is an upper limit to the furnace size (currently around 150 m2 for container glass). Overall, the furnace operation plays a more important role in the energy efficiency than the type of furnace (end-fired or cross-fired). Float glass, tableware and flaconnage (perfume and luxury cosmetics) furnaces are less efficient than container glass furnaces, because the specific pulls are much lower due to quality requirements and/or refining chemistry.

Chapter 4
312 Manufacture of Glass
The energy recovered by regenerators may be maximised by increasing the quantity of refractory bricks employed. In practice, these may be organised in enlarged regenerator chambers or in separate but connected structures, given the term multi-pass regenerators. The law of diminishing returns applies as the regenerator efficiency is approaching asymptotically its maximum limit. The principle limitations are the cost of the extra refractory bricks, and in the case of existing furnaces, the limitations are of available space and the additional costs of modifying the furnace infrastructures. This principle is more commonly applied to end-fired furnaces due to their simple regenerator geometry, although some applications on cross-fired furnaces have been made. Modification of regenerator structures on existing furnaces (if this is technically and economically feasible given the plant layout) can only be made during furnace reconstruction. At the beginning of the regenerators campaign, energy consumption may be reduced by up to 15 %, with respect to the equivalent furnace with typical single pass regenerators, depending on the size of the original single pass regenerator. On the other hand, the use of multi-pass regenerators may be associated with potential condensation problems with the consequent need for cleaning of the checkers and a subsequent decrease in energy efficiency. Modern furnaces equipped with single pass regenerators show heat recovery efficiency close to 65 %. In these cases, the use of multi-pass regenerators would not achieve significant improvements of the energy efficiency of the furnace. The only negative impact is the increased volume of refractory materials to be handled at the end of the furnace life. This negative impact is limited, as a significant proportion of the extra refractory bricks withstand two or more furnace campaigns, and solutions exist, and will continue to be developed, for recycling these materials. Although the increased air preheat temperatures of furnaces equipped with multiple pass regenerators is potentially a factor to increase flame temperature and hence NOX formation, these furnaces do not, in practice, demonstrate high NOX levels when appropriate measures of reduction at the source are taken. There are a variety of materials available for use as heat storage media and packing in regenerators. The simplest solution is to use refractory bricks stacked in an open or ‘basketweave’ pattern and this will generally give a regenerator efficiency of 50 % or more (heat recovered by air compared to heat contained in the waste gas). However, heat transfer can be improved by using specially shaped packing materials. For example, fusion cast corrugated cruciforms will enhance the heat exchange efficiency compared to standard brick packing. The effect of this type of refractory bricks on energy consumption depends on the starting situation and size of the regenerator; fuel savings of about 7 % are quoted. In addition, these materials are very resistant to chemical attack from volatiles in the waste gas stream and show very much reduced deterioration in performance (compared to bricks) throughout the campaign. So far (2010), the use of corrugated shapes has been generalised when cruciform pieces are installed in a regenerator. The maximum theoretical efficiency of a regenerator is about 77 % because the mass of waste gases from a furnace exceeds that of the incoming combustion air and the heat capacity of exhaust gases exceeds that of the combustion air. In practical terms, the efficiency will be limited by the cost and the structural losses become more significant as the size of the regenerators increases. In practice, it is difficult to conceive a cost-effective regenerator design with an efficiency of greater than 70 %. Furnace geometry is constantly undergoing refinements to optimise thermal currents and heat transfer, both to improve glass quality and to save energy. The developments are often combined with developments in combustion systems to reduce emissions and save energy. Furnace geometry changes are only possible for new furnaces or complete rebuilds and even then, what is actually possible may be limited by the steelwork and existing infrastructure.

Chapter 4
Manufacture of Glass 313
Electrical melting, either partial or 100 %, improves energy efficiency when considered at the site level, but when power generation efficiency and distribution losses are taken into consideration, the situation is less clear. These techniques are described in more detail in Section 4.2. Oxy-fuel melting can also result in lower energy consumption, but this is a complex subject that is discussed in more detail in Section 4.4.2.5. The advances in refractory materials over the past decades have allowed furnaces to operate with longer campaigns and with higher levels of insulation. The limitation of temperature to which the furnace superstructure could be subjected was, in the past, a limiting factor for high insulation. Today, the insulation must be carefully designed according to the part of the furnace and the operating conditions (temperature, type of glass, etc.). Not all parts of the furnace can be insulated. The flux line and the throat must be left uninsulated and they will have to be cooled to extend furnace life. Most glass contact and superstructure refractories are made with fusion cast or sintered chromium oxide materials that are very dense with low porosity and can resist liquid glass and volatile compounds in the superstructure. They have high thermal conductivity and need, in general, a good insulation level leading to substantial energy savings. In soda-lime glass, the crown is normally in silica and heavily insulated. For oxy-fuel-fired furnaces, other materials may be applied (fused cast alumina or AZS) in order to withstand possible attacks from alkali vapours. Silica limits the temperature of the crown of the furnace to 1600 – 1620 °C, while other crown refractory materials, such as fused cast AZS, mullite or fused cast alumina can withstand temperatures higher than 1620 °C. Any increase in furnace temperature may also adversely affect emissions of NOX and any emissions derived from volatile components of the batch. Additional insulation can be applied to certain areas of the furnace with little risk of structural damage. Sprayed fibre insulation can significantly reduce heat losses when applied to the regenerator structure. This simple, cost-effective technique can reduce regenerator structural heat losses by up to 50 % and give energy savings in the region of 5 %. There is also the additional benefit that the material will effectively seal any cracks in the regenerator structure, thus reducing the ingress of cold air and the escape of hot air.
4.8.2 Combustion control and fuel choice [6, EEO 1995] [15, ETSU 1992]
In recent decades the predominant fuel for glass making has been fuel oil, although the popularity of natural gas has been constantly increasing. At present, the use of both fuels is comparable. Natural gas firing results in lower SOX emissions but generally gives rise to higher NOX emissions. This is because the natural gas flame is less radiant and the heat capacity of the flue-gases from gas-firing (per GJ combustion) is different than that from oil-firing. This results in different heat losses even at the same flue-gas temperature, and in general, in higher energy consumption which is approximately 7 – 8 % higher for natural gas than for fuel oil. However, as experience of gas firing increases, performance levels progressively approaching those associated with oil firing can be achieved; although, in general, oil-fired furnaces still show a higher energy efficiency. Natural gas has a higher ratio of hydrogen to carbon and its use reduces overall emissions of CO2 by up to 25 % for a given pull rate. The developments in low-NOX burner systems have also resulted in energy savings. By reducing the amount of combustion air to close to stoichiometric levels, less energy is lost in the waste gas. The improvements made to the combustion system, the heat transfer systems and general process control during developments intended for NOX reduction have, in many cases, also led to improvements in furnace operation and efficiency.
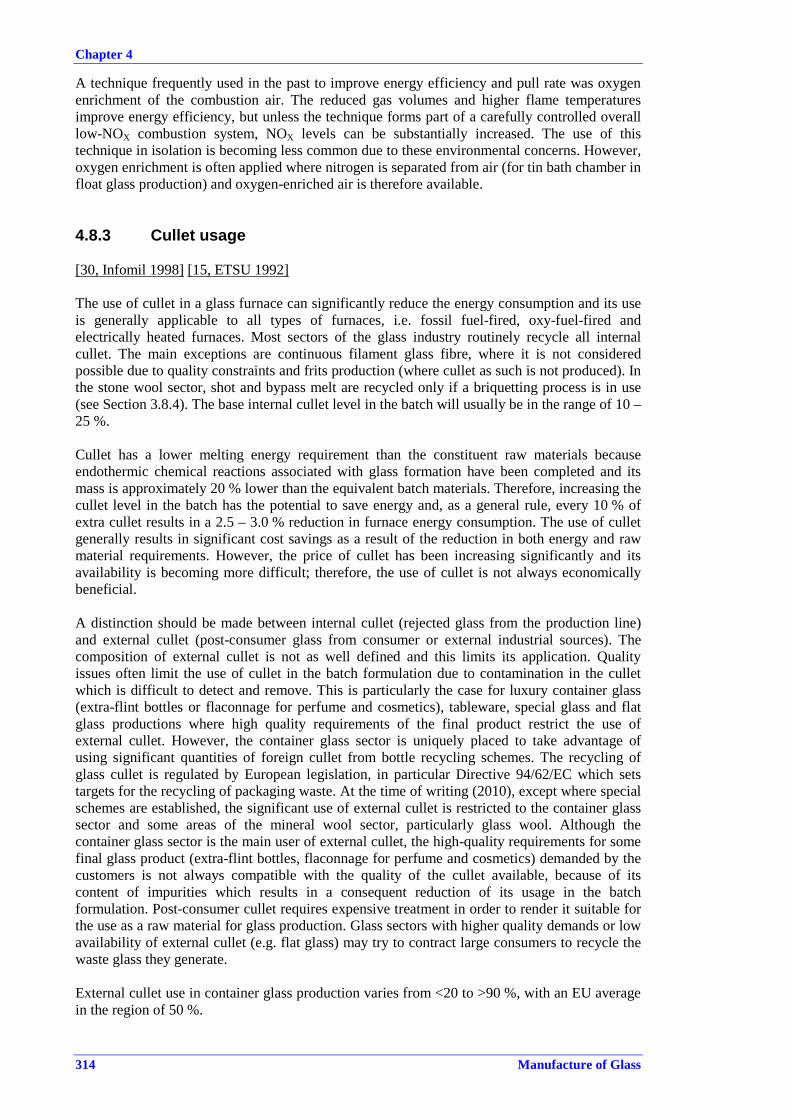
Chapter 4
314 Manufacture of Glass
A technique frequently used in the past to improve energy efficiency and pull rate was oxygen enrichment of the combustion air. The reduced gas volumes and higher flame temperatures improve energy efficiency, but unless the technique forms part of a carefully controlled overall low-NOX combustion system, NOX levels can be substantially increased. The use of this technique in isolation is becoming less common due to these environmental concerns. However, oxygen enrichment is often applied where nitrogen is separated from air (for tin bath chamber in float glass production) and oxygen-enriched air is therefore available.
4.8.3 Cullet usage [30, Infomil 1998] [15, ETSU 1992]
The use of cullet in a glass furnace can significantly reduce the energy consumption and its use is generally applicable to all types of furnaces, i.e. fossil fuel-fired, oxy-fuel-fired and electrically heated furnaces. Most sectors of the glass industry routinely recycle all internal cullet. The main exceptions are continuous filament glass fibre, where it is not considered possible due to quality constraints and frits production (where cullet as such is not produced). In the stone wool sector, shot and bypass melt are recycled only if a briquetting process is in use (see Section 3.8.4). The base internal cullet level in the batch will usually be in the range of 10 – 25 %. Cullet has a lower melting energy requirement than the constituent raw materials because endothermic chemical reactions associated with glass formation have been completed and its mass is approximately 20 % lower than the equivalent batch materials. Therefore, increasing the cullet level in the batch has the potential to save energy and, as a general rule, every 10 % of extra cullet results in a 2.5 – 3.0 % reduction in furnace energy consumption. The use of cullet generally results in significant cost savings as a result of the reduction in both energy and raw material requirements. However, the price of cullet has been increasing significantly and its availability is becoming more difficult; therefore, the use of cullet is not always economically beneficial. A distinction should be made between internal cullet (rejected glass from the production line) and external cullet (post-consumer glass from consumer or external industrial sources). The composition of external cullet is not as well defined and this limits its application. Quality issues often limit the use of cullet in the batch formulation due to contamination in the cullet which is difficult to detect and remove. This is particularly the case for luxury container glass (extra-flint bottles or flaconnage for perfume and cosmetics), tableware, special glass and flat glass productions where high quality requirements of the final product restrict the use of external cullet. However, the container glass sector is uniquely placed to take advantage of using significant quantities of foreign cullet from bottle recycling schemes. The recycling of glass cullet is regulated by European legislation, in particular Directive 94/62/EC which sets targets for the recycling of packaging waste. At the time of writing (2010), except where special schemes are established, the significant use of external cullet is restricted to the container glass sector and some areas of the mineral wool sector, particularly glass wool. Although the container glass sector is the main user of external cullet, the high-quality requirements for some final glass product (extra-flint bottles, flaconnage for perfume and cosmetics) demanded by the customers is not always compatible with the quality of the cullet available, because of its content of impurities which results in a consequent reduction of its usage in the batch formulation. Post-consumer cullet requires expensive treatment in order to render it suitable for the use as a raw material for glass production. Glass sectors with higher quality demands or low availability of external cullet (e.g. flat glass) may try to contract large consumers to recycle the waste glass they generate. External cullet use in container glass production varies from <20 to >90 %, with an EU average in the region of 50 %.

Chapter 4
Manufacture of Glass 315
Recycling rates vary widely between Member States depending on the material schemes for post-consumer glass collection. In the domestic glass sector, quality considerations generally prevent the use of external cullet in the process. Internal cullet usage is limited by the availability of cullet at the correct quality and composition. In general, the average amounts of internal cullet used are around 25 % for soda-lime products, although amounts as high as 50 % are possible depending on the type of article produced; for lead crystal, average amounts of 35 % are normally applied. For the manufacture of flint (colourless glass) only very low levels of coloured cullet can be tolerated since coloured glass cannot be decolourised. Therefore, recycling schemes with either separate collection between the main glass colours, or alternatively colour sorting of cullet from mixed collection are necessary to maximise recycling. In general, throughout the EU, there are ample supplies of mixed coloured, green and brown cullet. However, flint cullet tends to be less common and because of this situation, furnaces melting coloured glass operate at higher cullet levels, particularly for the production of green glass where a mixture of different colours can be used. The situation varies significantly between Member States due to regional differences, for example, it is a problem in the UK since the bulk of production is flint glass, yet a substantial proportion of cullet is coloured, from imported wine bottles. Consequently, furnace cullet levels in the UK are lower, on average. In terms of furnace operation, high cullet levels can also give other benefits such as lower particulate emissions. Cullet is easier than batch to preheat. The output of the furnace can also be greatly increased, but there are a number of drawbacks to the manufacturer when operating at high cullet levels such as those listed below. • Metallic impurities such as bottle caps or foils from wine bottles can cause serious
refractory damage and shorten the furnace life. The metallics sink to the bottom where a phenomenon known as ‘downward drilling’ takes place. Metals, or metal droplets (particularly lead) accumulating at the refractory bottom of the melting furnace, will drill into the bottom material, due to a dissolution of refractory material enhanced by surface tension gradients which occur in the direct vicinity of the metal droplets. Metal contamination, the presence of lead crystal glass and reducing components in the cullet may cause defects in the glass.
• Ceramic inclusions, such as earthenware or pottery and glass ceramics that have a very low dissolution rate in the glass melt will appear as ‘stones’ or knots, often with an opaque colour, in the final product and lead to rejects.
• At high cullet levels, the control of composition and therefore the physical characteristics of the glass melt can be reduced, possibly leading to final product quality problems. The variable content of organic matter (food residues, paper labels, plastics) in particular can cause problems in the oxidation-reduction state, leading to colour and refining difficulties.
• Aluminium caps and foils act as strong local reducing agents causing the silica of the glass to reduce to silicon metal (Si). The silicon forms inclusions in the glass products (small beads), which significantly reduce the mechanical strength of the glass, due to stresses resulting from the high difference of thermal expansion coefficient between the glass and silicon.
• Impurities from cullet can lead to air emissions (lead, fluorine and boron compounds, etc.).

Chapter 4
316 Manufacture of Glass
In addition to the substantial energy savings possible with cullet usage, there are a number of other important associated environmental benefits. Emissions of CO2, SOX, NOX and dust are greatly reduced due to reduced fuel usage and lower furnace temperatures. Emissions of other volatile substances may also be lower due to the reduced temperatures. However, impurities in the cullet may lead to higher emissions of HCl, HF and metals and SOX (when glasses with low sulphur content are produced). This is particularly relevant in areas with high recycling rates where impurities can build up in the recycled material. Many raw materials in glass making are carbonates and sulphates, which release CO2 and SOX upon melting. The increased cullet usage reduces these raw material derived emissions and reduces the consumption of virgin raw materials.
4.8.4 Waste heat boiler The principle of this technique is to pass waste gases directly through an appropriate tube boiler to generate steam. The steam may be used for heating purposes (space heating and heating of fuel oil storage and piping) or, via a suitable steam motor or turbine to drive electricity generation equipment or plant items such as air compressors or Individual Section (IS) machine ventilator fans. Incoming gases from regenerators/recuperators are usually in the temperature range from 600 to 300 °C. The outlet temperature determines the available recoverable heat which is limited to approximately 200 °C due to the risk of condensation in the boiler and to ensure correct stack operation. Boiler tubes exposed to furnace waste gases can become coated with condensed materials (e.g. sodium sulphate, depending on the composition) and sticky and corrosive compounds (e.g. sodium bisulphate) could form, depending on the temperature and composition of the flue-gases which may react with the metal structure of the pipes. Therefore, boiler tubes must be periodically cleaned to maintain recovery efficiency (this is not as important for boilers operating downstream of dust removal devices). In situ cleaning may be carried out automatically by steam, by mechanical means, or by periodic maintenance. The applicability and economic feasibility of the technique is dictated by the overall efficiency that may be obtained (including effective use of the steam generated). In practice, waste heat boilers have only been considered to recover residual heat downstream from regenerator or recuperator systems and there is thought to be at least two examples with oxy-fuel-fired furnaces (see Table 4.18). In many cases, the quantity of recoverable energy is low for efficient power generation and supplementary firing may be needed to generate superheated steam to drive turbines. Recuperative furnaces with higher waste gas temperatures or installations where it is possible to group the waste gases from several furnaces offer more opportunities for power generation. Waste heat boilers are in industrial use on some container glass facilities but most applications are with float glass furnaces. All float furnaces in Germany and many in other Member States have waste heat boilers. Investment costs can exceed EUR 1 million with variable payback periods, depending on performance and prevailing energy prices. The ongoing improvements in primary energy efficiency are eroding the cost-effectiveness of waste heat boilers. In some applications, there may not be an attractive payback period, but this will vary from case to case. The 3R process can help to make existing waste heat boiler systems more effective and would likely improve the economic performance of any new system proposed for installation. However, if for whatever reason the installation of a waste heat boiler is considered inappropriate or economically unattractive, the installation of the 3R process will not necessarily change this situation. In Table 4.44 data are reported concerning example installations where waste heat boilers (heat exchangers) are applied in different sectors of the glass industry.

Chapter 4
Manufacture of Glass 317
Table 4.44: Example installations of waste heat boilers applied in different sectors of the glass industryType of glass Container Container Flat Float Special Special
Type of furnaces Oxy-fired(2 furnaces)
End-port,regenerative
Side-port,regenerative
Side-port,regenerative Oxy-fired Side-port,
regenerativeFuel Natural gas Natural gas/fuel oil Fuel oil Natural gas/fuel oil Natural gas Natural gas/fuel oilFurnace capacity 650 tonnes/day (total) 300 tonnes/day 350 tonnes/day 800 tonnes/day 40 tonnes/day 220 tonnes/dayActual pull rate 502 tonnes/day (total) 297 tonnes/day 259 tonnes/day 700 tonnes/day 40 tonnes/day 180 tonnes/dayLast main repair 2000 – 1996 1997 2000 2002 2004Electric boosting Yes Yes Yes Yes YesType of glass Brown-green Brown White, bronze, yellow White Glass ceramics Not availableCullet 66 % (average) 72 % 30 % 35 % 50 % 25 %Type of heat exchanger Pipe bundle Pipe bundle Tube register Tube register Tube registerPlace of installation Before bag filter After ESP Before ESP Before ESP Before bag filter After ESPHeat carrier Water/steam Water/steam Water/steam Water/steam Water/steam Water/steam
Use of recovered energy Electric energy,compressed air
Electric energy,industrial water
Industrial water,firing, oil preheating
Industrial water,electricity, firing Industrial water Water for
domestic useDedusting Online Online Online Online Not available None
Dust disposal Added to the batch Added to the batch Special disposal Recycling or specialdisposal Not available Recycling or special
disposalTemperature difference From 1380 to 200 °C Approx. 150 °C Approx. 200 °C Not available Not available Not available
Amount of recovered energy 6472 kWh/h 1500 kWh/h(estimated) 1500 kWh/h 3000 kWh/h 550 kWh/h 1140 kWh/h
Specific heat recovery 0.31 kWh/kg glass 0.12 kWh/kg glass(estimated) 0.14 kWh/kg glass 0.10 kWh/kg glass 0.33 kWh/kg glass 0.15 kWh/kg glass
Specific energyconsumption
4.20 GJ/t melted glass(average) 4.21 GJ/t melted glass 5.71 GJ/t melted glass 5.20 GJ/t melted glass 12.31 GJ/t
melted glass16.44 GJ/t
melted glassInvestment/replacementcosts (1) EUR 1.67million (2) EUR 0.5 million (2) EUR 1.0 million (2)
Duration of amortisation 10 yrs 10 yrs 10 yrsOperating costs EUR 33 500 EUR 60 000 EUR 70 000Annual amortisation costs EUR 222 111 EUR 65 000 EUR 133 000Total annual costs (1) EUR 255 611 EUR 255 611 EUR 203 000Estimated costs per tonneof glass EUR 2.36/tonne glass EUR 1.34/tonne glass EUR 0.79/tonne glass
(1) Cost data are for the year of installation of the air pollution control system and are not necessarily representative of current costs.(2) Investment costs for the heat exchanger include accessories.Source: [75, Germany-HVG Glass Industry report 2007]

Chapter 4
318 Manufacture of Glass
4.8.5 Batch and cullet preheating [30, Infomil 1998] [65, GEPVP-Proposals for GLS revision 2007]
Description Batch and cullet is normally introduced cold into the furnace, but by using the residual heat of the waste gases to preheat the batch and cullet, significant energy savings can be possible. This only applies to fossil fuel-fired glass furnaces. In the stone wool industry, predominantly cupola furnaces are used, which have a design that preheats the raw materials intrinsically. Preheating temperatures should preferably not be lower than 270 °C but should not exceed 500 – 550 °C. In practice, most batch and cullet preheaters operate at batch preheat temperatures between 275 and 325 °C. Batch/cullet preheaters have been developed and installed by Nienburg/Interprojekt (direct preheating), Zippe (indirect preheating) and Sorg (direct preheating). A combined direct cullet preheater and electrostatic precipitator was developed and installed by Edmeston, now Praxair EGB. A new type is under development in the US for high temperature flue-gases of about 1300 °C, which should allow preheating the batch and cullet up to about 500 °C. The available systems are described below. • Direct preheating – this type of preheating involves direct contact between the flue-gas
and the raw material (cullet and batch) in a cross-counter flow. The waste gases are supplied to the preheater from the waste gas duct behind the regenerator. They pass through the cavities in the preheater, thereby coming into direct contact with the raw material. The outlet temperature of the cullet and batch is about 300 ºC and could go up to 400 ºC. The system incorporates a bypass that allows furnace operations to continue when preheater use is either inappropriate or impossible. Direct preheaters are developed and installed by Nienburg/Interprojekt and by Sorg. An example installation for the application of direct cullet preheating is reported in Table 4.45.
• Indirect preheating – the indirect preheater is, in principle, a cross-counter flow, plate heat exchanger, in which the material is heated indirectly. It is designed in a modular form and consists of individual heat exchanger blocks situated above each other. These blocks are again divided into horizontal waste gas and vertical material funnels. In the material funnels, the material flows from the top to the bottom by gravity. Depending on the throughput, the material reaches a speed of 1 – 3 m/h and will normally be heated from ambient temperature up to approximately 300 °C. The flue-gases will be let into the bottom of the preheater and flow into the upper part by means of special detour funnels. The waste gases flow horizontally through the individual modules. Typically the flue-gases will be cooled down by approximately 270 – 300 °C. The indirect cullet preheater has been developed by Zippe.
• Praxair EGB filter – the Edmeston electrified granulate bed (EGB) filter system is a hybrid system between an electrostatic precipitator for dust removal and a direct cullet preheater. The application consists of two different stages using external and internal cullet. Both cullet streams are preheated, but in a different way. Only the section operating with internal cullet plus external cullet after being treated in a pyrolysis unit (first preheater stage) is used in the electrostatic field to capture dust from the flue-gases. At the time of writing (2010) the Praxair EGB cullet preheater is not applied within the glass industry in Europe. An application, including an integrated cullet filter bed section, is running at Leone Glass in the US in connection with an oxy-gas-fired furnace producing flint container glass. Flue-gases from the oxy-fuel-fired container glass furnace using recycled cullet (internal and external) are conveyed to a cullet preheating section with external cullet (stage 1). The organic fumes released from the external cullet in the preheating stage 1 are pyrolised and combined with a second flue-gas flow from the furnace. The combined gas flow enters an ioniser chamber where the dust particles present in the flue-gases are charged. The hot flue-gases containing the charged dust

Chapter 4
Manufacture of Glass 319
particles enter a cullet preheater equipped with electrode plates (stage 2). The preheater is continuously charged with internal (clean) cullet and external cullet from the first preheating stage. The electrostatic fields bring the charged dust particles to the cullet surface to be captured. The preheated cullet materials (up to 400 °C) and adhering dust particles are charged into the glass melting furnace.
Achieved environmental benefits These techniques have a number of environmental effects, which can vary from case to case. In general, the benefits given below have been experienced. • Specific energy savings of between 10 and 20 % with a consequent reduction of CO2
emissions. • Reduction in NOX emissions (due to lower fuel requirements and lower furnace
temperatures). However, in most cases the energy savings are used to increase the pull of the furnace.
• In the case of direct preheating, reduction of acidic compounds in the flue-gases SO2, HF and HCl, of 60 %, 50 % and 90 % respectively have been found (difference before and after the batch bed).
• An increase of pull rate of up to 10 – 15 %, is possible for applications to existing glass furnaces, with preheating of the batch to 300 °C.
• A reduction or elimination of the need for a dry-scrubbing agent. Cross-media effects The technique can give an increase in furnace capacity of 10 – 15 % without compromising the furnace life. If the pull rate is not increased, a small increase in furnace life may be possible. By getting more heat into the furnace, the technique can also reduce the requirement for electric boosting. In some cases, problems with odour generation from the preheater have arisen, due to organic fumes released during the pre-drying of the cullet, depending on the level of organics in the cullet. The problems are caused by the burning and evaporation of food residues and other organics in the external cullet. Solutions to these problems (e.g. incineration) are being developed. The use of a direct preheating causes increased emissions of particulate matter (up to 2000 mg/Nm3) and secondary particulate abatement is necessary. The collected dusts can normally be recycled back into the furnace. Preheating of batch and cullet results in a very dry batch, which may cause carryover of the fine components during charging of the batch into the melting furnace or when flue-gases flow with high velocity over the batch blanket before sintering and melting occur. The use of direct preheating raises the need for maintenance and cleaning, because of the increased emissions of particulate matter, with a consequent increase of costs. When direct material preheating requires the use of an electrostatic precipitator, electric energy is consumed. This offsets a portion of the energy savings but it is not substantial. There is a possibility that direct preheating might lead to dioxin emissions, particularly if waste gases containing HCl from the hot-end coating are included. Based on studies and measurements, there is no evidence for the formation of dioxins at relevant levels in the flue-gas of furnaces equipped with batch preheaters. Operational data In order to keep the loss of heat of the transport system below the heat exchanger as low as possible, the preheater should be located as close to the doghouse as possible. The ideal location would be directly above the batch charger. For economic reasons, the temperature of the waste
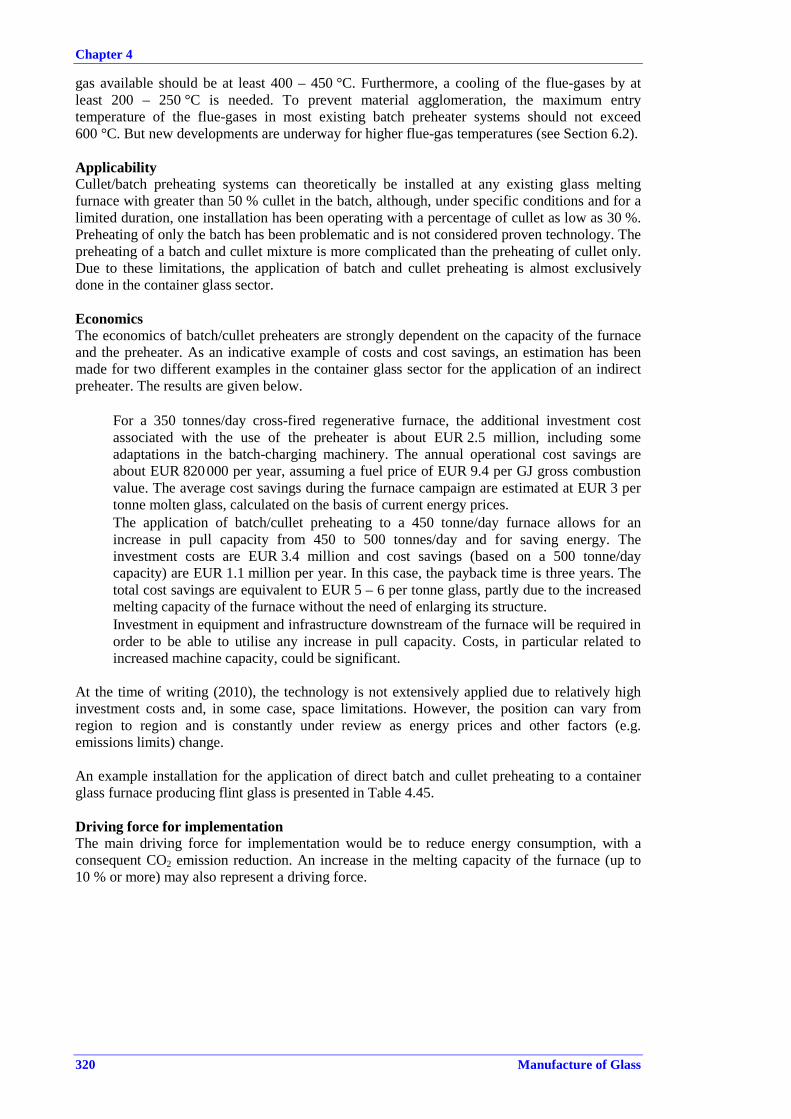
Chapter 4
320 Manufacture of Glass
gas available should be at least 400 – 450 °C. Furthermore, a cooling of the flue-gases by at least 200 – 250 °C is needed. To prevent material agglomeration, the maximum entry temperature of the flue-gases in most existing batch preheater systems should not exceed 600 °C. But new developments are underway for higher flue-gas temperatures (see Section 6.2). Applicability Cullet/batch preheating systems can theoretically be installed at any existing glass melting furnace with greater than 50 % cullet in the batch, although, under specific conditions and for a limited duration, one installation has been operating with a percentage of cullet as low as 30 %. Preheating of only the batch has been problematic and is not considered proven technology. The preheating of a batch and cullet mixture is more complicated than the preheating of cullet only. Due to these limitations, the application of batch and cullet preheating is almost exclusively done in the container glass sector. Economics The economics of batch/cullet preheaters are strongly dependent on the capacity of the furnace and the preheater. As an indicative example of costs and cost savings, an estimation has been made for two different examples in the container glass sector for the application of an indirect preheater. The results are given below. • For a 350 tonnes/day cross-fired regenerative furnace, the additional investment cost
associated with the use of the preheater is about EUR 2.5 million, including some adaptations in the batch-charging machinery. The annual operational cost savings are about EUR 820 000 per year, assuming a fuel price of EUR 9.4 per GJ gross combustion value. The average cost savings during the furnace campaign are estimated at EUR 3 per tonne molten glass, calculated on the basis of current energy prices.
• The application of batch/cullet preheating to a 450 tonne/day furnace allows for an increase in pull capacity from 450 to 500 tonnes/day and for saving energy. The investment costs are EUR 3.4 million and cost savings (based on a 500 tonne/day capacity) are EUR 1.1 million per year. In this case, the payback time is three years. The total cost savings are equivalent to EUR 5 – 6 per tonne glass, partly due to the increased melting capacity of the furnace without the need of enlarging its structure.
• Investment in equipment and infrastructure downstream of the furnace will be required in order to be able to utilise any increase in pull capacity. Costs, in particular related to increased machine capacity, could be significant.
At the time of writing (2010), the technology is not extensively applied due to relatively high investment costs and, in some case, space limitations. However, the position can vary from region to region and is constantly under review as energy prices and other factors (e.g. emissions limits) change. An example installation for the application of direct batch and cullet preheating to a container glass furnace producing flint glass is presented in Table 4.45. Driving force for implementation The main driving force for implementation would be to reduce energy consumption, with a consequent CO2 emission reduction. An increase in the melting capacity of the furnace (up to 10 % or more) may also represent a driving force.

Chapter 4
Manufacture of Glass 321
Table 4.45: Example installation for the application of a direct batch and cullet preheater to a container glass furnace
Operating conditions Type of furnaces Cross-fired, regenerative Fuel Natural gas Furnace capacity 350 t/d Actual pull rate 275 t/d Last main repair Year 2005 Electric boosting Yes Type of glass Flint Cullet 60 % Specific energy consumption 3.78 GJ/t glass Filter type ESP with 3 fields Temperature before filter 200 °CSorbent None Use of filter dust in the batch 100 % Energy consumption including ventilator 194 kWh/h
Type of raw material preheater Direct contact with exhaust gases from the furnace Exhaust gas volume before batch preheater 17000 m3/h
Exhaust gas temperature-entry/exit Approx. 450/200 °C
Raw material temperature-entry/exit Approx. 20/300 °C
Amount of recovered energy Approx. 900 kWh/h Filter system, including accessories,
pipeline, ventilator (1)Raw material preheater, including accessories (1)
Investment/replacement costs EUR 1.5 million EUR 1.0 million Duration of amortisation 10 yrs 12 yrs Operating costs EUR 120 000 EUR 10 000 Annual amortisation costs EUR 199 500 EUR 113 333 Total annual costs EUR 319 500 EUR 123 333 Estimated costs per tonne of glass EUR 3.18/t glass EUR 1.23/t glass Emission levels (2)
(mg/Nm3, dry gas at 8 % O2) kg/t glass Particulate matter 23.8 0.037 NOX 909 1.42 SOx 386 0.60 HCl 4.8 0.0075 HF 3.0 0.0047 Metals
Class I (Hg, Tl) 0.003 0.005x10⁻³ Class II (Pb, Co, Ni, Se) 0.76 1.2x10⁻³ Class III (Sb, Cr, Cu, Mn, V, Sn) 1.01 1.6x10⁻³
(1) Cost data are for the year of installation of the air pollution control system and are not necessarily representative of current costs.
(2) Emission data refer to half-hour average values. Source: [75, Germany-HVG Glass Industry report 2007]

Chapter 4
322 Manufacture of Glass
Example plants All the applications of batch and cullet preheating are in the container glass sector: • direct preheating:
◦ Ardagh Glass, Nienburg, Germany (three furnaces) ◦ Ardagh Glass, Neuenhagen, Germany ◦ Wiegand Glas, Steinbach am Wald, Germany ◦ Leone Industries, Bridgeton, New Jersey, US (oxy-fuel-fired furnace).
• indirect preheating:
◦ Ardagh Glass, Dongen, Netherlands. Reference literature [30, Infomil 1998] [65, GEPVP-Proposals for GLS revision 2007] [94, Beerkens - APC Evaluation 2008] [75, Germany-HVG Glass Industry report 2007]
4.9 Environmental management systems Description A formal system to demonstrate compliance with environmental objectives. Technical description The Directive defines ‘techniques’ (under the definition of ‘best available techniques’) as ‘both the technology used and the way in which the installation is designed, built, maintained, operated and decommissioned’.
In this respect, an environmental management system (EMS) is a technique allowing operators of installations to address environmental issues in a systematic and demonstrable way. EMSs are most effective and efficient where they form an inherent part of the overall management and operation of an installation. An EMS focuses the attention of the operator on the environmental performance of the installation; in particular through the application of clear operating procedures for both normal and other than normal operating conditions, and by setting out the associated lines of responsibility. All effective EMSs incorporate the concept of continuous improvement, meaning that environmental management is an ongoing process, not a project which eventually comes to an end. There are various process designs, but most EMSs are based on the plan-do-check-act cycle (which is widely used in other company management contexts). The cycle is an iterative dynamic model, where the completion of one cycle flows into the beginning of the next (see Figure 4.9).

Chapter 4
Manufacture of Glass 323
Figure 4.9: Continuous improvement in an EMS model
An EMS can take the form of a standardized or non-standardized (‘customized’) system. Implementation and adherence to an internationally accepted standardized system, such as EN ISO 14001:2004, can give higher credibility to the EMS especially when subjected to a properly performed external verification. EMAS provides additional credibility due to the interaction with the public through the environmental statement and the mechanism to ensure compliance with the applicable environmental legislation. However, non-standardized systems can, in principle, be equally effective provided that they are properly designed and implemented. While both standardized systems (EN ISO 14001:2004 or EMAS) and non-standardized systems apply in principle to organizations, this document takes a narrower approach, not including all activities of an organization e.g. with regard to their products and services, due to the fact that the Directive only regulates installations/plants.
An EMS can contain the following components: 1. commitment of management, including senior management; 2. definition of an environmental policy that includes the continuous improvement of the
installation by the management; 3. planning and establishing the necessary procedures, objectives and targets, in conjunction
with financial planning and investment; 4. implementation of procedures paying particular attention to:
(a) structure and responsibility (b) training, awareness and competence (c) communication (d) employee involvement (e) documentation (f) efficient process control (g) maintenance programmes (h) emergency preparedness and response (i) safeguarding compliance with environmental legislation;

Chapter 4
324 Manufacture of Glass
5. checking performance and taking corrective action paying particular attention to:
(a) monitoring and measurement (see also the Reference Document on the General Principles of Monitoring) [122, EC 2003].
(b) corrective and preventive action (c) maintenance of records (d) independent (where practicable) internal and external auditing in order to determine
whether or not the EMS conforms to planned arrangements and has been properly implemented and maintained;
6. review of the EMS and its continuing suitability, adequacy and effectiveness by senior
management; 7. preparation of a regular environmental statement; 8. validation by a certification body or an external EMS verifier; 9. following the development of cleaner technologies; 10. consideration for the environmental impacts from the eventual decommissioning of the
installation at the stage of designing a new plant, and throughout its operating life; 11. application of sectoral benchmarking on a regular basis. Achieved environmental benefits An EMS promotes and supports the continuous improvement of the environmental performance of the installation. If the installation already has a good overall environmental performance, an EMS helps the operator to maintain the high performance level. Environmental performance and operational data All significant consumptions (including energy) and emissions are managed in a coordinated manner by the operator for the short, medium and long term, in conjunction with financial planning and investment cycles. This means that e.g. adapting short-term end-of-pipe solutions to emissions may tie the operator to higher energy consumption in the long term, and postpone investment in potentially more environmentally beneficial solutions overall. This requires some consideration of the cross-media issues, and guidance on these and the costing and cost-benefits issues is given in the Reference Document on Economics and Cross-Media Effects [156, EC 2006] and in the BREF on Energy Efficiency [124, EC 2008].
Cross-media effects None reported. The systematic analysis of the initial environmental impacts and scope for improvements in the context of the EMS sets the basis for assessing the best solutions for all environmental media.
Technical considerations relevant to applicability The components described above can typically be applied to all installations within the scope of this document. The scope (e.g. level of detail) and nature of the EMS (e.g. standardised or non-standardised) will be related to the nature, scale and complexity of the installation, and the range of environmental impacts it may have. The implementation of an EMS, according to the rules of ISO 14001, to a number of installations within the glass industry, has proven to be a good tool for setting company guidelines for: • indicating to all employees the direction to focus their work on; • establishing an organisation where the tasks and responsibilities of every function are
clearly defined; • describing the production processes so that everyone can act accordingly; • adopting a controlling system to detect faults and abnormalities and to correct them
reliably, implementing a system to improve factory performance by fixing and realising specific targets.

Chapter 4
Manufacture of Glass 325
Economics It is difficult to determine accurately the costs and economic benefits of introducing and maintaining a good EMS. There are also economic benefits that are the result of using an EMS and these vary widely from sector to sector. External costs relating to verification of the system can be estimated from guidance issued by the International Accreditation Forum [182, IAF 2010].
Driving forces for implementation The driving forces for the implementation of an EMS include: • improved environmental performance • improved insight into the environmental aspects of the company which can be used to
fulfil the environmental requirements of customers, regulatory authorities, banks, insurance companies or other stakeholders (e.g. people living or working in the vicinity of the installation)
• improved basis for decision-making • improved motivation of personnel (e.g. managers can have confidence that environmental
impacts are controlled and employees can feel that they are working for an environmentally responsible company)
• additional opportunities for operational cost reduction and product quality improvement • improved company image • reduced liability, insurance and non-compliance costs. Example plants EMSs are applied in a number of installations throughout the EU. As an example, all float plants belonging to AGC Flat Glass Europe, Pilkington/NSG and Saint-Gobain are certified or are being certified to ISO 14001. These companies are part of large international groups with worldwide activities and therefore have chosen the international standard ISO 14001 rather than the EMAS that is specifically European. Other European installations producing container glass, continuous filament glass fibre, mineral wool, glass frits, etc. are certified ISO 14001 or are registered under EMAS (e.g. Rockwool Denmark, OCV, Saint-Gobain ISOVER, Saint-Gobain Mondego, etc). Reference literature EMAS Regulation (EC) No 1221/2009 [181, Reg. 1221/ 2009].DG Environment EMAS website [180, DG Environment 2010].EN ISO 14001: 2004 [179, ISO 2004].

Chapter 5
326 Manufacture of Glass
5 BAT CONCLUSIONS FOR THE MANUFACTURE OF GLASS SCOPE These BAT conclusions concern the industrial activities specified in Annex I to Directive 2010/75/EU, namely: • 3.3. Manufacture of glass including glass fibre with a melting capacity exceeding 20 tonnes
per day; • 3.4. Melting mineral substances including the production of mineral fibres with a melting
capacity exceeding 20 tonnes per day. These BAT conclusions do not address the following activities:
• Production of water glass, covered by the reference document Large Volume Inorganic Chemicals - Solids and Other Industry (LVIC-S)
• Production of polycrystalline wool • Production of mirrors, covered by the reference document Surface Treatment Using
Organic Solvents (STS) Other reference documents which are of relevance for the activities covered by these BAT conclusions are the following:
Reference documents Activity Emissions from Storage (EFS) Storage and handling of raw materials Energy Efficiency (ENE) General energy efficiency Economic and Cross-Media Effects (ECM) Economics and cross-media effects of techniques General Principles of Monitoring (MON) Emissions and consumption monitoring
The techniques listed and described in these BAT conclusions are neither prescriptive nor exhaustive. Other techniques may be used that ensure at least an equivalent level of environmental protection.
DEFINITIONS For the purposes of these BAT conclusions, the following definitions apply:
Term used Definition
New plant
A plant introduced on the site of the installation following the publication of these BAT conclusions or a complete replacement of a plant on the existing foundations of the installation following the publication of these BAT conclusions
Existing plant A plant which is not a new plant
New furnace A furnace introduced on the site of the installation following the publication of these BAT conclusions or a complete rebuild of a furnace following the publication of these BAT conclusions
Normal furnace rebuild
A rebuild between campaigns without a significant change in furnace requirements or technology and in which the furnace frame is not significantly adjusted and the furnace dimensions remain basically unchanged. The refractory of the furnace and, where appropriate, the regenerators are repaired by the full or partial replacement of the material.
Complete furnace rebuild A rebuild involving a major change in the furnace requirements or technology and with major adjustment or replacement of the furnace and associated equipments.

Chapter 5
Manufacture of Glass 327
General considerations Averaging periods and reference conditions for air emissions Unless stated otherwise, emission levels associated with the best available techniques (BAT-AELs) for air emissions given in these BAT conclusions apply under the reference conditions shown in Table 5.1. All values for concentrations in waste gases refer to standard conditions: dry gas, temperature 273.15 K, pressure 101.3 kPa.
For discontinuous measurements
BAT-AELs refer to the average value of three spot samples of at least 30 minutes each; for regenerative furnaces the measuring period should cover a minimum of two firing reversals of the regenerator chambers
For continuous measurements BAT-AELs refer to daily average values
Table 5.1: Reference conditions for BAT-AELs concerning air emissions Activities Unit Reference conditions
Conventional melting furnace in continuous melters mg/Nm3 8 % oxygen by volume
Conventional melting furnace in discontinuous melters mg/Nm3 13 % oxygen by volume
Oxy-fuel-fired furnaces kg/tonne melted glass
The expression of emission levels measured as mg/Nm3 to a reference oxygen concentration is not applicable
Electric furnaces
mg/Nm3
or kg/tonne
melted glass
The expression of emission levels measured as mg/Nm3 to a reference oxygen concentration is not applicable
Frit melting furnaces
mg/Nm3
or kg/tonne
melted frit
Concentrations refer to 15 % oxygen by volume.
When air-gas firing is used, BAT AELs expressed as emission concentration (mg/Nm3)apply.
When only oxy-fuel firing is employed, BAT AELs expressed as specific mass emissions (kg/tonne melted frit) apply.
When oxygen-enriched air-fuel firing is used, BAT AELs expressed as either emission concentration (mg/Nm3) or as specific mass emissions (kg/tonne melted frit) apply
Melting activities
All type of furnaces kg/tonne melted glass
The specific mass emissions refer to one tonne of melted glass
All processes mg/Nm3 No correction for oxygen Non-melting
activities, including
downstream processes
All processes kg/tonne glass The specific mass emissions refer to one tonne of produced glass

Chapter 5
328 Manufacture of Glass
Conversion to reference oxygen concentration The formula for calculating the emissions concentration at a reference oxygen level (see Table 5.1) is shown below.
ER =21 – OR21 – OM
*EM
Where: ER (mg/Nm3): emissions concentration corrected to the reference oxygen level OROR (vol %): reference oxygen level EM (mg/Nm3): emissions concentration referred to the measured oxygen level OMOM (vol %): measured oxygen level.
Conversion from concentrations to specific mass emissions BAT-AELs given in Sections 5.2 to 5.9 as specific mass emissions (kg/tonne melted glass) are based on the calculation reported below except for oxy-fuel fired furnaces and, in a limited number of cases, for electric melting where BAT-AELs given in kg/tonne melted glass were derived from specific reported data.
The calculation procedure used for the conversion from concentrations to specific mass emissions is shown below. Specific mass emission (kg/tonne of melted glass) = conversion factor × emissions concentration (mg/Nm3)
where: conversion factor = (Q/P) × 10–6
with Q = waste gas volume in Nm3/h P = pull rate in tonnes of melted glass/h.
The waste gas volume (Q) is determined by the specific energy consumption, type of fuel, and the oxidant (air, air enriched by oxygen and oxygen with purity depending on the production process). The energy consumption is a complex function of (predominantly) the type of furnace, the type of glass and the cullet percentage. However, a range of factors can influence the relationship between concentration and specific mass flow, including: • type of furnace (air preheating temperature, melting technique) • type of glass produced (energy requirement for melting) • energy mix (fossil fuel/electric boosting) • type of fossil fuel (oil, gas) • type of oxidant (oxygen, air, oxygen-enriched air) • cullet percentage • batch composition • age of the furnace • furnace size. The conversion factors given in Table 5.2 have been used for converting BAT-AELs from concentrations into specific mass emissions.

Chapter 5
Manufacture of Glass 329
The conversion factors have been determined on the basis of energy efficient furnaces and relate only to full air/fuel-fired furnaces.
Table 5.2: Indicative factors used for converting mg/Nm3 into kg/tonne of melted glass based on energy efficient fuel-air furnaces
Sectors Factors to convert mg/Nm3 into kg/tonne of melted glass
Flat glass 2.5 × 10⁻³
General case 1.5 × 10⁻³ Container glass Specific cases (1) Case-by-case study
(often 3.0 × 10⁻³)Continuous filament glass fibre 4.5 × 10⁻³
Soda lime 2.5 × 10⁻³
Domestic glass Specific cases (2) Case-by-case study (between 2.5 and >10 × 10-3; often 3.0 × 10⁻³)
Glass wool 2 × 10⁻³ Mineral wool Stone wool cupola 2.5 × 10⁻³ TV glass (panels) 3 × 10⁻³ TV glass (funnel) 2.5 × 10⁻³ Borosilicate (tube) 4 × 10⁻³
Glass ceramics 6.5 × 10⁻³Special glass
Lighting glass (soda-lime) 2.5 × 10⁻³
Frits Case-by-case study (between 5 – 7.5 × 10⁻³)
(1) Specific cases correspond to less favourable cases (i.e. small special furnaces with a production of generally below 100 tonnes/day and a cullet rate of below 30 %). This category represents only 1 or 2 % of the container glass production.
(2) Specific cases corresponding to less favourable cases and/or non-soda-lime glasses: borosilicates, glass ceramic, crystal glass and, less frequently, lead crystal glass.
Definitions for certain air pollutants For the purpose of these BAT conclusions and for the BAT-AELs reported in Sections 5.2 to 5.9, the following definitions apply: NOX expressed as NO2
The sum of nitrogen oxide (NO) and nitrogen dioxide (NO2)expressed as NO2
SOX expressed as SO2The sum of sulphur dioxide (SO2) and sulphur trioxide (SO3)expressed as SO2
Hydrogen chloride expressed as HCl All gaseous chlorides expressed as HCl
Hydrogen fluoride expressed as HF All gaseous fluorides expressed as HF
Averaging periods for waste water discharges Unless stated otherwise, emission levels associated with the best available techniques (BAT-AELs) for waste water emissions given in these BAT conclusions refer to the average value of a composite sample taken over a period of two hours or 24 hours.

Chapter 5
330 Manufacture of Glass
5.1 General BAT conclusions for the manufacture of glass Unless otherwise stated, the BAT conclusions presented in this section can be applied to all installations. The process-specific BAT included in Sections 5.2 – 5.9 apply in addition to the general BAT mentioned in this section.
5.1.1 Environmental management systems 1. BAT is to implement and adhere to an environmental management system (EMS) that
incorporates all of the following features:
i. commitment of the management, including senior management; ii. definition of an environmental policy that includes the continuous improvement for the
installation by the management; iii. planning and establishing the necessary procedures, objectives and targets, in conjunction
with financial planning and investment; iv. implementation of the procedures paying particular attention to:
(a) structure and responsibility (b) training, awareness and competence (c) communication (d) employee involvement (e) documentation (f) efficient process control (g) maintenance programmes (h) emergency preparedness and response (i) safeguarding compliance with environmental legislation.
v. checking performance and taking corrective action, paying particular attention to:
(a) monitoring and measurement (see also the BAT reference document on the General Principles of Monitoring)
(b) corrective and preventive action (c) maintenance of records (d) independent (where practicable) internal and external auditing in order to determine
whether or not the EMS conforms to planned arrangements and has been properly implemented and maintained;
vi. review of the EMS and its continuing suitability, adequacy and effectiveness by senior
management; vii. requirement to follow the development of cleaner technologies;
viii. consideration for the environmental impacts from the eventual decommissioning of the installation at the stage of designing a new plant, and throughout its operating life;
ix. application of sectoral benchmarking on a regular basis. Applicability The scope (e.g. level of details) and nature of the EMS (e.g. standardised or non-standardised) will generally be related to the nature, scale and complexity of the installation, and the range of environmental impacts it may have.
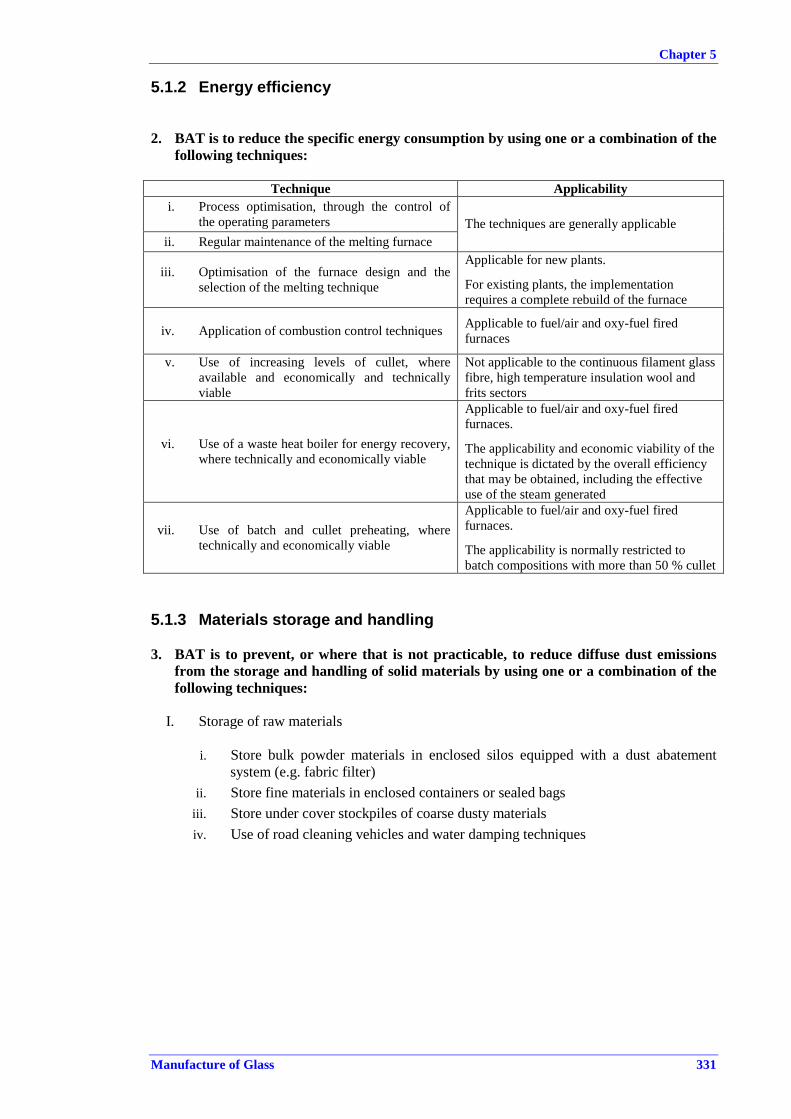
Chapter 5
Manufacture of Glass 331
5.1.2 Energy efficiency
2. BAT is to reduce the specific energy consumption by using one or a combination of the following techniques:
Technique Applicability
i. Process optimisation, through the control of the operating parameters
ii. Regular maintenance of the melting furnace The techniques are generally applicable
iii. Optimisation of the furnace design and the selection of the melting technique
Applicable for new plants.
For existing plants, the implementation requires a complete rebuild of the furnace
iv. Application of combustion control techniques Applicable to fuel/air and oxy-fuel fired furnaces
v. Use of increasing levels of cullet, where available and economically and technically viable
Not applicable to the continuous filament glass fibre, high temperature insulation wool and frits sectors
vi. Use of a waste heat boiler for energy recovery, where technically and economically viable
Applicable to fuel/air and oxy-fuel fired furnaces.
The applicability and economic viability of the technique is dictated by the overall efficiency that may be obtained, including the effective use of the steam generated
vii. Use of batch and cullet preheating, where technically and economically viable
Applicable to fuel/air and oxy-fuel fired furnaces.
The applicability is normally restricted to batch compositions with more than 50 % cullet
5.1.3 Materials storage and handling 3. BAT is to prevent, or where that is not practicable, to reduce diffuse dust emissions
from the storage and handling of solid materials by using one or a combination of the following techniques:
I. Storage of raw materials
i. Store bulk powder materials in enclosed silos equipped with a dust abatement
system (e.g. fabric filter) ii. Store fine materials in enclosed containers or sealed bags
iii. Store under cover stockpiles of coarse dusty materials iv. Use of road cleaning vehicles and water damping techniques

Chapter 5
332 Manufacture of Glass
II. Handling of raw materials
Technique Applicability i. For materials which are transported by above
ground, use enclosed conveyors to prevent material loss
ii. Where pneumatic conveying is used, apply a sealed system equipped with a filter to clean the transport air before release
The techniques are generally applicable
iii. Moistening of the batch
The use of this technique is limited by the negative consequences on the furnace energy efficiency. Restrictions may apply to some batch formulations, in particular for borosilicate glass production
iv. Application of a slightly negative pressure within the furnace
Applicable only as an inherent aspect of operation (i.e. melting furnaces for frits production) due to a detrimental impact on furnace energy efficiency
v. Use of raw materials that do not cause decrepitation phenomena (mainly dolomite and limestone). These phenomena consist of minerals that ‘crackle’when exposed to heat, with a consequent potential increase of dust emissions
Applicable within the constraints associated with the availability of raw materials
vi. Use of an extraction which vents to a filter system in processes where dust is likely to be generated (e.g. bag opening, frits batch mixing, fabric filter dust disposal, cold-top melters)
vii. Use of enclosed screw feeders
The techniques are generally applicable
viii. Enclosure of feed pockets Generally applicable. Cooling may be necessary to avoid damage to the equipment
4. BAT is to prevent, or where that is not practicable, to reduce diffuse gaseous emissions from the storage and handling of volatile raw materials by using one or a combination of the following techniques:
i. Use of tank paint with low solar absorbency for bulk storage subject to temperature
changes due to solar heating.
ii. Control of temperature in the storage of volatile raw materials.
iii. Tank insulation in the storage of volatile raw materials.
iv. Inventory management
v. Use of floating roof tanks in the storage of large quantities of volatile petroleum products.
vi. Use of vapour return transfer systems in the transfer of volatile fluids (e.g. from tank trucks to storage tank).
vii. Use of bladder roof tanks in the storage of liquid raw materials.
viii. Use of pressure/vacuum valves in tanks designed to withstand pressure fluctuations.
ix. Application of a release treatment (e.g. adsorption, absorption, condensation) in the storage of hazardous materials.
x. Application of subsurface filling in the storage of liquids that tend to foam.

Chapter 5
Manufacture of Glass 333
5.1.4 General primary techniques 5. BAT is to reduce energy consumption and emissions to air by carrying out a constant
monitoring of the operational parameters and a programmed maintenance of the melting furnace.
Technique Applicability The technique consists of a series of monitoring and maintenance operations which can be used individually or in combination appropriate to the type of furnace, with the aim of minimising the ageing effects on the furnace, such as sealing the furnace and burner blocks, keep the maximum insulation, control the stabilised flame conditions, control the fuel/air ratio, etc.
Applicable to regenerative, recuperative, and oxy-fuel fired furnaces. The applicability to other types of furnaces requires an installation-specific assessment
6. BAT is to carry out a careful selection and control of all substances and raw materials entering the melting furnace in order to reduce or prevent emissions to air by using one or a combination of the following techniques.
Technique Applicability Use of raw materials and external cullet with low levels of impurities (e.g. metals, chlorides, fluorides)
Use of alternative raw materials (e.g. less volatile)
Use of fuels with low metal impurities
Applicable within the constraints of the type of glass produced at the installation and the availability of raw materials and fuels
7. BAT is to carry out monitoring of emissions and/or other relevant process parameters on a regular basis, including the following:
Technique Applicability i. Continuous monitoring of critical process parameters to ensure
process stability, e.g. temperature, fuel feed and airflow ii. Regular monitoring of process parameters to prevent/reduce
pollution, e.g. O2 content of the combustion gases to control the fuel/air ratio.
iii. Continuous measurements of dust, NOX and SO2 emissions or discontinuous measurements at least twice per year, associated with the control of surrogate parameters to ensure that the treatment system is working properly between measurements
The techniques are generally applicable
iv. Continuous or regular periodic measurements of NH3 emissions, when selective catalytic reduction (SCR) or selective non-catalytic reduction (SNCR) techniques are applied
v. Continuous or regular periodic measurements of CO emissions when primary techniques or chemical reduction by fuel techniques are applied for NOX emissions reductions or partial combustion may occur.
Applicable to conventional air/fuel fired melting furnaces
vi. Regular periodic measurements of emissions of HCl, HF, CO and metals, in particular when raw materials containing such substances are used or partial combustion may occur
vii. Continuous monitoring of surrogate parameters to ensure that the waste gas treatment system is working properly and that the emission levels are maintained between discontinuous measurements. The monitoring of surrogate parameters includes: reagent feed, temperature, water feed, voltage, dust removal, fan speed, etc.
The techniques are generally applicable

Chapter 5
334 Manufacture of Glass
8. BAT is to operate the waste gas treatment systems during normal operating conditions at optimal capacity and availability in order to prevent or reduce emissions
Applicability Special procedures can be defined for specific operating conditions, in particular:
i. during start-up and shutdown operations ii. during other special operations which could affect the proper functioning of the systems
(e.g. regular and extraordinary maintenance work and cleaning operations of the furnace and/or of the waste gas treatment system, or severe production change)
iii. in the case of insufficient waste gas flow or temperature which prevents the use of the system at full capacity.
9. BAT is to limit carbon monoxide (CO) emissions from the melting furnace, when applying primary techniques or chemical reduction by fuel, for the reduction of NOX emissions
Technique Applicability Primary techniques for the reduction of NOX emissions are based on combustion modifications (e.g. reduction of air/fuel ratio, staged combustion, low-NOX burners, etc.). Chemical reduction by fuel consists of the addition of hydrocarbon fuel to the waste gas stream to reduce the NOX formed in the furnace. The increase in CO emissions due to the application of these techniques can be limited by a careful control of the operational parameters
Applicable to conventional air/fuel fired furnaces.
Table 5.3 BAT-AELs for carbon monoxide emissions from melting furnaces Parameter BAT-AEL
Carbon monoxide, expressed as CO <100 mg/Nm3
10. BAT is to limit ammonia (NH3) emissions, when applying selective catalytic reduction (SCR) or selective non-catalytic reduction (SNCR) techniques for a high efficiency NOX emissions reduction
Technique Applicability The technique consists of adopting and maintaining suitable operating conditions of the SCR or SNCR waste gas treatment systems, with the aim of limiting emissions of unreacted ammonia
Applicable to melting furnaces fitted with SCR or SNCR
Table 5.4: BAT-AELs for ammonia emissions, when SCR or SNCR techniques are applied Parameter BAT-AELs (1)
Ammonia, expressed as NH3 <5 – 30 mg/Nm3
(1) The higher levels are associated with higher inlet NOX concentrations, higher reduction rates and the ageing of the catalyst.

Chapter 5
Manufacture of Glass 335
11. BAT is to reduce boron emissions from the melting furnace, when boron compounds are used in the batch formulation, by using one or a combination of the following techniques:
Technique (1) Applicability i. Operation of a filtration system at a suitable
temperature for enhancing the separation of boron compounds in the solid state, taking into account that some boric acid species may be present in the flue-gas as gaseous compounds at temperatures below 200 °C, but also as low as 60 °C
The applicability to existing plants may be limited by technical constraints associated with the position and characteristics of the existing filter system
ii. Use of dry or semi-dry scrubbing in combination with a filtration system
The applicability may be limited by a decreased removal efficiency of other gaseous pollutants (SOX,HCl, HF) caused by the deposition of boron compounds on the surface of the dry alkaline reagent
iii. Use of wet scrubbing The applicability to existing plants may be limited by the need of a specific waste water treatment
(1) A description of the techniques is given in Sections 5.10.1, 5.10.4 and 5.10.6.
Monitoring The monitoring of boron emissions should be carried out according to a specific methodology which allows measurement of both solid and gaseous forms and to determine the effective removal of these species from the flue gases.
5.1.5 Emissions to water from glass manufacturing processes
12. BAT is to reduce water consumption by using one or a combination of the following techniques:
Technique Applicability
i. Minimisation of spillages and leaks The technique is generally applicable
ii. Reuse of cooling and cleaning waters after purging
The technique is generally applicable. Recirculation of scrubbing water is applicable to most scrubbing systems; however, periodic discharge and replacement of the scrubbing medium may be necessary
iii. Operate a quasi-closed loop water system as far as technically and economically feasible
The applicability of this technique may be limited by the constraints associated with the safety management of the production process. In particular:
• open circuit cooling may be used when safety issues require for it (e.g. incidents when large quantities of glass need to be cooled)
• water used in some specific process (e.g. downstream activities in the continuous filament glass fibre sector, acid polishing in the domestic and special glass sectors, etc.) may have to be discharged in total or in part to the waste water treatment system

Chapter 5
336 Manufacture of Glass
13. BAT is to reduce the emission load of pollutants in the waste water discharges by using one or a combination of the following waste water treatment systems:
Technique Applicability i. Standard pollution control techniques, such as
settlement, screening, skimming, neutralisation, filtration, aeration, precipitation, coagulation and flocculation, etc.
Standard good practice techniques to control emissions from storage of liquid raw materials and intermediates, such as containments, inspection/testing of tanks, overfill protection, etc.
The techniques are generally applicable
ii. Biological treatment systems, such as activated sludge, biofiltration to remove/degrade the organic compounds
The applicability is limited to the sectors which use organic substances in the production process (e.g. continuous filament glass fibre and mineral wool sectors)
iii. Discharge to municipal waste water treatment plants
Applicable to installations where further reduction of pollutants is necessary
iv. External reuse of waste waters The applicability is generally limited to the frits sector (possible reuse in the ceramic industry)
Table 5.5: BAT-AELs for waste water discharges to surface waters from the manufacture of glass
Parameter (1) Unit BAT-AEL (2)(composite sample)
pH - 6.5 – 9 Total suspended solids mg/l <30 Chemical oxygen demand (COD) mg/l <5 – 130 (3)Sulphates, expressed as SO4
2- mg/l <1000 Fluorides, expressed as F- mg/l <6 (4) Total hydrocarbons mg/l <15 (5)Lead, expressed as Pb mg/l <0.05 – 0.3(6)Antimony, expressed as Sb mg/l <0.5 Arsenic, expressed as As mg/l <0.3 Barium, expressed as Ba mg/l <3.0 Zinc, expressed as Zn mg/l <0.5 Copper, expressed as Cu mg/l <0.3 Chromium, expressed as Cr mg/l <0.3 Cadmium, expressed as Cd mg/l <0.05 Tin, expressed as Sn mg/l <0.5 Nickel, expressed as Ni mg/l <0.5 Ammonia, expressed as NH4 mg/l <10 Boron, expressed as B mg/l <1 – 3 Phenol mg/l <1 (1) The relevance of the pollutants listed in the table depends on the sector of the glass industry and on the different
activities carried out at the plant. (2) The levels refer to a composite sample taken over a time period of two hours or 24 hours. (3) For the continuous filament glass fibre sector, BAT-AEL is <200 mg/l. (4) The level refers to treated water coming from activities involving acid polishing. (5) In general, total hydrocarbons are composed of mineral oils. (6) The higher level of the range is associated with downstream processes for the production of lead crystal glass.
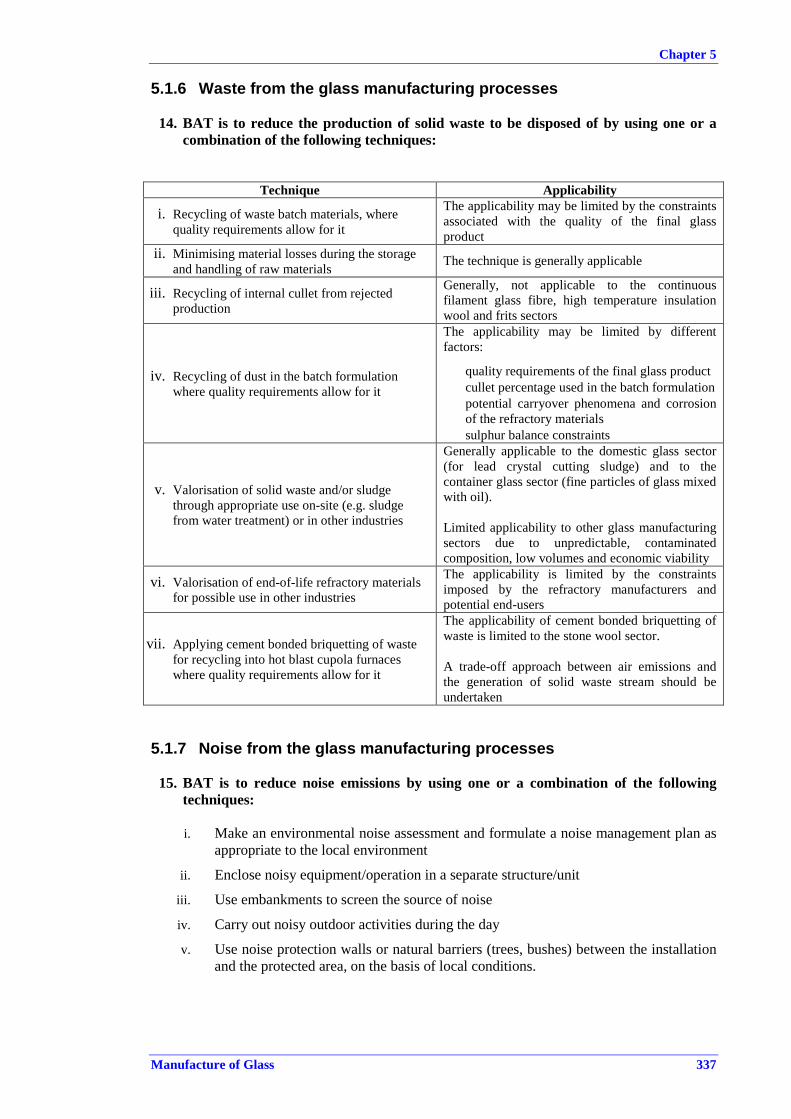
Chapter 5
Manufacture of Glass 337
5.1.6 Waste from the glass manufacturing processes
14. BAT is to reduce the production of solid waste to be disposed of by using one or a combination of the following techniques:
Technique Applicability i. Recycling of waste batch materials, where
quality requirements allow for it
The applicability may be limited by the constraints associated with the quality of the final glass product
ii. Minimising material losses during the storage and handling of raw materials The technique is generally applicable
iii. Recycling of internal cullet from rejected production
Generally, not applicable to the continuous filament glass fibre, high temperature insulation wool and frits sectors
iv. Recycling of dust in the batch formulation where quality requirements allow for it
The applicability may be limited by different factors:
• quality requirements of the final glass product • cullet percentage used in the batch formulation • potential carryover phenomena and corrosion
of the refractory materials • sulphur balance constraints
v. Valorisation of solid waste and/or sludge through appropriate use on-site (e.g. sludge from water treatment) or in other industries
Generally applicable to the domestic glass sector (for lead crystal cutting sludge) and to the container glass sector (fine particles of glass mixed with oil). Limited applicability to other glass manufacturing sectors due to unpredictable, contaminated composition, low volumes and economic viability
vi. Valorisation of end-of-life refractory materials for possible use in other industries
The applicability is limited by the constraints imposed by the refractory manufacturers and potential end-users
vii. Applying cement bonded briquetting of waste for recycling into hot blast cupola furnaces where quality requirements allow for it
The applicability of cement bonded briquetting of waste is limited to the stone wool sector. A trade-off approach between air emissions and the generation of solid waste stream should be undertaken
5.1.7 Noise from the glass manufacturing processes
15. BAT is to reduce noise emissions by using one or a combination of the following techniques:
i. Make an environmental noise assessment and formulate a noise management plan as
appropriate to the local environment
ii. Enclose noisy equipment/operation in a separate structure/unit
iii. Use embankments to screen the source of noise
iv. Carry out noisy outdoor activities during the day
v. Use noise protection walls or natural barriers (trees, bushes) between the installation and the protected area, on the basis of local conditions.

Chapter 5
338 Manufacture of Glass
5.2 BAT conclusions for container glass manufacturing Unless otherwise stated, the BAT conclusions presented in this section can be applied to all container glass manufacturing installations.
5.2.1 Dust emissions from melting furnaces
16. BAT is to reduce dust emissions from the waste gases of the melting furnace by applying a flue-gas cleaning system such as an electrostatic precipitator or a bag filter.
Technique (1) Applicability The flue-gas cleaning systems consist of end-of-pipe techniques based on the filtration of all materials that are solid at the point of measurement
The technique is generally applicable
(1) A description of filtration systems (i.e. electrostatic precipitator, bag filter) is given in Section 5.10.1.
Table 5.6: BAT-AELs for dust emissions from the melting furnace in the container glass sector
BAT-AEL Parameter
mg/Nm3 kg/tonne melted glass (1)
Dust <10 – 20 <0.015 – 0.06
(1) The conversion factors of 1.5 x 10⁻³and 3 x 10⁻³ have been used for the determination of the lower and higher value of the range respectively.
5.2.2 Nitrogen oxides (NOX) from melting furnaces
17. BAT is to reduce NOX emissions from the melting furnace by using one or a combination of the following techniques:
I. primary techniques, such as:
Technique (1) Applicability i. Combustion modifications
(a) Reduction of air/fuel ratio
Applicable to air/fuel conventional furnaces.
Full benefits are achieved at normal or complete furnace rebuild, when combined with optimum furnace design and geometry
(b) Reduced combustion air temperature
Applicable only under installation-specific circumstances due to a lower furnace efficiency and higher fuel demand (i.e. use of recuperative furnaces in place of regenerative furnaces)
(c) Staged combustion: • Air staging • Fuel staging
Fuel staging is applicable to most conventional air/fuel furnaces.
Air staging has very limited applicability due to its technical complexity
(d) Flue-gas recirculation The applicability of this technique is limited to the use of special burners with automatic recirculation of the waste gas

Chapter 5
Manufacture of Glass 339
(e) Low-NOX burners
The technique is generally applicable. The achieved environmental benefits are generally lower for applications to cross-fired, gas-fired furnaces due to technical constraints and a lower degree of flexibility of the furnace. Full benefits are achieved at normal or complete furnace rebuild, when combined with optimum furnace design and geometry
(f) Fuel choice The applicability is limited by the constraints associated with the availability of different types of fuel, which may be impacted by the energy policy of the Member State
ii. Special furnace design
The applicability is limited to batch formulations that contain high levels of external cullet (>70 %). The application requires a complete rebuild of the melting furnace. The shape of the furnace (long and narrow) may pose space restrictions
iii. Electric melting
Not applicable for large volume glass productions (>300 tonnes/day).
Not applicable for productions requiring large pull variations. The implementation requires a complete furnace rebuild
iv. Oxy-fuel melting The maximum environmental benefits are achieved for applications at the time of a complete furnace rebuild
(1) A description of the techniques is given in Section 5.10.2.
II. secondary techniques, such as:
Technique (1) Applicability
i. Selective catalytic reduction (SCR)
The application may require an upgrade of the dust abatement system in order to guarantee a dust concentration of below 10 – 15 mg/Nm3 and a desulphurisation system for the removal of SOX emissions. Due to the optimum operating temperature window, the applicability is limited to the use of electrostatic precipitators. In general, the technique is not used with a bag filter system because the low operating temperature, in the range of 180 – 200 °C, would require reheating of the waste gases. The implementation of the technique may require significant space availability
ii. Selective non-catalytic reduction(SNCR)
The technique is applicable to recuperative furnaces. Very limited applicability to conventional regenerative furnaces, where the correct temperature window is difficult to access or does not allow a good mixing of the flue-gases with the reagent. It may be applicable to new regenerative furnaces equipped with split regenerators; however, the temperature window is difficult to maintain due to the reversal of fire between the chambers that causes a cyclical temperature change
(1) A description of the techniques is given in Section 5.10.2.

Chapter 5
340 Manufacture of Glass
Table 5.7: BAT-AELs for NOX emissions from the melting furnace in the container glass sector
BAT-AEL Parameter BAT
mg/Nm3 kg/tonne melted glass (1)
Combustion modifications, special furnace designs (2) (3) 500 – 800 0.75 – 1.2
Electric melting <100 <0.3 Oxy-fuel melting (4) Not applicable <0.5 – 0.8
NOX expressed as NO2
Secondary techniques <500 <0.75 (1) The conversion factor reported in Table 5.2 for general cases (1.5 × 10⁻³ ) has been applied, with the exception of
electric melting (specific cases: 3 × 10⁻³). (2) The lower value refers to the use of special furnace designs, where applicable. (3) These values should be reconsidered in the occasion of a normal or complete rebuild of the melting furnace. (4) The achievable levels depend on the quality of the natural gas and oxygen available (nitrogen content).
18. When nitrates are used in the batch formulation and/or special oxidising combustion conditions are required in the melting furnace for ensuring the quality of the final product, BAT is to reduce NOX emissions by minimising the use of these raw materials, in combination with primary or secondary techniques
The BAT-AELs are set out in Table 5.7. If nitrates are used in the batch formulation for short campaigns or for melting furnaces with a capacity of <100 t/day, the BAT-AEL is set out in Table 5.8.
Technique (1) Applicability Primary techniques:
• Minimising the use of nitrates in the batch formulation
The use of nitrates is applied for very high quality products (i.e. flacconage, perfume bottles and cosmetic containers). Effective alternative materials are sulphates, arsenic oxides, cerium oxide. The application of process modifications (e.g. special oxidising combustion conditions) represents an alternative to the use of nitrates
The substitution of nitrates in the batch formulation may be limited by the high costs and/or higher environmental impact of the alternative materials
(1) A description of the techniques is given in Section 5.10.2.
Table 5.8: BAT-AEL for NOX emissions from the melting furnace in the container glass sector, when nitrates are used in the batch formulation and/or special oxidising combustion conditions in cases of short campaigns or for melting furnaces with a capacity of <100 t/day
BAT-AEL Parameter BAT
mg/Nm3 kg/tonne melted glass (1)
NOX expressed as NO2
Primary techniques <1000 <3
(1) The conversion factor reported in Table 5.2 for specific cases (3 × 10⁻³) has been applied.

Chapter 5
Manufacture of Glass 341
5.2.3 Sulphur oxides (SOX) from melting furnaces
19. BAT is to reduce SOX emissions from the melting furnace by using one or a combination of the following techniques:
Technique (1) Applicability i. Dry or semi-dry scrubbing, in combination
with a filtration system
The technique is generally applicable
ii. Minimisation of the sulphur content in the batch formulation and optimisation of the sulphur balance
The minimisation of the sulphur content in the batch formulation is generally applicable within the constraints of quality requirements of the final glass product. The application of sulphur balance optimisation requires a trade-off approach between the removal of SOX emissions and the management of the solid waste (filter dust). The effective reduction of SOX emissions depends on the retention of sulphur compounds in the glass which may vary significantly depending on the glass type
iii. Use of low sulphur content fuels The applicability may be limited by the constraints associated with the availability of low sulphur fuels, which may be impacted by the energy policy of the Member State
(1) A description of the techniques is given in Section 5.10.3.
Table 5.9: BAT-AELs for SOX emissions from the melting furnace in the container glass sector
BAT-AEL (1) (2)Parameter Fuel
mg/Nm3 kg/tonne melted glass (3)
Natural gas <200 – 500 <0.3 – 0.75 SOXexpressed as SO2
Fuel oil (4) <500 – 1200 <0.75 – 1.8 (1) For special types of coloured glasses (e.g. reduced green glasses), concerns related to the achievable emission
levels may require investigating the sulphur balance. Values reported in the table may be difficult to achieve in combination with filter dust recycling and the rate of recycling of external cullet.
(2) The lower levels are associated with conditions where the reduction of SOX is a high priority over a lower production of solid waste corresponding to the sulphate-rich filter dust. (3) The conversion factor reported in Table 5.2 for general cases (1.5 x 10⁻³) has been applied. (4) The associated emission levels are related to the use of 1 % sulphur fuel oil in combination with secondary abatement techniques.
5.2.4 Hydrogen chloride (HCl) and hydrogen fluoride (HF) from melting furnaces
20. BAT is to reduce HCl and HF emissions from the melting furnace (possibly combined
with flue-gases from hot-end coating activities) by using one or a combination of the following techniques:
Technique (1) Applicability i. Selection of raw materials for the batch
formulation with a low content of chlorine and fluorine
The applicability may be limited by the constraints of the type of glass produced at the installation and the availability of raw materials
ii. Dry or semi-dry scrubbing, in combination with a filtration system The technique is generally applicable
(1) A description of the techniques is given in Section 5.10.4.

Chapter 5
342 Manufacture of Glass
Table 5.10: BAT-AELs for HCl and HF emissions from the melting furnace in the container glass sector
BAT-AEL Parameter
mg/Nm3 kg/tonne melted glass (1)
Hydrogen chloride, expressed as HCl (2) <10 – 20 <0.02 – 0.03
Hydrogen fluoride, expressed as HF <1 – 5 <0.001 – 0.008 (1) The conversion factor for general cases, reported in Table 5.2 (1.5 x 10⁻³) has been applied. (2) The higher levels are associated with the simultaneous treatment of flue-gases from hot-end coating operations.
5.2.5 Metals from melting furnaces
21. BAT is to reduce metal emissions from the melting furnace by using one or a combination of the following techniques:
Technique (1) Applicability i. Selection of raw materials for the batch formulation with a low
content of metals
ii. Minimising the use of metal compounds in the batch formulation, where colouring and decolourising of glass is needed, subject to consumer glass quality requirements
The applicability may be limited by the constraints imposed by the type of glass produced at the installation and the availability of the raw materials
iii. Applying a filtration system (bag filter or electrostatic precipitator) iv. Applying a dry or semi-dry scrubbing, in combination with a
filtration system
The techniques are generally applicable
(1) A description of the techniques is given in Section 5.10.5.
Table 5.11: BAT-AELs for metal emissions from the melting furnace in the container glass sector
BAT-AEL (1) (2) (3)
Parameter mg/Nm3 kg/tonne
melted glass (4)
Σ (As, Co, Ni, Cd, Se, CrVI) <0.2 – 1 (5) <0.3 – 1.5 x 10⁻³
Σ (As, Co, Ni, Cd, Se, CrVI, Sb, Pb, CrIII, Cu, Mn, V, Sn) <1 – 5 <1.5 – 7.5 x 10⁻³
(1) The levels refer to the sum of metals present in the flue-gases in both solid and gaseous phases. (2) The lower levels are BAT-AELs when metal compounds are not intentionally used in the batch formulation. (3) The upper levels are associated with the use of metals for colouring or decolourising the glass, or when the flue-
gases from the hot-end coating operations are treated together with the melting furnace emissions. (4) The conversion factor for general cases, reported in Table 5.2 (1.5 x 10⁻³) has been applied. (5) In specific cases, when high quality flint glass is produced requiring higher amounts of selenium for decolourising
(depending on the raw materials), higher values are reported, up to 3 mg/Nm3.
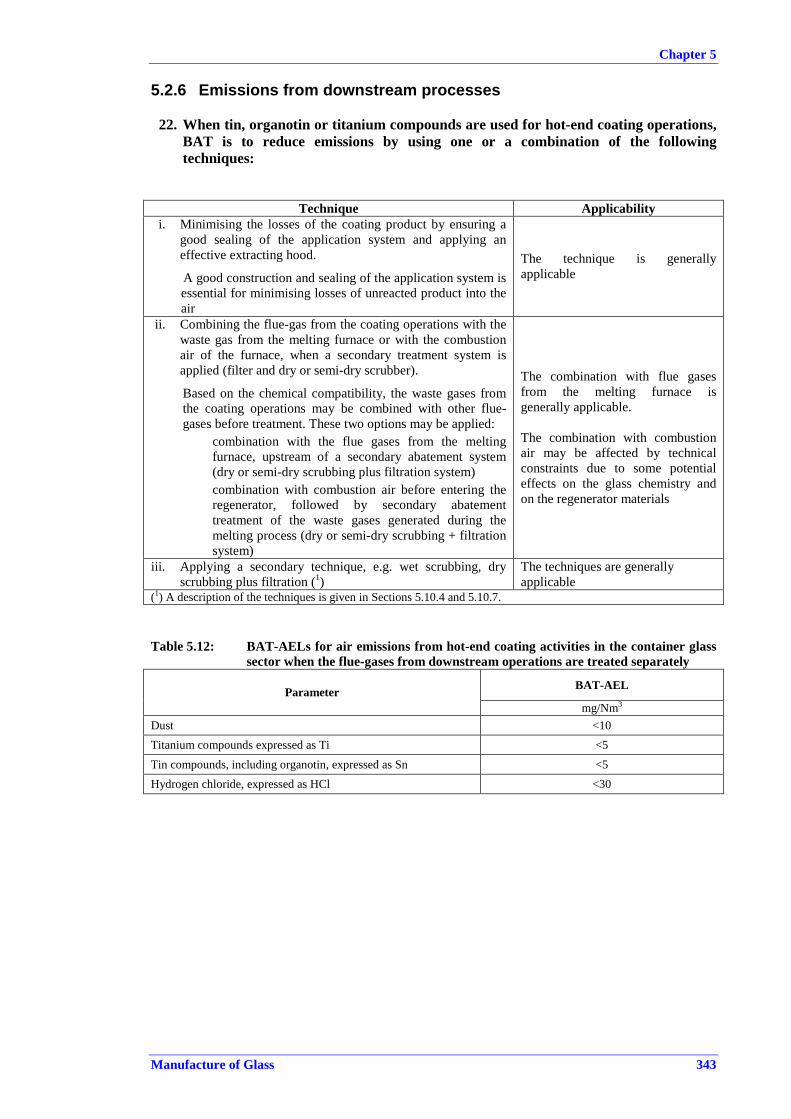
Chapter 5
Manufacture of Glass 343
5.2.6 Emissions from downstream processes
22. When tin, organotin or titanium compounds are used for hot-end coating operations, BAT is to reduce emissions by using one or a combination of the following techniques:
Technique Applicability i. Minimising the losses of the coating product by ensuring a
good sealing of the application system and applying an effective extracting hood.
A good construction and sealing of the application system is essential for minimising losses of unreacted product into the air
The technique is generally applicable
ii. Combining the flue-gas from the coating operations with the waste gas from the melting furnace or with the combustion air of the furnace, when a secondary treatment system is applied (filter and dry or semi-dry scrubber).
Based on the chemical compatibility, the waste gases from the coating operations may be combined with other flue-gases before treatment. These two options may be applied: • combination with the flue gases from the melting
furnace, upstream of a secondary abatement system (dry or semi-dry scrubbing plus filtration system)
• combination with combustion air before entering the regenerator, followed by secondary abatement treatment of the waste gases generated during the melting process (dry or semi-dry scrubbing + filtration system)
The combination with flue gases from the melting furnace is generally applicable. The combination with combustion air may be affected by technical constraints due to some potential effects on the glass chemistry and on the regenerator materials
iii. Applying a secondary technique, e.g. wet scrubbing, dry scrubbing plus filtration (1)
The techniques are generally applicable
(1) A description of the techniques is given in Sections 5.10.4 and 5.10.7.
Table 5.12: BAT-AELs for air emissions from hot-end coating activities in the container glass sector when the flue-gases from downstream operations are treated separately
BAT-AEL Parameter mg/Nm3
Dust <10 Titanium compounds expressed as Ti <5
Tin compounds, including organotin, expressed as Sn <5 Hydrogen chloride, expressed as HCl <30

Chapter 5
344 Manufacture of Glass
23. When SO3 is used for surface treatment operations, BAT is to reduce SOX emissions by using one or a combination of the following techniques:
Technique (1) Applicability i. Minimising the product losses by ensuring a good sealing of
the application system
A good construction and maintenance of the application system is essential for minimising the losses of unreacted product into the air
ii. Applying a secondary technique, e.g. wet scrubbing
The techniques are generally applicable
(1) A description of the techniques is given in Section 5.10.6.
Table 5.13: BAT-AEL for SOX emissions from downstream activities when SO3 is used for surface treatment operations in the container glass sector, when treated separately
BAT-AEL Parameter mg/Nm3
SOX, expressed as SO2 <100 – 200

Chapter 5
Manufacture of Glass 345
5.3 BAT conclusions for flat glass manufacturing Unless otherwise stated, the BAT conclusions presented in this section can be applied to all flat glass manufacturing installations.
5.3.1 Dust emissions from melting furnaces
24. BAT is to reduce dust emissions from the waste gases of the melting furnace by applying an electrostatic precipitator or a bag filter system
A description of the techniques is given in Section 5.10.1. Table 5.14: BAT-AELs for dust emissions from the melting furnace in the flat glass sector
BAT-AEL Parameter mg/Nm3 kg/tonne melted glass (1)
Dust <10 – 20 <0.025 – 0.05
(1) The conversion factor reported in Table 5.2 (2.5 x 10⁻³) has been applied.
5.3.2 Nitrogen oxides (NOX) from melting furnaces
25. BAT is to reduce NOX emissions from the melting furnace by using one or a combination of the following techniques:
I. primary techniques, such as:
Technique (1) Applicability i. Combustion modifications
(a) Reduction of air/fuel ratio
Applicable to air/fuel conventional furnaces. Full benefits are achieved at normal or complete furnace rebuild, when combined with optimum furnace design and geometry
(b) Reduced combustion air temperature
The applicability is restricted to small capacity furnaces for the production of specialty flat glass and under installation-specific circumstances, due to a lower furnace efficiency and higher fuel demand (i.e. use of recuperative furnaces in place of regenerative furnaces)
(c) Staged combustion: ◦ Air staging ◦ Fuel staging
Fuel staging is applicable to most conventional air/fuel furnaces. Air staging has very limited applicability due to its technical complexity
(d) Flue-gas recirculation The applicability of this technique is limited to the use of special burners with automatic recirculation of the waste gas
(e) Low-NOX burners
The technique is generally applicable. The achieved environmental benefits are generally lower for applications to cross-fired, gas-fired furnaces due to technical constraints and a lower degree of flexibility of the furnace. Full benefits are achieved at normal or complete furnace rebuild, when combined with optimum furnace design and geometry

Chapter 5
346 Manufacture of Glass
(f) Fuel choice
The applicability is limited by the constraints associated with the availability of different types of fuel, which may be impacted by the energy policy of the Member State
ii. Fenix process
Based on the combination of a number of primary techniques for the optimisation of the combustion of cross-fired regenerative float furnaces. The main features are: ◦ reduction of excess air ◦ suppression of hotspots and
homogenisation of the flame temperatures
◦ controlled mixing of the fuel and combustion air
The applicability is limited to cross-fired regenerative furnaces. Applicable to new furnaces. For existing furnaces, the technique requires being directly integrated during the design and construction of the furnace, at a complete furnace rebuild
iii. Oxy-fuel melting The maximum environmental benefits are achieved for applications at the time of a complete furnace rebuild
(1) A description of the techniques is given in Section 5.10.2.
II. secondary techniques, such as:
Technique (1) Applicability
i. Chemical reduction by fuel Applicable to regenerative furnaces. The applicability is limited by an increased fuel consumption and consequent environmental and economic impact
ii. Selective catalytic reduction (SCR)
The application may require an upgrade of the dust abatement system in order to guarantee a dust concentration of below 10 – 15 mg/Nm3 and a desulphurisation system for the removal of SOX emissions Due to the optimum operating temperature window, the applicability is limited to the use of electrostatic precipitators. In general, the technique is not used with a bag filter system because the low operating temperature, in the range of 180 – 200 °C, would require reheating of the waste gases. The implementation of the technique may require significant space availability
(1) A description of the techniques is given in Section 5.10.2.
Table 5.15: BAT-AELs for NOX emissions from the melting furnace in the flat glass sector BAT-AEL (1)
Parameter BAT mg/Nm3 kg/tonne
melted glass (2)Combustion modifications, Fenix process (3) 700 – 800 1.75 – 2.0
Oxy-fuel melting (4) Not applicable <1.25 – 2.0 NOX expressed as NO2
Secondary techniques (5) 400 – 700 1.0 – 1.75
(1) Higher emission levels are expected when nitrates are used occasionally for the production of special glasses. (2) The conversion factor reported in Table 5.2 (2.5 x 10⁻³) has been applied. (3) The lower levels of the range are associated with the application of the Fenix process. (4) The achievable levels depend on the quality of the natural gas and oxygen available (nitrogen content). (5) The higher levels of the range are associated with existing plants until a normal or complete rebuild of the melting
furnace. The lower levels are associated with newer/retrofitted plants.
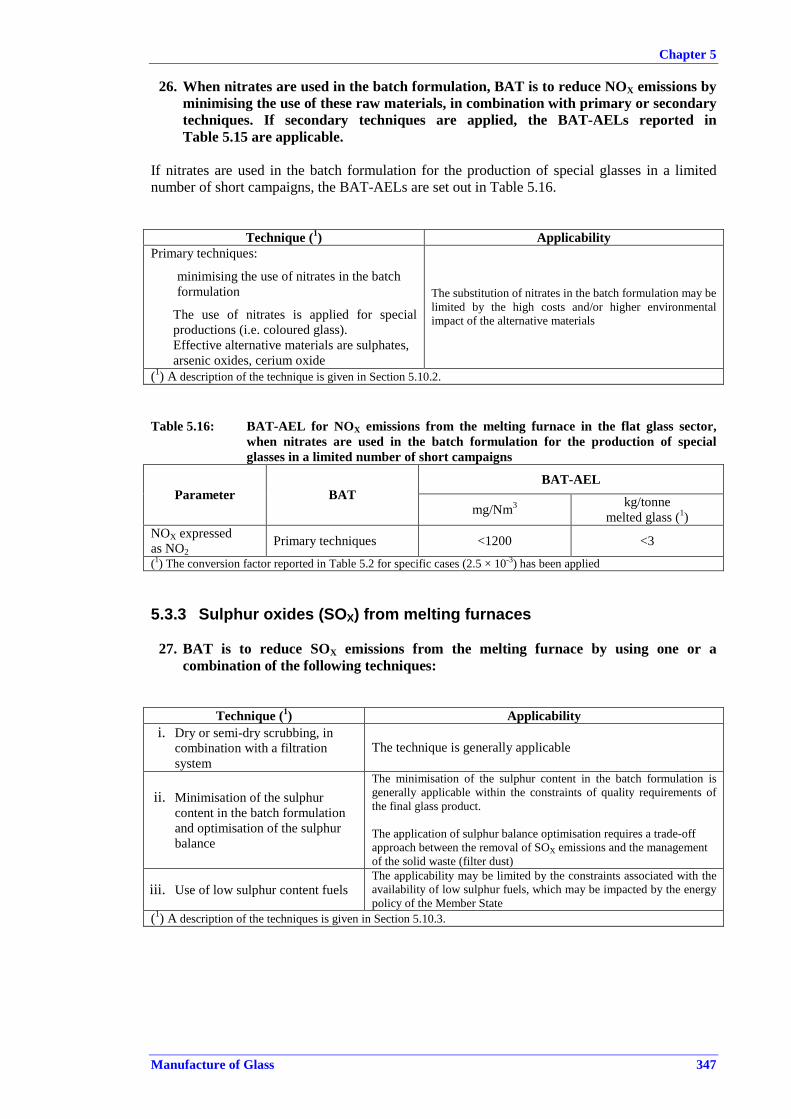
Chapter 5
Manufacture of Glass 347
26. When nitrates are used in the batch formulation, BAT is to reduce NOX emissions by minimising the use of these raw materials, in combination with primary or secondary techniques. If secondary techniques are applied, the BAT-AELs reported in Table 5.15 are applicable.
If nitrates are used in the batch formulation for the production of special glasses in a limited number of short campaigns, the BAT-AELs are set out in Table 5.16.
Technique (1) Applicability Primary techniques:
minimising the use of nitrates in the batch formulation
The use of nitrates is applied for special productions (i.e. coloured glass). Effective alternative materials are sulphates, arsenic oxides, cerium oxide
The substitution of nitrates in the batch formulation may be limited by the high costs and/or higher environmental impact of the alternative materials
(1) A description of the technique is given in Section 5.10.2.
Table 5.16: BAT-AEL for NOX emissions from the melting furnace in the flat glass sector, when nitrates are used in the batch formulation for the production of special glasses in a limited number of short campaigns
BAT-AEL Parameter BAT
mg/Nm3 kg/tonne melted glass (1)
NOX expressed as NO2
Primary techniques <1200 <3
(1) The conversion factor reported in Table 5.2 for specific cases (2.5 × 10⁻³) has been applied
5.3.3 Sulphur oxides (SOX) from melting furnaces
27. BAT is to reduce SOX emissions from the melting furnace by using one or a combination of the following techniques:
Technique (1) Applicability i. Dry or semi-dry scrubbing, in
combination with a filtration system
The technique is generally applicable
ii. Minimisation of the sulphur content in the batch formulation and optimisation of the sulphur balance
The minimisation of the sulphur content in the batch formulation is generally applicable within the constraints of quality requirements of the final glass product. The application of sulphur balance optimisation requires a trade-off approach between the removal of SOX emissions and the management of the solid waste (filter dust)
iii. Use of low sulphur content fuels The applicability may be limited by the constraints associated with the availability of low sulphur fuels, which may be impacted by the energy policy of the Member State
(1) A description of the techniques is given in Section 5.10.3.

Chapter 5
348 Manufacture of Glass
Table 5.17: BAT-AELs for SOX emissions from the melting furnace in the flat glass sector BAT-AEL (1)
Parameter Fuel mg/Nm3 kg/tonne
melted glass (2)Natural gas <300 – 500 <0.75 – 1.25 SOx expressed
as SO2 Fuel oil (3) (4) 500 – 1300 1.25 – 3.25 (1) The lower levels are associated with conditions where the reduction of SOX has a high priority over a lower production of
solid waste corresponding to the sulphate-rich filter dust. (2) The conversion factor reported in Table 5.2 (2.5 x 10⁻³) has been applied. (3) The associated emission levels are related to the use of 1 % sulphur fuel oil in combination with secondary abatement
techniques. (4) For large flat glass furnaces, concerns related to the achievable emission levels may require investigating the sulphur
balance. Values reported in the table may be difficult to achieve in combination with filter dust recycling.
5.3.4 Hydrogen chloride (HCl) and hydrogen fluoride (HF) from melting furnaces
28. BAT is to reduce HCl and HF emissions from the melting furnace by using one or a
combination of the following techniques:
Technique (1) Applicability i. Selection of raw materials for the batch
formulation with a low content of chlorine and fluorine
The applicability may be limited by the constraints of the type of glass produced at the installation and the availability of raw materials
ii. Dry or semi-dry scrubbing, in combination with a filtration system The technique is generally applicable
(1) A description of the techniques is given in Section 5.10.4.
Table 5.18: BAT-AELs for HCl and HF emissions from the melting furnace in the flat glass sector
BAT-AEL Parameter
mg/Nm3 kg/tonne melted glass (1)
Hydrogen chloride, expressed as HCl (2) <10 – 25 <0.025 – 0.0625
Hydrogen fluoride, expressed as HF <1 – 4 <0.0025 – 0.010
(1) The conversion factor reported in Table 5.2 (2.5 x 10⁻³) has been applied. (2) The higher levels of the range are associated with the recycling of filter dust in the batch formulation.
5.3.5 Metals from melting furnaces
29. BAT is to reduce metal emissions from the melting furnace by using one or a combination of the following techniques:
Technique (1) Applicability i. Selection of raw materials for the batch
formulation with a low content of metals The applicability may be limited by the constraints imposed by the type of glass produced at the installation and the availability of the raw materials.
ii. Applying a filtration system iii. Applying a dry or semi-dry scrubbing, in
combination with a filtration system The technique is generally applicable
(1) A description of the techniques is given in Section 5.10.5.

Chapter 5
Manufacture of Glass 349
Table 5.19: BAT-AELs for metal emissions from the melting furnace in the flat glass sector, with the exception of selenium coloured glasses
BAT-AEL (1)Parameter mg/Nm3 kg/tonne
melted glass (2)
Σ (As, Co, Ni, Cd, Se, CrVI) <0.2 – 1 <0.5 – 2.5 x 10⁻³
Σ (As, Co, Ni, Cd, Se, CrVI, Sb, Pb, CrIII, Cu, Mn, V, Sn) <1 – 5 <2.5 – 12.5 x 10⁻³ (1) The ranges refer to the sum of metals present in the flue-gases in both solid and gaseous phases. (2) The conversion factor reported in Table 5.2 (2.5 x 10⁻³) has been applied
30. When selenium compounds are used for colouring the glass, BAT is to reduce selenium emissions from the melting furnace by using one or a combination of the following techniques:
Technique (1) Applicability i. Minimising the evaporation of selenium from the
batch composition by selecting raw materials with a higher retention efficiency in the glass and reduced volatilisation
The applicability may be limited by the constraints imposed by the type of glass produced at the installation and the availability of the raw materials
ii. Applying a filtration system iii. Applying a dry or semi-dry scrubbing, in
combination with a filtration system The technique is generally applicable
(1) A description of the techniques is given in Section 5.10.5.
Table 5.20: BAT-AELs for selenium emissions from the melting furnace in the flat glass sector for the production of coloured glass
BAT-AEL (1) (2)Parameter mg/Nm3 kg/tonne
melted glass (3)
Selenium compounds, expressed as Se 1 – 3 2.5 – 7.5 x 10⁻³
(1) The values refer to the sum of selenium present in the flue-gases in both solid and gaseous phases. (2) The lower levels correspond to conditions where the reduction of Se emissions is a priority over a lower production of solid
waste from filter dust. In this case, a high stoichiometric ratio (reagent/pollutant) is applied and a significant solid waste stream is generated.
(3) The conversion factor reported in Table 5.2 (2.5 x 10⁻³) has been applied.

Chapter 5
350 Manufacture of Glass
5.3.6 Emissions from downstream processes
31. BAT is to reduce emissions to air from the downstream processes by using one or a combination of the following techniques:
Technique (1) Applicability i. Minimising the losses of coating products applied to
the flat glass by ensuring a good sealing of the application system
ii. Minimising the losses of SO2 from the annealing lehr, by operating the control system in an optimum manner
iii. Combining the SO2 emissions from the lehr with the waste gas from the melting furnace, when technically feasible, and where a secondary treatment system is applied (filter and dry or semi-dry scrubber)
The techniques are generally applicable
iv. Applying a secondary technique, e.g. wet scrubbing, or dry scrubbing and filtration
The techniques are generally applicable. The selection of the technique and its performance will depend on the inlet waste gas composition
(1) A description of the secondary treatment systems is given in Sections 5.10.3 and 5.10.6.
Table 5.21: BAT-AELs for air emissions from downstream processes in the flat glass sector, when treated separately
BAT-AEL Parameter mg/Nm3
Dust <15 – 20 Hydrogen chloride, expressed as HCl <10 Hydrogen fluoride, expressed as HF <1 – 5 SOX, expressed as SO2 <200 Σ (As, Co, Ni, Cd, Se, CrVI) <1 Σ (As, Co, Ni, Cd, Se, CrVI, Sb, Pb, CrIII, Cu, Mn, V, Sn) <5

Chapter 5
Manufacture of Glass 351
5.4 BAT conclusions for continuous filament glass fibre manufacturing
Unless otherwise stated, the BAT conclusions presented in this section can be applied to all continuous filament glass fibre manufacturing installations.
5.4.1 Dust emissions from melting furnaces The BAT-AELs reported in this section for dust refer to all materials that are solid at the point of measurement, including solid boron compounds. Gaseous boron compounds at the point of measurement are not included.
32. BAT is to reduce dust emissions from the waste gases of the melting furnace by using one or a combination of the following techniques:
Technique (1) Applicability i. Reduction of the volatile components by raw
material modifications The formulation of batch compositions without boron compounds or with low levels of boron is a primary measure for reducing dust emissions which are mainly generated by volatilisation phenomena. Boron is the main constituent of particulate matter emitted from the melting furnace
The application of the technique is limited by proprietary issues, since the boron-free or low-boron batch formulations are covered by a patent
ii. Filtration system: electrostatic precipitator or bag filter
The technique is generally applicable. The maximum environmental benefits are achieved for applications on new plants where the positioning and characteristics of the filter may be decided without restrictions
iii. Wet scrubbing system The application to existing plants may be limited by technical constraints; i.e. need for a specific waste water treatment plant
(1) A description of the secondary treatment systems is given in Sections 5.10.1 and 5.10.7.
Table 5.22: BAT-AELs for dust emissions from the melting furnace in the continuous filament glass fibre sector
BAT-AEL (1)Parameter mg/Nm3 kg/tonne melted glass (2)
Dust <10 – 20 <0.045 – 0.09
(1) Values at levels of <30 mg/Nm3 (<0.14 kg/tonne melted glass) have been reported for boron-free formulations, with the application of primary techniques.
(2) The conversion factor reported in Table 5.2 (4.5 x 10⁻³) has been applied.

Chapter 5
352 Manufacture of Glass
5.4.2 Nitrogen oxides (NOX) from melting furnaces
33. BAT is to reduce NOX emissions from the melting furnace by using one or a combination of the following techniques:
Technique (1) Applicability i. Combustion modifications
(a) Reduction of air/fuel ratio
Applicable to air/fuel conventional furnaces. Full benefits are achieved at normal or complete furnace rebuild, when combined with optimum furnace design and geometry
(b) Reduced combustion air temperature
Applicable to air/fuel conventional furnaces within the constraints of the furnace energy efficiency and higher fuel demand. Most furnaces are already of the recuperative type.
(c) Staged combustion: ◦ Air staging ◦ Fuel staging
Fuel staging is applicable to most air/fuel, oxy-fuel furnaces. Air staging has very limited applicability due to its technical complexity
(d) Flue-gas recirculation The applicability of this technique is limited to the use of special burners with automatic recirculation of the waste gas
(e) Low-NOX burners The technique is generally applicable. Full benefits are achieved at normal or complete furnace rebuild, when combined with optimum furnace design and geometry
(f) Fuel choice The applicability is limited by the constraints associated with the availability of different types of fuel, which may be impacted by the energy policy of the Member State
ii. Oxy-fuel melting The maximum environmental benefits are achieved for applications at the time of a complete furnace rebuild
(1) A description of the techniques is given in Section 5.10.2.
Table 5.23: BAT-AELs for NOX emissions from the melting furnace in the continuous filament glass fibre sector
BAT BAT-AEL Parameter
mg/Nm3 kg/tonne melted glass Combustion modifications <600 – 1000 <2.7 – 4.5 (1)NOX expressed
as NO2 Oxy-fuel melting (2) Not applicable <0.5 – 1.5 (1) The conversion factor reported in Table 5.2 (4.5 x 10⁻³) has been applied. (2) The achievable levels depend on the quality of the natural gas and oxygen available (nitrogen content).

Chapter 5
Manufacture of Glass 353
5.4.3 Sulphur oxides (SOX) from melting furnaces
34. BAT is to reduce SOX emissions from the melting furnace by using one or a combination of the following techniques:
Technique (1) Applicability
i. Minimisation of the sulphur content in the batch formulation and optimisation of the sulphur balance
The technique is generally applicable within the constraints of quality requirements of the final glass product. The application of sulphur balance optimisation requires a trade-off approach between the removal of SOX emissions and the management of the solid waste (filter dust), which needs to be disposed of
ii. Use of low sulphur content fuels The applicability may be limited by the constraints associated with the availability of low sulphur fuels, which may be impacted by the energy policy of the Member State
iii. Dry or semi-dry scrubbing, in combination with a filtration system
The technique is generally applicable. The presence of high concentrations of boron compounds in the flue-gases may limit the abatement efficiency of the reagent used in the dry or semi-dry scrubbing systems
iv. Use of wet scrubbing The technique is generally applicable within technical constraints; i.e. need for a specific waste water treatment plant
(1) A description of the techniques is given in Sections 5.10.3 and 5.10.6.
Table 5.24: BAT-AELs for SOX emissions from the melting furnace in the continuous filament glass fibre sector
BAT-AEL (1)Parameter Fuel
mg/Nm3 kg/tonne melted glass (2)Natural gas (3) <200 – 800 <0.9 – 3.6 SOx expressed
as SO2 Fuel oil (4) (5) <500 – 1000 <2.25 – 4.5 (1) The higher levels of the range are associated with the use of sulphates in the batch formulation for refining the
glass. (2) The conversion factor reported in Table 5.2 (4.5 x 10⁻³) has been applied. (3) For oxy-fuel furnaces with the application of wet scrubbing, the BAT-AEL is reported to be <0.1 kg/tonne melted
glass of SOX, expressed as SO2.(4) The associated emission levels are related to the use of 1 % sulphur fuel oil in combination with secondary
abatement techniques. (5) The lower levels correspond to conditions where the reduction of SOX is a priority over a lower production of
solid waste corresponding to the sulphate-rich filter dust. In this case, the lower levels are associated with the use of a bag filter.
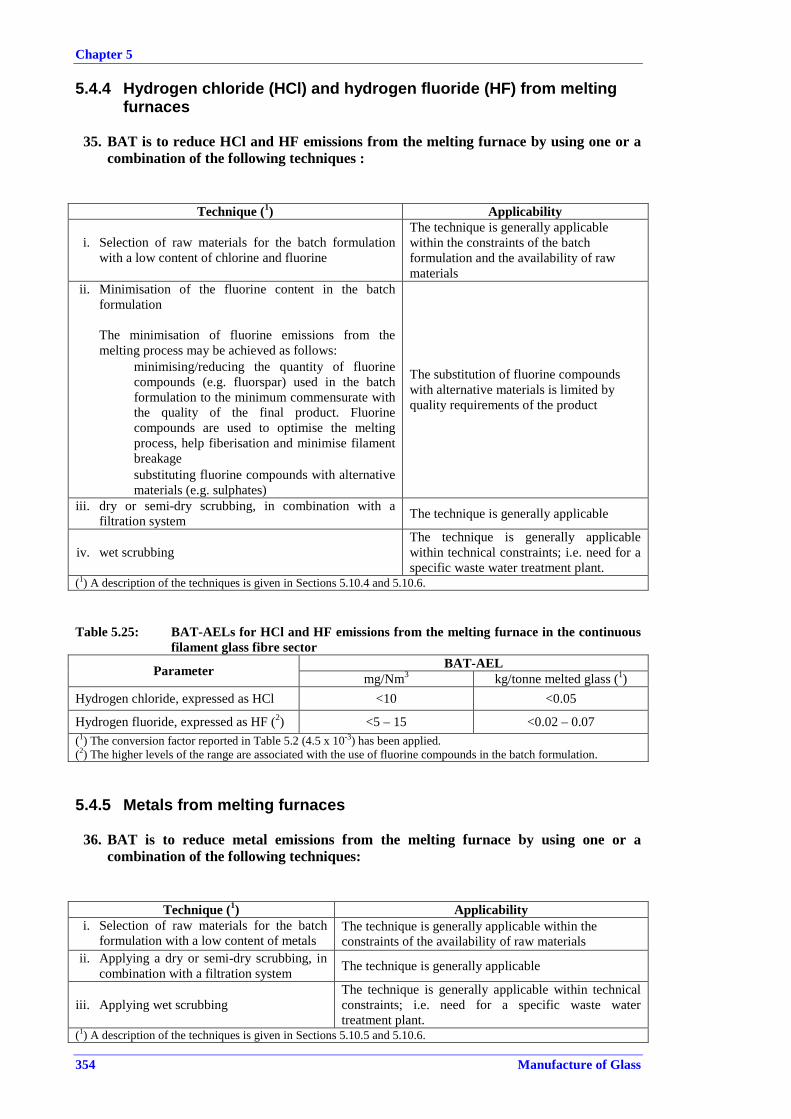
Chapter 5
354 Manufacture of Glass
5.4.4 Hydrogen chloride (HCl) and hydrogen fluoride (HF) from melting furnaces
35. BAT is to reduce HCl and HF emissions from the melting furnace by using one or a
combination of the following techniques :
Technique (1) Applicability
i. Selection of raw materials for the batch formulation with a low content of chlorine and fluorine
The technique is generally applicable within the constraints of the batch formulation and the availability of raw materials
ii. Minimisation of the fluorine content in the batch formulation
The minimisation of fluorine emissions from the melting process may be achieved as follows:
• minimising/reducing the quantity of fluorine compounds (e.g. fluorspar) used in the batch formulation to the minimum commensurate with the quality of the final product. Fluorine compounds are used to optimise the melting process, help fiberisation and minimise filament breakage
• substituting fluorine compounds with alternative materials (e.g. sulphates)
The substitution of fluorine compounds with alternative materials is limited by quality requirements of the product
iii. dry or semi-dry scrubbing, in combination with a filtration system The technique is generally applicable
iv. wet scrubbing The technique is generally applicable within technical constraints; i.e. need for a specific waste water treatment plant.
(1) A description of the techniques is given in Sections 5.10.4 and 5.10.6.
Table 5.25: BAT-AELs for HCl and HF emissions from the melting furnace in the continuous filament glass fibre sector
BAT-AEL Parameter mg/Nm3 kg/tonne melted glass (1)Hydrogen chloride, expressed as HCl <10 <0.05
Hydrogen fluoride, expressed as HF (2) <5 – 15 <0.02 – 0.07 (1) The conversion factor reported in Table 5.2 (4.5 x 10⁻³) has been applied. (2) The higher levels of the range are associated with the use of fluorine compounds in the batch formulation.
5.4.5 Metals from melting furnaces
36. BAT is to reduce metal emissions from the melting furnace by using one or a combination of the following techniques:
Technique (1) Applicability i. Selection of raw materials for the batch
formulation with a low content of metals The technique is generally applicable within the constraints of the availability of raw materials
ii. Applying a dry or semi-dry scrubbing, in combination with a filtration system The technique is generally applicable
iii. Applying wet scrubbing The technique is generally applicable within technical constraints; i.e. need for a specific waste water treatment plant.
(1) A description of the techniques is given in Sections 5.10.5 and 5.10.6.

Chapter 5
Manufacture of Glass 355
Table 5.26: BAT-AELs for metal emissions from the melting furnace in the continuous filament glass fibre sector
BAT-AEL (1)Parameter mg/Nm3 kg/tonne
melted glass (2)Σ (As, Co, Ni, Cd, Se, CrVI) <0.2 – 1 <0.9 – 4.5 x 10⁻³ Σ (As, Co, Ni, Cd, Se, CrVI, Sb, Pb, CrIII, Cu, Mn, V, Sn) <1 – 3 <4.5 – 13.5 x 10⁻³
(1) The levels refer to the sum of metals present in the flue-gases in both solid and gaseous phases. (2) The conversion factor reported in Table 5.2 (4.5 x 10⁻³) has been applied.
5.4.6 Emissions from downstream processes
37. BAT is to reduce emissions from downstream processes by using one or a combination of the following techniques:
Technique (1) Applicability i. Wet scrubbing systems
ii. Wet electrostatic precipitator
The techniques are generally applicable for the treatment of waste gases from the forming process (application of the coating to the fibres) or secondary processes which involve the use of binder that must be cured or dried
iii. Filtration system (bag filter) The technique is generally applicable for the treatment of waste gases from cutting and milling operations of the products
(1) A description of the techniques is given in Sections 5.10.7 and 5.10.8.
Table 5.27: BAT-AELs from downstream processes in the continuous filament glass fibre sector, when treated separately
BAT-AEL Parameter mg/Nm3
Emissions from forming and coating Dust <5 – 20 Formaldehyde <10 Ammonia <30 Total volatile organic compounds, expressed as C <20 Emissions from cutting and milling Dust <5 – 20

Chapter 5
356 Manufacture of Glass
5.5 BAT conclusions for domestic glass manufacturing Unless otherwise stated, the BAT conclusions presented in this section can be applied to all domestic glass manufacturing installations.
5.5.1 Dust emissions from melting furnaces
38. BAT is to reduce dust emissions from the waste gases of the melting furnace by using one or a combination of the following techniques:
Technique (1) Applicability i. Reduction of the volatile components by
raw material modifications.
The formulation of the batch composition may contain very volatile components (e.g. boron, fluorides) which significantly contribute to the formation of dust emissions from the melting furnace
The technique is generally applicable within the constraints of the type of glass produced and the availability of substitute raw materials
ii. Electric melting
Not applicable for large volume glass productions (>300 tonnes/day). Not applicable for productions requiring large pull variations The implementation requires a complete furnace rebuild
iii. Oxy-fuel melting The maximum environmental benefits are achieved for applications made at the time of a complete furnace rebuild
iv. Filtration system: electrostatic precipitator or bag filter The techniques are generally applicable
v. Wet scrubbing system
The applicability is limited to specific cases, in particular to electric melting furnaces, where flue-gas volumes and dust emissions are generally low and related to carryover of the batch formulation
(1) A description of the techniques is given in Sections 5.10.5 and 5.10.7.
Table 5.28: BAT-AELs for dust emissions from the melting furnace in the domestic glass sector
BAT-AEL Parameter mg/Nm3 kg/tonne melted glass (1)<10 – 20 (2) <0.03 – 0.06 Dust <1 – 10 (3) <0.003 – 0.03
(1) A conversion factor of 3 x 10⁻³ has been applied (see Table 5.2). However, a case by case conversion factor may have to be applied for specific productions.
(2) Considerations concerning the economic viability for achieving the BAT-AELs in the case of furnaces with a capacity of <80 t/d, producing soda-lime glass, are reported.
(3) This BAT-AEL applies to batch formulations containing significant amounts of constituents meeting the criteria as dangerous substances, in accordance with Regulation (EC) 1272/2008.

Chapter 5
Manufacture of Glass 357
5.5.2 Nitrogen oxides (NOX) from melting furnaces
39. BAT is to reduce NOX emissions from the melting furnace by using one or a combination of the following techniques:
I. primary techniques, such as:
Technique (1) Applicability i. Combustion modifications
(a) Reduction of air/fuel ratio Applicable to air/fuel conventional furnaces. Full benefits are achieved at normal or complete furnace rebuild, when combined with optimum furnace design and geometry
(b) Reduced combustion air temperature
Applicable only under installation-specific circumstances due to a lower furnace efficiency and higher fuel demand (i.e. use of recuperative furnaces in place of regenerative furnaces)
(c) Staged combustion: • Air staging • Fuel staging
Fuel staging is applicable to most conventional air/fuel furnaces. Air staging has very limited applicability due to its technical complexity
(d) Flue-gas recirculation The applicability of this technique is limited to the use of special burners with automatic recirculation of the waste gas
(e) Low-NOX burners
The technique is generally applicable. The achieved environmental benefits are generally lower for applications to cross-fired, gas-fired furnaces due to technical constraints and a lower degree of flexibility of the furnace. Full benefits are achieved at normal or complete furnace rebuild, when combined with optimum furnace design and geometry
(f) Fuel choice The applicability is limited by the constraints associated with the availability of different types of fuel, which may be impacted by the energy policy of the Member State
ii. Special furnace design
The applicability is limited to batch formulations that contain high levels of external cullet (>70 %). The application requires a complete rebuild of the melting furnace. The shape of the furnace (long and narrow) may pose space restrictions
iii. Electric melting
Not applicable for large volume glass productions (>300 tonnes/day). Not applicable for productions requiring large pull variations. The implementation requires a complete furnace rebuild
iv. Oxy-fuel melting The maximum environmental benefits are achieved for applications at the time of a complete furnace rebuild
(1) A description of the techniques is given in Section 5.10.2.
Table 5.29: BAT-AELs for NOX emissions from the melting furnace in the domestic glass sector
BAT-AEL Parameter BAT
mg/Nm3 kg/tonne melted glass (1)
Combustion modifications, special furnace designs <500 – 1000 <1.25 – 2.5
Electric melting <100 <0.3 NOx expressed as NO2
Oxy-fuel melting (2) Not applicable <0.5 – 1.5
(1) A conversion factor of 2.5 x 10⁻³ has been applied for combustion modifications and special furnace designs and a conversion factor of 3 x 10⁻³ has been applied for electric melting (see Table 5.2). However, a case-by-case conversion factor may have to be applied for specific productions.
(2) The achievable levels depend on the quality of the natural gas and oxygen available (nitrogen content).

Chapter 5
358 Manufacture of Glass
40. When nitrates are used in the batch formulation, BAT is to reduce NOX emissions by minimising the use of these raw materials, in combination with primary or secondary techniques.
The BAT-AELs are set out in Table 5.29 If nitrates are used in the batch formulation for a limited number of short campaigns or for melting furnaces with a capacity <100 t/day producing special types of soda-lime glasses (clear/ultra-clear glass or coloured glass using selenium) and other special glasses (i.e. borosilicate, glass ceramics, opal glass, crystal and lead crystal), the BAT-AELs are set out in Table 5.30.
Technique (1) Applicability Primary techniques:
• Minimising the use of nitrates in the batch formulation The use of nitrates is applied for very high quality products, where a very colourless (clear) glass is required or special glasses are produced. Effective alternative materials are sulphates, arsenic oxides, cerium oxide
The substitution of nitrates in the batch formulation may be limited by the high costs and/or higher environmental impact of the alternative materials
(1) A description of the technique is given in Section 5.10.2.
Table 5.30: BAT-AELs for NOX emissions from the melting furnace in the domestic glass sector, when nitrates are used in the batch formulation for a limited number of short campaigns or for melting furnaces with a capacity <100 t/day producing special types of soda-lime glasses (clear/ultra-clear glass or coloured glass using selenium) and other special glasses (i.e. borosilicate, glass ceramics, opal glass, crystal and lead crystal)
BAT-AEL Parameter Type of furnace mg/Nm3 kg/tonne
melted glass Fuel/air conventional furnaces <500 – 1500 <1.25 – 3.75 (1)NOX expressed
as NO2 Electric melting <300 – 500 <8 – 10
(1) The conversion factor reported in Table 5.2 for soda-lime glass (2.5 × 10⁻³) has been applied.
5.5.3 Sulphur oxides (SOX) from melting furnaces
41. BAT is to reduce SOX emissions from the melting furnace by using one or a combination of the following techniques:
Technique (1) Applicability
i. Minimisation of the sulphur content in the batch formulation and optimisation of the sulphur balance
The minimisation of the sulphur content in the batch formulation is generally applicable within the constraints of quality requirements of the final glass product. The application of sulphur balance optimisation requires a trade-off approach between the removal of SOX emissions and the management of the solid waste (filter dust)
ii. Use of low sulphur content fuels The applicability may be limited by the constraints associated with the availability of low sulphur fuels, which may be impacted by the energy policy of the Member State
iii. Dry or semi-dry scrubbing, in combination with a filtration system
The technique is generally applicable
(1) A description of the techniques is given in Section 5.10.3.

Chapter 5
Manufacture of Glass 359
Table 5.31: BAT-AELs for SOX emissions from the melting furnace in the domestic glass sector
BAT-AEL Parameter Fuel/melting technique
mg/Nm3 kg/tonne melted glass (1)Natural gas <200 – 300 <0.5 – 0.75 Fuel oil (2) <1000 <2.5 SOx expressed
as SO2 Electric melting <100 <0.25 (1) A conversion factor of 2.5 x 10⁻³ has been applied (see Table 5.2). However, a case-by-case conversion factor may have to be applied for specific productions. (2) The levels are related to the use of 1 % sulphur fuel oil in combination with secondary abatement techniques.
5.5.4 Hydrogen chloride (HCl) and hydrogen fluoride (HF) from melting furnaces
42. BAT is to reduce HCl and HF emissions from the melting furnace by using one or a
combination of the following techniques:
Technique (1) Applicability i. Selection of raw materials for the batch
formulation with a low content of chlorine and fluorine
The applicability may be limited by the constraints of the batch formulation for the type of glass produced at the installation and the availability of raw materials
ii. Minimisation of the fluorine content in the batch formulation and optimisation of the fluorine mass balance
The minimisation of fluorine emissions from the melting process may be achieved by minimising/reducing the quantity of fluorine compounds (e.g. fluorspar) used in the batch formulation to the minimum commensurate with the quality of the final product. Fluorine compounds are added to the batch formulation to give an opaque or cloudy appearance to the glass
The technique is generally applicable within the constraints of the quality requirements for the final product
iii. Dry or semi-dry scrubbing, in combination with a filtration system The technique is generally applicable
iv. Wet scrubbing
The technique is generally applicable within technical constraints; i.e. need for a specific waste water treatment plant. High costs, waste water treatment aspects, including restrictions in the recycle of sludge or solid residues from the water treatment, may limit the applicability of this technique
(1) A description of the techniques is given in Sections 5.10.4 and 5.10.6.

Chapter 5
360 Manufacture of Glass
Table 5.32: BAT-AELs for HCl and HF emissions from the melting furnace in the domestic glass sector
BAT-AEL Parameter mg/Nm3 kg/tonne
melted glass (1)Hydrogen chloride, expressed as HCl (2) (3) <10 – 20 <0.03 – 0.06
Hydrogen fluoride, expressed as HF (4) <1 – 5 <0.003 – 0.015 (1) A conversion factor of 3 x 10⁻³ has been applied (see Table 5.2). However, a case-by-case conversion factor may
have to be applied for specific productions. (2) The lower levels are associated with the use of electric melting. (3) In cases where KCl or NaCl are used as a refining agents, the BAT-AEL is <30 mg/Nm3 or <0.09 kg/tonne melted
glass. (4) The lower levels are associated with the use of electric melting. The higher levels are associated with the
production of opal glass, the recycling of filter dust or where high levels of external cullet are used in the batch formulation.
5.5.5 Metals from melting furnaces
43. BAT is to reduce metal emissions from the melting furnace by using one or a combination of the following techniques:
Technique (1) Applicability i. Selection of raw materials for the batch
formulation with a low content of metals
The applicability may be limited by the constraints imposed by the type of glass produced at the installation and the availability of raw materials
ii. Minimising the use of metal compounds in the batch formulation, through a suitable selection of the raw materials where colouring and decolourising of glass is needed or where specific characteristics are conferred to the glass
For the production of crystal and lead crystal glasses the minimisation of metal compounds in the batch formulation is restricted by the limits defined in Directive 69/493/EEC which classifies the chemical composition of the final glass products.
iii. Dry or semi-dry scrubbing, in combination with a filtration system The technique is generally applicable
(1) A description of the techniques is given in Section 5.10.5.
Table 5.33: BAT-AELs for metal emissions from the melting furnace in the domestic glass sector with the exception of glasses where selenium is used for decolourising
BAT-AEL (1)Parameter mg/Nm3 kg/tonne
melted glass (2)Σ (As, Co, Ni, Cd, Se, CrVI) <0.2 – 1 <0.6 – 3 x 10⁻³ Σ (As, Co, Ni, Cd, Se, CrVI, Sb, Pb, CrIII, Cu, Mn, V, Sn) <1 – 5 <3 – 15 x 10-3 (1) The levels refer to the sum of metals present in the flue-gases in both solid and gaseous phases. (2) A conversion factor of 3 x 10⁻³ has been applied (see Table 5.2). However, a case-by-case conversion factor may
have to be applied for specific productions.
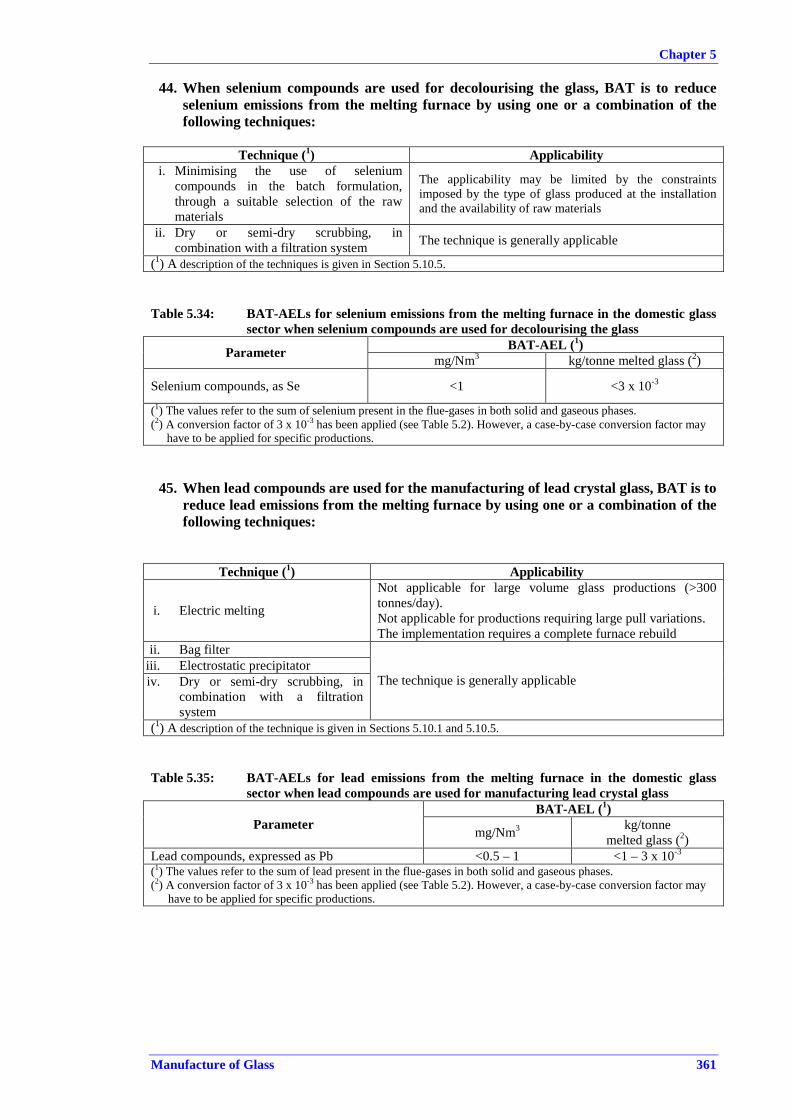
Chapter 5
Manufacture of Glass 361
44. When selenium compounds are used for decolourising the glass, BAT is to reduce selenium emissions from the melting furnace by using one or a combination of the following techniques:
Technique (1) Applicability
i. Minimising the use of selenium compounds in the batch formulation, through a suitable selection of the raw materials
The applicability may be limited by the constraints imposed by the type of glass produced at the installation and the availability of raw materials
ii. Dry or semi-dry scrubbing, in combination with a filtration system The technique is generally applicable
(1) A description of the techniques is given in Section 5.10.5.
Table 5.34: BAT-AELs for selenium emissions from the melting furnace in the domestic glass sector when selenium compounds are used for decolourising the glass
BAT-AEL (1)Parameter mg/Nm3 kg/tonne melted glass (2)
Selenium compounds, as Se <1 <3 x 10⁻³
(1) The values refer to the sum of selenium present in the flue-gases in both solid and gaseous phases. (2) A conversion factor of 3 x 10⁻³ has been applied (see Table 5.2). However, a case-by-case conversion factor may
have to be applied for specific productions.
45. When lead compounds are used for the manufacturing of lead crystal glass, BAT is to reduce lead emissions from the melting furnace by using one or a combination of the following techniques:
Technique (1) Applicability
i. Electric melting
Not applicable for large volume glass productions (>300 tonnes/day). Not applicable for productions requiring large pull variations. The implementation requires a complete furnace rebuild
ii. Bag filter iii. Electrostatic precipitator iv. Dry or semi-dry scrubbing, in
combination with a filtration system
The technique is generally applicable
(1) A description of the technique is given in Sections 5.10.1 and 5.10.5.
Table 5.35: BAT-AELs for lead emissions from the melting furnace in the domestic glass sector when lead compounds are used for manufacturing lead crystal glass
BAT-AEL (1)Parameter mg/Nm3 kg/tonne
melted glass (2)Lead compounds, expressed as Pb <0.5 – 1 <1 – 3 x 10⁻³ (1) The values refer to the sum of lead present in the flue-gases in both solid and gaseous phases. (2) A conversion factor of 3 x 10⁻³ has been applied (see Table 5.2). However, a case-by-case conversion factor may
have to be applied for specific productions.

Chapter 5
362 Manufacture of Glass
5.5.6 Emissions from downstream processes 46. For downstream dusty processes, BAT is to reduce emissions of dust and metals by
using one or a combination of the following techniques:
Technique (1) Applicability i. Performing dusty operations (e.g. cutting, grinding,
polishing) under liquid ii. Applying a bag filter system
The techniques are generally applicable
(1) A description of the techniques is given in Section 5.10.8.
Table 5.36: BAT-AELs for air emissions from dusty downstream processes in the domestic glass sector, when treated separately
BAT-AEL Parameter mg/Nm3
Dust <1 – 10
Σ (As, Co, Ni, Cd, Se, CrVI) (1) <1
Σ (As, Co, Ni, Cd, Se, CrVI, Sb, Pb, CrIII, Cu, Mn, V, Sn) (1) <1 – 5
Lead compounds, expressed as Pb (2) <1 – 1.5 (1) The levels refer to the sum of metals present in the waste gas. (2) The levels refer to downstream operations on lead crystal glass.
47. For acid polishing processes, BAT is to reduce HF emissions by using one or a combination of the following techniques:
Technique (1) Applicability i. Minimising the losses of polishing product by ensuring a
good sealing of the application system
ii. Applying a secondary technique, e.g. wet scrubbing. The techniques are generally applicable
(1) A description of the techniques is given in Section 5.10.6.
Table 5.37: BAT-AELs for HF emissions from acid polishing processes in the domestic glass sector, when treated separately
BAT-AEL Parameter mg/Nm3
Hydrogen fluoride, expressed as HF <5

Chapter 5
Manufacture of Glass 363
5.6 BAT conclusions for special glass manufacturing Unless otherwise stated, the BAT conclusions presented in this section can be applied to all special glass manufacturing installations.
5.6.1 Dust emissions from melting furnaces
48. BAT is to reduce dust emissions from the waste gases of the melting furnace by using one or a combination of the following techniques:
Technique (1) Applicability i. Reduction of the volatile components
by raw material modifications The formulation of the batch composition may contain very volatile components (e.g. boron, fluorides) which represent the main constituents of dust emitted from the melting furnace
The technique is generally applicable within the constraints of the quality of the glass produced
ii. Electric melting
Not applicable for large volume glass productions (>300 tonnes/day) Not applicable for productions requiring large pull variations The implementation requires a complete furnace rebuild
iii. Filtration system: electrostatic precipitator or bag filter The technique is generally applicable
(1) A description of the techniques is given in Section 5.10.1.
Table 5.38: BAT-AELs for dust emissions from the melting furnace in the special glass sector BAT-AEL
Parameter mg/Nm3 kg/tonne melted glass (1)
<10 – 20 <0.03 – 0.13 Dust <1 – 10 (2) <0.003 – 0.065 (1) The conversions factors of 2.5 x 10⁻³ and 6.5 x 10⁻³ have been used for the determination of the lower and upper
value of the BAT-AELs range (see Table 5.2), with some values being approximated. However, a-case-by-case conversion factor needs to be applied, depending on the type of glass produced (see Table 5.2).
(2) The BAT-AELs apply to batch formulations containing significant amounts of constituents meeting the criteria as dangerous substances, in accordance with Regulation (EC) 1272/2008.
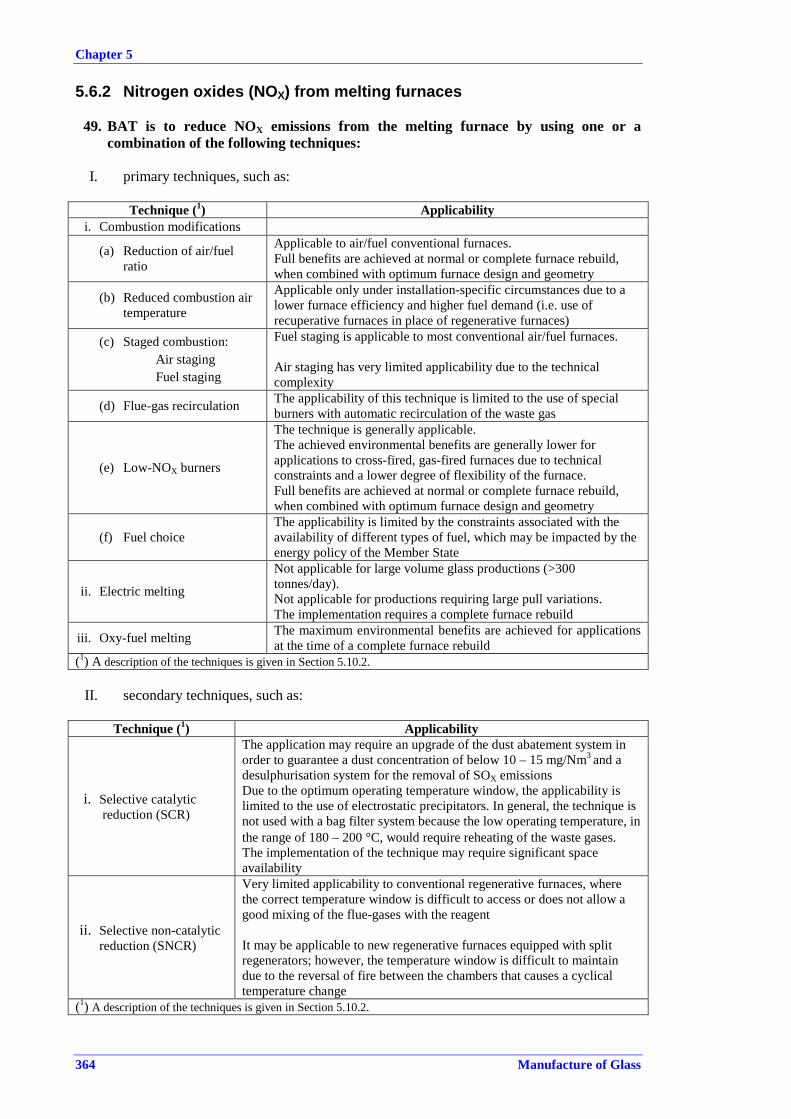
Chapter 5
364 Manufacture of Glass
5.6.2 Nitrogen oxides (NOX) from melting furnaces
49. BAT is to reduce NOX emissions from the melting furnace by using one or a combination of the following techniques:
I. primary techniques, such as:
Technique (1) Applicability
i. Combustion modifications (a) Reduction of air/fuel
ratio
Applicable to air/fuel conventional furnaces. Full benefits are achieved at normal or complete furnace rebuild, when combined with optimum furnace design and geometry
(b) Reduced combustion air temperature
Applicable only under installation-specific circumstances due to a lower furnace efficiency and higher fuel demand (i.e. use of recuperative furnaces in place of regenerative furnaces)
(c) Staged combustion: • Air staging • Fuel staging
Fuel staging is applicable to most conventional air/fuel furnaces. Air staging has very limited applicability due to the technical complexity
(d) Flue-gas recirculation The applicability of this technique is limited to the use of special burners with automatic recirculation of the waste gas
(e) Low-NOX burners
The technique is generally applicable. The achieved environmental benefits are generally lower for applications to cross-fired, gas-fired furnaces due to technical constraints and a lower degree of flexibility of the furnace. Full benefits are achieved at normal or complete furnace rebuild, when combined with optimum furnace design and geometry
(f) Fuel choice The applicability is limited by the constraints associated with the availability of different types of fuel, which may be impacted by the energy policy of the Member State
ii. Electric melting
Not applicable for large volume glass productions (>300 tonnes/day). Not applicable for productions requiring large pull variations. The implementation requires a complete furnace rebuild
iii. Oxy-fuel melting The maximum environmental benefits are achieved for applications at the time of a complete furnace rebuild
(1) A description of the techniques is given in Section 5.10.2.
II. secondary techniques, such as:
Technique (1) Applicability
i. Selective catalytic reduction (SCR)
The application may require an upgrade of the dust abatement system in order to guarantee a dust concentration of below 10 – 15 mg/Nm3 and a desulphurisation system for the removal of SOX emissions Due to the optimum operating temperature window, the applicability is limited to the use of electrostatic precipitators. In general, the technique is not used with a bag filter system because the low operating temperature, in the range of 180 – 200 °C, would require reheating of the waste gases. The implementation of the technique may require significant space availability
ii. Selective non-catalytic reduction (SNCR)
Very limited applicability to conventional regenerative furnaces, where the correct temperature window is difficult to access or does not allow a good mixing of the flue-gases with the reagent It may be applicable to new regenerative furnaces equipped with split regenerators; however, the temperature window is difficult to maintain due to the reversal of fire between the chambers that causes a cyclical temperature change
(1) A description of the techniques is given in Section 5.10.2.
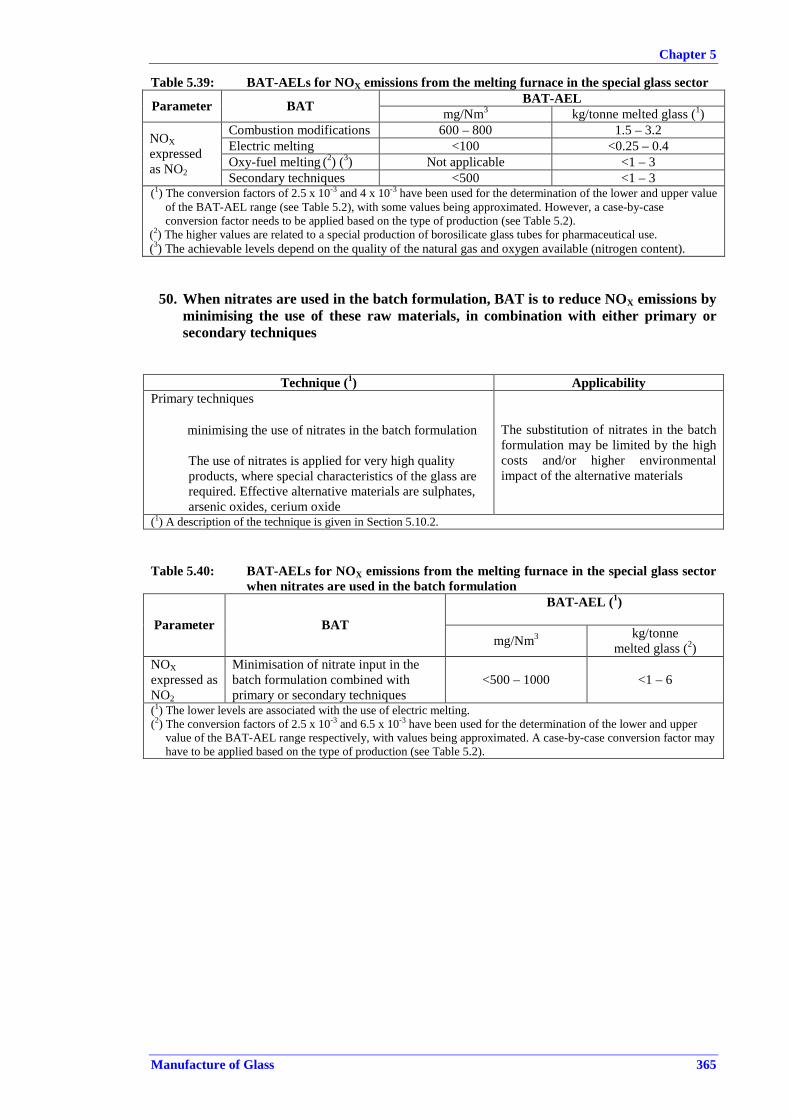
Chapter 5
Manufacture of Glass 365
Table 5.39: BAT-AELs for NOX emissions from the melting furnace in the special glass sector BAT-AEL Parameter BAT mg/Nm3 kg/tonne melted glass (1)
Combustion modifications 600 – 800 1.5 – 3.2 Electric melting <100 <0.25 – 0.4 Oxy-fuel melting (2) (3) Not applicable <1 – 3
NOXexpressed as NO2 Secondary techniques <500 <1 – 3 (1) The conversion factors of 2.5 x 10⁻³ and 4 x 10⁻³ have been used for the determination of the lower and upper value
of the BAT-AEL range (see Table 5.2), with some values being approximated. However, a case-by-case conversion factor needs to be applied based on the type of production (see Table 5.2).
(2) The higher values are related to a special production of borosilicate glass tubes for pharmaceutical use. (3) The achievable levels depend on the quality of the natural gas and oxygen available (nitrogen content).
50. When nitrates are used in the batch formulation, BAT is to reduce NOX emissions by minimising the use of these raw materials, in combination with either primary or secondary techniques
Technique (1) Applicability Primary techniques
• minimising the use of nitrates in the batch formulation The use of nitrates is applied for very high quality products, where special characteristics of the glass are required. Effective alternative materials are sulphates, arsenic oxides, cerium oxide
The substitution of nitrates in the batch formulation may be limited by the high costs and/or higher environmental impact of the alternative materials
(1) A description of the technique is given in Section 5.10.2.
Table 5.40: BAT-AELs for NOX emissions from the melting furnace in the special glass sector when nitrates are used in the batch formulation
BAT-AEL (1)
Parameter BAT mg/Nm3 kg/tonne
melted glass (2)NOXexpressed as NO2
Minimisation of nitrate input in the batch formulation combined with primary or secondary techniques
<500 – 1000 <1 – 6
(1) The lower levels are associated with the use of electric melting. (2) The conversion factors of 2.5 x 10⁻³ and 6.5 x 10⁻³ have been used for the determination of the lower and upper
value of the BAT-AEL range respectively, with values being approximated. A case-by-case conversion factor may have to be applied based on the type of production (see Table 5.2).

Chapter 5
366 Manufacture of Glass
5.6.3 Sulphur oxides (SOX) from melting furnaces
51. BAT is to reduce SOX emissions from the melting furnace by using one or a combination of the following techniques:
Technique (1) Applicability i. Minimisation of the sulphur
content in the batch formulation and optimisation of the sulphur balance
The technique is generally applicable within the constraints of quality requirements of the final glass product
ii. Use of low sulphur content fuels The applicability may be limited by the constraints associated with the availability of low sulphur fuels, which may be impacted by the energy policy of the Member State
iii. Dry or semi-dry scrubbing, in combination with a filtration system
The technique is generally applicable
(1) A description of the techniques is given in Section 5.10.3.
Table 5.41: BAT-AELs for SOX emissions from the melting furnace in the special glass sector BAT-AEL (1)
Parameter Fuel/melting technique mg/Nm3 kg/tonne melted glass (2)
Natural gas, electric melting (2) <30 – 200 <0.08 – 0.5 SOX expressed as
SO2 Fuel oil (3) 500 – 800 1.25 – 2
(1) The ranges take into account the variable sulphur balances associated with the type of glass produced. (2) The conversion factor of 2.5 x 10⁻³ (see Table 5.2) has been used. However, a case-by-case conversion factor may
have to be applied based on the type of production. (3) The lower levels are associated with the use of electric melting and batch formulations without sulphates. (4) The associated emission levels are related to the use of 1 % sulphur fuel oil in combination with secondary
abatement techniques.
5.6.4 Hydrogen chloride (HCl) and hydrogen fluoride (HF) from melting furnaces
52. BAT is to reduce HCl and HF emissions from the melting furnace by using one or a combination of the following techniques:
Technique (1) Applicability
i. Selection of raw materials for the batch formulation with a low content of chlorine and fluorine
The applicability may be limited by the constraints of the batch formulation for the type of glass produced at the installation and the availability of raw materials
ii. Minimisation of the fluorine and/or chlorine compounds in the batch formulation and optimisation of the fluorine and/or chlorine mass balance
Fluorine compounds are used to confer particular characteristics to special glasses (i.e. opaque lighting glass, optical glass). Chlorine compounds may be used as fining agents for borosilicate glass production
The technique is generally applicable within the constraints of the quality requirements for the final product.
iii. Dry or semi-dry scrubbing, in combination with a filtration system The technique is generally applicable
(1) A description of the techniques is given in Section 5.10.4.

Chapter 5
Manufacture of Glass 367
Table 5.42: BAT-AELs for HCl and HF emissions from the melting furnace in the special glass sector
BAT-AEL Parameter
mg/Nm3 kg/tonne melted glass (1)Hydrogen chloride, expressed as HCl (2) <10 – 20 <0.03 – 0.05
Hydrogen fluoride, expressed as HF <1 – 5 <0.003 – 0.04 (3)
(1) The conversion factor of 2.5 x 10⁻³ (see Table 5.2) has been used; with some values being approximated. A case-by-case conversion factor may have to be applied based on the type of production.
(2) The higher levels are associated with the use of materials containing chlorine in the batch formulation. (3) The upper value of the range has been derived from specific reported data.
5.6.5 Metals from melting furnaces
53. BAT is to reduce metal emissions from the melting furnace by using one or a combination of the following techniques:
Technique (1) Applicability
i. Selection of raw materials for the batch formulation with a low content of metals
The applicability may be limited by the constraints imposed by the type of glass produced at the installation and the availability of raw materials
ii. Minimising the use of metal compounds in the batch formulation, through a suitable selection of the raw materials where colouring and decolourising of glass is needed or where specific characteristics are conferred to the glass
iii. Dry or semi-dry scrubbing, in combination with a filtration system
The techniques are generally applicable
(1) A description of the techniques is given in Section 5.10.5.
Table 5.43: BAT-AELs for metal emissions from the melting furnace in the special glass sector BAT-AEL (1) (2)
Parameter mg/Nm3 kg/tonne melted
glass (3)Σ (As, Co, Ni, Cd, Se, CrVI) <0.1 – 1 <0.3 – 3 x 10⁻³
Σ (As, Co, Ni, Cd, Se, CrVI, Sb, Pb, CrIII, Cu, Mn, V, Sn) <1 – 5 <3 – 15 x 10-3 (1) The levels refer to the sum of metals present in the flue-gases in both solid and gaseous phases. (2) The lower levels are BAT-AELs when metal compounds are not intentionally used in the batch formulation. (3) The conversion factor of 2.5 x 10⁻³ (see Table 5.2) has been used, with some values indicated in the table having
been approximated. A case-by-case conversion factor may have to be applied based on the type of production.
5.6.6 Emissions from downstream processes
54. For downstream dusty processes, BAT is to reduce emissions of dust and metals by using one or a combination of the following techniques:
Technique (1) Applicability
i. Performing dusty operations (e.g. cutting, grinding, polishing) under liquid
ii. Applying a bag filter system The techniques are generally applicable
(1) A description of the techniques is given in Section 5.10.8.

Chapter 5
368 Manufacture of Glass
Table 5.44: BAT-AELs for dust and metals emissions from downstream processes in the special glass sector, when treated separately
BAT-AEL Parameter mg/Nm3
Dust 1 – 10 Σ (As, Co, Ni, Cd, Se, CrVI) (1) <1 Σ (As, Co, Ni, Cd, Se, CrVI, Sb, Pb, CrIII, Cu, Mn, V, Sn) (1) <1 – 5 (1) The levels refer to the sum of metals present in the waste gas.
55. For acid polishing processes, BAT is to reduce HF emissions by using one or a combination of the following techniques:
Technique (1) Description
i. Minimising the losses of polishing product by ensuring a good sealing of the application system
ii. Applying a secondary technique, e.g. wet scrubbing The techniques are generally applicable
(1) A description of the techniques is given in Section 5.10.6.
Table 5.45: BAT-AELs for HF emissions from acid polishing processes in the special glass sector
BAT-AEL Parameter mg/Nm3
Hydrogen fluoride, expressed as HF <5
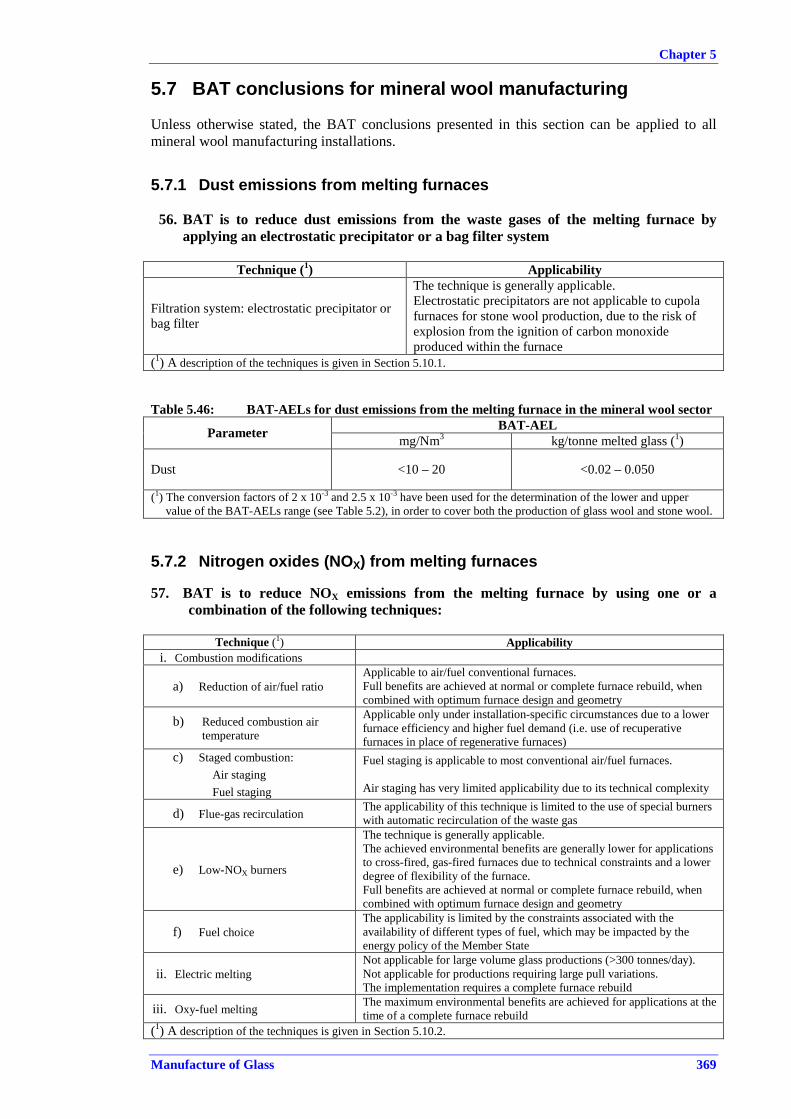
Chapter 5
Manufacture of Glass 369
5.7 BAT conclusions for mineral wool manufacturing Unless otherwise stated, the BAT conclusions presented in this section can be applied to all mineral wool manufacturing installations.
5.7.1 Dust emissions from melting furnaces
56. BAT is to reduce dust emissions from the waste gases of the melting furnace by applying an electrostatic precipitator or a bag filter system
Technique (1) Applicability
Filtration system: electrostatic precipitator or bag filter
The technique is generally applicable. Electrostatic precipitators are not applicable to cupola furnaces for stone wool production, due to the risk of explosion from the ignition of carbon monoxide produced within the furnace
(1) A description of the techniques is given in Section 5.10.1.
Table 5.46: BAT-AELs for dust emissions from the melting furnace in the mineral wool sector BAT-AEL Parameter mg/Nm3 kg/tonne melted glass (1)
Dust <10 – 20 <0.02 – 0.050
(1) The conversion factors of 2 x 10⁻³ and 2.5 x 10⁻³ have been used for the determination of the lower and upper value of the BAT-AELs range (see Table 5.2), in order to cover both the production of glass wool and stone wool.
5.7.2 Nitrogen oxides (NOX) from melting furnaces 57. BAT is to reduce NOX emissions from the melting furnace by using one or a
combination of the following techniques:
Technique (1) Applicability i. Combustion modifications
a) Reduction of air/fuel ratio Applicable to air/fuel conventional furnaces. Full benefits are achieved at normal or complete furnace rebuild, when combined with optimum furnace design and geometry
b) Reduced combustion air temperature
Applicable only under installation-specific circumstances due to a lower furnace efficiency and higher fuel demand (i.e. use of recuperative furnaces in place of regenerative furnaces)
c) Staged combustion: • Air staging • Fuel staging
Fuel staging is applicable to most conventional air/fuel furnaces. Air staging has very limited applicability due to its technical complexity
d) Flue-gas recirculation The applicability of this technique is limited to the use of special burners with automatic recirculation of the waste gas
e) Low-NOX burners
The technique is generally applicable. The achieved environmental benefits are generally lower for applications to cross-fired, gas-fired furnaces due to technical constraints and a lower degree of flexibility of the furnace. Full benefits are achieved at normal or complete furnace rebuild, when combined with optimum furnace design and geometry
f) Fuel choice The applicability is limited by the constraints associated with the availability of different types of fuel, which may be impacted by the energy policy of the Member State
ii. Electric melting Not applicable for large volume glass productions (>300 tonnes/day). Not applicable for productions requiring large pull variations. The implementation requires a complete furnace rebuild
iii. Oxy-fuel melting The maximum environmental benefits are achieved for applications at the time of a complete furnace rebuild
(1) A description of the techniques is given in Section 5.10.2.

Chapter 5
370 Manufacture of Glass
Table 5.47: BAT-AELs for NOX emissions from the melting furnace in the mineral wool sector BAT-AEL
Parameter Product Melting technique mg/Nm3 kg/tonne melted glass (1)
Fuel/air and electric furnaces <200 – 500 <0.4 – 1.0
Glass wool Oxy-fuel melting (2) Not applicable <0.5
NOXexpressed as NO2
Stone wool All types of furnaces <400 – 500 <1.0 – 1.25
(1) The conversion factors of 2 x 10⁻³ for glass wool and 2.5 x 10⁻³ for stone wool have been used (see Table 5.2). (2) The achievable levels depend on the quality of the natural gas and oxygen available (nitrogen content).
58. When nitrates are used in the batch formulation for glass wool production, BAT is to reduce NOX emissions by using one or a combination of the following techniques:
Technique (1) Applicability i. Minimising the use of nitrates in
the batch formulation
The use of nitrates is applied as an oxidising agent in batch formulations with high levels of external cullet to compensate for the presence of organic material contained in the cullet
The technique is generally applicable within the constraints of the quality requirements for the final product
ii. Electric melting
The technique is generally applicable. The implementation of electric melting requires a complete furnace rebuild
iii. Oxy-fuel melting
The technique is generally applicable. The maximum environmental benefits are achieved for applications made at the time of a complete furnace rebuild
(1) A description of the techniques is given in Section 5.10.2.
Table 5.48: BAT-AELs for NOX emissions from the melting furnace in glass wool production when nitrates are used in the batch formulation
BAT-AEL Parameter BAT mg/Nm3 kg/tonne melted glass
(1)
NOX expressed as NO2
Minimisation of nitrate input in the batch formulation, combined with primary techniques
<500 – 700 <1.0 – 1.4 (2)
(1) The conversion factor of 2 x 10⁻³ has been used (see Table 5.2). (2) The lower levels of the ranges are associated with the application of oxy-fuel melting.

Chapter 5
Manufacture of Glass 371
5.7.3 Sulphur oxides (SOX) from melting furnaces
59. BAT is to reduce SOX emissions from the melting furnace by using one or a combination of the following techniques:
Technique (1) Applicability
i. Minimisation of the sulphur content in the batch formulation and optimisation of the sulphur balance
In glass wool production, the technique is generally applicable within the constraints of the availability of low-sulphur raw materials, in particular external cullet. High levels of external cullet in the batch formulation limit the possibility of optimising the sulphur balance due to a variable sulphur content. In the stone wool production, the optimisation of the sulphur balance may require a trade-off approach between the removal of SOX emissions from the flue-gases and the management of the solid waste, deriving from the treatment of the flue-gases (filter dust) and/or from the fiberising process, which may be recycled into the batch formulation (cement briquettes) or may need to be disposed of
ii. Use of low sulphur content fuels
The applicability may be limited by the constraints associated with the availability of low sulphur fuels, which may be impacted by the energy policy of the Member State
iii. Dry or semi-dry scrubbing, in combination with a filtration system
Electrostatic precipitators are not applicable to cupola furnaces for stone wool production (see BAT 56)
iv. Use of wet scrubbing The technique is generally applicable within technical constraints; i.e. need for a specific waste water treatment plant
(1) A description of the techniques is given in Sections 5.10.3 and 5.10.6.
Table 5.49: BAT-AELs for SOX emissions from the melting furnace in the mineral wool sector
BAT-AEL Parameter Product/conditions
mg/Nm3 kg/tonne melted glass (1)
Glass wool
Gas-fired and electric furnaces (2) <50 – 150 <0.1 – 0.3
Stone wool
Gas-fired and electric furnaces <350 <0.9
Cupola furnaces, no briquettes or slag recycling (3) <400 <1.0
SOXexpressed
as SO2
Cupola furnaces, with cement briquettes or slag recycling (4) <1400 <3.5
(1) The conversion factors of 2 x 10⁻³ for glass wool and 2.5 x 10⁻³ for stone wool have been used (see Table 5.2). (2) The lower levels of the ranges are associated with the use of electric melting. The higher levels are associated with
high levels of cullet recycling. (3) The BAT-AEL is associated with conditions where the reduction of SOX emissions has a high priority over a
lower production of solid waste. (4) When reduction of waste has a high priority over SOX emissions, higher emission values may be expected. The
achievable levels should be based on a sulphur balance.

Chapter 5
372 Manufacture of Glass
5.7.4 Hydrogen chloride (HCl) and hydrogen fluoride (HF) from melting furnaces
60. BAT is to reduce HCl and HF emissions from the melting furnace by using one or a
combination of the following techniques:
Technique (1) Description i. Selection of raw materials for the batch
formulation with a low content of chlorine and fluorine
The technique is generally applicable within the constraints of the batch formulation and the availability of raw materials
ii. Dry or semi-dry scrubbing, in combination with a filtration system
Electrostatic precipitators are not applicable to cupola furnaces for stone wool production (see BAT 56)
(1) A description of the techniques is given in Section 5.10.4.
Table 5.50: BAT-AELs for HCl and HF emissions from the melting furnace in the mineral wool sector
BAT-AEL Parameter Product mg/Nm3 kg/tonne
melted glass (1)Glass wool <5 – 10 <0.01 – 0.02 Hydrogen chloride,
expressed as HCl Stone wool <10 – 30 <0.025 – 0.075 Hydrogen fluoride, expressed as HF All products <1 – 5 <0.002 – 0.013 (2)
(1) The conversion factors of 2 x 10⁻³ for glass wool and 2.5 x 10⁻³ for stone wool have been used (see Table 5.2). (2) The conversion factors of 2 x 10⁻³ and 2.5 x 10⁻³ have been used for the determination of the lower and upper values of the BAT-AELs range (see Table 5 2).
5.7.5 Hydrogen sulphide (H2S) from stone wool melting furnaces
61. BAT is to reduce H2S emissions from the melting furnace by applying a waste gas incineration system to oxidise hydrogen sulphide to SO2
Technique (1) Applicability
Waste gas incinerator system The technique is generally applicable to stone wool cupola furnaces
(1) A description of the technique is given in Section 5.10.9.
Table 5.51: BAT-AELs for H2S emissions from the melting furnace in stone wool production BAT-AEL
Parameter mg/Nm3 kg/tonne melted glass (1)
Hydrogen sulphide, expressed as H2S <2 <0.005
(1) The conversion factor of 2.5 x 10⁻³ for stone wool has been applied (see Table 5.2).

Chapter 5
Manufacture of Glass 373
5.7.6 Metals from melting furnaces
62. BAT is to reduce metal emissions from the melting furnace by using one or a combination of the following techniques:
Technique (1) Applicability
i. Selection of raw materials for the batch formulation with a low content of metals
The technique is generally applicable within the constraints of the availability of raw materials. In glass wool production, the use of manganese in the batch formulation as an oxidising agent depends on the quantity and quality of external cullet employed in the batch formulation and may be minimised accordingly
ii. Application of a filtration system Electrostatic precipitators are not applicable to cupola furnaces for stone wool production (see BAT 56)
(1) A description of the techniques is given in Section 5.10.5.
Table 5.52: BAT-AELs for metal emissions from the melting furnace in the mineral wool sector
BAT-AEL (1)Parameter mg/Nm3 kg/tonne
melted glass (2)Σ (As, Co, Ni, Cd, Se, CrVI) <0.2 – 1 (3) <0.4 – 2.5 x 10⁻³ Σ (As, Co, Ni, Cd, Se, CrVI, Sb, Pb, CrIII, Cu, Mn, V, Sn) <1 – 2 (3) <2 – 5 x 10⁻³ (1) The ranges refer to the sum of metals present in the flue-gases in both solid and gaseous phases. (2) The conversion factors of 2 x 10⁻³ and 2.5 x 10⁻³ have been used for the determination of the lower and upper values of the BAT-AELs range (see Table 5.2). (3) Higher values are associated with the use of cupola furnaces for the production of stone wool.
5.7.7 Emissions from downstream processes
63. BAT is to reduce emissions from downstream processes by using one or a combination of the following techniques:
Technique (1) Applicability i. Impact jets and cyclones
The technique is based on the removal of particles and droplets from waste gases by impaction/impingement, as well as gaseous substances by partial absorption with water. Process water is normally used for impact jets. The recycling process water is filtered before it is reapplied
The technique is generally applicable to the mineral wool sector, in particular to glass wool processes for the treatment of emissions from the forming area (application of the coating to the fibres). Limited applicability to stone wool processes since it could adversely affect other abatement techniques being used.
ii. Wet scrubbers
The technique is generally applicable for the treatment of waste gases from the forming process (application of the coating to the fibres) or for combined waste gases (forming plus curing)
iii. Wet electrostatic precipitators
The technique is generally applicable for the treatment of waste gases from the forming process (application of the coating to the fibres), from curing ovens or for combined waste gases (forming plus curing)

Chapter 5
374 Manufacture of Glass
iv. Stone wool filters
It consists of a steel or concrete structure in which stone wool slabs are mounted and act as a filter medium. The filtering medium needs to be cleaned or exchanged periodically. This filter is suitable for waste gases with a high moisture content and particulate matter with an adhesive nature
The applicability is mainly limited to stone wool processes for waste gases from the forming area and/or curing ovens
v. Waste gas incineration
The technique is generally applicable for the treatment of waste gases from curing ovens, in particular in the stone wool processes. The application to combined waste gases (forming plus curing) is not economically viable because of the high volume, low concentration, low temperature of the waste gases
(1) A description of the techniques is given in Sections 5.10.7 and 5.10.9.
Table 5.53: BAT-AELs for air emissions from downstream processes in the mineral wool sector, when treated separately
BAT-AEL Parameter mg/Nm3 kg/tonne
finished product Forming area-Combined forming and curing emissions-Combined forming, curing and cooling emissions Total particulate matter <20 – 50 - Phenol <5 – 10 - Formaldehyde <2 – 5 - Ammonia 30 – 60 - Amines <3 - Total volatile organic compounds expressed as C 10 – 30 -
Curing oven emissions (1) (2)
Total particulate matter <5 – 30 <0.2 Phenol <2 – 5 <0.03 Formaldehyde <2 – 5 <0.03 Ammonia <20 – 60 <0.4 Amines <2 <0.01 Total volatile organic compounds expressed as C <10 <0.065 NOX, expressed as NO2 <100 – 200 <1 (1) Emission levels expressed in kg/tonne of finished product are not affected by the thickness of the mineral wool
mat produced nor by extreme concentration or dilution of the flue-gases. A conversion factor of 6.5 x 10⁻³ has been used.
(2) If high density or high binder content mineral wools are produced, the emission levels associated with the techniques listed as BAT for the sector could be significantly higher than these BAT-AELs. If these types of products represent the majority of the production from a given installation, then consideration should be given to other techniques.

Chapter 5
Manufacture of Glass 375
5.8 BAT conclusions for high temperature insulation wools (HTIW) manufacturing
Unless otherwise stated, the BAT conclusions presented in this section can be applied to all HTIW manufacturing installations.
5.8.1 Dust emissions from melting and downstream processes
64. BAT is to reduce dust emissions from the waste gases of the melting furnace by applying a filtration system.
Technique (1) Applicability The filtration system usually consists of a bag filter The technique is generally applicable (1) A description of the technique is given in Section 5.10.1.
Table 5.54: BAT-AELs for dust emissions from the melting furnace in the HTIW sector BAT-AEL Parameter BAT mg/Nm3
Dust Flue-gas cleaning by filtration systems <5 – 20 (1)
(1) The values are associated with the use of a bag filter system.
65. For downstream dusty processes, BAT is to reduce emissions using one or a combination of the following techniques:
Technique (1) Applicability i. Minimising the losses of product by ensuring a good sealing of the
production line, where technically applicable.
The potential sources of dust and fibre emissions are: • fiberisation and collection • mat formation (needling) • lubricant burn-off • cutting, trimming and packaging of the finished product
A good construction, sealing and maintenance of the downstream processing systems are essential for minimising the losses of product into the air
ii. Cutting, trimming and packaging under vacuum, by applying an efficient extraction system in conjunction with a fabric filter.
A negative pressure is applied to the workstation (i.e. cutting machine, cardboard box for packaging) in order to extract particulate and fibrous releases and convey it to a fabric filter
iii. Applying a fabric filter system (1)
Waste gases from downstream operations (e.g. fiberising, mat formation, lubricant burn-off) are conveyed to a treatment system consisting of a bag filter
The techniques are generally applicable
(1) A description of the technique is given in Section 5.10.1.

Chapter 5
376 Manufacture of Glass
Table 5.55: BAT-AELs from dusty downstream processes in the HTIW sector, when treated separately
BAT-AEL Parameter mg/Nm3
Dust (1) 1 – 5(1) The lower level of the range is associated with emissions of aluminium silicate glass wool/refractory ceramic
fibres (ASW/RCF).
5.8.2 Nitrogen oxides (NOX) from melting and downstream processes
66. BAT is to reduce NOX emissions from the lubricant burn-off oven by applying combustion control and/or modifications
Technique Applicability Combustion control and/or modifications
Techniques to reduce the formation of thermal NOX emissions include a control of the main combustion parameters:
• air/fuel ratio (oxygen content in the reaction zone) • flame temperature • residence time in the high temperature zone.
A good combustion control consists of generating those conditions which are least favourable for NOX formation
The technique is generally applicable
Table 5.56: BAT-AELs for NOX emissions from the lubricant burn-off oven in the HTIW sector
BAT-AEL Parameter BAT mg/Nm3
NOX expressed as NO2 Combustion control and/or modifications 100 – 200
5.8.3 Sulphur oxides (SOX) from melting and downstream processes
67. BAT is to reduce SOX emissions from the melting furnaces and downstream processes by using one or a combination of the following techniques :
Technique (1) Applicability i. Selection of raw materials for the batch
formulation with a low content of sulphur The technique is generally applicable within the constraints of the availability of raw materials
ii. Use of low sulphur content fuel The applicability may be limited by the constraints associated with the availability of low sulphur fuels, which may be impacted by the energy policy of the Member State
(1) A description of the technique is given in Section 5.10.3.
Table 5.57: BAT-AELs for SOX emissions from the melting furnaces and downstream processes in the HTIW sector
BAT-AEL Parameter BAT mg/Nm3
SOx expressed as SO2 Primary techniques <50

Chapter 5
Manufacture of Glass 377
5.8.4 Hydrogen chloride (HCl) and hydrogen fluoride (HF) from melting furnaces
68. BAT is to reduce HCl and HF emissions from the melting furnace by selecting raw
materials for the batch formulation with a low content of chlorine and fluorine
Technique (1) Applicability Selection of raw materials for the batch formulation with a low content of chlorine and fluorine The technique is generally applicable
(1) A description of the technique is given in Section 5.10.4.
Table 5.58: BAT-AELs for HCl and HF emissions from the melting furnace in the HTIW sector
BAT-AEL Parameter mg/Nm3
Hydrogen chloride, expressed as HCl <10 Hydrogen fluoride, expressed as HF <5
5.8.5 Metals from melting furnaces and downstream processes
69. BAT is to reduce metal emissions from the melting furnace and/or downstream processes by using one or a combination of the following techniques:
Technique (1) Applicability i. Selection of raw materials for the batch formulation with a low
content of metals
ii. Applying a filtration system
The techniques are generally applicable
(1) A description of the technique is given in Section 5.10.5.
Table 5.59: BAT-AELs for metal emissions from the melting furnace and/or downstream processes in the HTIW sector
BAT-AEL (1)Parameter mg/Nm3
Σ (As, Co, Ni, Cd, Se, CrVI) <1 Σ (As, Co, Ni, Cd, Se, CrVI, Sb, Pb, CrIII, Cu, Mn, V, Sn) <5 (1) The levels refer to the sum of metals present in the flue-gases in both solid and gaseous phases.

Chapter 5
378 Manufacture of Glass
5.8.6 Volatile organic compounds from downstream processes
70. BAT is to reduce volatile organic compound (VOC) emissions from the lubricant burn-off oven by using one or a combination of the following techniques:
Technique (1) Applicability i. Combustion control, including monitoring the associated
emissions of CO.
The technique consists of the control of combustion parameters (e.g. oxygen content in the reaction zone, flame temperature) in order to ensure a complete combustion of the organic components (i.e. polyethylene glycol) in the waste gas. The monitoring of carbon monoxide emissions allows for controlling the presence of uncombusted organic materials
The technique is generally applicable
ii. Waste gas incineration
iii. Wet scrubbers
The economic viability may limit the applicability of these techniques because of low waste gas volumes and VOC concentrations
(1) A description of the techniques is given in Sections 5.10.6 and 5.10.9.
Table 5.60: BAT-AELs for VOC emissions from the lubricant burn-off oven in the HTIW sector, when treated separately
BAT-AEL Parameter BAT mg/Nm3
Volatile organic compounds, expressed as C Primary and/or secondary techniques 10 – 20
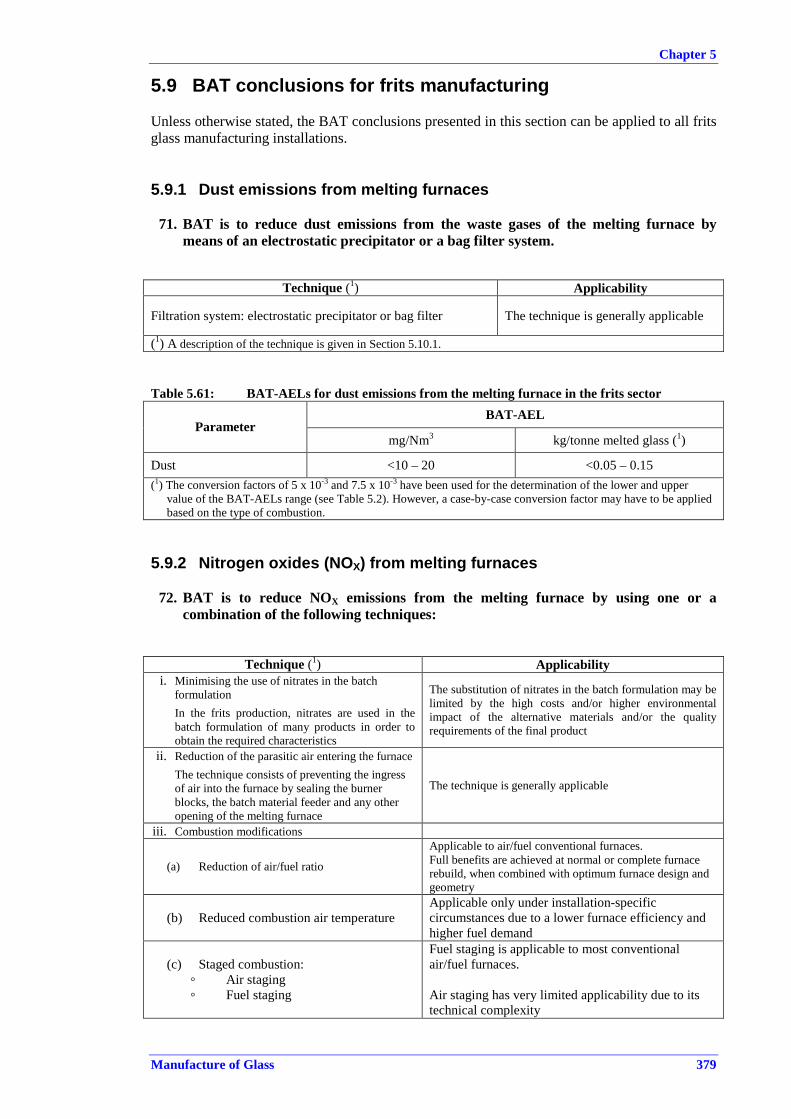
Chapter 5
Manufacture of Glass 379
5.9 BAT conclusions for frits manufacturing Unless otherwise stated, the BAT conclusions presented in this section can be applied to all frits glass manufacturing installations.
5.9.1 Dust emissions from melting furnaces
71. BAT is to reduce dust emissions from the waste gases of the melting furnace by means of an electrostatic precipitator or a bag filter system.
Technique (1) Applicability
Filtration system: electrostatic precipitator or bag filter The technique is generally applicable
(1) A description of the technique is given in Section 5.10.1.
Table 5.61: BAT-AELs for dust emissions from the melting furnace in the frits sector BAT-AEL
Parameter mg/Nm3 kg/tonne melted glass (1)
Dust <10 – 20 <0.05 – 0.15 (1) The conversion factors of 5 x 10⁻³ and 7.5 x 10⁻³ have been used for the determination of the lower and upper
value of the BAT-AELs range (see Table 5.2). However, a case-by-case conversion factor may have to be applied based on the type of combustion.
5.9.2 Nitrogen oxides (NOX) from melting furnaces
72. BAT is to reduce NOX emissions from the melting furnace by using one or a combination of the following techniques:
Technique (1) Applicability i. Minimising the use of nitrates in the batch
formulation
In the frits production, nitrates are used in the batch formulation of many products in order to obtain the required characteristics
The substitution of nitrates in the batch formulation may be limited by the high costs and/or higher environmental impact of the alternative materials and/or the quality requirements of the final product
ii. Reduction of the parasitic air entering the furnace
The technique consists of preventing the ingress of air into the furnace by sealing the burner blocks, the batch material feeder and any other opening of the melting furnace
The technique is generally applicable
iii. Combustion modifications
(a) Reduction of air/fuel ratio
Applicable to air/fuel conventional furnaces. Full benefits are achieved at normal or complete furnace rebuild, when combined with optimum furnace design and geometry
(b) Reduced combustion air temperature Applicable only under installation-specific circumstances due to a lower furnace efficiency and higher fuel demand
(c) Staged combustion: ◦ Air staging ◦ Fuel staging
Fuel staging is applicable to most conventional air/fuel furnaces. Air staging has very limited applicability due to its technical complexity

Chapter 5
380 Manufacture of Glass
(d) Flue-gas recirculation The applicability of this technique is limited to the use of special burners with automatic recirculation of the waste gas
(e) Low-NOX burners
The technique is generally applicable. Full benefits are achieved at normal or complete furnace rebuild, when combined with optimum furnace design and geometry
(f) Fuel choice
The applicability is limited by the constraints associated with the availability of different types of fuel, which may be impacted by the energy policy of the Member State
iv. Oxy-fuel melting The maximum environmental benefits are achieved for applications at the time of a complete furnace rebuild
(1) A description of the technique is given in Section 5.10.2.
Table 5.62: BAT-AELs for NOX emissions from the melting furnace in the frits sector BAT-AEL (1)
Parameter BAT Operating conditions mg/Nm3 kg/tonne
melted glass (2)
Oxy-fuel firing, without nitrates (3) Not applicable <2.5 – 5
Oxy-fuel firing, with use of nitrates Not applicable 5 – 10
Fuel/air, fuel/oxygen-enriched air combustion, without nitrates 500 – 1000 2.5 – 7.5
NOXexpressed as NO2
Primary techniques
Fuel/air, fuel/oxygen-enriched air combustion, with use of nitrates <1600 <12
(1) The ranges take into account the combination of flue-gases from furnaces applying different melting techniques and producing a variety of frit types, with or without nitrates in the batch formulations, which may be conveyed to a single stack, precluding the possibility of characterising each applied melting technique and the different products.
(2) The conversion factors of 5 x 10⁻³ and 7.5 x 10⁻³ have been used for the determination of the lower and higher values of the range. However, a case-by-case conversion factor may have to be applied based on the type of combustion (see Table 5.2). (3) The achievable levels depend on the quality of the natural gas and oxygen available (nitrogen content).
5.9.3 Sulphur oxides (SOX) from melting furnaces
73. BAT is to control SOX emissions from the melting furnace by using one or a combination of the following techniques:
Technique (1) Applicability i. Selection of raw materials for
the batch formulation with a low content of sulphur
The technique is generally applicable within the constraints of the availability of raw materials
ii. Dry or semi-dry scrubbing, in combination with a filtration system
The technique is generally applicable
iii. Use of low sulphur content fuels
The applicability may be limited by the constraints associated with the availability of low sulphur fuels, which may be impacted by the energy policy of the Member State
(1) A description of the techniques is given in Section 5.10.3.

Chapter 5
Manufacture of Glass 381
Table 5.63: BAT-AELs for SOX emissions from the melting furnace in the frits sector BAT-AEL Parameter mg/Nm3 kg/tonne melted glass (1)
SOX, expressed as SO2 <50 – 200 <0.25 – 1.5
(1) The conversion factors of 5 x 10⁻³ and 7.5 x 10⁻³ have been used; however, the values indicated in the table may have been approximated. A case-by-case conversion factor may have to be applied based on the type of combustion (see Table 5.2).
5.9.4 Hydrogen chloride (HCl) and hydrogen fluoride (HF) from melting furnaces
74. BAT is to reduce HCl and HF emissions from the melting furnace by using one or a
combination of the following techniques:
Technique (1) Applicability i. Selection of raw materials for the batch formulation
with a low content of chlorine and fluorine
The technique is generally applicable within the constraints of the batch formulation and the availability of raw materials
ii. Minimisation of the fluorine compounds in the batch formulation when used to ensure the quality of the final product
Fluorine compounds are used to confer particular characteristics to the frits (i.e. thermal and chemical resistance)
The minimisation or substitution of fluorine compounds with alternative materials is limited by quality requirements of the product
iii. Dry or semi-dry scrubbing, in combination with a filtration system The technique is generally applicable
(1) A description of the techniques is given in Section 5.10.4.
Table 5.64: BAT-AELs for HCl and HF emissions from the melting furnace in the frits sector BAT-AEL Parameter mg/Nm3 kg/tonne melted glass (1)
Hydrogen chloride, expressed as HCl <10 <0.05
Hydrogen fluoride, expressed as HF <5 <0.03 (1) The conversion factor of 5 x 10⁻³ has been used with some values being approximated. A case-by-case conversion
factor may have to be applied based on the type of combustion (see Table 5.2).
5.9.5 Metals from melting furnaces 75. BAT is to reduce metal emissions from the melting furnace by using one or a
combination of the following techniques:
Technique (1) Applicability
i. Selection of raw materials for the batch formulation with a low content of metals
The technique is generally applicable within the constraints of the type of frit produced at the installation and the availability of raw materials
ii. Minimising of the use of metal compounds in the batch formulation, where colouring is required or other specific characteristics are conferred to the frit
iii. Dry or semi-dry scrubbing, in combination with a filtration system
The techniques are generally applicable
(1) A description of the techniques is given in Section 5.10.5.

Chapter 5
382 Manufacture of Glass
Table 5.65: BAT-AELs for metal emissions from the melting furnace in the frits sector BAT-AEL (1)
Parameter mg/Nm3 kg/tonne melted glass (2)
Σ (As, Co, Ni, Cd, Se, CrVI) <1 <7.5 × 10⁻³ Σ (As, Co, Ni, Cd, Se, CrVI, Sb, Pb, CrIII, Cu, Mn, V, Sn) <5 <37 × 10-3
(1) The levels refer to the sum of metals present in the flue-gases in both solid and gaseous phases. (2) The conversion factor of 7.5 x 10⁻³ has been used. A case-by-case conversion factor may have to be applied based
on the type of combustion (see Table 5.2).
5.9.6 Emissions from downstream processes
76. For downstream dusty processes, BAT is to reduce emissions by using one or a combination of the following techniques:
Technique (1) Applicability i. Applying wet milling techniques
The technique consists of grinding the frit to the desired particle size distribution with sufficient liquid to form a slurry. The process is generally carried out in alumina ball mills with water
ii. Operating dry milling and dry product packaging under an efficient extraction system in conjunction with a fabric filter
A negative pressure is applied to the milling equipment or to the work station where packaging is carried out in order to convey dust emissions to a fabric filter
iii. Applying a filtration system
The techniques are generally applicable
(1) A description of the techniques is given in Section 5.10.1.
Table 5.66: BAT-AELs for air emissions from downstream processes in the frits sector, when treated separately
BAT-AEL Parameter mg/Nm3
Dust 5 – 10
Σ (As, Co, Ni, Cd, Se, CrVI) <1 (1)
Σ (As, Co, Ni, Cd, Se, CrVI, Sb, Pb, CrIII, Cu, Mn, V, Sn) <5 (1)(1) The levels refer to the sum of metals present in the waste gas.
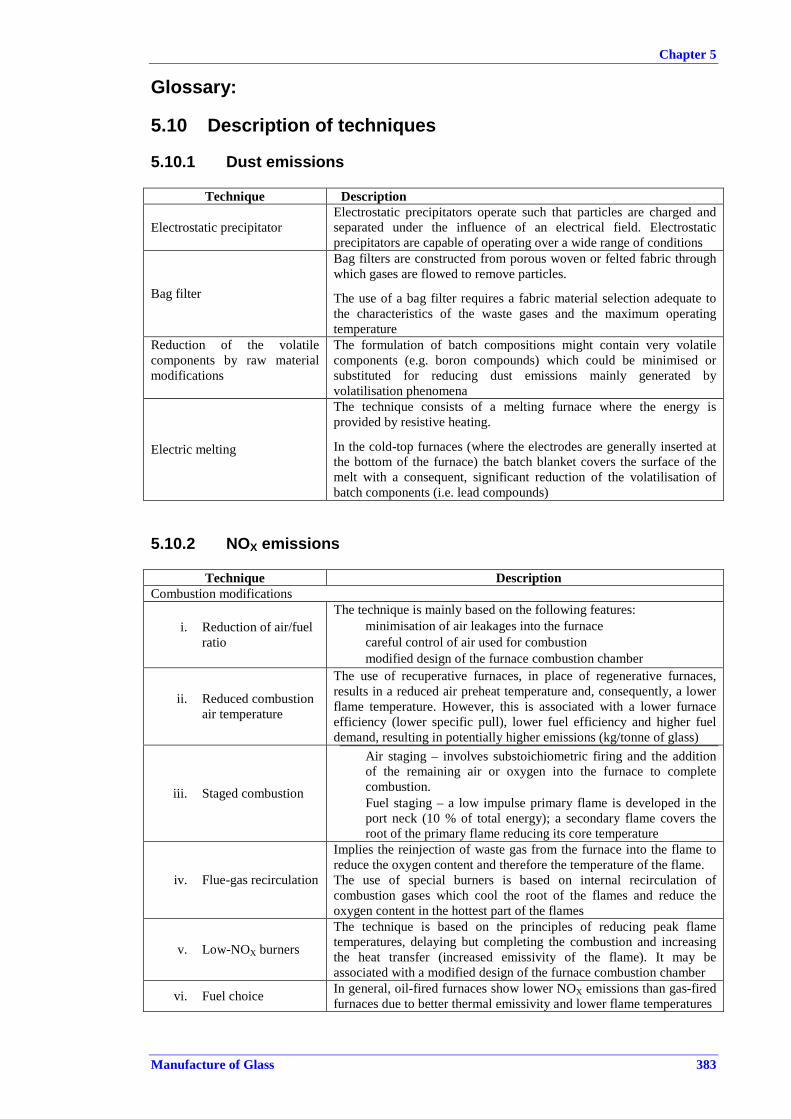
Chapter 5
Manufacture of Glass 383
Glossary: 5.10 Description of techniques 5.10.1 Dust emissions
Technique Description
Electrostatic precipitator Electrostatic precipitators operate such that particles are charged and separated under the influence of an electrical field. Electrostatic precipitators are capable of operating over a wide range of conditions
Bag filter
Bag filters are constructed from porous woven or felted fabric through which gases are flowed to remove particles.
The use of a bag filter requires a fabric material selection adequate to the characteristics of the waste gases and the maximum operating temperature
Reduction of the volatile components by raw material modifications
The formulation of batch compositions might contain very volatile components (e.g. boron compounds) which could be minimised or substituted for reducing dust emissions mainly generated by volatilisation phenomena
Electric melting
The technique consists of a melting furnace where the energy is provided by resistive heating.
In the cold-top furnaces (where the electrodes are generally inserted at the bottom of the furnace) the batch blanket covers the surface of the melt with a consequent, significant reduction of the volatilisation of batch components (i.e. lead compounds)
5.10.2 NOX emissions
Technique Description Combustion modifications
i. Reduction of air/fuel ratio
The technique is mainly based on the following features: • minimisation of air leakages into the furnace • careful control of air used for combustion • modified design of the furnace combustion chamber
ii. Reduced combustion air temperature
The use of recuperative furnaces, in place of regenerative furnaces, results in a reduced air preheat temperature and, consequently, a lower flame temperature. However, this is associated with a lower furnace efficiency (lower specific pull), lower fuel efficiency and higher fuel demand, resulting in potentially higher emissions (kg/tonne of glass)
iii. Staged combustion
• Air staging – involves substoichiometric firing and the addition of the remaining air or oxygen into the furnace to complete combustion.
• Fuel staging – a low impulse primary flame is developed in the port neck (10 % of total energy); a secondary flame covers the root of the primary flame reducing its core temperature
iv. Flue-gas recirculation
Implies the reinjection of waste gas from the furnace into the flame to reduce the oxygen content and therefore the temperature of the flame. The use of special burners is based on internal recirculation of combustion gases which cool the root of the flames and reduce the oxygen content in the hottest part of the flames
v. Low-NOX burners
The technique is based on the principles of reducing peak flame temperatures, delaying but completing the combustion and increasing the heat transfer (increased emissivity of the flame). It may be associated with a modified design of the furnace combustion chamber
vi. Fuel choice In general, oil-fired furnaces show lower NOX emissions than gas-fired furnaces due to better thermal emissivity and lower flame temperatures
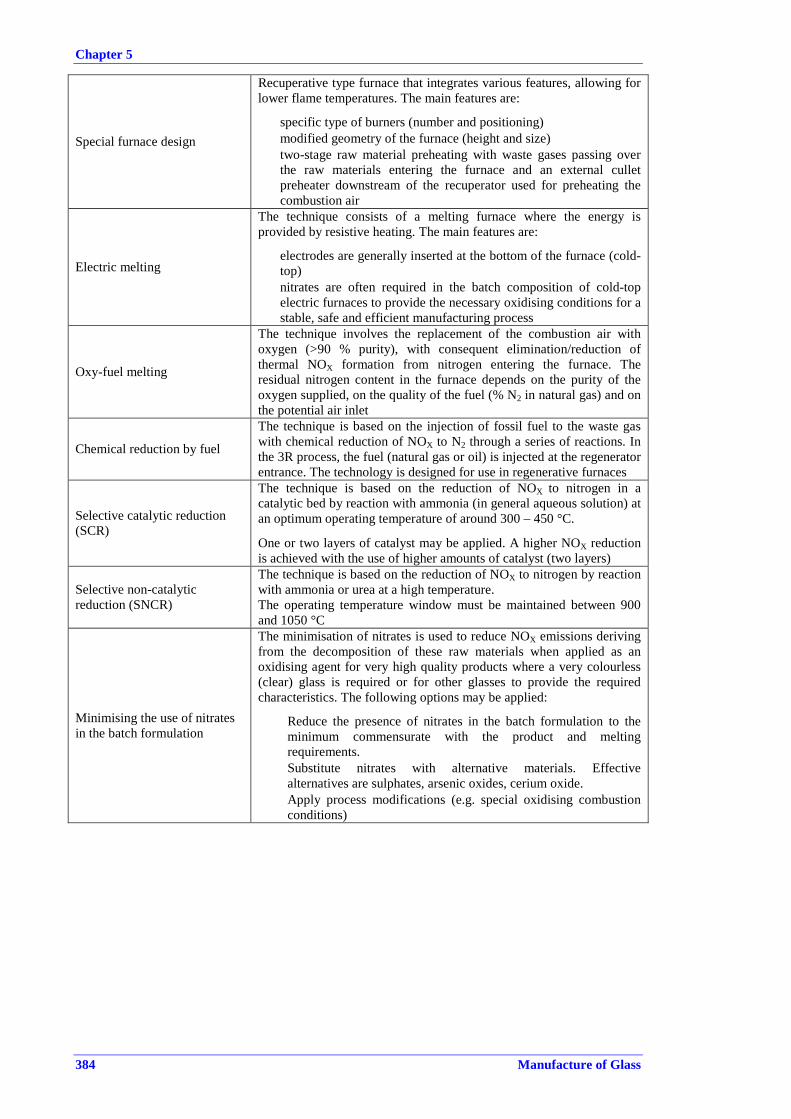
Chapter 5
384 Manufacture of Glass
Special furnace design
Recuperative type furnace that integrates various features, allowing for lower flame temperatures. The main features are:
• specific type of burners (number and positioning) • modified geometry of the furnace (height and size) • two-stage raw material preheating with waste gases passing over
the raw materials entering the furnace and an external cullet preheater downstream of the recuperator used for preheating the combustion air
Electric melting
The technique consists of a melting furnace where the energy is provided by resistive heating. The main features are:
• electrodes are generally inserted at the bottom of the furnace (cold-top)
• nitrates are often required in the batch composition of cold-top electric furnaces to provide the necessary oxidising conditions for a stable, safe and efficient manufacturing process
Oxy-fuel melting
The technique involves the replacement of the combustion air with oxygen (>90 % purity), with consequent elimination/reduction of thermal NOX formation from nitrogen entering the furnace. The residual nitrogen content in the furnace depends on the purity of the oxygen supplied, on the quality of the fuel (% N2 in natural gas) and on the potential air inlet
Chemical reduction by fuel
The technique is based on the injection of fossil fuel to the waste gas with chemical reduction of NOX to N2 through a series of reactions. In the 3R process, the fuel (natural gas or oil) is injected at the regenerator entrance. The technology is designed for use in regenerative furnaces
Selective catalytic reduction (SCR)
The technique is based on the reduction of NOX to nitrogen in a catalytic bed by reaction with ammonia (in general aqueous solution) at an optimum operating temperature of around 300 – 450 °C.
One or two layers of catalyst may be applied. A higher NOX reduction is achieved with the use of higher amounts of catalyst (two layers)
Selective non-catalytic reduction (SNCR)
The technique is based on the reduction of NOX to nitrogen by reaction with ammonia or urea at a high temperature. The operating temperature window must be maintained between 900 and 1050 °C
Minimising the use of nitrates in the batch formulation
The minimisation of nitrates is used to reduce NOX emissions deriving from the decomposition of these raw materials when applied as an oxidising agent for very high quality products where a very colourless (clear) glass is required or for other glasses to provide the required characteristics. The following options may be applied:
• Reduce the presence of nitrates in the batch formulation to the minimum commensurate with the product and melting requirements.
• Substitute nitrates with alternative materials. Effective alternatives are sulphates, arsenic oxides, cerium oxide.
• Apply process modifications (e.g. special oxidising combustion conditions)

Chapter 5
Manufacture of Glass 385
5.10.3 SOX emissions
Technique Description
Dry or semi-dry scrubbing, in combination with a filtration system
Dry powder or a suspension/solution of alkaline reagent are introduced and dispersed in the waste gas stream. The material reacts with the sulphur gaseous species to form a solid which has to be removed by filtration (bag filter or electrostatic precipitator). In general, the use of a reaction tower improves the removal efficiency of the scrubbing system
Minimisation of the sulphur content in the batch formulation and optimisation of the sulphur balance
The minimisation of sulphur content in the batch formulation is applied to reduce SOX emissions deriving from the decomposition of sulphur-containing raw materials (in general, sulphates) used as fining agents. The effective reduction of SOX emissions depends on the retention of sulphur compounds in the glass, which may vary significantly depending on the glass type, and on the optimisation of the sulphur balance
Use of low sulphur content fuels
The use of natural gas or low sulphur fuel oil is applied to reduce the amount of SOX emissions deriving from the oxidation of sulphur contained in the fuel during combustion
5.10.4 HCl, HF emissions
Technique Description
Selection of raw materials for the batch formulation with a low content of chlorine and fluorine
The technique consists of a careful selection of raw materials that may contain chlorides and fluorides as impurities (e.g. synthetic soda ash, dolomite, external cullet, recycled filter dust) in order to reduce at source HCl and HF emissions which arise from the decomposition of these materials during the melting process
Minimisation of the fluorine and/or chlorine compounds in the batch formulation and optimisation of the fluorine and/or chlorine mass balance
The minimisation of fluorine and/or chlorine emissions from the melting process may be achieved by minimising/reducing the quantity of these substances used in the batch formulation to the minimum commensurate with the quality of the final product. Fluorine compounds (e.g. fluorspar, cryolite, fluorsilicate) are used to confer particular characteristics to special glasses (e.g. opaque glass, optical glass). Chlorine compounds may be used as fining agents
Dry or semi-dry scrubbing, in combination with a filtration system
Dry powder or a suspension/solution of alkaline reagent are introduced and dispersed in the waste gas stream. The material reacts with the gaseous chlorides and fluorides to form a solid which has to be removed by filtration (electrostatic precipitator or bag filter)
5.10.5 Metal emissions
Technique Description
Selection of raw materials for the batch formulation with a low content of metals
The technique consists of a careful selection of batch materials that may contain metals as impurities (e.g. external cullet), in order to reduce at source metal emissions which arise from the decomposition of these materials during the melting process
Minimising the use of metal compounds in the batch formulation, where colouring and decolourising of glass is needed, subject to consumer glass quality requirements
The minimisation of metal emissions from the melting process may be achieved as follows:
• minimising the quantity of metal compounds in the batch formulation (e.g. iron, chromium, cobalt, copper, manganese compounds) in the production of coloured glasses
• minimising the quantity of selenium compounds and cerium oxide used as decolourising agents for the production of clear glass
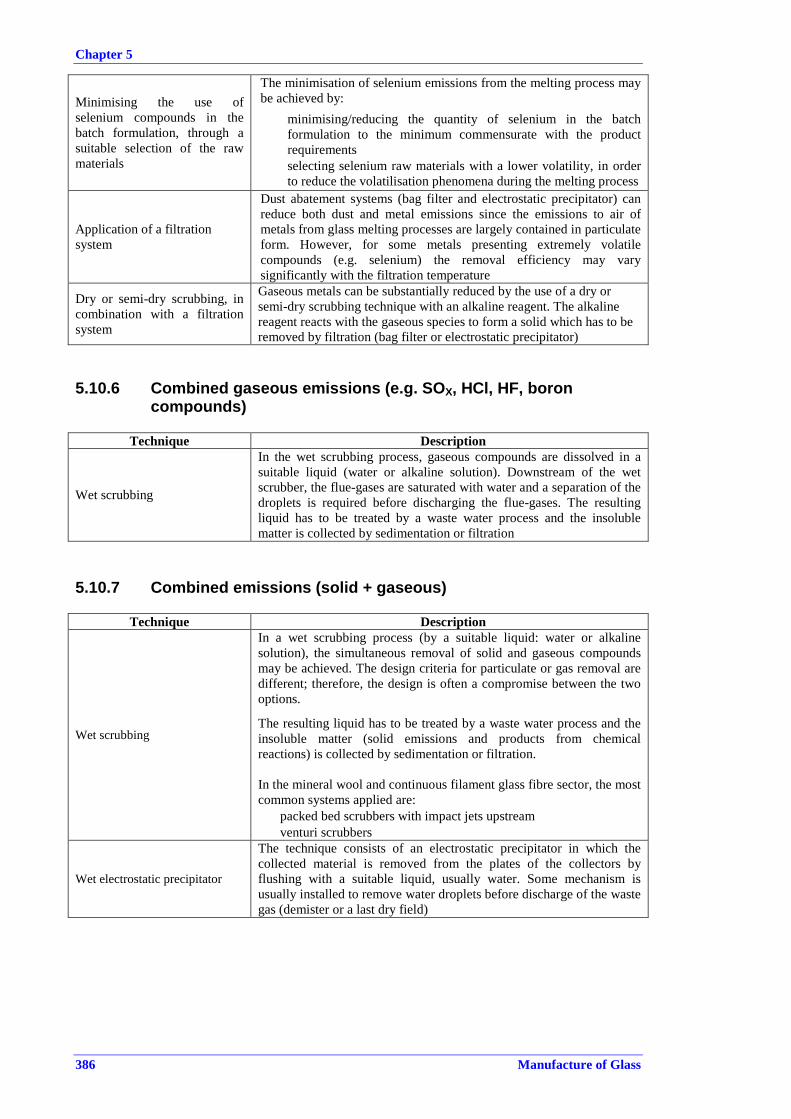
Chapter 5
386 Manufacture of Glass
Minimising the use of selenium compounds in the batch formulation, through a suitable selection of the raw materials
The minimisation of selenium emissions from the melting process may be achieved by:
• minimising/reducing the quantity of selenium in the batch formulation to the minimum commensurate with the product requirements
• selecting selenium raw materials with a lower volatility, in order to reduce the volatilisation phenomena during the melting process
Application of a filtration system
Dust abatement systems (bag filter and electrostatic precipitator) can reduce both dust and metal emissions since the emissions to air of metals from glass melting processes are largely contained in particulate form. However, for some metals presenting extremely volatile compounds (e.g. selenium) the removal efficiency may vary significantly with the filtration temperature
Dry or semi-dry scrubbing, in combination with a filtration system
Gaseous metals can be substantially reduced by the use of a dry or semi-dry scrubbing technique with an alkaline reagent. The alkaline reagent reacts with the gaseous species to form a solid which has to be removed by filtration (bag filter or electrostatic precipitator)
5.10.6 Combined gaseous emissions (e.g. SOX, HCl, HF, boron compounds)
Technique Description
Wet scrubbing
In the wet scrubbing process, gaseous compounds are dissolved in a suitable liquid (water or alkaline solution). Downstream of the wet scrubber, the flue-gases are saturated with water and a separation of the droplets is required before discharging the flue-gases. The resulting liquid has to be treated by a waste water process and the insoluble matter is collected by sedimentation or filtration
5.10.7 Combined emissions (solid + gaseous)
Technique Description
Wet scrubbing
In a wet scrubbing process (by a suitable liquid: water or alkaline solution), the simultaneous removal of solid and gaseous compounds may be achieved. The design criteria for particulate or gas removal are different; therefore, the design is often a compromise between the two options.
The resulting liquid has to be treated by a waste water process and the insoluble matter (solid emissions and products from chemical reactions) is collected by sedimentation or filtration. In the mineral wool and continuous filament glass fibre sector, the most common systems applied are:
• packed bed scrubbers with impact jets upstream • venturi scrubbers
Wet electrostatic precipitator
The technique consists of an electrostatic precipitator in which the collected material is removed from the plates of the collectors by flushing with a suitable liquid, usually water. Some mechanism is usually installed to remove water droplets before discharge of the waste gas (demister or a last dry field)

Chapter 5
Manufacture of Glass 387
5.10.8 Emissions from cutting, grinding, polishing operations
Technique Description Performing dusty operations (e.g. cutting, grinding, polishing) under liquid
Water is generally used as a coolant for cutting, grinding and polishing operations and for preventing dust emissions. An extraction system equipped with a mist eliminator may be necessary
Applying a bag filter system The use of bag filters is suitable for the reduction of both dust and metal emissions since metals from downstream processes are largely contained in particulate form
Minimising the losses of polishing product by ensuring a good sealing of the application system
Acid polishing is performed by immersion of the glass articles in a polishing bath of hydrofluoric and sulphuric acids. The release of fumes may be minimised by a good design and maintenance of the application system in order to minimise losses
Applying a secondary technique, e.g. wet scrubbing
Wet scrubbing with water is used for the treatment of waste gases, due to the acidic nature of the emissions and the high solubility of the gaseous pollutants to be removed
5.10.9 H2S, VOC emissions
Technique Description
Waste gas incineration
The technique consists of an afterburner system which oxidises the hydrogen sulphide (generated by strong reducing conditions in the melting furnace) to sulphur dioxide and carbon monoxide to carbon dioxide. Volatile organic compounds are thermally incinerated with consequent oxidation to carbon dioxide, water and other combustion products (e.g. NOX, SOX)
5.10.10 Dust emissions
Technique Description
Electrostatic precipitator Electrostatic precipitators operate such that particles are charged and separated under the influence of an electrical field. Electrostatic precipitators are capable of operating over a wide range of conditions
Bag filter
Bag filters are constructed from porous woven or felted fabric through which gases are flowed to remove particles.
The use of a bag filter requires a fabric material selection adequate to the characteristics of the waste gases and the maximum operating temperature
Reduction of the volatile components by raw material modifications
The formulation of batch compositions might contain very volatile components (e.g. boron compounds) which could be minimised or substituted for reducing dust emissions mainly generated by volatilisation phenomena
Electric melting
The technique consists of a melting furnace where the energy is provided by resistive heating.
In the cold-top furnaces (where the electrodes are generally inserted at the bottom of the furnace) the batch blanket covers the surface of the melt with a consequent, significant reduction of the volatilisation of batch components (i.e. lead compounds)

Chapter 5
388 Manufacture of Glass
5.10.11 NOX emissions
Technique Description Combustion modifications
(a) Reduction of air/fuel ratio
The technique is mainly based on the following features: • minimisation of air leakages into the furnace • careful control of air used for combustion • modified design of the furnace combustion chamber
(b) Reduced combustion air temperature
The use of recuperative furnaces, in place of regenerative furnaces, results in a reduced air preheat temperature and, consequently, a lower flame temperature. However, this is associated with a lower furnace efficiency (lower specific pull), lower fuel efficiency and higher fuel demand, resulting in potentially higher emissions (kg/tonne of glass)
(c) Staged combustion
• Air staging – involves substoichiometric firing and the addition of the remaining air or oxygen into the furnace to complete combustion.
• Fuel staging – a low impulse primary flame is developed in the port neck (10 % of total energy); a secondary flame covers the root of the primary flame reducing its core temperature
(d) Flue-gas recirculation
Implies the reinjection of waste gas from the furnace into the flame to reduce the oxygen content and therefore the temperature of the flame. The use of special burners is based on internal recirculation of combustion gases which cool the root of the flames and reduce the oxygen content in the hottest part of the flames
(e) Low-NOX burners
The technique is based on the principles of reducing peak flame temperatures, delaying but completing the combustion and increasing the heat transfer (increased emissivity of the flame). It may be associated with a modified design of the furnace combustion chamber
(f) Fuel choice In general, oil-fired furnaces show lower NOX emissions than gas-fired furnaces due to better thermal emissivity and lower flame temperatures
Special furnace design
Recuperative type furnace that integrates various features, allowing for lower flame temperatures. The main features are:
• specific type of burners (number and positioning) • modified geometry of the furnace (height and size) • two-stage raw material preheating with waste gases passing over the raw materials
entering the furnace and an external cullet preheater downstream of the recuperator used for preheating the combustion air
Electric melting
The technique consists of a melting furnace where the energy is provided by resistive heating. The main features are:
• electrodes are generally inserted at the bottom of the furnace (cold-top) • nitrates are often required in the batch composition of cold-top electric furnaces to
provide the necessary oxidising conditions for a stable, safe and efficient manufacturing process
Oxy-fuel melting
The technique involves the replacement of the combustion air with oxygen (>90 % purity), with consequent elimination/reduction of thermal NOX formation from nitrogen entering the furnace. The residual nitrogen content in the furnace depends on the purity of the oxygen supplied, on the quality of the fuel (% N2 in natural gas) and on the potential air inlet
Chemical reduction by fuel
The technique is based on the injection of fossil fuel to the waste gas with chemical reduction of NOX to N2 through a series of reactions. In the 3R process, the fuel (natural gas or oil) is injected at the regenerator entrance. The technology is designed for use in regenerative furnaces
Selective catalytic reduction (SCR)
The technique is based on the reduction of NOX to nitrogen in a catalytic bed by reaction with ammonia (in general aqueous solution) at an optimum operating temperature of around 300 – 450 °C. One or two layers of catalyst may be applied. A higher NOX reduction is achieved with the use of higher amounts of catalyst (two layers)
Selective non-catalytic reduction (SNCR)
The technique is based on the reduction of NOX to nitrogen by reaction with ammonia or urea at a high temperature. The operating temperature window must be maintained between 900 and 1050 °C
Minimising the use of nitrates in the batch formulation
The minimisation of nitrates is used to reduce NOX emissions deriving from the decomposition of these raw materials when applied as an oxidising agent for very high quality products where a very colourless (clear) glass is required or for other glasses to provide the required characteristics. The following options may be applied:
• Reduce the presence of nitrates in the batch formulation to the minimum commensurate with the product and melting requirements.
• Substitute nitrates with alternative materials. Effective alternatives are sulphates, arsenic oxides, cerium oxide.
• Apply process modifications (e.g. special oxidising combustion conditions)

Chapter 5
Manufacture of Glass 389
5.10.12 SOX emissions
Technique Description
Dry or semi-dry scrubbing, in combination with a filtration system
Dry powder or a suspension/solution of alkaline reagent are introduced and dispersed in the waste gas stream. The material reacts with the sulphur gaseous species to form a solid which has to be removed by filtration (bag filter or electrostatic precipitator). In general, the use of a reaction tower improves the removal efficiency of the scrubbing system
Minimisation of the sulphur content in the batch formulation and optimisation of the sulphur balance
The minimisation of sulphur content in the batch formulation is applied to reduce SOX emissions deriving from the decomposition of sulphur-containing raw materials (in general, sulphates) used as fining agents. The effective reduction of SOX emissions depends on the retention of sulphur compounds in the glass, which may vary significantly depending on the glass type, and on the optimisation of the sulphur balance
Use of low sulphur content fuels
The use of natural gas or low sulphur fuel oil is applied to reduce the amount of SOX emissions deriving from the oxidation of sulphur contained in the fuel during combustion
5.10.13 HCl, HF emissions
Technique Description
Selection of raw materials for the batch formulation with a low content of chlorine and fluorine
The technique consists of a careful selection of raw materials that may contain chlorides and fluorides as impurities (e.g. synthetic soda ash, dolomite, external cullet, recycled filter dust) in order to reduce at source HCl and HF emissions which arise from the decomposition of these materials during the melting process
Minimisation of the fluorine and/or chlorine compounds in the batch formulation and optimisation of the fluorine and/or chlorine mass balance
The minimisation of fluorine and/or chlorine emissions from the melting process may be achieved by minimising/reducing the quantity of these substances used in the batch formulation to the minimum commensurate with the quality of the final product. Fluorine compounds (e.g. fluorspar, cryolite, fluorsilicate) are used to confer particular characteristics to special glasses (e.g. opaque glass, optical glass). Chlorine compounds may be used as fining agents
Dry or semi-dry scrubbing, in combination with a filtration system
Dry powder or a suspension/solution of alkaline reagent are introduced and dispersed in the waste gas stream. The material reacts with the gaseous chlorides and fluorides to form a solid which has to be removed by filtration (electrostatic precipitator or bag filter)
5.10.14 Metal emissions
Technique Description
Selection of raw materials for the batch formulation with a low content of metals
The technique consists of a careful selection of batch materials that may contain metals as impurities (e.g. external cullet), in order to reduce at source metal emissions which arise from the decomposition of these materials during the melting process
Minimising the use of metal compounds in the batch formulation, where colouring and decolourising of glass is needed, subject to consumer glass quality requirements
The minimisation of metal emissions from the melting process may be achieved as follows:
• minimising the quantity of metal compounds in the batch formulation (e.g. iron, chromium, cobalt, copper, manganese compounds) in the production of coloured glasses
• minimising the quantity of selenium compounds and cerium oxide used as decolourising agents for the production of clear glass

Chapter 5
390 Manufacture of Glass
Minimising the use of selenium compounds in the batch formulation, through a suitable selection of the raw materials
The minimisation of selenium emissions from the melting process may be achieved by:
• minimising/reducing the quantity of selenium in the batch formulation to the minimum commensurate with the product requirements
• selecting selenium raw materials with a lower volatility, in order to reduce the volatilisation phenomena during the melting process
Application of a filtration system
Dust abatement systems (bag filter and electrostatic precipitator) can reduce both dust and metal emissions since the emissions to air of metals from glass melting processes are largely contained in particulate form. However, for some metals presenting extremely volatile compounds (e.g. selenium) the removal efficiency may vary significantly with the filtration temperature
Dry or semi-dry scrubbing, in combination with a filtration system
Gaseous metals can be substantially reduced by the use of a dry or semi-dry scrubbing technique with an alkaline reagent. The alkaline reagent reacts with the gaseous species to form a solid which has to be removed by filtration (bag filter or electrostatic precipitator)
5.10.15 Combined gaseous emissions (e.g. SOX, HCl, HF, boron compounds)
Technique Description
Wet scrubbing
In the wet scrubbing process, gaseous compounds are dissolved in a suitable liquid (water or alkaline solution). Downstream of the wet scrubber, the flue-gases are saturated with water and a separation of the droplets is required before discharging the flue-gases. The resulting liquid has to be treated by a waste water process and the insoluble matter is collected by sedimentation or filtration
5.10.16 Combined emissions (solid + gaseous)
Technique Description
Wet scrubbing
In a wet scrubbing process (by a suitable liquid: water or alkaline solution), the simultaneous removal of solid and gaseous compounds may be achieved. The design criteria for particulate or gas removal are different; therefore, the design is often a compromise between the two options.
The resulting liquid has to be treated by a waste water process and the insoluble matter (solid emissions and products from chemical reactions) is collected by sedimentation or filtration. In the mineral wool and continuous filament glass fibre sector, the most common systems applied are:
• packed bed scrubbers with impact jets upstream • venturi scrubbers
Wet electrostatic precipitator
The technique consists of an electrostatic precipitator in which the collected material is removed from the plates of the collectors by flushing with a suitable liquid, usually water. Some mechanism is usually installed to remove water droplets before discharge of the waste gas (demister or a last dry field)

Chapter 5
Manufacture of Glass 391
5.10.17 Emissions from cutting, grinding, polishing operations
Technique Description Performing dusty operations (e.g. cutting, grinding, polishing) under liquid
Water is generally used as a coolant for cutting, grinding and polishing operations and for preventing dust emissions. An extraction system equipped with a mist eliminator may be necessary
Applying a bag filter system The use of bag filters is suitable for the reduction of both dust and metal emissions since metals from downstream processes are largely contained in particulate form
Minimising the losses of polishing product by ensuring a good sealing of the application system
Acid polishing is performed by immersion of the glass articles in a polishing bath of hydrofluoric and sulphuric acids. The release of fumes may be minimised by a good design and maintenance of the application system in order to minimise losses
Applying a secondary technique, e.g. wet scrubbing
Wet scrubbing with water is used for the treatment of waste gases, due to the acidic nature of the emissions and the high solubility of the gaseous pollutants to be removed
5.10.18 H2S, VOC emissions
Technique Description
Waste gas incineration
The technique consists of an afterburner system which oxidises the hydrogen sulphide (generated by strong reducing conditions in the melting furnace) to sulphur dioxide and carbon monoxide to carbon dioxide. Volatile organic compounds are thermally incinerated with consequent oxidation to carbon dioxide, water and other combustion products (e.g. NOX, SOX)


Chapter 6
Manufacture of Glass 393
6 EMERGING TECHNIQUES In general, the emerging techniques for the glass industry focus on the reduction of the high investment costs for the melting furnace (i.e. new melting techniques), on energy savings (e.g. batch and cullet preheaters, new furnace design, innovative burners) and on the improvement of the environmental performance of the production process (e.g. new product formulations, waste recovery, reduced emissions and improved removal efficiencies for the main pollutants). Some of the emerging techniques reported in the original GLS BREF did not prove successful, while others have been completely developed and implemented within the different sectors of the glass industry. Improved combustion techniques are among the main objectives, with the aim of reducing energy consumption and, at the same time, minimising NOX emissions by primary measures. Combustion control systems, different types of burners and new furnace designs are always investigated and substantial innovations and developments are achieved even though they are not reported specifically in this section as emerging techniques. In particular, low-NOX burners, in combination with combustion control systems, are still undergoing constant development to optimise performance in terms of energy efficiency and pollution reduction.
6.1 Glas Flox® high-temperature combustion system Description Glas Flox® burners represent an advanced technique for glass melting. The functioning principle is based on internal recirculation of combustion gases, which are sucked in the flames by the low pressure at the burner outlet (due to high gas injection velocities through the burners). The recirculation gas will cool the root of the flames and will reduce the oxygen content in the hottest part of the flames. Compared to the standard gas burners, Glas Flox® burners operate at higher combustion speed and lead to an improved covering of the flame over the glass melt bath due to the reaction intensity as well as an expanded burning zone. These characteristics lead to a better energy transfer into the glass bath. The complete combustion operates in infrared and runs evenly without significant temperature and heat transfer gradients. Glas Flox® burners operate with reduced flame temperatures near the burner nozzles/outlets resulting in a reduced generation of thermal NOX.
The overall heat transfer characteristics of Glas Flox® burners and Flox combustion technology in glass furnaces compared to conventional furnaces (in particular recuperative furnaces) would require further investigations by measurements and mathematical modelling. Achieved environmental benefits The reported benefits are a reduction of about 50 % in NOX emissions and lower specific energy consumption with a consequent reduction of CO2 emissions. The best achieved performance reported shows a concentration value of 484 mg/Nm3 of NOxemissions, from a starting level of 1183 mg/Nm3 when a conventional combustion system was applied. Applicability The burners are applicable only on recuperative glass furnaces. Driving force for implementation A reduction of NOX emissions together with a lower energy consumption compared to the standard burners are the main driving forces for applying the Glas Flox® burners.

Chapter 6
394 Manufacture of Glass
Example plants An application of the Glas Flox® high-temperature combustion system is currently (2010) running in Germany for the production of glass for light bulbs. Reference literature [117, GWI, VDI-Berichte Nr. 1988 2007]
6.2 Advanced cullet and batch preheaters The main examples of batch and cullet preheaters in use within the glass manufacturing industry are described in Section 4.8.5 and, therefore are not considered emerging techniques. However, significant developments are underway, in particular for the application of cullet and batch preheating to oxy-fuel-fired furnaces. In general, the conversion of traditional furnaces to oxy-fuel firing results in higher glass productivity and quality, lower emissions of NOX and particulate, lower energy consumption and lower rebuild costs. However, the additional cost of oxygen still represents a significant economic barrier for the application of oxy-fuel firing to many glass furnaces. The economics of oxy-fuel conversion would be much more attractive if the energy content of the flue-gases (which are released at very high temperatures of up to 1400 °C) could be recovered. The existing cullet and batch preheaters operate at temperatures in the range of 500 – 600 °C; thus, the flue-gases are cooled down with dilution air, with a consequent increase in volume. The advanced cullet and batch preheaters are designed to operate with flue-gases that are not cooled or are only slightly cooled. In particular, in the advanced cullet and batch preheater system developed by Praxair (BCP system), flue-gases enter the preheater at temperatures in the range of 1200 – 1400 °C. At the time of writing (2010), there are currently two projects, which are developed by different teams: • PRECIOUS-project under development by Zippe Industrieanlagen GmbH in cooperation with the
RWTH Aachen University, within the support programme of the Deutsche Bundesstiftung Umwelt (DBU);
• PRAXAIR-BCP system under development at the Praxair Technology Center.
6.2.1 PRECIOUS-project The aim of the PRECIOUS-project is to reduce the CO2 and NOX emissions by preheating the cullet and/or the batch with the waste heat of an oxy-fuel-fired furnace. The preheating technology could theoretically be installed in any furnace with a cullet ratio of more than 50 %. Tests of this cullet and batch preheater are carried out at an oxy-fuel-fired furnace producing glass for light bulbs. An increase of energy efficiency of about 20 % is expected. The completion of the pilot project and the transfer of the technology into a large-scale project are still underway [153, Germany Precious 2007].
6.2.2 PRAXAIR-BCP project Description The PRAXAIR-BCP project’s system is suitable for batch plus cullet preheating and is dedicated to the use of the flue-gases from all oxy-fuel-fired furnaces. The main features of the advanced preheater are the following:

Chapter 6
Manufacture of Glass 395
• indirect heat transfer from the flue-gas to the batch and cullet in the preheater; • the batch plus the cullet (internal and external) is to be preheated to about 480 – 600 °C; • the flue-gases from the oxy-gas or oxy-fuel oil fired furnaces are not or are hardly diluted
with cold air; • in the first stage (indirect radiation heat transfer section) flue-gases enter the
section without dilution, typically at 1200 – 1400 °C; • the organic compounds present in the external cullet are completely removed (fumes are
burnt); • the unit is a modular system and can be adapted to the required size; • batch and flue-gases can be bypassed in case of maintenance; • special attention is given to avoid batch carryover in the furnace, by adapting the batch
chargers; • there is no batch carbon loss when producing amber glass by a special preheater design. A schematic diagram of the advanced batch and cullet preheater is given in Figure 6.1, where the positioning of the radiative heat transfer section (RHRS) and the optional convective heat recovery section (CHRS) are shown.
Figure 6.1: Schematic diagram of the advanced batch and cullet preheater
Achieved environmental benefits The reported (expected) benefits are an emission reduction of about 15 – 30 % (CO2, NOX and particulate matter) compared to an oxy-fuel-fired furnace without a preheater. The reduction in energy consumption is estimated at about ± 1 GJ per tonne of melted glass, compared with an oxy-fuel-fired furnace without a preheater. Applicability In principle, the advanced BCP technique is applicable for almost all normal cullet/batch ratios.

Chapter 6
396 Manufacture of Glass
Economics The application of the BCP technique is expected to result in potential energy savings (15 – 25 %), reduced oxygen consumption for the combustion and a potential increase of the production rate (10 – 20 %). The payback time for the equipment is estimated to be between 1 and 3 years. Driving force for implementation The recovery of energy from the flue-gases and the consequent reduction of the energy consumption used in the production represents the main driving forces for applying the advanced cullet and batch preheater. A significant reduction of direct and indirect emissions would be an additional driving force for implementation. Example plants A pilot scale system (15 tonnes of batch per day) has been tested by Praxair in 2007, at Tonawanda, NY, US, with preheating temperatures of 480 – 535 °C. The design of a larger system to be applied to a commercial glass furnace is the next step in this project. Reference literature [147, Kobayashi et al. 2007] [148, Beerkens 2008]
6.3 New product formulations There are a number of interesting developments regarding batch and product formulations which are summarised below. New glass composition for continuous filament glass fibre A new glass composition for continuous filament glass fibre has been developed by one producer. This glass composition addresses two main air emission components typical of E-glass melting, i.e. particulates and fluorides. The batch formulation does not include boron or added fluorine. The elimination of boron and added fluoride render this glass more difficult to melt (higher melting temperature) and to fiberise, and can lead to some increase in energy requirements. The new formulation is applied at industrial installations and indicative emission data are available in Section 3.5 above and Section 4.4.1.1. The formulation has been developed by one company and is covered by patents, and therefore is not generally available within the sector. This type of continuous filament glass fibre is now (2010) produced by two companies in Europe and probably covers around one fourth or one third of the European production; therefore, it may not be considered an emerging technique. However, this technique cannot be considered ‘available’ due to the patents covering the production process and due to the fact that very little information is currently available. New binder formulation for mineral wool products Mineral wool producers are continuously improving the properties of their products to reduce the environmental impact and to enhance product performance. Some producers have carried out significant research and development to introduce new binders which fully or partially substitute for the phenol-formaldehyde binders which have been typically used in the industry for many years. Several patents have been published and/or delivered. The new formulations are based on either: • phenol-formaldehyde resins with significantly lower formaldehyde content or • other types of resins based on plant/vegetable sources or acrylic which contain no phenol-
formaldehyde as ingredients.

Chapter 6
Manufacture of Glass 397
Some of these binders have been introduced and are available on the market. In other cases the impact of new solutions has to be fully assessed to confirm their suitability from manufacturing, product characteristic and environmental impact viewpoints. Reference literature [174, EURIMA position 2010] [150, Knauf 2008]
6.4 Waste injection in the stone wool production process Description The amount of waste produced by the stone wool production installations in the EU is estimated to be between 160 000 and 480 000 tonnes per year. The waste comes mainly from the fiberising process, where about 10 – 20 % of the melt is not fiberised completely and is rejected. A stone wool line with a yearly production of 20 000 tonnes/year generates between 2 000 and 4000 tonnes/year of fiberising process waste. At the time of writing (2010), briquetting is the only system applied to reuse the waste into the melting process. This system requires the grinding of the waste and mixing with cement. The use of briquettes is associated with an increase in atmospheric emissions, consisting mainly of sulphur oxide emissions due to the sulphur content of the cement (see Section 3.8.2.1). The waste injection technique consists of feeding fine fractioned material directly into the melting zone, in a stone wool cupola furnace. The injected material is dry production waste. The waste (shots) from the fiberising process, having a size of 0 – 6 mm, is transported to a hopper and a pressurised feeding tank. At the bottom of the tank there is a rotating feeder, which feeds small doses of material into three pneumatic feeding pipes. Lances connected to the cupola furnace, close to the tuyères, are placed at the end of the pipes. The material moves through the lance where oxygen is added into the melting zone in the cupola furnace. The machinery is exposed to an extremely harsh environment. The temperature in the melting zone is above 1700 °C; at the same time, the materials which are fed in are hard and abrasive, which puts a significant strain on the materials of the machinery design. Achieved environmental benefits With this technique, it is possible to recycle waste from the fiberising process by up to 80 – 100 %; this corresponds to a reduction of mineral raw materials in the batch composition of at least 7 %. The system is also designed to operate with other types of fine fractioned raw materials and solid fuels, such as mineral raw materials and coke. The application of waste injection results in a reduced amount of waste to landfill, a reduced consumption of coke for the melting process and consequently fewer emissions. Emissions of sulphur oxides are reduced in comparison with the waste recycling process through cement briquettes, since there is no addition of sulphur in the batch formulation. Applicability The waste injection technique is applicable in the stone wool manufacturing industry where cupola furnaces are used. At the time of writing (2010), it is applied on two production lines for further developments. Economics The investment costs for waste injection are only about 20 % of the cost for equipment to make briquettes, including the necessary buildings.

Chapter 6
398 Manufacture of Glass
Driving force for implementation The minimisation of the waste stream, together with a reduction of SOX emissions associated with the technique in use for waste recycling (cement briquetting) represent the main driving force for implementing waste injection to the stone wool production. Example plants A prototype plant has been running in Oulu, Finland since 2001. A full-scale pilot plant has been operating in Hässleholm, Sweden since 2004. Both plants are owned by Paroc Group; the project of developing the waste injection technique has been financed within the Sixth Environment Action Programme 2001 – 2010. Reference literature http://ec.europa.eu/environment/life/project/Projects/index[146, EURIMA 2007]
6.5 Submerged combustion melting technology Description The submerged combustion melting (SCM) is based on a segmented melting approach in which several stages are used to optimise melting, homogenisation, refining and heat recovery. This approach is expected to reduce the average residence time of the glass melt by ≥80 %compared to a single large tank melter, with a consequent decrease in energy costs and emissions. The SCM melter consists of a small tank in which fuel and oxidants are fired directly into the bath of material being melted. The combustion gases bubble or flow through the glass bath, creating a high heat-transfer rate and turbulent mixing (and carryover). High shear from forced convection provides rapid particle (sand, raw materials containing alumina) dissolution and temperature uniformity. Melted material with a uniform composition, but still with many seeds and bubbles, is drained from a tap near the bottom of the bath. In Figure 6.2 a schematic diagram of the submerged combustion melter is shown.
Figure 6.2: Schematic diagram of the submerged combustion melter

Chapter 6
Manufacture of Glass 399
Batch handling and charging is more flexible with the submerged combustion melter than conventional melters. The handling system can be simple and inexpensive because the melter can accept a much wider particle-size range of up to 1 cm or more, without the need for the complete mixing of the raw materials. This characteristic would allow a wider choice in raw materials and a decrease in batch processing labour and capital costs. Achieved environmental benefits An overall energy savings of about 5 % over the best oxy-gas-fired tank furnace is estimated when no heat is recovered from the walls of the melter. A 20 % energy recovery of the wall losses would allow an overall energy savings of about 7.5 %. A reduction of NOX emissions is expected, due to the quenching of the flames in the melt. Operational data Five commercial submerged combustion melters of 75 tonnes/day are in operation in Ukraine and Belarus for the production of mineral wool. They operate with less than 10 % excess air and produce less than 350 mg/Nm3 of NOX emissions, referring to 8 % O2.
For extending the application of the SCM melter technique, some limitations need to be overcome, which require several improvements of the existing melters. A first step is to switch the combustion from air to oxygen in order to decrease bubbling in the melt while improving heat transfer and lowering emissions; this should result in an 80 % decrease in gas volume passing through the melt. Applicability At the time of writing (2010), the applicability of the SCM melter is limited to the mineral wool production. The development and testing work that is underway should allow for the application of this technique to a wide range of glass compositions and colours. Most of the development work is mainly carried out in the US by the Glass Manufacturing Industry Council (GMIC) and by the Gas Technology Institute, Des Plaines, Illinois, US. Economics The SCM melter technique should allow a minimum of 5 % energy savings compared to conventional melting. Savings in capital costs and batch processing labour are expected. Driving force for implementation Lower investment costs, more flexibility in the selection of raw materials, energy savings and lower emissions, in particular NOX emission, represent the driving forces for a full development and application of the SCM technique. Example plants At the time of writing (2010), five commercial melters are in operation for the production of mineral wool, in Ukraine and Belarus. A patent application has been filed. A project team led by the Gas Technology Institute (GTI, Chicago, US) including six glass companies is working on ‘next-generation’ melting systems, which include submerged combustion melting. For the purpose, a pilot SCM melter producing 1 tonne per hour has been built and is used to melt a range of industrial glasses under various operating conditions. Reference literature [149, Rue et al. 2006]

Chapter 6
400 Manufacture of Glass
6.6 Flue-gas treatment with dry sodium bicarbonate and chemical valorisation of gas treatment residues
Description This technique applies to the desulphurisation of waste gases from glass melting furnaces. Sodium bicarbonate shows a high efficiency for the removal of SOX emissions (see Section 4.4.3.3); with the consequent production of a solid residue resulting from the chemical reaction between acid gases and sodium bicarbonate. The solid residue is mainly separated from the flue-gases by means of filtration systems (an ESP or a bag filter). The main components of the residue are sodium sulphate and sodium carbonate (unreacted alkaline reagent). In many cases, the solid residue can be recycled to the melting furnace, partly replacing the refining agent (in general, sodium sulphate) used in the batch formulation; however, in some cases, the residue cannot be recycled directly in the furnace. The main limitations for the reuse of the filter dust are the following: 1. solid residues are very fine and tend to easily generate carryover or volatilise (for
instance, NaCl) from the furnace, with consequent modification of the chemical composition of the melted glass and high concentrations of NaCl entering the regenerator;
2. the chemical composition of the solid residues may vary significantly with different operating conditions of the furnace, resulting in a difficult control of the chemical composition of glass, affecting the quality of the final products.
In order to prevent a waste stream of dust to be disposed of in landfills, a treatment of the residue is carried out in a specific plant, generally located near a soda ash production installation. The treatment consists of dissolving the solid residue in a solution which contains calcium chloride (CaCl2) (this solution being available at the soda ash plant). The chemical reaction is the following:
CaCl2 + Na2SO4 → CaSO4 + 2 NaCl The resulting slurry is filtered in order to separate the solid calcium sulphate (CaSO4). The sodium chloride (NaCl) solution is treated to purified it from the remaining calcium and other ions. Both reaction products can be reused. The calcium sulphate may be used in the cement manufacturing process, substituting other purchased material used in the charge. The sodium chloride solution may be used as a raw material in the production process of soda ash. Achieved environmental benefits The dry scrubbing with sodium bicarbonate achieves high removal efficiencies of SOXemissions. The possibility to treat and reuse the solid residue generated by the scrubbing system represents a good alternative to the direct recycling of filter dust into the melting furnace for glass production, without compromising the quality of the glass or the control of the production process. Furthermore, a significant waste stream is avoided, due to the possible valorisation and reuse of the resulting products. Cross-media effects The solid residue needs to be transported from the glass manufacturing installation to the treatment plant. The treatment process requires consumption of energy and water.

Chapter 6
Manufacture of Glass 401
Applicability Dry scrubbing with sodium bicarbonate for flue-gas desulphurisation, followed by a treatment of the resulting solid residues, is applicable to glass production plants where the recycling of filter dust is not possible because of quality requirements of the final glass product or difficulties in controlling the production process. Economics This technique is under tests at a preindustrial level and those tests indicate that it will be economically viable. Driving force for implementation The impossibility of recycling the solid residues from the flue-gas desulphurisation plant internally should represent the main driving force for implementation. Example plants The technique has been tested in France and specific treatment plants are being studied/planned. This technique is industrially operational and it is applied in France and Italy for solid residues generated by municipal waste incineration plants where the flue-gas treatment is done with sodium bicarbonate (see Waste Incineration BREF, Sections 4.6.11.4 and 4.6.11.5). Reference literature [154, EC 2006] [145, France contribution 2007].
6.7 Application of ceramic and catalytic ceramic filters for the removal of multiple pollutants from process waste gases
Description Flue-gases from glass melting furnaces present elevated temperatures, depending on the level of heat recovery, and carry a mixture of solid and gaseous pollutants (mainly NOX and SOX). A number of well-established techniques are currently applied for the removal of these pollutants, either individually or in combination (see related sections in Chapter 4). The application of high temperature filtration systems within the glass industry is uncommon (see Section 4.4.1.5). A new type of ceramic filter which could operate at high temperature has been developed with promising results. The use of (low density) ceramic filter elements represents an emerging technique for treating the flue-gases generated by glass melting furnaces. Ceramic filters are very efficient for the separation of dust and work well in combination with a dry scrubbing stage for acid gas removal. Furthermore, given the refractory nature of the filter medium and the favourable filtration temperature, the catalytic reduction of NOX emissions is possible with this technique by applying catalytic ceramic filters where the catalyst is incorporated into the ceramic filter elements. Thus, the major pollutants emitted by a glass furnace can be treated simultaneously in a single piece of equipment.
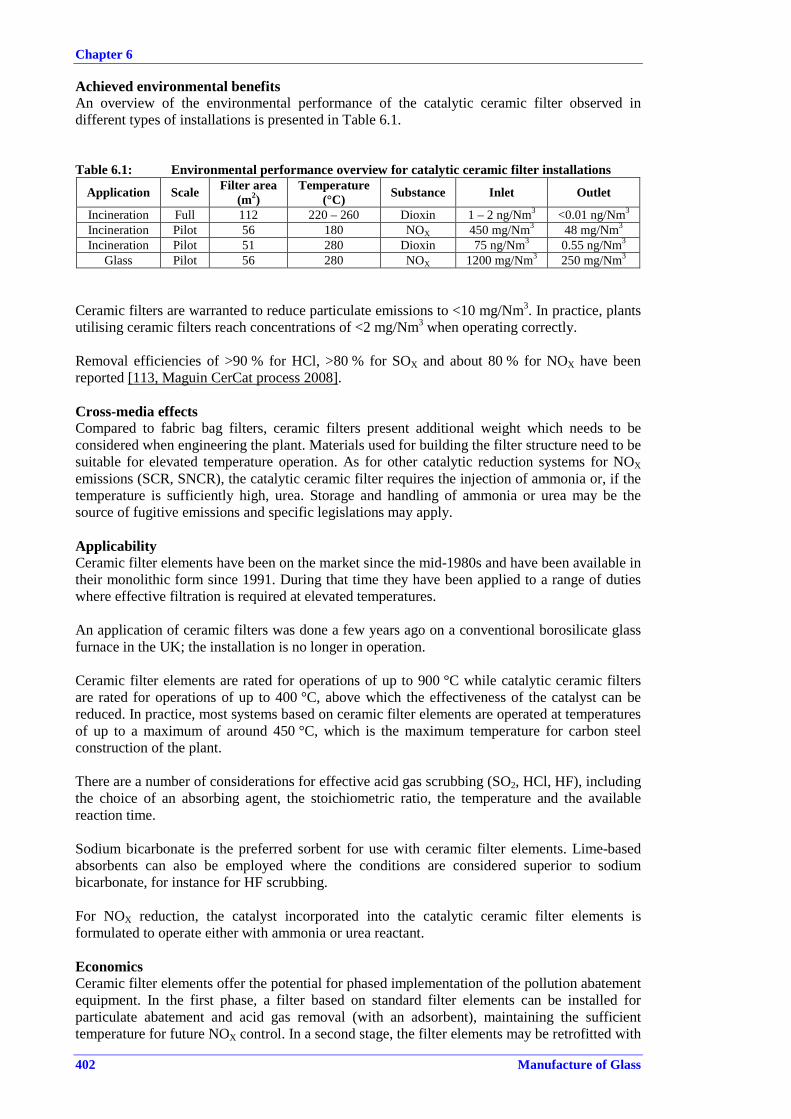
Chapter 6
402 Manufacture of Glass
Achieved environmental benefits An overview of the environmental performance of the catalytic ceramic filter observed in different types of installations is presented in Table 6.1.
Table 6.1: Environmental performance overview for catalytic ceramic filter installations
Application Scale Filter area (m2)
Temperature (°C) Substance Inlet Outlet
Incineration Full 112 220 – 260 Dioxin 1 – 2 ng/Nm3 <0.01 ng/Nm3
Incineration Pilot 56 180 NOX 450 mg/Nm3 48 mg/Nm3
Incineration Pilot 51 280 Dioxin 75 ng/Nm3 0.55 ng/Nm3
Glass Pilot 56 280 NOX 1200 mg/Nm3 250 mg/Nm3
Ceramic filters are warranted to reduce particulate emissions to <10 mg/Nm3. In practice, plants utilising ceramic filters reach concentrations of <2 mg/Nm3 when operating correctly. Removal efficiencies of >90 % for HCl, >80 % for SOX and about 80 % for NOX have been reported [113, Maguin CerCat process 2008].
Cross-media effects Compared to fabric bag filters, ceramic filters present additional weight which needs to be considered when engineering the plant. Materials used for building the filter structure need to be suitable for elevated temperature operation. As for other catalytic reduction systems for NOXemissions (SCR, SNCR), the catalytic ceramic filter requires the injection of ammonia or, if the temperature is sufficiently high, urea. Storage and handling of ammonia or urea may be the source of fugitive emissions and specific legislations may apply. Applicability Ceramic filter elements have been on the market since the mid-1980s and have been available in their monolithic form since 1991. During that time they have been applied to a range of duties where effective filtration is required at elevated temperatures. An application of ceramic filters was done a few years ago on a conventional borosilicate glass furnace in the UK; the installation is no longer in operation. Ceramic filter elements are rated for operations of up to 900 °C while catalytic ceramic filters are rated for operations of up to 400 °C, above which the effectiveness of the catalyst can be reduced. In practice, most systems based on ceramic filter elements are operated at temperatures of up to a maximum of around 450 °C, which is the maximum temperature for carbon steel construction of the plant. There are a number of considerations for effective acid gas scrubbing (SO2, HCl, HF), including the choice of an absorbing agent, the stoichiometric ratio, the temperature and the available reaction time. Sodium bicarbonate is the preferred sorbent for use with ceramic filter elements. Lime-based absorbents can also be employed where the conditions are considered superior to sodium bicarbonate, for instance for HF scrubbing. For NOX reduction, the catalyst incorporated into the catalytic ceramic filter elements is formulated to operate either with ammonia or urea reactant. Economics Ceramic filter elements offer the potential for phased implementation of the pollution abatement equipment. In the first phase, a filter based on standard filter elements can be installed for particulate abatement and acid gas removal (with an adsorbent), maintaining the sufficient temperature for future NOX control. In a second stage, the filter elements may be retrofitted with
Chapter 6
Manufacture of Glass 403
catalytic ceramic filter elements for NOX reduction or a selective catalytic reduction system (SCR) can be installed. The most appropriate choice can be made on the basis of economic and technical considerations. This phased introduction would prevent unnecessary or premature expenses. The initial capital costs of a catalytic ceramic filter-based system can be substantially lower that traditional alternatives. When annualised operating costs are calculated, the costs of energy, adsorbent, replacement of filter media, labour and other factors should be considered. Cost calculations suggest that the lifetime ownership cost of a catalytic ceramic filter system is favourable when compared with other technologies. Driving force for implementation The possibility to remove a mixture of pollutants with a single system may be particularly attractive when available space is limited. Example plants Catalytic ceramic filters have been employed on a small scale in both full and pilot scale plants. The pilot scale applications have been set up to closely reflect actual operational conditions. One pilot scale trail was carried out at a European flat, printed glass production line. The trial plant housed 40 Cerafil TK-3000 XS-1 filter elements (3 m long by 150 mm O/D and an effective area of 1.4 m2). The achieved NOX reduction was around 80 % at 280 °C, which is an ideal temperature for long-term applications. An artificial ageing trial indicated a stable, long-term performance. A second trial at a European float glass production line has been undertaken. The results are not available because of confidentiality issues. Two industrial applications have been announced to start operations in 2010, including one in the domestic glass sector for the production of soda-lime glass. The objectives are to assess this technique technically and economically during a full campaign. Reference literature [151, Madison Filter Ltd. 2008] [113, Maguin CerCat process 2008]
6.8 NASU electrostatic precipitator for nanoparticles Description In the glass manufacturing industry, the techniques applied for dust removal from the waste gases of the melting furnace are, in general, the electrostatic precipitator (ESP) and bag filter. These techniques show good efficiencies in the removal of large and fine particles even with diameters <2 µm. However, fine particles (<2 µm), ultrafine particles (<1 µm) and nanoparticles (<0.1 µm) are more difficult to separate. The aerodynamic and electrostatic behaviour of particles with a diameter of about 0.01 µm is totally different from the properties of 2 µm and larger particles. Particles smaller than 0.1 µm have high mobility and lower charge values and would require a dense fabric filter for their removal with consequently high pressure drop in the flue-gas line. With traditional ESPs, the pressure drop would not be a problem but the unit to be used would be large and relatively expensive, due to the need to use several charging zones (multiple fields) in order to charge the fine particles for an efficient removal (filed charging). The electrostatic precipitator for nanoparticles is based on a different technique for charging the particles (diffusion charging) which shows a better efficiency with fine particles. The system consists of a two-stage device that uses a ‘sonic jet charger’ inside which ions are produced and blown into the flue-gas duct by sonic velocity airflow. A schematic representation of the sonic jet charger is given in Figure 6.3

Chapter 6
404 Manufacture of Glass
Figure 6.3: Schematic representation of a sonic jet charger
Achieved environmental benefits The typical removal efficiency for the NASU ESP, consisting of one modular filter, is between 80 – 90 % of the total particle mass load. When multiple fields are used (two or more modular filter units connected in series), a theoretical removal efficiency of up to 95 % may be achieved. The reported efficiencies are related to the removal of particulates with an average particle size of below 2 µm. Operational data The NASU ESP system installed on a domestic glass installation operates at approximately an average flow velocity at the duct of 5.5 m/s. The sonic jet charger does not require cleaning; it presents a constant corona voltage and the flue-gas properties do not affect the current. The size of the device is very small and inexpensive. Applicability The NASU ESP system can be applied for the filtration of fine particles in different applications, including glass melting furnaces and glass coating systems. Economics The modularity of the system allows a number of standard modules to be added together to match the flowrate in different sized precipitators. This characteristic makes the NSU ESP system very cost effective. The system has low installation and operational costs and requires minimal maintenance. Driving force for implementation The need to efficiently remove ultrafine particles from emission sources represents the main driving force for implementation, together with the possibility to apply a number of modular units (10 – 12 or more) depending on the needs and the waste gas volume. Example plants An application has been tested at Beneq (Helsinki, Finland) to treat the flue-gases from a glass coating system. The system was tested in January 2009 at Littala Nuutajärvi glass factory on two traditional pot furnaces producing domestic glass fired with liquefied petroleum gas burners. The filter has been installed on the roof of the building. NASU-project is not yet completed. Studies continue in order to asses whether this system is a feasible solution for industrial purposes. Reference literature [152, Finland contribution 2009]

Chapter 6
Manufacture of Glass 405
6.9 Charged cloud scrubber Description The charged cloud scrubber (CCS) technique consists of a system were both particulates and gaseous pollutants are removed by passing the waste gases through a chamber that contains a carefully generated ‘scrubbing cloud’ of high-density, charged water droplets. Inside the cloud chamber system, billions of droplets rapidly interact with the particles present in the process waste-gases. When a particle and a droplet pass within 20 microns, electrical forces cause mutual attraction and the particle is pulled into the droplet. Captured particles agglomerate within the sump and deposit at the bottom of the chamber from where they are removed as low volume slurry. Relatively cleaned water from the top of the sump is recirculated to the charging grid, where it is recharged and reused in the system. The CCS system can remove soluble gaseous pollutants (e.g. SO2, HCl, HF, NH3) in addition to fine and ultrafine particles. In Figure 6.4 a schematic diagram is shown.
Figure 6.4: Schematic diagram of the charged cloud scrubber system
Achieved environmental benefits The reported environmental benefits observed from pilot tests on waste gases from an oxy-fuel-fired glass furnace claim high abatement efficiencies for both particulates and SOX (respectively from 410 mg/Nm3 to 23 mg/Nm3 and from 770 mg/Nm3 to 1 mg/Nm3; data are reported as measured). A full scale CGS system applied to an oxy-fuel-fired furnace has been tested in the US; the results are not yet available.

Chapter 6
406 Manufacture of Glass
Operational data Electric consumption for the electrostatic charging of the droplets is estimated to be significantly lower than from electrostatic precipitator systems. Pressure drop in the CCS system is very low and is mainly generated by the mist eliminator and the connecting ductwork. The technique is reported to be relatively unaffected by changes in particle loading and other loading constituents. Applicability The system is potentially applicable to waste gases from all glass furnace types; however, this needs to be confirmed. Economics At the time of writing (2010) no cost data are available. Driving force for implementation The CCS system potentially notably reduces space requirements where both fine dust and acid gas abatement is necessary. Example plants At the time of writing (2010) the first full scale installation is being tested in the US on an oxy-fuel-fired furnace. Reference literature [170, N.Harris 2009] [171, Tri-Mer Corporation 2010]

Chapter 7
Manufacture of Glass 407
7 CONCLUDING REMARKS AND RECOMMENDATIONS FOR FUTURE WORK
Timing of the review process The work for the review of the BAT reference document for the Manufacture of Glass (GLS BREF) began with the reactivation of the TWG in February 2006, followed by a call for wishes in March 2006 and subsequent preparation of the background paper outlining the wishes of the TWG members and the key issues for the review of the document. The kick-off meeting for the review process of the BAT reference document was held in January 2007. The TWG agreed to maintain the structure of the existing document and to update all sections, integrating additional information, in particular new data on emissions and consumption levels. The need to expand the existing information concerning downstream processes, emissions of heavy metals, use of cullet (availability, quality requirements, etc.) was recorded. It was agreed to include information on topics that were not covered in the existing document, in particular regarding boron compounds emissions, diffuse and fugitive emissions. A concern was raised during the kick-off meeting concerning the confidentiality of data to be collected for the review of the BAT reference document, due to a competition issue related to an ongoing infringement procedure carried out by the Commission (DG COMP) against some large glass manufacturers. After a consultation with DG COMP, a TWG subgroup defined the guidelines for data collection, together with the necessary restrictions for avoiding sensitive competition issues. The requirement caused certain difficulties in the collection of emission and consumption data at the installation level. The period for collecting data and information ended in July 2007. The information was validated by site visits, consulting with TWG members and by scrutiny within the EIPPCB. The first draft of the BAT reference document covering Chapters 1 – 4 was released in February 2008, with a consultation period for the TWG that ended in April 2008. In May 2008 the work was taken over by a new author who prepared a revised version of the first draft which was released in September 2008. An interim TWG meeting was held in October 2008 with the aim to discuss a number of specific topics that required additional information for completing the review process. A second draft of the revised BAT reference document including Chapter 5 (draft conclusions on Best Available Techniques) and Chapter 6 (Emerging techniques) was released in June 2009 (the full document) with a request for the TWG members to provide comments on the revised document by September 2009. The final TWG meeting was held in December 2009. At the time of the meeting, the TWG comprised 85 members representing 20 Member States, the industrial organisations concerned, the European Commission and environmental NGOs. Sources of information and information gaps The information exchange for the review of this BAT reference document was affected by the restrictions indicated above, derived mainly from the competition issues. However, a high number of useful documents were submitted and more than 100 new references were included in this revised document. As for the original document, a substantial part of the information was submitted to support the diversity of the eight different glass sectors and to specify the applicability of the identified techniques across all processes and sectors. The BAT information system (BATIS) has been used systematically to upload documents and comments received from the TWG members to ensure an efficient exchange of information and a high level of transparency.

Chapter 7
408 Manufacture of Glass
Major contributors of information were the industrial associations, representing the whole glass industry (CPIV) and the single sectors (FEVE, Glass for Europe, APFE, Domestic Glass, ESGA, EURIMA, ECFIA, ANFFECC), and several Member States, in particular Austria, France, Germany, Italy, the Netherlands, Portugal and Spain. A number of documents containing emissions data from example installations and extensive information on costs and cross-media effects were largely used for the review of Chapter 4, in particular the reports from HVG (Germany), Austria, TNO (submitted by CPIV) and Entec (submitted by EURIMA). In spite of the usefulness of the information received, some issues were identified: • Emission and consumption data were regularly submitted in an aggregated form. • Certain example installation data submissions contained gaps e.g. reference year for costs
of techniques, long term emission performance where spot measurements were used. • For some sectors, energy consumption data were provided as a range (minimum and
maximum value) and were not complemented with relevant parameters, such as the type and age of the furnace and the percentage of cullet.
• A lack of data was identified for the emissions of selenium compounds from the production of coloured flat glass, flint container and domestic glass, together with the performance of scrubbing systems for emissions removal.
Degree of consensus reached during the information exchange During and following the final meeting of the technical working group, a consensus was reached within the TWG for the whole document. Dissenting views were expressed on a limited number of BAT-AELs, two of which have been recorded. Table 7.1 shows the split views expressed by TWG members and recorded.

Chapter 7
Manufacture of Glass 409
Table 7.1: Split views BAT
conclusion View
expressed by Split view
No 17 Portugal, Italy
The two Member States consider that the upper value of the BAT-AEL range concerning the application of combustion modifications for the reduction of NOX emissions is not achievable in the case of existing installations, in particular for cross-fired, gas-fired, regenerative furnaces. On the basis of the example installation data (see Column 1 in Table 4.15, Section 4.4.2.1) and of the values reported in ‘Operational data’ of Section 4.4.2.1, the BAT-AEL of 800 mg/Nm3 (equivalent to 1.2 kg/tonne melted glass) determined as a daily average or average over the sampling period is not considered representative of all types of conventional melting furnaces. Emission levels in the range of 700 – 1100 mg/Nm3 (0.9 – 1.7 kg/tonne melted glass) are indicated as achievable for cross-fired, gas-fired furnaces. In the opinion of the two Member States, the application of secondary measures that may be considered a more efficient BAT alternative for achieving lower associated emission levels (e.g. SCR and SNCR) have never been implemented on this type of furnace, due to technical constraints and its low degree of flexibility.
No 19 The European container glass federation (FEVE)
The industrial organisation considers that the upper value of the BAT-AEL ranges for both natural gas and oil-fired furnaces are difficult to achieve in particular when a complete recycling of filter dust and high external cullet rates are used in the batch formulation. The production of certain types of glass with a fixed oxidation state and a low uptake of sulphur in the melt, determining the glass colour and other relevant properties, is generally associated with higher SOX emissions compared to glasses with higher sulphur uptake. Based on data reported in Section 3.3.2.2, Table 3.15 and Section 4.4.3.3, values in the range of <500 – 800 mg/Nm3 (0.75 – 1.2 kg/tonne melted glass) are expected for gas-fired furnaces and in the range of <1200 – 1500 mg/Nm3 (1.8 – 2.3 kg/tonne melted glass) for oil-fired furnaces. In the opinion of industry, the concluded BAT-AEL ranges would cause a waste stream of filter dust and would endanger the recycling of glass packaging (external cullet) in Europe.
Consultation of the Forum and subsequent formal adoption procedure of the BAT conclusions. The forum for the exchange of information pursuant to Article 13 of the Directive 2010/75/EU on industrial emissions (IED) (generally referred to as the IED Article 13 Forum) was consulted on the proposed content of this BAT reference document on 24 June 2012 and provided its opinion during its meeting of 12-13 September 2011. The opinion of the IED Article 13 Forum distinguishes between two different sets of comments. Firstly, the opinion lists those comments on which the forum gave its consensus to include them in the final BAT reference document. Secondly, the opinion lists those comments representing the views of certain Forum members but on which there was no consensus to include them in the final BAT reference document. The full opinion of the Forum is available here: http://circa.europa.eu/Public/irc/env/ied/library?l=/ied_art_13_forum/opinions_article
Subsequently, the Commission has taken the opinion of the IED Article 13 Forum into account when preparing the draft Commission Implementing Decision establishing the BAT conclusions for the manufacture of glass.
Chapter 7
410 Manufacture of Glass
The Industrial Emissions Directive (IED) Article 75 Committee gave a positive opinion on the draft Implementing Decision during its meeting of 21 November 2011. No substantive modifications were made to the document during this process. Recommendations for future work The information exchange and the quality of its result disclosed a number of areas where further information should be collected in the future in order to help in defining the applicability of certain techniques to consider in the determination of BAT, refining BAT-AELs and other associated levels. Further work would be useful to provide a more in depth understanding of cross-media issues and the potential performance improvements of some identified BAT. The recommendations for areas for future work and areas that should be reviewed when this document is revised are discussed below. • More data at installation level should be collected for evaluating the performance of the
identified techniques. Emission data referred to all relevant applied techniques should be gathered.
• Further information regarding the measuring methods (continuous or discontinuous measurements) in particular the detection limit value and uncertainty should be supplied together with the emission data.
◦ Specific energy consumption data should be provided in a disaggregated form for better comprehension; more detailed information at the installation level should be collected (e.g. cullet percentage, age of furnace, etc.).
◦ Data on investment and operating costs provided for a specific plant should be correlated with other relevant information (year of investment, items included in the cost data, etc.).
◦ Further data concerning CO emissions should be collected. ◦ Further data on NH3 emissions when SCR or SNCR are applied should be
collected, in particular to correlate the achievable emission levels of NOX with the potential cross-media effect of ammonia slip.
◦ Data on boron compounds emissions at the installation level should be collected in view of the definition of specific BAT-AELs for these compounds. This recommendation is particularly relevant due to the inclusion of two boron compounds (boric acid, disodium tetraborate anhydrous) in the candidate list of Substances of Very High Concern (SVHC), under the application of the REACH European Regulation 2006/1907/EC.
◦ Additional, plant-specific information and emission data should be collected for the flat glass and container glass sectors in order to assess the relevant cross-media effects associated with high removal efficiencies of SOX emissions and the recycling of filter dust into the batch composition. In particular, the options of landfilling the filter dust versus higher SOX emissions should be further investigated.
◦ For the production of stone wool, additional data on SOX removal efficiencies and cross-media effects associated with the production of a solid waste stream should be collected at the installation level. In particular, information concerning the recycling of solid waste through cement briquettes and the alternative routes of filter dust should be supplemented. For stone wool production, emission data concerning volatile organic substances (VOC) from downstream activities and information related to the sources and abatement techniques should be considered in more detail.
◦ Data on NOX emissions associated with the use of nitrates in the batch formulation should be collected for all the sectors concerned (container, flat, domestic and special glass; mineral wool, frits). Both, sector-specific typical emission data and values at the installation level are needed.

Chapter 7
Manufacture of Glass 411
◦ For the production of frits, additional plant specific data concerning NOX emissions and information regarding the possible technical options to reduce them should be collected in order to better assess the sector.
Suggested topics for future R&D work The potential applicability to the frits sector of some available techniques, with particular reference to secondary (end-of-pipe) measures for the reduction of NOX emissions (e.g. SCR, SNCR) should be investigated, in order to determine the technical and economical constraints of such techniques. A comparative work on the measurement of solid and gaseous emissions of boron compounds from the melting furnaces of glasses containing boron would be beneficial to define a standard sampling method and for the assessment of suitable BAT-AELs. For the application of SCR to the glass industry, lower NOX emission levels have been reported as theoretically achievable, on the basis of the performances observed in other industrial sectors. The possibility to attain lower NOX emission levels, in particular in the flat glass sector, should be investigated.
The Commission is launching and supporting, through its Research and Technological Development programmes, a series of projects dealing with clean technologies, emerging effluent treatment and recycling technologies and management strategies. Potentially, these projects could provide a useful contribution to future BREF reviews. Readers are therefore invited to inform the European IPPC Bureau of any research results which are relevant to the scope of this document (see also the fifth section of the Preface of this document). All comments and suggestions should be made to the European IPPC Bureau at the Institute for Prospective Technological Studies at the following address: European Commission Institute for Prospective Technological Studies European IPPC Bureau Edificio Expo c/ Inca Garcilaso, 3 E-41092 Seville, Spain Telephone: +34 95 4488 284 Fax: +34 95 4488 426 E-mail: [email protected]: http://eippcb.jrc.ec.europa.eu


Annexes
Manufacture of Glass 413
8 ANNEXES 8.1 Annex I: Method of estimation of air pollution control
costs and cross-media effects [94, Beerkens - APC Evaluation 2008]
The reference document used for most of the cost data conclusions and tables presented in Chapter 4 in the ‘Economics’ sections was provided by the glass industry. Data presented in Chapter 4 and in this section refer to costs and cross-media effects of the different techniques applied to various glass sectors and furnace sizes to control air pollution. This section describes the methodology that has been applied to estimate the additional production costs associated with the installation and operation of air pollution control equipment for a glass production plant. The calculation of extra costs associated with the application of process modifications (changes in design, conversion from air-firing to oxygen-firing or electric melting), carried out with the primary goal of decreasing the emission levels (in concentrations or in absolute values) of certain pollutant species, is also described in this section. A methodology for the calculation has been set up by the Netherlands with the purpose of standardising the calculation of the costs and the effects of an environmental measure regardless the internal cost figures applied by the company that uses the technique being investigated (NER Nederlandse Emissie Richtlijn Lucht, InfoMil September 2004. ISBN 90-776323-01-1) [155, NER April 2003].
The methodology adopted for the calculation of most cost data reported in Chapter 4, presented in the following sections, is based mainly on the NER approach. Because in the glass industry the main emissions are generally caused by the melting process, only the costs for reducing the solid and gaseous emissions of the glass melting furnaces are considered here.
8.1.1 Costs included in the economic evaluation The additional costs for air pollution control (APC) systems include the capital costs/investment costs for the additional equipment or for the changes to the existing installations. These costs are spread over the economic lifetime and are calculated as capital costs per year. These costs include the annual depreciation of the investments plus annual interest costs. Typical investment costs are, for instance: • filters, scrubbers, SCR equipment, new burners, changes in furnace design • piping, valve connections to existing flue-gas systems, extra fans or fan capacity to
compensate for pressure drop of the flue-gas over the equipment (filter, SCR, scrubber) • storage (silo) and transport of waste materials, for instance the collected filter dust • in the case of wet scrubbing systems: waste water treatment systems and sewage sludge
treatment • engineering and construction/erection of equipment on site • the transport of new equipment • site preparation: foundations, buildings • electricity supply, transformers • changes in stacks or erection of an extra stack • licence costs (often included in the price of the main equipment) • continuous monitoring system for the flue-gas composition (NOX, SOX, O2, dust),
necessary for checking the performance of the APC system and to detect failures (such as catalyst poisoning or fouling, defective bag filter modules) in APC operations.

Annexes
414 Manufacture of Glass
In this study, the interest rates that apply to these investments is set at 6 % annually, the writing-off period for the equipment is taken as 10 years, taking into account the average lifetime of the APC equipment and economic writing-off periods for these types of installations. For buildings, foundations or other infrastructural measures, the depreciation is evenly spread over 25 years. The formula used to calculate the contribution of interest rate and writing-off time to the average annual APC costs, referring to 2007 value, is the following: Capital costs in EUR/year = Equipment costs × [{(1+I/100)ELE}/{((1+I/100)ELE)-1}] × I/100 + Infrastructure costs × [{(1+I/100)ELI}/{((1+I/100)ELI)-1}] × I/100 Where: • ELE = writing-off time for the equipment, in years (default value: 10 years) • ELI = writing-off time for infrastructural investments, in years (default value: 25 years) • I = annual interest rate on capital, in % (default value: 6 %/year) • equipment costs = current value of all purchased equipment and installation of the
equipment, plus decommissioning at the current value • infrastructure costs = current value costs of the foundations, electricity supply, buildings,
and sometimes costs for stack modifications. Operational costs of air pollution control equipment are given below. • Extra energy consumption: the important factor is the electrical energy used for oxygen
production, motor fan operation and for compressed air consumption (cleaning of filters, injection of absorption media in the gas flow, aspiration of ammonia solution).
• Chemical agents: ammonia solution (or urea), limestone or hydrated lime (for scrubbers), sodium carbonate or sodium bicarbonate.
• Extra fuel: for instance, for compensating the loss in energy efficiency in some cases, or for hydrocarbon injection in the exhaust gases when the 3R process is applied.
• Oxygen: oxygen is supplied by trucks when there are small demands (small furnaces). In this case the oxygen is more expensive compared to when producing large quantities of oxygen on-site by cryogenic distillation or molecular sieve processes (PSA or VSA/VPSA). Some glass companies can be directly supplied by liquid oxygen pipelines located in their vicinity. Oxygen prices may range from EUR 0.05 up to 0.15 per Nm3
(pure), depending on the consumption level (oxygen capacity required), contract conditions, distance to oxygen production site and local electricity prices.
• CO2 permits: extra fossil fuel energy consumption associated with the operation of APC systems (e.g. the 3R process) or variations in fossil fuel energy demands for different furnace types (oxygen-firing versus air-firing) will change the volume of CO2 emissions and the required CO2 permits (in this study a permit for 1 tonne CO2 emissions is assumed to cost EUR 20).
• Filter dust disposal: glass companies strive to reuse the filter dust as raw material in the batch. However, in the case of unacceptable sulphur or chloride accumulation in the system, or problems with carryover of fine dust in the furnace, part (or sometimes all) of the filter dust has to be externally disposed of. Disposal plus transport costs may be up to EUR 400 per tonne of dust.
• Equipment maintenance and operation by workforce. • Regular calibration of flue-gas monitoring equipment. • Water used for cleaning, semi-dry, wet scrubbing or for the preparation of ammonia
solutions. • Repairs • Replacing catalyst modules or bag filter modules with typical lifetimes of 5 years.

Annexes
Manufacture of Glass 415
The following specific default price levels have been used to calculate costs of consumables and energy: • electricity: EUR 0.091 per kWh (including taxes referring to the EU-27 level for the year
2007), estimated from electricity prices for large industrial consumers (EuroStat: electricity prices for large industrial consumers and natural gas prices for large industrial standard consumer)
• natural gas/fuel oil: 10.43 EUR/GJ (based on net calorific combustion value, including taxes) or 9.41 EUR/gross GJ
• oxygen price: EUR 0.06 per m3 for large consumers and EUR 0.10 per m3 for small consumers
• catalyst modules for SCR systems: EUR 12 000 per m3
• water: EUR 2 per m3
• ammonia (NH3): EUR 400 per tonne • hydrated lime: EUR 175 per tonne (high quality grade) • sodium carbonate: EUR 160 per tonne • sodium bicarbonate: EUR 210 per tonne • CO2 permits: EUR 20 per tonne CO2
• labour: EUR 40 000 per full person-year (1 680 hours) • waste disposal (if required): EUR 400 per tonne of waste (chemical waste) (*)
The above costs are derived/estimated for the average situation in the EU-27 for the year 2007.
8.1.2 Comparison of costs of different technologies In several cases, the costs associated with the reduction of emissions for a specific pollutant cannot directly be derived from the investment costs of end-of-pipe equipment (such as scrubbers, filters or SCR) and their related operational costs. Especially in the case of the application of a primary measure, the difference in production costs between the conventional process and the new process with a lower emissions level have to be determined and the difference between the volume of emissions produced in both cases (before and after the implementation of the BAT) should be estimated in order to derive the specific abatement costs (costs per kg of species removed). An example is given by the application of oxygen-firing to glass furnaces. The total costs for melting, calculated over a period of a typical lifetime of the furnace, include the costs for the furnace and boundary equipment, the energy and oxygen costs and production losses during repairs or overhauls. The total costs divided by the total production in this period are equivalent to the melting costs. Oxygen-firing is considered a primary measure (preventing the formation of NOX) and it is applied in Europe and the US mainly to reduce NOx emissions. The conversion of a glass furnace from air-fuel firing (conventional) to oxygen-firing results in a different melting cost per tonne of glass which is then attributed to the emissions reduction of NOX, expressed in EUR per tonne of NOx reduced.
(*) Disposal costs are strongly country dependent and may be as high as 400 to 600 EUR/tonne waste. Of course, the specific costs may change over time; some price levels are very volatile such as fuel costs. Different areas in Europe can show very different costs for electricity, workpower, waste disposal and water.
Annexes
416 Manufacture of Glass
Also for electric melting, as an alternative for lowering emissions by primary measures, the difference between the melting costs calculated during a sufficiently long time (e.g. 10 or 15 years) with the electric furnace, and the melting costs with air-gas or air-fuel oil-fired furnaces is attributed to emissions reduction. Only in cases where the main goal for the application of the technique is not emissions reduction are the cost differences not attributed to the pollutants removed.
8.1.3 Air pollution control cost data In this study, the capital costs and operational costs are calculated or estimated from the data of existing plants installed before 2007, or recent estimates from suppliers of APC systems to the glass industry. The costs are based on 2007 values. For several relevant cases: container glass, float glass, tableware and continuous filament glass fibre melting furnaces, the costs for different types of APC equipment are related to the capacity of the furnace (suited to treat the emitted flue-gas volumes) and to the types of pollutants to be removed. For instance, for a container glass furnace producing 300 tonnes/day molten glass (on average), equipped with a dry scrubber and a bag filter, the total annual costs are determined including interest, depreciation of investments and operational costs. These costs can be divided by the total annual glass melt production to assess the APC cost per tonne molten glass. The costs can also be divided by the total amount of reduced emissions of a given pollutant, which have decreased over one year because of the application of this APC equipment. Thus, air pollution control costs presented in Chapter 4 and in Section 8.1.7 may be expressed as described below. • Cost per tonne molten glass (average). • Cost per kg of reduced emissions of a specific pollutant that is abated by the applied
BAT. Sometimes one integrated APC system reduces the emissions of several pollutant species. For example, a scrubber plus filter will reduce SOX and dust emissions. In this case, the distribution of costs over the different pollutant emission reductions is clearly defined, because 1 kg SOX emissions reduction cannot be considered equivalent to 1 kg dust (particulate) emissions reduction (See Section 8.1.4).
• Total annual costs for capital and operation. • Annual costs of air pollution control versus the turnover of glass production. • Annual costs of air pollution control versus the market value of produced glass • Annual costs of air pollution control versus the total production costs (melting, forming,
energy, raw materials, personnel costs for the complete production plant, taxes). In this study, the total annual APC costs, the costs per tonne molten glass (specific costs) and per kg emissions reduction are determined and results are presented in Chapter 4 and in Section 8.1.7 for existing installations and for installations recently realised or scheduled (2007 - 2008).
8.1.4 Distribution of APC costs in combined systems, among more than one pollutant species
The method presented in the NER (Netherlands Emission Regulations) provides criteria for calculating the specific costs of air pollution control applications when a reduction of emissions of multiple pollutants present in flue-gases occurs. The costs per unit (tonne) of emissions reduced is calculated for each component by using weighting factors. The weighting factors are

Annexes
Manufacture of Glass 417
generally based on the emission limit values of the general NER (NER Nederlandse Emissie Richtlijn Lucht, InfoMil September 2004. ISBN 90-7-76323-01-1) [155, NER April 2003].This means that the emissions reduction of a component with an emission limit value of X mg/Nm3 is Y/X times more important than for another pollutant with an emission limit of Y mg/Nm3.
The weighting factor for dust is 10, compared to SOX being 0.5, because the emission limit for dust expressed in mg/Nm3 is 20 times lower than the limit for SOX, based to the general rules of the Dutch regulation NER. Example: In this study, the method described in the NER has been used, based on a weighting factor for dust (Wd) of 10 and for SOX (Ws) of 0.5. The specific SOX abatement costs are calculated on the basis of the total annual costs (Q) in EUR (capital and operational) for the system consisting of a scrubber stage plus filter applied to reduce emissions of a glass melting furnace, the kg of particulate emissions reduced per year (Rd) and the SOx emission reduction in kg per year (Rs). Specific SOx abatement costs, in EUR per kg SOx emissions reduction = Q × Ws/(Ws × Rs + Wd × Rd) Specific dust abatement costs, in EUR per kg dust emission reduction = Q × Wd/(Ws × Rs + Wd × Rd) The weighting factors given in the NER are the following: • SOX (expressed as SO2): 0.5 • Particulates: 10 • NOX (expressed as NO2): 0.5.
8.1.5 Cross-media effects The consumption of electricity associated with the production of oxygen, or chemical agents such as sodium carbonate, hydrated lime, sodium bicarbonate or other reactants such as ammonia, is associated with indirect emissions. Also, in the case of the extra consumption of fossil fuels due to the application of air pollution control systems (e.g. 3R), extra emissions are produced (mainly CO2). Table 8.1shows the typical emissions expressed per kWh of electricity, from power generation plants in the EU per kWh, derived from the Reference document on Best Available Techniques for Energy Efficiency (ENE), June 2008 and from 2005 data on electricity production in Europe (EU-27) and emissions from power plants (data from the European Environment Agency).
Table 8.1 shows the indirect emissions related to the production of electricity, reagents and chemicals used to operate the air pollution control systems. (See also the Reference Document on Economics and Cross-Media Effects (ECM), July 2006 and the Reference Document on Best Available Techniques for Energy Efficiency (ENE), June 2008) [124, EC 2008] [156, EC 2006].

Annexes
418 Manufacture of Glass
Table 8.1: Indirect emissions related to the consumption of chemicals and electricity NOX SOX CO2 NH3Chemical compound/
energy carrier Unit grams grams kg grams Ammonia tonne 1000 NA 1150 1000 Hydrated lime tonne 150 NA 800 NA Sodium carbonate tonne 529 NA 661 551 Sodium bicarbonate tonne 330 NA 438 350 Electricity kWh 1.715 6.24 0.683 NA Oxygen tonne 453 1650 180 NA NA = not available.
- Emissions are per tonne or per kWh. - Only emissions during production, excluding emissions during transport.
Sources: • Electricity data: from European Environment Agency (2003 data). • Data for ammonia: IPPC Reference Document on Best Available Techniques for the
Manufacture of Large Volume Inorganic Chemicals-Ammonia, Acids and Fertilisers, August 2007.
• Data for sodium carbonate and sodium bicarbonate: IPPC Reference Document on Best Available Techniques for the Manufacture of Large Volume Inorganic Chemicals-Solids and Others Industry, August 2007.
• Data for hydrated lime: estimated from limestone calcination: CO2 from limestone plus fossil fuel energy consumption of calcination kilns (information from one of the hydrated lime producers in Europe).
8.1.6 Example cost calculation Table 8.2 shows an example of costs calculated with the methodology previously described, for an APC system consisting of an ESP with a Ca(OH)2 scrubber, applied to a gas-fired float glass furnace of 700 tonnes per day.
Table 8.2: Example cost calculation (ESP plus Ca(OH)2 scrubber) for a 700 tonnes/day gas-fired float glass furnace
General information Furnace Cross-fired Regenerative Glass type Float glass Molten glass 700 Tonnes/day Flue-gas flow dry 88 000 Nm3/h/dry 8 % O2Flue-gas flow 98 000 Nm3/h/wet 8 % O2Fuel gas Temperature abatement system 350 – 400 ºC Capital costs (value year 2007) Engineering costs 180 000 EUR Start-up costs and training 31 000 EUR 2 person/month Water cooling system 75 000 EUR Investment for filter (ESP) piping and insulation 2 180 000 EUR
Investment for fan 400 000 EUR Investment for scrubber 250 000 EUR Investment for injector lime/Ca(OH) 2/soda EUR Included in scrubber
Investment for filter dust removal equipment 120 000 EUR
Investment for filter dust and SOX monitoring 65 000 EUR
Investment for changes in stack and connections 515 200 EUR
Transport costs equipment parts 125 000 EUR Decommissioning costs (value year 2007) 145 800 EUR 6 % of investments filter + scrubber
Total capital costs 4 087 000 EUR Investment electricity supply 340 000 EUR

Annexes
Manufacture of Glass 419
Foundation and buildings, site preparation 272 500 EUR
Control equipment EUR Included in other items Total foundation/civil works 612 500 EUR Total investments 4 699 500 EUR Interest rate 6 % Lifetime installation 10 Years Capital costs per year 603 206 EUR Operating costs
Absorption agent (hydrated lime) 117 815 EUR/yr 3.31 tonnes/tonne SO2 removed (efficiency 35 %)
Electricity 239 148 EUR/yr 10.29 kWh/tonne glass (fans, ESP, control equipment)
Pressurised air (6 bar) 55 448 EUR/yr 400 Nm3/h pressurised air, at 6 bar
Labour costs 30 000 EUR/yr 0.75 Person/yr Monitoring system calibration and maintenance 10 000 EUR/yr
Filter cloth exchange 0 EUR/yr Waste disposal 389 779 EUR/yr 974.45 tonnes/yr Water 67 452 EUR/yr 7.7 m3/h Total operating costs per year 909 641 EUR Total costs per year 1 512 848 EUR
Specific costs
Total tonnes melted glass 255 500 tonnes melted glass/yr 5.92 EUR/tonne melted glass
Total net tonnes glass 229 950 net tonnes glass/yr 6.58 EUR/tonne glass product
Weighting factor SO2 0.5 Weighting factor dust 10 Initial SOX content 800 mg/Nm3
SOX content after APC 536 mg/Nm3
Initial dust content 140 mg/Nm3
Dust content after APC 5 mg/Nm3
Volume flow flue-gases through filter 88 000 Nm3/h, dry,
8 % O2Amount SOX (as SO2) reduction 203.5 tonnes/yr 0.66 EUR/kg SO2Amount dust reduction 104.1 tonnes/yr 13.24 EUR/kg dust Emissions associated with electricity consumption (indirect emissions at power plant) NOX 5.2 tonnes/yr SOX 19.0 tonnes/yr CO2 2082 tonnes/yr Emissions associated with Ca(OH)2 use NOX 0.1 tonnes/yr CO2 539 tonnes/yr Source: [94, Beerkens - APC Evaluation 2008]

Annexes
420 Manufacture of Glass
8.1.7 Cost data for APC systems applied to glass melting furnaces This section presents a summary of estimated costs associated with the implementation of different air pollution control (APC) systems to glass melting furnaces. Table 8.3 reports the estimated costs concerning the application of an electrostatic precipitator in combination with a dry scrubbing stage, applied to different melting furnaces. Data presented in the table refer to both APC systems applied before 2007 and systems implemented in 2007 and 2008. The table shows the total investment costs (second column), the investment costs (depreciation and interest) per year, operational costs and specific costs for different furnaces in three glass sectors, with or without filter dust recycling. Also the costs per kg SO2 or per kg dust removed from the flue-gas are presented. These costs depend on many factors and, for the same type of glass and tonnes of melted glass, the costs for scrubbing and filtering may be different due to different flue-gas volumes, hydrated lime addition and over-sizing of the equipment (to be able to operate the APC even at the highest production levels). Part of the total cost is assumed to be associated with dust removal and the other part with the reduction of SOx emissions. In Table 8.4 a summary of estimated costs concerning the application of an air pollution control system with a bag filter plus a scrubbing stage (dry and semi-dry scrubbing) is presented for different glass sectors and furnace capacities. Table 8.5 gives an overview of the different available methods applied for the removal of SOX,HF, HCl or boron compounds and selenium compounds from the flue-gases of glass melting furnaces. It summarises the performance, advantages, disadvantages, boundary conditions and costs associated with the different DeSOX techniques. Cost data are given per tonne of melted glass and refer to applications on float or container glass furnaces. Two different options, with the total recycling of filter dust in the batch formulation or with external disposal into a landfill are presented. The difference between the two values is based on the typical costs for the disposal of the filter dust. Disposal plus transport may cost up to EUR 400 per tonne of dust. The costs indicated in Table 8.5 consider the average situation in the EU-27 (year 2007). It should be noted that these costs may vary across the different Member States and will also change over time (e.g. price of energy is highly variable). A summary of the specific costs concerning different APC systems applied for the combined abatement of dust and SOX is presented in Table 8.6.
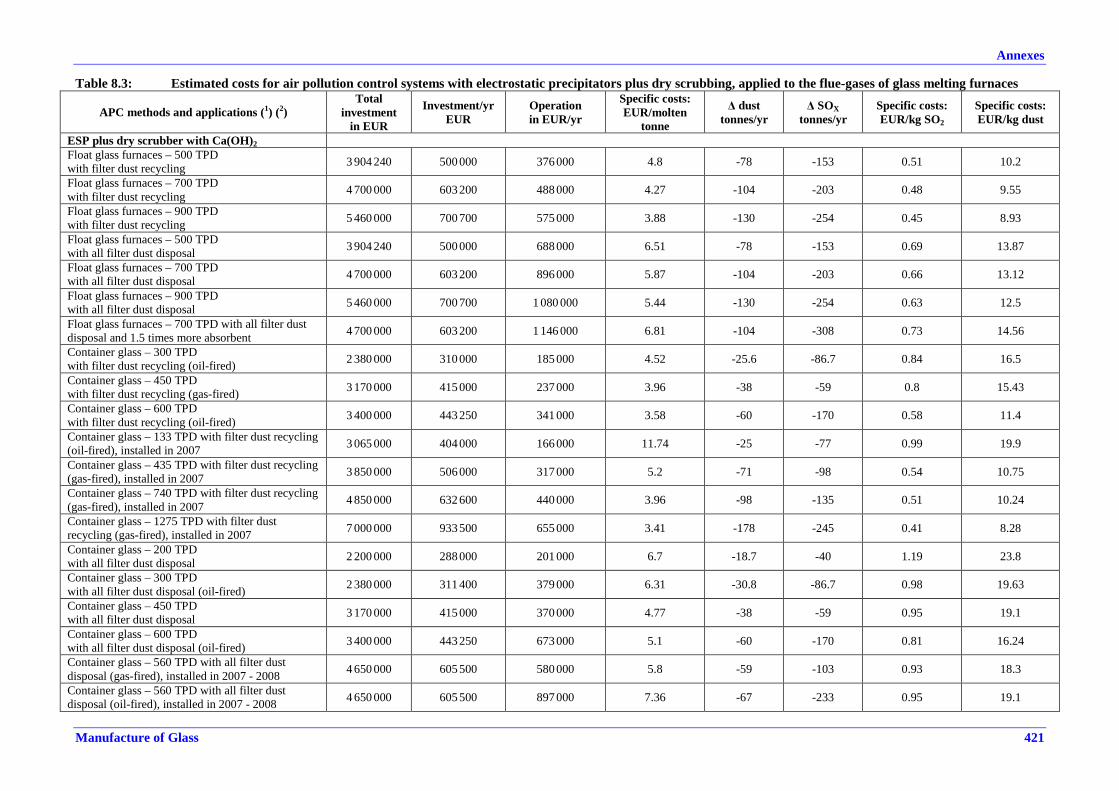
Annexes
Manufacture of Glass 421
Table 8.3: Estimated costs for air pollution control systems with electrostatic precipitators plus dry scrubbing, applied to the flue-gases of glass melting furnaces
APC methods and applications (1) (2)Total
investmentin EUR
Investment/yrEUR
Operationin EUR/yr
Specific costs:EUR/molten
tonne
∆ dusttonnes/yr
∆ SOXtonnes/yr
Specific costs:EUR/kg SO2
Specific costs:EUR/kg dust
ESP plus dry scrubber with Ca(OH)2Float glass furnaces – 500 TPDwith filter dust recycling 3 904 240 500 000 376 000 4.8 -78 -153 0.51 10.2
Float glass furnaces – 700 TPDwith filter dust recycling 4 700 000 603 200 488 000 4.27 -104 -203 0.48 9.55
Float glass furnaces – 900 TPDwith filter dust recycling 5 460 000 700 700 575 000 3.88 -130 -254 0.45 8.93
Float glass furnaces – 500 TPDwith all filter dust disposal 3 904 240 500 000 688 000 6.51 -78 -153 0.69 13.87
Float glass furnaces – 700 TPDwith all filter dust disposal 4 700 000 603 200 896 000 5.87 -104 -203 0.66 13.12
Float glass furnaces – 900 TPDwith all filter dust disposal 5 460 000 700 700 1 080 000 5.44 -130 -254 0.63 12.5
Float glass furnaces – 700 TPD with all filter dustdisposal and 1.5 times more absorbent 4 700 000 603 200 1 146 000 6.81 -104 -308 0.73 14.56
Container glass – 300 TPDwith filter dust recycling (oil-fired) 2 380 000 310 000 185 000 4.52 -25.6 -86.7 0.84 16.5
Container glass – 450 TPDwith filter dust recycling (gas-fired) 3 170 000 415 000 237 000 3.96 -38 -59 0.8 15.43
Container glass – 600 TPDwith filter dust recycling (oil-fired) 3 400 000 443 250 341 000 3.58 -60 -170 0.58 11.4
Container glass – 133 TPD with filter dust recycling(oil-fired), installed in 2007 3 065 000 404 000 166 000 11.74 -25 -77 0.99 19.9
Container glass – 435 TPD with filter dust recycling(gas-fired), installed in 2007 3 850 000 506 000 317 000 5.2 -71 -98 0.54 10.75
Container glass – 740 TPD with filter dust recycling(gas-fired), installed in 2007 4 850 000 632 600 440 000 3.96 -98 -135 0.51 10.24
Container glass – 1275 TPD with filter dustrecycling (gas-fired), installed in 2007 7 000 000 933 500 655 000 3.41 -178 -245 0.41 8.28
Container glass – 200 TPDwith all filter dust disposal 2 200 000 288 000 201 000 6.7 -18.7 -40 1.19 23.8
Container glass – 300 TPDwith all filter dust disposal (oil-fired) 2 380 000 311 400 379 000 6.31 -30.8 -86.7 0.98 19.63
Container glass – 450 TPDwith all filter dust disposal 3 170 000 415 000 370 000 4.77 -38 -59 0.95 19.1
Container glass – 600 TPDwith all filter dust disposal (oil-fired) 3 400 000 443 250 673 000 5.1 -60 -170 0.81 16.24
Container glass – 560 TPD with all filter dustdisposal (gas-fired), installed in 2007 - 2008 4 650 000 605 500 580 000 5.8 -59 -103 0.93 18.3
Container glass – 560 TPD with all filter dustdisposal (oil-fired), installed in 2007 - 2008 4 650 000 605 500 897 000 7.36 -67 -233 0.95 19.1

Annexes
422 Manufacture of Glass
APC methods and applications (1) (2)Total
investmentin EUR
Investment/yrEUR
Operationin EUR/yr
Specific costs:EUR/molten
tonne
∆ dusttonnes/yr
∆ SOXtonnes/yr
Specific costs:EUR/kg SO2
Specific costs:EUR/kg dust
ESP plus dry scrubber with Ca(OH)2Container glass – 133 TPD with all filter dustdisposal (oil-fired), installed in 2007 - 2008 3 065 000 403 000 322 000 14.96 -27 -76 1.16 23.3
Container glass – 435 TPD with all filter dustdisposal (gas-fired), installed in 2007 - 2008 3 850 000 505 000 534 500 6.55 -71 -98 0.68 13.7
Container glass – 740 TPD with all filter dustdisposal (gas-fired), installed in 2007 - 2008 4 850 000 632 600 743 000 5.1 -98 -135 0.66 13.2
Container glass – 1275 TPD with all filter dustdisposal (gas-fired), installed in 2007 - 2008 7 000 000 933 500 1 194 000 4.57 -178 -245 0.56 11.2
Tableware furnace – 35 TPDwith all filter dust disposal 1 190 000 156 500 57 000 16.7 -4.63 -4.8 2.2 43.9
Tableware furnace – 35 TPD with all filter dustrecycling 1 119 000 156 000 43 500 15.65 -4.63 -4.8 2.05 41.1
Tableware furnace – 180 TPDwith all filter dust disposal 1 960 000 256 000 247 000 7.66 -22.7 -56.2 0.99 19.73
ESP plus dry scrubber with NaHCO3Float glass furnace – 700 TPD, with all filter dustdisposal (gas-fired) 4 719 500 605 920 1 370 000 7.75 -104 -414 0.79 15.9
Float glass furnace – 700 TPD, with all filter dustrecycling (gas-fired) 4 719 500 605 920 515 000 4.39 -104 -414 0.49 9.81
Container glass furnace – 300 TPD, with all filterdust disposal, 67 % SO2 absorption (oil-fired) 2 400 000 312 800 600 000 8.33 -30.8 -232 1.07 21.5
Container glass furnace – 300 TPD, with all filterdust disposal, 50 % SO2 absorption (oil-fired) 2 400 000 312 800 491 000 7.38 -30.8 -173 1.02 20.36
(1) TPD =tonnes per day.(2) Emission data used for the calculation are the following:
• dust: typical values between 10 and 20 mg/Nm3, with optimised values between 5 and 10 mg/Nm3
• SO2: typical removal efficiency with Ca(OH)2 between 25 and 33 %.Source: [94, Beerkens - APC Evaluation 2008]

Annexes
Manufacture of Glass 423
Table 8.4: Estimated costs for air pollution control systems with bag filters plus scrubbing, applied to the flue-gases of glass melting furnaces
APC methods and applications (1) (2) (3) Investmentin EUR
Investment/yrEUR
Operationin EUR/yr(1)
Specificcosts:
EUR/moltentonne
∆dusttonnes/yr
∆SOXtonnes/yr
Specificcosts:
EUR/kg SO2
Specificcosts:
EUR/kg dust
Bag filter plus dry scrubberFloat glass – 500 TPD with all filter dust disposal 2 670 000 344 300 930 000 6.98 -80 -159 0.72 14.42
Container glass – 200 TPD with filter dust recycling 1 211 000 158 600 168 000 4.63 -17.2 -19.9 0.9 17.93Container glass – 300 TPD with filter dust recycling 1 435 500 188 400 234 000 3.86 -20.3 -26.5 0.98 19.57Container glass – 450 TPD with filter dust recycling 1 588 300 208 000 268 000 2.9 -35.3 -43.4 0.64 12.72Container glass – 600 TPD with filter dust recycling 1 895 000 249 000 344 000 2.7 -43.3 -53.3 0.64 12.9Container glass – 210 TPD with filter dust recycling,installed in 2007 (gas-fired) 1 960 000 260 300 191 000 5.89 -25 -29 0.85 17
Container glass – 210 TPD with filter dust recycling,installed in 2007 (oil-fired) 1 960 000 260 300 227 400 6.36 -28 -87 0.76 15.11
Container glass – 270 TPD with filter dust recyclinginstalled in 2008 (oil-fired) 3 036 000 406 500 365 000 7.83 -47 -146 0.71 14.21
Container glass – 290 TPD with filter dust recycling,installed in 2005 (gas-fired) 1 860 000 247 000 235 000 4.55 -28.5 -33 0.8 16
Container glass – 200 TPD with all filter dustdisposal 1 211 000 158 600 220 000 5.2 -16 -19.1 1 20.04
Container glass – 300 TPD with all filter dustdisposal 1 435 500 188 400 298 000 4.44 -20.5 -23.6 1.04 20.78
Container glass – 450 TPD with all filter dustdisposal 1 588 900 208 000 380 000 3.6 -35 -41 0.79 15.74
Container glass – 600 TPD with all filter dustdisposal 1 895 000 249 000 488 000 3.37 -45.5 -52.6 0.77 15.3
Container glass – 210 TPD with all filter dustdisposal installed in 2007 1 960 000 260 300 271 000 6.93 -25 -29 1 20.1
Container glass – 290 TPD with all filter dustdisposal,installed in 2005 (gas-fired) 1 860 000 247 000 326 000 5.41 -28.5 -33 0.95 19
Container glass – 290 TPD with all filter dustdisposal, installed in 2005 (oil-fired) 1 860 000 247 000 526 000 7.3 -32 -99 1.16 23.14
Tableware furnace – 30 TPD with filter dustrecycling 771 000 99 600 64 500 12.85 -5.32 -3.25 1.49 30
Tableware furnace – 30 TPD, with all filter dustdisposal 771 000 99 600 77 200 13.84 -5.32 -3.25 1.61 32.2
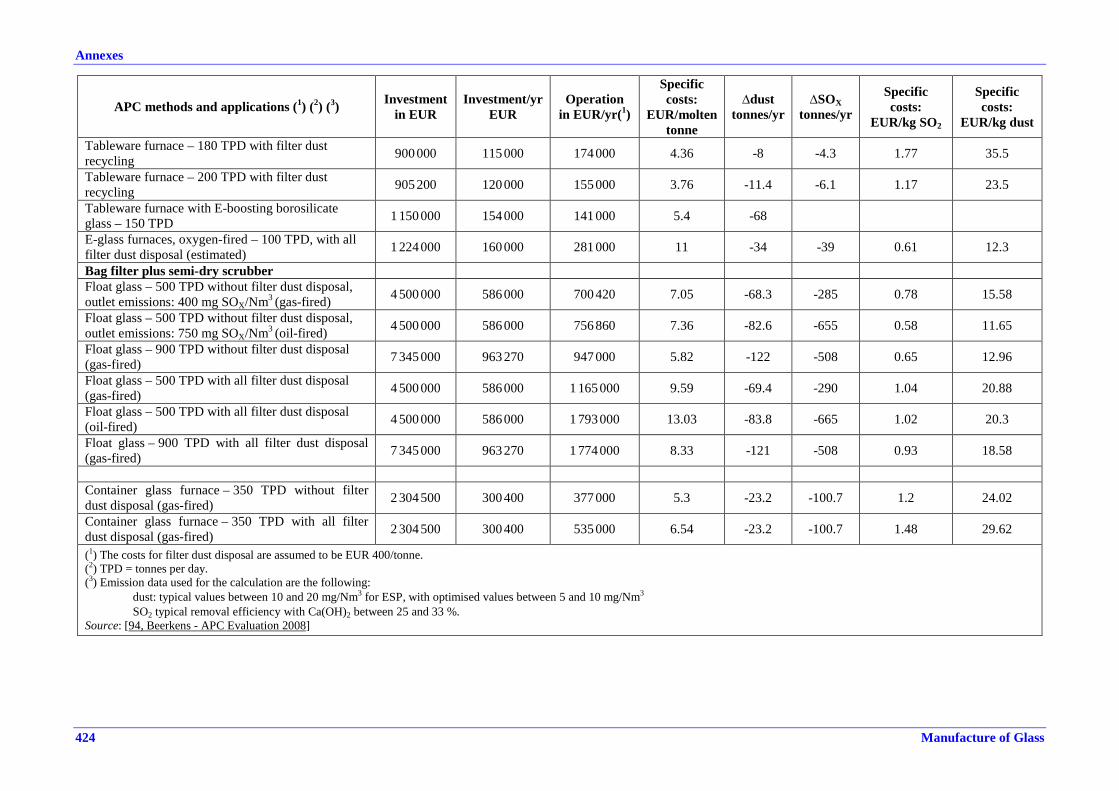
Annexes
424 Manufacture of Glass
APC methods and applications (1) (2) (3) Investmentin EUR
Investment/yrEUR
Operationin EUR/yr(1)
Specificcosts:
EUR/moltentonne
∆dusttonnes/yr
∆SOXtonnes/yr
Specificcosts:
EUR/kg SO2
Specificcosts:
EUR/kg dust
Tableware furnace – 180 TPD with filter dustrecycling 900 000 115 000 174 000 4.36 -8 -4.3 1.77 35.5
Tableware furnace – 200 TPD with filter dustrecycling 905 200 120 000 155 000 3.76 -11.4 -6.1 1.17 23.5
Tableware furnace with E-boosting borosilicateglass – 150 TPD 1 150 000 154 000 141 000 5.4 -68
E-glass furnaces, oxygen-fired – 100 TPD, with allfilter dust disposal (estimated) 1 224 000 160 000 281 000 11 -34 -39 0.61 12.3
Bag filter plus semi-dry scrubberFloat glass – 500 TPD without filter dust disposal,outlet emissions: 400 mg SOX/Nm3 (gas-fired) 4 500 000 586 000 700 420 7.05 -68.3 -285 0.78 15.58
Float glass – 500 TPD without filter dust disposal,outlet emissions: 750 mg SOX/Nm3 (oil-fired) 4 500 000 586 000 756 860 7.36 -82.6 -655 0.58 11.65
Float glass – 900 TPD without filter dust disposal(gas-fired) 7 345 000 963 270 947 000 5.82 -122 -508 0.65 12.96
Float glass – 500 TPD with all filter dust disposal(gas-fired) 4 500 000 586 000 1 165 000 9.59 -69.4 -290 1.04 20.88
Float glass – 500 TPD with all filter dust disposal(oil-fired) 4 500 000 586 000 1 793 000 13.03 -83.8 -665 1.02 20.3
Float glass – 900 TPD with all filter dust disposal(gas-fired) 7 345 000 963 270 1 774 000 8.33 -121 -508 0.93 18.58
Container glass furnace – 350 TPD without filterdust disposal (gas-fired) 2 304 500 300 400 377 000 5.3 -23.2 -100.7 1.2 24.02
Container glass furnace – 350 TPD with all filterdust disposal (gas-fired) 2 304 500 300 400 535 000 6.54 -23.2 -100.7 1.48 29.62
(1) The costs for filter dust disposal are assumed to be EUR 400/tonne.(2) TPD = tonnes per day.(3) Emission data used for the calculation are the following:
• dust: typical values between 10 and 20 mg/Nm3 for ESP, with optimised values between 5 and 10 mg/Nm3
• SO2 typical removal efficiency with Ca(OH)2 between 25 and 33 %.Source: [94, Beerkens - APC Evaluation 2008]

Annexes
Manufacture of Glass 425
Table 8.5: Comparison of methods for the removal of SOX, HCl, HF and other gaseous pollutants from flue-gases of glass melting furnacesScrubbing system
Scrubber type Dry Semi-dry Wet
Absorption agent Ca(OH)2 NaHCO3
Uncalcinatedtrona
Na3H(CO3)2 2H2OCa(OH)2 NaHCO3
Ca(OH)2suspension
Na2CO3solution
Na2CO3solution
Ca(OH)2suspension
Filter type Bag filter Bag filter ESP(1) ESP (1) ESP (1) Bag filter Bag filter ESP (1)Application inglass industry High Very low Very low Very high Medium Low Low Low Low
Typicaltemperaturerange (ºC)
140 – 180 140 – 180 300 – 350 300 – 400 250 – 350 160 – 180 180 – 200 250 – 400 60
SO2 removalefficiency in % at
stoichiometricdosing n=1
10 to 25 75 75 – 90 30 – 40 >60 Not available 70 – 90 >90
Filter dustcomposition (2)
CaSO3, CaSO4,CaF2, CaCl2,
CaCO3,Ca(OH)2,Na2SO4
Na2SO4,NaCl
Na2SO4,NaCl
CaSO4,CaSO3,CaF2,
Ca(OH)2
Na2SO4,NaCl
CaSO4,CaSO3,CaF2,
Ca(OH)2
Na2SO4,Na2SO3,Na2CO3,
NaCl
Na2SO4,Na2SO3,Na2CO3,
NaCl
CaSO4,CaSO3,CaF2
Advantages
Simple process,only cooling of
flue-gas;bag filterprovides
dust removal andreaction
Simpleprocess, only
cooling offlue-gas;bag filter
provides dustremoval and
reaction
Simpleprocess, only
cooling offlue-gas;bag filterprovides
dust removal andreaction
Highabsorption
for HCl andSOX
Lowconsumptionof absorption
agent, low costsof chemicals, and
lowerinvestment
costs comparedto wet
scrubbers
Goodabsorption
performance;with dry, fine(milled) sodaPowder, goodefficienciescan also beachieved
Lowconsumptionof absorption
agent, low costsof chemicals
Disadvantages
Highconsumptionof reactants in
cases where highremoval
efficiencies arerequired;
generates largeamounts
of filter dust
Expensivereactant
Reactant isdifficult
to purchase inEurope
Highconsumptionof reactants incases where
high removalefficiencies
are required;generates
large amountsof filter dust
Expensivereactant
Spray dryer isexpensive; costlymaterials for bag
filter;higher investmentcompared to dry
scrubber
Spray dryer isexpensive; costlymaterials for bag
filter;higher investmentcompared to dry
scrubber
System needsmore
maintenancethan dry
scrubbers
Reheating offlue-gas before
stack; productionof waste waterand gypsum
complex, andfouling of
equipment;high
investment
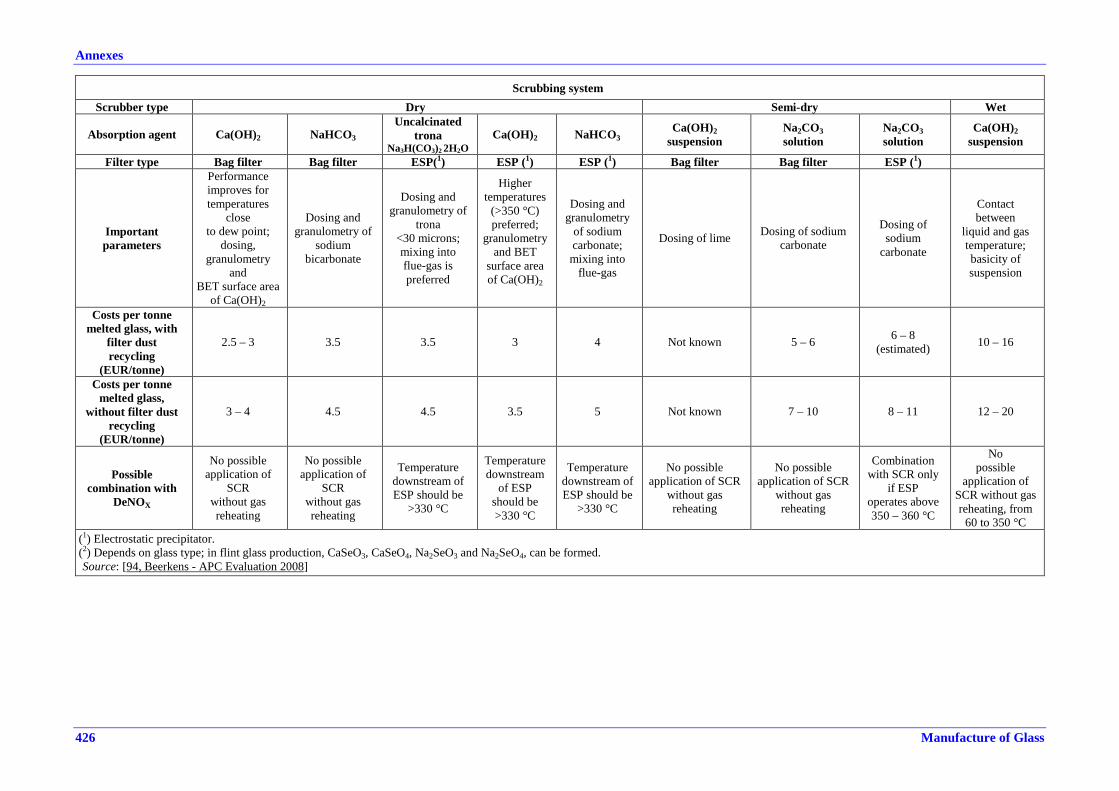
Annexes
426 Manufacture of Glass
Scrubbing systemScrubber type Dry Semi-dry Wet
Absorption agent Ca(OH)2 NaHCO3
Uncalcinatedtrona
Na3H(CO3)2 2H2OCa(OH)2 NaHCO3
Ca(OH)2suspension
Na2CO3solution
Na2CO3solution
Ca(OH)2suspension
Filter type Bag filter Bag filter ESP(1) ESP (1) ESP (1) Bag filter Bag filter ESP (1)
Importantparameters
Performanceimproves fortemperatures
closeto dew point;
dosing,granulometry
andBET surface area
of Ca(OH)2
Dosing andgranulometry of
sodiumbicarbonate
Dosing andgranulometry of
trona<30 microns;mixing intoflue-gas ispreferred
Highertemperatures
(>350 °C)preferred;
granulometryand BET
surface areaof Ca(OH)2
Dosing andgranulometry
of sodiumcarbonate;mixing into
flue-gas
Dosing of lime Dosing of sodiumcarbonate
Dosing ofsodium
carbonate
Contactbetween
liquid and gastemperature;basicity ofsuspension
Costs per tonnemelted glass, with
filter dustrecycling
(EUR/tonne)
2.5 – 3 3.5 3.5 3 4 Not known 5 – 6 6 – 8(estimated) 10 – 16
Costs per tonnemelted glass,
without filter dustrecycling
(EUR/tonne)
3 – 4 4.5 4.5 3.5 5 Not known 7 – 10 8 – 11 12 – 20
Possiblecombination with
DeNOX
No possibleapplication of
SCRwithout gasreheating
No possibleapplication of
SCRwithout gasreheating
Temperaturedownstream ofESP should be
>330 °C
Temperaturedownstream
of ESPshould be>330 °C
Temperaturedownstream ofESP should be
>330 °C
No possibleapplication of SCR
without gasreheating
No possibleapplication of SCR
without gasreheating
Combinationwith SCR only
if ESPoperates above350 – 360 °C
Nopossible
application ofSCR without gasreheating, from
60 to 350 °C(1) Electrostatic precipitator.(2) Depends on glass type; in flint glass production, CaSeO3, CaSeO4, Na2SeO3 and Na2SeO4, can be formed.Source: [94, Beerkens - APC Evaluation 2008]

Annexes
Manufacture of Glass 427
Table 8.6: Overview of specific costs for different air pollution control (APC) techniques applied to glass furnaces for the abatement of dust and SOXDust + SOX abatement
Production
ESP + dryscrubber(CaOH)2filter dustrecycling
ESP + dryscrubber(CaOH)2filter dustdisposal
ESP + dryscrubber
(NaHCO3)filter dustrecycling
ESP + dryscrubber
(NaHCO3)filter dustdisposal
Bag filter +dry scrubber
Filter dustrecycling
Bag filter +dry
scrubberfilter dustdisposal
Bag filter +semi-dryscrubber
filterdust
recycling
Bag filter +semi-dryscrubberfilter dustdisposal
Wetscrubber
Type of glass
Tonne meltedglass/day EUR/t glass EUR/t glass EUR/t glass EUR/t glass EUR/t glass EUR/t glass EUR/t glass EUR/t glass EUR/t glass
Float 500 4.8 6.51 6 7 – 7.35 9.6 (gas)-13 (oil)Float 700 4.27 5.87 4.39 7.75 6.98Float 900 3.88 5.44 5.82 8.33
Container 100 – 150 11 14Container 200 4.63 – 5.9 4.8 – 7Container(oil-fired) 200 6.4 9.25
Container(oil-fired) 300 – 350 4.52 – 6 6.31 – 7.5 7.38 – 8.33 3.86 – 5 4.11 – 7.3 5.3 6.54
Container 450 3.96 – 5.2 4.77 – 6.5 2.9 3.6Container(oil-fired) 600 3.58 5.1 2.7 3.37
Container(gas-fired) 740 4 5.1
Container(gas-fired) 1240 3.4 4.6
Container(oil-fired) 1240 3.7 6.2
Tableware 30 – 35 15.65 16.7 12.85 13.84Tableware 180 – 200 7.66 3.75 – 4.35
E-glass oxy-fired 100 – 120 11 14.4 – 21.5(*)
E-glassair-fired 100 – 120 15.7 – 20.5(*)
(*) Higher value for filter dust disposal at EUR 400 per tonne of dust.Source: [94, Beerkens - APC Evaluation 2008

Annexes
428 Manufacture of Glass
A comparison of cost data concerning available techniques for the reduction of NOX emissions is presented in the following tables, where several examples for flat, container and domestic glass installations are given, all of which produce soda-lime glass. Estimated data are also proposed for a continuous filament glass fibre furnace and a special glass installation.
Table 8.7 shows examples of costs (investment and operational) together with the estimated amounts of direct (internal) and indirect (external) emissions related to the application of different primary measures for the reduction of NOX emissions. In particular, the cases given below have been evaluated.
• Application of basic low-NOX measures consisting of the use of adjustable burners, with low injection velocities or the splitting of the fuel jet into separate jets, equipped with variable burner angles, air-tight sealing between the burner and the burner block and control of the oxygen content in the exhaust gases to prevent unnecessary excess air. Cost data refer to the application of the low-NOX measures without any modification of the furnace design.
• Application of extended low-NOX measures consisting of the adjustable burners plus adaptations of the furnace design, in particular increasing the height of the combustion chamber, enlarging the size of the burner ports, changing the slopes of the burner ports and the positions of the burners.
• Use of oxy-fuel firing melting technique. Estimated cost data are given in comparison with conventional regenerative furnaces (for float glass and container glass) or recuperative furnaces (for tableware, continuous filament glass fibre and special glass). The comparison of the melting costs depends very much on the oxygen prices that may be affected by various factors, such as access to an oxygen pipeline, the oxygen capacity demand (oxygen prices increase when lowering the demand), the local electricity price and the contract between the oxygen supplier and the glass company. Cost data are indicative and many (local) conditions may affect the differences in melting costs when comparing oxy-fuel-fired and air-fuel-fired furnaces.
A summary of estimated costs (investment and operational) related to the application of secondary measures for the abatement of NOX emissions are presented in Table 8.8. Cost data concerning the application of the SCR, SNCR and 3R techniques are given for different glass sectors and furnace capacities.
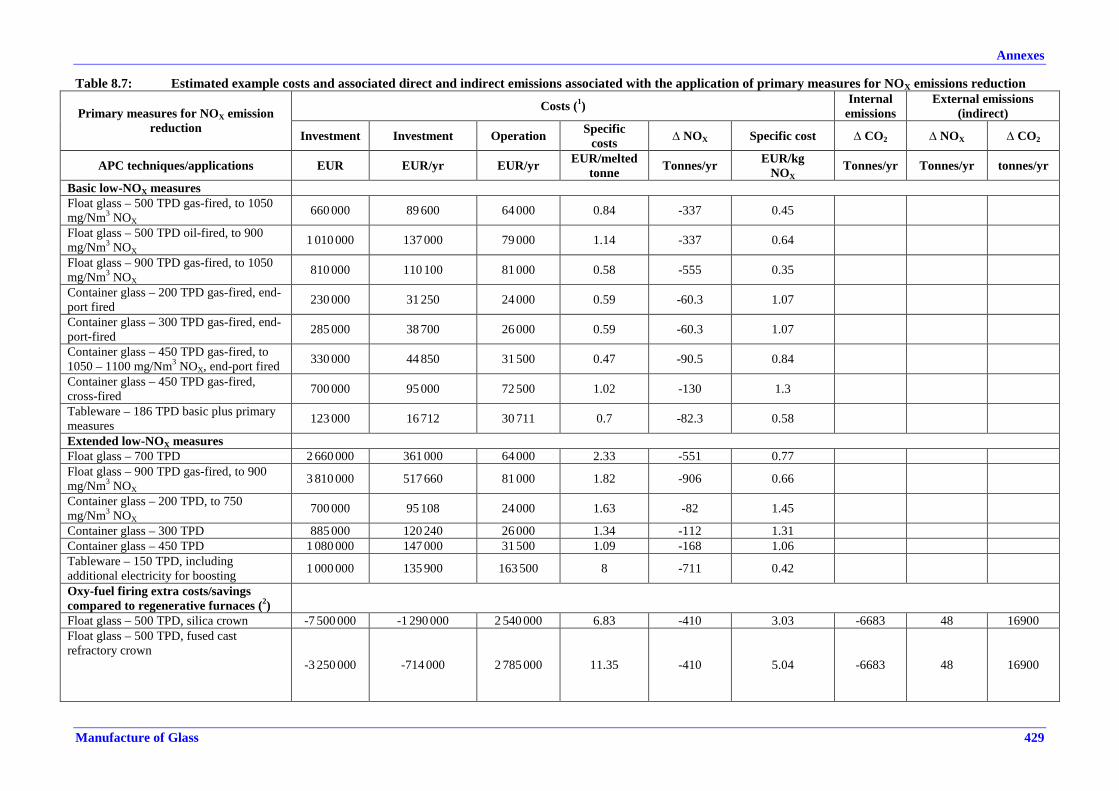
Annexes
Manufacture of Glass 429
Table 8.7: Estimated example costs and associated direct and indirect emissions associated with the application of primary measures for NOX emissions reduction
Costs (1) Internalemissions
External emissions(indirect)Primary measures for NOX emission
reduction Investment Investment Operation Specificcosts ∆ NOX Specific cost ∆ CO2 ∆ NOX ∆ CO2
APC techniques/applications EUR EUR/yr EUR/yr EUR/meltedtonne Tonnes/yr EUR/kg
NOXTonnes/yr Tonnes/yr tonnes/yr
Basic low-NOX measuresFloat glass – 500 TPD gas-fired, to 1050mg/Nm3 NOX
660 000 89 600 64 000 0.84 -337 0.45
Float glass – 500 TPD oil-fired, to 900mg/Nm3 NOX
1 010 000 137 000 79 000 1.14 -337 0.64
Float glass – 900 TPD gas-fired, to 1050mg/Nm3 NOX
810 000 110 100 81 000 0.58 -555 0.35
Container glass – 200 TPD gas-fired, end-port fired 230 000 31 250 24 000 0.59 -60.3 1.07
Container glass – 300 TPD gas-fired, end-port-fired 285 000 38 700 26 000 0.59 -60.3 1.07
Container glass – 450 TPD gas-fired, to1050 – 1100 mg/Nm3 NOX, end-port fired 330 000 44 850 31 500 0.47 -90.5 0.84
Container glass – 450 TPD gas-fired,cross-fired 700 000 95 000 72 500 1.02 -130 1.3
Tableware – 186 TPD basic plus primarymeasures 123 000 16 712 30 711 0.7 -82.3 0.58
Extended low-NOX measuresFloat glass – 700 TPD 2 660 000 361 000 64 000 2.33 -551 0.77Float glass – 900 TPD gas-fired, to 900mg/Nm3 NOX
3 810 000 517 660 81 000 1.82 -906 0.66
Container glass – 200 TPD, to 750mg/Nm3 NOX
700 000 95 108 24 000 1.63 -82 1.45
Container glass – 300 TPD 885 000 120 240 26 000 1.34 -112 1.31Container glass – 450 TPD 1 080 000 147 000 31 500 1.09 -168 1.06Tableware – 150 TPD, includingadditional electricity for boosting 1 000 000 135 900 163 500 8 -711 0.42
Oxy-fuel firing extra costs/savingscompared to regenerative furnaces (2)Float glass – 500 TPD, silica crown -7 500 000 -1 290 000 2 540 000 6.83 -410 3.03 -6683 48 16900Float glass – 500 TPD, fused castrefractory crown
-3 250 000 -714 000 2 785 000 11.35 -410 5.04 -6683 48 16900

Annexes
430 Manufacture of Glass
Costs (1) Internalemissions
External emissions(indirect)Primary measures for NOX emission
reduction Investment Investment Operation Specificcosts ∆ NOX Specific cost ∆ CO2 ∆ NOX ∆ CO2
APC techniques/applications EUR EUR/yr EUR/yr EUR/meltedtonne Tonnes/yr EUR/kg
NOXTonnes/yr Tonnes/yr tonnes/yr
Container glass – 150 TPD,EUR 0.06/Nm3 O2, high-duty silica crown -2 051 100 -276 633 444 700 3.07 -49.3 3.41 -1227 7.6 3027
Container glass – 225 TPD,EUR 0.06/Nm3 O2, high-duty silica crown -2 740 000 -369 000 637 990 3.27 -73.9 3.64 -1942 11.1 4444
Container glass – 450 TPD,EUR 0.06/Nm3 O2, high-duty silica crown -4 743 000 -639 400 1 490 000 5.18 -147 5.76 -2097 21 8380
Oxy-fuel firing extra costs/savingscompared to recuperative furnaces (2)Tableware – 30 TPD,EUR 0.06/Nm3 O2
500 000 56 406 -245 400 -17.26 -19.2 -9.86 -2600 1.8 716
Tableware – 30 TPD,EUR 0.08/Nm3 O2
500 000 56 406 -175 000 -10.79 -19.2 -6.16 -2600 1.8 716
Tableware – 30 TPD,EUR 0.10/Nm3 O2
500 000 56 406 -103 660 -4.32 -19.2 -2.47 -2600 1.8 716
Tableware – 30 TPD,EUR 0.12/Nm3 O2
500 000 56 406 -32 754 2.16 -19.2 1.23 -2600 1.8 716
Tableware – 30 TPD,EUR 0.14/Nm3 O2
500 000 56 406 38 152 8.63 -19.2 4.93 -2600 1.8 716
Tableware– 70 TPD,EUR 0.10/Nm3 O2
-2 254 000 -265 972 582 590 12.76 -40 7.97 -2449 5.2 2064
E-glass furnace – 100 – 120 TPDEUR 0.08/Nm3 O2
1 500 000 117 340 -248 400 6.19 -80.3 3.1 -5387 8.86 3530
(1) Unless otherwise specified, the achievable emission levels used for the calculation of cost data are the following:• 1100 – 1400 mg/Nm3 NOX for primary low-NOX measures (basic, no design changes); 900 – 1100 mg/Nm3 NOX for primary low-NOX measures with design changes on float glass furnaces and 750 mg/Nm3 NOX on
container glass furnaces• 0.5 – 0.9 kg/t glass NOX for oxy-fuel on container glass furnaces; 1.5 – 2 kg/t glass NOX for oxy-fired float glass furnaces; 1 – 1.5 kg/t glass NOX for special glass without nitrates.
(2) The cost differences between oxy-fuel-fired furnaces and conventional air-fuel furnaces include the difference in economics due to production stop during overhaul or furnace construction.Source: [94, Beerkens - APC Evaluation 2008]

Annexes
Manufacture of Glass 431
Table 8.8: Estimated example costs for the application of secondary measures for NOX emissions reductionSecondary measures for NOX emission reduction Investment Investment Operation Specific costs ∆ NOX Specific costs
APC techniques/applications EUR EUR/year EUR/year EUR/tonne glass tonnes/year EUR/kg NOXSCR processFloat glass – 500 TPD 2 065 000 270 000 331 500 3.29 -804 0.75Float glass – 650 TPD oil-fired 2 303 000 301 400 332 000 2.67 -692 0.91Float glass – 650 TPD gas-fired 2 303 000 301 400 370 000 2.82 -946 0.71Float glass – 700 TPD 1 880 000 248 000 283 000 2.07 -708 0.75Float glass – 900 TPD 3 112 000 391 000 450 000 2.57 -1255 0.67
Container glass – 200 TPD 840 000 110 000 77 500 2.56 -110 1.7Container glass – 300 TPD 1 036 000 134 700 98 800 2.13 -159 1.47Container glass – 450 TPD 1 270 000 166 300 135 500 1.84 -228 1.32
Tableware furnace – 35 TPD (hypothetical case) 490 000 64 200 38 500 8.03 -23.6 4.34Tableware furnace – 100 TPD regenerative: from1500 to 450 mg/Nm3 NOX (hypothetical case) 758 000 98 300 80 800 4.9 -130 1.38
3R processFloat glass – 500 TPD oil-fired 307 400 41 800 1 057 000 6.02 -598 1.84Float glass – 500 TPD gas-fired 307 400 41 800 1 085 000 6.17 -769 1.47Float glass – 650 TPD oil-fired 360 400 49 000 1 224 338 5.37 -726 1.75Float glass – 650 TPD gas-fired 360 400 49 000 1 309 662 5.52 -985 1.38
Container glass – 200 TPD 185 500 25 200 303 200 4.5 -127 2.6Container glass – 300 TPD 238 500 32 400 405 350 4 -169 2.6Container glass – 600 TPD 281 000 46 800 779 000 3.73 -330 2.48
SNCR processContainer glass – 200 TPD recuperative 684 000 93 000 73 850 2.28 -65 2.56Container glass – 350 TPD recuperative 900 000 122 000 97 000 1.88 -101 2.16
Special glass (estimated) – 5 oxygen-fired furnaces(total capacity 250 tonnes/day) 785 000 107 000 199 000 3.34 -290 1.06
E-glass fibres, 100 TPD (fictive) 615 000 83 500 66 930 4.12 -55.2 2.73NB:- Unless otherwise specified, the achievable emission levels used for the calculation of cost data are the following: 400 – 500 mg/Nm3 NOX for SCR; 450 – 500 mg/Nm3 NOX for SNCR and
<500 mg/Nm3 NOX for 3RSource: [94, Beerkens - APC Evaluation 2008]

Annexes
432 Manufacture of Glass
A summary of the additional costs, expressed in EUR per tonne of melted glass, associated with the application of each DeNOX technique evaluated in the comparative study, is given in Table 8.9.
Table 8.9: Additional costs associated with the application of DeNOX techniques (in EUR/tonne melted glass)
Type of furnace Production SCR 3R SNCR(1)
Basic low-NOX
measures(2)
Extended low-NOX
measures(3)
Oxy-firing with silica crown(4)
Oxy-firing with fused
cast crown(4)
Tonnes /day EUR/tonne melted glass
Float 500 3.3 6 – 6.25 0.85 – 1.1 6.83 (0.06)
11.35 (0.06)
Float 700 2.6 – 2.9 5.25 – 5.6 2.33 Float 900 2.6 0.58 1.82
Container 150 3.07 (0.06)
5.28 (0.06)
Container 200 – 225 2.56 4.5 2.28 0.76 1.63 3.27 (0.06)
5.39 (0.06)
Container 300 2.13 4 1.88 0.59 1.34
Container 450 1.84 0.47 1.09 5.18 (0.06)
7.16 (0.06
Container (cross-fired) 450 3.73 1.02 1.5
(Estimated)
Tableware (recuperative) 30 – 35 8 -4.32
(0.10)
Tableware (regenerative) 70 12.76
(0.10)
Tableware (regenerative) 100 4.9
Tableware (regenerative) 150
8(High electric
boosting)
Tableware (regenerative) 190 0.7
Special glass (oxy-fired) 250 3.34
Special glass (regenerative) 700 2.8
E-glass 100 4.1 6.20 (0.08)
(1) SNCR for recuperative and oxy-fired furnaces only and special case of regenerative furnace. (2) Basic low-NOX measures: adjustable burners, oxygen sensors, air-fuel control. (3) Extended low-NOXmeasures: basic measures plus modifications of burner ports and combustion chamber. (4) The cost of oxygen is given in brackets (EUR/m3). Source: [94, Beerkens - APC Evaluation 2008]
An estimation of specific indirect emissions, calculated for different air pollution control techniques (dust removal, DeSOX and DeNOX techniques), referring to different production capacities and glass types, is presented in Table 8.10. Indirect emissions are mainly associated with the use of electric energy, scrubbing agents, reactants (ammonia) and the production of solid waste. Values reported are given in grams or kilograms per tonne of melted glass.

Annexes
Manufacture of Glass 433
Table 8.10: Estimated specific indirect emissions per tonne melted glass for different glass furnaces and for different air pollution control (APC) techniques
Associated consumption of reagents and electricity
Production APC system Installationand type of fuel
NOXreduced
by DeNOX
NOXindirect
emissions(1)
Net effectNOX
reduction
Dustreducedby APC
SOXreduced
byDeSOX
SOXindirect
emissions(1)
Extrareleaseof CO2
(indirect+ direct)
(2) (3)
Wastedisposal
NH3 Ca(OH)2 NaHCO3 Na2CO3 Electricity
Tonnesmelted
glass/yearg/t g/t g/t g/t g/t g/t kg/t kg/t kg/t kg/t kg/t kg/t kWh/t
255500ESP + dryCa(OH)2
scrubber
700 TPD floatglass furnace, gas 0 21 -21 407 795 74 10 3.82 2.64 11.94
109500ESP + dryCa(OH)2
scrubber
300 TPD containerglass furnace, gas 0 18 -18 237 795 64 8 3.79 2.75 9.95
10950ESP + dryCa(OH)2
scrubber
30 TPD tablewarefurnace, gas 0 38 -38 423 440 137 17 2.89 2.04 22.28
255500ESP +dryNaHCO3scrubber
700 TPD float glassfurnace, gas 0 27 -27 407 1620 90 16 6.09 6.33 14.40
182500Bag filter + dry
Ca(OH)2scrubber
500 TPD float glassfurnace, gas 0 35 -35 438 871 125 16 4.00 3.05 20.02
109500Bag filter + dry
Ca(OH)2
scrubber
300 TPD containerglass furnace, gas 0 24 -24 192 216 89 10 1.40 1.00 13.68
182500Bag filter +
semi-dryscrubber
500 TPD floatglass furnace, gas 0 45 -45 380 1584 165 22 4.97 3.29 26.52
182500Bag filter +
semi-dryscrubber
500 TPD floatglass furnace, fueloil <1 % sulphur
0 45 -45 459 3644 164 26 11.01 7.54 26.28
40150 Wet scrubber100 – 120 TPDE-glass furnace,
fuel-air-fired0 42 -42 927 548 152 20 20.55
5 – 6Quicklime
24.21
40150 Wet scrubber100 – 120 TPDE-glass furnace,
oxy-fired0 36 -36 655 448 127 17 20.55
4 – 5Quicklime
20.42
328500 SCR 900 TPD floatglass furnace, gas 3820 8 3814 25 4 1.41 3.99
109500 SCR 300 TPD containerglass furnace, gas 1461 7 1452 23 3 0.57 3.20
10950 SCR 30 TPD tablewarefurnace, gas 2160 18 2146 62 8 0.84 8.04
36500 SCR 100 TPD tablewarefurnace, gas 3562 20 3534 9 1.40 10.68
237250 3R 650 TPD float glassfurnace, gas 3987 0 3987 28

Annexes
434 Manufacture of Glass
Associated consumption of reagents and electricity
Production APC system Installationand type of fuel
NOXreduced
by DeNOX
NOXindirect
emissions(1)
Net effectNOX
reduction
Dustreducedby APC
SOXreduced
byDeSOX
SOXindirect
emissions(1)
Extrareleaseof CO2
(indirect+ direct)
(2) (3)
Wastedisposal
NH3 Ca(OH)2 NaHCO3 Na2CO3 Electricity
Tonnesmelted
glass/yearg/t g/t g/t g/t g/t g/t kg/t kg/t kg/t kg/t kg/t kg/t kWh/t
109500 3R 300 TPD containerglass furnace, gas 1534 0 1534 18
116800 SNCR 320 TPD containerglass furnace, gas 868 3 865 9 2 0.48
36500 SNCR 100 TPD E-glassfurnace 1512 6 1507 20 3 0.84
328500 Low-NOX basic 900 TPD float glassfurnace, gas 1689 0 1689 0
182500 Low-NOX basic 500 TPD float glassfurnace, oil 1847 1847 0
109500 Low-NOX basic 300 TPD containerglass furnace, gas 0
255500 Low-NOXextended
700 TPD float glassfurnace, gas 1319 1319
328500 Low-NOX
extended900 TPD float glass
furnace, oil 2761 2761 0
109500 Low-NOXextended
300 TPD containerglass furnace, gas 1023 1023 0
65700Low-NOX
extended, pluselectricity
180 TPDtableware
borosilicate glass10822 10822 171 25.01
182500 Oxy-fuel 500 TPD float glassfurnace, gas 2247 232 2016 844 56 135.56
82125 Oxy-fuel 225 TPD containerglass furnace, gas 901 21 879 30 79.22
10950 Oxy-fuel 30 TPD tableware,gas 1735 164 1553 -172 95.71
36500 Oxy-fuel 100 TPD, E-glass,gas 2200 244 1956 885 -51 110.41
14600 Electric melter 40 TPD lead crystal 2438 1295 1144 -15 747.9510950 Electric melter 30 TPD lead crystal 2466 1032 1425 -59 600.007300 Electric melter 20 TPD lead crystal 1918 1918 0 168 1056.16
127750 Batch preheater 350 TPD containerglass furnace 225 12 214 407 43 -35+5 (3) 6.86
(1) External emissions arise from electricity generation (average EU), ammonia production, soda and sodium bicarbonate production, hydrate lime production, oxygen.(2) Extra release of CO2 does not include the amount from the manufacturing process of Ca(OH)2.(3) The extra release of CO2 is equivalent to -30 kg/tonne melted glass. This value is derived from 5 kg/t from extra electricity use for the flue-gas fan and 35 kg/t CO2 emission reduction due to fuel savings in the melting process because of
batch preheating.Source: [94, Beerkens - APC Evaluation 2008]
Annexes
Manufacture of Glass 435
8.2 Annex II: Example sulphur balances for industrial glass furnaces
In Chapters 4 and 5, references are made to the use of sulphur balances for the determination of installation-specific conditions, or as the basis of comparisons between various process options. This annex provides two examples of sulphur balances for soda-lime glass, together with a simplified example for mineral wool, and explains the related issues for these examples. Soda lime-glass production The examples chosen for soda-lime glass concern one furnace for flat glass and one for container glass, with complete and partial internal recycling of collected dust from a filter unit incorporating acid gas scrubbing. The figures used are examples only, and in particular the emission levels given in the examples should not be taken to be indicative of BAT. The total recycling of filter dust depends on the type of glass, its oxidation state, its ability to absorb the SO3 and more generally on the furnace running conditions (in particular the content of sulphur in the fuel). The best way to illustrate these aspects is to examine a complete sulphur balance as given in the figures below. For a specific case, the flow can be given in kg/h of a coherent unit (SO2, SO3, or S) or alternatively as mg/Nm3 of SO2, because for a specific furnace it is straightforward to calculate the conversion factor between concentration and mass flow. For the furnace sulphur balance, inputs are: • Sulphur input by batch material • Sulphur input by cullet (internal + external) • Sulphur input by fuel • Sulphur input by recycled filter dust. Outputs are: • Sulphur in glass pull • Sulphur in the flue-gas (SO2+SO3)• Sulphur contained in dust • Sulphur in the dust deposited in regenerators and flues (estimated to be 1 to 5 %). The overall sulphur balance must include the sulphur balance for the pollution control unit, i.e. outputs at the stack and the filter dust. If the filter dust quantity is not compatible with the type of glass, an external disposal route (generally landfill) must be used for at least part of the dust. Alternatively in order to minimise waste disposal, the sulphur content of the fuel can be reduced. This latter option is generally the preferred choice both in terms of protection of the environment as a whole and on economic grounds. Recycling of filter dust implies the substitution of sodium sulphate or calcium sulphate in the batch material. The potential amount of dust that can be recycled depends on the sulphate quantity required for refining and the possibility of substituting this sulphate by the filter dust. The dust properties and potential for recycling will depend on the running conditions and the type of absorbent (scrubbing material) used. The external cullet and its average composition will also influence the SO3 input. If the furnace is oil-fired, the oil will give rise to about 1200 mg/Nm3 of SO2 per 1 % of sulphur in the oil. The quantity of sulphur that can be absorbed into the glass varies from almost zero for some reduced glasses, up to about 500 to 700 mg/Nm3 for oxidising flint glasses. These figures are indicative only. In Figure 8.1, a sulphur balance is presented for a float glass furnace, where the filter dust is totally recycled to the furnace in the batch composition.

Annexes
436 Manufacture of Glass
Figure 8.1: Sulphur balance for a float glass furnace with complete filter dust recycling
In Figure 8.2, a sulphur balance is presented for a container glass furnace, where only part of the filter dust is recycled to the furnace in the batch composition.
External cullet: (SO3= 0.19 %)
All units expressed as SO2SO2 emission level: 1700 mg/Nm3
Sulphur Balance, example 2
Glass6.7 kg/h250 mg/Nm3
Internal cullet (10 %)
18.6 kg/h694 mg/Nm3
Batch materialFuel (oil 1 % S)
3 kg/h, 112 mg/Nm3
32 kg/h, 1194 mg/Nm3
Filter dust
FurnaceContainer glassPull: 400 t/dCullet: 80 % (70 % external + 10 % int.)SO3 in the glass: 0.30 %
Air pollution control unit
Waste disposalDust1.5 kg/h56 mg/Nm3
Dust left in flues0.3 kg/h, 11 mg/Nm3
0.6 kg/h, 22 mg/Nm3
SO2 + SO3 (waste gas)47.5 kg/h
1782 mg/Nm3
2.4 kg/h, 90 mg/Nm3
3.4 kg/h, 126 mg/Nm3
SO2 + SO3 to the stack45.3 kg/h
1700 mg/Nm3
Dust to the stack0.3 kg/h12 mg/Nm3
1 kg/hr, 37 mg/Nm3
Figure 8.2: Sulphur balance for a container glass furnace with partial filter dust recycling

Annexes
Manufacture of Glass 437
Mineral wool production The production of mineral wool often involves the recycling of filter dust and, in particular for glass wool, the use of variable amounts of recycled cullet. Raw materials used in the process are essentially pure and none contain appreciable amounts of sulphur. Typical sulphur contents are reported in Table 8.11.
Table 8.11: Raw materials and typical sulphur content in the mineral wool manufacturing production
Raw material Composition Typical sulphur content(% as SO3)
Max. values (from suppliers,
year 2007) Sand SiO2 <0.01 Soda ash Na2CO3 0.015 0.020 Limestone CaCO3 <0.01 Dolomite MgCO3.CaCO3 0.04 0.05 Stone Mineral based on aluminosilicate <0.01 Borate Hydrated 0.01 0.011 Source: [136, EURIMA 2008]
The example plant used for the study of the sulphur balance for glass wool production is oxy-gas-fired. The natural gas supplied to the example plant has a very low sulphur content which could be considered almost negligible. The production process typically generates 3 – 10 % of internal cullet which is directly recycled back into the process. The external cullet used at the plant originates from either container glass (bottles and jars) or flat glass (window). The typical sulphur contents of the commonly used cullet types are presented in Table 8.12.
Table 8.12: Typical SO3 content of common cullet types Cullet type Typical SO3 content (%)
Clear 0.18 Green 0.14 Container Amber 0.05
Flat Clear 0.22 Internal 0.044
The content of sulphur in the glass wool product in the example plant is equivalent to 0.044 % SO3 (as for internal cullet). As for the container glass production, the quantity of sulphur that can be absorbed into the glass depends on the redox state of the glass melt and in particular is influenced by the ratio of Fe2+/Fe3+ ions in the glass. The dust removed from the waste gas stream presents a variable sulphur content but a value of 7 % SO3 is considered to be typical. The sulphur balance calculated on the basis of the SO3 entering the furnace with the raw materials and the glass cullet, and the output of glass wool, filter dust and gaseous SOXemissions, show that the cullet is responsible for the vast majority of the sulphur input into the melting process. The relative proportions of the sulphur inputs and outputs from the process are shown in Figure 8.3.

Annexes
438 Manufacture of Glass
Source: [136, EURIMA 2008]
Figure 8.3: Schematic sulphur balance for an oxy-fuel glass wool furnace with filter dust recycling
The typical SOx emission values measured at the plant show concentrations varying from 69 to 143 mg/m3 SO2. The mass balance performed with the plant production data predicts a value of 77 mg/Nm3.

Annexes
Manufacture of Glass 439
8.3 Annex III: Emission Monitoring General recommendations for the measurement of emissions are given in the Reference Document on the General Principles of Monitoring (MON), July 2003 [122, EC 2003].
This annex gives general recommendations for the measurement of emissions from glass production processes, in order to obtain representative and comparable results. A number of national and international methods and procedures can be applied for the measurement of emissions but their use can lead to significantly different results due to the inappropriate application of general methods to a very specific case like the glass manufacturing process.
8.3.1 Main pollutants The main source of pollution from the glass industry is atmospheric emissions from the melting process. However, in some sectors the downstream activities can also give rise to substantial emissions. A summary of the main pollutants, indicated for the sectors identified within the glass industry, is given in Table 8.13.
Table 8.13: Main pollutants likely to be considered for measurement in the glass industry Sector/activity Pollutants
Container glass Materials handling Dust, crystalline silica Melting process Dust, CO, NOX, SOX, HF, HCl, heavy metals Hot-end coating or treatment Dust, organic and inorganic tin, HCl, SOX
Flat glass Materials handling Dust, crystalline silica Melting process Dust, CO, NOX, SOX, HF, HCl, heavy metals (for coloured glasses) Surface treatment SOX
Continuous glass filament Materials handling Dust, crystalline silica Melting process Dust, CO, NOX, SOX, HF, HCl, boron compounds Downstream activities Dust, VOC, formaldehyde, ammonia, waste water Domestic glass Materials handling Dust, crystalline silica, heavy metals Melting process Dust, CO, NOX, SOX, HF, HCl, heavy metals, boron compounds Downstream activities HF, Pb, waste water (from polishing and grinding) Special glass Materials handling Dust, crystalline silica, heavy metals Melting process Dust, CO, NOX, SOX, HF, HCl, heavy metals, boron compounds Downstream activities Dust, Pb, waste water (from polishing and grinding) Mineral wool Materials handling Dust, crystalline silica Melting process Dust, CO, NOX, SOX, HF, HCl, boron compounds, H2SDownstream processes Dust, VOC, phenols, amines, ammonia, formaldehyde, VOC, NOX
(curing), waste water High temperature insulation wools Materials handling Dust, crystalline silica Melting process Dust, CO, NOX, SOX, HF, HCl Downstream activities Dust, fibres, waste water Frits Materials handling Dust, crystalline silica, heavy metals Melting process Dust, CO, NOX, SOX, HF, HCl, heavy metals, boron compounds Downstream activities Dust, waste water
Annexes
440 Manufacture of Glass
8.3.2 Monitoring of emissions Emission monitoring is universally used for ensuring compliance with permit emission limits. The mode and the frequency should be related to the extent of emissions to be verified and to the control technology being used. The methods most commonly applied are the following: • monitoring of abatement technique performance (e.g. bag filter pressure drop) • continuous monitoring of pollutants • discontinuous measurements of pollutants • mass balance calculation. Monitoring of abatement technique performance In general, this is the minimum requirement imposed for emission monitoring. In some cases, (e.g. a well understood stable emission situation) the assessment of abatement technique performance could be sufficient to determine the compliance with the requirement of a permit. In many cases, automatic techniques capable of detecting the failure or malfunction of the abatement equipment are applied (e.g. measurement of pressure drop, temperature, pH, etc.). Continuous and/or discontinuous measurement of pollutants Emission monitoring requires the determination of all relevant parameters capable of influencing the measurement of the different pollutants, or the interpretation and reporting of results. In addition to the regulated substances (Dust, NOX, SOX, CO, HCl, HF, etc.) it is necessary to determine the characteristic parameters of the emitting source, e.g.: • flue-gas velocity and mass flow • temperature • humidity • oxygen concentration • carbon dioxide concentration. The measurement of emissions can be affected by several factors, some of which are particularly important in the case of glass melting processes. In most cases, the critical parameters can be identified as follows: • waste gas temperature • size distribution of dust • waste gas velocity • waste gas moisture • gaseous and particulate form of pollutants • sampling time • reference conditions. Waste gas temperature The flue-gas temperature from the furnace can vary substantially (generally 100 to 850 °C at the stack), depending on the heat recovery system (regenerators, recuperators or gas quenching) and the abatement technique applied. The higher temperatures generally correspond to recuperative type furnaces and/or oxy-fuel melting. The lower temperatures are typical of highly diluted waste gases (discontinuous furnaces, all electric melting, some furnaces with abatement equipment, etc.). The possible measuring errors due to the waste gas temperature can be minimised as listed below.

Annexes
Manufacture of Glass 441
• Use of appropriate filters and probes for dust measurements (quartz or glass fibre filters without organic binders, high temperature gaskets, etc.).
• Appropriate conditioning of the filters before use at high temperature. A previous conditioning phase at temperatures of up to 400 – 600 °C is recommended in order to avoid further weight losses during the measurements.
• Use of heated probes and filters at low waste gas temperatures, particularly in the presence of high humidity, in order to prevent acid and water condensation.
Size distribution of dust The particle diameter of dust generated by the melting process is normally very small (less than 1 µm, and generally 0.02 – 0.5µm). During sampling the particles easily agglomerate and, when alkaline filtering materials are used, tend to react with the acid gaseous substances present in the flue-gas. In order to avoid the phenomena, chemically inert filters should be selected for sampling. When particulate matter is measured continuously, the fine particles can be difficult to remove from the optical parts of the measuring equipment, leading to erroneous results of dust concentration. A suitable cleaning system should be applied. Waste gas velocity Although dust emitted from the glass melting process is made up of extremely fine particles, the measurements should be carried out isokinetically. The geometry of the duct and the position of the sampling point should be selected in order to allow a correct measurement of the flue-gas velocity. Waste gas moisture The presence of high percentages of water in the waste gases is very common in the case of oxy-fuel melting and air/gas furnaces when water is used as the coolant prior to abatement equipment. The determination of the gas dew point should be carried out in order to avoid condensation during sampling. Gaseous pollutants should be measured by using heated probes any time there is a risk of condensation, especially in SO3-rich flue-gases. This is also the case for some downstream processes employing wet scrubbers, such as for continuous glass filament, glass fibre, etc. Where water condensation does occur, the resulting liquid should be checked to determine the possible absorption of gaseous pollutants, e.g. oxides of sulphur. Gaseous and particulate form of pollutants Some pollutants can be released into the atmosphere in both particulate and gaseous form. This is the case for some substances from the melting process, e.g. certain boron compounds (particularly, boric acid), selenium, arsenic, mercury (if cullet from lighting is used), but also tin chloride from the hot-end coating activities for container glass. In these cases, in order to avoid evaluating errors, the sampling train should be equipped with a combined system for the simultaneous collection of both particulate and gaseous components. In the case of borosilicate glass production, it may be necessary to measure boron emissions in both forms, gaseous and particulate, in order to determine the effective removal of both species from the flue-gases (see Section 4.4.1). In particular, in the production of borosilicate glasses with a low alkali content, boric acid is mainly released into the atmosphere in its gaseous form, due to its high vapour pressure and low condensation temperature (below 160 °C). A specific measurement for total boron emissions allows for distinguishing between boron contained in the waste gases in the particulate form and the gaseous boron compounds that may escape the air pollution abatement technique (e.g. filter plus scrubbing system) applied to the melting furnace. Total boron emissions may be measured by sampling a portion of the flue-gases through a quartz probe connected to an absorption system consisting of impingers filled with water. The probe, connecting tubes and impingers are then rinsed thoroughly with water in order to recover the possible condensed material containing boron. The absorbing solution from the impingers and the washings of the sampling train may then be analysed for the determination of boron.

Annexes
442 Manufacture of Glass
The difference between the total boron emissions concentration and the boron determined in the particulate matter emissions, measured with standard methods (e.g. isokinetic sampling on quartz membrane filter), represents the gaseous boron compounds at the point of measurement. The measurement of selenium emissions involves the use of a specific sampling method which should be designed to guarantee that the absorption of both solid and gaseous forms present in the waste gases. Selenium used for colouring or decolouring the glass can result in a high gaseous emission, due to the formation of extremely volatile compounds, with condensation temperatures as low as 60 – 100 °C. A recommended sampling method for selenium emissions has been developed by the International Commission on Glass, Technical Committee 13 (published in Glass Technology: European Journal of Glass Science and Technology, Part A, Volume 47, No 2, April 2006) [162, ICG-TC 13 2006].
Sampling time In case of regenerative furnaces, in addition to the standard procedures which require an adequate sampling time for collecting a representative sample, a good practice should take into consideration the reversal cycle of the regenerators. In fact, emissions from the melting process can vary substantially with the temperature cycle of the chambers, which increases during the cycle. In order to carry out measurements with comparable results, the sampling time should cover an even number of firing cycles. This can also be an issue with cleaning cycles on abatement equipment. Reference conditions Normally, the emission limit values are given in concentrations referred to 0 °C, 101.3 kPa and other specific conditions, e.g.: • continuous melting furnaces: 8 % oxygen by volume, dry • discontinuous furnaces: 13 % oxygen by volume, dry • other sources of emissions: no correction for oxygen. In general, the concentration of pollutants is used to define compliance with the emission limit values. This is because it is directly measured and does not require the acquisition of additional information concerning the production process, which is usually needed for the definition of the emission factors or specific emissions (e.g. kg emission per tonne of molten glass). However, emission limit values are sometimes given both in concentration (mg/Nm3) and emission factor (kg/tonne glass, kg/h, g/h). This is particularly the case for highly diluted waste gases (e.g. electric furnaces) and, in general, in the presence of high percentages of oxygen (oxy-fuel combustion, oxygen-enriched air-fuel combustion). The correction to 8 or 13 % oxygen would yield results that would not be comparable with furnaces using fossil fuels and air instead of oxygen for the melting process. This is very much the case of the glass frit industry where flue-gases from oxy-fuel combustion, oxygen-enriched air-fuel furnaces and excess air are combined in a single plant, with a resulting high concentration of oxygen (>15 %). In this case, the use of emission factors or the reference to a percentage of oxygen closer to the real measurement conditions (15 % O2) will be more appropriate. Continuous monitoring The application of continuous monitoring is generally limited to the emissions generated by the melting furnace, being the most relevant mass flow and having a relatively constant level of emissions. Continuous monitoring of emissions can be carried out by in situ or extractive measuring equipment. In situ measurements are performed across the stack/chimney, at flue-gas temperature and the humidity of the sampling point. Extractive measurements are based on the conditioning of the flue-gas sample and subsequent determination of the pollutant concentration on dry gas. Both systems require careful maintenance and periodic calibration by means of discontinuous measuring methods. In particular, measurements carried out by in situ” instruments can be affected by colour and particulate size distribution, which vary according to

Annexes
Manufacture of Glass 443
the different glasses produced in the furnace (green, brown, half-white) and the type of fuel used for combustion. The parameters that could be measured continuously and the suggested methods are given in Table 8.14 below.
Table 8.14: Continuous monitoring techniques Parameter Method
Oxygen Paramagnetic, zirconium oxide cell Dust Light opacity, light scattering Nitrogen oxide (NO) Infrared or UV photometry, chemi-luminescence
Nitrogen oxides (NO + NO2)Infrared or UV photometry, chemi-luminescence equipped with converter (NO2 to NO)
Sulphur dioxide Infrared or UV photometry Carbon monoxide Infrared photometry Total hydrocarbons Flame ionisation detector (FID)
Other pollutants could be measured continuously, such as HF and HCl by potentiometry and IR photometry respectively or by the potentiometric method. However, these measurements are not easy to perform and require frequent recalibration of the analysers. Continuous monitoring of these pollutants could be appropriate for particular glass processes that imply the use of chlorine and fluorine compounds in the batch composition, and result in emissions after the abatement system.
In some Member States, national legislation requires continuous monitoring of emissions to be applied for mass flows higher than the threshold values reported in Table 8.15. In other Members States different approaches are applied. For example, in the Netherlands, the requirement for continuous monitoring (monitoring regime) is based on the size of the untreated emission in combination with the controlling technology utilised. The ratio between the ‘failure emission’ and the mass flow check value determines the monitoring regime of the installation (5 different categories) and the consequent type of monitoring required (e.g. frequency, continuous or periodic measurements) for the assigned category [172, NeR, April 2003].
Table 8.15: Mass flow thresholds for continuous monitoring of emissions Mass flow threshold (kg/h) Substance
Germany France Austria Dust 3 >2.5 ≤50 (1)
>50 (2) 3
Sulphur dioxide 30 20 15 NitrogenoOxides, as NO2 30 20 5Carbon monoxide, for evaluating the efficiency of combustion 5Carbon monoxide, all other cases 100 Fluorine compounds, as HF 0.3 1Chlorine compounds, as HCl 1.5 20 Ammonia 10 (1) A continuous monitoring of dust with at least an optical instrument (e.g. opacimeter) required. (2) A continuous monitoring of dust based on a gravimetric method required.

Annexes
444 Manufacture of Glass
Discontinuous measurements Individual measurements may be carried out by separating the different pollutants (generally dust, SOX, HCl, HF, metals) on appropriate filtering materials or in adsorbing solutions, or with the use of continuous extractive measuring instruments (e.g. IR, UV photometry for NOX, SO2,etc.). The number of measurements required is generally established on the basis of the emission variability and the length of the operation to be controlled. In some cases, the operation is carried out in a limited amount of time that only allows a single measurement (e.g. raw materials handling). However, in most cases for a continuous process characterised by stable emissions, a minimum of three separate measurements are required, and for variable emissions five separate measurements. In special cases, up to 8 – 10 measurements can be necessary.
A general indication of the most common methods used for discontinuous monitoring of emissions is given in Table 8.16 .
Table 8.16: Discontinuous monitoring techniques Pollutant/Parameter Method
Dust Filtration and gravimetric determination
Nitrogen oxides (NO + NO2)IR or UV photometry, chemi-luminescence. Absorption in a suitable solution and chemical determination (colourimetry, ion chromatography, etc.)
Sulphur dioxide (SO2) IR or UV photometry
Oxides of sulphur (SO2 + SO3)Absorption in a suitable solution and chemical determination (titration, ion chromatography, ICP)
Sulphur oxide (SO3)Absorption in a suitable solution and chemical determination (titration, ion chromatography)
Metals (As, Pb, Cd, Se, Cr, Cu, V, Mn, Ni, Co, Sb, etc.)
Filtration and/or absorption in a suitable solution. Determination by AAS, ICP
Selenium as Se (particulate + gaseous) Absorption in a suitable solution and chemical determination (e.g. HGAAS, ICP, etc.) [162, ICG-TC 13 2006]
Boron compounds (particulate + gaseous)
Absorption in water and chemical determination (ICP, titration, colourimetric)
Chlorides as HCl Filtration and absorption in suitable solution. Determination by ion chromatography, titration
Fluorides, as HF Filtration and absorption in suitable solution. Determination by ion specific electrode, ion chromatography
Hydrogen sulphide Filtration and absorption in a suitable solution. Ion chromatography, colourimetric determination or back titration
Formaldehyde Absorption in a suitable solution. Colourimetric or HPLC determination
Phenol Absorption in suitable solution. Gas (liquid) chromatography or colourimetric determination
Ammonia Absorption in suitable solution. Ion chromatography, colourimetric or ion selective electrode determination
Amines Absorption in a suitable solution or silica gel. GC, HPLC or GC-MS determination
Volatile organic compounds Flame ionisation detector (FID) Oxygen Paramagnetic, zirconium oxide cell Carbon monoxide IR photometry Carbon dioxide IR photometry NB: The techniques listed are examples and do not cover all the analytical techniques that might be used for the
determination of the different pollutants in the glass industry.
In general, national and international standardised methods (ISO, CEN, VDI, EPA, etc.) are available for measuring most of the relevant emission parameters. However, for a number of substances there is no such standardised methodology. This is the case for most organic substances (phenol, formaldehyde, amines, etc.) but also for many inorganic compounds that

Annexes
Manufacture of Glass 445
can be released to the atmosphere in both particulate and gaseous form (e.g. boron compounds). As already indicated, good common practice suggests performing combined sampling (filtration and adsorption) in order to identify and quantify the different fractions. Mass balance calculation In some cases, and for certain pollutants, a mass balance calculation can provide a good evaluation of process emissions. When the input and output of a specific substance in a process step (e.g. the melting process), together with any chemical and/or physical changes are known with sufficient accuracy, the mass balance can be used as a quantitative method to evaluate emissions. For example this might be the case for SO2 arising from melting, HF in opal glass production, or selenium in bronze or flint glass production (see Section 8.2 for sulphur balances). In general, the mass balance calculation is used to make a comparison with the measured emissions level. Interpretation and reporting of measurement results To give a reasonable standard of interpretation in reporting the results of emission measurements, it is important to specify the following information, as a minimum: • the monitoring method applied • the precision of the method applied • the relevant operating conditions (process data) • the reference conditions (humidity, temperature at measuring point, etc.) • the results of all separate measurements or, in the case of continuous monitoring, the
frequency distribution of all half-hourly, hourly or daily average concentrations. It should be stressed that each method applied for the monitoring of solid and gaseous emissions presents a different detection limit value and the uncertainty of the measurement varies depending on the concentration range to be measured. For emission measurements, the uncertainty should define an interval about the measurement result within which the measured substance can be confidently asserted to lie. For the purpose, the determination of the relative expanded uncertainty is normally considered in place of a combined standard uncertainty. In a significant number of cases, the standard methods applied for the measurement of emissions to air present an uncertainty that can be of the same order of magnitude as the concentration to be measured. In other cases, the concentration to be measured is near the detection limit value of the measuring method applied. All of these aspects should be carefully considered when interpreting the results of emission measurements. Standard methods may report the detection limit values and the uncertainties calculated for a specific concentration range; however, in most cases, these values need to be determined/calculated by the laboratory which applies the measuring methods, on the basis of the specific sampling train and equipment used for the measurement. As an example, the uncertainties and detection limit values observed by two specialised laboratories, accredited under the European norm ISO/IEC 17025, are presented in Table 8.17 and Table 8.18. Table 8.17 presents the detection limit values associated to emission measurements mainly performed on unabated flue-gases.

Annexes
446 Manufacture of Glass
Table 8.17: Example of detection limit values for the measurement of emissions from glass melting furnaces
Parameter Detection limit value (1)Dust 4.8 (2) mg/Nm3
Nitrogen oxides (NOX) 2 – 4 ppm Sulphur oxides (SO2) 0.16 mg/Nm3
Carbon monoxide (CO) 2 – 4 ppm Chlorides (expressed as HCl) 1 mg/Nm3
Fluorides (expressed as HF) 0.05 mg/Nm3
VOC (expressed as C) 0.2 (range 0 – 20) mg/Nm3
Pb 0.032 mg/Nm3
Cr 0.011 mg/Nm3
Cu 0.010 mg/Nm3
Ni 0.032 mg/Nm3
As 0.002 mg/Nm3
Cd 0.003 mg/Nm3
Hg 0.001 mg/Nm3
(1) The values are typical figures observed for the measurement of solid and gaseous emissions from the glass melting furnaces.
(2) The detection limit value refers to measurements of dust on unabated flue-gases. Source: [118, CTCV Data for BREF revision 2007] [175, CTCV 2010]
Table 8.18 presents the detection limit values and expanded uncertainties determined for the indicated methods which are applied by the certified laboratory for emission measurements mainly performed on abated flue-gases.
Table 8.18: Example of detection limit values and expanded uncertainties for the measurement of emissions in the glass industry sector
Parameter Method Detection limit Expanded uncertainty
HF ISO 15713: 2006 Potentiometry 0.1 mg/Nm3 Estimated 1mg/Nm3
HCl UNI EN 1911-1/2/3: 1998 Titration with AgNO3
0.1 mg/Nm3 Estimated 1mg/Nm3
SOXUNI EN 14791: 2005 Ion chromatography, titration 1 mg/Nm3 0.126 C* + 8.5 mg/Nm3
NOX
UNI EN 10878: 2000 NDIR, NDU, chemiluminescence
1 mg/Nm3 4 % measured value
NOXUNI EN 14792 Chemiluminescence 1mg/Nm3 0.041 C*+ 2.8 mg/Nm3
Dust UNI EN 13284-1: 2001 Gravimetric
0.3 mg/m3 for dry gases 2 mg/m3 for gases saturated with
water vapour 4 mg/Nm3
O2EN 14789: 2006 Paramagnetic
0.2 % full scale value (0.05 %O2)
0.041 C**+ 0.1 % O2 vol.
NB: - C* = measured concentration in mg/Nm3.- C** = measured concentration in % O2.
Source: [173, SSV-Stazione Sperimentale del Vetro 2010]
Conclusions This annex does not attempt to give any standard methodology for the monitoring of emissions in the glass industry. Where appropriate, established methods are normally available and should be evaluated for each application. The objective of this annex is to give general information and to point out the potential sources of erroneous evaluation of the emission levels that can be obtained by the application of different BAT.

Annexes
Manufacture of Glass 447
8.4 Annex IV: Calculation of conversion factors for the determination of mass emissions from concentrations
The approach used in the GLS BREF for reporting the emission levels from the melting process and the BAT-AELs for the identified techniques comprises both emission concentrations (mg/Nm3) and specific mass emissions (kg/tonne melted glass), also referred to as ‘emission factors’. The expression of BAT-AELs as specific mass emissions has been considered essential in order to appropriately cover all the potential melting options used within the glass manufacturing industry (oxy-fuel, oxygen-enriched, air-fuel melting, etc.). The calculation procedure for the conversion from concentrations to emission factors is already given in Chapter 5 (General considerations) and is based on the waste gas volume (Nm3/h) and the pull rate of the furnace (melted tonnes per hour). The waste gas volume depends mainly on energy consumption, type of fuel, and the oxidant (air, air enriched by oxygen and oxygen with a purity depending on the production process). The energy consumption is a complex function of (predominantly) the type of furnace, the type of glass and the cullet percentage. However, a range of factors can influence the relationship between concentration and specific mass flow, including: • type of furnace (air preheating temperature, melting technique) • type of glass produced (energy requirement for melting) • energy mix (fossil fuel/electric boosting) • type of fossil fuel (oil, gas) • type of oxidant (oxygen, air, oxygen-enriched air) • cullet percentage • batch composition • age of the furnace • furnace size. Mass emissions (kg/tonne of glass) = conversion factor × emissions concentration (mg/Nm3)
Where: conversion factor = (Q/P) × 10–6
and Q = waste gas volume in Nm3/h P = pull rate in tonnes of glass/h.
For this purpose, conversion factors for the different sectors of the glass industry have been estimated on the basis of specific energy consumption data for fuel-air furnaces. For simplicity, the estimation does not take into account the waste gas volume generated by the decomposition of minerals during the melting process (e.g. CO2, SO2). From the specific energy consumption data the theoretical, stoichiometric waste gas volume of the furnace can be calculated and the correction factor can be determined as reported in the following examples, given for the container glass sector. Data used for the calculation are based on specific energy values given in Table 3.13.

Annexes
448 Manufacture of Glass
Example 1 – Container glass Type of furnace: end-fired, regenerative Furnace capacity: 250 t/d equivalent to 10.42 tonnes/h (P) Fuel: natural gas with a net calorific value equivalent to 8500 kcal/Nm3 (NCV) Specific energy consumption (furnace): 4.8 GJ/tonne melted glass (SEC) Conversion factor from GJ to kcal: 238.85 × 10³ (K) Stoichiometric waste gas volume (wet, at 0 % oxygen) for 1 Nm3 natural gas: 10.6 Nm3 (SWG)
Conversion factor = [(SEC × P × K)/NCV × SWG]/P = [(4.8 GJ/t × 10.42 t/h × 238.85 × 10³)/8500 kcal/Nm3 × 10.6 Nm3/h]/10.42 t/h = 1.43 × 10⁻³
Example 2 – Container glass Type of furnace: recuperative Furnace capacity: 250 t/d equivalent to 10.42 tonnes/h (P) Fuel: natural gas with a net calorific value equivalent to 8500 kcal/Nm3 (NCV) Specific energy consumption (furnace): 5.8 GJ/tonne melted glass (SEC) Conversion factor from GJ to kcal: 238.85 × 10³ (K) Stoichiometric waste gas volume (wet, at 0 % oxygen) for 1 Nm3 natural gas: 10.6 Nm3 (SWG)
Conversion factor = [(SEC × P × K)/NCV × SWG]/P = [(5.8 GJ/t × 10.42 t/h × 238.85 × 10³)/8500 kcal/Nm3 × 10.6 Nm3/h]/10.42 t/h = 1.73 × 10⁻³
Example 3 – Container glass Type of furnace: end-fired, regenerative Furnace capacity: 400 t/d equivalent to 16.67 tonnes/h (P) Fuel: natural gas with a net calorific value equivalent to 8500 kcal/Nm3 (NCV) Specific energy consumption (furnace): 4.3 GJ/tonne melted glass (SEC) Conversion factor from GJ to kcal: 238.85 × 10³ (K) Stoichiometric waste gas volume (wet, at 0 % oxygen) for 1 Nm3 natural gas: 10.6 Nm3 (SWG)
Conversion factor = [(SEC × P × K)/NCV × SWG]/P = [(4.3 GJ/t × 16.67 t/h × 238.85 × 10³)/8500 kcal/Nm3 × 10.6 Nm3/h]/16.67 t/h = 1.28 × 10⁻³
Example 4 – Container glass Type of furnace: end-fired, regenerative Furnace capacity: 100 t/d equivalent to 4.17 tonnes/h (P) Fuel: natural gas with a net calorific value equivalent to 8500 kcal/Nm3 (NCV) Specific energy consumption (furnace): 6.9 GJ/tonne melted glass (SEC) Conversion factor from GJ to kcal: 238.85 × 10³ (K) Stoichiometric waste gas volume (wet, at 0 % oxygen) for 1 Nm3 natural gas: 10.6 Nm3 (SWG)
Conversion factor = [(SEC × P × K)/NCV × SWG]/P = [(6.9 GJ/t × 4.17 t/h × 238.85 × 10³)/8500 kcal/Nm3 × 10.6 Nm3/h]/4.17 t/h = 2.06 × 10⁻³
The average value for the calculated conversion factors reported above is equivalent to 1.63 × 10⁻³.

Glossary
Manufacture of Glass 449
GLOSSARY This glossary is meant to facilitate the understanding of the information contained in this document. The definitions of terms in this glossary are not legal definitions (even if some of them may coincide with definitions given in European legislations), they are meant to help the reader understand some key terms in the context of their use in the specific sector covered by this document. This glossary is divided up into the following sections: I. Monetary units II. ISO country codes III. Unit prefixes IV. Units V. Chemical elements VI. Chemical formulae commonly used in this document VII. Acronyms and technical definitions I. Monetary units
Code(1) Country/territory Currency Member State currencies
EUR Euro area (2) euro (pl. euros)
(1) ISO 4217 codes. (2) Includes Austria, Belgium, Cyprus, Estonia, Finland, France, Germany, Greece, Ireland, Italy, Luxembourg,
Malta, the Netherlands, Portugal, Slovakia, Slovenia, Spain.
II. ISO country codes
ISO code Country Member States (*)UK United Kingdom Non-member countries US United States
III. Unit prefixes
Symbol Prefix Term Number Y yotta 1024 1 000 000 000 000 000 000 000 000 Z zeta 1021 1 000 000 000 000 000 000 000 E exa 1018 1 000 000 000 000 000 000 P peta 1015 1 000 000 000 000 000 T tera 1012 1 000 000 000 000 G giga 109 1 000 000 000 M mega 106 1 000 000 k kilo 103 1000 h hecto 102 100 da deca 101 10 ------- ------- 1 unit 1 d deci 10−1 0.1 c centi 10−2 0.01 m milli 10−3 0.001 µ micro 10−6 0.000 001 n nano 10−9 0.000 000 001 p pico 10−12 0.000 000 000 001 f femto 10−15 0.000 000 000 000 001 a atto 10−18 0.000 000 000 000 000 001 z zepto 10−21 0.000 000 000 000 000 000 001 y yocto 10−24 0.000 000 000 000 000 000 000 001

Glossary
450 Manufacture of Glass
IV. Units
Term Meaning bar bar (1.013 bar = 100 kPa or 1 atm) °C degree Celsius cm centimetre d day g gram GJ gigajoule g·mol·s-1 gram moles per second h hour J joule K kelvin (0 °C = 273.15 K) kcal kilocalorie (1 kcal = 4.19 kJ) kg kilogram (1 kg = 1000 g) kJ kilojoule (1 kJ = 0.24 kcal) kPa kilopascal kV kilovolt kWh kilowatt-hour (1 kWh = 3600 kJ = 3.6 MJ) l litre m metre m2 square metre m3 cubic metre mg milligram (1 mg = 10-3 g) MJ megajoule (1 MJ = 1000 kJ = 106 J) mm millimetre (1 mm = 10-3 m) MWh megawatt hour ng nanogram (1 ng = 10-9 g) Nm3 normal cubic metre (at 101.325 kPa, 273.15 K) ouE European odour unit Pa pascal (1 Pa = 1 N/m2)Pa.s pascal second ppm parts per million (1 ppm = 10-6)s second t metric tonne (1000 kg or 106 g) t/d tonnes per day t/yr tonnes per year yr year ~ around; more or less ∆T temperature difference µm micrometre (1 µm = 10-6 m)

Glossary
Manufacture of Glass 451
V. Chemical elements
Symbol Name Symbol Name Ag Silver Mg Magnesium Al Aluminium Mn Manganese Ar Argon Mo Molybdenum As Arsenic N Nitrogen B Boron Na Sodium Ba Barium Nd Neodymium Be Beryllium Ni Nickel Bi Bismuth O Oxygen C Carbon P Phosphorus Ca Calcium Pb Lead Cd Cadmium Pd Palladium Ce Cerium Pt Platinum Cl Chlorine S Sulphur Co Cobalt Sb Antimony Cr Chromium Se Selenium Cs Caesium Si Silicon Cu Copper Sn Tin F Fluorine Sr Strontium Fe Iron Ta Tantalum Gd Gadolinium Ti Titanium Ge Germanium V Vanadium H Hydrogen W Tungsten Hg Mercury Y Yttrium K Potassium Zn Zinc La Lanthanum Zr Zirconium Li Lithium
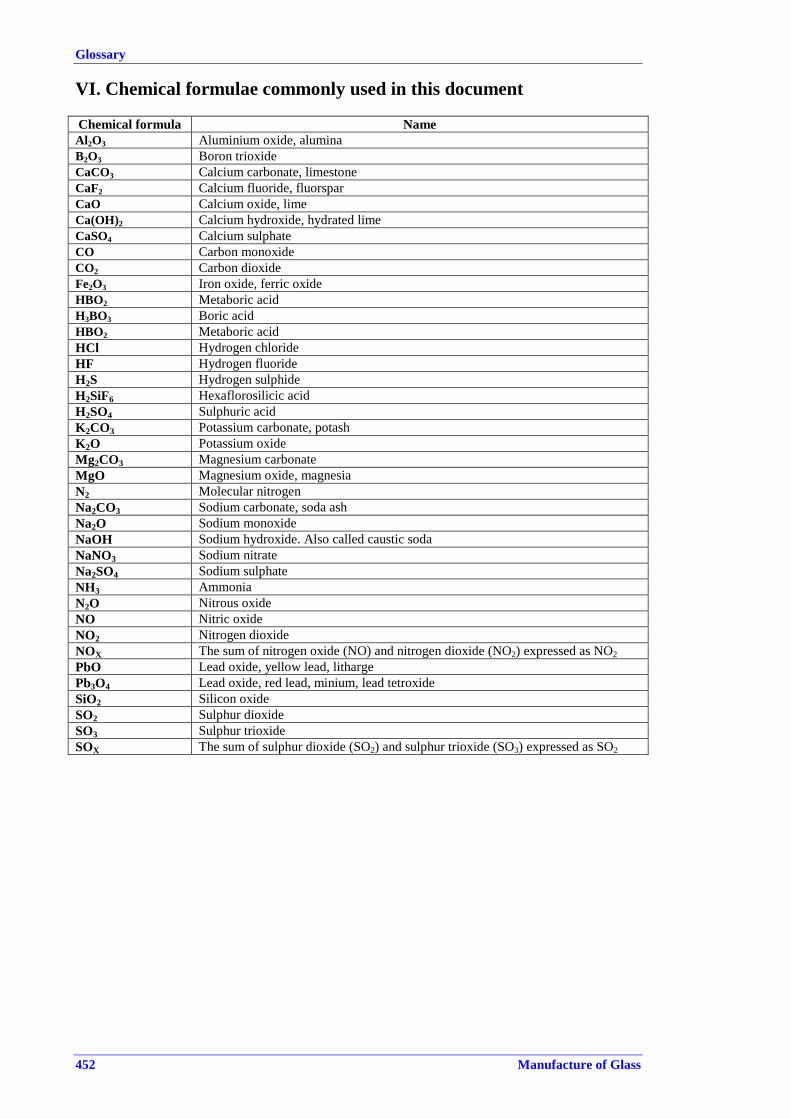
Glossary
452 Manufacture of Glass
VI. Chemical formulae commonly used in this document Chemical formula Name Al2O3 Aluminium oxide, alumina B2O3 Boron trioxide CaCO3 Calcium carbonate, limestone CaF2 Calcium fluoride, fluorspar CaO Calcium oxide, lime Ca(OH)2 Calcium hydroxide, hydrated lime CaSO4 Calcium sulphate CO Carbon monoxide CO2 Carbon dioxide Fe2O3 Iron oxide, ferric oxide HBO2 Metaboric acid H3BO3 Boric acid HBO2 Metaboric acid HCl Hydrogen chloride HF Hydrogen fluoride H2S Hydrogen sulphide H2SiF6 Hexaflorosilicic acid H2SO4 Sulphuric acid K2CO3 Potassium carbonate, potash K2O Potassium oxide Mg2CO3 Magnesium carbonate MgO Magnesium oxide, magnesia N2 Molecular nitrogen Na2CO3 Sodium carbonate, soda ash Na2O Sodium monoxide NaOH Sodium hydroxide. Also called caustic soda NaNO3 Sodium nitrate Na2SO4 Sodium sulphate NH3 Ammonia N2O Nitrous oxide NO Nitric oxide NO2 Nitrogen dioxide NOX The sum of nitrogen oxide (NO) and nitrogen dioxide (NO2) expressed as NO2
PbO Lead oxide, yellow lead, litharge Pb3O4 Lead oxide, red lead, minium, lead tetroxide SiO2 Silicon oxide SO2 Sulphur dioxide SO3 Sulphur trioxide SOX The sum of sulphur dioxide (SO2) and sulphur trioxide (SO3) expressed as SO2

Glossary
Manufacture of Glass 453
VII. Acronyms and definitions
Acronyms Definition ac.pol. Acid polishing/polished AES Alkaline Earth Silicate ACGIH American Conference of Industrial Hygienists APC Air Pollution Control system ASW Aluminium Silicate Wool AZS Alumina-zirconia-silica BAS Blowing Air Staging BAT Best Available Techniques BOD Biological Oxygen Demand COD Chemical Oxygen Demand CPIV Comité Permanent des Industries du Verre CRF Chemical Reduction by Fuel CRT Cathode Ray Tube CVD Chemical Vapour Deposition EC European Commission ECFIA European Association representing the High Temperature
Insulation Wool ESP Electrostatic Precipitator ETS Emission Trading Scheme EU European Union EURIMA European Insulation Manufacturers Association FLOX Flameless oxidation GRP Glass-reinforced Plastic HT High Tension HTIW High Temperature Insulation Wools IBC Intermediate Bulk Container I-TEQ International Toxic Equivalent IPPC Integrated Pollution Prevention and Control IS Individual Section LCD Liquid Crystal Display MAK Maximale Arbeitplatzkonzentration NEPSI European Network for Silica OEAS Oxygen-enriched Air Staging OEL Occupational Exposure Limit OSHA Occupational Safety and health Administration PCW Polycrystalline Wool PET PolyEthylene Terephtalate PSA Pressure Swing Absorption RCF Refractory Ceramic Fibre SCR Selective Catalytic Reduction SNCR Selective Non Catalytic Reduction Tpd/TPD Tonnes per day VOC Volatile Organic Compound(s) VSA/VPSA Vacuum Pressure Swing Absorption WESP Wet Electrostatic Precipitator


References
Manufacture of Glass 455
REFERENCES [2] UKDoE, Pollution Control at Large Glass Works, Environmental Resources Limited, 1991.
[4] EPA, Alternative Control Techniques Document - NOx Emissions from Glass Manufacturing, Unites States Environmental Protection Agency, 1994.
[6] EEO, Energy Efficiency Environmental Control in the Glass Industry, Good Practice Guide 127, Energy Efficiency Office UK, 1995.
[7] Ind.duVerre, Reduction des Emissions d 'Oxydes d'Azote dans l'Industrie du Verre, Comité de Suivi du Verre, Arreté du 14mai 1993, 1996.
[9] IPC Guidance S2 3.03, IPC Guidance note S2 3.03, Manufacture of glass fibres, other non-asbestos mineral fibres, glass frit, enamel frit and associated processes, 1996.
[15] ETSU, Energy technology in the Glass Industry Sector (Thermie), AEA Environment and Energy, 1992.
[18] Ercole, 'Oxycombustion: The problems and Perspectives for Development of its Use in Glass Containers Production', US Ceramic Society congress on glass, 1998, San Francisco.
[19] CPIV, CPIV BAT Reference Document for the European Glass Industry, Comité Permanent des Industries du Verre, 1998.
[20] Ehrig et al., Five years of operational experience with the SORG LoNOx Melter, Glastech. Ber. Glass Sci. technol. 68, 1995.
[22] Schott, Schott Guide to Glass second Edition, Ed HG Pfaender, Chapman & Hall, 1996.
[25] FENIX, Saint-Gobain Vitrage Reduit les rejets de NOx du Float D'Aniche á prés de 500 mg/Nm3 par des mesures Primaires, L'Industie Ceramic & Verriere, 1998.
[26] Special Glass, Reference Document of the European Special Glass Industry for the implementation of Directive 96/61/EC, Comité Permanenet des Industries du Verre, 1998.
[27] EURIMA, EURIMA BAT Reference note on insulation wool production, European Insulation Manufacturers Association, 1998.
[28] Domestic, Reference Document of the European Tableware and Domestic Glass Industry for the implementation of Directive 96/61/EC, Comité Permanent des industries du Verre, 1998.
[30] Infomil, Dutch Notes on BAT for the Glass and Mineral Wool Industry, Infomil for Dutch Ministry of Environment (directorate for Air and Energy), 1998.
[31] CPIV, An examination of the low environmental impact of dust emitted by soda-lime glass furnaces, 1998.
[33] Beerkens, Abatment of glass furnace emissions techniques, performance, costs and possible combinations of abatement techniques, 1999.
[38] FENIX, method and Device for Reducing NOx Emission in a Glass Furnace, 1998.
[40] Shulver et al., 3R Technology: An Update, Pilkington, 1997.
[41] ECFIA, Information Report on Environmental Performances of RCF Manufacturing Plants in Europe, ECFIA, 1998.
[42] VDI, Verein Deutscher Ingenieure Guidelines (VDI 2578) Emission Control Glassworks (DRAFT), VDI, 1997.
[46] Illy et al., 'Processes for heat recovery and energy savings in oxy-fired glass furnaces: a technology survey', International Glass Journal, Vol. No 96, 1998.
[47] ANFFECC, Reference Document of the Spanish Frits Industry for the Implementation of the Directiva IPPC 96/61/EC, 1999.
[49] ADEME, Les techniques de désulfuration des procédés industriels, 1999.
[59] SORG, SORG Brochure on Flex Melter – “Discontinuous Production Constant Quality”, GmbH & Co KG, 1999.

References
456 Manufacture of Glass
[60] SORG, SORG Brochure on LoNOx Melter, GmbH & Co KG, 1999.
[62] CPIV Update for Glass BREF, 'Breakdown between glass sectors', Personal Communication, 2007.
[63] CPIV Annual report, Statistical annual report 2006-2007, 2007.
[64] FEVE, 'First contribution of data to the Glass BREF revision of Container glass sector
[65] GEPVP-Proposals for GLS revision, 'Proposal from GEPVP (European Flat Glass Manufacturer Association) for the revision of the Glass BREF', Personal Communication, 2007.
[66] APFE UPDATE IPPC Glass BREF, UPDATE IPPC Glass BREF by Continuous Filament Glass Fibre data (APFE), 2007.
[67] APFE Plant survey, 'APFE Plant survey CFG 2005 ', Personal Communication, 2007.
[68] Domestic Glass Data update, Data update for BREF review related to domestic glass, 2007.
[69] EURIMA data collection, 'Tables with data from 2005 submitted by EURIMA (Mineral Wool Sector) for GLS BREF review', Personal Communication, 2007.
[70] VDI 3469-1, Emission control: Production and processing of fibrous materials - Fibrous dusts – Fundamentals, Overview(Verein Deutscher Ingenieure) March 2007, 2007.
[71] VDI 3469-5, Emission control: Production and processing of fibrous materials - High temperature insulation wool (Verein Deutscher Ingenieure) March 2007, 2007.
[73] Special Glass Proposal, Proposal of review for the Glass BREF from Special glass sector, 2007.
[74] Special Glass breakdown, Special glass sector beakdown table, 2007.
[75] Germany-HVG Glass Industry report, Final report: BAT in the German Glass industry, HVG Hüttentechnisch Vereinigung Der Deutschen Glasindustrie E.V., 2007.
[76] TNO SO2, Inventory of SO2 emissions and emission reduction
potential in the Netherlands glass industry., 2007.
[78] DUTCH Oxy-firing furnaces, NOx-emissions container glass melting oxy-fuel furnaces in the Netherlands, 2007.
[79] TNO Oxy-firing 2005, ATIV Final, OXYGEN-FIRED GLASS FURNACES: EXPECTATIONS AND EXPERIENCES IN THE GLASS INDUSTRY IN THE LAST 15 YEARS, 2005.
[84] Italy Report, 'Italian contribution to Glass BREF Review-2. GLASS INDUSTRY Data', Personal Communication, 2007.
[85] Spanish BAT Glass Guide, Draft of:"Guia de mejores tecnicas disponibles en Espana" in the glass manufacturing sector -July 07, 2007.
[86] Austrian container glass plants, Austrian BREF contribution for container glass plants, 2007.
[88] FEVE Proposal Ch.4-NOx, Proposed modified texts of Chapter 4 for NOx reduction - FEVE (Glass container), 2007.
[89] EURIMA Suggestions, Suggestions for text changes to the IPPC BREF Note, 2007, 2007.
[92] ITC - C071603, ITC - C071603 on the "Current situation of NOx emission values in ceramic frit manufacture. Evaluation of primary measures and abatement techniques", 2007.
[93] EURIMA data tables 80%, EIPPCB Data tables submitted 18_July 07_1, 2007.
[94] Beerkens - APC Evaluation, Evaluation of costs associated with air pollution control for glass melting furnaces, 2008.
[96] TNO-TPD Energy efficiency benchmarking, Energy efficiency benchmarking of glass furnaces., 2003, p. 11.
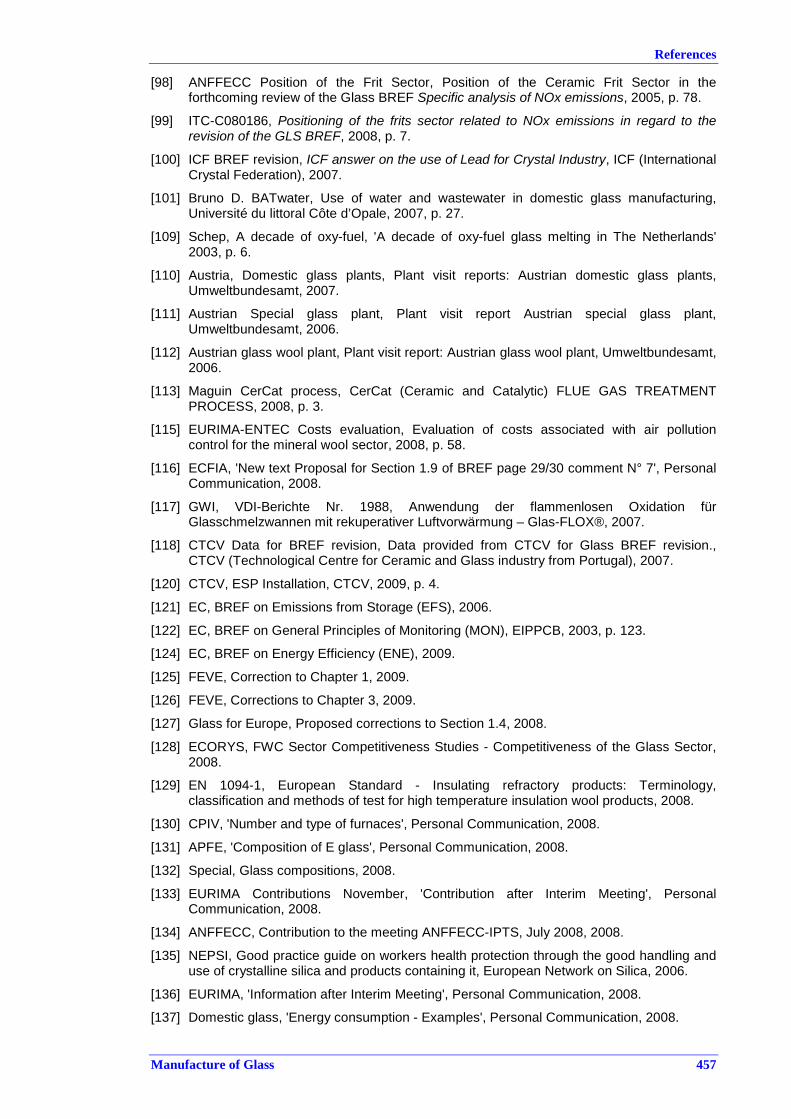
References
Manufacture of Glass 457
[98] ANFFECC Position of the Frit Sector, Position of the Ceramic Frit Sector in the forthcoming review of the Glass BREF Specific analysis of NOx emissions, 2005, p. 78.
[99] ITC-C080186, Positioning of the frits sector related to NOx emissions in regard to the revision of the GLS BREF, 2008, p. 7.
[100] ICF BREF revision, ICF answer on the use of Lead for Crystal Industry, ICF (International Crystal Federation), 2007.
[101] Bruno D. BATwater, Use of water and wastewater in domestic glass manufacturing, Université du littoral Côte d’Opale, 2007, p. 27.
[109] Schep, A decade of oxy-fuel, 'A decade of oxy-fuel glass melting in The Netherlands' 2003, p. 6.
[110] Austria, Domestic glass plants, Plant visit reports: Austrian domestic glass plants, Umweltbundesamt, 2007.
[111] Austrian Special glass plant, Plant visit report Austrian special glass plant, Umweltbundesamt, 2006.
[112] Austrian glass wool plant, Plant visit report: Austrian glass wool plant, Umweltbundesamt, 2006.
[113] Maguin CerCat process, CerCat (Ceramic and Catalytic) FLUE GAS TREATMENT PROCESS, 2008, p. 3.
[115] EURIMA-ENTEC Costs evaluation, Evaluation of costs associated with air pollution control for the mineral wool sector, 2008, p. 58.
[116] ECFIA, 'New text Proposal for Section 1.9 of BREF page 29/30 comment N° 7', Personal Communication, 2008.
[117] GWI, VDI-Berichte Nr. 1988, Anwendung der flammenlosen Oxidation für Glasschmelzwannen mit rekuperativer Luftvorwärmung – Glas-FLOX®, 2007.
[118] CTCV Data for BREF revision, Data provided from CTCV for Glass BREF revision., CTCV (Technological Centre for Ceramic and Glass industry from Portugal), 2007.
[120] CTCV, ESP Installation, CTCV, 2009, p. 4.
[121] EC, BREF on Emissions from Storage (EFS), 2006.
[122] EC, BREF on General Principles of Monitoring (MON), EIPPCB, 2003, p. 123.
[124] EC, BREF on Energy Efficiency (ENE), 2009.
[125] FEVE, Correction to Chapter 1, 2009.
[126] FEVE, Corrections to Chapter 3, 2009.
[127] Glass for Europe, Proposed corrections to Section 1.4, 2008.
[128] ECORYS, FWC Sector Competitiveness Studies - Competitiveness of the Glass Sector, 2008.
[129] EN 1094-1, European Standard - Insulating refractory products: Terminology, classification and methods of test for high temperature insulation wool products, 2008.
[130] CPIV, 'Number and type of furnaces', Personal Communication, 2008.
[131] APFE, 'Composition of E glass', Personal Communication, 2008.
[132] Special, Glass compositions, 2008.
[133] EURIMA Contributions November, 'Contribution after Interim Meeting', Personal Communication, 2008.
[134] ANFFECC, Contribution to the meeting ANFFECC-IPTS, July 2008, 2008.
[135] NEPSI, Good practice guide on workers health protection through the good handling and use of crystalline silica and products containing it, European Network on Silica, 2006.
[136] EURIMA, 'Information after Interim Meeting', Personal Communication, 2008.
[137] Domestic glass, 'Energy consumption - Examples', Personal Communication, 2008.

References
458 Manufacture of Glass
[138] EC, BREF on Large Volume Inorganic Chemicals - Solids and Others (LVIC-S), 2007.
[139] European Commission, BREF on Surface Treatment using Organic Solvents, 2007.
[140] Domestic Glass, 'Comments to Section 3.6.5', Personal Communication, 2008.
[141] Special glass, 'Contribution for Chapter 3', Personal Communication, 2008.
[142] EURIMA August, August 2008 New Tables, 2008.
[143] ECFIA November, 'Contribution for chapters 1 and 3', Personal Communication, 2008.
[144] ITC November, Report C082655 on diffuse/fugitive emissions, 2008.
[145] France contribution, Glass furnace flue gas treatment with dry sodium bicarbonate and treatment of residues, 2007.
[146] EURIMA, Waste injection into stone wool melting furnace, 2007.
[147] Kobayashi et al., 'Development of an advanced batch/cullet preheater for oxy-fuel fired glass furnace', 68th Conference on Glass Problems, 2007, Columbus, OH, USA.
[148] Beerkens, 'Energy saving options for glass furnaces & recovery of heat from their flue gases', 69th Conference on Glass Problems, 2008, Columbus, OH, USA.
[149] Rue et al., 'Recent developments in submerged combustion melting', 67th Conference on Glass Problems, 2006, Ohio, USA.
[150] Knauf, 'ECOSE Technology', Personal Communication, 2008.
[151] Madison Filter Ltd., Low density ceramic filter elements, 2008.
[152] Finland contribution, NASU electrostatic precipitator, 2009.
[153] Germany Precious, Precious cullet preheater, 2007.
[154] EC, BREF on Waste Incineration (WI), 2006.
[155] NER April, Description of the cost effectiveness methodology, INFOMIL, 2003.
[156] EC, BREF on Economics and Cross-Media Effects (ECM), 2006.
[157] European Commission - Green Paper, Green Paper - Towards a European strategy for the security of energy supply, 2000.
[158] EEA - NEC report, NEC Directive status report 2008, European Environment Agency, 2008.
[159] Glass for Europe, Low-E Insulating Glass for Energy Efficient Building, 2009.
[160] Glass for Europe, Solar Control Glass for Greater Energy Efficiency, 2008.
[161] Special glass, 'Investment costs for special glass installations', Personal Communication, 2008.
[162] ICG-TC 13, 'Selenium emissions from glass melting furnaces: formation, sampling and analysis', Glass Technology: European Journal of Glass Science and Technology, Vol. Part A, Volume 47, 2006, pp. 29-38.
[163] Glass for Europe, 'Variation of dust emissions behind an ESP', Personal Communication, 2009.
[164] France - Example installation, Euroglas Hombourg, France - Gerard Genuit, Gilles Guilloteau, 2001.
[165] France, 'French contribution to final draft', Personal Communication, 2010.
[166] ITC- C100244, Additional information to the Conclusions of the Final TWG Meeting for the review of the GLS BREF, Instituto de Tecnologia Ceramica, 2010.
[167] Hans van Limpt (TNO), Modeling of Evaporation Processes in Glass Melting Furnaces, 2007.
[168] CPIV - Health Risk Assessment, Evaluation of Health Risk Assessment from the dust emissions of a Glass Container Factory, 2009.
[169] NEPSI-Good Practice Guide, Good Practice Guide on Workers Health Protection through the Good Handling and Use of Crystalline Silica and Products Containing it, NEPSI, 2006.

References
Manufacture of Glass 459
[170] N.Harris, 'Cloud Chamber Scrubber', Personal Communication, 2009.
[171] Tri-Mer Corporation, Cloud Chamber Scrubber, 2010.
[172] NeR, April, Monitoring Emissions, 2003, p. 9.
[173] SSV-Stazione Sperimentale del Vetro, 'Limiti di rivelabilita' e incertezza estesa dei metodi per la misura delle emissioni', Personal Communication, 2010.
[174] EURIMA position, 'Eurima position on new product formulations', Personal Communication, 2010.
[175] CTCV, 'Detection limit values', Personal Communication, 2010.
[176] TRGS 619, Substitute materials for aluminium silicate wool products, Committee on hazardous Substances - AGS management - Federal Institute for Occupational Safety and Health, 2007.
[177] VDI 3677 Part 1, draft edition, Filtering separators, 2009.
[178] Glass International September, 'Particle size range in the waste gas of flat glass furnaces', Glass International, 2009.
[179] ISO, ISO 14001: 2004 http://www.iso.org/iso/iso_14000_essentials.htm, 2004.
[180] DG Environment, What is Emas? http://ec.europa.eu/environment/emas/index_en.htm, 2010.
[181] Reg. 1221/, REGULATION (EC) No 1221/2009 of the European Parliament and the Council of 25 November 2009 on the voluntary participation by organisations in a Community eco-management and audit scheme (EMAS), repealing Regulation (EC) No 761/2001 and Commission Decisions 2001/681/EC and 2006/193/EC., 2009.
[182] IAF, International Accreditation Forum website http://www.iaf.nu, 2010.

European Commission
EUR 25786 – Joint Research Centre – Institute for Institute for Prospective Technological Studies Title: Best Available Techniques (BAT) Reference Document for the Manufacture of Glass
Author(s): SCALET Bianca Maria, GARCIA MUÑOZ Marcos, SISSA Aivi Querol, ROUDIER Serge, DELGADO SANCHO Luis
Luxembourg: Publications Office of the European Union
2013 – 480 pp. – 21.0 x 29.7 cm
EUR – Scientific and Technical Research series – ISSN 1831-9424 (online), ISSN 1018-5593 (print),
ISBN 978-92-79-28284-3 (pdf)
ISBN 978-92-79-28285-0 (print)
doi:10.2791/69502
Abstract The BREF entitled ‘Manufacture of Glass’ forms part of a series presenting the results of an exchange of information between
EU Member States, the industries concerned, nongovernmental organisations promoting environmental protection, and the
Commission, to draw up, review, and where necessary, update BAT reference documents as required by Article 13(1) of the
Directive. This document is published by the European Commission pursuant to Article 13(6) of the Directive. This BREF for the
glass manufacturing industry covers the following activities specified in Annex I to Directive 2010/75/EU, namely:
• activity 3.3: Manufacture of glass including glass fibre with a melting capacity exceeding 20
tonnes per day
• activity 3.4: Melting mineral substances including the production of mineral fibres with a melting
capacity exceeding 20 tonnes per day.
The document also covers non-melting activities and downstream processes that may be directly associated to these activities
and carried out on the same site.
Important issues for the implementation of Directive 2010/75/EU in the manufacturing of glass are the reduction of emissions
to air; efficient usage of energy and raw materials; minimisation, recovery and recycling of process residues; as well as an
effective implementation of environmental and energy management systems. The BREF document contains eight chapters.
Chapters 1 and 2 provide general information on the glass manufacturing industry and on the industrial processes and
techniques used within this sector. Chapter 3 provides data and information concerning the environmental performance of
installations in terms of current emissions, consumptions of raw materials, water and energy, generation of waste. Chapter 4
describes the techniques to prevent or reduce the environmental impact of installations in this sector. In Chapter 5 the BAT
conclusions, as defined in Article 3(12) of the Directive, are presented for the eight sectors of the glass industry: container glass,
flat glass, continuous filament glass fibre, domestic glass, special glass, mineral wool, high temperature insulation wool, frits.

z
As the Commission’s in-house science service, the Joint Research Centre’s mission is to provide EU policies with independent, evidence-based scientific and technical support throughout the whole policy cycle. Working in close cooperation with policy Directorates-General, the JRC addresses key societal challenges while stimulating innovation through developing new standards, methods and tools, and sharing and transferring its know-how to the Member States and international community. Key policy areas include: environment and climate change; energy and transport; agriculture and food security; health and consumer protection; information society and digital agenda; safety and security including nuclear; all supported through a cross-cutting and multi-disciplinary approach.
LF-NA-25786-EN
-N


