Integrated management principles and their application to ...
28
sinergie, rivista di studi e ricerche Ricevuto: 07/01/2013 n. 93, Gennaio-Aprile 2014, pp. 213-239 Revisionato: 24/07/2013 ISSN 0393-5108 – DOI 10.7433/ s93.2014.13 Accettato: 18/02/2014 Integrated management principles and their application to healthcare systems RON S. KENETT * YIFAT LAVI ** Abstract Purpose of the paper: The paper presents, with examples, the concept of integrated models and the general principles of integrated management, with a focus on healthcare systems. Methodology: Several interventions designed to implement integrated management in two different healthcare systems are presented. In each case, process improvement methodology was applied to common healthcare processes. Findings: The concept of integrating the voice of customer, the voice of workforce and the voice of the process into a cohesive managerial approach was shown relevant also in healthcare. Research limitations: Healthcare systems consist of complex organizational structures. Managers of such organizations are often very conservative and find difficult to adopt a process point of view in order to succeed in the implementation of a comprehensive integrated model. Research and managerial implications: The goal of integrated management is to achieve a proper balance between the needs of the customers, the satisfaction of the workforce and the performance of processes. Such a balance provides added value to the organisation stakeholders, in the wide sense. Originality/Value of the paper: Integrated models were developed in industry and their implementation was widely tested thanks to the model generalization by Kenett (2004). The research shows how healthcare systems can benefit from integrated models by pointing out similarities and differences between healthcare and industry organizations. This permits better planning of integrated model implementation and increases the potential for success. Key words: integrated models; integrated management; Bayesian networks; healthcare systems; planned interventions; lean sigma. * KPA Ltd., Raanana, Israel and University of Turin, Italy e-mail: [email protected] ** Doctoral student at the University of Turin, Italy e-mail: [email protected]
Transcript of Integrated management principles and their application to ...
sinergie, rivista di studi e ricerche Ricevuto: 07/01/2013
n. 93, Gennaio-Aprile 2014, pp. 213-239 Revisionato: 24/07/2013
ISSN 0393-5108 – DOI 10.7433/ s93.2014.13 Accettato: 18/02/2014
Integrated management principles and their application to healthcare systems
RON S. KENETT
* YIFAT LAVI
**
Abstract
Purpose of the paper: The paper presents, with examples, the concept of integrated
models and the general principles of integrated management, with a focus on healthcare
systems.
Methodology: Several interventions designed to implement integrated management in two
different healthcare systems are presented. In each case, process improvement methodology
was applied to common healthcare processes.
Findings: The concept of integrating the voice of customer, the voice of workforce and
the voice of the process into a cohesive managerial approach was shown relevant also in
healthcare.
Research limitations: Healthcare systems consist of complex organizational structures.
Managers of such organizations are often very conservative and find difficult to adopt a
process point of view in order to succeed in the implementation of a comprehensive integrated
model.
Research and managerial implications: The goal of integrated management is to achieve
a proper balance between the needs of the customers, the satisfaction of the workforce and
the performance of processes. Such a balance provides added value to the organisation
stakeholders, in the wide sense.
Originality/Value of the paper: Integrated models were developed in industry and their
implementation was widely tested thanks to the model generalization by Kenett (2004). The
research shows how healthcare systems can benefit from integrated models by pointing out
similarities and differences between healthcare and industry organizations. This permits
better planning of integrated model implementation and increases the potential for success.
Key words: integrated models; integrated management; Bayesian networks; healthcare
systems; planned interventions; lean sigma.
* KPA Ltd., Raanana, Israel and University of Turin, Italy
e-mail: [email protected] ** Doctoral student at the University of Turin, Italy
e-mail: [email protected]
INTEGRATED MANAGEMENT PRINCIPLES AND THEIR APPLICATION TO HEALTHCARE SYSTEMS 214
1. Introduction
Integrated Management is an updated vision of how to manage organizations in
general and health care systems in particular. Underlining the approach is a map of
cause and effects with inputs generated from the voice of the customer, the voice of
the workforce and the voice of the process. Combining information from these
various sources supports balanced decisions aimed at achieving, simultaneously,
high customer satisfaction, an enthusiastic workforce and success in performance
and financial dimensions (Rucci et al., 1998; Kenett, 2004; Godfrey and Kenett,
2007; Kenett, 2009).
The combination of an integrated holistic view with a descriptive causality map
is the main characteristic of integrated management models. To implement such
models requires both appropriate data and the application of various tools and
methodologies. Kenett (2004) discusses a general approach to integrated models and
Lavi et al., (2011) combine Six Sigma, Lean Sigma, Human Sigma, Balanced
Scorecards and many other methods and tools to deploy an integrated management
model in healthcare. Section 2 elaborates on general cause and effect models,
section 3 deals with integrated management models and section 4 with integrated
models in healthcare.
Two case studies of healthcare systems are presented in section 5. Section 6
summarizes the results of the study and the final section concludes with a discussion
and general remarks. The statistical tools used in the study include control charts,
Bayesian networks and hypothesis testing.
2. Cause and effect models
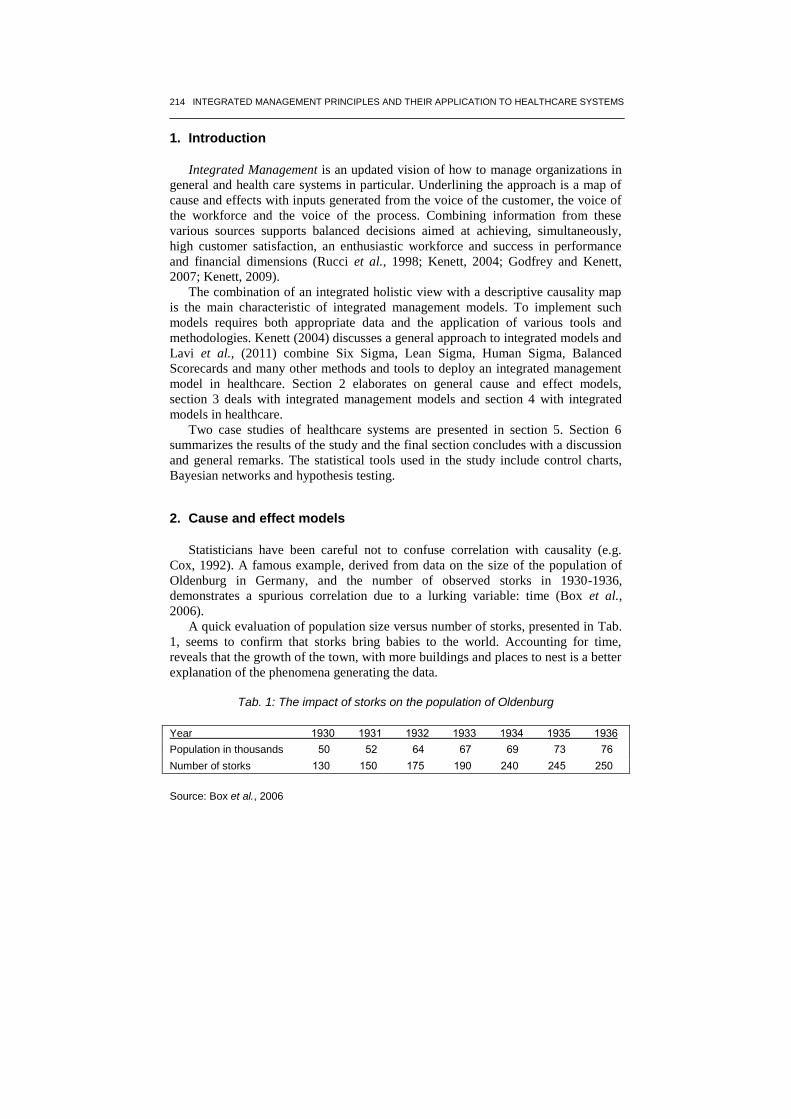
Statisticians have been careful not to confuse correlation with causality (e.g.
Cox, 1992). A famous example, derived from data on the size of the population of
Oldenburg in Germany, and the number of observed storks in 1930-1936,
demonstrates a spurious correlation due to a lurking variable: time (Box et al.,
2006).
A quick evaluation of population size versus number of storks, presented in Tab.
1, seems to confirm that storks bring babies to the world. Accounting for time,
reveals that the growth of the town, with more buildings and places to nest is a better
explanation of the phenomena generating the data.
Tab. 1: The impact of storks on the population of Oldenburg
Year 0391 0390 0391 0399 0391 0391 0391
Population in thousands 11 11 11 16 13 69 61
Number of storks 091 011 061 031 111 111 111
Source: Box et al., 2006

RON S. KENETT - YIFAT LAVI 215
Understanding causality is a basic component of both management methodology
and the scientific method. Establishment of causality relies on a combination of
axiomatic thought and empirical evidence derived from observational studies and
designed experiments. A review of key thinkers and writers in this area covers many
centuries and continents.
Sir Francis Bacon (1561-1626) was the chief figure of the English Renaissance
and an influential advocate of “active science”.
He writes in Novum Organum (New Method, 1620) “... the true method of
experience ... first lights the candle, then by means of the candle shows the way;
commencing as it does with experience duly ordered and digested, not bungling or
erratic, and from it educing axioms, and from established axioms again new
experiments...”.
One century later, the Scottish philosopher David Hume (1711-1776) observes
that:
1. Analytical claims are product of thoughts and empirical claims are a matter of
fact
2. Causal claims are empirical
3. All empirical claims originate from experience.
Two hundred years later, the 20th
century saw an increase in the attention given
to the concept of causation and the role of experimentation. For example Albert
Einstein (1879-1955) has stated that: “Development of Western science is based on
two great achievements: the invention of the formal logical system (in Euclidean
geometry) by the Greek philosophers, and the discovery of the possibility to find out
causal relationships by systematic experiment”, A. Einstein, April 23rd
, 1953.
W. Edwards Deming (1900-1993) made the important distinction between
analytical and enumerative studies (Deming, 1953). The enumerative question is
“how many?”, the analytic question is “why?”. In a dedicated preface to the
Economic Control of Quality of Manufactured Product by W. Shewhart, Deming
states that: “Statistical theory, as taught in the books, is valid and leads to
operationally verifiable tests and criteria for an enumerative study. Not so with an
analytic problem, as the conditions of the experiment will not be duplicated in the
next trial. Unfortunately, most problems in industry are analytic.” By using data
analysis and multidisciplinary teams, causes that were never suspected as the root
cause of problems were identified and eliminated. Some industrial companies
became exceptional simultaneously in their performance, financial outcomes and
quality (Toyota, General Electric, Ford, Motorola etc.).
In 1986, a project designed to achieve improvements in healthcare systems was
launched in the USA and titled - the national demonstration project. In their book,
“Curing health care” (1990), Donald M. Berwick and Blanton A. Godfrey describe
the formation of the project and its main outcomes. The main question asked in the
project was - “Will it be possible to achieve improvements, as experienced by
industry, also in health care systems?”.
INTEGRATED MANAGEMENT PRINCIPLES AND THEIR APPLICATION TO HEALTHCARE SYSTEMS 216
This question was tested by forming working groups which included quality
improvement experts from industry in addition to health care managers from
different health care systems. The project was extremely successful and, in 1991, it
lead to the foundation of IHI, the American institute for healthcare improvement
(http://www.ihi.org). The national demonstration project proved that the statistical
methods and managerial tools used by industry to achieve improved performance
and quality can be also applied in health care systems.
The concept of integrated models presented in this paper is an evolution of this
fundamental insight.
Under this approach, a structured effort is conducted to study cause and effect
relationships between various sources of information. In recent years, causality in
general has become a major issue in statistics. A dynamic viewpoint of causality
connecting causality, mediation and time is presented in Aalen, Roysland and Gran,
2012.
A complete theory of causal diagrams, where cause and effect relationships are
directly integrated into mathematical models has been proposed in the form of
Bayesian networks and structural equation models (Pearl, 1995, 2000, Kenett, 2007,
Kenett and Salini, 2009, Kenett and Raanan, 2010, Kenett and Salini, 2011 and
Kenett, 2012). In order to address the topic of integrated management in health care
systems, we invoke the application of Bayesian networks to present descriptively
causality links.
Bayesian networks (BN) implement a graphical model structure known as a
directed acyclic graph (DAG) that is popular in statistics, machine learning and
artificial intelligence. BN are both mathematically rigorous and intuitively
understandable. They enable an effective representation and computation of the joint
probability distribution over a set of random variables. The structure of a DAG is
defined by two sets: the set of nodes and the set of directed edges (arrows). The
nodes represent random variables and are drawn as circles labelled by the variables
names.
The edges represent direct dependencies among the variables and are represented
by arrows between nodes. In particular, an edge from node Xi to node Xj represents
a statistical dependence between the corresponding variables. Thus, the arrow
indicates that a value taken by variable Xj depends on the value taken by variable
Xi. Node Xi is then referred to as a ‘parent’ of Xj and, similarly, Xj is referred to as
the ‘child’ of Xi. An extension of these genealogical terms is often used to define the
sets of ‘descendants’, i.e., the set of nodes from which the node can be reached on a
direct path.
As an example, consider the analysis of a customer satisfaction survey. The BN
analysis provides a descriptive visual causality map linking the various survey
variables like satisfaction from documentation, training or service provided and
target variables such as overall satisfaction; recommendation and repurchasing
intentions.

RON S. KENETT - YIFAT LAVI 217
By studying the network, one can see that an intervention to improve satisfaction
levels from My Work will increase satisfaction in all other topics and eventually
Overall Satisfaction. As an example, consider the BN with and without conditioning
on the highest satisfaction level of My Work. Without conditioning, the highest level
of satisfaction from Direct Manager (percentage of “5”) is 40% and from Strategy,
Targets and Culture is 27%.
When conditioning the network on the response “5” to My Work as presented in
Fig. 2, 40% increases to 45% and 27% increase to 32%.
Fig
. 1:
Jo
int
Pro
bab
ility
Dis
trib
utio
ns in
a B
ayesia
n N
etw
ork
of
va
ria
ble
s m
ea
su
red
in a
n e
mp
loye
e s
atisfa
ctio
n s
urv
ey o
n a
1-5
sca
le
Sourc
e: K
enett a
nd L
avi, 2
013

INTEGRATED MANAGEMENT PRINCIPLES AND THEIR APPLICATION TO HEALTHCARE SYSTEMS 218
The implication is that if the organization increases the percentage of employees
with top level satisfaction from their direct Manager from 40% to 45% as well as
their satisfaction from Strategy, Targets and Culture from 27% to 32%, Employees
satisfaction levels from their work will increase significantly and their overall
satisfaction will increase as well.
Fig
. 2:
Con
ditio
ne
d N
etw
ork
- R
esp
onse
“5
” o
f “M
y W
ork
” p
ara
me
ter
(Ye
llow
arr
ow
s in
dic
ate
pa
ram
ete
rs w
ith
incre
ased
“5
” re
sp
onse
resu
lted
fro
m c
on
ditio
nin
g th
e n
etw
ork
)
Sourc
e: K
enett a
nd L
avi, 2
013
RON S. KENETT - YIFAT LAVI 219
Management can learn from this analysis what actually affects their employees’
satisfaction and direct future actions accordingly. For more on this data set and
various models used to analyse it see Kenett and Salini (2011).
These examples show how BN can be used to analyze data derived from
“passive” observational databases or from “proactive” designed experiments.
Designed experiments with focused interventions are the gold standard for
determining cause and effect relationships. The next sections present outcomes from
interventions designed to improve healthcare services in an integrated way.
3. Integrated management models
The dictionary defines integration as ‘the act of making a whole out of parts; the
consolidation and harmonizing of parts’. Organizations are built from different part
as well - People, Customers, Suppliers, Working processes and so on. These form
together the whole concept of the organization - The way it produce materials, The
way it gives service, How much employees enjoy working in it, How well financials
are managed etc.
An early example of an integrated management model was implemented by
Sears Roebuck and Co. as the employee-customer-profit model (Rucci et al., 1998).
The model cause and effect chain links three strategic initiatives:
1) to be a compelling place to work;
2) to be a compelling place to shop;
3) to be a compelling place to invest.
In order to push forward these initiatives, Sears’ management looked for answers
to three basic questions:
1) How do employees feel about working at Sears?
2) How does employee behavior affect customers’ shopping experience?
3) How does customers’ shopping experience affect profits?
The model developed by Rucci et al., (1998) reflects detailed answers to these
questions and identifies the drivers to improve employee retention, customer
retention, customer recommendation and profits. Sears has been able to map out
these variables and determine that, for them, a 0.5 increase in employee attitude
could lead to a 1.3 unit increase in customer satisfaction that in turn could lead to a
0.5% increase in revenue growth.
Kenett (2004) presents a generic integrated model that has been implemented in
companies in a variety of industries. The basic building block of the model is data
representing:
1) Voice of the Customer;
2) Voice of the Process;
3) Voice of the Workforce
An early example of an integrated model is provided by a company specializing
in HOD (Home Office Delivery) of water bottles who was able to establish that an
increase in average employee satisfaction from their immediate supervisor, by

INTEGRATED MANAGEMENT PRINCIPLES AND THEIR APPLICATION TO HEALTHCARE SYSTEMS 220
branch, is directly related to average customer satisfaction from that branch (Kenett,
2004). In the six branches investigated, higher employee satisfaction correlates so
well with higher customer satisfaction, that we can predict customer satisfaction
quite closely on the basis of employee satisfaction level alone.
The implementation of integrated models consists of analyzing internal
operational data, customer and employee surveys, using an interdisciplinary research
teams. A brief sketch of the approach is presented in Fig. 3:
Fig. 3: A general framework for designing and implementing Integrated Models
Source: Kenett, 2004
Kaplan and Norton introduced strategy maps as an improved version of their
original balanced scorecards (Kaplan and Norton, 2001, 2004). A strategy map
develops strategic cause and effect relationships by linking measures of financial
performances to measures on their drivers. To build a strategy map the authors
suggest a top down approach, starting with financial performances to be followed by
cross-perspective routes leading to these performances. Norton (2004) describes the
strategy map as a set of hypothetical causal relationships to be continually tested and
revised and suggests testing causal linkages by means of statistical correlation
analysis. However, correlation analysis is a relatively crude tool. It can only measure
the strength of the relationships among performance indices and does not consider
the time element involved. By contrast, techniques utilized in statistical process
control seem to be more appropriate. Dror and Barad (2006) develop a validation
process for dynamically investigating performance linkages as implied by a given
strategy map. The proposed validation process takes into account the time dimension
in performance measurement as well as the time lag between causes and their
effects. Kenett (2009) shows how BNs can be used to connect Key Process
Indicators and produce an effective and informative management dashboard.
Annual Customer
Satisfaction Survey
On- going and Special
Purpose Surveys
Global View
Annual plans
On- going Control
and special studies
Cause and Effect
Relationships
Voice of the Customer (VOC)
Research teams
Voice of the Workforce (VOW)
Training
Mkt. initiatives
Improvements
Compensation
Voice of the Process (VOP)

RON S. KENETT - YIFAT LAVI 221
4. Integrated management models in healthcare
The implementation of integrated management models in healthcare systems
requires special considerations and taking into account the complexity of the system.
Healthcare systems are based on medical science and include treatment protocols,
medical equipment, and pharmaceutical products. Healthcare management
requirements impact significantly the delivery of care, beyond the various aspects of
medical science.
Healthcare managers are required to also manage logistics systems as well as
administrative processes. A successful healthcare manager will be able to bring the
healthcare system under his control to better financial, medical and service-related
outcomes. While the medical profession and the management of patients’ medical
condition become more and more complex, the multifaceted aspects of successful
healthcare management are becoming increasingly challenging.
Modern management of healthcare systems requires a review of old work habits
in parallel with the introduction of a general evidence based approach. More and
more healthcare service providers consider now an integrated care model for
patients, at all levels of care (primary, secondary and tertiary) in order to improve
and become more effective and efficient.
An example of such an integrated care delivery model was presented by the
English National Health Service (NHS) in Camden (http://www.camden.nhs.uk).
Healthcare delivery concerns the routines in hospitals, including primary patient
processes, medical support processes, and nonmedical support processes.
Characteristics of these processes, such as their capacity, efficiency, and reliability,
determine important performance dimensions of healthcare, like throughput, patient
safety, and waiting times. Ultimately, these characteristics have a substantial impact
on patient satisfaction, cost, and the quality and timeliness of medical care.
Denney et al., 2009, suggest a list of key points in healthcare systems’
management. These are:
1. safety;
2. effectiveness;
3. patient-centered care;
4. timelines;
5. efficiency;
6. equitable care.
These key elements play a critical role in considering an integrated model that
balances out these considerations. In terms of Bayesian networks, the above six
elements can be used as key process indicators that affect key system stakeholders.
More and more healthcare organizations are involved in the process of designing the
best way to manage healthcare systems and in defining which indicators will allow
the best decision making. Two such examples are presented next.
In the context of the SiVeAS Project, the Laboratorio Management e Sanità of
Scuola Superiore Sant’Anna (MeS Lab) in Pisa, Italy, developed a performance
evaluation system in order to assess performance by regional healthcare services.

INTEGRATED MANAGEMENT PRINCIPLES AND THEIR APPLICATION TO HEALTHCARE SYSTEMS 222
The performance evaluation system proposed by MeS Lab consists of 34 indicators
and 6 dimensions. The Italian Ministry of Health has charged MeS Lab to collect
data and compare different healthcare institutions at the national level in Italy
(http://www.salute.gov.it/siveas/siveas.jsp). This data can be used to support an
integrated management model of the Italian healthcare system.
Another example of an integrated view on healthcare systems can be found in
Scotland (Scottish Department of Health, 1999). Achieving integration of care
services is a key policy objective of Scotland’s newly devolved government and is
intended to reduce the frustration, the delay, the inefficiency, and the gaps that
frequently exist in care systems. While working on a development of an integrated
health care system, several learning points were documented. Tab. 2 presents these
key points.
Tab. 2: Learning points from the JIF in Scotland
The process worked well:
1. Where there is a history of good relationships. 2. Where the leadership of the Primary Care Trust is committed to making JIF work and has
afforded it high priority. 3. Where attention has not been diverted by other major changes/crises.
The process was ‘slow’:
4. Where the health Board and Trusts faced financial pressures. 5. Where there is no shared vision of the JIF. 6. Where the JIF is afforded low priority. 7. Where there is skepticism about whether resources can be moved from the acute sector. 8. Where relationships between local ‘partners’ were historically poor and the cultural change
required by JIF seemed impossible.
Source: The Scottish executive department of health, 1999
In Israel, The National Quality Measures Program is an activity equivalent to the
SiVeAS Project. The program began as a research project initiated by a team of
researchers from Ben Gurion University, in cooperation with four Israeli HMOs.
During the research stage, a unified standardized measures system was developed
mainly for primary care. This enabled the establishment of a reliable and ongoing
assessment of the quality of care in the community in accordance with national
Israeli and international goals. In 2004 the project was adopted by the Israeli
Ministry of Health and recognised as an operational national program. The program
allows routine and dynamic quality assessment of the preventive, diagnostic,
therapeutic and rehabilitative services supplied by the HMOs. To date, 69 indicators
have been developed in six main medical fields and are regularly measured in the
total Israeli population. This ongoing scientific infrastructure helps in setting
national priorities during policy making and induces quality improvement. The
information is also available and open to the general public providing an assessment
of the quality of services in Israel (see http://www.israelhpr.org.il/e/87/67.htm).
As already mentioned, healthcare indicators can be combined using Bayesian
networks described in section 2 to generate a comprehensive map of cause and
effect relationship. As described in section 2, statistically designed experiments are
RON S. KENETT - YIFAT LAVI 223
Technology Peoplee
Processes
Patient
also instrumental in determining cause an defect relationships (see Moore, 1993,
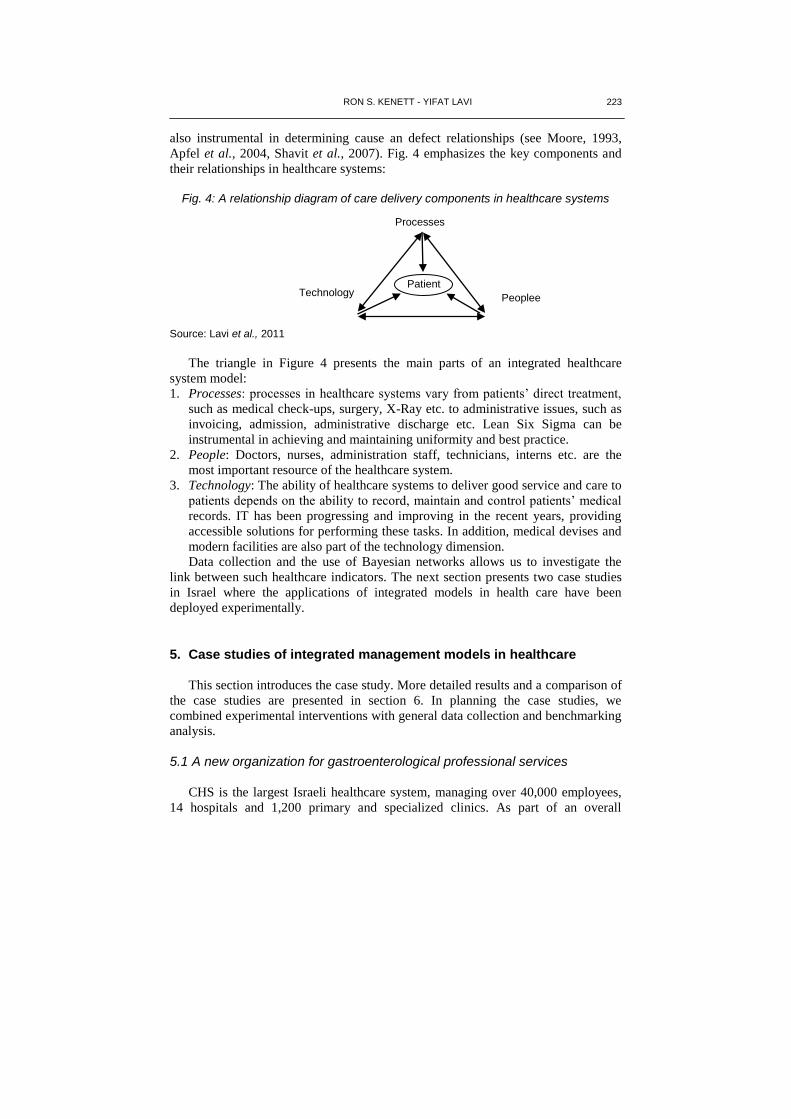
Apfel et al., 2004, Shavit et al., 2007). Fig. 4 emphasizes the key components and
their relationships in healthcare systems:
Fig. 4: A relationship diagram of care delivery components in healthcare systems
Source: Lavi et al., 2011
The triangle in Figure 4 presents the main parts of an integrated healthcare
system model:
1. Processes: processes in healthcare systems vary from patients’ direct treatment,
such as medical check-ups, surgery, X-Ray etc. to administrative issues, such as
invoicing, admission, administrative discharge etc. Lean Six Sigma can be
instrumental in achieving and maintaining uniformity and best practice.
2. People: Doctors, nurses, administration staff, technicians, interns etc. are the
most important resource of the healthcare system.
3. Technology: The ability of healthcare systems to deliver good service and care to
patients depends on the ability to record, maintain and control patients’ medical
records. IT has been progressing and improving in the recent years, providing
accessible solutions for performing these tasks. In addition, medical devises and
modern facilities are also part of the technology dimension.
Data collection and the use of Bayesian networks allows us to investigate the
link between such healthcare indicators. The next section presents two case studies
in Israel where the applications of integrated models in health care have been
deployed experimentally.
5. Case studies of integrated management models in healthcare
This section introduces the case study. More detailed results and a comparison of
the case studies are presented in section 6. In planning the case studies, we
combined experimental interventions with general data collection and benchmarking
analysis.
5.1 A new organization for gastroenterological professional services
CHS is the largest Israeli healthcare system, managing over 40,000 employees,
14 hospitals and 1,200 primary and specialized clinics. As part of an overall

INTEGRATED MANAGEMENT PRINCIPLES AND THEIR APPLICATION TO HEALTHCARE SYSTEMS 224
organizational change, a new professional organisational unity was created in the
gastroenterology department of the Dan-Petach Tiqva district and called the “gastro
space”. This professional space includes 3 clinics - two are located in hospitals and
one in a primary care clinic in the community health service. In this district, about
60,000 patients use gastroenterology health related services in a course of a year
including endoscopic procedures, consultations, surgeries etc. By creating this
professional space, primary, secondary and tertiary care is managed as one
integrated unit with a focus on patient optimal care and best performance.
As part of a research project held at the University of Turin, Italy, a collaboration
was established with this professional space in order to define the best managerial
model that will enable managing such a complex organization. Employee’s
satisfaction, patient satisfaction, financial data (cost of tests, retakes, procedures
etc.), adverse events, patient’s appointments data and clinics waiting time data for
queue management was extracted from CHS databases in order to create the baseline
for the research. In addition, in depth interviews were held with representatives from
all organization disciplines - management, gastroenterology doctors, nurses,
administrators and clinical research coordinators. The study included the following
research methods:
1. Case control - performance of units of similar characteristics were used as
control.
2. Benchmark - identification of units in Italy or elsewhere were used as
benchmark.
3. Longitudinal assessment - the research included a before and after comparison.
The gastro space new professional structure included 3 units, which are used as
gastroenterology clinics. Since they provide similar health services and have the
same professional team available, it was also possible to compare them to each
other. As part of the intervention, after analyzing the baseline data and interview
findings, three pilot projects were defined as an intervention in the gastroenterology
clinics. All projects were managed as lean sigma projects and were mentored by a
professional lean facilitator:
1. Procedure room project - eliminating waste in the procedure room, as well as
increasing capacity and improving patient/staff safety.
2. Appointment scheduling project - Improving the appointment scheduling process
in order to reduce waiting time to the gastro clinics.
3. Patients’ readiness for endoscopic procedures project - Reduce number of
patients which arrive unprepared to endoscopic procedures (~20%) and are
forced to redo the procedure.
As part of the intervention process, the gastro team went through a 15 hours
professional lean sigma training program. Team members included
gastroenterologists, nurses, administrators, clinical research coordinators and
managers.
For each of the three topics, teams gathered data from IT systems in their gastro
units. Data was cleaned and analyzed to create a baseline for the projects.

RON S. KENETT - YIFAT LAVI 225
The new gastro space organization management aimed to reach uniform
processes and performance levels in all three units. At the first stage of the three
projects, data was pulled from each unit and compared. Although it seemed like a
simple task, this was one of the difficulties teams had to face. The lack of a joint
database for the new organization made them pull data from three different systems
and sometimes this was an impossible task due to different data format. As an
example, Fig. 5 shows the waiting time to get an appointment to the gastro unit for
basic consultation. In case an administrator wanted to help patients get an earlier
appointment in one of the other two units, there was no way he could see availability
through the IT system. Patients would have to call all three units, sometimes even
schedule an appointment in all three units, and only then decide what will be their
choice. This issue resulted in:
1. low satisfaction levels of patients;
2. long waiting time for telephone service centers due to calls overload;
3. an appointment No-Show rate of 30% in all units;
4. long waiting for a gastro consultation due to unnecessary scheduled
appointments (when scheduling in the three units in parallel for the same
patient);
5. frustration of administrators;
6. poor process performance in service indicators of CHS.
Failed preparation for colonoscopy was also one of the topics chosen for the
improvement projects. Data showed differences between similar units of the
organization.
Fig. 5: Analysis of data - Waiting time (in days) for gastro consultation
Source: Niv, 2011
Data from the third unit in the gastro space new organization is missing since
there was no possibility to retrieve this information from its IT system. As Fig. 6
Time (days) for GI appointment in the community (Concord)
32,06 30,44
24,11
20,73
14,63 12,63
15,31
18,51 20
21,82 20,2
36,96
10
12
14
16
18
20
22
24
26
28
30
32
34
36
38
40
Jan-00 Jan-00 Jan-00 Jan-00 Jan-00 Jan-00 Jan-00 Jan-00 Jan-00 Jan-00 Jan-00 Jan-00
No. of Days
Days
INTEGRATED MANAGEMENT PRINCIPLES AND THEIR APPLICATION TO HEALTHCARE SYSTEMS 226
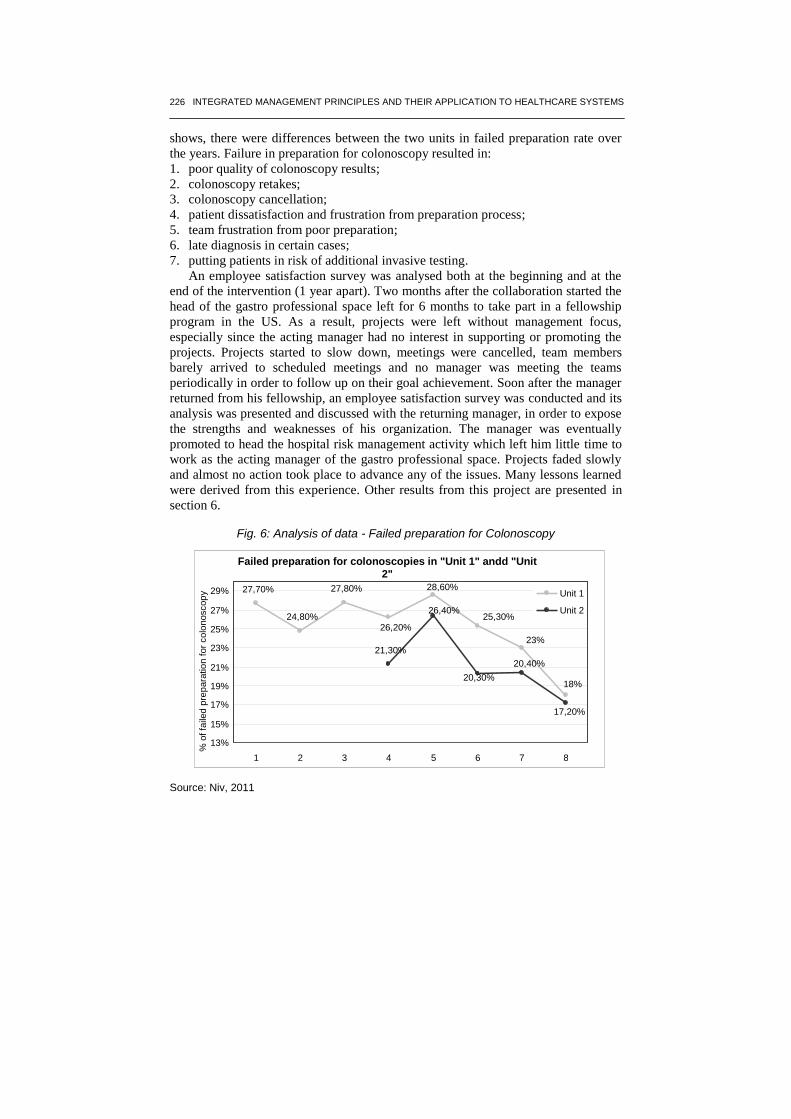
shows, there were differences between the two units in failed preparation rate over
the years. Failure in preparation for colonoscopy resulted in:
1. poor quality of colonoscopy results;
2. colonoscopy retakes;
3. colonoscopy cancellation;
4. patient dissatisfaction and frustration from preparation process;
5. team frustration from poor preparation;
6. late diagnosis in certain cases;
7. putting patients in risk of additional invasive testing.
An employee satisfaction survey was analysed both at the beginning and at the
end of the intervention (1 year apart). Two months after the collaboration started the
head of the gastro professional space left for 6 months to take part in a fellowship
program in the US. As a result, projects were left without management focus,
especially since the acting manager had no interest in supporting or promoting the
projects. Projects started to slow down, meetings were cancelled, team members
barely arrived to scheduled meetings and no manager was meeting the teams
periodically in order to follow up on their goal achievement. Soon after the manager
returned from his fellowship, an employee satisfaction survey was conducted and its
analysis was presented and discussed with the returning manager, in order to expose
the strengths and weaknesses of his organization. The manager was eventually
promoted to head the hospital risk management activity which left him little time to
work as the acting manager of the gastro professional space. Projects faded slowly
and almost no action took place to advance any of the issues. Many lessons learned
were derived from this experience. Other results from this project are presented in
section 6.
Fig. 6: Analysis of data - Failed preparation for Colonoscopy
Source: Niv, 2011
Failed preparation for colonoscopies in "Unit 1" andd "Unit
2"
27,70%
24,80%
27,80%
21,30%
26,20%
28,60%
25,30%
23%
18%
26,40%
20,30% 20,40%
17,20%
13%
15%
17%
19%
21%
23%
25%
27%
29%
1 2 3 4 5 6 7 8
% o
f fa
iled
pre
para
tio
n f
or
colo
noscop
y
Unit 1 Unit 2

RON S. KENETT - YIFAT LAVI 227
5.2 Geriatric medical center
“Dorot medical center”, started as a Nursing Home in 1954 and was converted
into a recovery medical center for third age patients. There are 365 beds in the
hospital, in 12 medical wards. Main services provided at Dorot, are: acute geriatrics,
nursing and complex nursing care, rehabilitation, long-term ventilation care,
oncology - hospice care and a mentally frail unit. Dorot is co-managed by a CMO
(Chief Medical Officer) and a CEO (Chief Executive Officer).
Dorots’ Patient safety manager was looking for possibilities to engage
employees into patient safety issues through joint work and data analysis. As a
result, an intervention was designed in Dorot as another case study of the research
on integrated models in healthcare. After two meetings with hospital management
(including also the Chief Nursing Officer) with the research team, two topics were
chosen for the intervention process:
1. Patients falls reduction project - Reducing patients falls in 10%, without
increasing chemical or physical constraints.
2. Bedsores reduction project - Eliminating occurrence of new bedsores – Reducing
new occurrence of bedsores in addition to establishing a methodology for
bedsores reporting and measuring.
Team members were chosen by management and the patient safety manager was
appointed to lead both projects with a professional mentoring assistance. Both teams
started six Sigma projects and got trainings on tools and methodology during the
meetings (no formal Six Sigma/Lean training took place). Team members included
Doctors, RN’s, Nurse Aides, Pharmacist, Nutritionist and Patient Safety manager.
Both teams analyzed available data, performed brainstorming, used analytic tools
for prioritization of tasks and concept, performed a fishbone analysis, were trained
on 5S concepts etc.
After completing the definition of a “Problem statement” the teams presented
their work plan to a steering committee consisting of the CMO, CEO and CNO. A
bi-weekly two hours meeting was scheduled for each team in order to ensure
ongoing progression. Teams experienced some difficulties, facing uncooperative
team members, personal relationship issues and work load, which made it hard for
them to leave their work for the meetings. The CMO and CNO were updated
frequently on the progress of the projects, helping solve any of the above with the
best possible outcome. The teams met again the steering committee again to present
their finding according to data and joint team work and suggest several improvement
solutions.
As a result of this meeting, the falls reduction team finalized visual indicating
characteristics of the patients so that the hospital team become more efficient and
effective in handling the patient. The second team started improvements in patient
handling activity in order to reduce wasted time and provide time for actions
designed to reduce bedsore occurrence.

INTEGRATED MANAGEMENT PRINCIPLES AND THEIR APPLICATION TO HEALTHCARE SYSTEMS 228
6. Results
The two healthcare systems that were chosen for the intervention process have
different characteristics and organizational structures. A comparison of the baseline
characteristics of the two case studies is presented in Tab. 3:
Tab. 3: Case studies characteristics comparison
Case Study
Healthcare top Mgt. system
Organization Seniority
Organization complexity
Main services Acting management
1 CHS – H MO 1.5 Years High Ambulatory gastro procedure and consultation
Gastroenterologist
2 Government 7 Years Low Rehabilitation & hospitalization of elderly patients
Geriatric Specialist & Administrator
Source: Kenett and Lavi, 2013
As shown in Table 3, the two case studies are different which provides a basis
for generalisation of integrated models for healthcare systems. Tab. 4 presents a
summary of the results and findings discovered to date with the intervention process.
Tab. 4: Summary of intervention main results and findings
Case Study
Staff # of
planned projects
Management Engagement
Professional Training
Access to data
Quality of
existing data
Team satisfaction from the
intervention process
Invention duration
Current Status
1 15 3 Poor Yes Poor Poor Expressed strong
dissatisfaction 2011-2012
Intervention terminated
2 15 2 Strong No Fair Good Expressed satisfaction
02/13 to date
Plans for further word
Source: Kenett and Lavi, 2013
As described in Table 4, the teams in the two organizations reached different
outcomes. One could expect that a team which was trained for 15 hours of process
improvement methodologies will be able to implement the knowledge gained and
will be more prepared and open for changes and joint efforts. However, the
interventions resulted in three teams which were not able to complete their projects
and, eventually, were unhappy about the intervention process. Another point regards
data availability - one of the projects in the Dorot case study lacked the data required
for root cause analysis. While the team could settle for a weak analysis relying on
the data they had, they performed an in depth analysis, collecting data from
structured observations, employee feedback and available external data. As a result
of working on the project, the team realized the importance of having good data for
process control and continuous improvement.
Results from gastro space: After two years of work, the planned intervention was terminated in the gastro
space system. None of the three projects were completed and no significant
improvements were achieved in the processes discussed with management at the
beginning of the project.
Several major issues affected these teams:

RON S. KENETT - YIFAT LAVI 229
- the teams never met management to verify that their problem statement is
aligned with organization goals for success;
- management never defined measurable success indicators;
- team meeting were not scheduled at a fixed day/time;
- no meeting room / working area was assigned for the teams to work in;
- the team members were not given suitable solution for substitutes while
attending team meetings;
- community service doctors who were supposed to take part in the projects, were
not officially assigned to this task.
Specific projects issues were:
Procedure room project
1. This team suffered from issues of team composition and personal relationships in
the team. An assertive chief of nursing from one of the units caused many delays
due to her resistance to team members’ ideas and objections for changes in
processes. In addition, this individual was often late to scheduled meetings,
would talk on the phone during meetings and would get out when called in the
middle of meetings.
2. The acting manager wouldn’t help the team when some of the personal issues
were reported to him. This resulted in frustration and low motivation to
participate in team meetings.
3. The team observed and analyzed different processes in the procedure room and
found several improvement opportunities. Pathology handling at the end of a
procedure was chosen as their specific mission for improvement.
4. Due to the differences between the three units in physical structure, equipment,
working processes and protocols, the teams found it difficult to progress and
define a single process that fits all units.
Tab. 5 has to be advanced in the text: Benchmarking between the three gastro units
Unit Rooms for
procedures Equipment
maintenance and cleaning
Cleaning score
Comfort score
Patient dressing
room
Transfer to
recovery
Documentation
1 5 RN’s 5 4 Yes 2 RN’s Performed post procedure, medical and nursing report entered in the computer, pathology report and toxic registry
2 2 RN’s / Nurse
Aides 4 2 No 2 RN’s
Performed post procedure, medical and nursing report entered in the computer, pathology report and toxic registry
3 4 Nurse Aides 5 3 Yes 1 or 2 RN’s
Performed during and post procedure, medical report entered in the computer, Nursing report is written manually and scanned into the computer, pathology report and toxic registry
Source: Kenett and Lavi, 2013
The table presented above demonstrates some of the gaps between the units.
When team tried to address some of the issues to organization management, they
were accused of presenting false data and missing projects’ targets.
Appointment scheduling

INTEGRATED MANAGEMENT PRINCIPLES AND THEIR APPLICATION TO HEALTHCARE SYSTEMS 230
1. This team included three administrative managers from all three units. All
were frustrated from their inability to do their job as good as they wished.
All three were service orientated and were in good relationship between
them. Having a senior gastroenterologist as a team member caused created a
belligerent atmosphere towards the administrative staff.
2. The acting manager was requested to step in and help, however this was not
taken care of.
3. The team worked hard in order to analyze the process of appointment
scheduling, especially since the administrative staff failed to analyze the
actions and kept discussing specific cases from daily work.
4. The team faced serious obstacles right at the beginning of their work and a
family doctor was never assigned for this project as originally planned.
5. The new gastro space management invested much effort in appointing focal
point individuals to each primary care clinic and its doctors. This analysis
shows that family doctors are not using their focal points as a source of
knowledge - and there is a need to understand “why?”. Fig. 7 presents the
analysis of the appointment scheduling process as analyzed by the team. In
the process map there are indications of improvement opportunities that the
team noted as next steps already at the beginning of their project.
6. Due to the different IT systems and the required assistance to recover the
data, data collection was a difficult process. It was only late in the project
that the team members were able to meet a family doctor which joined their
meeting. In this meeting, the team realized the improvements required in the
different processes are beyond their abilities since they required the
engagement and support of many units in CHS. Without management
intervention this could not be achieved.
Fig. 7: Scheduling appointment process map with improvement opportunities
Source: Lavi, 2011
RON S. KENETT - YIFAT LAVI 231
Patients’ readiness for endoscopic procedures
1. This team worked on a very problematic issue. Failed preparation for endoscopic
procedures could result in the worst case even a late diagnosis of colon cancer
patients. In most cases preparation quality is discovered only after procedure
have started, which meant an appointment was wasted, including the waste of
resources - room, equipment, medical staff time etc. Patient satisfaction was
affected as a result as well, since in some cases there was a need to redo the
unpleasant procedure or come back for it sooner than usually. Since patients are
instructed to arrive accompanied by someone, this would mean that another
persons’ time was also wasted.
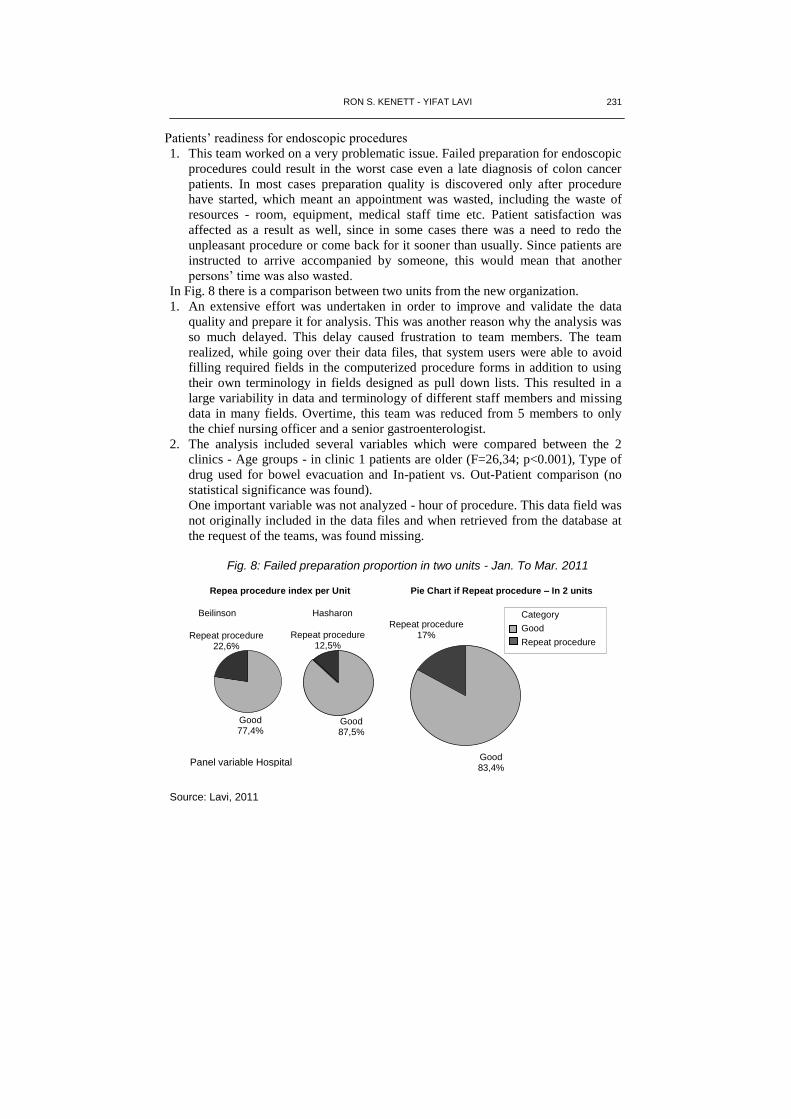
In Fig. 8 there is a comparison between two units from the new organization.
1. An extensive effort was undertaken in order to improve and validate the data
quality and prepare it for analysis. This was another reason why the analysis was
so much delayed. This delay caused frustration to team members. The team
realized, while going over their data files, that system users were able to avoid
filling required fields in the computerized procedure forms in addition to using
their own terminology in fields designed as pull down lists. This resulted in a
large variability in data and terminology of different staff members and missing
data in many fields. Overtime, this team was reduced from 5 members to only
the chief nursing officer and a senior gastroenterologist.
2. The analysis included several variables which were compared between the 2
clinics - Age groups - in clinic 1 patients are older (F=26,34; p<0.001), Type of
drug used for bowel evacuation and In-patient vs. Out-Patient comparison (no
statistical significance was found).
One important variable was not analyzed - hour of procedure. This data field was
not originally included in the data files and when retrieved from the database at
the request of the teams, was found missing.
Fig. 8: Failed preparation proportion in two units - Jan. To Mar. 2011
Source: Lavi, 2011
Good 77,4%
Repeat procedure 22,6%
Good 87,5%
Repeat procedure 12,5%
Repea procedure index per Unit
Beilinson Hasharon
Good 83,4%
Repeat procedure 17%
Category
Good
Repeat procedure
Pie Chart if Repeat procedure – In 2 units
Panel variable Hospital

INTEGRATED MANAGEMENT PRINCIPLES AND THEIR APPLICATION TO HEALTHCARE SYSTEMS 232
3. The team efforts were presented in a quality meeting organized by their returning
manager. No actual conclusions were presented and the team stopped meeting.
2011 Employee satisfaction survey results
At the beginning of the intervention in the gastro space organization, an
employee satisfaction survey was conducted in all three clinics.
The gastro space manager sent a notice to all employees, asking their
cooperation and encouraging response to it. The overall response rate was about
40%.
After completing the analysis, the survey[s main findings were presented to the
gastro space manager.
In comparison to other organizations the results showed that the average
satisfaction level of gastro space employees were high with respect to their work
team and direct manager and average on the other topics (see Fig. 9).
Fig
. 9:
Em
plo
ye
e s
atisfa
ctio
n b
en
chm
ark
ing
- A
vg
. S
atisfa
ction
leve
l
Sourc
e: K
enett, 2012

RON S. KENETT - YIFAT LAVI 233
Among the topics requiring management action in the organization, two were
classified as gastro space management. Specifically these were:
a. The gastro space management does not have open and sincere communication
with its employees.
b. The gastro space management is unaware of daily activities and employees’
daily problems during their work.
In depth interviews were performed a few months after termination of the
intervention.
They indicated low satisfaction from top management support, time consumed
for projects, lack of results and general frustration.
An employee satisfaction survey was performed a year after the first survey,
exploring the intervention impact on employee satisfaction, in addition to the overall
condition of the organization. Response rate to the survey dropped from 40% to
29%. Results of 2012 survey in comparison to 2011 are described in Tab. 6:
Tab. 6: Compared results of employee satisfaction survey 2011 vs. 2012
Overall Satis.
My work
Direct mgr.
Team Emp.
conditions Internal Comm.
Strategy, Targets
Patient Satis.
Work Processes
Organization Mgnt.
2011 33% 25% 40% 37% 16% 23% 27% 24% 25% 23%
2012 25% 20% 20% 28% 17% 42% 28% 19% 21% 18%
∆ -8% -5% -20% -9% +1% +19% +1% -5% -4% -5%
Source: Kenett and Lavi, 2013
2011 survey data analysis indicated “Direct manager”, “Work processes” and
“Team members” as topics in need for immediate action. The above comparison
emphasizes the fact that management did not take into consideration employees’
opinion and did not invest in the right spots.
Bayesian networks were used to compare employee satisfaction data form
healthcare systems in Israel and Italy. The Israeli data included employees’ response
to the first satisfaction survey sent to healthcare employees in the new gastro space
organization.
The Italian database included employees’ response from various healthcare
systems in the Piemonte region in Italy from MeS Lab. In order to compare the
results, the Italian survey questions were sorted into groups matching the Israeli
survey main topics.
INTEGRATED MANAGEMENT PRINCIPLES AND THEIR APPLICATION TO HEALTHCARE SYSTEMS 234
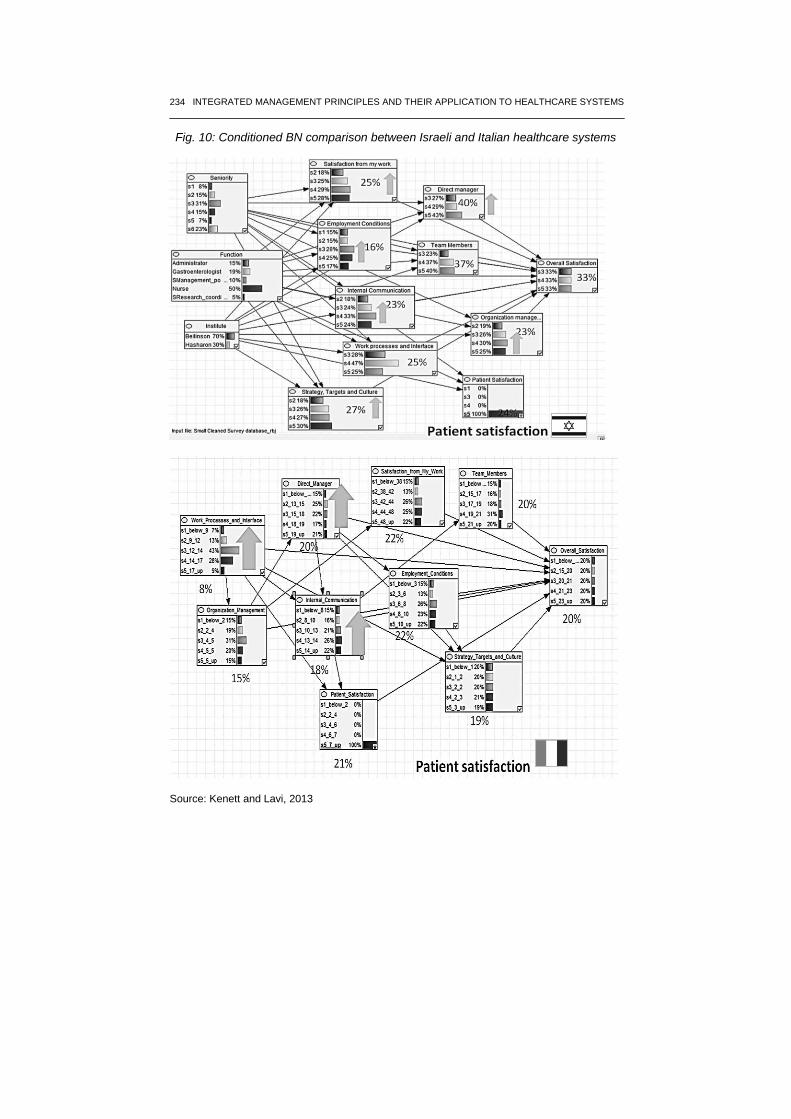
Fig. 10: Conditioned BN comparison between Israeli and Italian healthcare systems
Source: Kenett and Lavi, 2013

RON S. KENETT - YIFAT LAVI 235
Fig. 10 presents a comparison between the two healthcare systems after
conditioning on one of the topics - Patient satisfaction. The Israeli survey network
resulted in an improvement of employees’ satisfaction in six additional topics: my
work (+3%), direct manager (+3%), employment conditions (+1%), internal
communication (+1%), organization management (+2%) and strategy, targets and
culture (+3%). The Italian survey network, however, resulted in an improvement of
employees’ satisfaction only in three additional topics: direct manager (+1%),
internal communication (+4%) and work processes and interface (+1%). The
networks comparison presented in Figure 10 shows that in both the Italian and
Israeli data, improvements in patient satisfaction in healthcare systems are achieved
by improvements in employees’ satisfaction from their direct manager and from
organizations’ internal communication. However, there are differences between the
two healthcare systems in other topics.
Results from Dorot projects: Intervention in the Dorot hospital started on February 2013 and lasted for six
months. Both projects reached the “Improve” phase in their six sigma roadmap. The
“Patient falls” team completed the design of a new tool, which is used like “Traffic
Signs” for staff, indicating specific needs of each patient that need to be accounted
for in order to prevent falling events. The “Bedsores” team started with developing a
solution to nursing lost time in shifts - walking distances, lost equipment, supplies,
standardized work processes etc. This helped staff improve layouts in wards and
establish standard work procedures. The team started the process with complaints on
shortage of suitable equipment for bedsore prevention. Initially, looking at other
directions was not an option. However, thanks to a strong team leader and
professional mentoring, the team discussed possible causes for bedsores occurrence
and rated the causes using an analytical tool designed by KPA Ltd. Each team
member listed the causes and rated them according to: Ability to Change, Required
Investment and Potential Outcome. Tab. 7 presents the results of the rating process.
Tab. 7: Prioritization tool for potential causes for bedsores occurrence
H = High M = Medium L = Low Subjects' Scoring Table
Subject Ability to Change Required Investment Value Achieved core
L M H L M H L M H
Patient placed in bed in a wrong position 0 0 7 5 2 0 0 0 7 95
Patient is sitted in a wrong position 0 1 6 5 2 0 0 0 7 93
Patient is wearing with wet cloths 0 0 7 5 1 1 0 0 7 93
Wrong treatment protocol for patient 0 0 7 2 5 0 0 0 7 88
Wet bed sheets 0 0 7 3 3 1 0 0 7 88
Bed sheets are not placed properly on bed 0 1 6 3 4 0 0 0 7 88
Loose clothing items 1 1 5 4 2 1 0 0 7 83
Protocol is not aligned with working process 0 1 6 0 6 1 0 0 7 79
Late instructions written in patients' protocol 0 1 6 2 4 1 0 2 5 79
Transfusion branoulli presures skin 1 1 4 6 0 1 0 1 6 79
Tight dressing 0 2 5 2 3 2 0 0 7 79
Tight cloths 1 1 5 4 2 1 1 1 5 76
Staff lacks awareness of risk factors 0 1 6 0 5 2 0 0 7 76
Old and unupdated patients' protocols 0 1 6 0 4 3 0 0 7 74
Reevaluation of patients' condition not performed 0 1 6 2 3 2 0 3 4 74
Source: Lavi, 2013
INTEGRATED MANAGEMENT PRINCIPLES AND THEIR APPLICATION TO HEALTHCARE SYSTEMS 236
As a result of looking at the analysis output, the team learned that other causes
need to be addressed in their work, beyond the special prevention equipment which
required a substantial budget. This allowed the team to progress on issues under
their influence such as placing patients in the right position, scheduled position
changes for patients, replacement of wet cloths etc. The team performed
observations and time measurements which were analyzed and used as baseline for
standard work and FTE allocation. This helped reduce wasted time and eliminate
activity by staff with no added value - the outcome was better patient care and
increased bedsores prevention focus. Bedsores data is now being collected regularly
by a dedicated nurse and ongoing trainings of bedsores reporting and prevention are
taking place. In this healthcare system management was fully engaged during the
process and at a final intervention meeting with management a decision to launch
more projects was made.
7. Conclusions and discussion
The purpose of this paper was to review the elements of integrated models and
present their application in healthcare systems. Healthcare systems require a
powerful model for achieving their main goal - delivering proper care to their
patients in a cost effective way. To achieve this, the “delivery” process requires
qualified medical staff, proper equipment, good service, efficient administrative
processes, safety etc. We show here how to combine data from general health care
systems at the national level with local data and plan a focused intervention.
The concept of considering the voice of customer, voice of workforce and voice
of process and integrating them into a cohesive managerial approach was shown
relevant also in healthcare In the two case studies presented here completely
different outcomes were achieved. It was shown that if staff is given the time and
encouragement to use their knowledge and expertise they will be committed and will
eventually bring the organization to better performance outcomes. However, as
shown by the first case study, professional tools are not enough. Without
management engagement and ongoing support, the team lose interest and feel their
efforts are not taken into consideration when important decisions are made. As a
result of organizational changes, lack of managerial support and organizational
complexity and maturity - most projects in the first case study resulted in no change
of work process. Team members became disappointed from the lack of progress and
the general poor quality of data.
The paper shows how to include in integrated model a mapping of mathematical
causality relationships between satisfaction levels of healthcare employees, the level
of patient satisfaction and the performance of processes and financial outcome. In
order to validate the model structure, all variables and measurements need to be
properly defined. Choosing the right indicators and using tools such as Bayesian
networks for mapping cause and effect relationships is one such approach.
As mentioned at the beginning in the first section, integrated models were
initially developed and implemented successfully in industrial organizations. Work

RON S. KENETT - YIFAT LAVI 237
in this research highlighted few things worth considering prior to the
implementation of integrated models in healthcare organizations. A comparison of
difference and similarities between industry and healthcare is described in table 8:
Tab. 8: Comparison between industrial organizations and healthcare organization
Industry Healthcare
Management structure
Similar Organization has one manager (usually). Organization has one manager.
Different
Employees from all levels report to the same top management.
Each employee usually has one manager in charge of all employment aspects – conditions, professional, working hours etc.
Professional managers, which define policy and measurements.
Employees are often required to report to three different managers: Professional manager, Administrative manager and the organization manager.
Organizational structure
Similar Departments give service to other departments.
Internal communication is crucial
Departments give service to other departments.
Internal communication is crucial
Different
Clear hierarchy from top management down to junior management levels and employees.
Each department is responsible for a specific expertise.
Organizations’ have complex structure with variety of professional managers and sometimes even several administrative managers.
Hierarchy is not clear.
Each department has several responsibilities and same expertise can be found in more than one department.
Work environment
Similar
Often stressing
Often working in shifts
Different between public sector and private sector.
Often stressing
Working in shifts
Different between public sector and private sector.
Different
Often there are offices for different positions and management levels, production lines with working stations.
Service is available constantly only in specific organization types.
Usually one man is responsible on his task.
Almost no offices available. Clinics with multiple users for patient care, sometimes patient care is done behind a drape alone in a noisy and stressing environment.
Service is available constantly.
Often patient care requires more than one person.
Rules and Standards
Similar
Submitted to rules and standards (each industry according to its expertise).
Require compliance with standards in order to give service/manufacture.
Submitted to strict rules and standards.
Require compliance with standards in order to give patient care.
Different Only certain professions require specific
certification All professional care require specific certifications
Employment conditions
Similar
Employees often feel underestimated and not rewarded enough for their work
Employees are evaluated by their managers and peers periodically.
Employees often feel underestimated and not rewarded enough for their work
Employees are evaluated by their professional managers periodically.
Different
Different levels of salaried and working terms in different organizations types.
Different employment conditions for different management levels.
Different levels of salaries and working terms for different professions in the same organization.
Employees relations with customers
Similar Indirect and direct relationships Indirect and direct relationships
Different Mostly people giving consumer service to other
people. People taking care of people in times of stress
and need.
Working processes Similar
Usually built from sets of repeating actions, performed each product manufacturing/service providing.
Tasks are performed both by man and by machines.
Processes involve more than one employee and even more than one department.
Usually built from sets of repeating actions, performed with each patient/care giving.
Tasks are performed both by man and by machines.
Processes involve more than one employee and even more than one department.
Different
Use of data
Similar
Each process can be measured and analyzed with the right set of data.
Data on processes can be: working time, cost of work, # of defected units, Qty produced etc.
Data is collected either automatically into IT systems or manually on paper/special files. Sometimes data is neglected.
Each process can be measured and analyzed with the right set of data.
Data on processes can be: working time, cost of work, # of adverse events, Qty produced etc.
Data is collected either automatically into IT systems or manually on paper/special files. Sometimes data is neglected.
Different
Analysis of data is considered essential in many industries for learning, improvement and prevention.
Organizations are obligated to share performance results in public and are measured upon them.
Although data is often available – many healthcare organizations lack the knowledge of using it for their benefit.
Many healthcare organizations do not publish performance results.
Financials
Similar Budget is defined every year for organization use.
Cost of poor quality in processes results in high costs of rework, resources etc.
Budget is defined every year for organization use.
Cost of poor quality in processes results in high costs of rework, resources etc.
Different Organization financials are managed mostly by
the CFO, which reports to the CEO. Organization financials are managed by
organization manager, with the support of finance specialists.
Source: Kenett and Lavi, 2013
INTEGRATED MANAGEMENT PRINCIPLES AND THEIR APPLICATION TO HEALTHCARE SYSTEMS 238
References
AALEN O.O., ROYSLAND K., GRAN J.M. (2012), “Causality, mediation and time: a
dynamic viewpoint”, The journal of the royal statistical society, Serious A, vol. 175,
Part 4, pp. 831-861.
APFEL C., KORTTILA K., ABDALLA M., KERGER H., TURAN A., VEDDER I.,
ZERNAK C., DANNER K., JOKELA R., POCOCK S., TRENKLER S., KREDEL
M., BIEDLER A., SESSLER D., ROEWER N. (4002), “A factorial trial of six
interventions for the prevention of postoperative nausea and vomiting”, The New
England Journal of Medicine, vol. 350, n. 24, pp. 2441-2451.
BERWICK D., GODFREY A.B., ROESSNER J. (2002), Curing health care: new strategies
for quality improvement, 2nd edition, Jossey-Bass, USA.
BOX G., HUNTER W., HUNTER S. (2006), Statistics for experimenters: an introduction to
design, data analysis, and model building, Second Edition, J. Wiley, Chichester, UK.
COX D.R. (1992), “Causality: some statistical aspects”, Journal of the Royal Statistical
Society. Series A (Statistics in Society), vol. 155, n. 2, pp. 291-301.
DEMING W.E. (1953), “On the distinction between enumerative and analytic surveys”,
Journal of the American Statistical Association, vol. 48, n. 262, pp. 244-255.
DENNEY W., ST. JOHN C., YOUNGBLOOD L. (2009), “Narrow healthcare quality
chasm”, Quality Progress, vol. 42, n. 5 pp. 38-45
DOES R.L.M.M, VAN DEN HEUVEL J., DE MAST J., NEIMEIJER G.C. (2011),
“Improving quality in health care while reducing costs”, The quality management
forum, vol. 36, n. 3, pp. 12-15
DROR S., BARAD M. (2006), “Enhancing control charts to validate strategy maps”, Quality
Technology and Quantitative Management, vol. 3, n. 4, pp. 529-541.
FALTIN F., KENETT R.S., RUGGERI F. (2012), Statistical Methods in Healthcare, John
Wiley and Sons, Chichester, UK.
GODFREY A.B., KENETT R.S. (2007), “Joseph M. Juran, a perspective on past
contributions and future impact”, Quality Reliability Engineering International, vol.
23, n.6, pp. 653-663.
KAPLAN R., NORTON D. (2004), Strategy maps: converting intangible assets into tangible
outcomes, Harvard Business School Press, Boston, MA.
KENETT R.S. (2004), “The integrated model, customer satisfaction surveys and six sigma”,
Proceedings of the First International Six Sigma Conference, Center for Advanced
Manufacturing Technologies, Wroclaw University of Technology, Wroclaw, Poland.
KENETT R.S. (2007), “Cause and Effect Diagrams”, Encyclopedia of Statistics in Quality
and Reliability, vol. 1, pp. 284-289.
KENETT R.S. (2009), “Managing Integrated Models: A challenge for Top Management and
the Quality Manager”, Galilee Annual Quality conference, Ort Braude College,
Carmiel, Israel.
KENETT R.S. (2012), “Applications of bayesian networks”, European Network for Business
and Industrial Statistics (ENBIS) Twelfth Annual Conference on Business and
Industrial Statistics, Ljubljana, Slovenia, September 9-13th.
KENETT R.S., RAANAN Y. (2010), Operational Risk Management: a practical approach to
intelligent data analysis, John Wiley and Sons, Chichester, UK.
KENETT R.S., SALINI S. (2011), Modern analysis of customer satisfaction surveys: with
applications using R, John Wiley and Sons, Chichester: UK.
KENETT R.S., ZACKS S. (2014), Modern industrial statistics: with application in R,
MINITAB and JMP, 2nd edition, John Wiley and Sons, Chichester: UK.

RON S. KENETT - YIFAT LAVI 239
KENETT R.S., SALINI S. (2009), “New frontiers: bayesian networks give insight into
survey-data analysis”, Quality Progress, vol. 42, n. 8, pp. 31-36.
LAVI Y., KENETT R.S., CORRADETTI R., FRASER G., BALICER R., ERLICH D., NIV,
Y. (2011), “Designing and deploying a healthcare professional service :case study in
integrated healthcare management”, Proceedings of the Eleventh ENBIS Conference,
Coimbra, Portugal.
MACDONALD M., MORS T., PHILLIPS A. (2003), “Management system integration: can it
be done?”, Quality Progress, vol. 36 n. 10, pp. 67-74.
MOORE C. (1993), “Using experimental designs to improve clinical processes, quest for
quality and productivity in health services”, Conference Proceedings. Institute of
Industrial Engineers, pp. 130-135.
MURANTE A.M., PANERO C., NUTI S. (2010), “The extent to which contextual effects
explain the patient satisfaction with GP assistance in four Italian Regions”,
Conference of The Future of Primary Health Care in Europe, Pisa, Italy.
NORTON D. (2004), Building strategy maps, part two: testing the hypothesis, Harvard
Business School Press.
PEARL J. (1995), “Causal diagrams for empirical research”, Biometrika, vol. 82, n. 4, pp.
669-710.
PEARL J. (2000), Causality: Models, Reasoning, and Inference, Cambridge University Press,
Cambridge.
PERELMAN J., SHMUELI A., CLOSON MC. (2008), “Deriving a risk-adjustment formula
for hospital financing: Integrating the impact of socio-economic status on length of
stay”, Social Science & Medicine, vol. 66, n. 1, pp. 88-98.
PETERSON J., KENETT R.S. (2011), “Modeling opportunities for statisticians supporting
quality by design efforts for pharmaceutical development and manufacturing”,
Biopharmaceutical Report, American Statistical Association Publication, USA.
RUCCI A., KIM S., QUINN R. (1998), “The Employee-Customer-Profit Chain at Sears”,
Harvard Business Review, vol. 76, n. 1 pp. 83-97.
SHAVIT O., LESHNO M., GOLDBERGER A., SHMUELI A., HOFFMAN A. (2007), “It’s
time to choose the study design! net benefit analysis of alternative study designs to
acquire information for evaluation of health technologies”, Pharmacoeconomics, vol.
25, n. 11, pp. 903-911.
WATKINS D. (2006), “Reflections on the future of quality”, Quality Progress, vol. 39, n. 1,
pp. 23-28.
WOODS K.J. (2001), “The development of integrated healthcare models in Scotland”,
International journal of integrated care, vol. 1, n. 1 available online from: URL:
http//www.ijic.org/
Internet sites
http://www.camden. nhs.uk
http://www.meslab.sssup.it/en/index.php?page=report-2010
http://magazine.amstat.org/blog/2012/11/01/pearl/.

INTEGRATED MANAGEMENT PRINCIPLES AND THEIR APPLICATION TO HEALTHCARE SYSTEMS 240