Integrated Core Project - Samantha Kautz€¦ · Web viewIntegrated Core Project. Adam Broka. Emily...
182
Page | 1 Integrated Core Project Adam Broka Emily Youngblood Melanie Bauer Samantha Kautz Hannah Gorman Spri ng 2013 \
Transcript of Integrated Core Project - Samantha Kautz€¦ · Web viewIntegrated Core Project. Adam Broka. Emily...

Table of Contents
Page | 1
\
Spring 2013
Integrated Core Project
Adam BrokaEmily Youngblood
Melanie BauerSamantha KautzHannah Gorman
Executive Summary………………………………………………………………………..6
Situational Analysis………………………………………………………………………..7
Company………………………………………………………………………………………...7
Background………………………………………………………………………………..7
Corporate Goals…………………………………………………………………………...8
SWOT Analysis…………………………………………………………………………...8
Strengths…………………………………………………………………………..9
Weaknesses………………………………………………………………………11
Opportunities……………………………………………………………………..13
Threats……………………………………………………………………………14
Organizational Structure…………………………………………………………………16
Capabilities and Processes……………………………………………………………….17
Industry Environment……………………………………………………………………17
Customers………………………………………………………………………………………20
Description of Buyers……………………………………………………………………20
Changes in the Customer Base…………………………………………………………..21
Purchased Products………………………………………………………………………22
Value of Products………………………………………………………………………...23
Order Qualifying and Order Winning Characteristics…………………………………...24
External Environment………………………………………………………………………..25
Industry…………………………………………………………………………………..25
Economic………………………………………………………………………………...26
Technological ……………………………………………………………………………27
Societal…………………………………………………………………………………..28
Legal……………………………………………………………………………………..29
Competitors……………………………………………………………………………….…...29
Description of Competitors……………………………………………………………....29
SWOT Analysis—Newell Rubbermaid, Inc.………………………………………….....31
Strengths…………………………………………………………………....……32
Weaknesses………………………………………………………………………33
Page | 2
Opportunities………………………………………………………………….….33
Threats……………………………………………………………………………34
SWOT Analysis—Avon, Inc.……………………………………………………...…….35
Strengths…………………………………………………………………………35
Weaknesses……………………………………………………………………....36
Opportunities …………………………………………………………………….36
Threats……………………………………………………………………………37
SWOT Analysis—Lifetime Brands, Inc.………………………………………………...37
Strengths…………………………………………………………………………38
Weaknesses………………………………………………………………………39
Opportunities……………………………………………………………………..40
Threats……………………………………………………………………………40
Competitive Advantages………………………………………………………………....41
Financial Ratio Analysis…………………………………………………………………43
Liquidity………………………………………………………………………….43
Long-term Solvency……………………………………………………………...45
Asset Management………………………………………………………………46
Profitability……………………………………………………………………....48
Market Value………………………………………………………………….....50
Collaborators…………………………………………………………………………………..52
Growth Strategy……………………………………………………………………………53
Description of Growth Strategy………………………………………………………….53
Goals and Objectives…………………………………………………………………….54
Segmentation…………………………………………………………………………………..55
Variables…………………………………………………………………………………55
Customer Segments……………………………………………………………………...55
Demographics…………………………………………………………………....55
Age……………………………………………………………………….55
Gender……………………………………………………………………56
Family Life Cycle………………………………………………………..56
Page | 3
Psychographics…………………………………………………………………..56
Motives……………………………………………………………..……56
Lifestyles…………………………………………………………………57
Targeting……………………………………………………………………………………….57
Positioning……………………………………………………………………………………..58
Strategy Execution………………………………………………………………………...59
Product………………………………………………………………………………………….59
Goals……………………………………………………………………………………..59
Description of Product…………………………………………………………………...60
Plastic Containers………………………………………………………………..61
Cloth Bag………………………………………………………………………...62
Pamphlet…………………………………………………………………………63
Description of Processes Used to Make Product………………………………………...63
Outsourced Components…………………………………………………………………66
Life Cycle of Product……………………………………………………………………66
Complementary Services and Warranties……………………………………………….68
Place…………………………………………………………………………………………….68
Goals……………………………………………………………………………………..68
Level of Market Exposure……………………………………………………………….69
Channels Used…………………………………………………………………………...69
Supply Chain System…………………………………………………………………….70
Promotion………………………………………………………………………………………71
Goals……………………………………………………………………………………..71
Promotional Blend……………………………………………………………………….72
Personal Selling………………………………………………………………….72
Sales Promotion …………………………………………………………………73
Advertising……………………………………………………………………….74
Price……………………………………………………………………………………………..76
Goals……………………………………………………………………………………..76
Value Proposition and Customer Sensitivity…………………………………………….76
Page | 4
Pricing Strategy………………………………………………………………………..…77
Breakeven Analysis……………………………………………………………………...78
Capital Budgeting Analysis……………………………………………………………...78
Project Life………………………………………………………………………78
Sales Volume…………………………………………………………………….79
Discount Rate…………………………………………………………………….83
Marginal Tax Rate……………………………………………………………….84
Change in Working Capital……………………………………………………...85
Initial Investment………………………………………………………………...85
Depreciation……………………………………………………………………...86
Salvage Value ……………………………………………………………………86
Variable Cost…………………………………………………………………….87
Fixed Costs……………………………………………………………………....90
Revenues………………………………………………………………………....91
Cannibalization of Volume, Revenue, and Capacity…………………………….92
NPV and IRR Discussion ……………………………………………………….95
Implementation and Control…………………………………………………………...96
Timing and Implementation Activities ………………………………………………….96
Sales Estimates…………………………………………………………………………..97
Scenario Analysis………………………………………………………………………..98
Sensitivity Analysis………………………………………………………………….…101
Comprehensive Financial Analysis ………………………………………………….…104
Conclusion………………………………………………………………………………….106
References…………………………………………………………………………………..107
Appendices A-V………………………………………………………………………..…112
Page | 5
Executive Summary
Tupperware Brands Corporation is one of the most trusted brands in housewares. The
renowned company continues to manufacture and sell high quality, innovative products to
women all across the globe. In fact, Tupperware Brands has an international sales force of 2.8
million in almost 100 different countries and territories, as well as sales revenues of almost $2.6
billion in 2012 (Tupperware Brands 10-K, 2013). They currently offer eight distinctive product
lines, which include Armand Dupree, Avroy Shlain, BeautiControl, Fuller, Nutrimetics,
NatureCare, Nuvo, and their most apparent brand, Tupperware (Tupperware Brands 10-K, 2013).
After reviewing Tupperware Brands’ financial statements from recent years, they have
remained consistent with their profitability. Considering today’s societal and wellbeing
concerns, our team has constructed a growth strategy to take advantage of these current trends
and help increase the value of Tupperware Brands’ shareholders wealth. With an integration of
finance, marketing, and supply chain management, our team has fashioned a profoundly detailed
analysis of our growth strategy and how it will be executed.
Throughout the marketing plan, our arrangement to implement a new product line
extension will be introduced in further detail. We plan to create a new product that is appealing
and beneficial for tweens and their mothers across the United States. In the comprehensive
financial analysis, we will discuss why we believe this project is financially feasible for
Tupperware Brands, and why we think they can achieve such parameters of the new project set
by our capital budge. As a result of our financial perception provided in a later report, and
assuming Tupperware Brands management capabilities do not change in the future, our team
believes the project should be accepted.
Page | 6
Situational Analysis
Company
Background and Competitive Advantages
Tupperware Brands Corporation was originally founded in 1946 by Earl Tupper.
Tupperware was unique because it was the first company to offer products that were lightweight
and less likely to break when compared to the traditional glassware found in kitchens at that time
(Heritage, 2012). Tupperware Brands is known for selling high quality, sustainable, and
innovative products. They currently offer eight unique product lines, which include Avroy
Shlain, Armand Dupree, Fuller, BeautiControl, Nutrimetics, NatureCare, Nuvo, and their most
distinguishable brand, Tupperware (Tupperware Brands 10-K, 2013). Their Tupperware line
features innovative plastic containers that can be used to store, serve, and refrigerate food.
Tupperware Brands uses the product differentiation strategy as their source of
competitive advantage. Tupperware Brands holds a competitive advantage over the other firms
in its industry because they were the first company to manufacture and distribute plastic
containers for food storage; and since then, they have lead the industry with a highly
recognizable brand name. Furthermore, Tupperware Brands pioneered the direct selling strategy,
an unconventional distribution method that has proven to be successful and they continue to
distribute its products in this manner today. The final significant advantage is their superior
research and development capabilities. They have become leaders in their market in innovation,
and their research and development skills reflect this. For these reasons, Tupperware Brands has
differentiated itself from its competitors giving them their unique advantages. Although
Tupperware Brands main business was selling plastic goods at first, they have expanded into
new markets and have acquired seven other product lines which have become a good competitive
Page | 7
fit in the company. The success of these new product lines can be associated with the trusted
brand name of Tupperware known by customers.
Corporate Goals
Tupperware Brands’ mission statement states that “Tupperware is passionate about
changing lives, especially for women by enlightening, educating, and empowering. We not only
strive to obtain our premium position, but we are passionate about changing lives and inspiring
confidence in every one of our nearly 3 million sales force members” (Vision and Strategy,
2012). As for Tupperware’s goals for the future, they state it is essential “to sustain our
reputation as the premier, global direct seller of quality and innovative products.” In addition,
they seek to “inspire confidence in our associates, sales force, consumers, and investors.” Lastly,
Tupperware Brands would like to “continue to literally change lives, especially women's, by
enabling them to reach their full potential” (Vision and Strategy, 2012). These goals are
governed by their core values of empowerment, integrity, responsibility, innovation,
collaboration, and celebration. How Tupperware Brands conducts business and formulates
strategies are centered on the goals mentioned above.
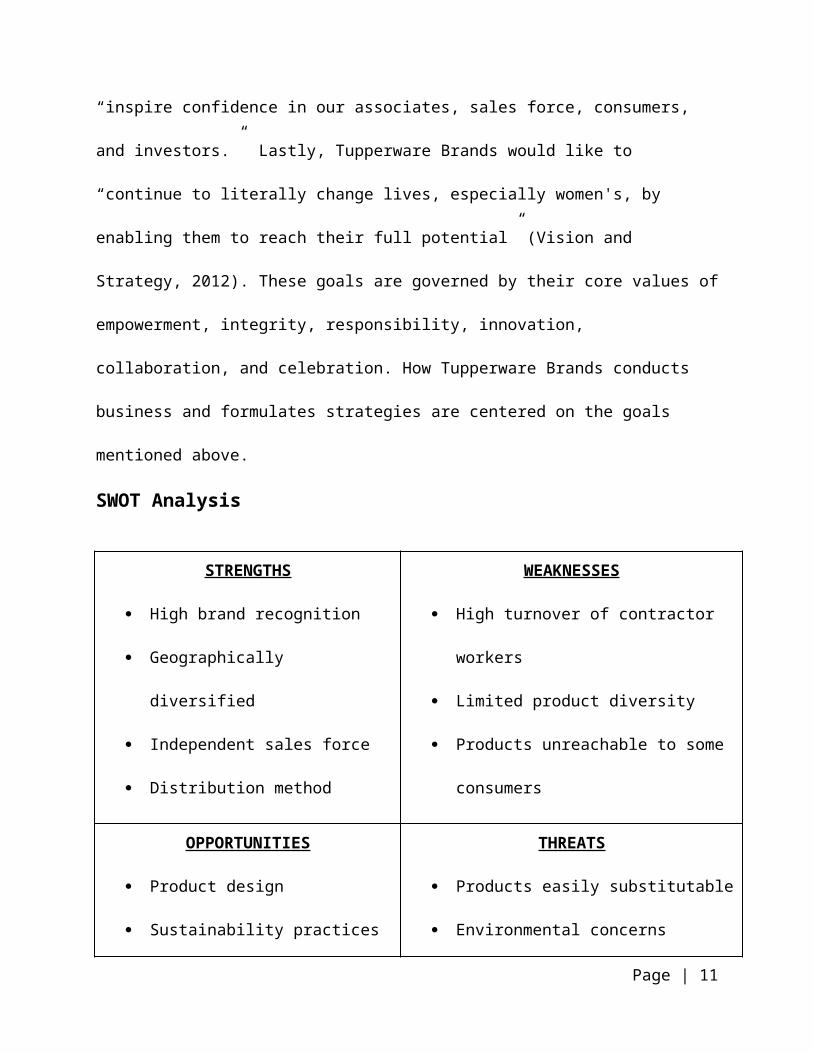
SWOT Analysis
STRENGTHS
High brand recognition
Geographically diversified
Independent sales force
Distribution method
WEAKNESSES
High turnover of contractor workers
Limited product diversity
Products unreachable to some consumers
Page | 8
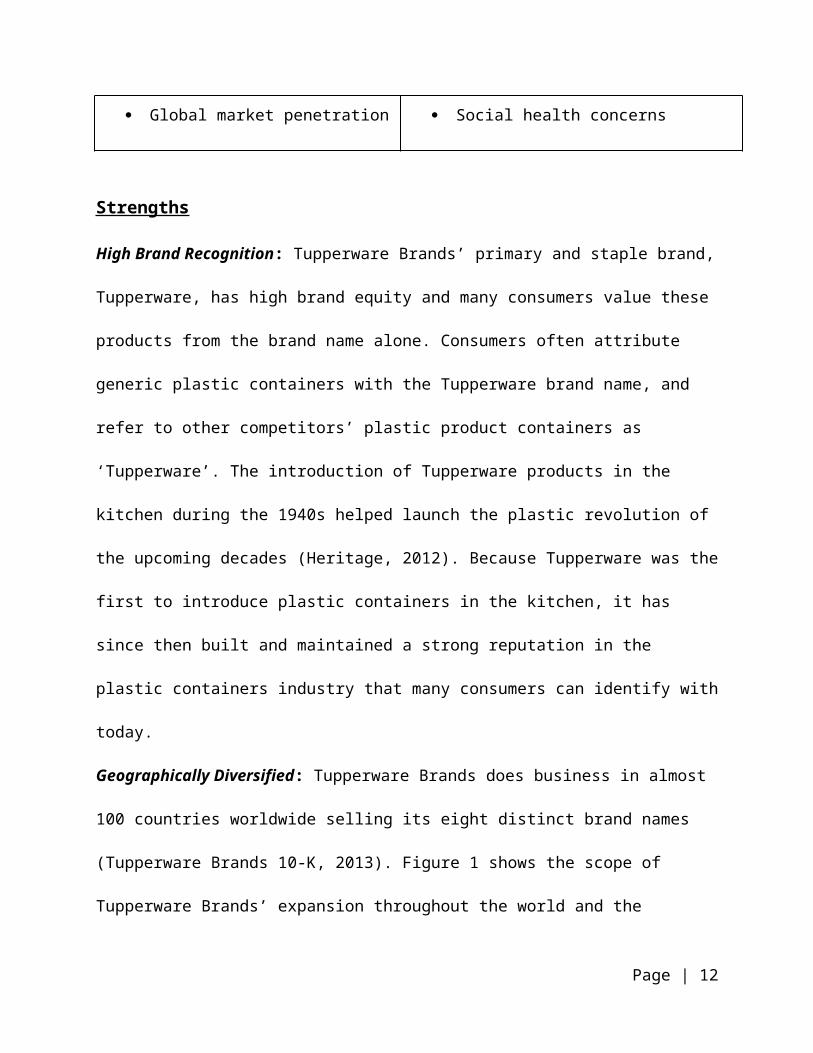
OPPORTUNITIES
Product design
Sustainability practices
Global market penetration
THREATS
Products easily substitutable
Environmental concerns
Social health concerns
Strengths
High Brand Recognition: Tupperware Brands’ primary and staple brand, Tupperware, has high
brand equity and many consumers value these products from the brand name alone. Consumers
often attribute generic plastic containers with the Tupperware brand name, and refer to other
competitors’ plastic product containers as ‘Tupperware’. The introduction of Tupperware
products in the kitchen during the 1940s helped launch the plastic revolution of the upcoming
decades (Heritage, 2012). Because Tupperware was the first to introduce plastic containers in the
kitchen, it has since then built and maintained a strong reputation in the plastic containers
industry that many consumers can identify with today.
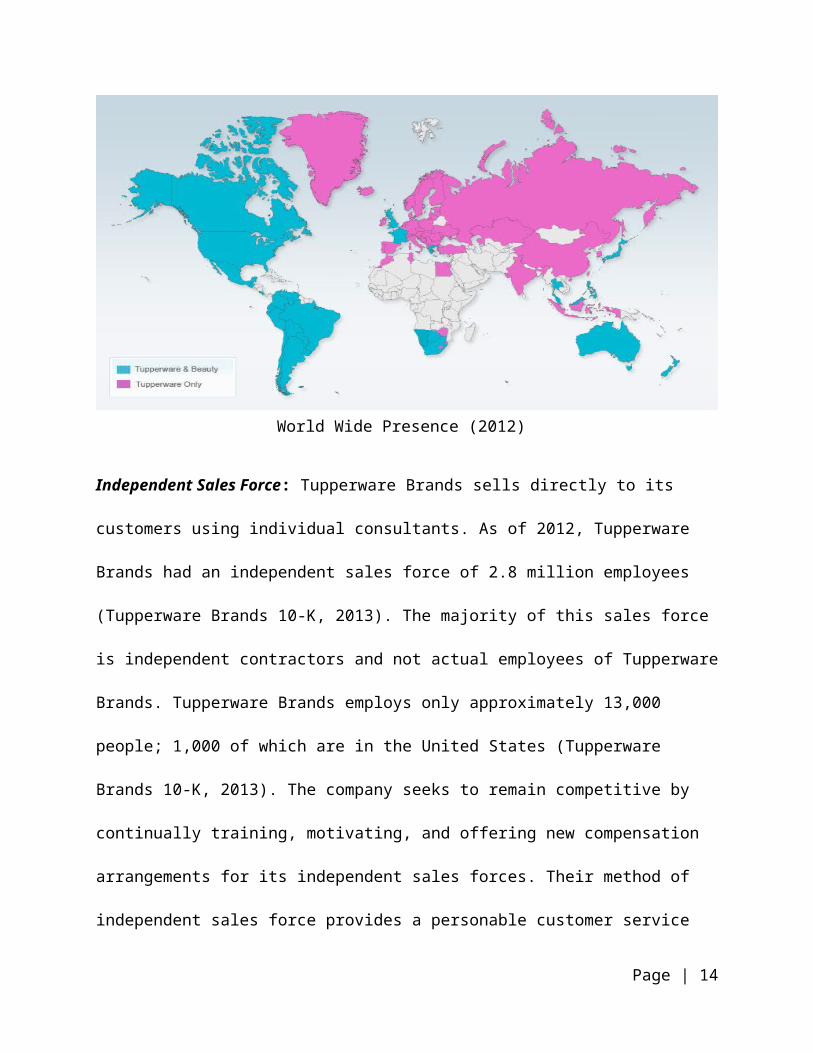
Geographically Diversified: Tupperware Brands does business in almost 100 countries
worldwide selling its eight distinct brand names (Tupperware Brands 10-K, 2013). Figure 1
shows the scope of Tupperware Brands’ expansion throughout the world and the illustration
distinguishes between its two broad product groups. They are a multinational company that sells
its products directly to the customer, and their global diversification reduces the chance of
business and operational risk, leading to a greater return on investment. In 2001, the United
States and Canada took up 29 percent of Tupperware Brands’ sales and Europe, Africa, and
Middle East at 36 percent. More recently, United States and Canada only hold 12 percent, Latin
America and Asia Pacific each at 28 percent, and Europe, Africa, and Middle East in the lead at
Page | 9
33 percent as of 2011 (Tupperware Brands 10-K, 2013). Tupperware Brands has successfully
penetrated the global markets shown and is continuing to seek more widespread expansion,
deeper penetration in existing markets, and greater penetration in areas that have low penetration.
Figure 1
Independent Sales Force: Tupperware Brands sells directly to its customers using individual
consultants. As of 2012, Tupperware Brands had an independent sales force of 2.8 million
employees (Tupperware Brands 10-K, 2013). The majority of this sales force is independent
contractors and not actual employees of Tupperware Brands. Tupperware Brands employs only
approximately 13,000 people; 1,000 of which are in the United States (Tupperware Brands 10-K,
2013). The company seeks to remain competitive by continually training, motivating, and
offering new compensation arrangements for its independent sales forces. Their method of
independent sales force provides a personable customer service and enhances direct relationships
with the consumers. Primarily, Tupperware products did not sell well in retail stores because
Page | 10
World Wide Presence (2012)
customers needed demonstrations to fully understand how they operated. This led to the first
Tupperware home party which took place in 1948. The purpose of these parties was to introduce
Tupperware products to the consumers in a social setting. Fortunately, the parties were so
successful that it became the focused method of selling (Heritage, 2012).
Distribution Method: Tupperware Brands uses the direct-to-consumer method worldwide as it
continues to be successful for the company. The renowned company sells its products through
the “party” method of sales, which allows them to bypass retail intermediaries. Tupperware
parties take place in homes, offices, social clubs, and other locations. According to Tupperware
Brands’ most recent 10-K (2013),
The system facilitates the distribution of products to the consumers in a timely manner,
without needing to work with intermediaries, and establishes routine standards regarding
the use of the firm’s trademarks and administrative arrangements. This includes order
entry, delivery and payment, as well as with the recruiting and training of dealers.
This method has differentiated Tupperware Brands from its competitors and is a major strength
because it has given them a competitive edge in its industry.
Weaknesses
High Turnover of Contractor Workers: As stated previously, Tupperware Brands uses a direct
sales distribution force of contractors to sell their products. Because many individuals of the
sales force seek to supplement their normal income with Tupperware parties, many of them are
not dedicated to the method entirely and leave the sales force, and some experiment with it only
once or twice. As a result, Tupperware Brands relies strongly on retaining and motivating their
sales force because of this high turnover rate of independent employees (Tupperware Brands 10-
K, 2013). In fact they state that “a key element of the Company's strategy is expanding its
Page | 11
business by increasing the size of its sales force” (Tupperware Brands, 10-K). This is evidence
that their growth as a company is reliant on retaining and expanding their sales force, and their
success could be compromised if they do not effectively maintain a large and competent sales
force.
Limited Product Diversity: Tupperware changed their name from Tupperware Corporation to
Tupperware Brands Corporation in 2005 after several acquisitions expanded their brand portfolio
to eight distinct brand names (Tupperware Brands, 2012). Not only are they selling durable
containers now in many different markets, but they also have a wide variety of beauty products.
Although they hold eight distinct brands, the company only has two broad groups of products,
plastics and beauty. Tupperware Brands may still be exposed to more risk than other companies
that hold more product diversification. If a significant drop in business results in one of their two
broad groups of products, Tupperware Brands could be left struggling to preserve long-term
survival and would be exposed to even more risk. Tupperware Brands should consider adding
another broad group of products that fits in their existing strategies.
Products Unreachable to Some Consumers: Direct selling benefits Tupperware Brands because
it can build customer relationships and loyalty, and also specify orders to that particular
customer. However, since Tupperware Brands does not sell through retailers, they lose a large
potential customer base. Instead of consumers directly ordering their products from Tupperware
Brands, it can be sometimes easier for customers to conveniently pick up a competitor's brand off
of the grocery store shelf. Although their method of direct selling is one of their competitive
advantages and has not caused them any significant problems in the past, a shift in consumer’s
attitudes and buying behaviors in the future could render their method obsolete, and they would
Page | 12
lag behind getting their products to retail locations because companies such as Clorox (Glad) and
Newell Rubbermaid are already selling their products in retail stores.
Opportunities
Global Expansion: Tupperware is not only a household name in the United States, but also in
almost 100 countries all over the world. “Tupperware Brands' products are sold in almost 100
countries around the world under eight brands…” (Tupperware Brands 10-K, 2013). Tupperware
Brands has discovered that most of their customers and markets are found outside of the United
States. Stated in their most recent 10-K (2013), “the Company derived 90 percent of its net sales
from operations outside the United States in 2011.” They have been successful in their global
expansion to nearly100 countries so far, and there are more opportunities in the global markets to
be successful in the future. They also have the opportunity to reposition their product in the
United States to build a stronger customer base and increase their sales in the United States as
well as the global nation. There was a sales increase of six percent from 2010 to 2011 already in
the United States and Tupperware Brands can continue to increase that percentage using
different market and repositioning strategies (Tupperware Brands 10-K, 2013).
Product Design: Tupperware Brands innovative company culture allows them to express their
innovative visions in the product development process. They can take advantage of new trends in
societies across the globe and find new solutions in the kitchen and home by designing products
that specifically fit these new needs. Tupperware Brands has continued to innovate, and this is
apparent as their 10-K (2013); it states, “…Tupperware has evolved towards truly lifestyle-
oriented products and has leveraged its research and development expertise to bring new
concepts to market, such as the Individual Microwave Rice Maker, the Microwave Omelet
Maker, a Universal Knife Sharpener…” Tupperware Brands can continue to pursue new
Page | 13
opportunities by designing new and improved products. For example, Tupperware Brands has an
obvious opportunity to design and extend their present eco-friendly line. Tupperware has already
broken into the environmental aspect of the market by creating eco-friendly mugs, water bottles,
and lunch containers, but as more consumers become concerned with environmental issues, the
company can seek to fulfill new environmental needs with innovative and quality products. Also,
because the company has already entered the global market, they have a great opportunity to
extend their innovative lines globally.
Sustainability Practices: Introduced in the preceding section, Tupperware Brands has an
opportunity to begin implementing practices that are environmentally safe and sustainable.
President and Chief Operating Advisor of Tupperware Brands’ Corporation stated that, “We
continue to look for opportunities to improve the environmental performance of our products and
manufacturing processes, without compromising on safety and quality. Tupperware Brands is
focused on eco-friendly product solutions that help reduce energy consumption and eliminate
waste in landfills” (Executive Message on Sustainability, 2012).
Now that “Going Green” is a new trend in the United States and places all over the world, it
presents an opportunity for Tupperware Brands to not only design sustainable products, but also
sustainable operations. By creating products that ensure the preservation and safety of the
environment, they can not only create products that are better for the environment but, as stated
earlier, they will be able to attract new customers.
Threats
Products Easily Substitutable: Although Tupperware Brands is the leading brand of packing and
container products, its products can easily be substituted by others. Several companies have
developed products similar to Tupperware that may possess qualities such as cost differentiation.
Page | 14
Tupperware Brands offers their plastic products at a premium price to reflect their dedication to
high quality and durability; however this high price can deter some consumers from buying.
With today’s depressed economy, buyers are more conscious of spending, and may be persuaded
to buy a product that is less expensive regardless of quality comparison. In addition to the
economic factors, Tupperware Brands has the disadvantage of not forming relationships with
retail buyers. Customers may find it easier to go to a local store to purchase their food containers
rather than making an order to be shipped to them on a later day.
Environmental Concerns: “In 2010, the United States generated almost 14 million tons of
plastics as containers and packaging, almost 11 million tons as durable goods, such as
appliances, and almost 7 million tons as nondurable goods, for example plates and cups. Only 8
percent of the total plastic waste generated in 2010 was recovered for recycling” (Plastics, 2012).
These statistics highlight an external threat Tupperware Brands may encounter in the future. As
environmental awareness becomes more prevalent across the globe, consumers may begin
avoiding products made entirely of plastic because of the known environmental effects it causes.
Plastic has been known to take a long time to degrade in landfills, and without a strong recycling
program in many countries, Tupperware Brands business could suffer unless they take the
actions to minimize this threat.
Social Health Concerns: Apart from the environmental damage plastic is known to cause, there
has also been concerned in the public about plastics adverse effects on health. It is commonly
known that many individuals are still concerned with certain chemicals in plastic products
leaking into their foods when stored or microwaved in. However, “As of March 2010, items sold
by Tupperware US & CA are BPA free” (About BPA & Materials, 2012). This means that
Tupperware products are safe to consumers, but it does not necessarily remove the stigma still
Page | 15
surrounding plastic products. Tupperware Brands is still exposed to the attitudes of society and
this negative attitude surrounding plastic products could affect Tupperware Brands sales if they
fail to remind consumers of their products safety.
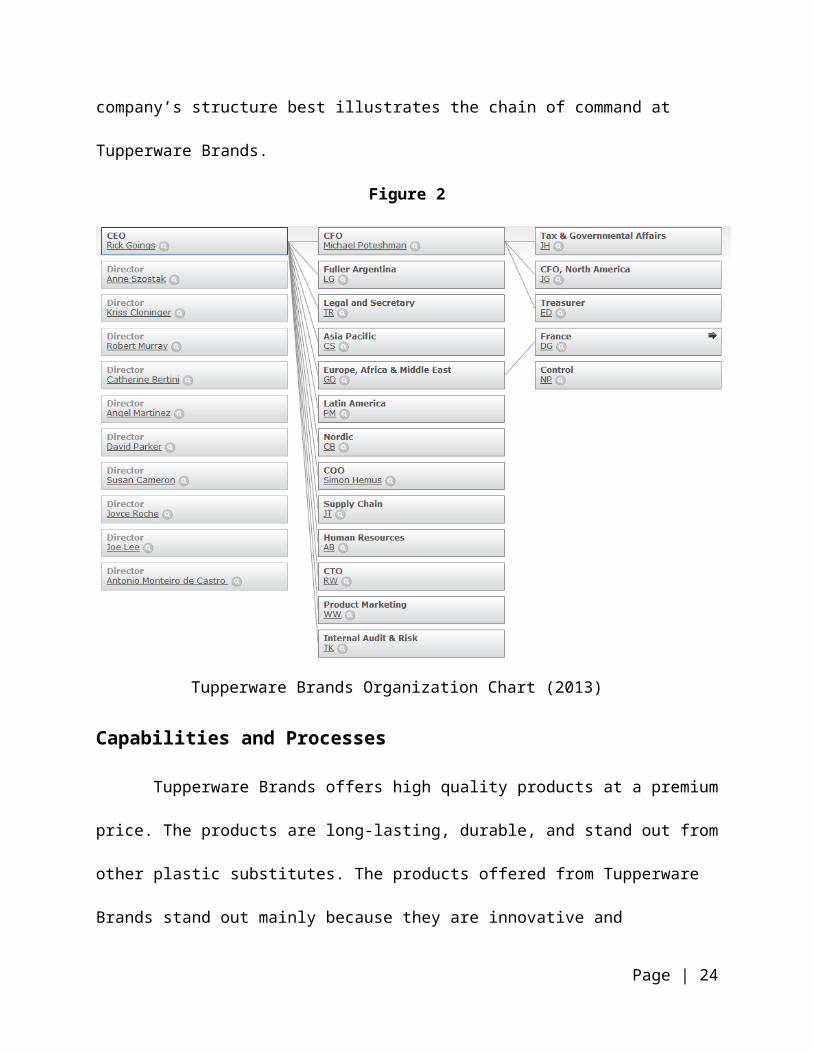
Organizational Structure
The Tupperware Brands management team and board of directors are committed to
having appropriate structures and processes in place to insure that our shareholders' best interests
are served and to meet the current requirements of law (Corporate Governance, 2012). Figure 2,
an organization chart of the company’s structure best illustrates the chain of command at
Tupperware Brands.
Figure 2
Page | 16
Tupperware Brands Organization Chart (2013)
Capabilities and Processes
Tupperware Brands offers high quality products at a premium price. The products are
long-lasting, durable, and stand out from other plastic substitutes. The products offered from
Tupperware Brands stand out mainly because they are innovative and decorative. They not only
offer storage containers, but also have product lines consisting of cooking utensils, cooking
spices, and housekeeping items. Tupperware also has a beauty line that offers skin care products,
cosmetics, fragrances, jewelry, and more (Tupperware Brands 10-K, 2013).
One of the most notable capabilities that really set Tupperware Brands’ apart from its
competitors is its superior research and development (R&D). “Tupperware spent $18.9 million in
2012, $19.5 million in 2011, and $17.8 million in 2010 on Research and Development”
(Tupperware Brands 10-K, 2013). Tupperware Brands has leverages their superior R&D
capabilities to bring new concepts to markets (Tupperware Brands 10-K, 2013). This has allowed
them to offer the most innovative products through their engineering and manufacturing
processes. Tupperware Brands believes their expertise in engineering and manufacturing “brings
customers the next generation of serving, fridge storage, and microwave products” (Tupperware
Brands 10-K, 2013).
Industry Environment
Tupperware Brands Corporation operates distinctly in the consumer goods sector, with it
specifically occupying the packaging and containers industry (Industry: Packaging & Containers,
2013). However, Tupperware Brands also competes with companies in the direct selling
industry. Because Tupperware Brands spans these two specific industries, competitors from both
industries will be considered and compared to the company in order to fully understand the
competitive environment. Avon, Inc. offers the closest competition for Tupperware Brands in the
Page | 17
direct selling industry because they sell similar beauty products that rival Tupperware Brands’
beauty line, distribute their products in a “direct selling” fashion, and also concentrate on the
same target markets. Newell Rubbermaid, Inc. is Tupperware Brands’ closest competitor in the
packaging and containers industries because they offer similar products that serve as substitutes
to Tupperware Brands’ popular kitchen food storage solutions. Lastly, Lifetime Brands, Inc.
constitutes as a competitor of Tupperware Brands because they offer household and kitchen
cutlery, cookware, and food storage items; items that are parallel to Tupperware Brands’ product
lines. The beginning section of this analysis contains a brief description of how each competitor
of Tupperware Brands got started, the products they offer and markets they operate in, and a
description of their competitive environments.
Avon was founded by David H. McConnell in the 19th century after he noticed an
opportunity to provide women of the time a chance to become their own business by allowing
them to directly sell products to other consumers. He noticed very little women working outside
the home and his idea gave women a chance to gain financial independence for themselves by
becoming personal representatives for Avon (Avon Founder, 2012). Today, their success has led
them to become the world’s largest direct seller and a leading global beauty company, operating
in over 100 countries, where its 6 million independent representatives sell high quality beauty,
fashion, and home products to women (Avon Markets, 2012). Avon, also known as “the
company for women”, targets and markets their efforts toward women consumers where they
generate over $11 billion in annual revenue, selling such well-recognized brands as Avon Color,
Anew, Skin-So-Soft, and Avon naturals. (Investor Relations, 2012)
Newell Rubbermaid was founded in 1903 after Edgar A. Newell purchased the company
and renamed it the Newell Manufacturing Company. Throughout the years leading up to an
Page | 18
acquisition that would eventually change the company name to Newell Rubbermaid, Inc., Newell
Manufacturing Company strategically acquired a variety of firms that introduced them to
diversified markets such as the cookware and office supply market segments. In 1999, the
company finally made its most significant acquisition and acquired Rubbermaid, doubling the
size of the company, and thus adding another high quality product line which included
innovative plastic home solutions, commercial, and infant products (Our History, 2013).
Because of the numerous acquisitions made in Newell Rubbermaid’s history, the firm is
now involved in many product segments which include tools, commercial products, writing,
baby and parenting, home solutions, and specialty items. The firm experiences solid competition
throughout its numerous segmented markets, and is required to constantly innovate by designing
new products that deliver superior performance (Our Company, 2013). Today, a highly
competitive environment has led Newell Rubbermaid to implement a new “Growth Game Plan”,
where the company is redesigning their corporate strategy and focusing on global opportunities
for growth in emerging markets, while also maintaining their share of their current markets (Our
Growth Game Plan, 2013).
Lifetime Brands, Inc. was founded under the name Lifetime Cutlery Corporation in 1945,
which it later changed to Lifetime Brands in 2005. Up until its initial public offering (IPO) in
1991, Lifetime Brands acquired a few firms which expanded their existing lines of kitchenware
and cookware. After its IPO, the brand acquired several other companies and secured a
successful KitchenAid license agreement with Whirlpool Corporation to manufacture and market
a high-end line of kitchen utensils. More recently, Lifetime Brands has opened a new west coast
distribution center, and has made several moves into the international markets of Asia and
Central and South America (Company Timeline, 2012). According to the company’s 2011
Page | 19
Annual Report, “the markets for kitchenware, tabletop and other products used in the home
including home décor products are highly competitive and include numerous domestic and
foreign competitors…” (Annual & Quarterly Reports, 2011). Lifetime Brands remains
competitive by stressing the importance of innovation throughout the firm and designing
products to meet the ever-changing needs of customers (Annual & Quarterly Reports, 2011).
Lifetime Brands’ popular product lines include kitchenware, cookware, and glassware under the
familiar brand names of KitchenAid, Farberware, and Pfaltzgraff (Brands, 2013).
Avon and Lifetime Brands are close competitors to Tupperware Brands and both offer
unique challenges to its strategic outcomes. However, Newell Rubbermaid offers the closest
comparison to Tupperware Brands because it is the biggest threat to Tupperware Brands’ most
popular product line; Tupperware food storage solutions. Because Newell Rubbermaid offers the
closest substitute to Tupperware Brands’ products, an analysis of the two companies will follow
in the financial ratio analysis discussion below in order to gauge the relative financial strength of
Tupperware Brands in relation to its competitor. This will be achieved by using the two firms’
most recent financial statements.
Customers
Description of Buyers
Tupperware Brands targets mostly one demographic, which is middle aged women, either
married or married with children. This demographic would typically fall in the Generation X
cohort, with some customers occupying the baby boomer generation. Since Tupperware is sold
by women either through home parties or catalog orders, the main customer is therefore women.
With Tupperware Brands offering an opportunity for women to make a business for themselves,
they target their own friends, family, and other women when selling and marketing their product.
Page | 20
With Tupperware being sold mostly at home parties, it offers a different buying
environment rather than just in stores. Being surrounded by friends, cocktails, and good
conversations, this leads to less buyer’s remorse, and the likelihood that more goods will be
purchased. Women who attend Tupperware parties are looking for an entertaining buying
situation that will engage their senses. They seek more involvement in the purchasing decision
and are better informed than if they were to buy from traditional retail locations.
Different lifestyles is the main psychographic that Tupperware Brands targets. The
women they target for both customers and as sales representatives are women that are
independent or women that are homemakers. The sales representatives are women that are
looking to supplement their incomes to help support their family or host parties for their friends
and family to receive party benefits. This unique selling method gives independent women an
opportunity to start their own business with little capital invested on their part.
Changes in the Customer Base
Tupperware Brands Corporation continues to evolve with the adjustments in consumer
wants and needs. The world is changing constantly and Tupperware Brands’ innovation and
creativity allows its products to adapt with the differences in buyer behavior and attitudes.
Tupperware Brands “use[s] a modern approach to form and function to create convenient
solutions to household tasks (Heritage, 2012). In fact, Tupperware Brands currently reaches over
100 markets worldwide and offers products specifically manufactured for different cultures, such
as the Kimchi Keeper, the Kimono Keeper, and the Japanese Bento Box (Heritage, 2012).
Recently, there have been slight changes in society that are persuading buyer behavior.
For instance, the environment has been a major factor in consumer purchases. Products that are
sustainable and eco-friendly have become an essential attribute, and can make or break a buyer
Page | 21
purchase. Since Tupperware Brands are using plastics in most of their merchandise, they have
created an eco-line to attract consumers that support “going green.” Another shift in society has
been the trend toward a healthier lifestyle. More than one-third of adults (35.7%) in the United
States are considered obese. Centers for Disease Control and Prevention proclaimed that
medical costs related to obesity were estimated at $147 billion as of 2008 (Overweight and
Obesity). Due to the issue with obesity, people have looked into healthier options dealing with
foods and portion control.
Purchased Products
Tupperware Brands’ core business is centered around “design-centric preparation, storage
and serving solutions for the kitchen and home” (Tupperware Brands 10-K, 2013). This core
business is centered on Tupperware Brands’ most well-known brand, Tupperware. This means
consumers who purchase from Tupperware Brands can expect innovative kitchen and home
solutions that are based on individuals’ lifestyle needs. Because the products are lifestyle
oriented, they are designed to enhance many of the situations consumers find themselves in
around the home and kitchen. Consumers are buying more than a plastic container when they
purchase from Tupperware, they are buying a product whose physical characteristics and
attributes are suited to fit their unique lifestyle needs.
Tupperware Brands carries a variety of product lines that include the traditional plastic
storage and serving solutions, but also an established line of kitchen cookware, microwavable
products, textiles, and gifts (Tupperware Brands 10-K, 2013). Some of the traditional storage
solutions include popular collections like Modular Mates and FridgeSmart, where the purpose of
the two collections is to provide consumers with simple containers in which they can
proportionally store dry or cold foods. Tupperware Brands also has a Chef Series collection
Page | 22
where it offers high-end cutlery sets, individual knives, and stainless pots and pans. They also
carry a kitchen complement category where consumers can purchase items to supplement their
experiences in the kitchen. Items in this category include recipe books, microfiber cleaning
cloths, sponges, and a can opener. Tupperware Brands also provides consumers with gift options
such as decorated drink and serving containers, and a boy’s or girl’s lunch set. The company is
also meeting people’s need for a cleaner environment, by offering new products such as Square
Eco by Tupperware. Tupperware Brands’ diversely designed kitchen and home product lines
fulfill consumers’ different needs around the home and kitchen.
Apart from Tupperware Brands core business of storage and serving solutions around the
kitchen and home, the company also “manufactures and distributes skin care products,
cosmetics, bath and body care, toiletries, fragrances, and nutritional products” (Tupperware
Brands10-K, 2013). Tupperware Brands’ markets and distributes these products under the brand
names Armand Dupree, Avroy Shlain, BeautiControl, Fuller Cosmetics, NaturCare, Nutrimetics,
and Nuvo. In each of the brands, consumers find a unique kind of cosmetics, skin care,
fragrances, and bath and body care products. Many of these brands originated in specific
international markets, but are now sold globally by Tupperware Brands’ after their acquisition of
the brands. Consumers purchase naturally enriched cosmetics from the NaturCase, Nutrimetics,
and Nuvo brands, and find a variety of perfumes and colognes, lip applications, and body washes
throughout most of their beauty line selections (Tupperware Brands 10-K, 2013)
Value of Products
Customers are buying our products mainly because they offer unique storage solutions to
the endless types of situations in the kitchen and home. Our products offer the customers a way
to keep food fresh and ready to consume when they are. Additionally, our products can be taken
Page | 23
on-the-go to places like school or work and keep food fresh and protected along the way. The
reason customers choose to buy our products over our competitor’s products is because they
value that we are a sustainable and societal company, not only looking out for the well-being of
our environment, but the health of our customers. Our customer’s value the durability,
reusability, and the warranties that come along with our product lines. Tupperware products are
made to last and if any product is believed to be defective a free replacement will be issued
(Warranty and Returns, 2012). Customers are always returning to Tupperware Brands because
they value the company’s constant efforts to innovate and offer new solutions to old problems. In
fact, Tupperware Brands was named in the World’s Most Admired Companies in 2013 by
Fortune, and received the top ranking for innovation in its industry (Fortune: World’s Most
Admired Companies, 2013).
Order Qualifying and Order Winning Characteristics
All companies must create order qualifying products to survive in the market. Their order
winning products, on the other hand, are what sets them apart and pulls them ahead of their
competition. Tupperware clearly has the order qualifying products they need to compete in the
market and they have for many years. The order qualifying attributes include durability,
reliability, range of products, and portability. Included on all their products is also a lifetime
warranty where they will replace the product if anything should happen to it due to normal wear.
Their competitors, such as Newell Rubbermaid, also have this attribute to their products. These
qualities allow Tupperware to be in competition with other close competitors.
However, it is Tupperware Brand’s order winning attributes to these products that sets
them apart and the reason why customers will choose them over others. Their products are all
designed to fit the needs of their customers. Tupperware Brands offers “truly lifestyle-oriented
Page | 24
products and has leveraged its research and development expertise to bring new concepts to
market” (Tupperware Brands 10-K, 2013). Another order winning characteristic is they
distribute their products through direct selling. This enables them to build a strong customer-
business relationship and customer loyalty. “This direct selling method offers consumers a
personal and convenient way to purchase products that they may not had access to otherwise”
(Direct Selling, 2012). They are also now, like many other companies, pushing to become a more
sustainable manufacturer, which will be a great order winning quality to their products if they are
able to achieve this before their competitors.
External Environment
Industry
Tupperware Brands is listed in Yahoo! Finance in the packing and containers industry
(Industry: Packaging & Containers, 2013). The packaging and containers industry consists of
firms engaged in the manufacturing of containers, as well as companies providing services in
packaging. In addition to the packaging and containers industry, Tupperware Brands other
diverse brands of beauty and cosmetic products also compete with similar companies that sell
these types of products. Tupperware Brands unique distribution method also puts them in
competition with companies such as Avon and Pampered Chef that distribute and sell in this
method. Lastly, because many of Tupperware Brands’ products are used around the kitchen and
home, companies in the housewares industry also rival Tupperware Brands with the products
they offer. It is clear that Tupperware Brands is affected by several different industries, and each
industry provides different challenges to their business strategy. For a more detailed discussion
on Tupperware Brands industry competitors, see the competitors sections in this report.
Page | 25
Economic
Tupperware Brands’ external environment includes economic factors that are out of the
control of the firm but still have an effect on the company’s strategy. Several economic factors in
the domestic market, as well as international markets, shape how Tupperware Brands
intelligently plans for the future. A primary economic factor that could negatively affect
Tupperware Brands’ success in the future is the rising cost of their raw materials; specifically,
the price of oil. Oil is the main raw material used to refine plastic resin pellets, the materials
Tupperware Brands uses in its operations to mold its various plastic containers. As finite global
energy sources deplete and populations of developing countries become more developed and use
more energy, the price of oil will continue to rise. Tupperware Brands most recent 10-K (2013)
states …“resins are purchased through various arrangements with a number of large chemical
companies located throughout the Company's markets. As a result, the Company has not
experienced difficulties in obtaining adequate supplies and generally has been successful in
obtaining favorable resin prices on a relative basis.” Although there has not been a negative
short-term effect on Tupperware Brands, our team suspects without new technologies in the
future, rising energy and raw materials cost will cause major problems for the firm’s ability to
maintain long-term growth.
Along with other multinational companies, Tupperware Brands is faced with the
economic risk of floating exchange rates in the international economy. Their 10-K (2013) states,
“the Company derived 90 percent of its net sales from operations outside the United States in
2012. Because of this, movement in exchange rates may have a significant impact on the
Company’s earnings, cash flows and financial position.” Exchange rates are uncontrollable by
Tupperware Brands, and although strategies can be taken to diminish the effects, a strengthening
Page | 26
U.S. dollar will most certainly negatively impact Tupperware Brands as they have more business
outside of the U.S. Their 10-K (2013) highlights this by stating, “Although this currency risk is
partially mitigated by the natural hedge arising from the Company’s local product sourcing in
many markets, a strengthening U.S. dollar generally has a negative impact on the Company.” As
the U.S. economy continues to strengthen, and the U.S dollar becomes more valuable relative to
other currencies, Tupperware Brands will need to consider these risks and plan accordingly.
The last economic factor in the external environment that is affecting Tupperware Brands
strategy is the most recent U.S. and global recession. The U.S. Great Recession of 2007-2009,
and the global recession that ensued, had a major effect on people’s attitudes and buying habits.
As a result, people’s real income and purchasing power dropped, and more and more people
focused on necessity items rather than additional wants. The depressed U.S. and global economy
has showed some progress in recent years, but its scope still has lingering effects on the people.
Although purchasing power has risen slightly, and more people are returning to work, people are
still unsure of the future and are reluctant to spend money. Our team has recognized that our
products, especially the plastic products, could be negatively impacted. Because of the reusable
nature of our products, and our warranty that guarantees replacement from defects caused by
normal use, individuals will be less willing to purchase new specialty plastic items from
Tupperware Brands and be more willing to reuse the items they already own. Tupperware
Brands may need to start offering lower priced options during the recession recovery to entice
more individuals to buy their products.
Technological
Technology is an aspect of business many companies struggle with. There is a constant
change in the types of systems a company uses to run their business. Software updates, faster
Page | 27
processors, and new programs are all things that a company needs to keep constant watch on
because if their competitors implement a system that is more cost efficient and effective than the
programs Tupperware Brands may be using then that creates a competitive advantage for their
competitors.
Things such as market/product research, new designs, increased production, sales
monitoring, etc., are all things that technology has greatly improved over a short amount of time.
Online surveys have quickly become the most popular and efficient way of conducting market
research and this was because of technology. Getting information about a market is now easier
than ever. As mentioned before, in order to gain a competitive advantage, Tupperware Brands
must keep up with the changes in operational and administrative technologies as it will help their
business remain ahead of the competition. The evolution of the internet will also serve as another
technological factor Tupperware Brands will need to follow with.
Societal
A current societal trend within the United States is childhood obesity. Childhood obesity
has more than doubled in children ages 6-11 from 1980 to 2010, from 7% to 18%, respectively.
Meaning that in 2010, more than one third of children were overweight or obese. Overweight is
commonly defined as having excess body weight, while obesity is defined as having excess body
fat (Childhood Obesity Facts, 2013). Children that are obese are more likely to have high blood
pressure, high cholesterol, and pre-diabetes. In a sample of 5 to 17 year olds, 70% had one of the
risk factors previously named. The long term effects of childhood include most likely being
obese as an adult and increased risk for heart problems, strokes, type 2 diabetes and numerous
types of cancer (Childhood Obesity Facts, 2013). Overweight and obesity within childhood can
Page | 28
be prevented by eating healthy and physical activity (Childhood Obesity Facts, 2013). As these
trends continue, consumers will be seeking products that will supplement a healthy lifestyle.
Legal
As environmental concern grows, there could be an increasing number of EPA laws
originating in the United States—Tupperware Brands domestic market. Tupperware Brands
primary products, plastic containers, may be subject to these laws as plastic is known to have
adverse effects on the environment and ecosystems of the world. As of present, Tupperware
Brands claims it has no issues with environmental laws. Tupperware Brands states in their 10-K
(2013) “Compliance with federal, state, and local environmental protection laws has not had in
the past, and is not expected to have in the future, a material effect upon the Registrant’s capital
expenditures, liquidity, earnings or competitive position.” However, government regulation on
the environmental practices of businesses in the United States could become more prevalent as
time passes, and this legal factor could have an effect on Tupperware Brands operations.
Although they do not foresee this having a negative impact on their operations, it should be
noted that this is a possible, future outcome that should still be monitored by Tupperware
Brands.
Competitors
Description of Competitors
Newell Rubbermaid, Inc.
The renowned company has managed to flourish and remain successful for over 100
years. In 1903, Newell Rubbermaid started operation in Ogdensburg, New York and primarily
produced and sold curtain rods. As years progressed, they have widened their range of products.
Their mix of products now includes pens, cookware, drill bits, strollers, hairbrushes, etc. The
Page | 29
organization strives on “helping people flourish every day, where they live, learn, work, and
play” (Our Company, 2013). Similar to Tupperware Brands, Rubbermaid is affiliated with more
than one industry. They are widely known for their home solutions which include home and
food storage solutions, premium cookware, window treatments and hair styling tools. They
focus on the need for women and their families to get their households in order, and make their
lives much easier. Because Newell Rubbermaid targets the same market as Tupperware Brands
with their home solutions, it makes them one of their top competitors.
Avon, Inc.
As the “world’s largest direct seller and a leading beauty company, Avon has nearly $11
billion in annual revenue” (Avon 10-K, 2013). With their wide range of products targeting
women in all aspects of their life, Avon has dominated the market putting their label not only on
beauty but also home products as well. Avon was founded in 1886 by David H. McConnell, who
himself was a door to door salesman until he recruited women as sales representatives to start
selling his products (Avon Founder, 2012). The business then grew to a global company
empowering women while creating jobs around the world. Just like Tupperware Brands
Corporation, Avon sells not only beauty products but also re-useable containers. They use the
direct selling technique which helps maintain close relationships with customers. Avon is
considered one of Tupperware Brands’ main competitors because they target women as their
main target market, while selling similar products at reasonable prices.
Lifetime Brands, Inc.
Lifetime Brands, formerly known as Lifetime Cutlery Corporations, is a kitchenware and
tabletop product manufacturer founded in Italy in 1945. The name of the company changed to
Lifetime Brands in 2005 after they began to build a stronger foundation and secure licenses to
Page | 30
brand names such as Kitchenware, Cuisinart, Farberware and many more. They continued to
increase the number of brand names associated with Lifetime Brands all the way up to their most
recent brand acquired, F&F (About Lifetime Brands, 2013).
Today, Lifetime brands’ is associated with 31 brands and counting. Consumers can find
Lifetime Brands in stores worldwide. The company sells their products to wholesalers, national
chains, retailers (private and public) and they make many of their products available to
customers online. Lifetime Brands also has a strong belief in increasing the sustainability of the
company’s manufacturing facilities and products (About Lifetime Brands, 2013). They are a
company that believes in providing the best and most innovative products for their customers.
Their ultimate goal as a company is to increase their shareholders wealth as stated in their
mission statement on the corporate website, “We are committed to deliver five-star experiences
to the earth’s consumers through innovative products, services & solutions for the home. In
return, they will reward us with increased market share and profitability allowing our associates,
stakeholders and shareholders to prosper” (Company Timeline, 2012).
SWOT Analysis
Newell Rubbermaid, Inc.
STRENGTHS
Strong brand equity
Wide range of products
WEAKNESSES
Products sensitive to consumer
demand
Expensive production costs
OPPORTUNITIES THREATS
Page | 31
Global expansion
Providing better online service
Products easily substitutable
Raw material costs
Strengths
Strong Brand Equity: Newell Rubbermaid has been in the market for over 100 years, and has
made a difference to families all across the globe. The familiarity of the company’s quality and
consumer values put them in a leading position within the market. The brand equity is the value
of a brand to a company—the higher the brand equity, the more successful and recognizable the
brand. In a survey conducted of the financial community (over 1,000 analysts), Newell
Rubbermaid received the highest linked rating compared to seven other major U.S. rubber and
plastic corporations. In fact, the most highly rated benchmark for Newell Rubbermaid was brand
equity (Rubbermaid, 2013).
Wide Range of Products: Newell Rubbermaid produces and distributes a wide range of products
around the world. Newell Rubbermaid categories span from home storage and garage
organization, food containers and laundry supplies, bath and cleaning products, closet
configuration, and refuse removal (Careers—Rubbermaid). Newell Rubbermaid can offer
almost every household necessity for women and their families. They are not limited to few
products, and diversification of products enhances their chances of maintaining their competitive
advantage.
Weaknesses
Page | 32
Products Sensitive to Consumer Demand: Newell Rubbermaid’s offers a range of products
whose sales are sensitive to consumer demand; for example, their line of tools could see a drop
in demand in recessionary times. In recent years, the economy in the United States has suffered
which altered consumers’ purchasing power, so it is assumable that Newell Rubbermaid’s vast
array of products was negatively affected.
Expensive Production Costs: Referring to their 10-K statement, Newell Rubbermaid has a cost
of products sold figure of 60 percent of their total revenues (Newell Rubbermaid 10-K, 2013).
This indicates Newell Rubbermaid may have difficulties controlling costs or their diverse
product lines cause them to operate at thinner margins than their industry competitors.
Opportunities
Global Expansion: Newell Rubbermaid has a strong brand that continues to grow in global
markets with “insight-driven innovation” (Newell Rubbermaid 10-K, 2013). In fact, Newell
Rubbermaid’s Home & Family segment consists of five global business units. The business
units consist of Rubbermaid Consumer, Baby & Parenting Essentials, Decor, Culinary Lifestyles,
and Beauty & Style. By continuing their global expansion, it could open up opportunities to for
increased sales in new markets.
Providing Better Online Service: Newell Rubbermaid recently paired up with The Clutter Diet
to provide unlimited access to direct, personal help from a team of Certified Professional
Organizers (R) via internet and weekly action plans for members (Clutter Diet, 2011). Shortly
after, White Lion adapted the functionality from the established Clutter Diet membership service
with the Newell Rubbermaid brand to provide assistance directly with Rubbermaid’s customers.
Overall, the Clutter Diet and online tools are helpful to get rid of clutter and reduce stress. With
Page | 33
an organized website, customers can find their way through more easily. Providing a better
online service can open more opportunities with increasing profit (Clutter Diet, 2011).
Threats
Products Easily Substitutable: Although Newell Rubbermaid is a leading brand; its products
can be easily substituted. Newell Rubbermaid is in an industry where there are several other
companies, such as Clorox, Inc., are offering similar products. Since most of Newell
Rubbermaid’s merchandise is sold in retail stores, there are other options that may or may not
look more reasonable to the customer. In today’s economy, people are more economical, and
aren’t will to pay top dollar for household items. Due to cheaper, more generic options being
offered, this will become a threat to Newell Rubbermaid products.
Raw Material Costs: As the cost of oil rises, Newell Rubbermaid’s production and distribution
are impacted. Rubbermaid uses the resin imported from China for its products. The cost of
transportation has a positive correlation with the cost of oil, therefore, the higher prices of oil
drive up the cost of transporting materials. This defeats the attempt of lowering costs using the
method to outsource manufacturing. Asia provides over 75% of Newell Rubbermaid’s goods,
but brings in less than 4% of revenue. This situation leaves Newell Rubbermaid no other option
but to transport goods over long distances from manufacturing centers to markets (Newell
Rubbermaid 10-K, 2013).
Page | 34
SWOT Analysis
Avon, Inc.
STRENGTHS
Target market
Customer relationships
WEAKNESSES
Sensitive to size of workforce
Information technology systems
OPPORTUNITIES
Global selling
Broaden target market
THREATS
Strong competition
Strengths
Target Market: Tupperware Brands considers Avon a close competitor due to their products
they sell. A specific strength of Avon is their specific market they target. Avon is targeted more
towards women, selling beauty, fragrance, and household items. According to Avon’s 10-K
(2013), “Our research and development department’s efforts are significant to developing new
products, including formulation effective beauty treatments relevant to women’s needs, and
redesigning or reformulating existing products.” They focus on the women’s needs while still
trying to keep their ideas fresh and ever changing as the market demand changes.
Customer Relationships: Another strength that Avon has is their strong customer relationships.
Just like Tupperware distribution method, their direct selling method supports relationships with
customers and connects with them on a personal level. Their channels that they use are online
Page | 35
ordering and catalog sales. Therefore, relationships are fostered through Avon’s personal sales
representatives.
Weaknesses
Sensitive to Size of Workforce: Although their independent sales representatives give Avon a
competitive advantage, their business is sensitive to the size and competency of their workforce
(Avon Products 10-K, 2013). If their independent sales people decide to leave their positions for
our direct selling companies, this could have an adverse effect on Avon’s ability to distribute and
expose goods to their customers.
Information Technology Systems: According to Avon’s 10-K (2013), they state that their
“Information Technology Systems are susceptible to disruptions.” Their systems are used to
“employ information technology systems to support our business, including systems to support
financial reporting, an enterprise resource planning system which we are implementing on a
worldwide basis, and an internal communication and data transfer network. We also employ
information technology systems to support Representatives in many of our markets, including
electronic order collection and invoicing systems and on-line training” (Avon Products 10-K,
2013). This means if their susceptible systems experience a disruption, it would have negative
impact on Avon’s daily operations. Avon may face problems if methods are not used to improve
the integrity of their information systems infrastructure.
Opportunities
Global Selling: Even though they already sell their products in 64 different countries and
territories (Avon Products 10-K, 2013), they can continue to expand into new regions. To
increase their revenues they can offer their products to growing countries. There is always an
Page | 36
opportunity for a company to keep growing, and if Avon can modify their products to meet the
needs of different cultures, they can expand in new regions.
Broaden Target Market: Another opportunity for Avon is broadening their target market. Their
main target is currently women, but the company can look to offer a wider variety of products to
attract a male population. This would increase their sales and allow them to leverage their direct
selling strategy to develop relationships with male consumers.
Threats
Strong Competition: Since Avon does sell a wide range of different products, they have intense
competition (Avon Products 10-K, 2013). They are not only competing against beauty
companies who sell their merchandise in retail locations, but they are also competing with other
companies that use the direct selling strategy such as Pampered Chef and Tupperware Brands.
SWOT Analysis
Lifetime Brands, Inc.
STRENGTHS
Innovation
Wholesale and Retail
Wholesaler Collaboration
WEAKNESSES
Materially Adverse
Limited Online Selection
OPPORTUNITIES
Environmentally Friendly
Retail Direct Selling Expansion
THREATS
Intense Competition
E-Commerce
Page | 37
Strengths
Innovation: Lifetime Brands is constantly coming up with new and innovative products. They
pride themselves on their innovation. “At the heart of the Company is a culture of innovation.
The Company brought over 3,600 new or redesigned products to market in 2012 and expects to
bring to market over 4,000 new or redesigned products in 2013” (Lifetime Brands 10-K, 2013).
Because Lifetime Brands is so innovative, they are able to stay ahead of their competition. They
are also able to break through to new markets and create new consumer needs through their
design team. “The Company’s in-house design and development teams currently consist of 101
professional designers, artists and engineers. Utilizing the latest available design tools,
technology and materials, these teams create new products, redesign products and create
packaging and merchandising concepts” (Lifetime Brands 10-K, 2013).
Wholesale and Retail: Lifetime Brands sells their products in both retail and wholesale settings.
They also are able to sell a limited selection of their products online to customers. This gives
them the advantage of being available to customers on the convenience and specialty shopping
levels. “The Company operates in two business segments: the Wholesale segment, which is the
Company’s primary business that designs, markets and distributes its products to retailers and
distributors, and the Retail Direct segment in which the Company markets and sells a limited
selection of its products through its Pfaltzgraff®, Mikasa®, Lifetime Sterling® and Housewares
Deals® Internet websites” (Lifetime Brands 10-K, 2013).
Wholesaler Collaboration: According to Lifetime Brands 10K (2013), “The Company generally
collaborates with its largest wholesale customers and in many instances produces specific
versions of the Company’s product lines with exclusive designs and/or packaging for their
stores.” Lifetime Brands not only sells their products through wholesalers but will also alter their
Page | 38
packaging to better fit the specific wholesaler. This builds long-term business to business
relationships with Lifetime Brands and its wholesalers giving them an edge over other
competition (Lifetime Brands 10-K, 2013).
Weaknesses
Materially Adverse: Lifetime Brands is unable to produce products by quick demand change of
the customer. They lack the materials and facilities to do so, resulting in financial difficulties and
a possible breakage of common retailer relations. The Lifetime Brands’ 10K (2013) states that,
“Decisions by large customers to increase their purchases directly from overseas vendors could
have a materially adverse effect on the Company. Significant changes or financial difficulties,
including consolidations of ownership, restructurings, bankruptcies, liquidations or other events
that affect retailers, could result in fewer stores selling the Company’s products, the Company
having to rely on a smaller group of customers, an increase in the risk of extending credit to
these customers or limitations on the Company’s ability to collect amounts due from these
customers” (Lifetime Brands 10-K, 2013). Lifetime Brands has many wholesaler relationships
but their relationships with their suppliers are lacking, resulting in difficulty in collecting
materials to produce more of their product for the quick order change.
Limited Online Selection: Lifetime Brands sells their products through retailers, wholesalers,
and also online. However, they lack a selection for their online products. “The Company also
markets and sells a limited selection of its products directly to consumers through its
Pfaltzgraff®, Mikasa®, Housewares Deals® and Lifetime Sterling® Internet websites.” This limits
the market exposure of its products in a channel that can reach a large amount of people
(Lifetime Brands 10-K, 2013).
Page | 39
Opportunities
Environmental Friendly: All manufacturers are subject to some sort of environmental, health
and safety laws. As stated in Lifetime Brands 10K (2013), “The Company’s operations also are
subject to national, state and local environmental and health and safety laws and regulations,
including those that impose workplace standards and regulate the discharge of pollutants into the
environment and establish standards for the handling, generation, emission, release, discharge,
treatment, storage and disposal of materials and substances including solid and hazardous
wastes” (Lifetime Brands 10-K, 2013). Lifetime Brands is presented a great opportunity to open
up to a new market by going above and beyond the standards of these laws. Eco-friendly
products are presently becoming more popular in several markets. As of right now, Lifetime
Brands is meeting the minimum for environment requirements. This creates a great opportunity
to reach a new market by developing products that are more environmentally friendly. For
example, they could create BPA free products or products that are recyclable and biodegradable.
Retail Direct Selling Expansion: Most companies sell their products online in some way.
Technology is advancing so quickly that shopping online is now very common among
consumers. Lifetime Brands currently only sells a limited amount of its products on its online as
stated before. Although this constituted as a weakness, there is also an opportunity to expand the
selection of products and brands sold through the Internet directly to customers. This could
greatly increase sales and also make for easier global expansion without setting up new, costly
distribution infrastructure.
Threats
Intense Competition: Lifetime Brands is in the industry of household appliances and
kitchenware items. This is a very competitive market for household items. Lifetime Brands must
Page | 40
compete with other manufacturers for supplies and resources. Lifetime Brands lacks an
advantage over other competing companies because of their size. There are many companies that
are much more established and have great foundations and relationships with their suppliers
making it difficult for Lifetime Brands to compete. Lifetime Brands 10K (2013) states, “The
markets for kitchenware, tabletop and other products used in the home including home décor
products are highly competitive and include numerous domestic and foreign competitors, some
of which are larger than the Company.”
E-Commerce: E-Commerce can create a huge competitive advantage for many companies,
“However, the Company’s computer network could be compromised which could impact
operations and confidential information such as customer credit card information could be
misappropriated. This could lead to adverse publicity, loss of sales and profits or cause the
Company to incur significant costs to reimburse third-parties for damages which could adversely
impact profits” (Lifetime Brands 10-K, 2013). Technology is something that can significantly
help a company or hurt them. Lifetime Brands are constantly concerned about their customers
and their sales online; therefore they have yet to rely on the Internet for their sales which results
in many potential sales being lost.
Competitive Advantages
Newell Rubbermaid, Inc.
As a result of their “design-driven” attitude, Newell Rubbermaid has a competitive
advantage because of their highly innovative and differentiated products. Newell Rubbermaid
seeks to design their products around their customers and their diverse line of products allows
them to do this. These diverse products line has allowed Newell Rubbermaid to become experts
in their markets and gain recognition through the success of their brand names. The company
Page | 41
leverages its expertise and experience to bring new concepts to the market and continues to stay
ahead of the competition by offering products designed to make customers lives easier and
attracting new customers across the world (Newell Rubbermaid 10-K, 2013).
Avon, Inc.
Avon consistently has a competitive advantage over other strong competitors because of
its various products and unique distribution method. Currently, Avon’s products include a
diverse line of color cosmetics, skincare, fragrance, personal care, hair care, jewelry, and
household items. Avon has products and brands that target women as well as children and teens.
Because of their extensive product line Avon dominates their market. Avon is currently the
world’s largest direct seller, which makes known their powerful brand and their worldwide
contributions (Avon Products 10-K, 2013).
Lifetime Brands
Lifetime Brands maintains a competitive advantage over its competitors by its ways of
selling. Their products are made more accessible to customers because they can be found in retail
stores, online and through wholesalers worldwide. Also, the company believes that they hold a
competitive advantage through their patents and innovative products. “The Company believes it
possesses certain competitive advantages based on its brands, its emphasis on innovation and
new product development and its sourcing capabilities. The Company owns or licenses a number
of the leading brands in its industry including Farberware®, KitchenAid®, Mikasa®, Pfaltzgraff®,
Cuisinart®, Elements®, Melannco®, Fred® and V&A®. Historically, the Company’s sales growth
has come from expanding product offerings within its product categories, by developing existing
brands, acquiring new brands and establishing new product categories” (Lifetime Brands 10-K,
Page | 42
2013). Lifetime Brands has so many brand extensions that are recognizable to the public and are
household names in homes across the globe.
Financial Ratio Analysis
Tupperware Brands Corporation’s SEC 10-K financial statements for 2011 through 2009
(Tupperware Brands Corporation, 2013) are located in Appendix A, and key financial ratios for
the firm are located in Appendix B. Newell Rubbermaid, Inc.’s SEC 10-K financial statements
for 2011 through 2009 (Newell Rubbermaid Inc., 2013) are located in Appendix C, and key
financial ratios for the firm are located in Appendix D. Thus, each of the firms’ financial ratios
included in the analysis below will be referenced from their respected Appendices.
Liquidity
Liquidity consists of two different financial ratios. These ratios are the current ratio and
quick ratio. Together, they measure how liquid a firm’s assets are, which indicates how quickly
assets can be converted to cash in order to cover their debt. The higher the liquidity measure for
a firm, the better it will be able to meet its short-term obligations. The first measure, the current
ratio, is calculated by dividing current assets by current liabilities. This expresses how much of
the firm’s current assets will be readily available to convert to cash if needed to cover short-term
debt. Located in Appendix B, Tupperware Brands has a current ratio of 1.1392 as of 2011; this
means that they have enough liquid assets to cover their short-term debt. Consistently,
throughout Tupperware Brands current ratio history, they have been able to maintain a ratio
higher than one, and this is evident when they had a current ratio of 1.6970 in 2010, and 1.5131
in 2009 (Appendix B). Newell Rubbermaid is one of Tupperware Brands’ leading competitors.
Newell Rubbermaid was able to maintain a consistent current ratio of 1.2933 in 2011, 1.2798 in
2010, and 1.2402 in 2009 (Appendix D). Tupperware Brands had a lower current ratio than
Page | 43
Newell Rubbermaid in 2011, but had higher ratios in 2010 and 2009. This means they had more
assets available to them to cover short-term debt in those previous years. Overall, both firms
have maintained a healthy current ratio over the past three years, staying just slightly over one in
every year. However, it appears Tupperware Brands has maintained a better average of current
ratio measures over a three year period which may indicate the firm is more financially sound in
this particular category.
The other ratio that measures liquidity of the firm is the quick ratio. The quick ratio
measures the firm’s ability to meet its short-term debt obligations with the most liquid assets
available to them. This measure uses the firm’s currents assets—but excludes the inventory
portion of assets. It is calculated by subtracting inventory from current assets, and dividing that
figure by current liabilities. This often makes for a more accurate measure of current assets
available to turn into cash. Tupperware Brands had a current quick ratio of 0.6913 as of 2011,
which is very poor, and a drastic drop compared to their 2010 quick ratio of 1.1393 (Appendix
B). Newell Rubbermaid's quick ratio for the year of 2011 was 0.8719—while in 2010 it was
0.8586 and 0.8490 in 2009 (Appendix D). A quick ratio of one or higher is something that should
be desired by companies because it indicates that they have enough assets at this current moment
in time to cover their debt. Both corporations will want to increase their quick ratios more
rapidly than they have been in order to become more financially stable. Overall, Tupperware
Brands has performed better in the current ratio and quick ratio category than Newell
Rubbermaid in previous years, but has performed more poorly in the most recent year of 2011.
This downward trend for Tupperware Brands in its most recent year should be evaluated by
management and corrected in order to maintain levels seen in 2010 and 2009. Although it may
Page | 44
just be a temporary dip, it should be noted and monitored so Tupperware Brands does not fall to
even lower levels while its competitor is improving their performances.
Long-term Solvency
Solvency is the measure of the firm’s ability to pay off long-term debt and interest. The
ability to pay off long-term debt and interest is important for long-term survival. The most
popular equations to evaluate solvency are the total debt ratio and the debt to equity ratio. The
total debt ratio is calculated by the total assets of the firm minus the total equity, divided by the
total assets. The comparison of total assets to total debt in this equation gives an idea of the
amount of leverage used by a company. A lower total debt ratio means the firm relies less on
leverage and vice versa. From the most recent financial statements obtained, Tupperware Brands
has a total debt ratio of 0.7284 as of 2011. This is the highest total debt ratio Tupperware Brands
has seen in the past years, with 2009 being 0.6448 and 2010 being 0.6082 (Appendix B). In other
words, Tupperware Brands has been more reliant on debt leverage in 2011 than in previous
years. Tupperware Brands currently has the highest total debt ratio when compared to their
largest competitor, Newell Rubbermaid. As of 2011, Newell Rubbermaid currently has a total
debt ratio of 0.6993, which has decreased over the past two years from 0.7226 in 2009 to 0.7025
in 2010 (Appendix D).
The debt to equity ratio, another equation used to evaluate solvency, is calculated by the
total debt divided by the total equity. This ratio is a comparison of the firm’s debt to their equity,
which gives an idea of the proportion of debt to equity being used to finance the firm’s assets.
For 2011, Tupperware Brands’ debt to equity ratio was 2.6825, which has fluctuated over the
years from 1.8153 in 2009 to 1.5523 in 2010 (Appendix B). Comparing the ratios from 2010 to
2011 shows that Tupperware substantially increased their debt financing and therefore may have
Page | 45
an advantage over their competitor, Newell Rubbermaid. Newell Rubbermaid’s debt to equity
ratio in 2011 was 2.3255, which remained quite stable from their 2010 ratio of 2.3615 and was
only a small decrease from their 2009 ratio of 2.6045 (Appendix D). The stability in these ratios
show that Newell Rubbermaid has been quite consistent with the amount of debt financing that
they have used over the years.
The total debt ratio and debt to equity ratio for 2011 of Tupperware Brands was higher
than their closest competitor, Newell Rubbermaid. This means that Tupperware Brands has
chosen to use more debt financing than equity financing. Regarding whether this reliance on
debt, opposed to equity, is a strength or weakness for the firm all depends on the outcome of the
financing. Using more debt leads to greater risk, but the more risk a company takes on, the more
opportunities for reward. Additionally, earnings in the firm can be accelerated rapidly upward
when leverage is used in times of positive growth, but earnings can also decline dramatically if
the leverage used returns negative growth. Again, the outcomes of the situations will determine
whether a higher, or lower, total debt ratio or debt to equity ratio is desired.
Asset Management
Asset management is the maintenance and monitoring of a firm’s tangible assets. The
measurement of how successful a company is at generating sales efficiently and effectively
through the management of their assets can be determined by asset management ratios. In short,
asset management determines the ability of a firm to turn tangible assets into sales revenue. The
two most commonly used ratios include inventory turnover and days sales in inventory.
Inventory turnover is a measurement of how many times inventory is sold or replaced
during a period of time. A high inventory turnover ratio could indicate high sales and profitable
inventory, but could also be an indication of under-stocking. On the other hand, a firm must be
Page | 46
aware of a low inventory turnover ratio because this may be an indication of obsolete,
overstocked, or deficient inventory. The inventory turnover ratio is measured by cost of goods
sold divided by inventory. The preceding information can be found in Appendix B of the firm’s
financial statements. Tupperware Brands’ inventory turnover ratio for 2011, 2010, and 2009 are
2.8125, 2.7453, and 2.7062, respectively. These numbers indicate that the turnover of
Tupperware Brands’ inventory has been quite consistent over the years but infrequent.
Tupperware Brands’ main competition Newell Rubbermaid has had inventory turnover ratios for
2011, 2010, and 2009 of 5.2285, 5.1146, and 5.1266, respectively (Appendix D). In comparison
of each other, Newell Rubbermaid has a much better, higher inventory turnover ratio which
could be due to any of the reasons previously named that are associated with high numbers. It
can be noted that Tupperware Brands turns their inventory over nearly twice as less as Newell
Rubbermaid during the year which could indicate a major weakness at Tupperware Brands and a
measure that should be evaluated.
Days sales in inventory is an extension of the inventory turnover ratio, which divides 365
by the inventory turnover number to help viewers of financial statements better understand the
turnover of tangible assets. Days sales in inventory converts the number calculated by the
inventory turnover ratio into the number of actual days that inventory turns over. A low number,
such as 20, indicates that every twenty days the inventory is sold and replaced. A higher number,
such as 340, indicates that every three-hundred and forty days the inventory is sold and replaced.
The goal of a firm is to have assets in inventory for a short amount of time to avoid obsolete
assets; therefore a lower days sales in inventory ratio is crucial. Tupperware Brands’ days sales
in inventory ratio for 2011, 2010, and 2009 are 128.0163, 132.9545, and 164.8757, respectively
(Appendix B). Since the days sales in inventory ratios are so high this indicates that the
Page | 47
inventory turnover ratios were low because the two equations are related inversely. Newell
Rubbermaid’s days sales in inventory turnover ratio for 2011, 2010, and 2009 are 69.8097,
71.3643, and 71.1973, respectively (Appendix D).
After comparing Tupperware Brands’ asset management ratios to Newell Rubbermaid’s,
it is easy to see that it takes Tupperware Brands almost twice as long to turnover their inventory.
As previously stated, this could indicate overstocking, deficient or obsolete products. The
manager in charge of inventory should re-evaluate sales, demand, and also the quality of the
products and supplier to help increase the amount of times inventory turns over. This should be
an area where management at Tupperware Brands looks to improve to remain competitive in its
industry and against its competitors.
Profitability
The capability of a firm to accomplish their objectives in the most effective and efficient
manner determines profitability. Profitability is the amount of money the firm is able to keep
after covering their expenses, costs, debt obligations. The three methods to measure profitability
include profit margin, return on assets (ROA), and return on equity (ROE). Profit margin shows
what percentage of sales makes it to the firm’s “bottom line” (net income line). It is calculated by
taking net income and dividing it by total sales. In 2011, Tupperware Brands had an 8.44%
profit margin, a decrease of 1.37% from the previous year of 2010 as shown in Appendix B. On
the other hand, Tupperware Brands’ closest competitor, Newell Rubbermaid, had a dramatically
lower profit margin rate of 2.13% in year 2011, as referenced in Appendix D. In fact, Newell
Rubbermaid’s profitability has decreased consistently since 2009 when it had a higher margin of
5.12% (Appendix D). These outcomes conclude that Tupperware Brands is more effective at
Page | 48
capturing a higher percentage of profit from total sales, providing them a competitive advantage
over Newell Rubbermaid.
The second measurement of profitability is return on assets (ROA). ROA measures how
effective the firm is in generating income from their productive assets. It is calculated by
dividing net income by total assets. Since 2009, Tupperware Brands’ ROA has gradually
increased. ROA for Tupperware Brands was 11.84% in 2011, 11.19% in 2010, and the ROA in
2009 was at 9.75% (Appendix B). This demonstrates Tupperware Brands’ ability to utilize their
assets in making the most profit. Tupperware Brands’ strongest competitor, Newell
Rubbermaid, has had a fluctuating ROA since 2009. After a slight increase in 2010 from 2009
(.4.44% to 4.57%), Newell Rubbermaid’s ROA dropped significantly to 2.03% in 2011. Based
on these figures, Tupperware Brands had a better return on assets amongst its closest competitor
and is able to generate more profit off their investments in assets. This is both an operating and
financial strength for Tupperware Brands, as it indicates their assets in operations are being used
efficiently and effectively, and as a result, they are able to achieve a better financial return on
those assets.
The third method to measure profitability is return on equity (ROE). ROE is calculated
by dividing the net income of a firm by total shareholder’s equity. This, specifically, measures
the organization’s profit achieved from investments made by the firm’s stockholders. In 2009,
Tupperware Brands’ return on equity was 0.2746 and has increased each year since (Appendix
B). As of 2011, the ROE for Tupperware Brands was 0.4359, which is close to double from
2009 (Appendix B). In contrast, Newell Rubbermaid has had the opposite correlation of ROE as
the years increase. In 2009, its ROE was 0.1602 and lowered to 0.0676 in 2011, as shown in
Appendix D. This concludes that Tupperware Brands is consistent with their ROE, and Newell
Page | 49
Rubbermaid is struggling to provide shareholders with consistent returns on their investments. It
appears Tupperware Brands is a leader in this category and the company is effectively managing
their investments and making wise decisions that produce solid returns for their shareholders.
In each of the profitability measurement categories, Tupperware Brands has had a higher
measure than Newell Rubbermaid. It can be concluded then that Tupperware Brands is superior
at controlling costs that allow them to keep more profits from their operations, and they are
excelling at setting up efficient and effective operations that provide greater returns on their
assets and investments over their competitors. Tupperware Brands should uphold this financial
strength over its competitors by continuing to make investment and operational decisions that
will produce the strong returns they have seen in the past few years. This also could be evidence
that Tupperware Brands is effective at managing new growth strategy investments, which could
have an effect on the overall decision of whether to go ahead with our proposed project
introduced later.
Market Value
Market value of a firm is the highest estimated price that a buyer or consumer is willing
to pay based on the firm’s current standing in the market. Two different ratios are calculated to
determine the firm’s market value—the first being the price to earnings ratio (P/E). This is
calculated by dividing the price per share by earnings per share. Although the P/E ratio varies
from industry to industry, a firm with a relatively high P/E ratio is generally expected to have a
higher earnings potential in the future. The P/E ratio is especially useful when it is used to
compare against other firms in an industry. As Appendix B states, Tupperware Brands’ price to
earnings ratios has varied over the past three years. In 2009, the ratio was at 16.8357, and then
declined in 2010 to 13.3917. In 2011, the last year in its most recent financial statements, their
Page | 50
P/E ratio was slightly higher at 15.4187. Tupperware Brands’ top competitor, Newell
Rubbermaid, had a P/E ratio of 14.7157 in 2009. In following years it rose to 17.4808 in 2010,
and then rose steeply to 37.5581 in 2011 (Appendix D). Tupperware Brands sustained a similar
P/E ratio to Newell Rubbermaid’s throughout years 2009 and 2010, but has lagged behind in
2011. This means investors in that particular industry are seeing Newell Rubbermaid as a more
desirable company to invest in, and consider them more valuable. If they are going to remain
competitive with Newell Rubbermaid, changes should be made that would raise their P/E ratio
much closer to their competitor(s).
The second part of a firm’s market value is calculating the market to book ratio (M/B),
which is done by dividing market value per share by book value per share. Additionally, the
denominator of the ratio, or the book value per share, is calculated by diving the firm’s total
equity by the number of shares issued. According to QFINANCE, it explains that a “low
market/book ratio could suggest a company’s assets are undervalued.” (2012). With that being
said, the opposite could also be true; a high market/book ratio could suggest a company’s assets
are overvalued. According to Appendix B, the M/B ratio for Tupperware Brands in 2009 was
4.7020, decreased to 3.8826 for year 2010, then climbed to 7.1088 in 2011. When comparing
them to their closest competitor Newell Rubbermaid, their M/B ratio in 2009 was at a lower
2.4761, with a slight increase in 2010 at 2.9309, then decreasing again for the year 2011 at
2.6614. Tupperware Brands overall had higher M/B ratios for three consecutive years over their
competitor Newell Rubbermaid. This is a disadvantage for Tupperware Brands because as their
M/B ratio climbs their firm becomes more overvalued, and investors could see its competitors
like Newell Rubbermaid as better investments. This could limit their growth in the future if
investors are not willing to provide capital to the firm.
Page | 51
Collaborators
Key collaborators of Tupperware Brands include suppliers of their raw materials, the
various depository and financial institutions that house their cash and cash equivalents and
execute financial transactions, and their extensive network of independent sales people. These
relationships benefit Tupperware Brands and allow them to secure favorable raw material prices,
hedge against the financial risks of exchange rates, and execute their business strategy of direct
selling. All these relationships offer an advantage to Tupperware Brands and they seek to
maintain these relationships to remain competitive.
In Tupperware Brands most recent 10-K (2013) statement, the firm mentions its
relationship with its suppliers, and offers the benefits it derives from the relationships. The firm
says, “Resins [raw materials] are purchased through various arrangements with a number of large
chemical companies located throughout the Company's markets”. They discuss the benefit of
these relationships by saying, “…as a result, the Company has not experienced difficulties in
obtaining adequate supplies and generally has been successful in obtaining favorable resin prices
on a relative basis” (Tupperware Brands 10-K, 2013). Although Tupperware Brands does not
explicitly name these chemical companies, it is evident that strong relationships with their
supplier of raw materials has been imperative in securing favorable prices which allow them to
reduce their costs.
It was noted in the economic analysis section that Tupperware Brands is exposed to the
risks of changing exchange rates. In order to hedge this risk, “The Company uses derivative
financial instruments… with major international financial institutions, to offset the effects of
exchange rate changes on net investments in certain foreign subsidiaries, certain forecasted
purchases, certain intercompany loan transactions, and certain accounts payable” (Tupperware
Page | 52
Brands10-K, 2013). These financial institutions, again not named explicitly in the 10-K
document, play an important role in Tupperware Brands global market presence. These
institutions help mitigate the losses Tupperware Brands experiences when doing business in
nearly 100 countries around the world.
The final key collaboration for Tupperware Brands is their relationship with their
extensive independent sales force. Because the vast majority of the sales force are not actual
employees of Tupperware Brands and they can easily quit selling for them, motivating and
retaining the sales force is vitally important to Tupperware Brands’ survival. Tupperware Brands
is dependent on the sales force to distribute their products in the direct selling method, so the
relationship with this group of independent workers must be constantly maintained by offering
the group compelling learning and earning opportunities. Without this vast network of the
independent sales force Tupperware Brands could not exercise their distinctive competitive
advantage of direct selling.
Growth Strategy
Description of Growth Strategy
Our growth strategy takes a product development approach because we are creating a
new product in an existing market. We plan to introduce a new children’s lunch box called
TupperBox that will enhance children's awareness of healthy eating practices in order to achieve
a healthier lifestyle. The product will be introduced in the existing market of the United States
where the tween cohort and women of those tweens will be our primary targeted focus. We plan
on integrating current healthy eating standards into the lunchbox by leveraging our firm’s ability
to create innovative product designs that will influence our customer base to buy. We will take
advantage of the current health trends in the U.S. society discovered in the situational analysis of
Page | 53
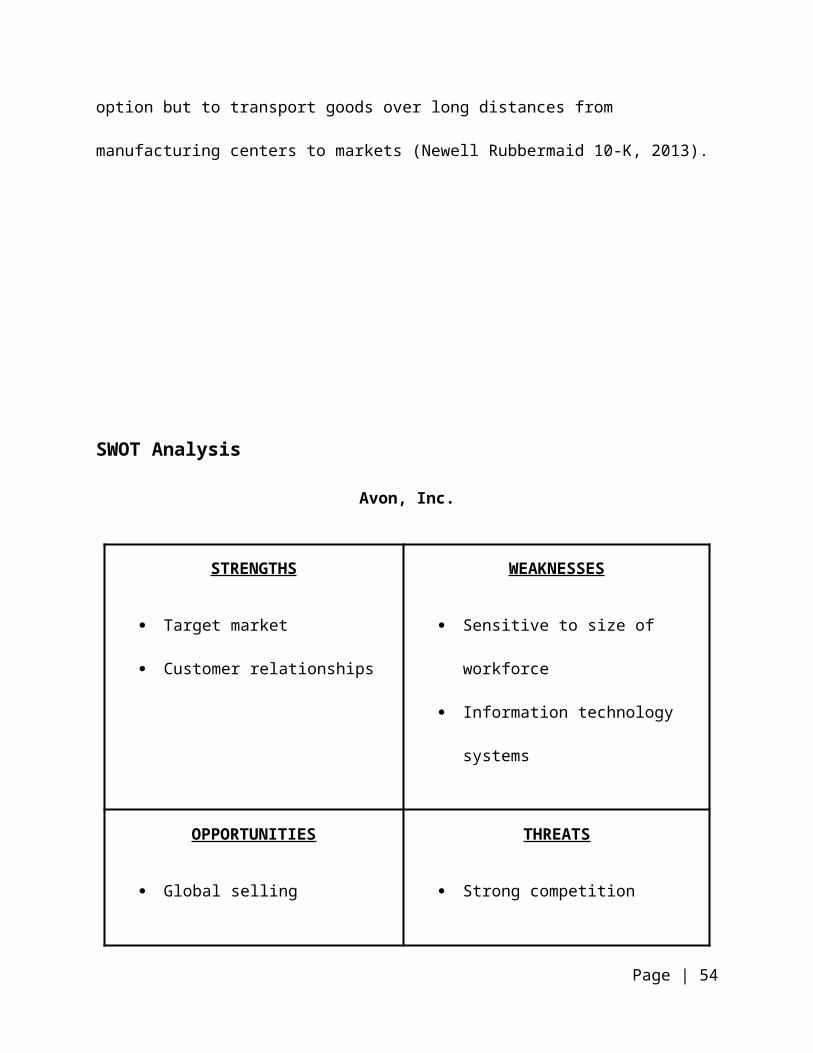
this report and offer a product that will satisfy these new wants while staying consistent with
Tupperware Brands strategy to offer products which are lifestyle oriented. Individuals in the U.S.
are searching for products that will supplement their new healthy lifestyles, and our team plans
on pursuing that opportunity with our unique product design. Additionally, our team will
formulate our growth strategy by using methods that are consistent with Tupperware Brands’
current internal strengths (i.e., distribution method & independent sales force)
Goals and Objectives
Our primary goal with this new lunch box is to raise awareness of healthy eating for kids,
ages 6 – 11, which bring a lunch to school. This new product offers food drawers that are
intended to ensure all food groups are incorporated into the child’s lunch. The drawers are
designed to approximately reflect the proper portion of each food group. The new product offers
an easy way for parents to pack a healthy lunch for their children and is also a learning
opportunity for children to be introduced how to prepare a proper meal. Another goal is to
distribute this product to consumers that are familiar with Tupperware Brands unique selling
method. Because mothers typically prepare children’s school meals, these same women will be
likely to attend a Tupperware party. Our distribution method goals will therefore ensure the
correct audience is being reached. The final goals will be promoting the product customers of
Tupperware Brands are accustomed to, and offering the product at a comparable price to existing
Tupperware products. This mix of objectives will influence whether the ultimate goal of the firm,
increasing shareholder wealth, will be achieved through financial success.
Page | 54
Segmentation
Variables
Individuals in the market of food storage containers value products that meet their special
needs, wants, and expectations. Tupperware Brands has the potential to serve the entire market
with our new product, but to better reach the consumers who will desire our new product’s
unique characteristics, the market must be divided into segments using segmentation bases, or
variables. Our segmentation strategy will take a multiple-variable approach in order to define a
more precise market base. The first characteristic that will be used as a basis to segment the
market is demographic segmentation. The specific descriptors that will be used within these
broad bases include age, gender, and family life cycle. The second broad category that will be
used in our segmentation strategy is psychographic segmentation. The specific variables used
within this category are motives and lifestyles.
Customer Segments
Demographics
Age: Young and middle aged parents (ages 25-55) are one of the main segments Tupperware
Brands new lunch box will be targeting. The parents of the children will be the purchasers of the
product and therefore will be a main segment for Tupperware Brands to target. Our product will
be designed for parents, specifically mothers, who will be searching for a product that is made to
promote a healthy lifestyle and will be a learning experience for their children. We predict these
mothers will fall within the age range stated above.
The other segment that this product will be targeting is the young children themselves,
tweens, ages 6-11. Since children are still included in the consumption of the lunch box, but will
not be the ultimate purchasers of it, so the marketing approach will be modified for to attract this
Page | 55
group to our product. Our team will mostly use the design of the product to attract their interest.
Our team will seek to create the next new “cool”, creative lunch box children will want to own.
Gender: Women, particularly mothers, are the main target market for this particular product.
This product provides health conscious mothers the opportunity to not only pack healthy lunches
for their children but also to teach their children the basics of a healthy diet. Additionally, our
distribution method of direct selling typically attracts mostly women participants to the party
demonstrations, so we believe they are our main audience as well.
Both genders of the tweens group will be targeted for this lunch box. The designs for the
product can be modified to be both gender neutral and gender specific, therefore both genders
will be targeted for children.
Family Life Cycle: Young and married with children and middle-aged married with children are
both segments of the market that we believe will provide a demand for the product. Both of these
life cycles are families that most likely will have children in the tween category and are parents
looking to provide the most opportunities to care for their children when it comes to life choices,
such as the foods they choose to eat. This new product will provide that opportunity for these
parents in these particular family life cycles.
Psychographic
Motives: The motives of Tupperware Brands’ consumers for this particular product are those
who want to provide or start a healthier lifestyle for their children. They are the types of people
that are looking to establish healthy eating habits in their children at a young age so they can
continue to grow and learn about nutrition their entire lives. These people are motivated at
starting children at a young age with healthy eating habits and find lunch meals a great learning
opportunity.
Page | 56
In addition to targeting individuals that value health, we intend on targeting to young
children who are motivated by the thought on owning the most creative lunchbox in school.
Children ages 6-11 are beginning to value their peers’ opinions, so designing our product to not
only serve as a health tool, but also serve as a creative expression and interest children who value
becoming opinion leaders of their peers.
Lifestyles: Tupperware Brands’ products are originally designed to be lifestyle-oriented
products, so designing one to fit the increasing health needs of families is consistent with
Tupperware Brands current business. The markets of people who are health conscious or
adopting a healthier lifestyle are individuals most apt to find interest in our new product. Parents
who practice healthy eating habits will most likely want their children to also do so. This product
will provide these parents with the right tools to teach their children what the main food groups
are and how much of each food group they should be eating.
Children attend school five days out of the week, so our product needs to serve their
needs at lunch time. Children who are looking for a creative lunch box to meet their busy
lifestyles at school lunch time will find interest in our product and we seek to target those
individuals.
Targeting
A particular target markets is needed to be selected in order meet the needs of certain
specific segments. Because our new product will appeal to serve two or more well-defined
market segments Tupperware Brands will use a multi-segment targeting strategy. The first target
market will consist of young and middle-aged women with children, using the division of
demographic segmentation. Age, gender, and family life cycle segmentations are all essential
factors to our target marketing. These women are most likely upper to middle class. In addition
Page | 57
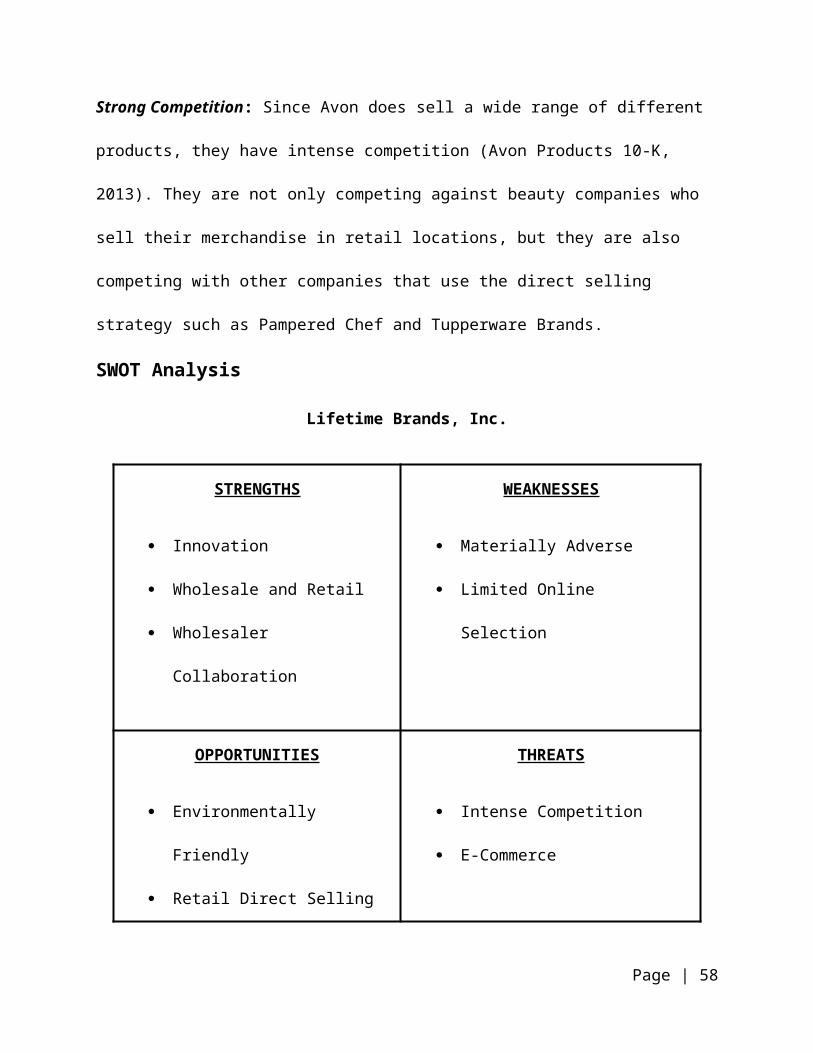
to the demographic segmentation, we developed a strategy to the psychographic segmentations
for our new product idea. Aside from our target market being women with children, they obtain
motives to become more health conscious and to spread the awareness amongst the rest of her
family, as well. As a result of such high rates of obesity in the U.S., we respectively narrowed
our focal point to women in the United States that are concerned with these issues.
The second target market will be male and female tweens (ages 6 to 11) that live in the
United States. The mothers will ultimately be the purchaser of our new product, so the product’s
message and positioning will be focused on influencing their perceptions, but the children will be
our primary consumers and actually use the product on a daily basis. The psychographic
segmentation involved tweens who are fashion forward and trendy. These trend setters embrace
their unique sense of style and incorporate it in our product. They are the elementary and middle
school students who wish to be in style and associated with the “in-crowd.”
Positioning
In developing a marketing mix, the process of positioning will intensify the potential
customers’ overall perception of our new product line. Currently, Tupperware Brands positions
its products as high quality, durable goods that simplify the consumers’ life. The containers are
priced at a premium to symbolize their prestigious quality and are for women who are willing to
pay the extra dollar for a smart, long-lasting solution to their kitchen problems. We used price
and quality, product user, and attributes as positioning bases. Following with Tupperware
Brands’ current positioning strategy for existing products, we plan on offering this product at a
premium price to uphold its high quality image. The product itself will be manufactured to match
the durability and long-lasting nature of Tupperware products. Furthermore, our positioning will
be structured to appeal to the product user of our product—the children consumers. We intend on
Page | 58
offering a new design of lunchbox with distinctive patterns to attract children who value being
noticed at school for having the latest and most creative accessories.
With our new product, we want the target market to perceive this product as more than
just a durable and high quality container amongst the other competitors. We want our audience to
recognize the beneficial attributes of delivers. Our product will demonstrate Tupperware’s effort
to raise awareness in making more health conscious decisions when packing lunches for
children. Child obesity is a major issue, especially in the U.S., and we wish to take this
opportunity to position our product to provide a smart, simple solution that will educate the
consumer in order to lead a healthier life for themselves and their families. Although there are
thousands of different lunchboxes sold in the United States market, our product does simply
more than just offer a medium to carry a children’s food at lunchtime, our lunchbox’s function
and ‘never-before-seen’ design are made specifically to give mothers the tools to execute
healthier practices for their children. Moreover, the children will have the opportunity to learn
about health through this creative tool, many of which will use it nearly every day at school.
Strategy Execution
Product
Goals
Our primary goal is to sell a product to our target market that will exceed their
expectations and enhance their satisfaction with Tupperware products. With our innovative
strategy, we plan to create a product that is durable and long lasting for kids ages 6-11.
Tupperware Brands takes pride in offering high-end quality and non-breakable products, and we
wish to continue this tradition. In addition to upholding the quality status, we expect to sell
75,375 units for the first year of production. Based on the percentage of Tupperware Brands’
Page | 59
share of market in the packaging and containers industry and applying it to the number of
children who prefer using a cloth lunch box (which is a percentage taken from all students who
bring a packed lunch to school), we computed a number to represent our potential customers for
our new product. A more detailed discussion of this is present in the base case of our capital
budget. Lastly, we want our product to raise awareness about the issue of child obesity and
encourage healthy food options with our product. Although it is unrealistic to expect our product
to make a dent in the high ratings of obesity in the United States, we want mothers to take
initiative in providing healthy lunch proportions for their children to encourage these healthy
habits early on in life. With our new stylish product, the tweens of our market will learn that the
“healthy way” is the “cool” thing to do. In order to determine if we met our objectives, we must
measure the product’s performance. To do so, we keep track of units sold and compare it to the
number we predicted. Also, we can compare the units of our product sold to the already existing
Tupperware lunch pails and observe any product cannibalization. This will allow us to
determine the demand for our healthy product amongst the other Tupperware options.
Description of the Product
Our new consumer product is expected to gradually become an asset to the existing
Tupperware Brands merchandise. Due to Tupperware Brands personal selling strategy, our new
creation will hold a shopping product status. Our product requires more extensive decision
making than a convenience product, therefore, it is a product that requires comparison shopping
because it is usually more expensive and found in fewer stores (in our case, most of which is sold
in homes). The product description in its most simple form is a lunch box for children to take to
school on an everyday basis. Tupperware Brands already has a lunch solutions line of products,
Page | 60
so the introduction of our new product will result in the extension of this line and add more depth
to the line.
The lunch box materials will include a plastic shell which will house plastic trays and a
cloth-like bag. The main plastic shell will act as a place to hold the specific plastic trays. The
five other plastic pieces are trays that fit into the larger mold like drawers. Each of the drawers
will have a handle for easy access to the food being used in the lunch box. The measurements
and weight of each plastic container is calculated and displayed in Appendix B. The entire
Tupperware container will then fit flawlessly into the customized cloth lunch box. The sizes of
each tray play an important role with our product’s overall value, and will help set our product
apart from other lunch solution items sold by competitors. An illustration of our lunch box is
displayed in Appendix V.
Plastic Containers: Each tray in our lunch box roughly represents the different portions
individuals need from the various food groups. On the front of each tray is a small handle, so
they can easily slide out like a drawer. Every plastic tray, including the outer shell container, is
microwaveable and dishwasher safe. The size of the containers will account for the grains,
protein, vegetables, fruits, and dairy proportions. The different food groups require different
nutritional needs. If one of the groups is regularly skipped, it will affect the amount of nutrients
that must be met for the best health. Our product is to be used as tool for healthy eating and is
designed to be meet nutritional standards, but it is designed to be versatile enough if children and
parents do not want to always follow the product’s suggested healthy guidelines. We plan on
integrating healthy eating by assigning a color to each tray that will represent a particular food
group. The colors displayed in Appendix V are not necessarily the colors we will use for
production; however these colors will be referenced for the sake of discussion. The bottom
Page | 61
drawer, which is a light blue, will be for grains. Whole grains are a nutritious and important part
of a child’s diet and have lots of dietary fiber that enhances the feeling of ‘fullness.’ Next, the
drawer directly above grains is for protein. The protein tray will be the orange color on the model
in Appendix V, and is essentially used to help body build, maintain, and repair tissue. The taller
red tray can be used to alternate between fruits and vegetables, although it will be suggested
vegetables occupy this tray. The alternative option for the smaller serving (either fruit or
vegetable) can be put into one of the green trays. Vegetables provide many vitamins and
minerals needed for good health. And fruits, like veggies, contain vitamins, minerals, and fiber.
Lastly, the second green drawer is used to primarily for dairy. Dairy products are rich in calcium,
such as milk, cheese, and yogurt. This is essential for growth and strength of a human’s teeth
and bones (Teens Health, 2013). Each tray will have measurement ‘ticks’ on the side of it to give
individuals an idea of the volume capacity of each tray. This can be used to better judge the
proportion sizes needed for each food group.
Cloth Bag: The cloth bag will keep the outer shell and trays together for transporting to and from
the cafeteria. When the bag sits right side up, it is shaped like a vertical rectangular cube. The
bag will possess a handle at the top, a side pouch for a drink and utensils, and a zipper that flows
around the entire front side to access the plastic drawers. The zipper will start at the bottom left
corner and continue up the edge of the bag towards the top. Once it reaches the top left corner,
the zipper will proceed to move along the edge, changing its direction, and moving along the top
of the bag towards the far right side. Lastly, the zipper will run down the right side of the bag
until it reaches the bottom right corner. After being completely unzipped, the whole front side of
the bag can be put down to conveniently access the inside. Outside of the bag, on the right side,
is a mesh pouch for a water bottle or other preferred drink and any needed eating utensils. To
Page | 62
craft our product to be engaging to the tweens market, we are offering customized designs and
colors for them to choose from. The range of creative and attractive options will appeal to both
male and female tweens. Our options include pink, orange, blue, green, black, floral print, and
sport themed print. After a couple years of production, we may wish to expand the options of
designs. We want our customers to be excited and proud to consume our product, and offering
them a chance to choose a look that fits their style will allow them to do so.
Pamphlet: Every customer who purchases our product will be granted an informative pamphlet
guide. The pamphlet will help mothers become more educated on the idea of using portion
control. The colors used on the plastic drawers will match up to a food group description
provided in the guide. This will make it easier for consumers to determine how much to pack of
each food group to achieve a healthy and complete lunch. The pamphlet is an important factor to
our product, and will appeal to both the parent and their children. In addition to the chart of the
different food groups assigned to the different trays, there will be a brief description of each food
group with suggested food items to put in the lunches. This will serve as an informative guide
that will set it apart from other lunch boxes but also will be used as a sales promotion technique
to induce more demand for our product.
Description of Processes Used to Make Product
While developing a new product it is inevitable to encounter constraints that make the
development process more difficult. The main constraint that we have encountered while
developing our new lunch box is the need to use our current equipment not only for our other
products, but for our new product as well. The reasoning for having to share the equipment
among products is because the new products only require new injection molds to make them, so
it would be cost inefficient to go purchase more machines. As a team, we had to consider how
Page | 63
much machine time to devote to our new products and our older products. This decision of
course leads to some cannibalization of revenues from our other products. In the end, we found a
way to devote time between products that was beneficial to our revenues.
Another constraint that we have encounter is how to market kids ages 6-11 to buy our
products. The main problem with developing products for children is they are usually not the
ones to pay for the item. Therefore, we have to market to not only the children but also the
person who will likely by the item for them. We have come up with the solution to market to the
kids through their mothers, making mothers one of the primary targets markets.
When taking into consideration lean applications, Tupperware is producing to the point
where there are low levels of waste. We are a company beginning to adopt sustainable practices
so operating at where waste levels are low is consistent with our mission. Also, while producing
this new product we will be producing at a minimum cost. Tupperware operates at a minimum
cost by eliminating non-value-adding steps and creates value by focusing primarily on the
process. Figure 3 shows a simplistic process map and the activities necessary for our product.
Page | 64
Figure 3 - Process Map
Page | 65
Produce plastic containers
Order cloths for the exterior of the lunch box from distributor
Start of Production –Make to Stock
Receive cloths
Assemble Product
Distribute Product
Outsourced Components
The only outsourced component that will be used in our company’s product is the cloth
lunch box that will hold the plastic outer shell and food trays. Our team has realized that
outsourcing the cloth is more beneficial to our company than if we were to produce the cloth
lunch component ourselves. We plan on outsourcing decorative cloths from distributors near our
manufacturing companies.
Life Cycle of Product
A newly introduced product passes through the four stages of the life cycle, where in the
end, production of the product ceases or the product is modified, and possibly repositioned, thus
beginning a new life cycle. Although there is no standard time any one product spends in its life
cycle, it is being assumed that our product spends around 3-5 years in its whole cycle. Based on
the prediction that our product will appeal to children in middle school, our team derived this
range of time by relating it to how long children spend in middle school. Our team is deducing
that those children first exposed to our product will use it throughout their middle school years,
and then replace our product with another alternative or switch to buying lunch at school. At that
time, our team assumes the product will need to be enhanced or modified to appeal to children of
the future, who most certainly will follow new trends and have new attitudes. It is still necessary
though to estimate the exact number of years our product will spend in its life cycle. To estimate
the exact number of years, an article from the external environment about the most recent
attitudes and trends in healthy eating will be used to justify why our team predicts our product
will expend 5 years in the product life cycle—the maximum figure in our assumed product life
cycle range.
Page | 66
According to an article in the Scientific American, students are not responding well to the
recent changes made by the U.S. Department of Agriculture (USDA) who are now offering
healthier lunch options to students (Meal Thicket, 2012). Those students whose schools are
participating in the federally supported National School Lunch Program (NSLP) are resisting the
Institute of Medicine’s science-based nutritional standards by boycotting lunch provided by their
school, and turning to social media sites such as Facebook to voice their displeasure. Some
schools report the recent change in nutritional standards is the cause for a 70 percent drop-off in
school lunch participation (Meal Thicket, 2012). However, the USDA and the federal
government are sticking with the program is hopes of changing the norms of unhealthy eating
practices in the public school system while also emulating the ongoing trend in the U.S. towards
healthier eating (Meal Thicket, 2012).
With the recent backlash the NSLP has received, and the drop-off of “hot” lunches being
served at school, it is certain that the number of “cold” lunches brought from home will increase
in the upcoming years until the program is accepted by students. Furthermore, this trend towards
healthier eating will not only continue in the school systems, but also remain at the broad societal
level for many years. Our product will serve as the perfect alternative for children who want to
start bringing lunch from home and parents who still want to see their children eating healthy and
portioned lunches. There will be an opportunity in the short-term to serve the needs of the
parents of students who fit the situation described above. Based on this article, it is believed by
our team that the growing awareness of healthier eating practices in schools and in society will
see no significant slowdown in the near future, and consequently, our product should be able to
reach the maximum life cycle of five years based on the reasoned higher demand for health
products in the near term.
Page | 67
Complementary Services and Warranties
Tupperware Brands values the customer satisfaction and is committed to producing
superior quality goods and deliver outstanding customer service. Tupperware Brands wants their
consumer to feel delighted and content with their decision in purchasing their merchandise. If
for whatever reason the customer is not satisfied with the product, Tupperware currently offers a
return policy of 30 days for full refund of the initial purchase price. In addition to the return
policy, Tupperware Brands products are warranted by Tupperware against chipping, cracking, or
peeling under normal non-commercial use for the lifetime of the product. Customers are
encouraged to call the Customer Care line for a free replacement. If the product is unavailable,
there will either be a comparable replacement or store credit towards a future purchase.
Warranty replacement items will be issued to shipping and handling charges and applicable taxes
(Warranty and Returns, 2012). With our new product, we will continue to use the same policies
and warranties Tupperware Brands currently offers for its existing Tupperware branded products.
Place
Goals
The primary goal for having an effective placing strategy for TupperBox is to stay
consistent with the distribution strategies Tupperware Brands currently employs. Tupperware
Brands’ “direct-to-customer” method plays a crucial role in the success of their operations and
their marketing and selling strategies are created and implemented from this technique. By
distributing our product in this style, it will meet the way our existing customers buy our
products, the places and times they are familiar with when purchasing our products, and will
support and enhance our promotional blend. Also, our goal is to distribute products in the most
effective and efficient way for Tupperware Brands, and their current distribution systems in
Page | 68
place are structured on the direct consumer method, so using this method will ensure an effective
and efficient delivery to the end consumers.
Level of Market Exposure
The exclusive distribution strategy will be employed for our new product, TupperBox.
Because Tupperware Brands grants distributorship to only a few groups, (i.e., distributors,
directors, managers, and the sales force) it limits the amount of market coverage of their
products. Their products’ exposure to the market is dependent mainly on the effort and success
of their independent sales force. This means that our new product will be exposed only to
individuals who attend Tupperware parties or access their online Tupperware store, and only
registered sales people are given the exclusive right to market their products. Individuals seeking
our product will typically need to find a representative in their area if they are interested in the
product. However, now that Tupperware products are offered online, the exclusivity of our
distribution method is reduced since nearly anyone with access to the Internet can purchase the
item.
Channels Used
Our primary channel which will be used for distributing our product is the nontraditional
“direct-to-consumer” channel where the merchandise will be sold through the independent sales
force outside traditional retail store locations. Instead of retail locations, our product will be
introduced and promoted at Tupperware parties. Representatives of Tupperware will display
merchandise for participants to sample and perform demonstrations. At the conclusion of the
party, participants are encouraged to place orders through Tupperware’s catalogs for the items
they desire. Tupperware Brands employed this distribution method shortly after their onset of
business in the 1940s, and have continued with this method since then. In order to expect
Page | 69
adequate levels of sales for our product, our team will place our items where their existing
customers are accustomed to. Additionally, because Tupperware Brands supply chain system is
set up to function in conjunction with “direct-to-consumer” distribution goals, it would be
ineffective and costly to distribute TupperBox in any other way, such as traditional retail
locations.
The second and last distribution channel being employed for the new TupperBox product
is the Internet. Tupperware Brands currently maintains a website dedicated to strictly selling
Tupperware products. The website address to its online store is www.tupperware.com. This
distribution method will be used to expose our product to consumers who may not attend the
traditional Tupperware party. By offering our product via the Internet, end consumers can expect
an alternative place to find our product, at a time that is convenient and flexible for them. The
Internet offers the flexibility for consumers to view and access our product in a setting that is
more comfortable for them.
Supply Chain System
Tupperware Brands supply chain system includes many elements to product their plastic
line of products. Although not explicitly stated in their 10-K, the company mentions close
relationships with large chemical companies as suppliers (Tupperware Brands 10-K, 2013).
Tupperware Brands procures its main raw material for these large chemical companies.
Tupperware Brands “owns and maintains significant manufacturing and distribution facilities in
Brazil, France, Greece, Indonesia, Japan, Korea, Mexico, New Zealand, Portugal, South Africa
and the United States…” (Tupperware Brands 10-K, 2013). Our new product’s manufacturing
location will be within the United States because of its proximity to its market. Although not the
Page | 70
exact location was not explicitly stated by Tupperware Brands, our product will be manufactured
in their east coast location in the United States (see figure 4).
Figure 4
Once the products are manufactured, the products are shipped to distribution locations
which are owned by Tupperware Brands. These locations “stock inventory and fulfill orders of
the sales force that are generally placed after orders have been received from end consumers”
(Tupperware Brands 10-K, 2013). Once orders are fulfilled, the goods are transported using
logistics companies and customer orders are received at their homes.
Promotion
Goals
The ultimate goal of promotion includes communicating a good or service to individuals
in hopes they will purchase the product. With our new product, our team will achieve that
Page | 71
Tupperware Worldwide Factory Locations (2012)
ultimate goal by informing the target market the benefits our product has to offer. Because our
product will be a newly introduced product to the market, we seek to bring interest, awareness,
and desire to the new product in the early stages of its life by promoting its use and
demonstrating to the consumers the healthy benefits they can expect if they purchase our item. In
the promotional mix of our new product, our strategy will parallel the goal of informing
consumers, and personal selling, sales promotion, and advertising will be used to achieve that
goal. We plan to use methods within each promotional mix element that are consistent with
informing the consumers, such as informative brochures or informative selling demonstrations.
These methods should not only inform our customers of the product, but also bring interest,
awareness, and desire in order to establish value in the eyes of the customers.
Promotional Blend
Although the promotional mix is established by the firm as they see fit, certain factors
unique to a firm or product serve as guidelines for the mix. For example, factors such as the
nature of our products’ distribution method, its stage in the life cycle, and the characteristics of
the target market will dictate the particular promotional mix that will be used by our team. We
seek to stay consistent with Tupperware Brands current strategies and competitive advantages
while working in the guidelines set by these factors. The primary strategies of our promotional
blend will include personal selling, sales promotions, and advertising. Methods used within each
element will take into account the factors stated above and the goals of our promotion strategy.
Personal Selling
The nature of Tupperware Brands’ current distribution channel, the “party” method of
sales, will largely dictate the specific personal selling method we will use for our product.
Tupperware Brands does not sell its products in traditional retail locations as stated before in the
Page | 72
report, so our new product will only be exposed to the sales force and consumers who attend or
host their own Tupperware party. Tupperware parties generally bring awareness and desire to
products through actual demonstrations during the party which highlight the features and benefits
of products. It is essential that our new product, in its introductory phase, be visible during these
parties and be included in the demonstrations put on by the host of the party. Attendees of the
parties will be able to see firsthand how the product functions and be able to receive informative
tips on the new product. This demonstration method of personal selling will bring new interest to
our product, and will hopefully lead to the action of purchasing it at the conclusion of the party.
In demonstrating the features and benefits of our new product in this personal selling fashion, we
believe better relationships can be developed between consultants and consumers resulting in a
more personalized service, which can foster a more educated and more satisfied consumer. By
selling personally to consumers in this fashion, we are staying consistent with Tupperware
Brands’ current strategies and still reaching our goals for promotion.
Sales Promotion
Our product is essentially a new product, so sales promotional methods for our product
will focus less on persuading consumers with discounts and coupons, but rather use methods
aimed at informing them. Since our product is centered on healthy eating, our team will use the
premium method of sales promotion. Our team plans on including an extra item with the
purchase of our lunch box to inform consumers the most up to date healthy eating standards they
can follow to take full advantage of our product. A brochure will include information on portion
sizes, food groups, and how to integrate this information with the lunch box itself. With our
product’s message and function being about healthy eating, we believe this supplemental aid will
help parents and children truly master healthy eating during lunch time and bring more value to
Page | 73
the consumer. Our team believes this informative sale promotional method will result in added
interest and desire for our product, making it more likely a sale will occur at the conclusion of a
Tupperware party.
Advertising
Tupperware Brands does not utilize the traditional nodes of advertising common to most
firms. Tupperware Brands rarely uses advertising methods aimed at reaching a mass target
market, such as television and radio. Instead, Tupperware Brands takes a more personal approach
to advertising to its target market, and our team plans to stay consistent with their strategy. We
plan on using the method within product advertising that pioneers, or stimulates, the demand for
our product by informing and communicating its benefits to consumers in a personal manner.
The first advertising method Tupperware Brands employs is the use of catalogs. Our team
plans on allocating catalog space to our new product to bring awareness of its benefits. Catalog
advertising will be important because a Tupperware party demonstration might not always
include our new lunch solution item, so the audience will need a printed source to obtain the
information about it. The item will be displayed in the catalogs in such a way to appeal to the
health desires of the purchasers, highlighting the health benefits which will be received.
Tupperware Brands releases seasonal catalogs throughout the year. One consideration for our
new product will be the placement in the catalog during the different seasonal catalogs. We
believe that during the summer catalog edition, our product should take a dominant position in
the catalog as children will be returning to school during that time. This dominant position, such
as near the front of the catalog or on the back cover, will draw the most attention to the item at
the time it is most likely to be purchased.
Page | 74

Our team will also advertise using the advertising channel of brochures. Tupperware
Brands currently promotes its products through brochures mailed or given to people invited to
attend a party (Tupperware Brands 10-K, 2013). Our team assumes Tupperware Brands
promotes its most popular or newest products on these brochures from time to time. Our team
will seek to contact consumers by mail that have purchased Tupperware branded products
before, and use their contact information to send them a brochure displaying the new product.
This method will bring interest and awareness to our new product, and the brochure will also
contain the steps viewers can take to purchase the new product. By displaying the item and
informing the viewers the steps on how to contact a local sales representative, our team hopes
this method will lead consumers into attending a Tupperware party and ultimately purchasing the
item. This method will be effective in reaching and motivating non regular customers who are
not exposed to Tupperware Brands other promotional techniques.
The final method of advertising we will employ in the advertising element is online
advertisements for our new product on Tupperware’s online store. Tupperware Brands maintains
a website where customers who do not want to attend a party can still purchase items and have
those items sent to their home. Along with the direct sales distribution method, our product will
also be distributed through this online store. Therefore, it will be appropriate to display our new
product on the main page on the website from time to time. During the first few months of the
product’s introduction, our team plans on featuring the item on the homepage of the online
website to maximize its exposure to the online audience. The feature will be an embedded link
where once clicked, the viewers’ browser will be redirected to the new product’s page where
information about the product will be displayed. The same web page will also contain the
functions necessary for viewers to buy the item. Additionally, during the summer months,
Page | 75
particularly before children return to school, the product will be again featured on the main page
to maximize exposure. During these times, the advertisements will be informative and appeal to
viewers health concerns in order to induce viewers to purchase the product.
Because of the new nature of our product, the target market, and our distribution
methods, our team took an informative approach to promotion in order to educate consumers of
the benefits the product has to offer, and sought to use methods that drew interest, awareness,
and desire in order to induce an action from the customer. Our promotional blend of personal
selling, sales promotion, and advertising are all consistent with Tupperware Brands current
promotional strategies being used, and the methods within each promotional element were
designed to meet our promotional goals.
Price
Goals
The price of our new product will be centered on the pricing objective of status quo
pricing. Status quo pricing objectives seek to maintain existing prices or meet the competition’s
price. In our case, status quo pricing will be used to maintain the existing price of our lunch
solutions product line. We want to offer a price similar to existing products in the Tupperware’s
lunch solution line as not to replace a large amount of demand. Furthermore, we seek to offer a
premium priced item to maintain Tupperware’s high quality image. We believe Tupperware’s
brand prestige substantiates their high prices for their lunch solution products and our team plans
to stay consistent with Tupperware Brands’ pricing strategy.
Value Proposition and Customer Price Sensitivity
Tupperware Brands value proposition for this particular product is to provide a high
quality, appealing, and innovative lunch box for mother’s seeking an opportunity to promote
Page | 76
healthier eating practices to their children (ages 6-11). Our product’s starting price will be $35.00
per unit and will include all the features mentioned in the product description section of the
report. The product is a guide to mothers and children alike on how to eat healthier and
contribute to a healthier lifestyle for children in the United States. Each color coordinated drawer
in the lunch box indicates a respective food group. The drawers, along with a health guide
provided in the packaging, will provide the child with all of their nutrition standards and also a
great learning opportunity by demonstrating to children, and their parents, healthy eating habits.
For the children, specifically, this lunch box will offer an opportunity to express themselves with
our appealing and creative product designs. Because our lunch box is priced relatively high
compared to the competition, we believe the demand for our product is slightly elastic. This
means that a substantial increase in the price of our lunch box would cause a loss in demand.
However, we plan on maintaining the status quo price of the lunch solutions line so a slight
increase would not result in a large demand drop—but a drop nonetheless.
Pricing Strategy
For the first year of the new product’s life, our product will be using the status quo
pricing strategy. Pricing this product similar to the ones it already has will portray the same type
quality and value that the other products have. This simplistic method will provide the new
product with the benefit of already having an image of good quality to customers and it will
prevent the struggle and possible failure of the new product. Because Tupperware products are
not sold in retail stores next to competitors’ products but rather sold in catalogs exclusively at
Tupperware parties, Tupperware products are sometimes competing with products in their own
products lines, so status quo pricing will maintain a level demand for products in the lunch
solutions line.
Page | 77
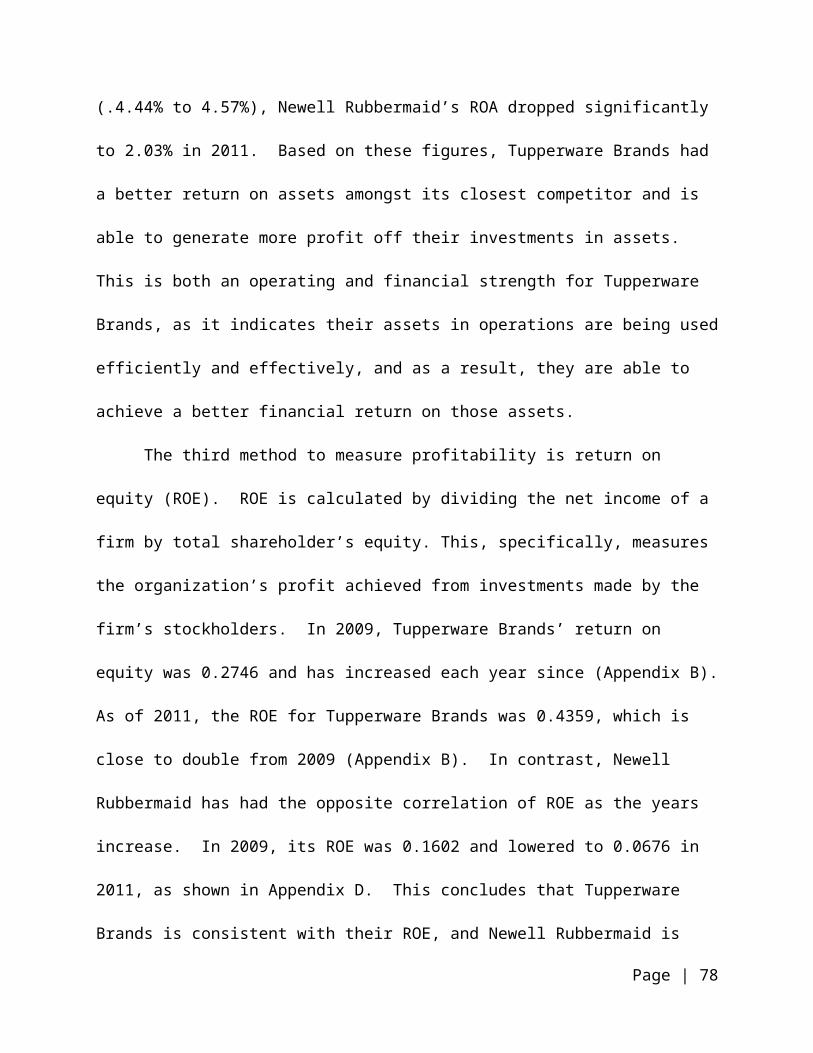
As the new product continues through its life cycle, Tupperware Brands will take into
account the availability of substitutes, demand of the product and the current status of the
economy in order to adjust the price accordingly. In most cases, Tupperware products are kept at
the similar prices they were introduced at, and the company employs methods of discounts and
rebates for its products. These are popular promotional strategies Tupperware Brands offers at
the various Tupperware parties to induce buyers and hosts to purchase their product. As our
product moves into the latter stages of its product life cycle, discounts such as a percentage off
will be offered. These long-term details will be reevaluated and decided at a more appropriate
time in the future.
Breakeven Analysis
Breakeven is used to determine the amount of units a company must sell in order to reach
a point of equality between total costs of producing the product and the total revenue that the
product has acquired. An analysis was done for year one of our capital budget. Total fixed costs
for the life of our project equal $750,000 (Appendix G). The revenue per unit of our product is
$35 and the cost per unit is $9.13 (Appendix G). Our team calculated that a figure of 28,991
units serves as the point where total costs equal total revenues—the breakeven point. Our
project’s first year of production has a predicted quantity of 75,378units, so the quick breakeven
estimation highlights that our project is producing about 50,000 units more than the breakeven
point and our project is returning adequate revenues to cover costs and contribute to profits.
Capital Budgeting Analysis
Project Life
A prediction for the relevant life of a project can be achieved by closely following the life
cycle of the new product being introduced. The life of our project is dependent on the predicted
Page | 78
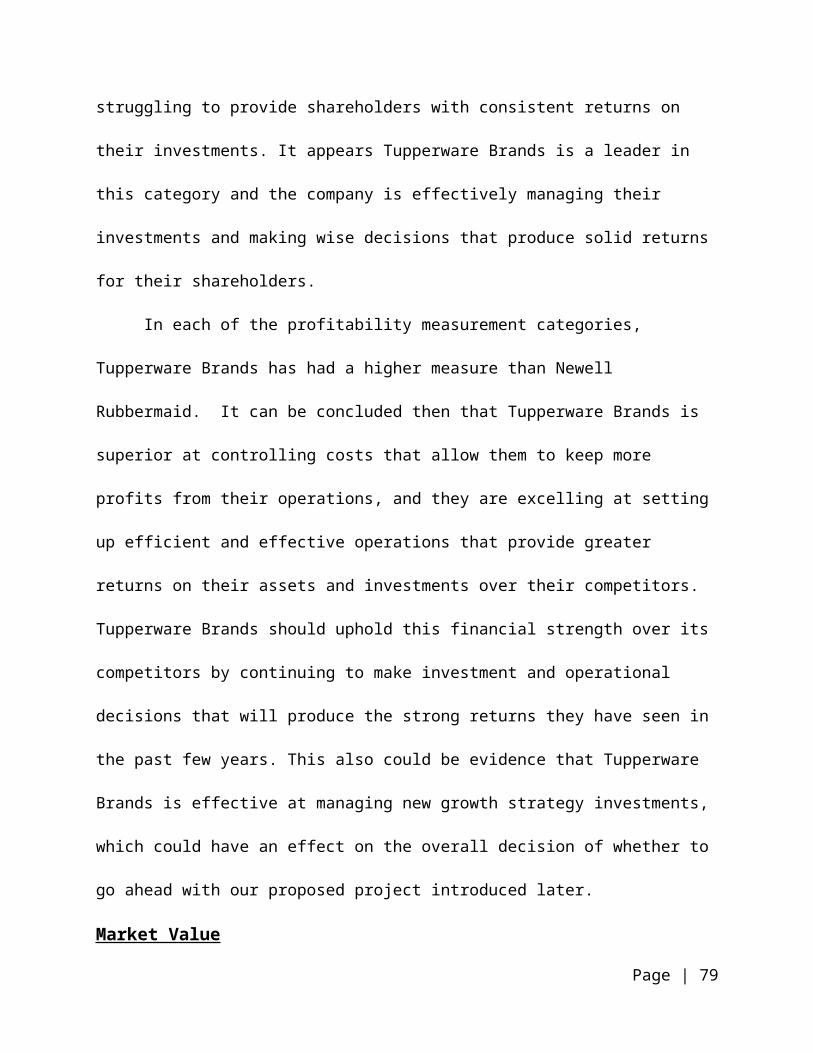
amount of time our product will spend in its life cycle, and therefore, our particular project life
will be derived from our new product’s specific life cycle. Our team believes that because our
product will expend five years in its life cycle, the life of the project will also be five years. The
discussion of the product life cycle in the product section serves as the justification for the
project life.
Sales Volume
Sales volume for the first year of our product will be determined by closely following our
intended market, and predicting the amount of individuals in this market that are most likely and
willing to buy the product. After the first year’s demand is estimated, a simple sales growth
percent will be applied to depict the rise and eventual decline of our product’s sales as it travels
through its corresponding stages of its life cycle.
An analysis of our consumer market will be used as a base for predicting the expected
sales volume for the first year. Currently in the United States, there are nearly 22 million children
that are considered to occupy the Tween cohort, which is defined as children aged 6-11
(Marketing Environment, 2012, p. 49). Based on the design and purpose of our product, this
group would most likely be the consumers of our product, as they are the group considered to
most likely take a lunch box from home. Although the mothers of these children are the ultimate
decision makers and purchasers of our product and our marketing efforts will be aimed at
influencing their decision to buy, the end consumers of our lunchbox is the only data necessary
to predict the amount of sales for the first year.
It can be reasoned, after establishing the number of tweens in the U.S., that not all of
those children bring a lunch from home, and that a percent of those buy their lunch from their
school’s lunch program. Based on data collected from an internet source, it was stated, “…an
Page | 79
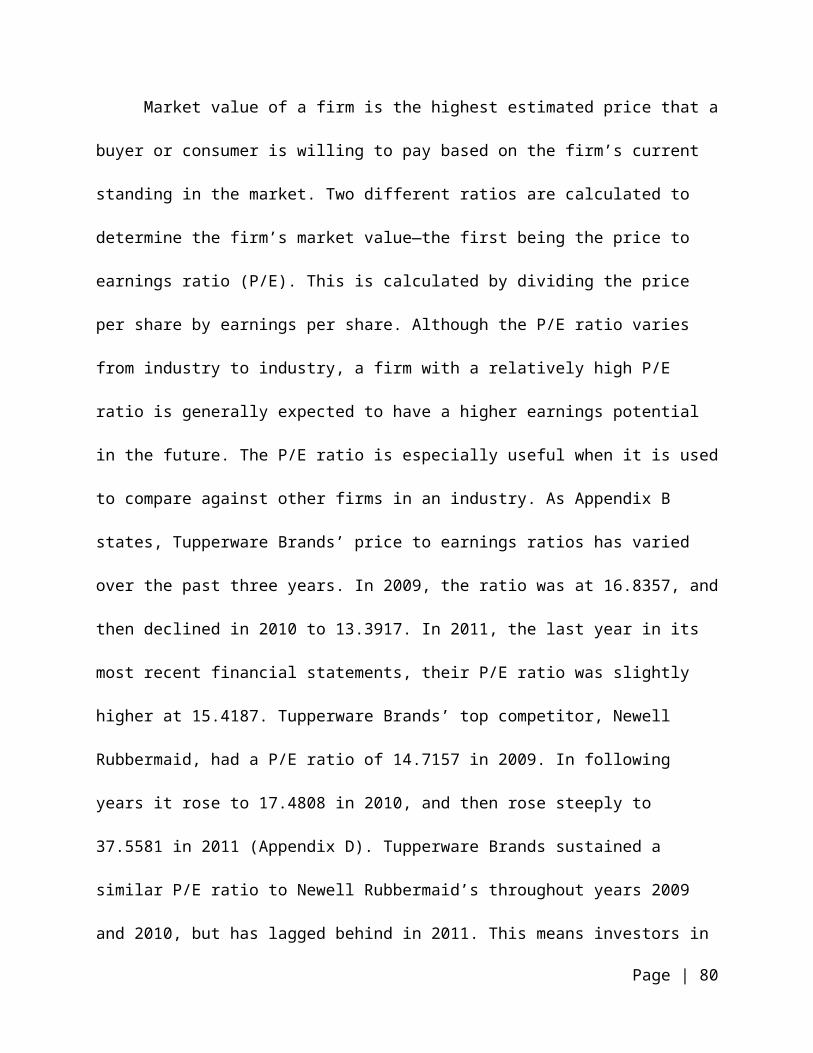
average of 53 percent of students bought a lunch on a typical day. (The State of Nutrition and
Physical Activity in Our Schools). Based on that data, it can be reasoned that around 47 percent
of children do not buy a lunch from school and choose to alternatively bring their lunch from
home. Given the 22 million tweens in the U.S., and the 47 percent of children that bring a lunch
from home, it can be concluded that nearly 10,340,000 children ages 6-11 use some form of
method to bring their lunch from home.
Children have a variety of options when bringing lunch from home. The various options
include a cloth lunch box, a plastic or tin lunch pail, or the generic brown paper bag. These are
the most common options children have when choosing to bring lunch from home, so it is
reasonable to think our cloth lunch box will be competing with these alternatives. Data about the
proportion of children that choose to take a cloth lunch box was not readily available, so a
general assumption will be made to gauge how many of the 10,340,000 children take a cloth
lunch box to school. Because there are three common lunch carrying options to choose from, our
team determined that the cloth product would be chosen around 33.33 percent of the time based
on its probability of its selection. However, our own experiences with children these ages led us
to adjust the selection proportion to 40 percent cloth lunch box, 40 percent lunch pail, and 20
percent generic brown paper bag. We have observed that children these ages are slightly more
likely to bring a purchased lunch box to school rather than the brown paper bag, warranting a
rearrangement of the proportions. With this information, our team inferred that of the 10,340,000
children who bring a lunch to school, around 4,136,000 of them choose to use the cloth style
lunch box; the same style of our new product.
It is necessary to determine the appropriate market share of Tupperware Brands relative
to its competitors to estimate how much share of the market they can expect to capture from the
Page | 80
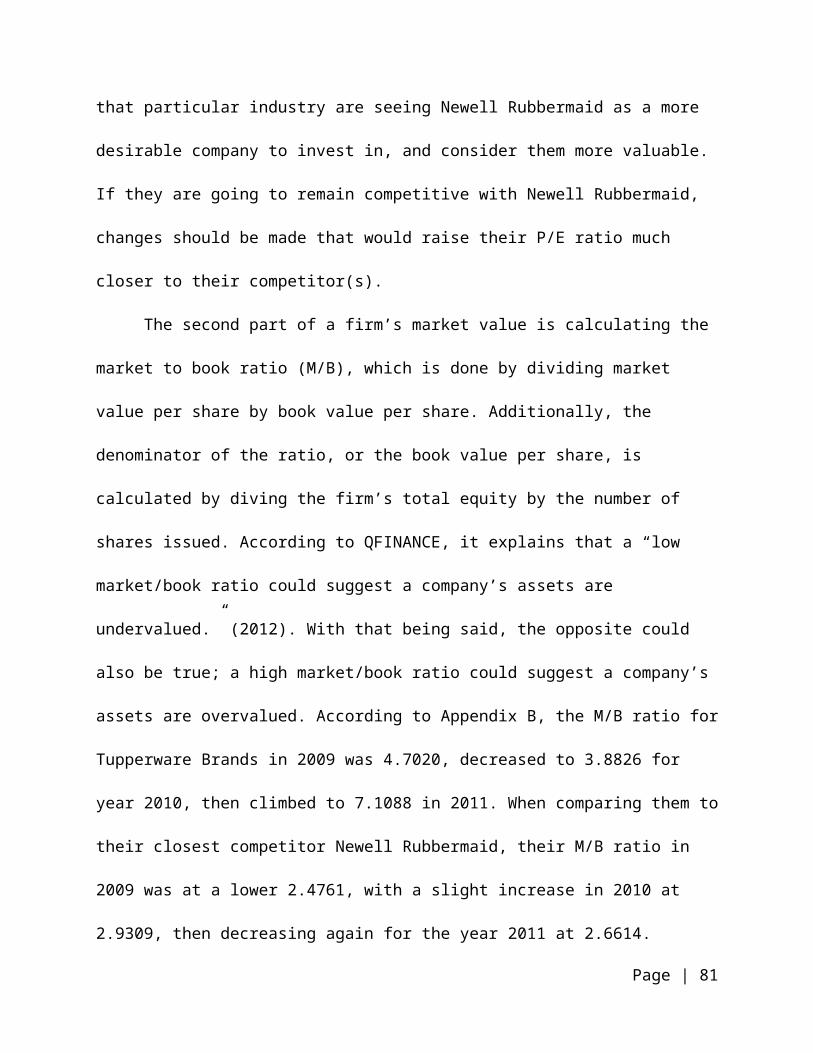
4,136,000 children in the U.S. most likely to purchase our new product. According to Yahoo!
Finance, Tupperware Brands is listed under the packaging and containers industry, which had a
total composite value of $1,499.8 as of March 15, 2013 (Industry, 2013). This value is subject to
change based on overall market conditions, but our team suspects this figure will remain
consistent enough in the short-term for it to be used as a reliable base. Tupperware Brands had a
share price of $78.56 at the same time the composite value of its industry was determined
(Industry, 2013). Tupperware Brands’ share price indicates the value of the firm per outstanding
share, and will be used by our team to generalize our estimate of their share of market. We are
assuming that the ratio of share price value to the total composite value of its market can give us
Tupperware Brands’ estimated market share, that is, how valuable they are compared to their
competitors in their industry For example, if Tupperware Brands’ value is a relatively large
portion of the overall industry value, it can be assumed then that it has a dominate position in the
market and can capture sales better than its competitors. Performing the ratio of share price value
to composite value yields a figure of 5.24 percent (rounded). We conclude that Tupperware
Brands has roughly 5.24 percent of the market share compared to its competitors in the plastics
and containers industry.
Since Tupperware Brands has an estimated 5.24 percent market share, this figure can be
used to find the amount of the 4,136,000 children in the market Tupperware Brands can expect to
sell to. We believe it is appropriate to use the entire 5.24 percent of market share in our
estimation. Because we previously segmented the market to only children aged 6-11 who bring a
cloth lunch to school, applying the 5.24 percent market share rate will result in a figure that only
represents a share of that small, defined market, not Tupperware Brands’ entire market itself. If
Page | 81
Tupperware Brands captures 5.24 percent of the market, we can then expect to have 216,727
children as potential customers for our new product.
However, we expect because of the higher relative price of our product and our firm’s
unique distribution method of direct selling, that selling to the full 216,727 children in the first
year will be unachievable. We presume our product will appeal to only those families in the
social classes that earn a higher income, that is, near or above the national average. Those
families in the upper middle class and middle class, which constitute 47 percent of America, are
two social classes with enough discretionary income to purchase our product while also still
identifying with our product (Consumer Decision Making, 2012, p. 97). Additionally, because
our product is distributed and sold mostly through direct private parties, only a percentage of our
market will be exposed to the product. Based on research by the Direct Selling Association, more
than 74 percent of the American public in 2011 has purchased goods or services through direct
selling (DSA FAQs, 2013). Applying these two percentages to our base market of 216,727 kids,
we arrive at a figure of 75,378. After considering the overall market conditions, price sensitivity
of our market, and the distribution method, our team concludes that our new product can expect
to sell 75,378 units for the first year of production.
During the first year of production, we can expect our product to occupy the introduction
stage of its product life cycle. The graphic representation (see Figure 5) of the product life cycle
shows revenues tend to rise until it reaches maturity, and decrease thereafter during the decline
stage.
Page | 82
Figure 5
These assumptions will be used to apply an expected annual growth rate to our sales
volume for years two and three, and a similar rate will be used to represent the decay of sales in
the decline stage of years four and five. Tupperware Brands’ 10-K (2013) states, “the significant
assumptions for these forecasts in 2012 included annual revenue growth rates ranging from
negative 7 percent to positive 10.0 percent with an average growth rate of positive 3 percent.”
Our team has selected to use a growth rate of 5 percent in years two and three because we
believe the current trend toward healthy eating warrants a slight increase in the average growth
rate indicated by Tupperware Brands; however, the indicated 3 percent growth rate practiced by
the firm will be used as a decay rate in years four and five to depict the decrease in sales at a
decreasing rate typical of the decline stage. Given these assumptions, we can expect sales
volume to be 79,147 units in year two, 83,105 units in year three, 80,612 units in year four, and
78,194 units in year five.
Discount Rate
Another important decision in capital budgeting involves determining a discount rate. A
discount rate is the percentage that a firm uses as a required rate of return on the investment. The
discount rate that we have chosen to use is 8.08 percent, based on a calculation provided by
Page | 83
QuickMBA.com (2010)
valuepro.net (Appendix E). This percent will be used to appropriately discount the future cash
flows of our investment to determine the net present value (NPV) of our project. Whether the
NPV is positive or negative will determine if the project is accepted or rejected, or if indifference
occurs.
Marginal Tax Rate
Based on the U.S. Federal Government’s table (Figure 6) for filing a U.S. Corporation
Income Tax Return, we predict Tupperware Brands’ marginal tax rate for this project to be 35
percent. Tupperware Brands reported an ‘income before income taxes’ amount of 272.8 million
on their most recent 10-K (Tupperware Brands 10-K, 2013). From the table, our team used this
amount to arrive at the marginal tax rate stated above.
Figure 6
Page | 84
Department of Treasury Internal Revenue Service (2012)
Tax Rate Schedule If taxable income (line 30, Form 1120) on page 1 is:
Over— But not over— Tax is: Of the amount over
—
$0 $50,000 15% $0
50,000 75,000 $ 7,500 + 25% 50,000
75,000 100,000 13,750 + 34% 75,000
100,000 335,000 22,250 + 39% 100,000
335,000 10,000,000 113,900 + 34% 335,000
10,000,000 15,000,000 3,400,000 + 35% 10,000,000
15,000,000 18,333,333 5,150,000 + 38% 15,000,000
18,333,333 - - - - - 35% 0
Change in Working Capital
Based on a valuation from valuepro.net, located in Appendix E, our team will use a
change in working capital figure of 11.95 percent. It can be assumed our project will resemble
Tupperware Brands’ current working capital structure, and the stated percentage will be used to
appropriately illustrate the change in working capital over the life of our proposed project.
Initial Investment
The manufacturing of Tupperware plastic products is accomplished through the injection
molding process. In simple terms, machines are used to melt and process plastic pellets called
resin, where the heated plastic is injected into a molded machine part. The necessary investments
for new plastic Tupperware products commonly warrant an outflow of cash for either a new
machine and new molds, or just new molds. Our team has decided to invest only in new molds,
and we will use existing machines for which the molds will be installed on and used by. Because
these molds are interchangeable, and can be installed and removed as needed, existing output of
another product will be sacrificed from time to time, and this will be accounted for in the
cannibalization of revenue section.
Based on knowledge provided to our team from an industry expert, it can be assumed a
typical investment for one injection mold requires an average $500,000 cash outflow (Appendix
F). Furthermore, it was also determined by the industry expert that our new product would
require an investment of five new molds—(see Appendix F). With this information available, our
team suspects that an initial investment of $2,500,000 will be necessary to put our project into
operation.
Page | 85
Depreciation
A straight-line depreciation approach will be used throughout the life of the project.
Based on the initial investment of $2,500,000 and a project life of five years, $500,000 will be
used as the yearly depreciable bases for our capital budgeting model.
Salvage Value
After the end of a project’s life, assets can be either sold or scrapped for a gain. Our
injection molds will not be sold at the end of their useful lives because they are proprietary in
nature, and Tupperware Brands would not want to give the competition an opportunity to
purchase these assets. Additionally, the integrity of the parts would be diminished after years of
use, so they may be close to inoperable. However, Tupperware Brands can scrap these parts and
receive a gain on the assets. Based on information from our industry expert, it can be assumed
the typical weight of a single injection mold is near 1,000 pounds (Appendix F). Therefore, we
can assume our five molds will equal a weight of nearly 5,000 pounds. Injection molds have
various types of metals incorporated into each one, but the bulk of metal is aluminum alloy
according to the industry expert. For the sake of simplicity, our team is assuming that we have
5,000 pounds of aluminum alloy to scrap at the end of our project. After visiting
metalprices.com, our team learned that aluminum alloy currently has a cash value of $0.8482 per
pound (LME Aluminum Alloy Daily Summary, 2013). It has been recognized that the value of
metal prices fluctuate over time, but our team has determined that five years is a short enough
time period to safely use the current value of scrap metal per pound. Based on these numbers,
our team expects to receive a pretax gain of $4,241 from the scrapping of our injection molds.
After paying taxes on this gain, our project can expect a recovery of $2,757 at the end of the
project.
Page | 86
Variable Cost
The major task of estimating the various costs involved in making our new product will be
accomplished by focusing on the main categories where our team expects large increases in
incremental costs. This includes an analysis of the direct materials needed to produce our
product, the costs of direct labor and overheard, extra direct labor time needed to assemble the
product after the production process, and distribution costs. These costs will account for the
variable portions of costs and will be discussed in the sections below.
A major cost involved in the introduction of our new product includes the direct materials
needed for production. A discussion on the cost of plastic resin, the main raw material input for
our product, and the insulated lunch box included, will be used to predict the direct materials
portion of our cost. Our main source of information for this section was provided to our team
after consulting with an industry expert who had the resources to accurately estimate the cubic
dimensions of our design. This information was then used to predict the gram weight of the
product’s individual components, thus leading us to the appropriate cost per unit based on the
market price for polypropylene (PP) resin. As shown in Appendix F, the total gram weight for
our product design totaled to be 203.6 grams. The current market price for PP resin was also
given to us by the industry expert, which is $0.95 per pound in today’s commodity resin market.
Based on these two figures, our team was able to calculate our product’s weight in pounds per
unit using the ratio of 1 pound to 453.592 grams, and then using this number to accurately
compute the cost based on the market price of resin. After converting grams to pounds, and
applying the appropriate price per pound of resin, it was determined that the cost of the raw
materials portion would be around $0.43 per unit.
Page | 87
To estimate the direct labor and overheard portions of the cost of producing one unit of
our product, a general rule of thumb in the industry was supplied to us by the industry expert. He
noted that the total cost of a unit is generally two times the cost of materials (Appendix F). He
suggested that once the cost of plastic materials was found, multiplying this figure by two would
serve as a way to derive the additional costs of standard direct labor and overhead for one unit.
Following his advice, our team estimates that the standard direct cost of manufacturing the
plastic components of our product will be $0.86 per unit.
Another direct material required for the production of our product is a soft, cloth lunch
box designed to house the unique characteristics of our removable trays. Scanning the
competition, we discovered Newell Rubbermaid, one of our competitors, offers a lunch box
similar to the design our team has in mind. We believe our firm can locate a supplier that can
match the design of Newell Rubbermaid, and we predict we can secure a price similar to the cost
Newell Rubbermaid incurs. Referring to Newell Rubbermaid’s financial statements located in
their most recent 10-K, we concluded their cost of products sold is 62.24 percent of their net
sales (Newell Rubbermaid 10-K, 2013). And based on the retail price of $10.99 Newell
Rubbermaid offers their trademarked LunchBlox product for, our team estimates the cost of
obtaining a similar lunch box for our new product will be around $6.84 per unit (62.24 percent of
$10.99).
Beyond the obvious direct materials and labor needed for production, our product will
also require extra assembly that most of our existing products do not require. Because of the
nature of our product, individual pieces are needed to be assembled by trained workers. Based on
our own simple mock simulation of the assembly process, we expect a trained worker to
assemble our product around 30 seconds or less. Hourly wage rates for a factory worker were
Page | 88
taken from a Kelly Services CareerBuilder site that offered a job description for a plastic
manufacturing firm in Northlake, Illinois. The position was for a standard factory job, and used
as a benchmark to gauge the wages we believe are paid in Tupperware Brands own factories.
The site offered a daily wage rate of $15.90 (Job Description, 2013). In addition to the normal
wage rate, a factor of 1.5 will be added to the base wage rate to account for the normal fringe
benefits received by the typical worker. Therefore, it can be assumed a typical factory worker in
the plastics industry receives a wage rate of $23.85 per hour. Based on this information, we
believe our own factory workers are paid rates similar to this example, and thus the added
assembly will warrant a $0.20 increase per unit for our new product. This was calculated by
multiplying the wage rate per second of a factory worker by the additional time required for
assembly.
The final component to the unit cost of our proposed project is the associated distribution
costs. According to Tupperware Brands’ 10-K (2013):
The warehousing and distribution costs of finished goods are included in DS&A expense.
Distribution costs are comprised of outbound freight and associated labor costs. Fees
billed to customers associated with the distribution of products are classified as revenue.
The distribution costs included in DS&A expense in 2012, 2011 and 2010 were $148.8
million, $151.7 million and $135.5 million, respectively.
This information from Tupperware Brands 10-K will then be used in order to estimate the
amount of distribution costs that will be incurred. Our team has noticed a direct correlation in the
DS&A expense column and cost of products sold column of Tupperware Brands’ income
statement. Because of this relationship, we believe it is appropriate to use a ratio of the two
categories in order to estimate distribution costs. In 2012, cost of products sold was $856.4
Page | 89
million and DS&A was $1,329.5 million. Therefore, in 2012, DS&A was around 1.55 times the
cost of products sold. Because we have already estimated our cost of products sold per unit
figure (the variable cost components of our product—$8), we believe DS&A expenses for our
product will be around $12.40 per unit. However, distribution costs only constitute $151.7
million of the 1,329.5 million DS&A expenses, or roughly 11.41 percent of it. Therefore,
distribution costs will not be the full $12.40, but rather, the distribution costs for our product will
be 11.41 percent of $12.40, or more accurately, $1.41.
The direct materials, direct labor, overhead, and distribution components of
manufacturing are typically product costs that vary with the level of production. These are
typically referred to as variable costs, and a summation of our new product’s direct materials,
direct labor, overhead, and distribution components will be given to justify our variable cost per
unit. As presented earlier, our team suspects the total cost of manufacturing the plastic elements
of our product to be $0.86 per unit, the cost of the cloth lunch box component to be $6.84 per
unit, and the added labor costs for assembly to be $0.20 per unit. Additionally, $1.41 will need to
be added to account for the distribution costs involved. It can be concluded that the variable
components of costs for our product will be near $9.13 per unit for the first year of production
and will rise and fall proportionally with revenues in the following years.
Fixed Costs
Fixed costs include costs that do not vary with the level of production and remain the
same no matter what level of production a factory is operating at. Our team does not expect our
project to warrant an increase in the fixed components such as electricity, property taxes, rent, or
insurance. These costs are already being accounted for by our current operations, and we do not
expect any incremental changes in these categories from our new project. However, we do
Page | 90
expect routine maintenance will be the largest fixed cost of maintaining the molds’ engineered
integrity. Maintenance is a cost required by all manufacturing businesses to maintain their
operations and ensure capital investments last. Referring to their income statement, it is seen that
the cost of products sold section for 2012 was 33.14 percent of sales (Tupperware Brands 10-K,
2013). This means that Tupperware Brands typically is responsible for controlling 30 percent of
revenue. Our team predicts it would be reasonable to assume that Tupperware Brands maintains
a discretionary maintenance target of around 30 percent of an investment. We assumed this
because if Tupperware Brands controls around 30 percent of costs, then a 30 percent figure
(rounded) could also be applied to the cost of the initial investment to estimate the fixed cost
component. This assumption is based on the notion that Tupperware Brands is responsible for
around 30 percent of revenue as costs, in which case they will try to maintain a cost target of 30
percent of the investment’s initial value. Therefore, a cost of $750,000 will be charged to fixed
costs for five consecutive years.
Revenues
Our pricing was established by looking at Tupperware Brands existing products which
are similar in nature to the new product being offered. After scanning their online retail store, our
team has observed lunchbox sets which include plastic components to be retailing within a range
of $35-$59. Because our team is extending this existing product line, we aim to maintain the
pricing status quo for this category. In other words, we do not want to replace a large amount of
demand for the other products by offering a price that falls outside this range. We believe these
existing products retail at such a premium price because Tupperware Brands seeks to maintain a
quality product image, distributes in the unique direct selling fashion, and has a high level of
brand equity. For these reasons, we believe our team can also expect our product to be offered at
Page | 91
a premium price. Our team expects to sell our product at a price of $35 per unit. We chose to
offer our product at the low end of our stated price range because our product does not include
separate items that our other existing products offer. For example, some existing products offer a
water bottle with its lunch set, and our product will only include a plastic insert, warranting a
lower price. Therefore, a $35 price will be appropriate for a simpler product; however, this price
is not low enough to leave consumers questioning its quality.
Cannibalization of Volume, Revenue, and Capacity
A major consideration in our capital budgeting decision includes the lost revenue of an
existing product after the introduction of our new product. Tupperware Brands offers Boy’s and
Girl’s Eco Lunch sets which retail for $45.00. Our team suspects this existing product will
experience the largest impact in lost revenue because its function and overall message are
substitutable by our product. We are assuming that mothers, who care about the environment and
want to set good examples for their children by purchasing an Eco friendly lunch set, will also be
interested in our new product because they will see the learning opportunity to teach their
children about healthy eating practices inherent in our product’s message and positioning. Based
on this assumption, our team will consider the lost revenue of the Tupperware Brands current
Eco lunch sets. To do this, an estimation of the Eco lunch set’s current volume is required.
To judge the current sales volume of the Eco lunch sets, it is necessary to estimate what product
life cycle stage we think the Eco lunch sets are in.
Since the Eco lunch sets appear in Tupperware’s catalogs, which are sent to the
independent sales force across North America for the Tupperware party demonstrations, we can
reason that this product has successfully completed the introductory and growth stages of the
product life cycle. We believe that products that make it into their catalogs have been
Page | 92
successfully adopted by consumers and have seen enough healthy profits to warrant an
appearance in the catalog. As such, we believe their Eco lunch sets have already reached the
maturity stage of the product life cycle, and more importantly, are beginning to cycle to the two
year decline stage.
Since their Eco lunch sets are comparable in nature to our new product, we also assumed
that Eco lunch sets’ sales volume match our predicted sales volume. However, since the Eco
lunch sets have a 28.5 percent higher price than our proposal, we believe the demand for the Eco
lunch sets are 28.5 percent less than our proposed projects’ expected yearly demand. From this
information, and considering Eco lunch sets are in years four and five of their life cycle, our
team expects the current volume of the old product to be 28.5 percent less than our new
product’s year four and five unit demand—or 57,638 units and 55,909 units.
Now that the old product’s current sales volume has been estimated, our team needed to
judge the volume loss of the old product given the introduction of our new product. We expect
our firm’s manufacturing plants to be operating in a lean fashion, so capacity for the Eco lunch
sets will need to be sacrificed for the last two years in order to meet the capacity needs of our
new product. Located in the discussion above, we justified that Eco lunch sets are in their two
year decline stage. During this same time, it is reasonable to think our new product will be in its
introductory and growth stages, where success of the product is still risky. Based on these
assumptions, our team has decided to sacrifice 40 percent of Eco lunch sets production time for
the last two years of its life, and maintain a production ratio of 60 percent Eco lunch sets and 40
percent new product. We want to allocate more production time to Eco lunch sets given these
products have already proved to be successful, and the success of our new product is still
unknown. This general assumption is being made because without adding any new capacity to
Page | 93
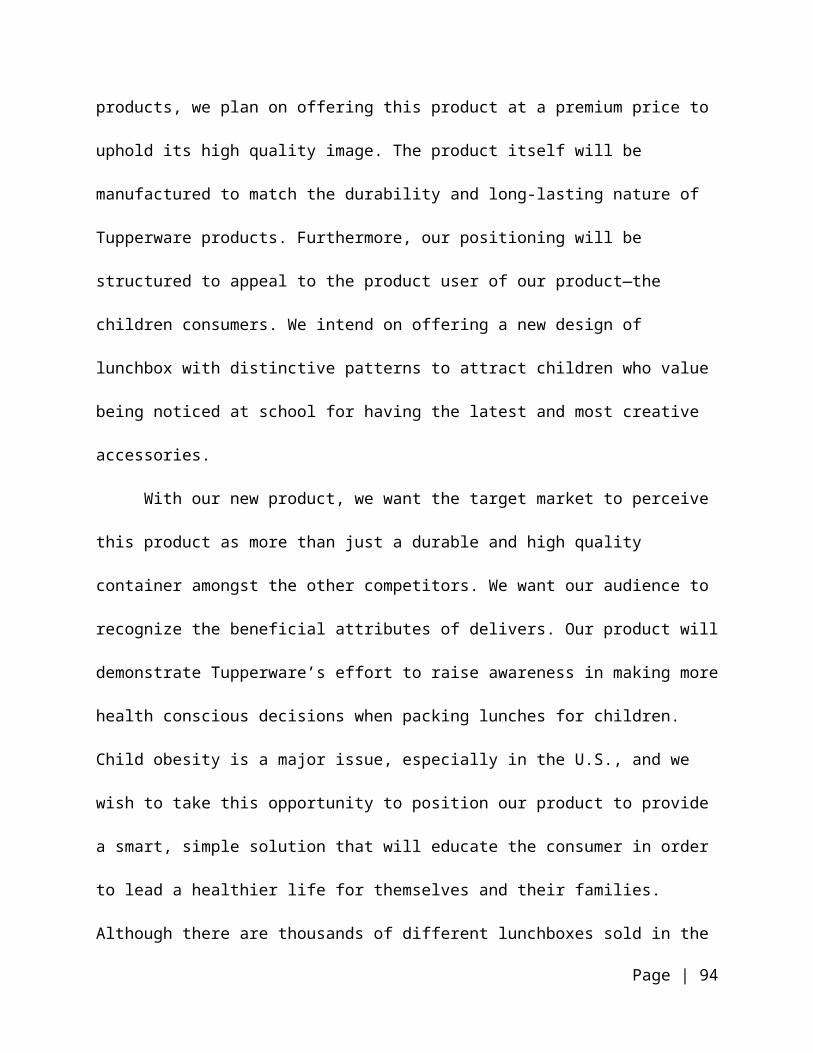
production, we are assuming our closest, most substitutable product’s capacity will suffer to
produce our new product. With this assumption made, we can expect to lose 40 percent of Eco
lunch sets’ volume in its last two years of life, resulting in a 23,055 unit volume loss in year four
and a 22,364 unit volume loss in year five. Although this assumption might not reflect the exact
loss of units given production times for each product are unknown to our team, a general
assumption was made to recognize that loss of capacity for the old product will take place
regardless.
Beyond the lost volume due to the limited resource of time and capacity, our team also
considered lost demand in the marketplace of the old product. We assume the Eco Lunch set will
experience a slight dip in demand barring the introduction of our new product. A simple
marketing principle was used to determine the drop in demand. The 80/20 principle states that
typically 20 percent of the market supplies 80 percent of the demand for a product (Segmenting
and Targeting Markets, 2012, p. 137). If this is true, the reverse should also hold; that only 80
percent of the market supplies 20 percent of the demand. Based on this assumption, we believe
the slight minority of customers, the 20 percent, has already purchased this product because they
supply the majority of demand, and their needs have already been satisfied. The majority, or 80
percent, is the group most likely to not have purchased the Eco lunch sets because they constitute
only 20 percent of demand, and because of this, they are also more likely to substitute our new
product for the old product if and when they do decide to make a purchase. Based on this
dynamic of the market, our team suspects that it is possible the old product could see a maximum
demand drop around 20 percent. However, this would mean every consumer in the 80 percent
majority would substitute our new product for the old product, which is not likely. Therefore, we
believe that 60 percent of the time Eco lunch sets will be chosen, and the other 40 percent of the
Page | 94
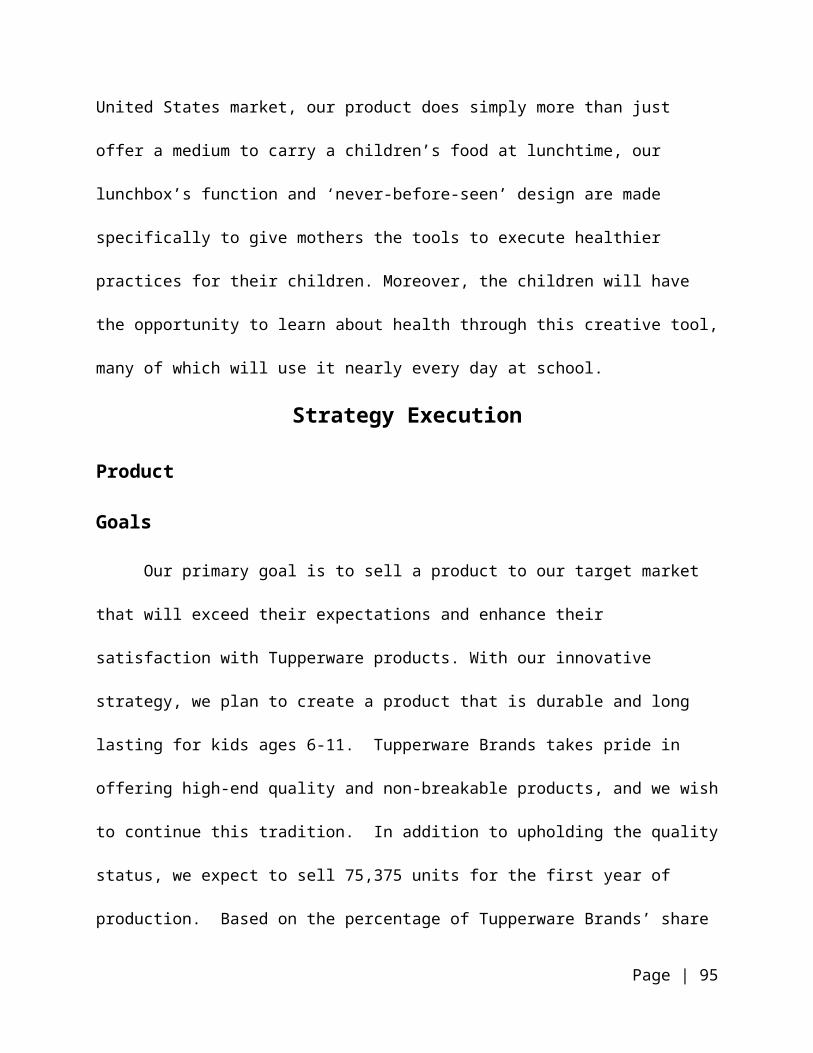
time our new product will be chosen. This prediction is ultimately related to our choice to only
produce Eco lunch sets 60 percent of the time, and we believe the same outcomes will apply in
the marketplace. Based on all the information provided above, we expect to see a 40 percent
decrease in the maximum 20 percent drop in demand of the old product. This will result in an 8
percent decline (40 percent of 20 percent) in demand for the old product, or more accurately, a
4,611 unit decrease for year four and a 4,472 unit decrease for year five.
By adding the decrease in volume due to reduced capacity and the demand drop for the
old product, our team supposes a total volume drop of 27,666 units in year one of the project and
26,836 decrease for year two of the project.
NPV and IRR Discussion
Appendix G neatly presents the information and numbers discussed above in a
landscaped table. The decision to undertake a project or not is dependent on the NPV of the
project’s expected future cash flows. Managers apply a discount rate to future cash flows to
determine if project’s are enhancing firm value and staying consistent with the ultimate goal of
the firm; that is, to maximize shareholder wealth. A NPV that returns a positive figure is
generally accepted as it enhances the value of the firm, and a negative NPV is rejected by
management. Our firm has decided to undertake this project based on the positive $546,341 NPV
our table has returned. This positive NPV will successfully add an incremental enhancement to
the value of our firm.
Another decision tool for company projects is an analysis of the internal rate of return
(IRR) of a project. The IRR is the rate that causes the NPV of a project to be zero. If the IRR of
the project is larger than the discount rate applied (cost of capital), the general consensus is to
accept the project. However, this decision rule only applies if free cash flows are conventional,
Page | 95
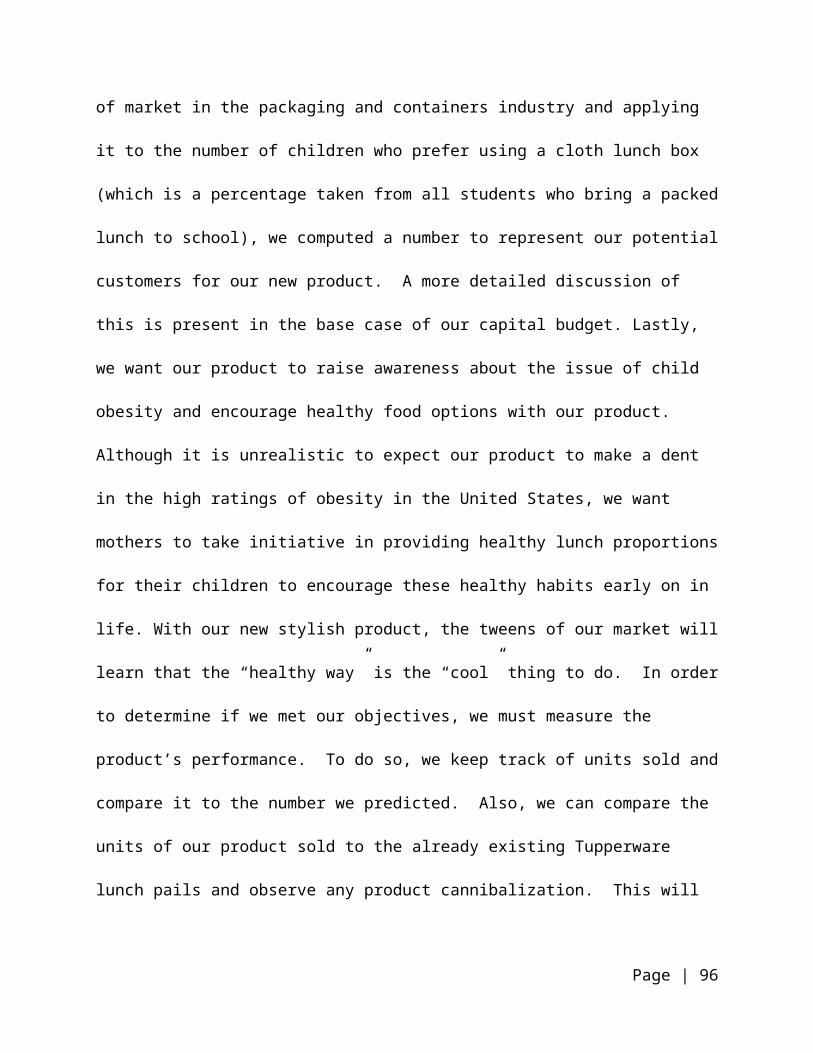
and the project is independent of other projects. Our project is both independent and its cash
flows are conventional. Therefore, it is acceptable to use IRR as another decision tool in this
instance. Based on the IRR of 14.31 percent of project returned, it would be acceptable to
undertake this project given the IRR is larger than our cost of capital of 8.08 percent.
Implementation and Control
Timing and Implementation Activities
To jump start our marketing plan, we must allocate necessary action assignments and
ensure that the assignments are executed in a way that accomplishes our plan’s goals. This
process is called implementation. In order to do so, it is essential to make the timing right. Since
our new product is primarily for upper elementary and middle school students, we wish to start
promotion in late July, early August. Starting of production will take place in May, so we can
have our products in stock in time for promotion. During the summer months, the individual
consultants will have the new Tupperware catalog with TupperBox ready to introduce,
demonstrate, and sell to potential customers. The end of the summer is the start of “back-to-
school” shopping, and our goal is to implement our growth strategy around that time frame. As a
result, we expect our product to attract the mothers making such purchases.
The TupperBox will not require new machinery, other than the different molds used for
each individual tray, used by Tupperware Brands for their manufacturing. Due to the similar
production, we will not require new training or additional employees in the manufacturing
department. Once the first batch of TupperBox’s are produced and distributed to the individual
consultants, the sales forced will be trained with a demonstration for a full understanding of how
the product operates. In order to properly control our potential growth strategy, we will
Page | 96
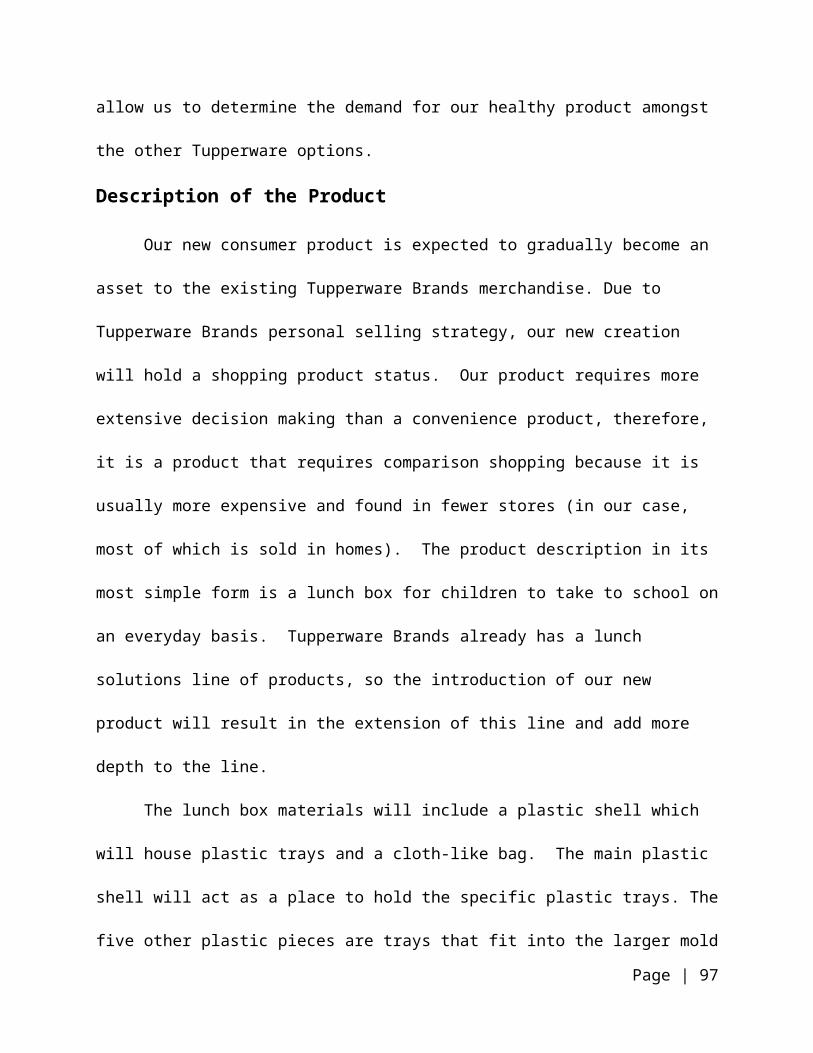
distribute a survey to all customers. This will help us gauge the customer approval, feedback,
and areas of improvement.
Sales Estimates
Our team did not use the mathematical, quantitative techniques of forecasting such as
moving average or exponential smoothing to predict demand for five year life of the project, but
rather took a qualitative approach. In the absence of stable, our team instead used intuition of
consumer market qualities to predict the appropriate forecasted sales. Because our project spans
a time frame of five years, this forecast constitutes as a long-term forecast, which is appropriate
when a new product is being developed. Our team was concerned with the strategic outcome of
the project so we sought to predict aggregate sales data for five years, and the details of short-
term and medium-term forecasts were left to be determined afterwards. The number of units
predicted to be sold in each year of the five year period will govern the later decisions of
inventory, personnel, and production scheduling.
Based on the discussion in the sales volume section of the capital budgeting section of
this report, our team used market research to arrive at an estimated sales forecast of 75,378 units
for the first year. This figure was determined are considering our target market, and narrowly
defining it with certain characteristics such as income of consumers and market share of
Tupperware Brands. As stated earlier, past sales data was unavailable to our team, so quantitative
methods could not be used to forecast sales volume in the following years. Instead, our team
applied a simple growth rate of 5 percent in years two and three, and a decay rate of 3 percent for
years four and five. This was done in order to reflect the product life cycle stages our product
will go through and the growth and decay rates were taken from Tupperware Brands 10-K
document.
Page | 97
Once a forecast is made, the last step is to typically implement the action. Whether this
project is accepted or rejected will dictate the implementation decisions following the sales
forecast. If the project is accepted, the necessary steps will be to communicate these estimates to
the appropriate functional areas of Tupperware Brands, such as production, in order to plan for
the resources needed to implement the project.
Scenario Analysis
Our team performed an analysis to our base case model in order forecast the best and
worst case scenarios our model could realize. These scenarios represent the upper and lower
extremes of the project, and will be used accordingly as another tool to test the financial
feasibility of our project. These extreme bounds will be compared to our most likely outcome,
the base case, and afterwards, the likelihood of these extreme cases occurring and what might
cause these events to materialize will be discussed.
Our team collected closing prices and dividends for Tupperware Brands from years 2008
through 2013. This information was used to calculate the holding period return for each year,
which in turn was used to calculate an average return and the standard deviation of returns for
the five year period. Our goal was to correctly estimate the standard deviation of Tupperware
Brands’ return over a five year period and apply this figure to our base case model to estimate
the extremities of our project. As stated in Appendix H, our team calculated a standard deviation
for Tupperware Brands over a five year period to be 78.67 percent. Our team suspects that
because many firms’ share prices have fluctuated wildly over the past few years due to the
conditions in the macro economy, it would be inappropriate to use such a large percentage, as it
would incorrectly represent what our firm would usually experience. Therefore, our team has
decided to follow the advice given to us by an outsider and adjust our base case up and down by
Page | 98
a percentage of 20 percent. This percentage will be high enough to capture the volatile nature
Tupperware Brands has experienced in recent years, but not too high as to lose the financial
soundness of our best and worst case models.
Appendix I captures the best and worst case models our team performed. Our team chose
to adjust the variables of volume, unit price, and the variable cost per unit, annual fixed costs,
and the discount rate. These variables were adjusted up and down by stated 20 percent. In the
upper half of Appendix I, our team calculated the lower and upper bounds for each relevant input
variable, and assigned these figures to the best and worst case approaches accordingly. The lower
half of Appendix I displays the best case, which includes a high volume estimate, a high unit
price, low variable and fixed costs, and a smaller discount rate. The worst case represents the
opposite and includes a low volume, a low unit price, high variable and fixed costs elements, and
a higher discount rate. Appendix I can be referenced for the exact estimates of both the best case
and worst case scenarios, as the values were not made explicit in the discussion.
After determining the values for the best and worst case scenarios, our team used these
values to calculate the NPV and IRR of both scenarios, and used it to compare the results to our
base case model. It should be noted that when calculating the NPV of the best and worst cases,
the volume loss of the old product [Eco Lunch sets] in the base case model was adjusted
accordingly as it had a direct relationship with the volume of our new product. This action was
performed in both cases to have an equal effect on the results. Appendix J illustrates the NPV
and IRR of our project’s best case scenario. As shown, the expected NPV of the best case
scenario is $4,275,553, and the IRR of the project is 48.06 percent. For the worst case scenario,
our project could realize an NPV of negative $2,172,443 and an IRR of negative 22.42 percent
(Appendix K). The IRR could not be used as a valid decision tool for our worst case scenario as
Page | 99
the cash flows are not conventional. Therefore, a comparison of the best, case, and worst case
scenarios will be done using NPV as the basis. Recalling from Appendix G, our base case NPV
was $546,341 and the IRR 14.31 percent.
Once the NPV of all three scenarios was established, it can be observed that this project
is highly volatile and potentially very risky. If the worst case comes to fruition, then Tupperware
Brands could expect to lose a little over $2,000,000 of value to the firm. This could be
potentially damaging to Tupperware Brands operations considering this loss would come from a
single product. This may affect Tupperware Brands’ future plans to expand into and penetrate
more global markets, limiting their competitive edge. On the other hand, if the best case is
realized, Tupperware Brands could expect to gain over $4,000,000 of value to the firm, which
would prove to be a highly successful growth strategy. This added value could supplement
Tupperware Brands growth as a company, and the product’s success would affirm their strategy
of offering innovative products that meet the ever-changing needs of the markets they serve.
Given the recent economic downturn and ensuing recovery of the market our team
expects to sell in, our team predicts that it is most likely the base case will result; however,
uncertainty of the economic future of the United States, at least in the short term, could also
result in the our project performing near the worst case scenario. The United States economy has
shown signs of a slow recovery out of the recession of the mid 2000’s, but its economic future
and expectations for growth are still unclear, making new growth ventures for firms in the United
States market still somewhat risky. We predict that because our products are reusable, durable,
and sold at a premium price, consumers in a depressed economy are less apt to buy our new
products and more likely to reuse their existing products until the economy improves. Our team
believes that if the slow and steady recovery continues in the near term, our firm’s base case
Page | 100
would best represent the expectations of the project. Business is by no means booming; however,
consumers are beginning to buy more goods, which can indicate to our team an intermediate
return for our project is most probable. However, if the economy does not recover, and returns to
zero or negative growth, our firm would be forced to lower the price of our product while costs
continue to rise; at which point, the worst case scenario could be realized. Although more
unlikely than the base case and worst case, certain events could result in the best case scenario.
New technologies which lower the cost of operations or a higher demand of our product due to
unexpected popularity of the product are both events that could influence the probability of the
best case happening.
Sensitivity Analysis
To better judge the effect that each variable has on the NPV of our capital budgeting
model, our team performed a sensitivity analysis. Each of the key variables mentioned above
were varied one at a time while the other variables were held constant. This allowed our team to
critique the volatility in NPV in relation to each specific variable, presenting the forecasting risk
involved. After an analysis of each variable was performed, our team recognized which
variable(s) had the greatest effect on NPV, and which variables require the most attention. The
discussion that will follow will include each variables effect on NPV and the likeliness of each
variable increasing or decreasing. For reasons stated in the scenario analysis, our team chose to
increase and decrease each variable by the suggested 20 percent.
The most volatile variable in relation to NPV our team noticed was the revenue per unit
variable. In Appendix N, when our team increased the price by 20 percent to $42, it returned the
highest NPV of $1,965,097. On the other hand, Appendix O showed the effects on NPV when
our team lowered the price 20 percent to $28. The NPV for this instance was negative $872,415.
Page | 101
The price variable’s best and worst NPV had the largest variance, suggesting this factor should
be carefully considered and monitored as it has a great impact on the success of the project. It is
more likely that the price of our new product will increase rather than decrease. Because our
product is at the low end of the price range of Tupperware Brands similar products, we believe it
is more likely the price would inflate slightly to better match the prices of existing similar
products, and not fall further away from the product line’s status quo pricing strategy.
The next variable that was relatively volatile in relation to NPV was the volume variable.
In Appendix L, it is observable that when the volume was increased by 20 percent for five
consecutive years, NPV $1,404,256. However, when volume was decreased by 20 percent,
volume for our project was negative $311,559 (Appendix M). This key variable is particularly
risky for the firm because forecasting volume demand is always difficult for firms to do, and
rarely are they ever close to their original estimates. Therefore, it is difficult to judge whether
Tupperware Brands will be more likely to experience an increase or decrease in volume over five
years. If it had to be decided, our careful analysis of the consumer environment leads us to
believe a slight increase could be possible given the conditions and trends in the market.
The variable cost and fixed cost inputs will be included into one discussion as they had a
very similar effect on NPV. In Appendix P, the NPV is $921,535 when the variable cost was
decreased by 20 percent. Similarly, the NPV is $934,811 when the fixed cost was decreased by
20 percent (Appendix R). Both of these instances have nearly the identical effect on the project’s
NPV. In Appendix Q, the NPV is $171,148 when variable costs are increased by 20 percent and
Appendix S shows the NPV is $157,871 when fixed costs are increased by 20 percent. Compared
to the NPV of the base case, these values deviate from the $546,341 less drastically than the
price and volume variables, indicating the cost variables are less volatile. It is more likely that
Page | 102
the cost components of this project will realize a decrease during the life of this project.
Tupperware Brands income statement shows the firm manages their costs effectively, which
leads our team to believe Tupperware Brands could realize a likely decrease in costs over the life
of the project.
The final variable that was adjusted while holding the other variables constant was the
discount rate. Appendix T shows a NPV of $715,163 when the discount rate is adjusted down 20
percent to 6.46 percent and Appendix U shows a NPV of $389,694 when the discount rate is
adjusted up 20 percent to 9.70 percent. It is clear that is variable has the least effect on NPV as it
deviates from the base case only around $200,000, and the least amount of attention should be
given to this factor. Our team suspects as the United States and global economies recover over
the next few years, real interest rates will rise as the business cycle improves. As a result, our
firm could see a higher cost of capital, which would warrant the use of the increased discount
rate.
The base case model of our project returned a positive NPV, which would validate the
acceptance of the project. However, performing a scenario and sensitivity analysis conveys a
better perspective to the true financial viability of our proposed project. The best case scenario of
our project returned a value just over $3,500,000 better than the base case estimate, and the worst
case scenario returned a value just under $3,000,000 from the base case estimate. Given these
two estimates, our project can expect a variation from the base case NPV of about $3,000,000 in
both directions. This figure may question the financial viability of the project as a $3,000,000
range seems risky for a single product line. However, the sensitivity analysis exposed that the
variables of price and volume are the most sensitive variables in this project. If Tupperware
Brands can maintain and manage those variables, the project is far less risky, and suggests the
Page | 103
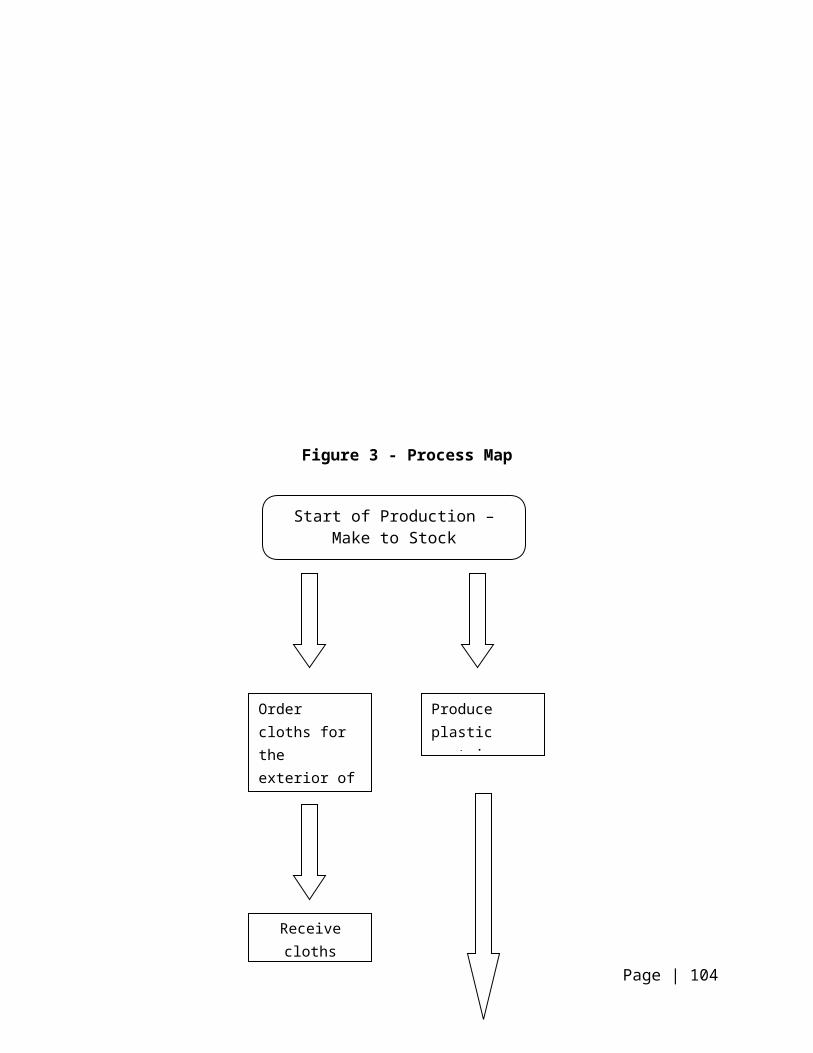
support of the project. In conclusion, the project has its risks, but this analysis exposed the
sources of those risks, so managing them correctly and evaluating Tupperware Brands
confidence in their ability to manage those factors could ultimately be a major factor in the
support of this project.
Comprehensive Financial Analysis
Based on all the financial data and analysis included in this report, our team believes
there is enough financial evidence for Tupperware Brands to undertake this project and begin the
process of producing the lunch box.
Our team began with the results of our capital budgeting model. Based on that model
alone, the positive NPV of $546,341 validated our decision to accept the project. However, a
decision cannot be made on the base case alone, and a scenario and sensitivity was performed to
model the dispersion of results around the base case. After these best and worst cases were
modeled, our team learned that this project could realize a best case with a positive NPV of over
$4,000,000 and a worst case with a negative NPV of over $2,000,000. This means our project’s
ultimate outcome could fall within this range. This large range led our team to question the
financial viability of this project as it appeared to be a risky project based on these two
projections.
However, after the sensitivity analysis was performed, our team discovered the variables
that provide the sources of risk for the project. These were the price and volume variables. The
other discount rate and variable and fixed costs variables did not have an extreme effect on NPV,
so therefore these variables should be given less attention. Once it was discovered which
variables affected NPV the most, our team had to decide whether Tupperware Brands was
Page | 104
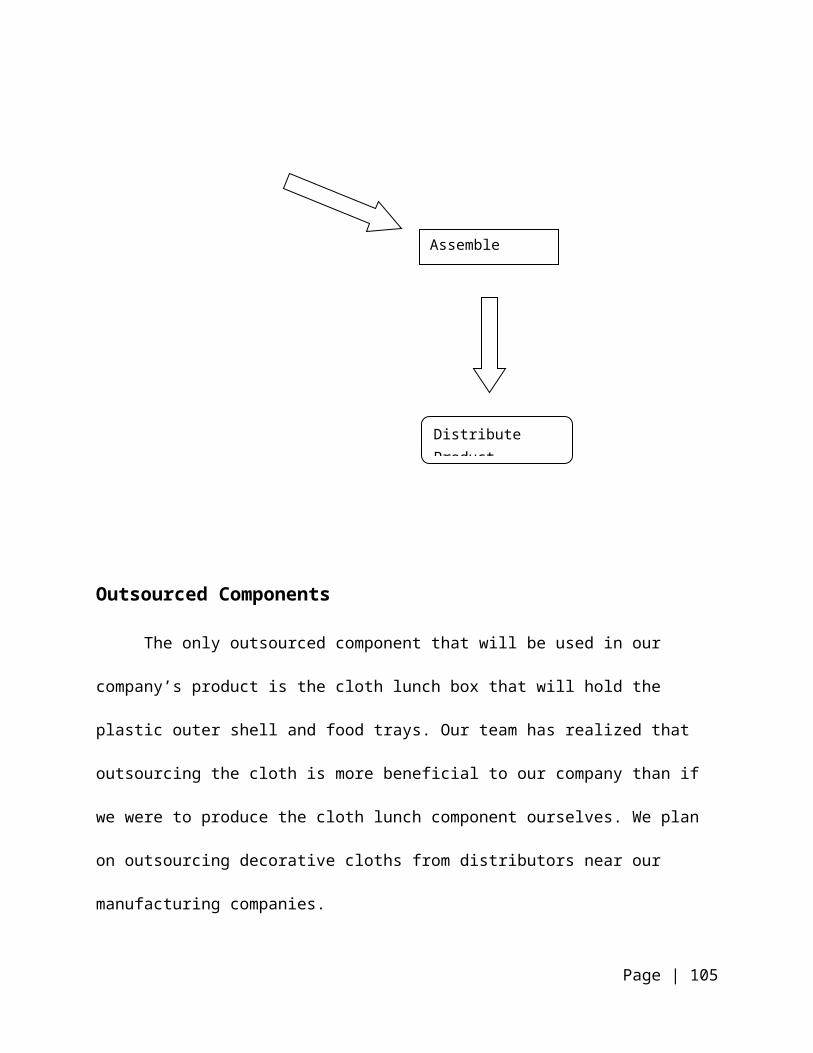
capable of managing the variables of price and volume. For this judgment, our team referred to
the financial ratio analysis performed by our team.
It was discovered in the financial ratio analysis that Tupperware Brands ROA and ROE
were superior to its competitor, Newell Rubbermaid. Our team used these figures to evaluate
Tupperware Brands capability to manage the most risky variables in the sensitivity analysis. Our
team reasoned that because Tupperware Brands had high returns in ROA and ROE on their other
investments in the firm, then they are highly capable of managing projects in general and will be
able to control or even improve the most risky variables in our project to drive the NPV of the
project even higher. Based on those figures, we believe their managers can achieve the
parameters set by the capital budget and their extensive network of independent sales people is
adequate enough to drive the demand for our new product.
This proposal acceptance is based on a foundation of assumptions. We are assuming our
firm is capable of meeting the goals set by the capital budget because they have adequate
management in place. However, if Tupperware Brands fails to maintain a competent workforce
and sales force, they could lose their ability to manage risks effectively and reach customers in
an effective manner. If Tupperware Brands loses these abilities, our project could result in a bad
outcome for the company.
Based on the whole financial perspective given in this report, and assuming Tupperware
Brands management capabilities do not change in the future, our team believes the project should
be accepted, and Tupperware Brands will be successful with our distinctive lunch box growth
strategy.
Page | 105
Conclusion
Tupperware Brands Corporation, as a whole, has maintained a consistent rate of growth.
Because of this, our goal as a group is to be able to add to the consistent growth levels of
Tupperware Brands. Society has proved to have an upward trend in health awareness, which we
believe will be a great benefit to our new product that targets that section of consumers. Our
product appeals to consumers wishing to live healthier lifestyles and establish better eating habits
for themselves and their children. Tupperware is already a very well known, established brand
and our group strives to sustain the image of that brand. We hope to use the success of the
company’s previous products to enter into their market successfully and continue the high
quality image Tupperware has maintained for many years.
Our capital budgeting model and comprehensive financial analysis for this product
proves that TupperBox will be successful. We, as a team, believe that this product will not only
benefit the Tupperware Brand name but also society as a whole. We hope to increase
Tupperware Brands Corporations shareholder wealth and create a healthier society with the
success of our new product, the TupperBox.
Page | 106
References
About BPA & Materials (2012). In Product Description. Retrieved April 6, 2013, from
http://www.tupperware.com/pls/htprod_www/tup_widget.show_page?fv_page_code=saf
ety&fv_section_name=help&fv_category_code=search&fv_item_category_code=200500
About Lifetime Brands (2013). In Lifetime Brands Company Timeline. Retrieved April 10,
2013, from http://www.lifetimebrands.com/About-Us/ABOUT_US,default,pg.html
Annual & Quarterly Reports (2011). In Lifetime Brands. Retrieved February 16, 2013, from
http://phx.corporate-ir.net/phoenix.zhtml?c=74141&p=irol-reports
Avon Products Inc. 10-K (2013). In U.S. Securities and Exchange Commission. Retrieved April
9, 2013, from
http://www.sec.gov/Archives/edgar/data/8868/000000886813000016/avp10ka2012.htm
Avon Founder (2012). In Avon. Retrieved February 15, 2013, from
http://www.avoncompany.com/aboutavon/history/mcconnell.html
Avon Markets (2012). In Avon. Retrieved February 15, 2013, from
http://www.avoncompany.com/aboutavon/avonmarkets.html
Brands (2013). In Lifetime Brands. Retrieved February 16, 2013, from
http://www.lifetimebrands.com/Brands/BRANDS,default,pg.html
Careers—Rubbermaid (2013). In Newell Rubbermaid About Us. Retrieved April 9, 2013, from
http://www.rubbermaid.com/mediaCenter/aboutUS/Pages/Careers.aspx
Childhood Obesity Fact (2013). In CDC Adolescent and School Heatlh. Retrieved April 10,
2013, from http://www.cdc.gov/healthyyouth/obesity/facts.htm
Page | 107
Clutter Diet (2011). In Whitelion Blog. Retrieved April 10, 2013, from
http://wlion.com/blog/2011/02/14/rubbermaid-personalized-organizing-website-service-
launches-during-national-get-organized-month/
Company Timeline (2012). In Lifetime Brands. Retrieved February 16, 2013, from
http://www.lifetimebrands.com/Company-Timeline/
COMPANY_TIMELINE,default,pg.html
Consumer Decision Making. Pg. 97. In MKTG: Student Edition (2012). Retrieved March 12,
2013.
Corporate Governance (2012). In Investor Relations. Retrieved April 3, 2013, from
http://ir.tupperwarebrands.com/governance.cfm
Department of Treasury Internal Revenue Service (2012). Retrieved March 30, 2013, from
http://www.irs.gov/pub/irs-pdf/i1120.pdf
Direct Selling (2012). In the Company Description. Retrieved April 1, 2013, from
http://tupperwarebrands.com/company/directselling.html
DSA FAQs (2013). In Direct Selling Association. Retrieved March 09, 2013, from
http://www.dsa.org/about/faq/
Executive Message on Sustainability (2012). In Brands. Retrieved April 3, 2013, from
http://tupperwarebrands.com/brands/tupperware/sustainability_executive_message.html
Fortune: World’s Most Admired Companies (2013). In Fortune Magazine. Retrieved from
http://money.cnn.com/magazines/fortune/most-admired/2013/snapshots/10497.html
Heritage (2012). In Tupperware Brands Company Description. Retrieved April 2, 2013, from
http://tupperwarebrands.com/company/heritage.html
I
Page | 108
ndustry: Packaging & Containers (2013). In Yahoo! Finance. Retrieved March 15, 2013, from
http://finance.yahoo.com/q/in?s=TUP+Industry
Investor Relations (2012). In Avon. Retrieved February 15, 2013, from
http://www.avoncompany.com/aboutavon/history/mcconnell.html
Job Description (2013). In Kelly Services career site. Retrieved March 10, 2013, from
http://www.careerbuilder.com/JobSeeker/Jobs/JobDetails.aspx?APath=2.21.0.0.0&job_di
d=J3H7KZ6XWHW4G0HVK39&IPath=JRKV0E
Lifetime Brands Incorporated 10-K (2013). In U.S. Securities and Exchange Commission.
Retrieved April 5, 2013, from
http://www.sec.gov/Archives/edgar/data/874396/000119312513109741/d439688d10k.ht
m#toc439688_3
LME Aluminum Alloy Daily Summary (2013). In MetalPrices.com. Retrieved March 12, 2013,
from http://www.metalprices.com/dailyexchangedata/LMESummary/LME/LAA
Market/Book Ratio (2012). In QFINANCE. Retrieved February 17, 2013, from
http://www.qfinance.com/asset-management-calculations/market-book-ratio
Marketing Environment. Pg. 49. In MKTG: Student Edition (2012). Retrieved March 11, 2013.
Meal Thicket: Students Balk at New School Lunch Nutritional Standards (2012). In Scientific
American. Retrieved March 10, 2013, from
http://www.scientificamerican.com/article.cfm?id=new-nutrition-standards-for-school-
lunches
Newell Rubbermaid Inc. 10-K (2013). In U.S. Securities and Exchange Commission. Retrieved
March 12, 2013, from http://www.sec.gov/cgi-bin/browse-edgar?
action=getcompany&CIK=0000814453&owner=exclude&count=40
Page | 109
Our Company (2013). In Newell Rubbermaid. Retrieved February 16, 2013, from
http://www.newellrubbermaid.com/OurCompany/Pages/OurCompany.aspx
Our Growth Game Plan (2013). In Newell Rubbermaid. Retrieved February 16, 2013, from
http://www.newellrubbermaid.com/OurCompany/Pages/OurGrowthGamePlan.aspx
Our History (2013). In Newell Rubbermaid. Retrieved February 16, 2013, from
http://www.newellrubbermaid.com/OurCompany/Pages/OurHistory.aspx
Overweight and Obesity (2012). In CDC Adult Obesity Facts. Retrieved April 8, 2013, from
http://www.cdc.gov/obesity/data/adult.html
Plastics (2012). In Plastics Common Wastes & Materials US EPA. Retrieved April 2, 2013, from
http://www.epa.gov/osw/conserve/materials/plastics.htm#facts
QuickMBA.com (2010). Retrieved March 11, 2013, from
http://www.quickmba.com/marketing/product/lifecycle/
Rubbermaid (2013). In the Free Library by Farlex. Retrieved April 10, 2013, from
http://www.thefreelibrary.com/Rubbermaid.-a017570237
Segmenting and Targeting Markets. Pg. 137. In MKTG: Student Edition (2012). Retrieved
March 12, 2013.
The State of Nutrition and Physical Activity in Our Schools (n.d.). In Environment and Human
Health, Inc. Retrieved March 15, 2013, from
http://www.ehhi.org/reports/obesity/summary.shtml
Teens Health (2013). In MyPlate Food Guide. Retrieved March 30, 2013, from
http://kidshealth.org/teen/food_fitness/dieting/myplate.html
Tupperware Brands (2012). In Brands. Retrieved April 7, 2013, from
http://tupperwarebrands.com/brands.html
Page | 110
Tupperware Brands Corporation 10-K (2013). In U.S. Securities and Exchange Commission.
Retrieved March 12, 2013, from http://www.sec.gov/cgi-bin/browse-edgar?
action=getcompany&CIK=0001008654&owner=exclude&count=40
Tupperware Brands Organization Chart (2013). In the OfficialBoard.com. Retrieved on April 1,
2013, from http://www.theofficialboard.com/org-chart/tupperware-brands
Tupperware Worldwide Factory Locations (2012). In Plant Locations. Retrieved April 8, 2013,
fromhttp://tupperwarebrands.com/brands/tupperware/sustainability_plant_locations.html
Vision and Strategy (2012). In Tupperware Brands Company Description. Retrieved April 1,
2013, from http://tupperwarebrands.com/company/vision.html
Warranty and Returns (2012). In Warranty Information. Retrieved April 2, 2013, from
http://order.tupperware.com/coe/app/tup_widget.show_page?fv_page_code=warranty&fv
_section_name=help&fv_category_code=search&fv_item_category_code=200500
World Wide Presence (2012). In Tupperware Brands Company Description. Retrieved April
5, 2013, from http://tupperwarebrands.com/company/wwpresence.html
Page | 111


![[Mfjs2240] lilly kautz slideshow #1](https://static.fdocuments.net/doc/165x107/54b75a164a795905078b4634/mfjs2240-lilly-kautz-slideshow-1-5584a7408e913.jpg)