Integrated catchment modelling: an application to Molenbeek catchment,...
14
1 Integrated catchment modelling: an application to Molenbeek catchment, Belgium M. Radwan, P. Willems, A. El-Sadek and J. Berlamont Hydraulics Laboratory, Department of Civil Engineering, Faculty of Engineering, K.U.Leuven, Belgium Abstract Hydrological, hydrodynamic and water quality models are often used to simulate surface water in a correct way to be a good basis for decisions regarding the development and management of water resources. Molenbeek is one of the main tributaries of the River Dender basin (Belgium). The hydraulic model is implemented by using the MIKE 11 software of the Danish Hydraulic Institute (DHI). It is a very detailed physically-based model: measured cross-sections are inserted at least every 40m and all significant structures (bridges, weirs, culverts and control structures) are considered. A simplification to the detailed model is performed to overcome the difficulties of running the model with higher time step (because of numerical instability problems). The simplified model is calibrated to the detailed one to make sure that it has a comparable performance accuracy. In this way, also an accurate and fast model for Molenbeek brook is implemented. The hydrodynamic model is linked with a hydrological model, which was calibrated and validated on the basis of new concepts. In addition, water quality modules (advection-dispersion and water quality) are applied to the river. Therefore, it was important to study the activities (agricultural, domestic, and industrial) that influence the river water and their quality. Model calibration was performed on the basis of available measured flow and water quality data. Keywords: rainfall-runoff, hydrodynamic, water quality, modelling, calibration. Introduction In recent years, water resources studies have become increasingly concerned with aspects of water resources. A mathematical simulation model can be considered a major tool for the efficient management of receiving waters. With such a model, a river or watercourse can be simulated to analyse its
Transcript of Integrated catchment modelling: an application to Molenbeek catchment,...

1
Integrated catchment modelling: an application to Molenbeek
catchment, Belgium
M. Radwan, P. Willems, A. El-Sadek and J. Berlamont
Hydraulics Laboratory, Department of Civil Engineering,
Faculty of Engineering, K.U.Leuven, Belgium
Abstract
Hydrological, hydrodynamic and water quality models are often used to
simulate surface water in a correct way to be a good basis for decisions
regarding the development and management of water resources. Molenbeek
is one of the main tributaries of the River Dender basin (Belgium). The
hydraulic model is implemented by using the MIKE 11 software of the
Danish Hydraulic Institute (DHI). It is a very detailed physically-based
model: measured cross-sections are inserted at least every 40m and all
significant structures (bridges, weirs, culverts and control structures) are
considered. A simplification to the detailed model is performed to overcome
the difficulties of running the model with higher time step (because of
numerical instability problems). The simplified model is calibrated to the
detailed one to make sure that it has a comparable performance accuracy. In
this way, also an accurate and fast model for Molenbeek brook is
implemented. The hydrodynamic model is linked with a hydrological model,
which was calibrated and validated on the basis of new concepts. In
addition, water quality modules (advection-dispersion and water quality) are
applied to the river. Therefore, it was important to study the activities
(agricultural, domestic, and industrial) that influence the river water and
their quality. Model calibration was performed on the basis of available
measured flow and water quality data.
Keywords: rainfall-runoff, hydrodynamic, water quality, modelling,
calibration.
Introduction
In recent years, water resources studies have become increasingly concerned
with aspects of water resources. A mathematical simulation model can be
considered a major tool for the efficient management of receiving waters.
With such a model, a river or watercourse can be simulated to analyse its
2
observed state. The different physical processes, which underlie the
observations, can be identified, making the understanding of the observation
possible. A mathematical model also allows the identification of the most
efficient measures for the improvement of the observed surface water state
(Willems et al. 2000).
The water quality of the receiving waters has decreased a lot all over the
world for a few decades now. The data flow through measuring systems
makes quantification of this decline possible. To solve the problem, water
management authorities and environmental protection agencies all over the
world are developing management plans for the water quality of the
receiving waters. In these water management plans severer standards for the
discharge of polluted water and for dumping pollutants on permeable
surfaces are defined. Moreover, a lot of money is invested in water
collection and treatment infrastructure (Willems et al. 1996). In this study
both aspects of water quantity (hydrological and hydrodynamic modelling)
and water quality (advection-dispersion and water quality modelling) are
considered.
Hydrological modelling
NAM is an abbreviation meaning precipitation-runoff-model. The
Hydrological Section of the Institute of Hydrodynamics and Hydrological
Engineering has developed this modelling system at the Technical
University of Denmark. In this study it is implemented and evaluated for
Molenbeek subcatchment of the river Dender watershed in Belgium. The
river Dender is located in the Flemish region of Belgium to the west of
Brussels. It is a tributary of the river Scheldt and rises in the Walloon region
of Belgium of total catchment area of 1384 km2. The Flemish part of the
Dender catchment area is divided into 12 hydrographic subcatchments
(zones) and Molenbeek is one of them as shown in Figure 1.

3
Figure 1. Plan view of the river Dender basin, together with the location
Molenbeek subcatchment and discharge measuring (Mere) station.
Calibration methodology
Model calibration is done for two different parameter groups: first the
parameters of the routing models (the recession constants or time constants
for baseflow, interflow and overland flow). Secondly the water balance
parameters (maximum water content in the lower zone storage, maximum
water content in the surface storage, and overland flow runoff coefficient. A
recursive digital filter is applied (Willems, 1999) to separate total flow to
three different subflows: baseflow (groundwater runoff), interflow (sub-
surface runoff), and overland flow (surface runoff). The working-principle
of the filter can be explained physically as the routing of the high frequency
(or quick) subflows through a linear reservoir, with the reservoir constant
equal to the recession constant of the signal that is filtered. In this reservoir
Mere station
Molenbeek
subcatchment
4
routing, the routed signal is considered equal to the filtered subflow as it has
the same qualitative behaviour in recession periods. The subflows with the
largest recession constants are separated first. In this way, baseflow is first
separated from total rainfall-runoff discharges, secondly interflow is
separated from total discharges of surface runoff and interflow. Finally, the
total flow filtered series is the sum of the three filtered subflows. For each
filtered subflow, the recession constant is estimated as the average value of
the inverse slope of the linear path in the recession periods of a Log (Q) –
time graph
After calibration of the recession constants, the water balance parameters are
calibrated by trial and error. The procedure is repeated till the maximization
of the agreement between the measured and modelled peak discharges and
total volumes is achieved. During the calibration procedure of the water
balance parameters, the models are evaluated in three steps:
(1) Evaluation of water balance (comparison of simulated and observed
runoff volumes).
(2) Evaluation of peak flows and low flows (comparison of hydrograph
maxima and minima for the different individual rain storms).
(3) Evaluation of long-term statistics. The observed and simulated
discharge values in the full time series are plotted after ranking them in
a ascending order.
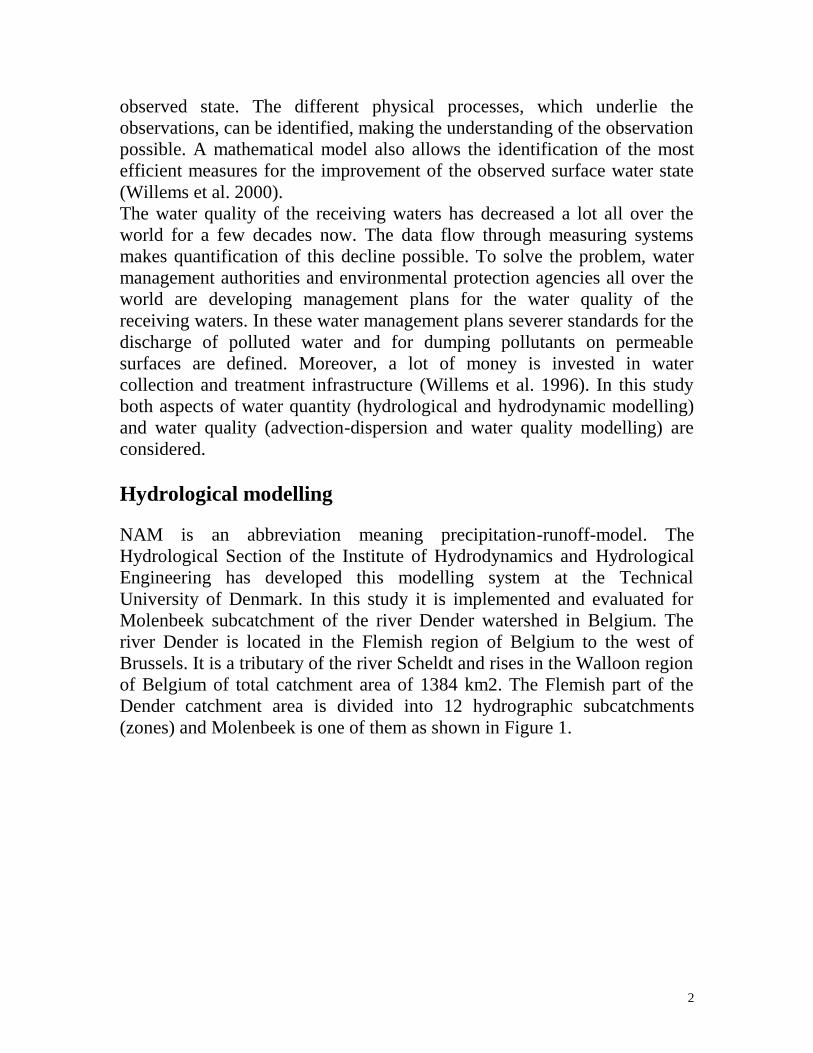
After calibration, model validation of overall agreement of hydrograph
shape is done by directly comparing the simulated and measured time series
(Figure 2).
1-11-1992 6-11-1992 11-11-1992 16-11-1992 21-11-1992 26-11-1992 1-12-1992 6-12-1992 11-12-1992 16-12-1992 21-12-199226-12-1992 31-12-1992
0.0
1.0
2.0
3.0
4.0
5.0
6.0
7.0
8.0
[m^3/s] Time series of Discharge (NAM20_four-years.RES11) Discharge
RunOff, 431, 40.500 RunOff
measures20
Figure 2. Comparison between measured and simulated discharge series
(for a validation period in 1992).

5
Hydrodynamic modelling
The MIKE 11 hydrodynamic module is a modelling system for the
hydrodynamical computation of unsteady flows in rivers by solving the
basic hydrodynamic equations in an implicit finite difference scheme (DHI,
1993). The system has been used in numerous engineering studies around
the world. For the Molenbeek case study, a full hydrodynamic MIKE 11
model was implemented.
Model Implementation: The total length of the Molenbeek brook is
23043m. For the first 5650m no detailed data about cross-sections and
hydraulic structures are available, but for the next 17393m, detailed data
about cross sections and all significant hydraulic structures are available.
There are 440 cross sections inserted along a distance of 17393m. In this
way, the variation in channel shape along the model branches can be
described adequately. In total 16 bridges, 16 weirs, 6 culverts and 6 control
structures over a distance of 17.393 km are considered. The 6 control
structures are present at different locations along the brook to regulate water
levels to prevent areas from flooding problems. Those control structures
were also modelled. For the first 5 structures, this could be done easily by
regulating the constant upstream water levels. But for one weir (structure
no.6), the regulation was more complex. The crest level of the structure was
regulated on the basis of both up-and downstream water levels. Regulation
priorities between upstream and downstream are given below. The highest
priority is given last:
(1) For normal conditions, upstream water level should be regulated at
18.9m
(2) If ( h upstream < 21.5m ) and ( h downstream < 19.15m ) are true, then
downstream water level should be regulated at 19.03m
(3) Downstream water level should be less than 19.15m ( h downstream <
19.15m )
(4) Upstream water level should be less than 21.5m ( h upstream < 21.5m
)
These regulations for control structure no. 6 are working as follows: for
normal conditions the water level upstream is regulated at 18.9m. Once the
water level is increasing up to 19.03m (the first critical level), crest level
should be increased to maintain downstream regulation (to avoid
downstream flooding). Whenever the discharge is increasing more, the crest
level is increasing to have a downstream level less than 19.15m. If the

6
upstream water level increases up to 21.5m and the downstream level is still
lower than 19.15m, there is no problem. But once the upstream level reaches
21.5m (the critical level for upstream flooding), the priority regulation is
switched to the upstream level to avoid upstream areas to be flooded by
decreasing the crest level of the structure.
Model simulation
Simulations are performed for this detailed model. In the calculation, a
distance between computational grid points of 500m is used, and hourly
averaged rainfall-runoff input discharges are considered. Due to the very
detailed description, a long calculation time is needed: 25 min. on a Pentium
processor with 130 MHz speed and 32 Mbyte RAM to simulate 1 day
(hydrodynamically).
Model simplification
Due to the big calculation time of the detailed model and difficulties to run
the simulation for long periods, also a simplified model has been developed
for the Molenbeek brook. The simplification has been achieved by
eliminating a large number of cross-sections and by grouping the hydraulic
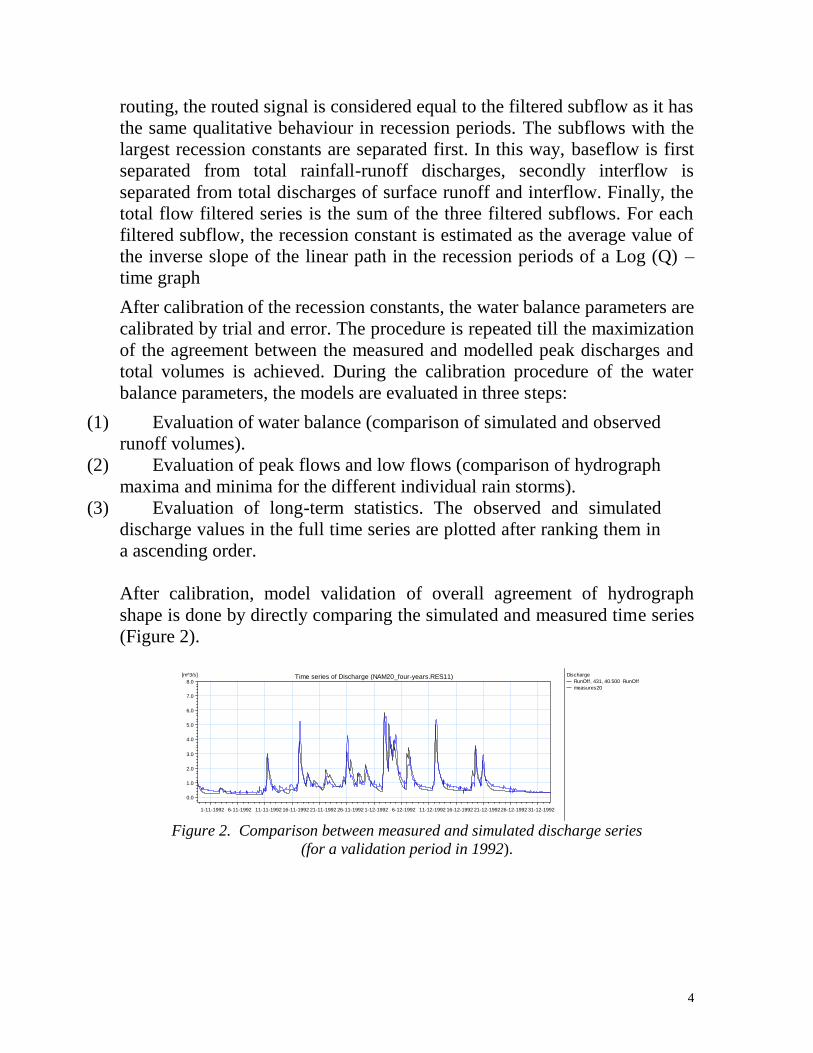
structures. The calibration of the simplified model to the detailed one is done
by comparing the Q-H relationships up stream of each group (Figure 3). For
group 3, the results are presented in Figure 4. Also at the discharge
measuring station (Mere station) a comparison with the measured Q-H
relationship is performed (Figure 5).
7
Structure locations along Molenbeek
10000 11000 12000 13000 14000 15000 16000 17000
Distance (m)
Culverts
Bridges
Control structures
Group 1 Group 2 Group 3 Group 4
Locations where Q-h
relationship is checked
Figure 3 Structure locations along Molenbeek brook
Figure 4 Comparison of the Q-H relationship up stream of structure group 3
Q-h relationship
up-stream group 3
0
0.5
1
1.5
2
2.5
3
3.5
0 2 4 6 8 10 12Discharge Q (m3/s)
Wat
er d
epth
h (m
)
Detailed model
Simplified model
8
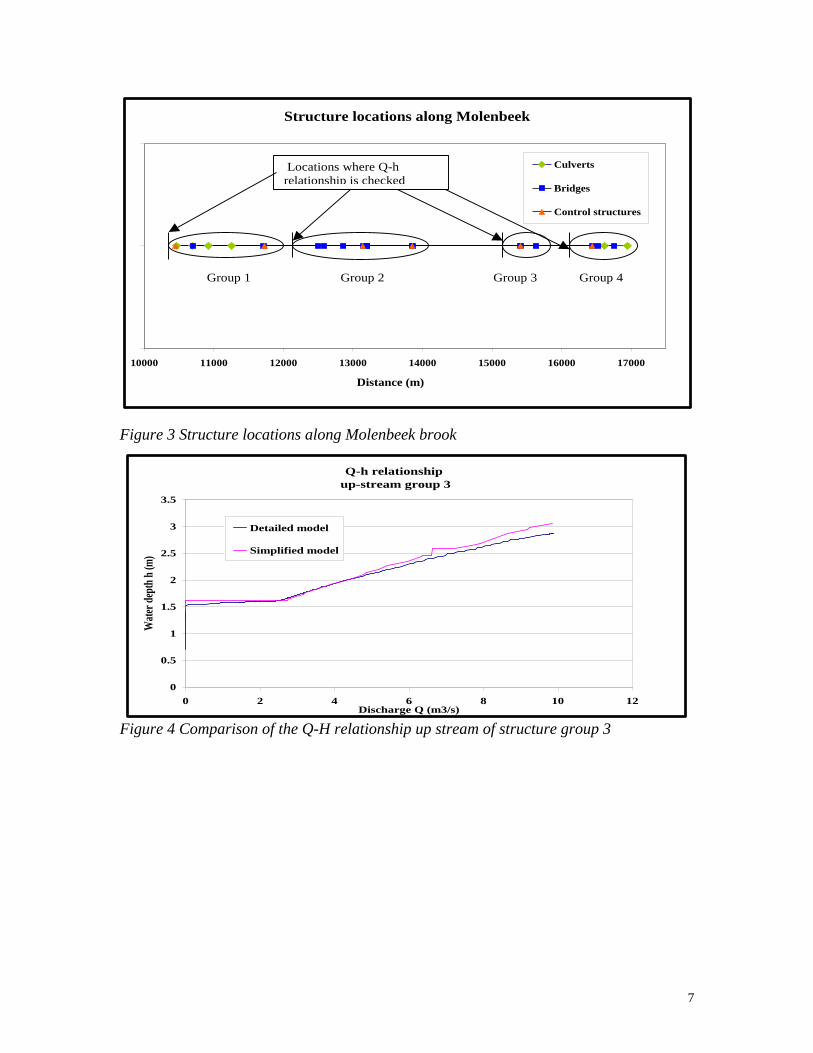
Figure 5 Comparison of Q-H relationship at Mere station
The comparison of the simulation results and the measured Q-h relationship
at Mere station show that the dynamics of the system are well represented at
lower discharge values (< 2 m3/s) but with higher discharge values (>2m
3/s)
it is underestimated. This is might be explained by some missing data (e.g.
culvert under a big highway, local narrowing of the brook) downstream of
Mere station. Additional data, which will become available later, and a
parallel modelling application with a comparable model (implementation of
the ISIS modelling package, HR Wallingford) by a consulting agency in
charge of the Flemish authority AMINAL will make this more clear.
Water quality modelling
With the increase in water consumption to satisfy the different demands, the
quantities of waste waters to be disposed are increasing rapidly. The
continued release of the waste waters has had serious impact on the water
quality of the river. Concentrations of dissolved oxygen (DO), biochemical
oxygen demand (BOD), ammonium (NH4) and nitrate (NO3) are calculated
in MIKE 11 by taking into consideration advection, dispersion and the most
important biological, chemical and physical processes.
Q-h relationship at Mere station
0
0.5
1
1.5
2
2.5
3
0 1 2 3 4 5 6 7 8
Discharge Q (m3/s)
Wat
er d
epth
h (
m)
Measurements
Detailed model
Simplified model

9
Sources of pollution
Along the Molenbeek brook, the major sources of pollution are agricultural
drainage, industrial and domestic waste water.
Agricultural leaching pollution
Agricultural activities in the catchment are about 76 % of the total area. To
estimate nitrate leaching, a DRAINMOD-N (Brevé et al., 1997) model is
used.
The DRAINMOD (Skaggs, 1997) model is used to simulate the performance
of drainage and related water table management systems. DRAINMOD-N is
an add module to DRAINMOD for simulating the nitrogen dynamics in
artificially drained soils. Nitrate-nitrogen (NO3-N) is the main N considered.
The model is a quasi two-dimensional model because the nitrogen
movement component considers only vertical transport in the unsaturated
zone and both vertical and lateral transport in the saturated zone. The
controlling processes considered by the model are rainfall deposition,
fertiliser dissolution, net mineralisation of organic nitrogen, denitrifcation,
plant uptake, and surface runoff and subsurface drainage losses. A detailed
description of each functional relationship and a model application in the
Netherlands and Flanders is given by El-Sadek et al. (1999&2000).
The climates, soil, crop and crop management data, required as input for the
water and nitrate transport modelling, were collected. The distribution over
the catchment of the model input and simulation results were presented
graphically using GIS (El-Sadek et al. 2000). Combination of soil type and
the main agricultural land units resulted in 32 scenarios, being the result of
eight soil types and four main field crops. The soil-land use map was
overlaid by the parcel map and for each parcel the climate, soil, crop
conditions and nitrogen application depth were determined and used as input
for DRAINMOD model. The leaching period from 1 January 1990 to 31
December 1993 (0 < t < 1461 day) was simulated using the measured NO3-
N concentrations on 16 December 1989 as initial condition (El-Sadek et al.
2000). The simulation results are used as input for Mike11.
Industrial wastewater
The industrial wastes are considered as one of the main sources of water
pollution, because of their toxic chemicals and organic loading. In the

10
studied catchment there is one factory located at 10.990 km. The pollution
load for different water quality parameters was estimated on the basis of
measurements of the Flemish Environmental Agency.
Domestic wastewater
Along the Molenbeek brook there are 21 sewerage outlet pipes which
receive domestic wastes. For each point the total number of population
discharging to it is calculated and then the concentration of rough effluent
was evaluated by assuming concentrations of BOD and ammonia equal to 54
and 10 g/capita day
Simulation results
Figure 7 Simulated NO3-N concentrations against measurements
Nitrate (NO3-N) concentrations
0
2
4
6
8
10
12
14
16
0 5000 10000 15000 20000 25000
Number of hours
NO
3 co
nce
ntr
atio
n m
g/l
Measured
Simulated
11
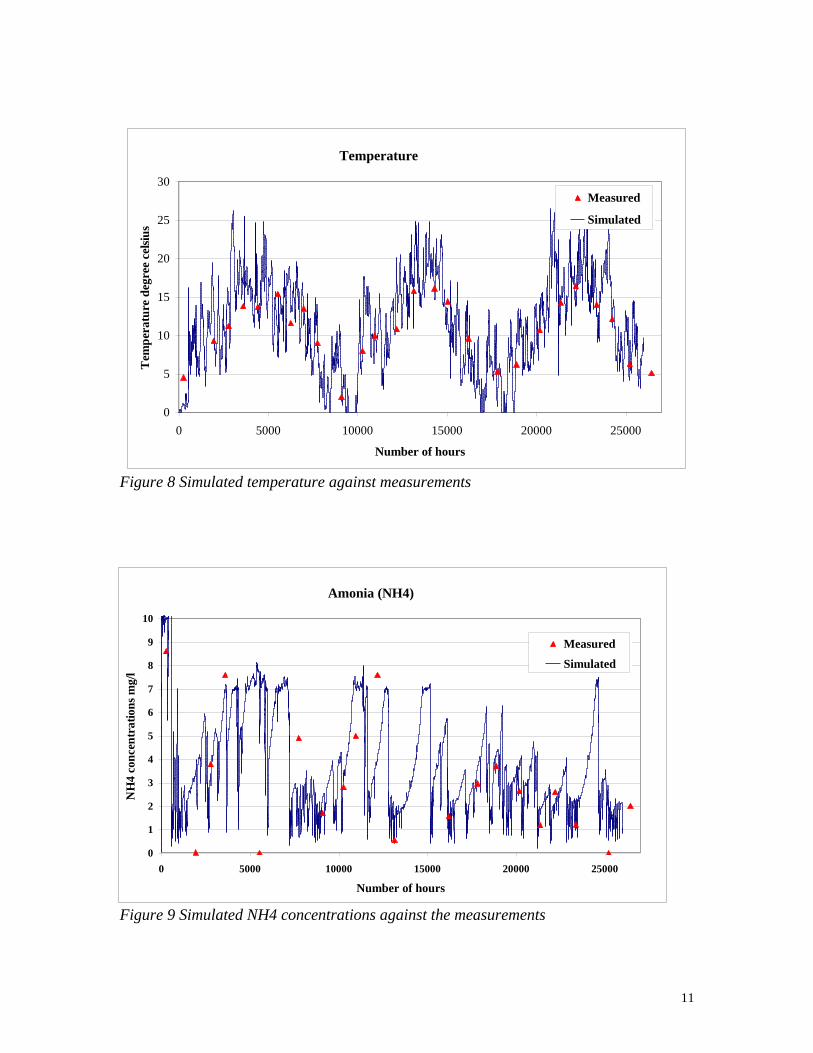
Figure 8 Simulated temperature against measurements
Figure 9 Simulated NH4 concentrations against the measurements
Amonia (NH4)
0
1
2
3
4
5
6
7
8
9
10
0 5000 10000 15000 20000 25000
Number of hours
NH
4 c
on
cen
tra
tion
s m
g/l
Measured
Simulated
Temperature
0
5
10
15
20
25
30
0 5000 10000 15000 20000 25000
Number of hours
Tem
per
atu
re d
egre
e ce
lsiu
s
Measured
Simulated

12
Figure 10 Simulated DO concentrations against measurements
The model was simulated over a period of four years. Observed flows, rain
and temperature data for the period 1990 to 1993 were hereby used. The
calculations were performed on an hourly basis. From the simulation results,
it can be seen that the general performance of the model was satisfactory
Conclusion
Molenbeek is one of the main tributaries of the River Dender basin
(Belgium). A hydraulic model is implemented by using the MIKE 11
software of the Danish Hydraulic Institute (DHI). It is a very detailed
physically-based model: measured cross-sections are inserted at least every
40m and all significant structures (bridges, weirs, culverts and control
structures) are considered. The detailed model was also simplified to
overcome the difficulties of running the model with higher time step
(because of numerical instability problems). The simplified model is
calibrated to the detailed one to make sure that it has comparable
performance accuracy. In this way, also an accurate and fast model for
Molenbeek brook is implemented. The hydrodynamic model is linked with a
hydrological model, which was calibrated and validated in a step-wise way.
In addition, water quality modules (advection-dispersion and water quality)
are applied to the river. Therefore, it was important to study the activities
(agricultural, domestic, and industrial) that influence the river water and
Dissolved oxygen (DO)
0
5
10
15
20
25
0 5000 10000 15000 20000 25000
Number of hours
DO
con
cen
tra
tio
n m
g/l
Measured
Simulated

13
their quality. The model was calibrated on the basis of available measured
flow and water quality data. The comparison between simulation results and
measurements show that the general performance of the implemented
hydrological, hydrodynamic and water quality models for Molenbeek brook
is satisfactory. Therefore, it can be concluded that surface water quantity and
quality can be simulated in an accurate way to be a good basis for decisions
regarding the development and management of the brook.
Acknowledgements
The authors would like to thank the Flemish authority for land and water
AMINAL for the data (cross-sections, structure geometry, limnigraphic
data) they have made available for the university project about the
evaluation of modelling techniques for the lumped hydrological modelling
of Flemish subcatchments. Also the Flemish consulting agency IMDC is
acknowledged for their expertise about the Molenbeek case-study.
References
Breve, M., Skaggs, R., Kandil, H., Parsons, J., and Gilliam, J., 1992.
DRAINMOD-N, a nitrogen model for artificially drained soils.
Proceedings of the Sixth International Drainage Symposium, ASAE, St.
Joseph, MI 49085-9659, 327-344.
Breve, M., Skaggs, R., Kandil, H., Parsons, J., and Gilliam, J., 1997.
DRAINMOD-N, a nitrogen model for artificially drained soils. Trans.
ASAE, 40 (4), 1067-1075.
Danish Hydraulic Institute (DHI), 1993. MIKE11, A microcomputer-based
modelling system for rivers and channels, User & reference manual,
Version 3.1, DHI, Horsholm, Denmark.
Devantier, B.A. & Felman, A.D 1993. Review of GIS application in
hydrological modelling. Journal of Water Research Planning and
Management 2,119.
El-sadek, A., De vos, J., Ducheyne, S., and Feyen, J., 1999. Analysis of the
nitrate leaching to surface waters using a simplified and detailed model
approach. Proceeding of the Int. Workshop on Modelling transport
processes in soils, EurAgEng's IG on Soil and Water, Leuven, Belgium,
24-26 Nov., 569-579.
El-sadek, A., Willems, P., Christiaens, K., Casteels, C., Ducheyne, S., and
Feyen, F., 2000 Modeling of the nitrogen balance at regional scale using a
quasi- two dimensional mechanistic model in combination with GIS.

14
Accepted for the Micro 2000 Congress, 22-27 October, Cape Town,
South Africa
Jones, J., 1997. Global hydrology, Addison Wesley Longman Limited,
England
Nathan, R. & McMahon, T., 1990. Evaluation of automated techniques for
base flow and recession analyses, Water Resources Research, Vol. 26
No. 7, p. 1465-1473.
Nienhuis, P., Leuven, R. and Ragas, A. 1998. New concepts for sustainable
management of river basins, Leiden, The Netherlands.
Radwan, M. Willems, P. and Berlamont, J. 1999. Rainfall-runoff modelling
as part of integrated watershed management, International Workshop on
Modelling transport processes in soils, EurAgEng's IG on Soil and Water,
Leuven, Belgium, 24-26 Nov., p. 755-764.
Refsgaard, J. & Knudsen,J., 1996. Operational validation and
intercomparison of different to get rid of these random fluctuation types
of hydrological models, Water Resources Research Vol. 32, No. 7, p.
2189-2202.
Skaggs, R.W., 1997. Methods for design and evaluation of drainage water
management systems for soils with high water tables, DRAINMOD.
North Carolina State University, Raleigh, North Carolina, USA.
Viessman, Jr. & G. Lewis, 1996. Introduction to hydrology, Fourth edition,
Harper Collins College Publishers, New York, NY 10022, USA.
Voet M., 1991. Frequency analysis of high water discharges in the
liminigraphic network of the Flemish Authority for land and water (in
dutch). Report, Ministry of the Flemish Community, Flemish Authority
for Land Management (Vlaamse Landmaatschappij), 138p.
Willems, P., Huysentruyt, H., and Berlamont, J., 1996. A water quality
model as a management tool, Proceedings WEF conference on Urban
Wet Weather Pollution, Quebec.
Willems, P., 1999. Probabilistic lumped conceptual modelling of rainfall-
runoff from watersheds, Report, hydraulics laboratory, Katholieke
Universitiet Leuven, Belgium.
Willems, P., 1999. Transparent physically-based calibration and optimal
case-specific construction of a lumped conceptual rainfall-runoff model
for watersheds, submitted to Water Resources Research.
Willems, P., Looveren, R., Sas, M., Boglitti, C., and Berlamont, J., 2000
Practical comparison of the modelling systems MIKE 11 and ISIS for
hydrodynamic modelling in the Flemish river Dijle catchment, submitted
to hydroinformatics 2000, Iowa.