Integrated Backscatter Intravascular...
14
3 Integrated Backscatter Intravascular Ultrasound Masanori Kawasaki Department of Cardiology, Gifu University Graduate School of Medicine Japan 1. Introduction About 30 years ago, a pathological study by Horie et al. demonstrated that plaque rupture into the lumen of a coronary artery may precede and cause thrombus formation leading to acute myocardial infarction (Horie et al., 1978). In an angioscopic study, Mizuno et al. demonstrated that disruption or erosion of vulnerable plaques and subsequent thromboses are the most frequent cause of acute coronary syndrome (Mizuno et al., 1992). The stability of atherosclerotic plaques is related to the histological composition of plaques and the thickness of fibrous caps. Therefore, recognition of the tissue characteristics of coronary plaques is important to understand and prevent acute coronary syndrome. Accurate identification of the tissue characteristics of coronary plaques in vivo may allow the identification of vulnerable plaques before the development of acute coronary syndrome. In the 1990’s, a new technique was developed that could characterize myocardial tissues by integrated backscatter (IB) analysis of ultrasound images. This technique is capable of providing both conventional two-dimensional echocardiographic images and IB images. Ultrasound backscatter power is proportional to the difference of acoustic characteristic impedance that is determined by the density of tissue multiplied by the speed of sound. In studies of the myocardium, calibrated myocardial IB values were significantly correlated with the relative volume of interstitial fibrosis (Picano, 1990 et al.; Naito et al., 1996). In preliminary studies in vitro, IB values reflected the structural and biochemical composition of atherosclerotic lesion and could differentiate fibrofatty, fatty and calcification of arterial walls (Barziliai et al., 1987; Urbani et al., 1993; Picano et al., 1988). It was also reported that anisotropy of the direction and backscatter power is related to plaque type (De Kroon et al., 1991). Takiuchi et al. found that quantitative tissue characterization using IB ultrasound could identify lipid pool and fibrosis in human carotid and/or femoral arteries (Takiuchi et al., 2000). However, these studies were done ex vivo and different plaque types were measured in only a few local lesions. In the early 2000s, it was reported that IB values measured in vivo in human carotid arteries correlated well with postmortem histological classification (Kawasaki et al., 2001). This new non-invasive technique using IB values could characterize the two- dimensional structures of arterial plaques in vivo. With this technique, plaque tissues were classified based on histopathology into 6 types, i.e. intraplaque hemorrhage, lipid pool, intimal hyperplasia, fibrosis, dense fibrosis, and calcification. This technique was applied in the clinical setting to predict cerebral ischemic lesions after carotid artery stenting. From the analysis of receiver operating characteristic (ROC) curves, a relative intraplaque hemorrhage + lipid pool area of 50% measured by IB ultrasound imaging was the most reliable cutoff value www.intechopen.com
Transcript of Integrated Backscatter Intravascular...
3
Integrated Backscatter Intravascular Ultrasound
Masanori Kawasaki Department of Cardiology,
Gifu University Graduate School of Medicine Japan
1. Introduction
About 30 years ago, a pathological study by Horie et al. demonstrated that plaque rupture into the lumen of a coronary artery may precede and cause thrombus formation leading to acute myocardial infarction (Horie et al., 1978). In an angioscopic study, Mizuno et al. demonstrated that disruption or erosion of vulnerable plaques and subsequent thromboses are the most frequent cause of acute coronary syndrome (Mizuno et al., 1992). The stability of atherosclerotic plaques is related to the histological composition of plaques and the thickness of fibrous caps. Therefore, recognition of the tissue characteristics of coronary plaques is important to understand and prevent acute coronary syndrome. Accurate identification of the tissue characteristics of coronary plaques in vivo may allow the identification of vulnerable plaques before the development of acute coronary syndrome. In the 1990’s, a new technique was developed that could characterize myocardial tissues by integrated backscatter (IB) analysis of ultrasound images. This technique is capable of providing both conventional two-dimensional echocardiographic images and IB images. Ultrasound backscatter power is proportional to the difference of acoustic characteristic impedance that is determined by the density of tissue multiplied by the speed of sound. In studies of the myocardium, calibrated myocardial IB values were significantly correlated with the relative volume of interstitial fibrosis (Picano, 1990 et al.; Naito et al., 1996). In preliminary studies in vitro, IB values reflected the structural and biochemical composition of atherosclerotic lesion and could differentiate fibrofatty, fatty and calcification of arterial walls (Barziliai et al., 1987; Urbani et al., 1993; Picano et al., 1988). It was also reported that anisotropy of the direction and backscatter power is related to plaque type (De Kroon et al., 1991). Takiuchi et al. found that quantitative tissue characterization using IB ultrasound could identify lipid pool and fibrosis in human carotid and/or femoral arteries (Takiuchi et al., 2000). However, these studies were done ex vivo and different plaque types were measured in only a few local lesions. In the early 2000s, it was reported that IB values measured in vivo in human carotid arteries correlated well with postmortem histological classification (Kawasaki et al., 2001). This new non-invasive technique using IB values could characterize the two-dimensional structures of arterial plaques in vivo. With this technique, plaque tissues were classified based on histopathology into 6 types, i.e. intraplaque hemorrhage, lipid pool, intimal hyperplasia, fibrosis, dense fibrosis, and calcification. This technique was applied in the clinical setting to predict cerebral ischemic lesions after carotid artery stenting. From the analysis of receiver operating characteristic (ROC) curves, a relative intraplaque hemorrhage + lipid pool area of 50% measured by IB ultrasound imaging was the most reliable cutoff value
www.intechopen.com
Intravascular Ultrasound
42
for predicting cerebral ischemic lesions evaluated by diffusion-weighted magnetic resonance imaging after carotid artery stenting (Yamada et al., 2010). Since it was difficult to differentiate lipid pool from intimal hyperplasia using IB values, the anatomical features of the lesion were used for this purpose. Because lipid pool is generally located under a fibrous cap, a region of interest (ROI) that was either lipid pool or intimal hyperplasia was classified as lipid pool only when that region was located underneath a ROI with fibrosis. Intimal hyperplasia was identified when a ROI that was either lipid pool or intimal hyperplasia was not covered by a fibrous cap. Most of these two lesion types could be differentiated using this method.
2. IB-IVUS equipment and data acquisition
In the next generation, this ultrasound IB technique was applied to coronary arteries by use of intravascular ultrasound (IVUS) (Kawasaki et al., 2002). A personal computer (Windows XP Professional, CPU: 3.4 GHz) equipped with newly developed custom software was connected to an IVUS imaging system (VISIWAVE, Terumo, Japan) to obtain the radio frequency signal, signal trigger and video image outputs. An analog-to-digital converter digitized the signals at 400 MHz with 8-bit resolution, and the digitized data were stored on the hard drive of the PC for later analysis. In the IVUS analysis, 512 vector lines of ultrasound signal around the circumference were analyzed to calculate the IB values. The IB values for each tissue component were calculated using a fast Fourier transform, and expressed as the average power, measured in decibels (dB), of the frequency component of the backscattered signal from a small volume of tissue. Ultrasound backscattered signals were acquired using a 38 or 43 MHz mechanically-rotating IVUS catheter (ViewIT, Terumo, Tokyo, Japan), digitized and subjected to spectral analysis. The tissue IB values were calibrated by subtracting the IB values from the IB value of a stainless steel needle placed at a distance of 1.5 mm from the catheter. IB-IVUS color-coded maps were constructed based on the IB values by use of custom software written by our group. Conventional IVUS images and IB-IVUS color-coded maps were immediately displayed side-by-side on a monitor. Color-coded maps of the coronary arteries were finally constructed after excluding the vessel lumen and area outside of the external elastic membrane by manually tracing the vessel lumen and external elastic membrane on the conventional IVUS images. With a transducer frequency of 38 or 43 MHz, the wavelength was calculated as 36 or 41 µm, respectively, assuming a tissue sound speed of approximately 1,560 m/sec.
3. Correlation between IB-IVUS and histological images
To compare IB-IVUS images with histological images, coronary cross-sections obtained at autopsy were stained with hematoxylin-eosin, elastic van Gieson and Masson’s trichrome. In the training study, three pathologic subsets were identified in each ROI: lipid pool (extracellular lipid, macrophages, microcalcification and/or foam cells), fibrosis and calcification. Necrotic core that consisted of lipid pool, microcalcification and remnants of foam cells and/or dead lymphocytes were classified as lipid pool in the IB-IVUS analysis. In the validation study, coronary arterial cross-sections were classified into three categories: fibrocalcific, fibrous and lipid-rich. To evaluate overall ultrasound signal attenuation, IB values of the same lesions (n = 10)
were measured after moving the lesions 2.5 - 4.0 mm from the IVUS catheter. Including the
www.intechopen.com
Integrated Backscatter Intravascular Ultrasound
43
attenuation by flowing blood, an overall attenuation of 4.0 dB/mm was determined to be
the most appropriate, and this value was used to correct for ultrasound signal attenuation.
Therefore, when color-coded maps were constructed, each IB value was corrected by adding
4.0 dB/mm when the ROI was located 1.5 mm further away from the catheter and
subtracting 4.0 dB/mm when the ROI was located 1.5 mm closer to the catheter. Color-
coded maps consisted of four major components: fibrous (green), dense fibrosis (yellow),
lipid pool (blue), calcification (red).
The histological analysis of each ROI showed the presence of typical tissue components
including calcification (n = 41), fibrosis (n = 102) and lipid pool (n = 99). With the 38 MHz
ultrasound mode, the average IB values in each ROI of these tissue components were -7.3 ±
6.5, -27.0 ± 5.3 and -51.2 ± 3.3 dB, respectively; however, with the 43 MHz ultrasound mode,
the average IB values were -10.6 ± 6.1, -30.4 ± 4.9 and -54.0 ± 3.9 dB, respectively. The
differences among IB values of lipid pool, fibrosis or calcification were significant (p<0.001).
IB values were highest in calcification and lowest in lipid pool. There was no overlap
between the IB values of lipid pool and calcification. According to the analysis of ROC
curves, an IB value of ≤ -39 dB (area under curve = 0.98) was the most reliable cutoff point
for discriminating lipid pool (90% sensitivity, 92% specificity) and fibrosis (94% sensitivity,
93% specificity), and an IB value of > -17 dB (area under curve = 0.99) was the most reliable
cutoff point for discriminating calcification and fibrosis with the 38 MHz mode. An IB value
of ≤ -42 dB (area under curve = 0.98) was the most reliable cutoff point for discriminating
lipid pool and fibrosis and an IB value of > -20 dB (area under curve = 0.99) was the most
reliable cutoff point for discriminating calcification and fibrosis with the 43 MHz mode.
Based on the above cutoff points, two-dimensional color-coded maps of tissue
characteristics were constructed. A total of 95 cross-sections were diagnosed as fibrocalcific,
fibrous or lipid-rich by the IB-IVUS reader, who was blinded to the histological diagnoses.
There was no difference in the diagnosis of the images obtained using either the 38 MHz or
43 MHz ultrasound signal. The overall agreement between the classifications made by IB-
IVUS and histology (lipid-rich: n = 35, fibrous: n = 33 and fibrocalcific: n = 27) was excellent
(Cohen’s κ = 0.83, 95% CI: 0.73 - 0.92).
4. Comparison between IB-IVUS and virtual hostology IVUS
Virtual histology IVUS (Virtual Histology Version 1.4, Volcano Corp., CA, USA) images were acquired by a VH-IVUS console with a 20 MHz phased-array catheter and stored on CD-ROM for offline analysis. To clarify the rotational and cross-sectional position of the included segment, multiple surgical needles were carefully inserted into the coronary arteries before IB-IVUS and VH-IVUS imaging to serve as reference points to compare the two imaging modalities. In qualitative comparison, small (0.3mm x 0.3mm) region-of-interest (ROI)s were set on the
same sites of histological and IVUS images. In quantitative comparison, histological images
from cross-sections that were stained with Masson’s trichrome were digitized, and the areas
that were stained blue were automatically selected by a multipurpose image processor
(LUZEX F, Nireco Co., Tokyo, Japan). Then the relative fibrous area (fibrous area / plaque
area) was automatically calculated by the LUZEX F system.
In the direct qualitative comparison, the overall agreement between the histological and IB-IVUS diagnoses was higher (Cohen’s κ = 0.81, 95% CI: 0.74-0.90) than between the
www.intechopen.com
Intravascular Ultrasound
44
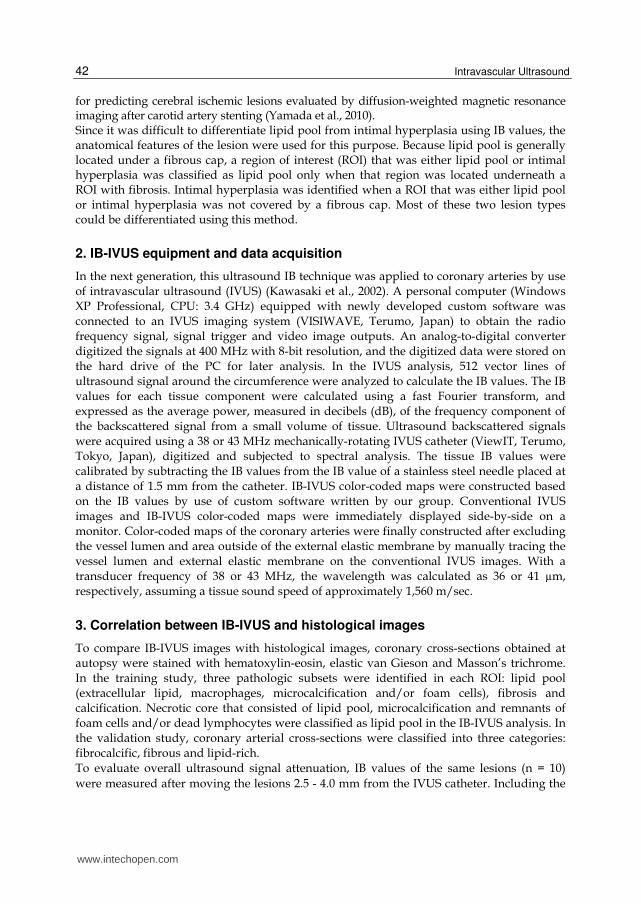
histological and VH-IVUS diagnoses (Cohen’s κ = 0.30, 95% CI: 0.14-0.41) (Okubo et al., 2008 (a); Okubo et al., 2008 (b)). In the direct quantitative comparison, the % fibrosis area determined by IB-IVUS was significantly correlated with the relative area of fibrosis based on histology (r=0.67, p<0.001), whereas the % fibrous area and % fibrous area + % fibro-fatty area determined by VH-IVUS were not correlated with the relative area of fibrosis based on histology (Figure 1) (Okubo et al., 2008).
Fig. 1. Representative lesion used in the direct comparison study. A: histological images
stained with Masson’s trichrome. Bar = 1 mm. B: Images after quantification by the image
processor. Areas that were stained blue by Masson’s trichrome were automatically selected
(green area) by the multipurpose image processor (LUZEX F) and the relative fibrous area
(fibrous area / plaque area) was automatically calculated by the system. C: IB-IVUS images
corresponding to sections analyzed by histology. D: IVUS-VH images corresponding to
sections analyzed by histology. Percentages indicate the relative fibrous areas determined
by each method.
5. Comparison of the thickness of the fibrous cap measured by IB-IVUS and optical coherence tomography in vivo
During routine selective percutaneous coronary intervention in 42 consecutive patients, a total of 28 cross-sections that consisted of lipid overlaid by a fibrous cap were imaged by both IVUS and optical coherence tomography in 24 patients with stable angina pectoris. A 0.016-inch optical coherence tomography catheter (Imagewire, LightLab Imaging, Inc.,
www.intechopen.com
Integrated Backscatter Intravascular Ultrasound
45
Westford, MA) was advanced into the coronary arteries. IB-IVUS and optical coherence tomography (M2 OCT Imaging system, LightLab Imaging, Inc., Westford, MA) were performed in each patient at the same site without significant stenosis as described below. IB-IVUS images were obtained every one second using an automatic pullback device at a rate of 0.5 mm/sec. optical coherence tomography images were obtained using an automatic pullback system at a rate of 0.5 mm/sec. IB-IVUS images were obtained at 0.5 mm intervals, whereas optical coherence tomography images were obtained at 0.03 mm intervals. Therefore, the segments of coronary artery to compare between the two methods were selected based on the IB-IVUS images. Then, these same coronary segments were identified in optical coherence tomography using the distance from easily-definable side branches and calcification as reference markers to ensure that IB-IVUS and optical coherence tomography were compared at the same site. The cross-sections that did not have sufficient imaging quality to analyze tissue characteristics were excluded from the comparison. In the IB-IVUS analysis, images were processed by a smoothing method that averaged nine IB values in nine pixels located in a square field of the color-coded maps to reduce uneven surfaces of tissue components produced by signal noise.
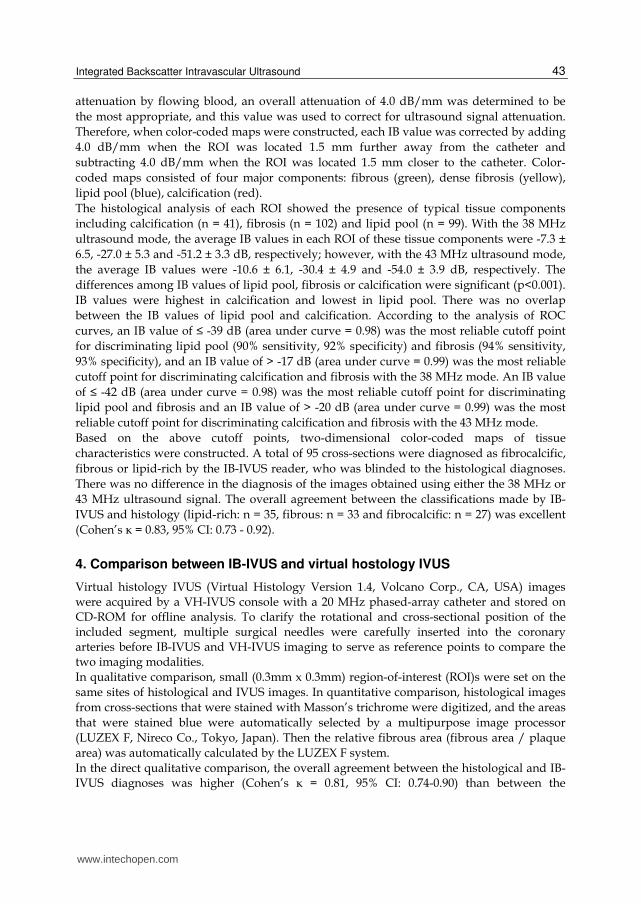
Fig. 2. The same coronary segments were selected for imaging using the distance from easily-identifiable side branches and calcification as reference markers to ensure that integrated backscatter intravascular ultrasound (IB-IVUS) and optical coherence tomography (OCT) were compared at the same site. (A) Conventional IVUS image. (B) Corresponding OCT image. (C) IB-IVUS image. (D) Corresponding OCT image. (E) Fibrous caps that overlaid lipid pool were divided into regions-of-interest (ROIs) (every 10˚ from the center of the vessel) and the thickness of fibrous caps was measured as an average. The average thickness of fibrous cap was measured by averaging the thickness of fibrous cap every 2˚ within ROIs. *: septal branch.
www.intechopen.com
Intravascular Ultrasound
46
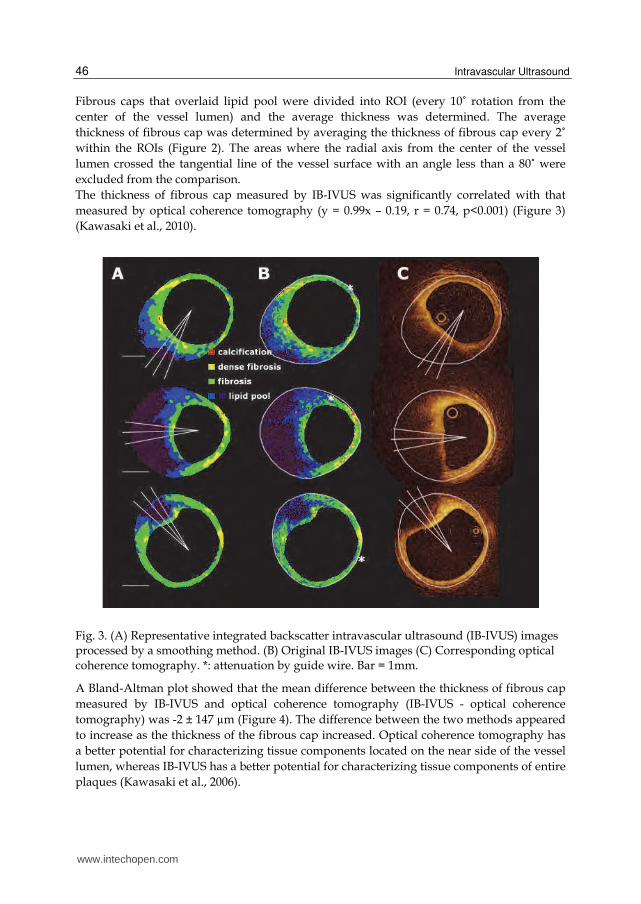
Fibrous caps that overlaid lipid pool were divided into ROI (every 10˚ rotation from the
center of the vessel lumen) and the average thickness was determined. The average
thickness of fibrous cap was determined by averaging the thickness of fibrous cap every 2˚
within the ROIs (Figure 2). The areas where the radial axis from the center of the vessel
lumen crossed the tangential line of the vessel surface with an angle less than a 80˚ were
excluded from the comparison.
The thickness of fibrous cap measured by IB-IVUS was significantly correlated with that
measured by optical coherence tomography (y = 0.99x – 0.19, r = 0.74, p<0.001) (Figure 3)
(Kawasaki et al., 2010).
Fig. 3. (A) Representative integrated backscatter intravascular ultrasound (IB-IVUS) images processed by a smoothing method. (B) Original IB-IVUS images (C) Corresponding optical coherence tomography. *: attenuation by guide wire. Bar = 1mm.
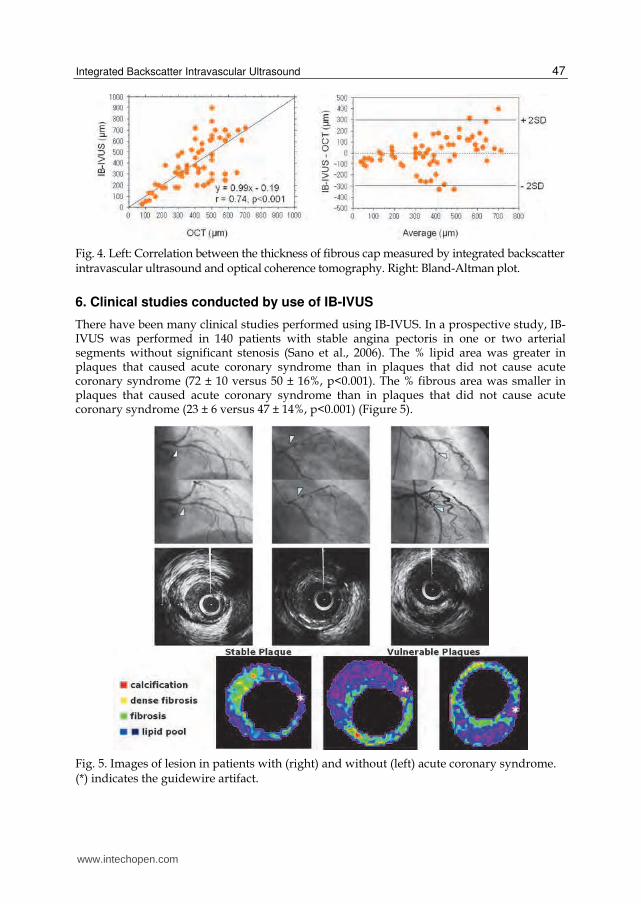
A Bland-Altman plot showed that the mean difference between the thickness of fibrous cap
measured by IB-IVUS and optical coherence tomography (IB-IVUS - optical coherence
tomography) was -2 ± 147 µm (Figure 4). The difference between the two methods appeared
to increase as the thickness of the fibrous cap increased. Optical coherence tomography has
a better potential for characterizing tissue components located on the near side of the vessel
lumen, whereas IB-IVUS has a better potential for characterizing tissue components of entire
plaques (Kawasaki et al., 2006).
www.intechopen.com
Integrated Backscatter Intravascular Ultrasound
47
Fig. 4. Left: Correlation between the thickness of fibrous cap measured by integrated backscatter intravascular ultrasound and optical coherence tomography. Right: Bland-Altman plot.
6. Clinical studies conducted by use of IB-IVUS
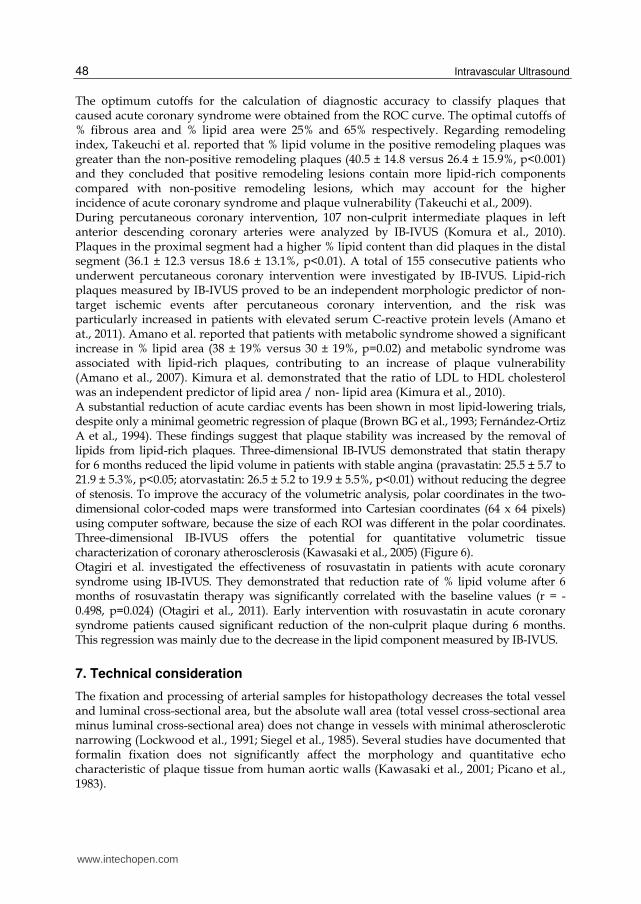
There have been many clinical studies performed using IB-IVUS. In a prospective study, IB-IVUS was performed in 140 patients with stable angina pectoris in one or two arterial segments without significant stenosis (Sano et al., 2006). The % lipid area was greater in plaques that caused acute coronary syndrome than in plaques that did not cause acute coronary syndrome (72 ± 10 versus 50 ± 16%, p<0.001). The % fibrous area was smaller in plaques that caused acute coronary syndrome than in plaques that did not cause acute coronary syndrome (23 ± 6 versus 47 ± 14%, p<0.001) (Figure 5).
Fig. 5. Images of lesion in patients with (right) and without (left) acute coronary syndrome. (*) indicates the guidewire artifact.
www.intechopen.com
Intravascular Ultrasound
48
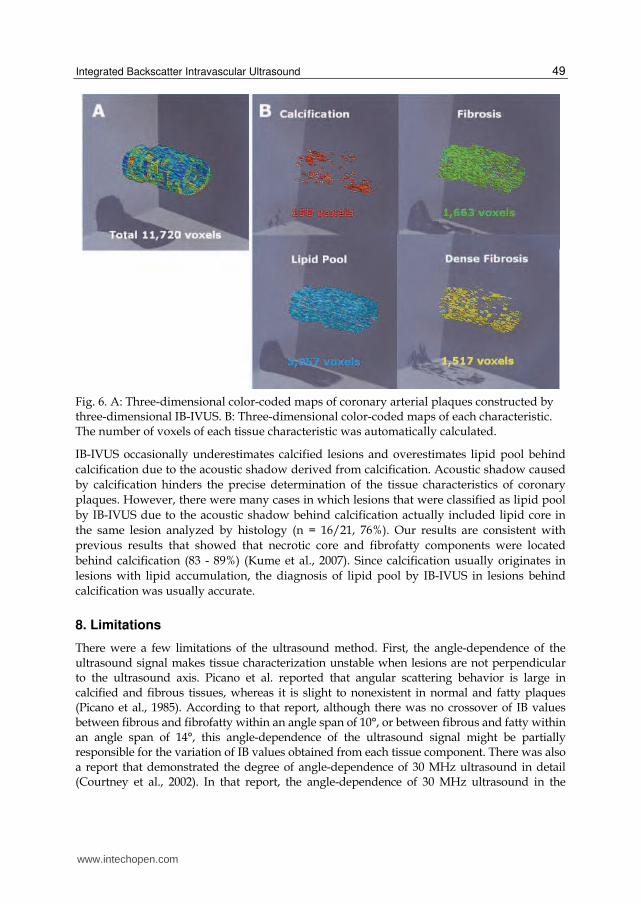
The optimum cutoffs for the calculation of diagnostic accuracy to classify plaques that caused acute coronary syndrome were obtained from the ROC curve. The optimal cutoffs of % fibrous area and % lipid area were 25% and 65% respectively. Regarding remodeling index, Takeuchi et al. reported that % lipid volume in the positive remodeling plaques was greater than the non-positive remodeling plaques (40.5 ± 14.8 versus 26.4 ± 15.9%, p<0.001) and they concluded that positive remodeling lesions contain more lipid-rich components compared with non-positive remodeling lesions, which may account for the higher incidence of acute coronary syndrome and plaque vulnerability (Takeuchi et al., 2009). During percutaneous coronary intervention, 107 non-culprit intermediate plaques in left anterior descending coronary arteries were analyzed by IB-IVUS (Komura et al., 2010). Plaques in the proximal segment had a higher % lipid content than did plaques in the distal segment (36.1 ± 12.3 versus 18.6 ± 13.1%, p<0.01). A total of 155 consecutive patients who underwent percutaneous coronary intervention were investigated by IB-IVUS. Lipid-rich plaques measured by IB-IVUS proved to be an independent morphologic predictor of non-target ischemic events after percutaneous coronary intervention, and the risk was particularly increased in patients with elevated serum C-reactive protein levels (Amano et at., 2011). Amano et al. reported that patients with metabolic syndrome showed a significant increase in % lipid area (38 ± 19% versus 30 ± 19%, p=0.02) and metabolic syndrome was associated with lipid-rich plaques, contributing to an increase of plaque vulnerability (Amano et al., 2007). Kimura et al. demonstrated that the ratio of LDL to HDL cholesterol was an independent predictor of lipid area / non- lipid area (Kimura et al., 2010). A substantial reduction of acute cardiac events has been shown in most lipid-lowering trials, despite only a minimal geometric regression of plaque (Brown BG et al., 1993; Fernández-Ortiz A et al., 1994). These findings suggest that plaque stability was increased by the removal of lipids from lipid-rich plaques. Three-dimensional IB-IVUS demonstrated that statin therapy for 6 months reduced the lipid volume in patients with stable angina (pravastatin: 25.5 ± 5.7 to 21.9 ± 5.3%, p<0.05; atorvastatin: 26.5 ± 5.2 to 19.9 ± 5.5%, p<0.01) without reducing the degree of stenosis. To improve the accuracy of the volumetric analysis, polar coordinates in the two-dimensional color-coded maps were transformed into Cartesian coordinates (64 x 64 pixels) using computer software, because the size of each ROI was different in the polar coordinates. Three-dimensional IB-IVUS offers the potential for quantitative volumetric tissue characterization of coronary atherosclerosis (Kawasaki et al., 2005) (Figure 6). Otagiri et al. investigated the effectiveness of rosuvastatin in patients with acute coronary syndrome using IB-IVUS. They demonstrated that reduction rate of % lipid volume after 6 months of rosuvastatin therapy was significantly correlated with the baseline values (r = -0.498, p=0.024) (Otagiri et al., 2011). Early intervention with rosuvastatin in acute coronary syndrome patients caused significant reduction of the non-culprit plaque during 6 months. This regression was mainly due to the decrease in the lipid component measured by IB-IVUS.
7. Technical consideration
The fixation and processing of arterial samples for histopathology decreases the total vessel and luminal cross-sectional area, but the absolute wall area (total vessel cross-sectional area minus luminal cross-sectional area) does not change in vessels with minimal atherosclerotic narrowing (Lockwood et al., 1991; Siegel et al., 1985). Several studies have documented that formalin fixation does not significantly affect the morphology and quantitative echo characteristic of plaque tissue from human aortic walls (Kawasaki et al., 2001; Picano et al., 1983).
www.intechopen.com
Integrated Backscatter Intravascular Ultrasound
49
Fig. 6. A: Three-dimensional color-coded maps of coronary arterial plaques constructed by three-dimensional IB-IVUS. B: Three-dimensional color-coded maps of each characteristic. The number of voxels of each tissue characteristic was automatically calculated.
IB-IVUS occasionally underestimates calcified lesions and overestimates lipid pool behind
calcification due to the acoustic shadow derived from calcification. Acoustic shadow caused
by calcification hinders the precise determination of the tissue characteristics of coronary
plaques. However, there were many cases in which lesions that were classified as lipid pool
by IB-IVUS due to the acoustic shadow behind calcification actually included lipid core in
the same lesion analyzed by histology (n = 16/21, 76%). Our results are consistent with
previous results that showed that necrotic core and fibrofatty components were located
behind calcification (83 - 89%) (Kume et al., 2007). Since calcification usually originates in
lesions with lipid accumulation, the diagnosis of lipid pool by IB-IVUS in lesions behind
calcification was usually accurate.
8. Limitations
There were a few limitations of the ultrasound method. First, the angle-dependence of the ultrasound signal makes tissue characterization unstable when lesions are not perpendicular to the ultrasound axis. Picano et al. reported that angular scattering behavior is large in calcified and fibrous tissues, whereas it is slight to nonexistent in normal and fatty plaques (Picano et al., 1985). According to that report, although there was no crossover of IB values between fibrous and fibrofatty within an angle span of 10°, or between fibrous and fatty within an angle span of 14°, this angle-dependence of the ultrasound signal might be partially responsible for the variation of IB values obtained from each tissue component. There was also a report that demonstrated the degree of angle-dependence of 30 MHz ultrasound in detail (Courtney et al., 2002). In that report, the angle-dependence of 30 MHz ultrasound in the
www.intechopen.com
Intravascular Ultrasound
50
arterial intima and media was 1.11dB/10°. When the 40 MHz catheter was used, the angle dependence increased in arterial tissue. This angle-dependence of the ultrasound signal may decrease the diagnostic accuracy for differentiating tissue components. Second, the guidewire was not used in the process of imaging because the present studies were performed ex vivo. Imaging artifacts in vivo due to the guidewire may decrease the diagnostic accuracy. However, removal of the guidewire during imaging after completing the intervention procedure and/or excluding the area behind calcification from the analysis may be necessary in the clinical setting to eliminate this problem. Finally, detecting thrombus from a single IVUS cross-section was not possible because we usually look at multiple IVUS images over time for speckling, scintillation, motion and blood flow in the “microchannel” (Mintz et al., 2001). The analysis of IB values in multiple cross-sections over time is required for the detection of thrombus.
9. References
Amano T, Matsubara T, Uetani T, Nanki M, Marui N, Kato M, Arai K, Yokoi K, Ando H, Ishii H, Izawa H, Murohara T. (2007). Impact of metabolic syndrome on tissue characteristics of angiographically mild to moderate coronary lesions integrated backscatter intravascular ultrasound study. J Am Coll Cardiol Vol 49:1149-56.
Amano T, Matsubara T, Uetani T, Kato M, Kato B, Yoshida T, Harada K, Kumagai S, Kunimura A, Shinbo Y, Ishii H, Murohara T. (2011). Lipid-rich plaques predict non-target-lesion ischemic events in patients undergoing percutaneous coronary intervention. Circ J Vol 75;157-66.
Barziliai B, Shffitz JE, Miller JG, Sobel BE. (1987). Quantitative ultrasonic characterization of the nature of atherosclerotic plaques in human aorta. Circ Res.Vol 60: 459-63.
Brown BG, Zhao XQ, Sacco DE, Albers JJ. (1993). Lipid lowering and plaque regression. New insights into prevention of plaque disruption and clinical events in coronary disease. Circulation. Vol 87:1781-91.
Courtney BK, Robertson AL, Maehara A, Luna J, Kitamura K, Morino Y, et al. (2002). Effect of transducer position on backscattered intensity in coronary arteries. Ultrasound in Med & Biol. Vol 28:81-91.
De Kroon MGM, van der Wal LF, Gussenhoven WJ, Rijsterborgh H, Bom N. (1991). Backscatter directivity and integrated backscatter power of arterial tissue. Int J Card Imaging.Vol 6:265-75.
Fernández-Ortiz A, Badimon JJ, Falk E, Fuster V, Meyer B, Mailhac A, Weng D, Shah PK, Badimon L. (1994). Characterization of the relative thrombogenecity of atherosclerotic plaque components: implications for consequences of plaque rapture. J Am Coll Cardiol Vol 23:1562-9.
Horie, T., Sekiguchi, M., Hirosawa, K. (1978). Coronary thrombosis in pathogenesis of acute myocardial infarction. Histopathological study of coronary arteries in 108 necropsied cases using serial section. Br Heart J Vol. 40:153-61.
Kawasaki M, Takatsu H, Noda T, Ito Y, Kunishima A, Arai M, Nishigaki K, Takemura G, Morita N, Minatoguchi S, Fujiwara H. (2001). Non-invasive tissue characterization of human atherosclerotic lesions in carotid and femoral arteries by ultrasound integrated backscatter. -Comparison between histology and integrated backscatter images before and after death- J Am Coll Cardiol. Vol 38:486-92
www.intechopen.com
Integrated Backscatter Intravascular Ultrasound
51
Kawasaki M, Takatsu H, Noda T, et al. (2002) In vivo quantitative tissue characterization of human coronary arterial plaques using integrated backscatter intravascular ultrasound and comparison with angioscopic findings. Circulation Vol 105:2487-92.
Kawasaki M, Sano K, Okubo M, Yokoyama H, Ito Y, Murata I, Tsuchiya K, Minatoguchi S, Zhou X, Fujita H, Fujiwara H. (2005). Volumetric quantitative analysis of tissue characteristics of coronary plaques after statin therapy using three dimensional integrated backscatter intravascular ultrasound. J Am Coll Cardiol Vol 45:1946-1953.
Kawasaki M, Bouma BE, Bressner J, Houser SL, Nadkarni SK, MacNeill BD, Jang IK, Fujiwara H, Tearney GJ. (2006). Diagnostic accuracy of optical coherence tomography and integrated backscatter intravascular ultrasound images for tissue characterization of human coronary plaques. J Am Coll Cardiol Vol 48:81-8.
Kawasaki M, Hattori A, Ishihara Y, Okubo M, Nishigaki K, Takemura G, Saio M, Takami T, Minatoguchi S. (2010). Tissue characterization of coronary plaques and assessment of thickness of fibrous cap using integrated backscatter intravascular ultrasound. Comparison with histology and optical coherence tomography. Circ J Vol 74:2641-48.
Kimura T, Itoh T, Fusazaki T, Matsui H, Sugawara S, Ogino Y, Endo H, Kobayashi K, Nakamura M. (2010). Low-density lipoprotein-cholesterol/high-density lipoprotein-cholesterol ratio predicts lipid-rich coronary plaque in patients with coronary artery disease--integrated-backscatter intravascular ultrasound study. Circ J Vol 74:1392-8.
Komura N, Hibi K, Kusama I, Otsuka F, Mitsuhashi T, Endo M, Iwahashi N, Okuda J, Tsukahara K, Kosuge M, Ebina T, Umemura S, Kimura K. (2010). Plaque location in the left anterior descending coronary artery and tissue characteristics in angina pectoris: an integrated backscatter intravascular ultrasound study. Circ J Vol 74: 142-7.
Kume T, Okura H, Kawamoto T, Akasaka T, Toyota E, Neishi Y, et al. (2007). Assessment of the histological characteristics of coronary arterial plaque with severe calcification. Circ J. Vol 71:643-7.
Lockwood GR, Ryan LK, Hunt JW, Foster FS. (1991). Measurement of the ultrasound properties of vascular tissue and blood from 35-65Mhz. Ultrasound Med Biol. Vol 17:653-66.
Mintz GS, Nissen SE, Anderson WD, Bailey SR, Erbel R, Fitzgerald PJ, et al. (2001). American College of Cardiology clinical expert consensus document on standards for acquisition, measurement and reporting of intravascular ultrasound studies (IVUS). A report of the American College of Cardiology task force on clinical expert consensus documents developed in collaboration with the European society of cardiology endorsed by the society of cardiac angiography and interventions. J Am Coll Cardiol. Vol 37:1478-92.
Mizuno K, Satomura K, Miyamoto A, Arakawa K, Shibuya T, Arai T, Kurita A, Nakamura H, Ambrose JA. (1992). Angioscopic evaluation of coronary artery thrombi in acute coronary syndromes. N Engl J Med Vol 326:287-91.
Naito J, Masuyama T, Mano T, Kondo H, Yamamoto K, Nagano R, Doi Y, Hori M, Kamada T. (1996). Ultrasound myocardial tissue characterization in the patients with dilated cardiomyopathy: Value in noninvasive assessment of myocardial fibrosis. Am Heart J. Vol 131:115-21.
Okubo M, Kawasaki M, Ishihara Y, Takeyama U, Kubota T, Yamaki T, Ojio S, Nishigaki K, Takemura G, Saio M, Takami T, Minatoguchi S, Fujiwara H. (2008). Development of
www.intechopen.com
Intravascular Ultrasound
52
integrated backscatter intravascular ultrasound for tissue characterization of coronary plaques. Ultrasound Med Biol. Vol 34:655-63. (a)
Okubo M, Kawasaki M, Ishihara Y, Takeyama U, Yasuda S, Kubota T, Tanaka S, Yamaki T, Ojio S, Nishigaki K, Takemura G, Saio M, Takami T, Fujiwara H, Minatoguchi S. (2008). Tissue characterization of coronary plaques: comparison of integrated backscatter intravascular ultrasound with virtual histology intravascular ultrasound. Circ J Vol 72:1631-9. (b)
Otagiri K, Tsutsui H, Kumazaki S, Miyashita Y, Aizawa K, Koshikawa M, Kasai H, Izawa A, Tomita T, Koyama J, Ikeda U. (2011). Early intervention with rosuvastatin decreases the lipid components of the plaque in acute coronary syndrome: analysis using integrated backscatter IVUS (ELAN study). Circ J Vol 75:633-41.
Picano E, Landini L, Distante A, Sarnelli R, Benassi A, L'Abbate A. (1983). Different degreed of atherosclerosis detected by backscattered ultrasound: An in vitro study on fixed human aortic walls. J Clin ultrasound. Vol 11:375-379.
Picano E, Landini L, Distante A, Salvadori M, Lattanzi F, Masini M, et al. (1985). Angle dependence of ultrasonic backscatter in arterial tissues: a study in vitro. Circulation.Vol 72:572-6.
Picano E, Landini L, Lattanzi F, Salvadori M, Benassi A, L’Abbate A. (1988). Time domain echo pattern evaluation from normal and atherosclerotic arterial walls: a study in vitro. Circulation. Vol 77:654-9.
Picano E, Pelosi G, Marzilli M, Lattanzi F, Benassi A, Landini L, L'Abbate A. (1990). In vivo quantitative ultrasonic evaluation of myocardial fibrosis in humans. Circulation. Vol 81:58-64.
Sano K, Kawasaki M, Ishihara Y, Okubo M, Tsuchiya K, Nishigaki K, Zhou X, Minatoguchi S, Fujita H, Fujiwara H. (2006). Assessment of vulnerable plaques causing acute coronary syndrome using integrated backscatter intravascular ultrasound. J Am Coll Cardiol Vol 47:734-41.
Siegel RJ, Swan K, Edwalds G, Fishbein MC. (1985). Limitations of postmorterm assessment of human coronary artery size and luminal narrowing: differential effects of tissue fixation and processing on vessel with different degrees of atherosclerosis. J Am Coll Cardiol. Vol 5:342-346
Takeuchi H, Morino Y, Matsukage T, Masuda N, Kawamura Y, Kasai S, Hashida T, Fujibayashi D, Tanabe T, Ikari Y. (2009). Impact of vascular remodeling on the coronary plaque compositions: an investigation with in vivo tissue characterization using integrated backscatter-intravascular ultrasound Atherosclerosis. Vol 202:476-8
Takiuchi S, Rakugi H, Honda K, Masuyama T, Hirata N, Ito H, Sugimoto K, Yanagitani Y, Moriguchi K, Okamura A, Higaki J, Ogihara T. (2000). Quantitative ultrasonic tissue characterization can identify high-risk atherosclerotic alteration in human carotid arteries. Circulation Vol 102:766-70.
Urbani MP, Picano E, Parenti G, Mazzarisi A, Fiori L, Paterni M, Pelosi G, Landini L. (1993). In vivo radiofrequency-based ultrasonic tissue characterization of the atherosclerotic plaque. Stroke. Vol 24:1507-12.
Yamada K, Kawasaki M, Yoshimura S, Enomoto Y, Asano T, Minatoguchi S, Iwama T. (2010). Prediction of silent ischemic lesions after carotid artery stenting using integrated backscatter ultrasound and magnetic resonance imaging. Atherosclerosis Vol 208:161-6
www.intechopen.com
Intravascular UltrasoundEdited by Dr. Yasuhiro Honda
ISBN 978-953-307-900-4Hard cover, 207 pagesPublisher InTechPublished online 01, February, 2012Published in print edition February, 2012
InTech EuropeUniversity Campus STeP Ri Slavka Krautzeka 83/A 51000 Rijeka, Croatia Phone: +385 (51) 770 447 Fax: +385 (51) 686 166www.intechopen.com
InTech ChinaUnit 405, Office Block, Hotel Equatorial Shanghai No.65, Yan An Road (West), Shanghai, 200040, China
Phone: +86-21-62489820 Fax: +86-21-62489821
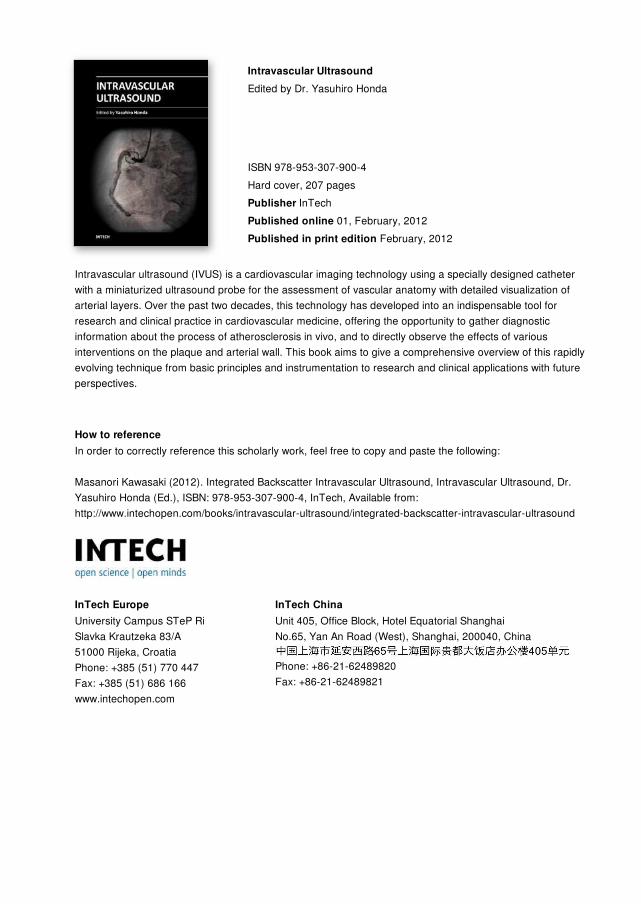
Intravascular ultrasound (IVUS) is a cardiovascular imaging technology using a specially designed catheterwith a miniaturized ultrasound probe for the assessment of vascular anatomy with detailed visualization ofarterial layers. Over the past two decades, this technology has developed into an indispensable tool forresearch and clinical practice in cardiovascular medicine, offering the opportunity to gather diagnosticinformation about the process of atherosclerosis in vivo, and to directly observe the effects of variousinterventions on the plaque and arterial wall. This book aims to give a comprehensive overview of this rapidlyevolving technique from basic principles and instrumentation to research and clinical applications with futureperspectives.
How to referenceIn order to correctly reference this scholarly work, feel free to copy and paste the following:
Masanori Kawasaki (2012). Integrated Backscatter Intravascular Ultrasound, Intravascular Ultrasound, Dr.Yasuhiro Honda (Ed.), ISBN: 978-953-307-900-4, InTech, Available from:http://www.intechopen.com/books/intravascular-ultrasound/integrated-backscatter-intravascular-ultrasound

© 2012 The Author(s). Licensee IntechOpen. This is an open access articledistributed under the terms of the Creative Commons Attribution 3.0License, which permits unrestricted use, distribution, and reproduction inany medium, provided the original work is properly cited.