Integrated Annual Report 2012 -...
188
Integrated Annual Report 2012
Transcript of Integrated Annual Report 2012 -...

Integrated Annual Report 2012
Report profile Mustek published its first integrated annual report for the 2011 financial year. It was a major first step, but constrained by the reorganising of its internal information systems and reporting policies to fit the integrated reporting model. This 2012 integrated annual report is structured to align more fully with the King Code of Governance Principles for South Africa 2009 (King III) and other reporting guidelines, although this journey to fully integrated reporting is still under way.
The Integrated Reporting Committee of South Africa defines an integrated report as “a report that incorporates, in clear language, material information from these and other sources to enable stakeholders to evaluate the organisation’s performance and to make an informed assessment about its ability to create and sustain value. An integrated annual report should provide stakeholders with a concise overview of an organisation, integrating and connecting important information about strategy, risks and opportunities and relating them to social, environmental, economic and financial issues.”
This form of annual reporting integrates economic, environmental, social and governance issues into a single concise report that also emphasises company risks and strategies.
Mustek’s engagement of King III and its process of producing all-inclusive integrated reports will influence the Group’s business thinking, consequent management decisions and systems of information gathering. This 2012 report meets the integrated reporting scope to the fullest extent that Mustek can provide at this stage. Future reports will build upon this foundation.
Report scope and boundary Mustek’s financial year is from 1 July to 30 June. This report covers Mustek’s operations in South Africa, elsewhere in Africa and in Australia for the financial year 1 July 2011 to 30 June 2012. Where reporting value and insights can be added by including post-30 June 2012 events and information, this has been done and recorded as having occurred subsequent to the reporting period.
This integrated annual report covers the economic, social and environmental performance of the entire Group and all its subsidiaries.
Reporting principles and approach This integrated annual report and annual financial statements are prepared in accordance with International Financial Reporting Standards (IFRS), the Companies Act (Act 71 of 2008), as amended, the JSE Limited Listings Requirements, the King Report on Governance for South Africa 2009 (King III) and the guidelines of the Global Reporting Initiative (GRI 3.1). The only restatement made was the splitting out of discontinued operations.
Assurance Mustek is on the road to creating a combined assurance model. Our financial statements for the period were independently audited and assured by Deloitte & Touche. At this stage of our integrated reporting path, our reporting information systems are not yet bedded down sufficiently to assure the non-financial information, but Mustek will consider phasing in non-financial assurance in the next few years. For this period, we have self-assessed our application of the GRI 3.1 reporting framework to be at Level C.
About this report IFCReport profile IFCReport scope and boundary IFCReporting principles and approach IFCAssurance IFCBoard responsibility statement 1Feedback 1Forward-looking statement disclaimer 1
Highlights of the year 2
Organisational structure 3
Six-year financial review 4
Organisational overview 6Group profile and history 6Awards and recognition 6Business model 7Material issues 8Stakeholder engagement 10What to expect – key ICT trends in 2012/13 11
Chairman and Chief Executive Officer’s review 12Core values 14Chairman and Chief Executive Officer’s review 14
Corporate strategy 20Vision and mission 20
Operational review 21Operational divisions 21 Mustek 21 Rectron 21 Comztek 22Mustek in Africa 23
Value added 24
Sustainability and social and environmental reporting 26Approach and sustainability journey 26Sustainability focus areas 26 Our people 26 Mustek environmental and climate change 33 Social impacts 39 Quality, environmental, health and safety policy 41 Culture, ethics and values 41
Corporate governance 42Corporate governance report 42Remuneration report 60Risk management report 62
Leadership 64Directorate 64Executive Committee 64
Annual financial statements 65
Shareholder information 162Notice of Annual General Meeting 162Appendices 171Form of proxy 175
GRI Index 177
Corporate information IBC www.mustek.co.za
About this Report
Mu
stek In
tegrated
An
nu
al Rep
ort 2
01
2
1
information
Board responsibility statement The Mustek Board of Directors (the Board) acknowledges its responsibility to ensure the integrity of its integrated annual report for the 2012 financial year. The Board has accordingly applied its mind and in its opinion this integrated annual report addresses all material issues, and presents fairly the integrated performance of the organisation and its impacts. This integrated annual report has been prepared in accordance with the recommendations of principle 9.1 of the King III Code, to the extent that current Mustek management policies and systems enable.
Feedback We need your feedback to ensure that we are reporting on the things that matter to you. Visit www.mustek.co.za or email [email protected].
Forward-looking statement disclaimer Certain forward-looking statements are made regarding Mustek’s operations, economic performance or financial condition. These include statements concerning the economic and technological outlook for the ICT industry. Although Mustek regards these forward-looking statements as being reasonable from available information, no assurance can be given that such expectations will prove to be correct. Outcomes may differ materially from those set out in the forward-looking statements as a result of, among other factors, changes in economic conditions, results from business and operating initiatives, regulatory changes, exchange rate fluctuations, technological advances or disruptions, and actualised risks. Mustek is not obliged to update publicly or release any revisions of these forward-looking statements to reflect events or circumstances after the date of the annual financial statements, or to note unanticipated events. All subsequent written or oral forward-looking statements attributable to Mustek or any other person acting on its behalf are qualified by this cautionary statement.
Mu
ste
k In
teg
rate
d A
nn
ual
Rep
ort
20
12
2
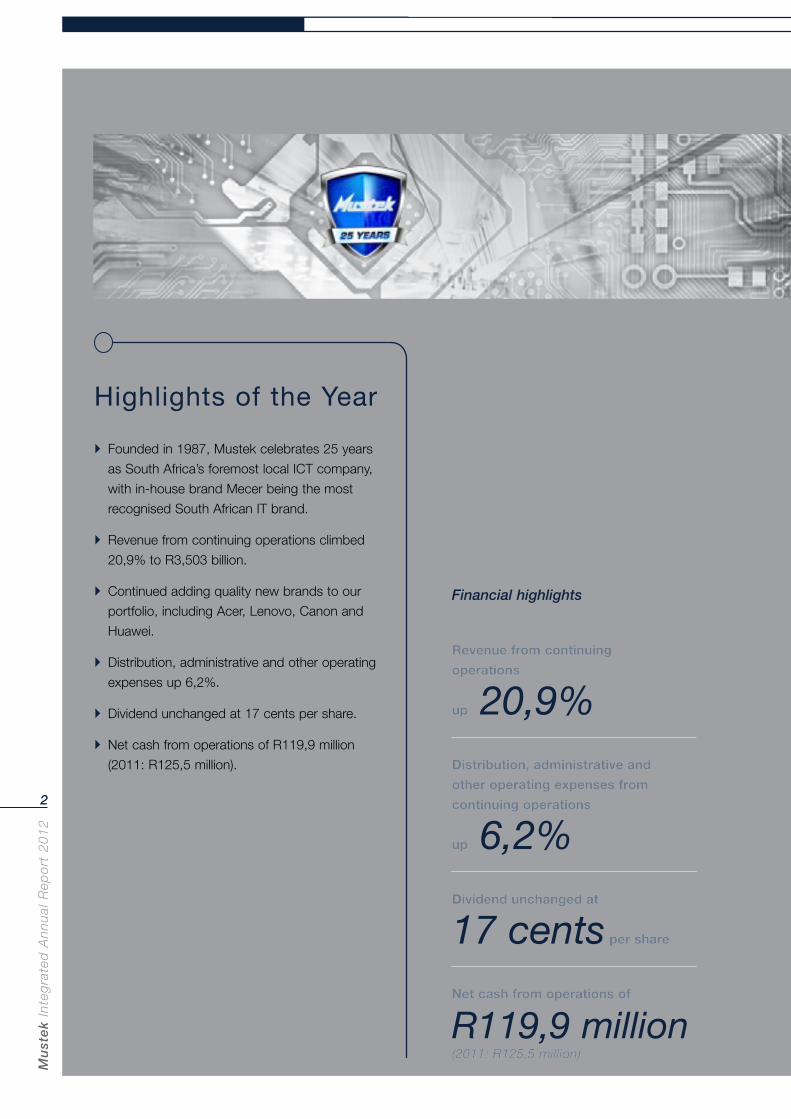
Highlights of the Year
Founded in 1987, Mustek celebrates 25 years
as South Africa’s foremost local ICT company,
with in-house brand Mecer being the most
recognised South African IT brand.
Revenue from continuing operations climbed
20,9% to R3,503 billion.
Continued adding quality new brands to our
portfolio, including Acer, Lenovo, Canon and
Huawei.
Distribution, administrative and other operating
expenses up 6,2%.
Dividend unchanged at 17 cents per share.
Net cash from operations of R119,9 million
(2011: R125,5 million).
Financial highlights
Revenue from continuing Revenue from continuing
operationsoperations
upup 20,9%Distribution, administrative and Distribution, administrative and
other operating expenses from other operating expenses from
continuing operationscontinuing operations
upup 6,2%Dividend unchanged atDividend unchanged at
17 cents per share per share
Net cash from operations ofNet cash from operations of
R119,9 million(2011: R125,5 million)(2011: R125,5 million)
Mu
stek In
tegrated
An
nu
al Rep
ort 2
01
2
3
www.mustek.co.zafor more info go to:
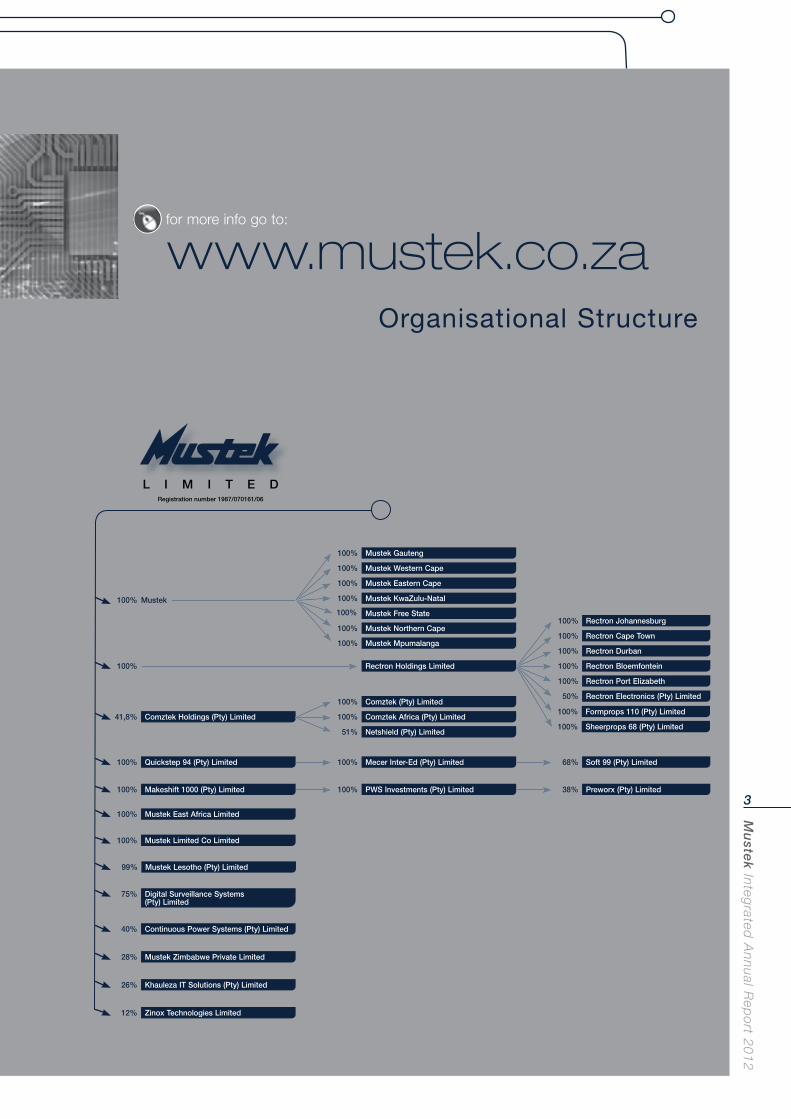
Organisational Structure
100% Mustek
100% Mustek Gauteng
100% Mustek Western Cape
100% Mustek Eastern Cape
100%
100%
100%
100%
Mustek KwaZulu-Natal
Mustek Free State
Mustek Northern Cape
Mustek Mpumalanga
100% Rectron Holdings Limited
100% Rectron Johannesburg
100% Rectron Cape Town
100% Rectron Durban
100% Rectron Bloemfontein
100% Rectron Port Elizabeth
100%
50%
Formprops 110 (Pty) Limited
Rectron Electronics (Pty) Limited
100% Sheerprops 68 (Pty) Limited41,8% Comztek Holdings (Pty) Limited
100% Comztek (Pty) Limited
100%
51%
Comztek Africa (Pty) Limited
Netshield (Pty) Limited
100% Quickstep 94 (Pty) Limited 100%
100%
Mecer Inter-Ed (Pty) Limited
PWS Investments (Pty) Limited
68%
38%
Soft 99 (Pty) Limited
Preworx (Pty) Limited100% Makeshift 1000 (Pty) Limited
100% Mustek Limited Co Limited
75% Digital Surveillance Systems (Pty) Limited
40% Continuous Power Systems (Pty) Limited
28%
26%
12%
Mustek Zimbabwe Private Limited
Khauleza IT Solutions (Pty) Limited
Zinox Technologies Limited
99% Mustek Lesotho (Pty) Limited
100% Mustek East Africa Limited
Registration number 1987/070161/06
L I M I T E D
Mu
ste
k In
teg
rate
d A
nn
ual
Rep
ort
20
12
4
Six-year Financial Review
2012R000
2011R000
2010R000
2009R000
2008R000
2007R000
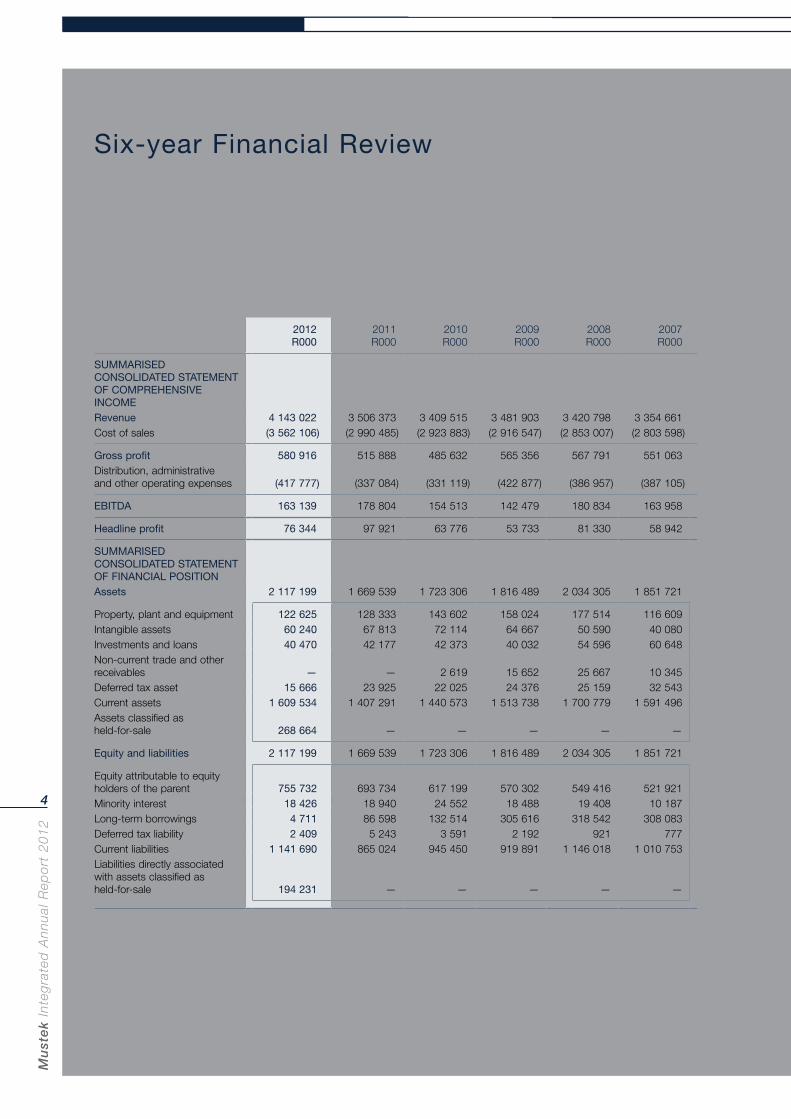
SUMMARISED CONSOLIDATED STATEMENT OF COMPREHENSIVE INCOMERevenue 4 143 022 3 506 373 3 409 515 3 481 903 3 420 798 3 354 661Cost of sales (3 562 106) (2 990 485) (2 923 883) (2 916 547) (2 853 007) (2 803 598)
Gross profit 580 916 515 888 485 632 565 356 567 791 551 063Distribution, administrative and other operating expenses (417 777) (337 084) (331 119) (422 877) (386 957) (387 105)
EBITDA 163 139 178 804 154 513 142 479 180 834 163 958
Headline profit 76 344 97 921 63 776 53 733 81 330 58 942
SUMMARISED CONSOLIDATED STATEMENT OF FINANCIAL POSITIONAssets 2 117 199 1 669 539 1 723 306 1 816 489 2 034 305 1 851 721
Property, plant and equipment 122 625 128 333 143 602 158 024 177 514 116 609Intangible assets 60 240 67 813 72 114 64 667 50 590 40 080Investments and loans 40 470 42 177 42 373 40 032 54 596 60 648Non-current trade and other receivables — — 2 619 15 652 25 667 10 345Deferred tax asset 15 666 23 925 22 025 24 376 25 159 32 543Current assets 1 609 534 1 407 291 1 440 573 1 513 738 1 700 779 1 591 496Assets classified as held-for-sale 268 664 — — — — —
Equity and liabilities 2 117 199 1 669 539 1 723 306 1 816 489 2 034 305 1 851 721
Equity attributable to equity holders of the parent 755 732 693 734 617 199 570 302 549 416 521 921Minority interest 18 426 18 940 24 552 18 488 19 408 10 187Long-term borrowings 4 711 86 598 132 514 305 616 318 542 308 083Deferred tax liability 2 409 5 243 3 591 2 192 921 777Current liabilities 1 141 690 865 024 945 450 919 891 1 146 018 1 010 753Liabilities directly associated with assets classified as held-for-sale 194 231 — — — — —
Mu
stek In
tegrated
An
nu
al Rep
ort 2
01
2
5
2012R000
2011R000
2010R000
2009R000
2008R000
2007R000
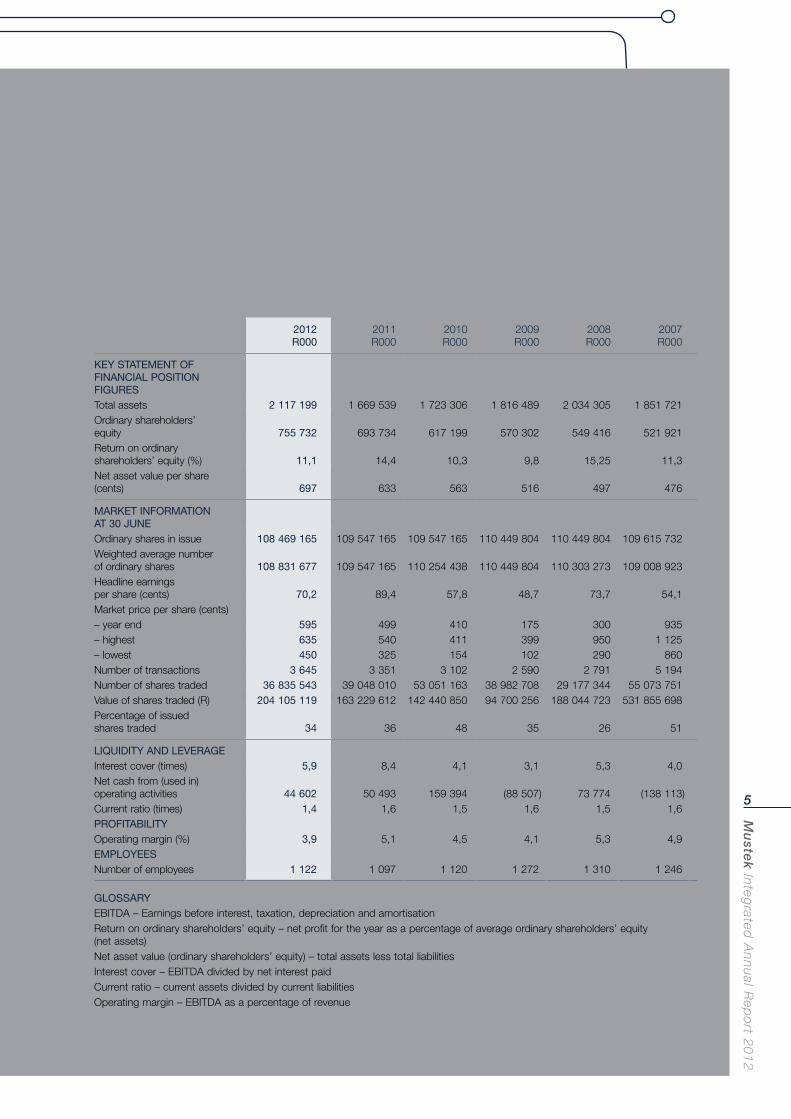
KEY STATEMENT OF FINANCIAL POSITION FIGURESTotal assets 2 117 199 1 669 539 1 723 306 1 816 489 2 034 305 1 851 721Ordinary shareholders’ equity 755 732 693 734 617 199 570 302 549 416 521 921Return on ordinary shareholders’ equity (%) 11,1 14,4 10,3 9,8 15,25 11,3Net asset value per share (cents) 697 633 563 516 497 476
MARKET INFORMATION AT 30 JUNEOrdinary shares in issue 108 469 165 109 547 165 109 547 165 110 449 804 110 449 804 109 615 732Weighted average number of ordinary shares 108 831 677 109 547 165 110 254 438 110 449 804 110 303 273 109 008 923Headline earnings per share (cents) 70,2 89,4 57,8 48,7 73,7 54,1Market price per share (cents)– year end 595 499 410 175 300 935– highest 635 540 411 399 950 1 125– lowest 450 325 154 102 290 860Number of transactions 3 645 3 351 3 102 2 590 2 791 5 194Number of shares traded 36 835 543 39 048 010 53 051 163 38 982 708 29 177 344 55 073 751Value of shares traded (R) 204 105 119 163 229 612 142 440 850 94 700 256 188 044 723 531 855 698Percentage of issued shares traded 34 36 48 35 26 51
LIQUIDITY AND LEVERAGEInterest cover (times) 5,9 8,4 4,1 3,1 5,3 4,0Net cash from (used in) operating activities 44 602 50 493 159 394 (88 507) 73 774 (138 113)Current ratio (times) 1,4 1,6 1,5 1,6 1,5 1,6PROFITABILITYOperating margin (%) 3,9 5,1 4,5 4,1 5,3 4,9EMPLOYEESNumber of employees 1 122 1 097 1 120 1 272 1 310 1 246
GLOSSARYEBITDA – Earnings before interest, taxation, depreciation and amortisationReturn on ordinary shareholders’ equity – net profit for the year as a percentage of average ordinary shareholders’ equity (net assets)Net asset value (ordinary shareholders’ equity) – total assets less total liabilitiesInterest cover – EBITDA divided by net interest paid Current ratio – current assets divided by current liabilitiesOperating margin – EBITDA as a percentage of revenue
Mu
ste
k In
teg
rate
d A
nn
ual
Rep
ort
20
12
6
Organisational Overview
Group profile and history
Mustek Limited is a limited liability company founded by
David Kan in 1987 and listed on the JSE in 1997.
Up to 2008, Mustek focused on its proprietary Mecer brand
of PCs, notebooks, servers and peripherals, along with
limited distribution of printers and consumables. Locally
assembled Mecer PCs are custom-built to end-user
requirements, and the Mecer brand remains one of the
best-selling PC brands in South Africa.
The Group then took a strategic decision to adopt a
horizontal growth strategy and to reposition Mustek as a
broad-based distributor of premium-brand ICT and
technology-related products. Essentially, this broad-base
distribution strategy incorporates any product that utilises
computing or is related to computing. Mustek embarked on
an aggressive product expansion programme and now
boasts an impressive range of premium brands.
Mustek has a comprehensive infrastructure for a national
support network, and branches offering the full range of
service including distribution, service and repairs are located
at its head office in Midrand and in Cape Town, Port Elizabeth,
East London, Durban, Bloemfontein, Kimberley and Nelspruit.
The Group invests heavily in its core resource – competent
people – by pursuing a comprehensive programme of
training and people development.
The tenets of the Group’s philosophy embrace transparency
of operation, imaginative application of technology and
accountability to all stakeholders.
Mustek’s ongoing success is attributable to a clear and
forward-looking strategic vision, responsible management,
technically adept workforce, high-quality products and
superior service levels.
The Group aims to continue sustainably growing headline
earnings and creating long-term shareholder value by
remaining focused on its business model. This model
provides cost-efficient, world-class distribution, after-sales
support and added-value services for quality ICT brands that
include Mustek’s own well-established Mecer brand.
Awards and recognition
Mustek won the Sake 24 award for best financial results
advertisement.
Andrada Manu, APC Product Manager Mustek, was
conferred the award for Outstanding Sales of the Year for
Southern Africa, as well as APC Product Manager of the
Year for Africa.
Mustek won the Epson Distributor of the Year award.
Epson – The Rising Star Award was conferred on Shaun
Battis (Epson Product Manager at Mustek).
Mustek won the Microsoft – OEM Hardware Partner of the
Year award.
Rectron was named Distributor of the Year, resulting from
an independent survey of South Africa’s resellers.
Comztek won the coveted Symantec Distribution Partner
of the Year award 2012.
Mu
stek In
tegrated
An
nu
al Rep
ort 2
01
2
7
Business model
Originally founded to market and distribute the Mecer PC brand, Mustek leveraged its industry-leading logistics network to
add in a growing range of complementary ICT brands and products. These products are carefully chosen so not to take away
or ‘cannibalise’ existing ranges, but rather to engage new customer segments and adjacent market niches.
Mustek’s post-2008 business model is proving successful and sustainable, as Mustek is able to provide an end-to-end distribution
and support service, from when the product is sourced, right through to support and repair.
To support this business strategy, Mustek is continually looking to enter into complementary sectors, such as – for example – solar
power technology.
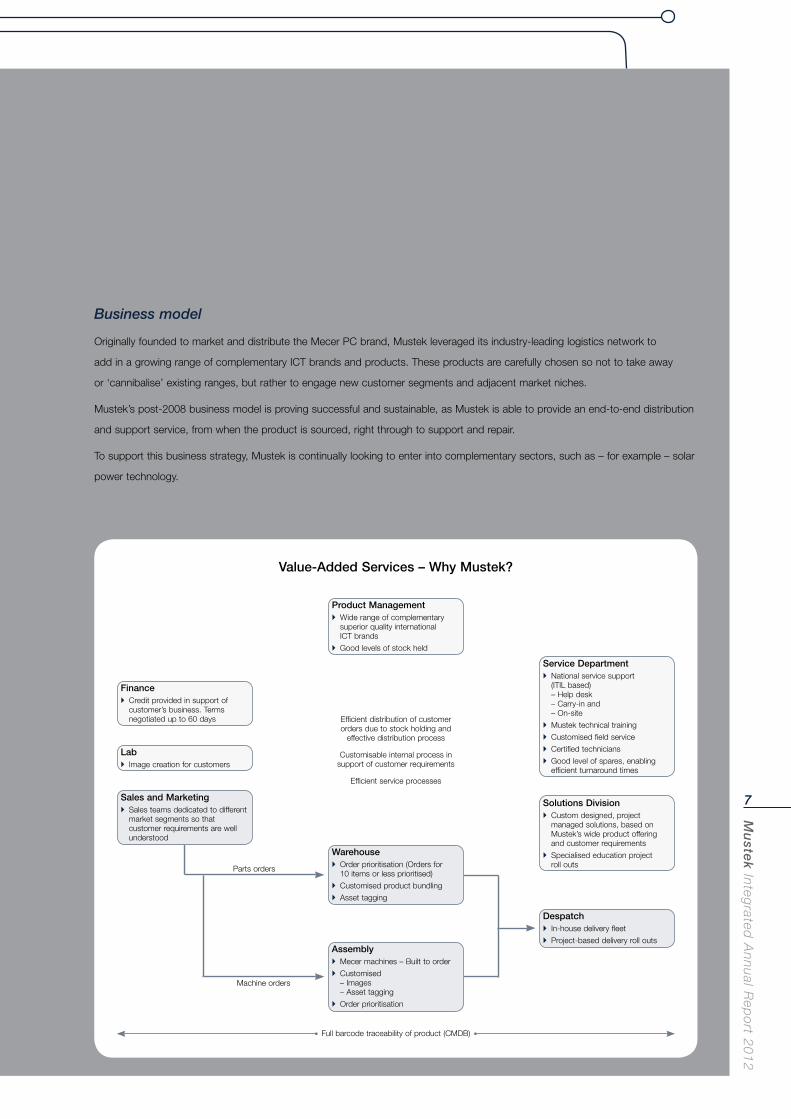
Value-Added Services – Why Mustek?
Full barcode traceability of product (CMDB)
Product Management Wide range of complementary
superior quality international ICT brands
Good levels of stock held
Efficient distribution of customer orders due to stock holding and
effective distribution process
Customisable internal process in support of customer requirements
Efficient service processes
Parts orders
Machine orders
Service Department National service support
(ITIL based) – Help desk – Carry-in and – On-site
Mustek technical training
Customised field service
Certified technicians
Good level of spares, enabling efficient turnaround times
Solutions Division Custom designed, project
managed solutions, based on Mustek’s wide product offering and customer requirements
Specialised education project roll outs
Despatch In-house delivery fleet
Project-based delivery roll outs
Finance Credit provided in support of
customer’s business. Terms negotiated up to 60 days
Lab Image creation for customers
Sales and Marketing Sales teams dedicated to different
market segments so that customer requirements are well understood
Warehouse Order prioritisation (Orders for
10 items or less prioritised)
Customised product bundling
Asset tagging
Assembly Mecer machines – Built to order
Customised – Images – Asset tagging
Order prioritisation
Mu
ste
k In
teg
rate
d A
nn
ual
Rep
ort
20
12
8
Organisational Overview (continued)
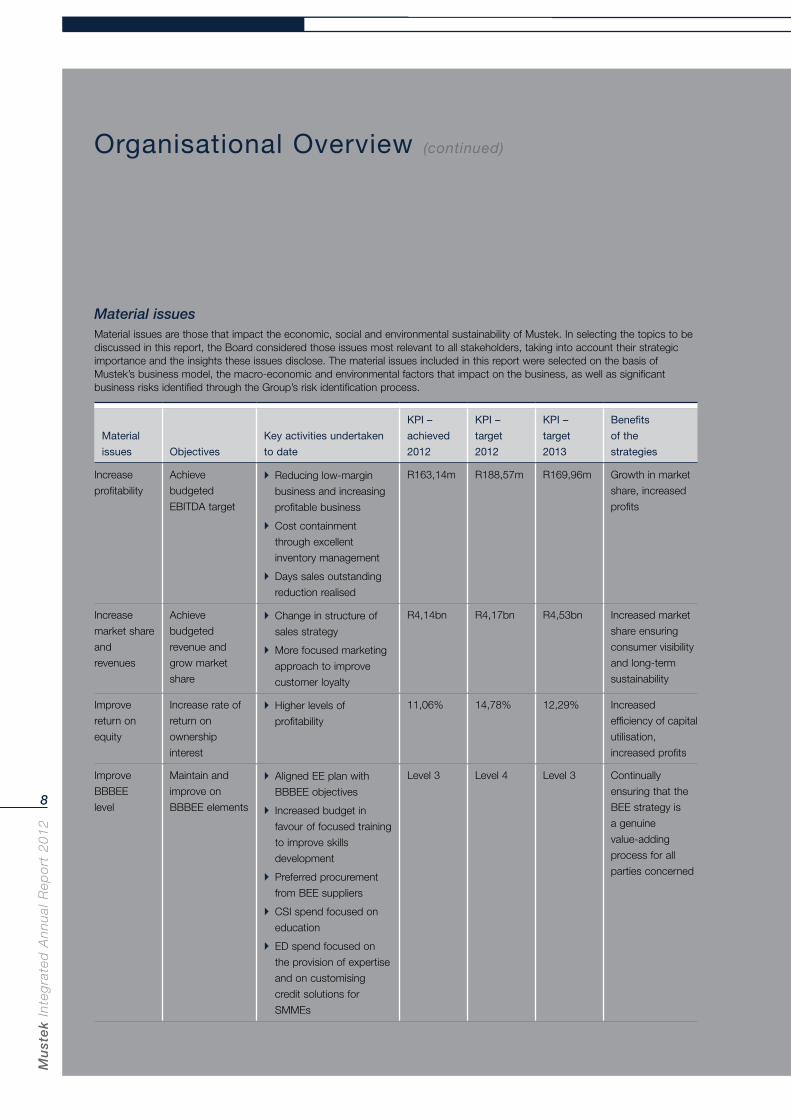
Material issues Material issues are those that impact the economic, social and environmental sustainability of Mustek. In selecting the topics to be discussed in this report, the Board considered those issues most relevant to all stakeholders, taking into account their strategic importance and the insights these issues disclose. The material issues included in this report were selected on the basis of Mustek’s business model, the macro-economic and environmental factors that impact on the business, as well as significant business risks identified through the Group’s risk identification process.
Material
issues
Objectives
Key activities undertaken
to date
KPI –
achieved
2012
KPI –
target
2012
KPI –
target
2013
Benefits
of the
strategies
Increase
profitability
Achieve
budgeted
EBITDA target
Reducing low-margin
business and increasing
profitable business
Cost containment
through excellent
inventory management
Days sales outstanding
reduction realised
R163,14m R188,57m R169,96m Growth in market
share, increased
profits
Increase
market share
and
revenues
Achieve
budgeted
revenue and
grow market
share
Change in structure of
sales strategy
More focused marketing
approach to improve
customer loyalty
R4,14bn R4,17bn R4,53bn Increased market
share ensuring
consumer visibility
and long-term
sustainability
Improve
return on
equity
Increase rate of
return on
ownership
interest
Higher levels of
profitability
11,06% 14,78% 12,29% Increased
efficiency of capital
utilisation,
increased profits
Improve
BBBEE
level
Maintain and
improve on
BBBEE elements
Aligned EE plan with
BBBEE objectives
Increased budget in
favour of focused training
to improve skills
development
Preferred procurement
from BEE suppliers
CSI spend focused on
education
ED spend focused on
the provision of expertise
and on customising
credit solutions for
SMMEs
Level 3 Level 4 Level 3 Continually
ensuring that the
BEE strategy is
a genuine
value-adding
process for all
parties concerned
Mu
stek In
tegrated
An
nu
al Rep
ort 2
01
2
9
Material
issues
Objectives
Key activities undertaken
to date
KPI –
achieved
2012
KPI –
target
2012
KPI –
target
2013
Benefits
of the
strategies
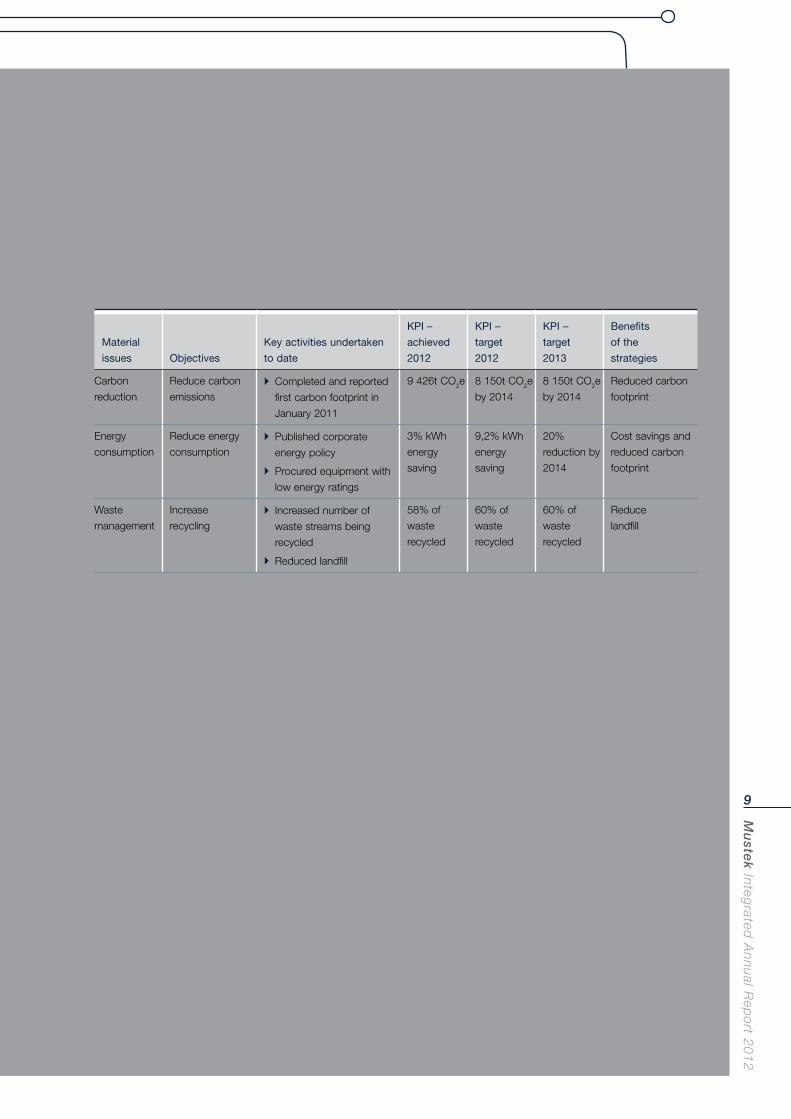
Carbon
reduction
Reduce carbon
emissions Completed and reported
first carbon footprint in
January 2011
9 426t CO2e 8 150t CO2e
by 2014
8 150t CO2e
by 2014
Reduced carbon
footprint
Energy
consumption
Reduce energy
consumption Published corporate
energy policy
Procured equipment with
low energy ratings
3% kWh
energy
saving
9,2% kWh
energy
saving
20%
reduction by
2014
Cost savings and
reduced carbon
footprint
Waste
management
Increase
recycling Increased number of
waste streams being
recycled
Reduced landfill
58% of
waste
recycled
60% of
waste
recycled
60% of
waste
recycled
Reduce
landfill
Mu
ste
k In
teg
rate
d A
nn
ual
Rep
ort
20
12
10
Organisational Overview (continued)
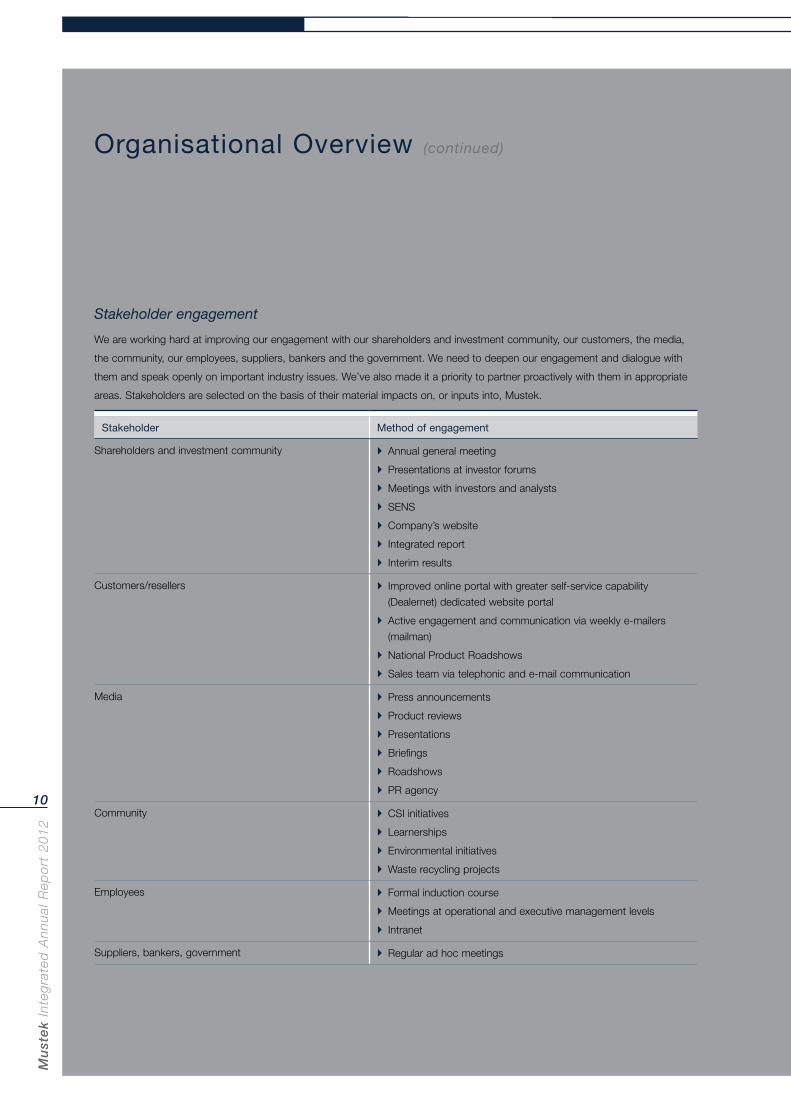
Stakeholder engagement
We are working hard at improving our engagement with our shareholders and investment community, our customers, the media,
the community, our employees, suppliers, bankers and the government. We need to deepen our engagement and dialogue with
them and speak openly on important industry issues. We’ve also made it a priority to partner proactively with them in appropriate
areas. Stakeholders are selected on the basis of their material impacts on, or inputs into, Mustek.
Stakeholder Method of engagement
Shareholders and investment community Annual general meeting
Presentations at investor forums
Meetings with investors and analysts
SENS
Company’s website
Integrated report
Interim results
Customers/resellers Improved online portal with greater self-service capability
(Dealernet) dedicated website portal
Active engagement and communication via weekly e-mailers
(mailman)
National Product Roadshows
Sales team via telephonic and e-mail communication
Media Press announcements
Product reviews
Presentations
Briefings
Roadshows
PR agency
Community CSI initiatives
Learnerships
Environmental initiatives
Waste recycling projects
Employees Formal induction course
Meetings at operational and executive management levels
Intranet
Suppliers, bankers, government Regular ad hoc meetings
Mu
stek In
tegrated
An
nu
al Rep
ort 2
01
2
11
the end of 2012. This incoming wave of Windows 8-based
software and hardware platforms enables Microsoft to offer
an integrated computing and communication platform across
the entire range of digital user interfaces, with commercial
users likely to select up to ‘three screens’ from desktops,
notebooks, tablets and mobile phones.
Microsoft continues to overwhelmingly dominate the
commercial desk space with its Microsoft Office software and
Windows operating system (OS) desktop computers or
notebooks.
Until the launch of Windows 8 – which is Microsoft’s most
revolutionary OS update since Windows 95 – Microsoft
competed mainly through software. Now Microsoft clearly
intends competing through hardware as well. This is
exacerbated by the fact that Windows 8 can run efficiently on
older hardware – another shift from previous Microsoft policy,
which compelled hardware upgrades. At Mustek, we don’t
see this slowing our own hardware sales, due to many
corporate users having held onto ageing XP OS hardware for
years beyond the usual upgrade cycle.
How will corporations respond to Windows 8? Many still on
the venerable XP operating system may decide to leapfrog
Windows 7 and upgrade directly to Windows 8, as the new
OS supports traditional mouse and keyboard operability. It is
expected that Windows 8’s robust ‘touch’ functionality will
initially be embraced mainly by general consumers, as touch
screens are still relatively expensive, though will inevitably
drop in price in coming years.
Company information officers (CIOs) and IT departments will
be especially attracted to Windows 8, with its integrated
services across all devices and security features more
advanced than those of competitors.
What to expect – key ICT trends in 2012/13
Microsoft and Intel’s response
The new ‘tablet’ category that emerged cut deeply into the
traditional desktop and laptop PC segments, which fell back
into single-digit growth.
This proved to be a major wake-up call for the Microsoft
Intel (Wintel) technology collaboration, which responded by
releasing standards for a new range of notebooks called
‘ultrabooks’. Ultrabook models are being launched by most
major PC manufacturers from mid-2012 and must comply
with a specific Intel standard, of which the main features are
a low-voltage Intel Core processor, a frame no thicker than
22 mm, at least five hours of battery life, and fast boot times.
Fitted with touchscreens, the ultrabooks will run Microsoft’s
revolutionary Windows 8 operating system, which integrates
‘touch’ and gestures as key user interfaces. Windows 8 is
intuitive for users and has the processing power and physical
keyboard input to generate content easily.
Microsoft’s ‘three screens’ counter strike
Besides its integral involvement in the ultrabooks campaign,
Microsoft positioned itself by launching Windows 8 in
October 2012 in conjunction with its Surface Tablet, which
is pitched directly against other tablets. The Surface will offer
competitive advantages such as a microSD card slot for
added storage capacity and a neatly designed cover/
keyboard that integrates with the tablet to make it an
effective netbook or notebook replacement.
In October 2012, Microsoft also launched its Windows 8
Mobile platform for smartphones, with Nokia and other major
cellphone manufacturers such as Samsung, Huawei and
HTC all committed to releasing Windows 8 models before
Mu
ste
k In
teg
rate
d A
nn
ual
Rep
ort
20
12
12
Organisational Overview (continued)
Cloud computing – a threat or an opportunity?
Another growing factor is the advent of ‘cloud computing’,
with its potential for storing and manipulating corporate data
on off-site servers. Keeping company data ‘in the cloud’
offers security from hacking, improved data manipulation,
lower hardware costs and business services, less demand
on staff and IT expertise, as well as shared costs for
continually improving business services.
We foresee that over the next three to five years, many large
companies will initially test the cloud by using it as a backup
rather than for primary storage. In South Africa, bandwidth
and broadband speeds will continue to inhibit cloud
adoption, while as data hacking becomes more
sophisticated, database security remains a concern. Most
often the weakest link in data security is human rather than
technical, therefore offsite backups remain essential.
Africa’s bandwidth rolls out – slowly
Although broadband delivery into Africa is growing by leaps
and bounds, it needs networks and ‘last mile’ infrastructure
to get into the businesses and homes of consumers. While
this is being rolled out, Africa is still years away from
leveraging all the bandwidth now being piped into the
continent. As a consequence, Internet access and data still
takes between 30 to 40% of company ICT spend. When this
figure is brought down to 20% and below, demand for new
hardware would certainly accelerate.
Digital innovation in Africa
Africa’s younger generations are fast turning to technology
and, in many instances, are completely bypassing the
traditional PC or notebook by designing or utilising apps that
allow them to do banking and other business transactions
through their mobile phones. Although content generation
remains difficult on these smaller devices, Samsung’s Note, a
larger smartphone issued with a stylus and the capacity to
The beginning of the end of the mouse? Touch, gestures and voice
For nearly 40 years, the humble ‘mouse’ has been a vital part
of the human interface with computers. But notebook
trackpads started weaning users away and Apple’s
revolutionary iPad, with no mouse option at all, accelerated
the trend toward on-screen touch. Microsoft’s new
Windows 8 OS is primarily based on touch, but with some
voice capability, yet still supports traditional mouse and
keyboard interaction.
At a developer conference in San Francisco in September
2012, Intel sponsored another long stride into the future of
computing by unveiling a kit that will enable developers to
create gesture, facial and voice recognition applications for
Intel-based computers. With processors becoming powerful
enough, the envisaged ‘perceptual computing’ will allow
people to simply ask their computers to open a document,
play a song, search the Internet, or post a picture to Twitter
and Facebook, all without having to type on the keyboard,
tap a touchpad or touch the screen.
The first Intel Perceptual Computing Software Development
Kit (SDK) beta is geared towards ultrabooks and PCs using
Intel’s Core processor.
Ultrabooks are expected to come into their own in 2013,
when Intel will release the fourth-generation Intel Core
processor family, codenamed ‘Haswell’, which is expected to
provide twice as much power as the current Intel Cores at
the same battery life, or will offer the same power with
double the battery life. This would enable ‘all-day computing’,
with ultrabook users not needing to recharge for a full
working day.
Mu
stek In
tegrated
An
nu
al Rep
ort 2
01
2
13
In recent years, African desktop or notebook users typically
spend 70% on Internet connectivity and 30% on hardware.
As connectivity costs reduce, users will have more
disposable income for hardware. Falling costs and improving
ICT infrastructure and computer literacy skills over the next
10 years will accelerate the growth of personal computing
across Africa.
Growing bandwidth and falling prices will
accelerate hardware demand
Although broadband capacity piped into southern Africa has
grown exponentially in recent years, its roll out to end-users
is hampered by lack of delivery infrastructure, high costs to
consumers, regulatory inefficiency and the relative poverty of
millions of potential consumers. Network operators and
Internet service providers are now collaborating to develop
terrestrial networks connecting to the undersea cable
network.
Growth will be achieved as terrestrial networks expand and
prices for fixed and mobile broadband fall. Over the next
three to five years, revenue growth will come from data
services that add value and new users joining networks as
these expand.
This will, however, depend on regulators being reasonably
quick in unlocking spectrum and licensing new technologies.
digitalise drawings and handwriting, has proven surprisingly
popular. Ideally suited to the African market, it may well
spawn a ‘phablet’ generation of devices halfway between
smartphones and tablets that could take market share from
notebooks and tablets.
Global trends
Chronic financial instability in many leading economies will
probably persist for at least the next five years until the
underlying causes have been worked out through the global
economy. At this time Europe is the key problem area, the
USA is gripped by its presidential election, while previously
rampant Asian economies such as China and India are
slowing down.
Fortunately, Mustek has little direct customer exposure to
these economies and we have the size and flexibility to adapt
to major macro-economic events.
Global ICT growth
According to research published by Gartner, the world’s
leading IT research company, worldwide IT spend grew by
7.9% in 2011. Gartner forecasts that growth in global IT
spending will slip to 3% in 2012.
Strong IT growth in Africa
By contrast, IT spending in Africa continues to show robust
growth, with Gartner expecting 11% in 2012. This is due to
continued strong economic growth in sub-Saharan Africa.
Mu
ste
k In
teg
rate
d A
nn
ual
Rep
ort
20
12
14
Financial highlights
Revenue from continuing operations increased by 20,9% to
R3,503 billion (2011: R2,897 billion), while the gross profit
percentage reduced to 14,3% (2011: 14,9%). This result can
be ascribed largely to adding the Acer and Lenovo product
ranges in this financial year, which helped grow revenue but
decreased margins, as these products are typically sold at
lower margins.
Included in the profit from operations figure is R47,8 million
relating to realised and unrealised foreign exchange losses.
Mustek’s headline earnings from continuing operations was
71,37 cents per share and basic earnings from continuing
operations came in at 74,89 cents per share.
A need for increased working capital raised financing costs in
this year. Distribution, administrative and other operating
expenses were tightly controlled, and increased by just 6,2%.
An increased focus on working capital management will
reduce finance costs.
Rectron grew its full-year revenue by 5,7%, which was
satisfactory after the decline of 6,5% in the six months to
December 2011. This was against the background of a new
executive team taking the reins at Rectron, with Lindi Shortt
appointed as CEO.
Comztek’s overall performance was disappointing, although
its broader Africa operations grew by 30% and delivered
profits well above budget. A major setback was Microsoft’s
appointment of a second distributor of its Xbox console and
games, which reduced Comztek’s share of that market.
Dividend
The final dividend declared by the Board of Directors for the
financial year ended 30 June 2012 remained unchanged at
17 cents per share.
Chairman and Chief Executive Officer’s Review
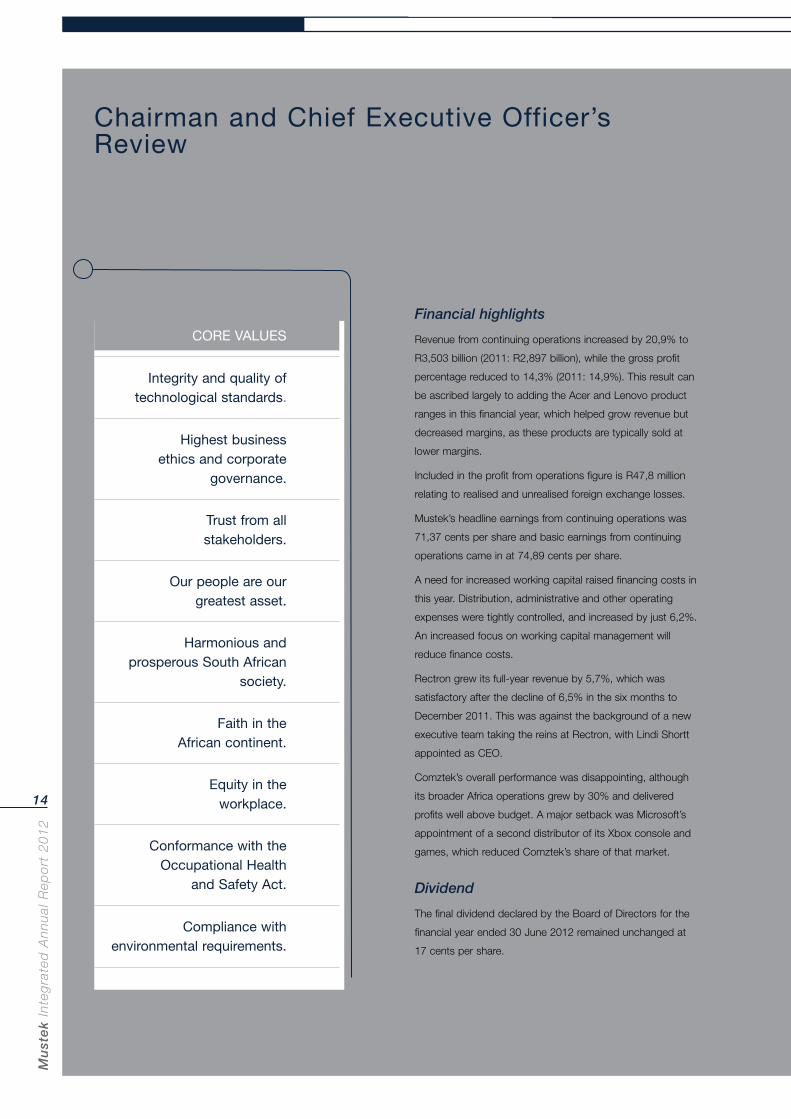
CORE VALUES
Integrity and quality of technological standards..
Highest business ethics and corporate
governance.
Trust from all stakeholders.
Our people are our greatest asset.
Harmonious and prosperous South African
society.
Faith in the African continent.
Equity in the workplace.
Conformance with the Occupational Health
and Safety Act.
Compliance with environmental requirements.
Mu
stek In
tegrated
An
nu
al Rep
ort 2
01
2
15
economicperformance
Mu
ste
k In
teg
rate
d A
nn
ual
Rep
ort
20
12
16
Chairman and Chief Executive Officer’s Review (continued)
Gazetting of the ICT Charter
In planning since 2003, South Africa’s ICT Charter (sector
code) was gazetted and became legally binding on entities in
the ICT sector until 30 April 2026, with the mid-term five-year
review scheduled for 30 April 2017.
Key points in the charter are:
a black ownership target of 30% to be achieved by entities
in the sector, including multinationals;
a set target of 5% net profit after tax to be spent on
enterprise development initiatives aimed at developing
black-owned ICT enterprises; and
a spend of 1,5% of net profit after tax on socio-economic
development initiatives to improve the lives of communities
and bridge the digital divide in the country.
The ICT Charter includes a sector-specific scorecard for
determining the BEE scores of enterprises in the ICT sector.
In August 2012, Mustek’s BEE rating was assessed for the
first time against the ICT sector code, which sets higher BEE
benchmarks than the generic code against which previous
assessments of Mustek were done. These more rigorous
standards notwithstanding, Mustek improved its BEE rating
from Level 4 to Level 3, which shows that our efforts to
comply are well on track.
Consolidation of distribution network
The obstacles faced by small business are contributing to a
trend we have been experiencing in recent years, in which
many of our distributors are consolidating into larger tier 1 or
2 distributors, probably due to the rising costs of doing
business and the consequent squeeze on margins. Although
this trend isn’t good for small business, it hasn’t negatively
affected our sales margins. If anything, having fewer but
larger distributors is easier to administer.
Exchange rates and the Reserve Bank
The South African Rand is among the world’s most volatile
currencies, which makes business forward planning difficult,
particularly for those companies operating in the import
and/or export markets, or needing to source products
from abroad.
Mustek uses the Rand/USD spot rate at the beginning of
each month to determine its selling prices, with adjustments
made during the month should the exchange rate change
substantially. Inventory is accounted for at the exchange rate
at the time when risks and rewards transfer to the company
and accounting standards do not allow the fair valuation of
inventory, but require the corresponding foreign accounts
payable to be stated at the closing spot rate. As long as this
is the case and the Rand remains as volatile as it currently is,
reported earnings will be in line with the volatilities of the
Rand.
Price war among network providers – the consequences
Until now, the major cellphone (mobile) network operators
such as MTN and Vodacom have controlled the distribution
of cellphones, as these were typically linked into contracts
and subsidised to keep consumers loyal to their chosen
network provider. But over the past year Cell C is
aggressively growing its market share by sparking off a price
and contract package war. Cell C has rather cleverly cut its
call charges and enabled clients to customise their contracts
in a manner that allows them to include their handsets, or
bring their own.
I foresee the fallout being that the network operators will no
longer control the supply of cellphones to end-users, as the
major cellphone brands will turn to established distributors to
channel their handsets to the marketplace. As one of
South Africa’s leading IT distributors – with a 25-year track
record – Mustek is well-positioned to offer a competitive
service when the opportunity inevitably arises.
Mu
stek In
tegrated
An
nu
al Rep
ort 2
01
2
17
Delisting from Taiwan Stock Exchange
In 2003 Mustek listed on the Taiwan Stock Exchange (TSE),
primarily to increase our international brand recognition, and
to raise capital in international markets. In subsequent years,
the initial 20 million Taiwan Depository Receipts (TDRs) have
dwindled, as the Depository Receipt holders took advantage
of price differentials to make profits by converting and selling
the TDRs back on the JSE.
Maintaining the Mustek Depository Receipts on the TSE was
proving expensive due to Taiwan’s reporting legislation and
accounting standards being different to South Africa’s. For
the sake of transparency, investor communications and
Company reports had to be translated into Chinese for the
simultaneous release in both markets, which was a logistical
headache.
Recently the TSE passed a new regulation requiring listed
companies there to maintain a minimum of 10 million TDRs
on the bourse, which placed Mustek in the position of having
to issue new TDRs to replace those that had left Taiwan.
We weighed up the management time spent on the Taiwan
listing and the associated costs of listing fees, translation,
audit fees and publication against the liquidity of the receipts,
share prices and the potential for dilution if more TDRs
were issued.
In the balance, the Board decided to end our Taiwan listing
from 27 August 2012 and delist our remaining TDRs. This
action had no effect on the trading of Mustek shares on the
JSE stock exchange.
Mustek revenue growth in 2012
During this financial period, Mustek brought in major new
brands to our stable that included Acer, Huawei and Lenovo,
while Rectron clinched the Canon agency. These new brands
have enabled Mustek to appeal to a wider range of
consumers.
Acer, Lenovo and Toshiba offer quality choices for customers
seeking generic technology products, while those with
specific requirements can engage with our Mecer division for
configurations built to their exact specifications.
As a consequence, we anticipate increasing our market
share and the average spend per customer by building on
our industry-leading after-sales service and support
programme.
With the South African government committed to major
infrastructure development across the country and the
National Development Plan approved, we expect robust
public sector spending on ICT equipment in areas such as
health, education and security, particularly as we offer
specialised solutions in those areas.
Stakeholder engagement
We at Mustek maintain regular communications with our
stakeholders, as their input is vital to the Group remaining
profitable and sustainable. Our salespeople and the
distributors and resellers that market and move our products
are particularly vital stakeholders, and we pay constant
attention to their feedback. This stakeholder group offers us
the market intelligence that guides us in sourcing the right
products and identifying weak points in our supply chain.
Mustek has already commenced on a more formal and
upscaled stakeholder engagement process.
Mu
ste
k In
teg
rate
d A
nn
ual
Rep
ort
20
12
18
Chairman and Chief Executive Officer’s Review (continued)
the globe, Huawei is not yet well-recognised in South Africa,
but with focused marketing and keen pricing, we believe that
Huawei will make significant inroads.
In the quarter century since our founding, Mustek has
developed one of South Africa’s most efficient distribution
networks, which is capable of handling larger volumes of
product than at present. Logic dictates that we should
continue seeking complementary products to take advantage
of the potential economies of scale. One possibility is solar
power technology. Another is a potential distribution of
mobile phones, as discussed earlier in this commentary. We
already offer a portfolio of security technology products and
are confident of expanding this business.
Product service and repair
As Mustek developed and broadened our in-house range of
Mecer desktops and notebooks, we established a service
centre network to support them. In recent years we have
been certified to service and support the complementary
brands brought into the Mustek stable, such as Toshiba,
Acer, Lenovo and Brother printers, among others. In effect,
our service ‘cost’ centres have become ‘profit’ centres. This
capacity is a key advantage that Mustek enjoys over our
competitors in the South African marketplace, as their
products are sent for maintenance and repair to third-party
contractors with considerably slower turnaround times.
Mustek will further leverage our service network by becoming
authorised service and support centres for current and
incoming brands that we distribute.
Mustek is also a 36% shareholder in Khauleza IT Services, a
company that provides ICT services and support. We believe
that our support of Khauleza will be rewarded with a growing
share of maintenance and repair business in South Africa’s
public and corporate sectors.
Operations elsewhere in Africa
Mustek is the 100% shareholder in Mustek East Africa, which
is a small but vigorously growing ICT company based in
Kenya. Although its contribution remains small, we are
pleased by its steadily improving performance and see real
potential for further growth.
Mustek Zimbabwe has survived an especially challenging
decade, but appears to have turned the corner and is
rebuilding off a low base. We recently exercised the option to
repurchase a 28% share, and look forward to trading
conditions there improving further.
Mustek was a founder shareholder in Zinox, an ICT company
in Nigeria that operates on a similar business model to
Mustek and, through organic growth and acquisitions, has
expanded to a similar size to Mustek. After a rights issue in
recent years, our shareholding has shrunk to 12%. As we
have no supply or trading connection with Zinox, we will
dispose of the shares when the opportunity arises and the
timing is appropriate.
Forward-looking strategies
Mustek will continue growing the Group in accordance with
our operating model, which again proved to be on the right
track. Adding in high-profile brands such as Acer, Lenovo
and Canon to our product portfolio has offered increased
choice to the consumer and increased product volumes. We
take care to introduce brands that will not cannibalise sales
from existing brands such as Mecer, Brother and Toshiba,
which in this instance proved correct, as Mecer, Brother and
Toshiba continued to grow their annual sales.
Another recently acquired brand, Huawei, offers immense
potential through its wide range of well-priced products and
the considerable sums it invests into research and
development (R&D). Although expanding aggressively around
Mu
stek In
tegrated
An
nu
al Rep
ort 2
01
2
19
were implemented. In line with King III, a Social and Ethics
Committee at Board level was established in April 2012,
and it held its first two meetings before the end of the
financial year.
During this period there were no changes to the directors of
the Board, which means that a settled and well-informed
team is guiding Mustek into the 2013 financial year.
Appreciation
The fact that Mustek continues to make solid progress in
developing our business model and generating profits in the
context of a highly unstable international economic climate,
again shows the hard-working commitment and loyalty of the
entire Mustek team – from bottom to top. The Group is
blessed to be staffed by a willing and stable workforce, as
proven by our low employee turnover rate and remarkably
sound labour relations.
To our employees and various stakeholders – ranging from
investors, salespeople, distributors, and all those consumers
who add value to their lives by using our products – we
thank you for your steady loyalty and support. In this next
financial year, we will work harder and smarter to bring the
new products and services to you that are making this
Information Age such an exciting era to be living in.
Yours sincerely
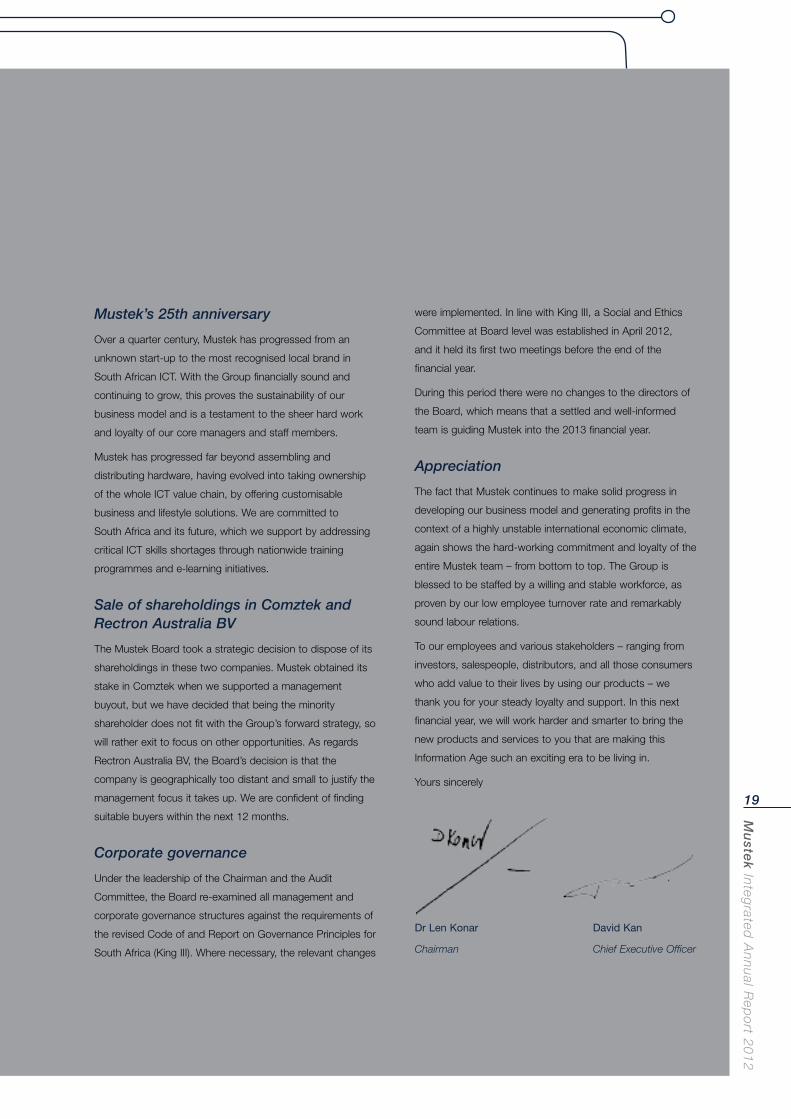
Dr Len Konar David Kan
Chairman Chief Executive Officer
Mustek’s 25th anniversary
Over a quarter century, Mustek has progressed from an
unknown start-up to the most recognised local brand in
South African ICT. With the Group financially sound and
continuing to grow, this proves the sustainability of our
business model and is a testament to the sheer hard work
and loyalty of our core managers and staff members.
Mustek has progressed far beyond assembling and
distributing hardware, having evolved into taking ownership
of the whole ICT value chain, by offering customisable
business and lifestyle solutions. We are committed to
South Africa and its future, which we support by addressing
critical ICT skills shortages through nationwide training
programmes and e-learning initiatives.
Sale of shareholdings in Comztek and Rectron Australia BV
The Mustek Board took a strategic decision to dispose of its
shareholdings in these two companies. Mustek obtained its
stake in Comztek when we supported a management
buyout, but we have decided that being the minority
shareholder does not fit with the Group’s forward strategy, so
will rather exit to focus on other opportunities. As regards
Rectron Australia BV, the Board’s decision is that the
company is geographically too distant and small to justify the
management focus it takes up. We are confident of finding
suitable buyers within the next 12 months.
Corporate governance
Under the leadership of the Chairman and the Audit
Committee, the Board re-examined all management and
corporate governance structures against the requirements of
the revised Code of and Report on Governance Principles for
South Africa (King III). Where necessary, the relevant changes
Mu
ste
k In
teg
rate
d A
nn
ual
Rep
ort
20
12
20
Corporate strategy
Mission statement
Mustek assembles, markets and distributes ICT (Information
Communication Technology) products and services. Mustek
provides competitive, value-added services to our customers
and creates wealth for shareholders. Mustek meets its
objectives through strong relationships in the international
ICT market by continually nurturing the entrepreneurial spirit
of our people and business associates.
Vision and mission
Corporate vision
Mustek will achieve its corporate objectives through:
leadership in its chosen markets
increasing market share while maintaining margins
maintaining its leadership position by introducing
technology advances to the marketplace ahead of other
suppliers
superior procurement, manufacturing and distribution
capabilities, ensuring that high-quality, competitively priced
products and services are delivered to customers
equity in the workplace through focused empowerment
initiatives
growth and value through targeted initiatives with larger,
high-value customers.
Mu
stek In
tegrated
An
nu
al Rep
ort 2
01
2
21
Operational divisions
Mustek
Mecer is Mustek’s original brand and has proven brand
recognition in over 95% of the target market. Mecer-branded
products generate about 20% of the Group’s overall revenue.
Mecer produces a range of desktop PCs, notebooks and
accessories, as well as custom-built computer systems
specified by clients.
As the only brand produced in-house by Mustek, Mecer
operates a production line that includes assembly, testing,
quality control, checking and packing. It has an average
output of 400 units per day, which can be increased to
700 per day without requiring overtime work. January
through to April is the busiest time, during which Mustek
produces approximately 16 000 Mecer units per month – an
average of 735 units per day.
Quality assurance lab
The Mustek Electronics Quality Assurance Lab was
developed to create a sophisticated information and
communication infrastructure. The aim of the lab is to supply
and research information to supply a better product, create
better product knowledge, and offer better product support.
In return, all departments benefit from the information
generated.
Service
The effective handling of warranty and post-warranty repair
services can be a key differentiator between distributors,
especially in South Africa.
Mustek has state-of-the-art repair workshops that are
authorised by many leading ICT brands to service and repair
its products.
The Mustek Service Centre has a large PC board component
level repair facility at Midrand, with advanced facilities for
activities such as testing, de-bugging, applying Engineering
Change Orders, Bios flashing and EPROM reprogramming.
Operational Review
Rectron
Rectron’s core business is the importation and distribution
of computer components to computer dealers, resellers
and systems integrators. Rectron is widely recognised as
South Africa’s leading ICT and consumer electronics
distributor.
Major brands distributed by Rectron include: Gigabyte, Intel,
Microsoft, Samsung, Sony, Transcend, Tomtom, Seagate,
LiteON, PCM, Acer, AMD, Corsair, Epson, Leadtek, Western
Digital, ZyXEL, Luxa2, Symantec, AOpen, Envision, Imation,
Panasonic, Partner Tech and LG.
Rectron conducts its business through three divisions, each
focused on a particular segment of the business. These
divisions are the:
Consumer Business Group;
White Box PC Business Group; and
MNC Business Group.
Highlights
The 2012 financial year was a period of fundamental renewal
for Rectron. After the resignation of longstanding CEO
Mark Lu and several senior executives, Lindi Shortt was
appointed as the new CEO together with a new executive
team.
The new brooms wasted no time in sweeping clean, with
Rectron rebounding from sub-optimal results in the first
six months to a stellar performance in the last two quarters.
This turnaround provides a foundation of excellence for
significantly improved performances in coming years.
Much emphasis was placed on staff morale, work
environment, productivity and realigning the workforce to a
shared set of goals. The result was a harmonious team spirit,
with fewer HR issues and staff resignations.
Building the product portfolio
Highlights were the gaining of the Canon brand in February
2012 and signing up Corsair in June 2012. Corsair’s range of
high-performance computing hardware will expand Rectron’s
offering of higher margin products in the lucrative gaming
Mu
ste
k In
teg
rate
d A
nn
ual
Rep
ort
20
12
22
Operational Review (continued)
Comztek
Comztek is a distributor and specialist services provider for
the ICT networking and communications sector. It offers
quality hardware and software that can be packaged to meet
specific client needs in these fields. It can be described as a
tier 2 distributor to resellers of integrated systems
infrastructure.
The company is one of South Africa’s leading names in
networking and integrated communications and, in the last
five years, has successfully expanded its services into
26 other African countries. Clients are serviced from its main
Midrand offices; regional offices in Kenya, Mauritius, Namibia,
Zambia and Zimbabwe; and its KwaZulu-Natal and Western
Cape branches.
Comztek is a shareholder in Netshield, a South African
research and development house that specialises in the
networking, datacom, telecom and Free Space Optical laser
communications environments.
Financial performance
Comztek’s overall financial performance in this period was
disappointing, primarily due to losing the sole distributorship
in South Africa of Microsoft’s Xbox console and the
associated games. Microsoft had given fair warning of its
intention to introduce a second distributor, but the
consequence was a 35% loss of market share in Comztek’s
single biggest retail consumer line, which makes up between
15 to 20% of the company’s revenue. To regain profitability,
Comztek restructured its retail operation and unfortunately
had to reduce the headcount by 12%.
On a positive note, Comztek’s cross-border revenues grew
by 30%, delivering more than double the budgeted profit.
Key risks, opportunities and strategies
About 70% of Comztek’s business is still done in
South Africa, although growth here is slow in what is a
relatively developed market for Africa. As the company
expands its operations outside into other African economies,
it is finding that the comparative lack of ICT infrastructure
market, among others. Rectron will also distribute Mustek-
aligned brands such as Brother, D-link and Huawei into
specific niche markets. RCT – Rectron’s in-house brand – is
a growing contributor to the overall product pool. In this
period, Rectron re-established its agreement with Samsung
as one of only three tier 1 distributors in South Africa. It
remains the sole local distributor for Gigabyte products.
Optimising the inventory and resolving operational issues
The incoming executive team addressed certain inherited
issues that were inhibiting business performance. The result
is improved control systems for stock forecasting and timely
accessing of forex. Rectron also tackled the issue of ageing
stock and reduced the capital tied up in inventory.
Automated storage system
A key competitive advantage is Rectron’s automated
warehouse, which is among the most advanced of its kind in
the southern hemisphere. Installed at Rectron’s primary
distribution centre in Midrand, Gauteng, the system is
capable of storing 3 050 pallets, utilising seven cranes
running simultaneously and covering three metres per
second. A 12-metre container can be loaded or unloaded in
just 30 minutes.
The automated storage system is designed for drastically
minimised vibration, which is essential for handling sensitive
components like hard drives.
Outlook for the year ahead
Staff morale at Rectron has never been higher and the entire
operation is committed to achieve its targets. One major
initiative is a partnership with Sony SA to establish Sony
Service Clinics across the country – repair and maintenance
facilities for consumers to have any Sony device serviced or
repaired free of charge, or at significantly reduced prices.
The company also intends boosting the Rectron experience
with new, hi-visual signage at its main branches, as well as
setting up high-tech service lounges.
Mu
stek In
tegrated
An
nu
al Rep
ort 2
01
2
23
there is translating into promising growth opportunities. It is
anticipated that the size of Comztek’s cross-border
operations will equal or be bigger than its South African
returns within the next three to five years.
There is a certain degree of currency risk, which is implicit in
any export business, but the company has the safety of
dealing in a basket of currencies rather than just Rand or US
Dollars. This is also true of our business model, which is
aimed at many countries rather than being confined to
South Africa’s sluggish economy.
The new Internet undersea cables that have landed on
Africa’s western and eastern seaboards – with more
under way – offer massive opportunities for Comztek, as it
specialises in providing the hardware and systems for linking
networks and infrastructure to these cables. It intends being
one of the major providers as infrastructure is rolled out to
distribute this bandwidth.
Doing business in Africa can be challenging, particularly for
new companies entering these markets but, after five years,
Comztek is well established and knows the ropes for doing
successful business in these regions.
Outlook for the forthcoming year
Mustek has stated its intention to sell its 42% shareholding in
Comztek during the next 12 months and Comztek remains
confident that its investment proposition and prospects are
appealing enough to attract a suitable buyer. It is hopeful that
the right investor will add value through vision, management
support and possible investment into expanding operations.
Comztek has developed a unique and effective distribution
model in Africa that is well suited for additional brands
wanting to enter these markets, but which lack the expertise
and experience to do so. It is in the strategic position of
being able to market and distribute hardware and software
brands across 26 African countries. This unique selling
proposition has already attracted the attention of several top
ICT brands and discussions are under way.
Mustek in Africa
Mustek exports to, or has operations in, 17 African countries.
Its Export division develops and manages the Group’s export
drive into Africa, which focuses on long-term business
relationships, quality and logistics to give Mustek the
competitive edge. Mustek’s distribution channels and dealer
support systems are undoubtedly the quickest and most
comprehensive. Typically, two to three top dealers are
selected in each country, and support each other
through marketing and sales campaigns, assistance with
import/export legalities, on-site stockpiling of spares and
rapid supply of products by air or road. Mustek can
assemble and deliver orders within two days, whereas
competitors are often limited by delivery times of six weeks
or more.
Nigeria
Mustek has a 12% shareholding in Zinox in Nigeria, which is
a dominant West African brand. As a minority shareholder
and with no trading or supply agreement in place, Mustek will
dispose of this asset when a suitable opportunity arises.
Zimbabwe
During Zimbabwe’s hyper-inflation period, Mustek Zimbabwe
was sold to its management team for a nominal amount,
while retaining an option to repurchase a 28% shareholding,
again for a nominal amount. This option was exercised
during December 2010. Mustek is pleased to report that
Mustek Zimbabwe is beginning to thrive again, as that
country’s economy slowly improves.
Kenya
Mustek East Africa is showing promise, as it returned to
profitability in the year under review. With the East African
economies growing consistently at above 5% per annum, it
is anticipated that this operation will deliver improving results
in the coming years.
Mu
ste
k In
teg
rate
d A
nn
ual
Rep
ort
20
12
24
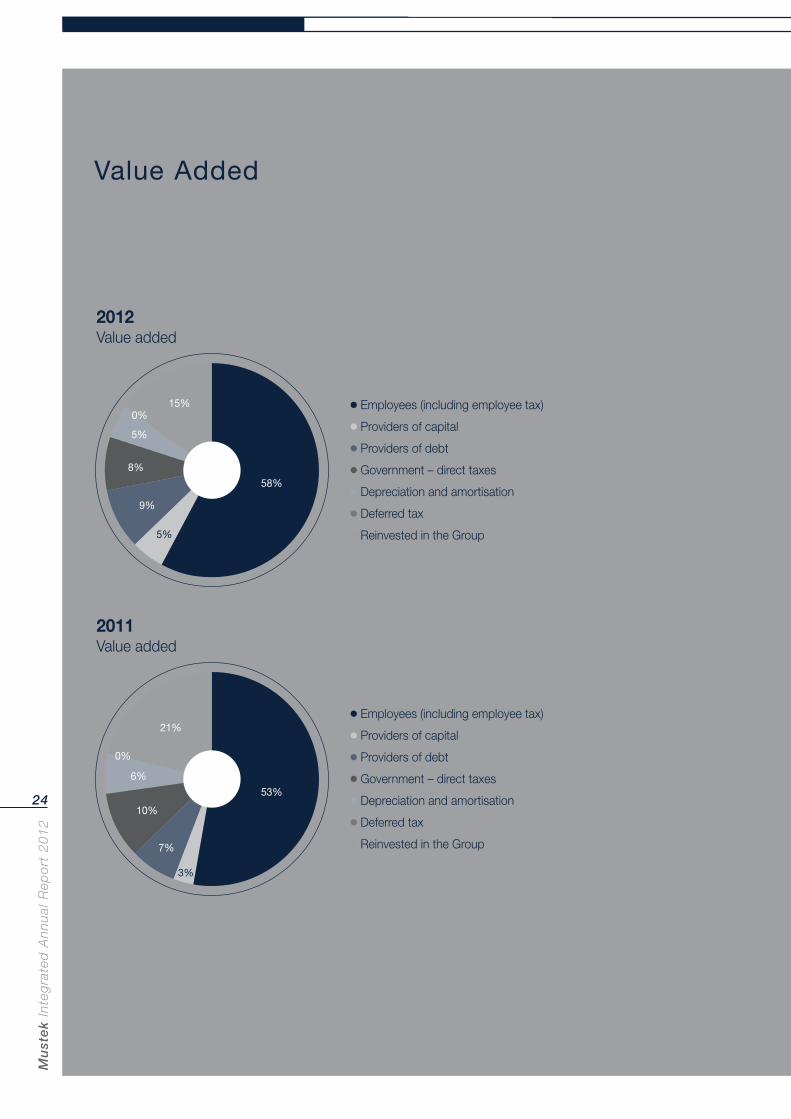
Value Added
● Employees (including employee tax)
● Providers of capital
● Providers of debt
● Government – direct taxes
● Depreciation and amortisation
● Deferred tax
● Reinvested in the Group
8%
9%
58%
5%
15%
5%
2012Value added
● Employees (including employee tax)
● Providers of capital
● Providers of debt
● Government – direct taxes
● Depreciation and amortisation
● Deferred tax
● Reinvested in the Group
10%
7%
53%
3%
0%
21%
6%
2011Value added
0%

Mu
stek In
tegrated
An
nu
al Rep
ort 2
01
2
25
communicationtechnology
Mu
ste
k In
teg
rate
d A
nn
ual
Rep
ort
20
12
26
Sustainability and Social and Environmental Reporting
Our management maintains a transparent and accessible
relationship with the almost 1 000 staff across South Africa,
which ensures a harmonious working environment and keeps
workplace conflicts to a minimum.
We have a mature and well-entrenched range of effective
human resources policies and procedures, all of which are
introduced to new employees during their induction and are
accessible via the Company intranet.
Mustek is proud of our staff members’ dedication to the
family spirit of the Company, evidenced by its low resignation
rate for the ICT industry. Many employees have over 15
years’ service. Several employees, including the CEO, have
been with us for over 20 years. This bears testimony to the
fact that we remain a preferred employer for many of
South Africa’s talented ICT professionals.
Health and safety
Four per cent of Mustek’s staff are represented in formal joint
management-worker health and safety committees, which
help monitor and advise on occupational health and safety
programmes. Our rates of injury, occupational diseases, lost
days, absenteeism, and number of work-related fatalities are
currently not being measured and recorded. In terms of
education, training, counselling, prevention, and risk-control
programmes are in place to assist workforce members, their
families or community members regarding serious diseases,
and 100% of our staff are trained on wellness annually – with
a specific emphasis on HIV transmission and prevention. No
health and safety topics are covered in formal agreements
with trade unions.
Mustek conforms to all applicable health and safety
legislation and we conduct our business within the
parameters of a Group Safety, Health, Environmental and
Quality (SHEQ) manual. Emergency and disaster recovery
plans have been prepared for all areas and the workforce is
thoroughly trained in their application.
The Group’s focus on health and safety is driven by staff
volunteers, who are elected by their peers onto various
health and safety committees. These committees meet
Approach and sustainability journey
Sustainability is central to Mustek’s business model and we
consider not only issues of financial sustainability, but also
those relating to the environment, social impact and the
principles of good governance. While the Group already
addresses key areas of our overall sustainability, it is currently
in the process of formalising its approach to non-financial
sustainability and is assessing the best way to put in place a
sustainability policy and framework.
Sustainability focus areas Our people
Labour relations
Every Mustek staff member has received training in all
Mustek policies. These policies comply with human rights
in terms of South African labour law requirements which
embody human rights. No incidents of discrimination within
Mustek were recorded in the past financial year, no forced or
compulsory labour was applied, there were no incidents
regarding violations of the rights of indigenous people, and
no grievances were filed related to human rights. No human
rights reviews or impact assessments have been undertaken
with Mustek staff.
Mustek complies with the Labour Relations Act and all
associated labour legislation in the spirit of freedom of
association. Employees may associate with, or be members
of, any representative organisation or trade union that they
choose. All disciplinary cases and disputes are handled in
terms of a legally compliant disciplinary code and grievance
procedure, which applies to all our South Africa-based
employees, managers and executives. Clear explanations of
disciplinary and grievance procedures are made available to
our employees at all Mustek workplaces.
There are no collective bargaining agreements in place
between employees and Mustek. In terms of benefits,
full-time employees are provided with membership to the
Company pension fund, while temporary or part-time
employees are not. Mustek has a 100% score in the
return-to-work and retention rate after parental leave.
Mu
stek In
tegrated
An
nu
al Rep
ort 2
01
2
27
quarterly to assess Company performance in terms of health,
safety and related issues, and to suggest possible
improvements to safety procedures across the organisation.
No reportable SHEQ incidents occurred during the year
under review.
HIV/AIDS and the workplace
For nearly a decade, we have conducted a comprehensive
HIV/AIDS strategy and programme, based on the core
principle that the human rights and dignity of any employees
infected by the virus should, at all times, and under all
circumstances, be upheld. The approach also recognises the
need to educate all our employees regarding HIV/AIDS to
empower them to protect themselves and their loved ones
from the disease. This programme also provides antiretroviral
drugs to HIV-positive staff as needed.
Mustek continues to fund this programme in its entirety, with
none of the costs passed on to employees. In addition, the
confidentiality of employees seeking assistance via the
programme is assured at all times.
Training and education
Mustek competes in a high-tech industry in which the correct
skills and experience are always in short supply. As such,
ongoing skills development and training is a business
imperative. The continued in-house training of our staff allows
us to stay abreast of constantly changing technology.
Specialised training courses are outsourced to reputable and
appropriately registered service providers. Mustek is a fully
accredited member of the ISETT SETA and we reclaim our
full development levies every year.
The Group develops skills and talent from within the ranks of
our own employees – striving, at the same time, to develop
the industry leaders of the future. In line with national
directives, priority in terms of skills development is given to
previously disadvantaged individuals (PDIs), including women.
The ICT industry in South Africa continues to be challenged
by the scarcity of key skills – and Mustek is no exception. As
such, we regularly sponsor accredited ‘learnerships’, with
over 30 learners presently on the programme. South Africans
from diverse backgrounds are selected for training to
become employable in the ICT industry. They receive a salary
during this period and their training fees are fully sponsored
by us. Upon completion of the programme, we offer
employment opportunities to those ‘graduates’ with the
appropriate skills to fill any vacancies that exist in the Group.
Those not immediately employed by us generally find work
within the industry due to their Mustek-sponsored IT training.
We also continue our popular and successful adult English
literacy programme for staff whose first language is not
English.
Our progressive education and training vision benefit not only
the Group, but also the broader South African economy.
Identifying future leaders
Mustek is passionate about the development of our future
leaders. We continually develop in-house and tailor-made
programmes with the golden thread of connecting the
Company strategy throughout everyday work and leadership.
Our programmes start at an entry Foundation level, followed
by Jump (junior management). This facilitates continual
learning through self-awareness, as well as on-line coaching
and training that cultivates leadership capabilities. We
support our future leaders with the day-to-day application of
newly acquired soft and technical skills. There are currently
18 employees being developed at the Foundation level, and
five employees on the Jump initiative. A Mustek certification
will be awarded once a candidate has successfully
completed the training course.
Mu
ste
k In
teg
rate
d A
nn
ual
Rep
ort
20
12
28
Sustainability and Social and Environmental Reporting (continued)
All of our staff receive regular performance and career development reviews, on a quarterly basis. The average hours of training per
year per employee are not recorded at present.
All our security personnel are also trained in Mustek’s values and aspects of operations.
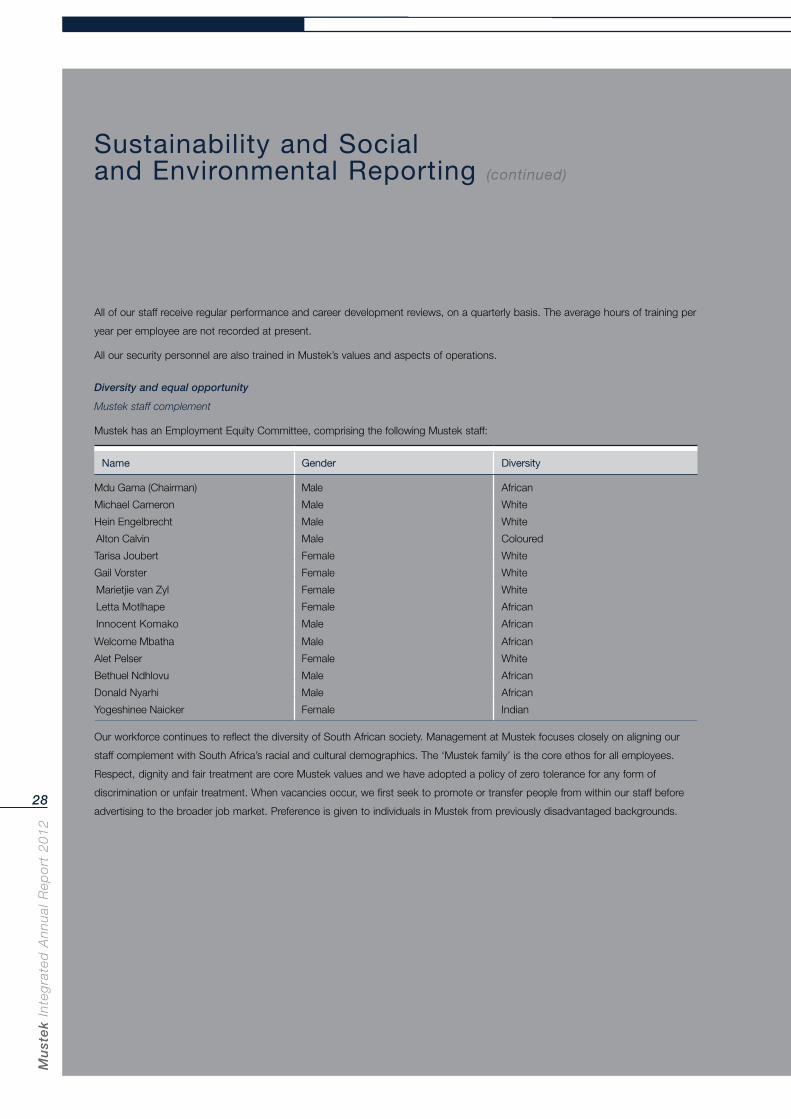
Diversity and equal opportunity
Mustek staff complement
Mustek has an Employment Equity Committee, comprising the following Mustek staff:
Name Gender Diversity
Mdu Gama (Chairman) Male African
Michael Cameron Male White
Hein Engelbrecht Male White
Alton Calvin Male Coloured
Tarisa Joubert Female White
Gail Vorster Female White
Marietjie van Zyl Female White
Letta Motlhape Female African
Innocent Komako Male African
Welcome Mbatha Male African
Alet Pelser Female White
Bethuel Ndhlovu Male African
Donald Nyarhi Male African
Yogeshinee Naicker Female Indian
Our workforce continues to reflect the diversity of South African society. Management at Mustek focuses closely on aligning our
staff complement with South Africa’s racial and cultural demographics. The ‘Mustek family’ is the core ethos for all employees.
Respect, dignity and fair treatment are core Mustek values and we have adopted a policy of zero tolerance for any form of
discrimination or unfair treatment. When vacancies occur, we first seek to promote or transfer people from within our staff before
advertising to the broader job market. Preference is given to individuals in Mustek from previously disadvantaged backgrounds.
Mu
stek In
tegrated
An
nu
al Rep
ort 2
01
2
29
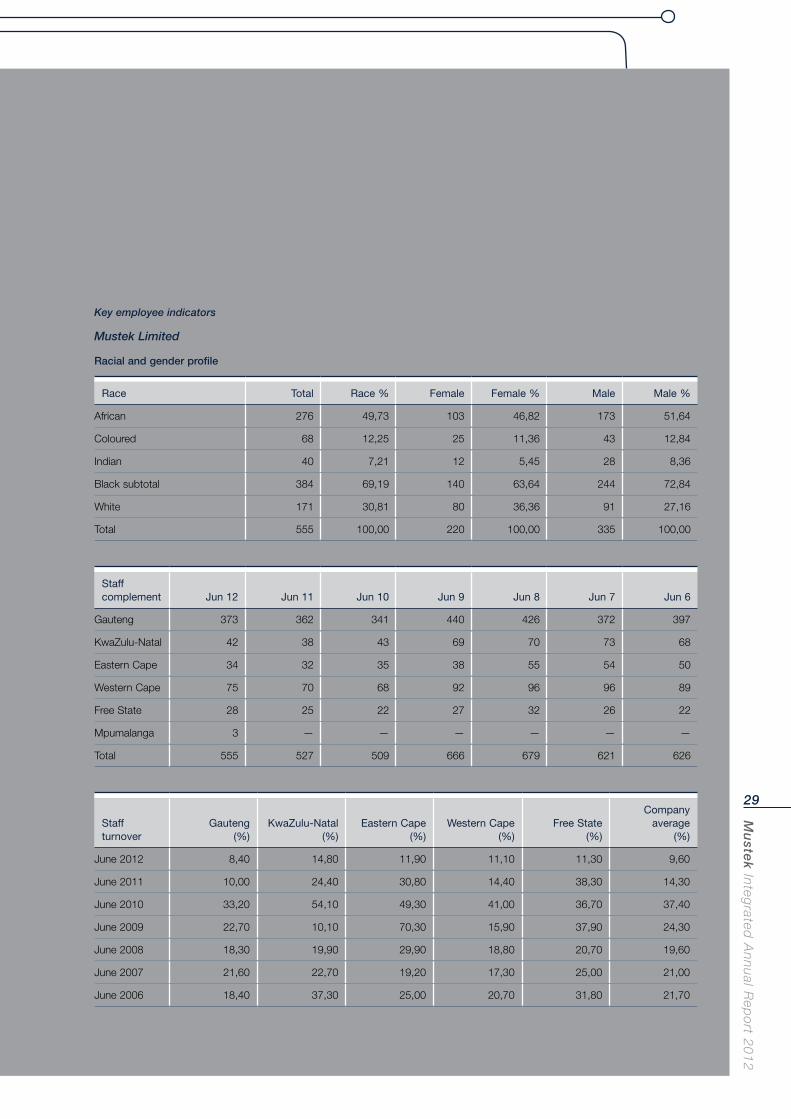
Key employee indicators
Mustek Limited
Racial and gender profile
Race Total Race % Female Female % Male Male %
African 276 49,73 103 46,82 173 51,64
Coloured 68 12,25 25 11,36 43 12,84
Indian 40 7,21 12 5,45 28 8,36
Black subtotal 384 69,19 140 63,64 244 72,84
White 171 30,81 80 36,36 91 27,16
Total 555 100,00 220 100,00 335 100,00
Staff complement Jun 12 Jun 11 Jun 10 Jun 9 Jun 8 Jun 7 Jun 6
Gauteng 373 362 341 440 426 372 397
KwaZulu-Natal 42 38 43 69 70 73 68
Eastern Cape 34 32 35 38 55 54 50
Western Cape 75 70 68 92 96 96 89
Free State 28 25 22 27 32 26 22
Mpumalanga 3 — — — — — —
Total 555 527 509 666 679 621 626
Staff turnover
Gauteng (%)
KwaZulu-Natal (%)
Eastern Cape (%)
Western Cape (%)
Free State (%)
Company average
(%)
June 2012 8,40 14,80 11,90 11,10 11,30 9,60
June 2011 10,00 24,40 30,80 14,40 38,30 14,30
June 2010 33,20 54,10 49,30 41,00 36,70 37,40
June 2009 22,70 10,10 70,30 15,90 37,90 24,30
June 2008 18,30 19,90 29,90 18,80 20,70 19,60
June 2007 21,60 22,70 19,20 17,30 25,00 21,00
June 2006 18,40 37,30 25,00 20,70 31,80 21,70
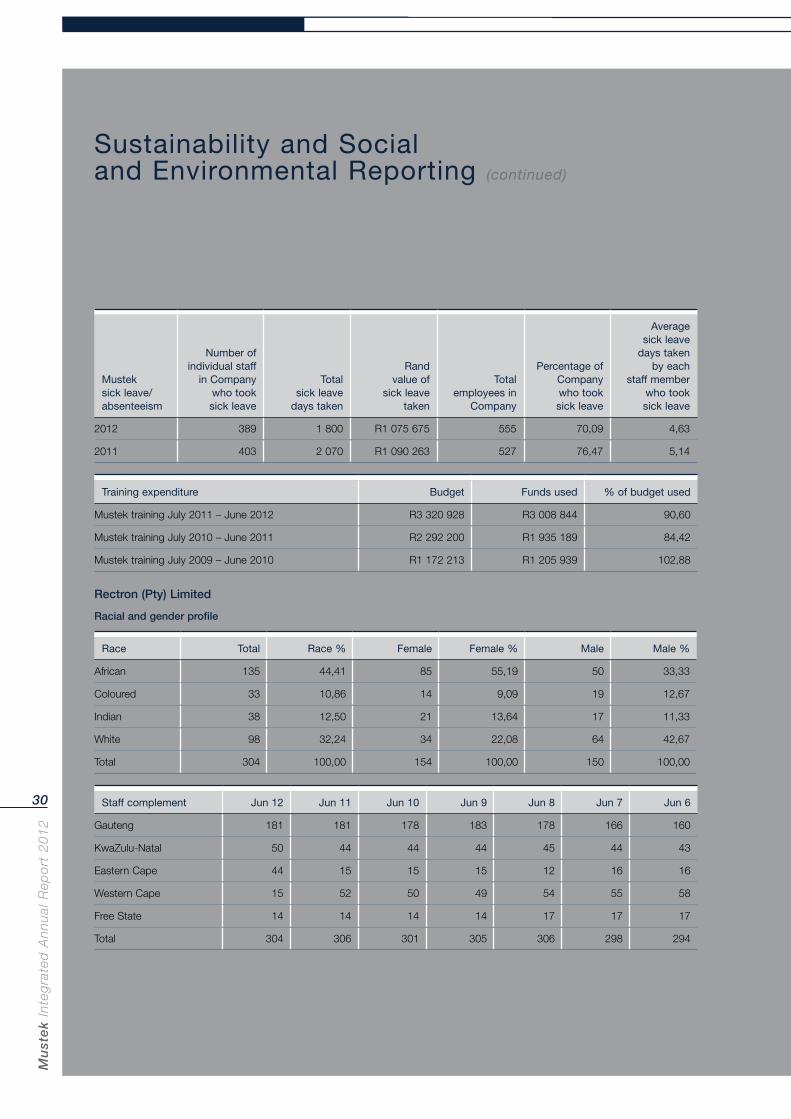
Mu
ste
k In
teg
rate
d A
nn
ual
Rep
ort
20
12
30
Sustainability and Social and Environmental Reporting (continued)
Mustek sick leave/absenteeism
Number of individual staff
in Company who tooksick leave
Total sick leave
days taken
Rand value of
sick leave taken
Total employees in
Company
Percentage of Company who took sick leave
Average sick leave
days taken by each
staff member who took
sick leave
2012 389 1 800 R1 075 675 555 70,09 4,63
2011 403 2 070 R1 090 263 527 76,47 5,14
Training expenditure Budget Funds used % of budget used
Mustek training July 2011 – June 2012 R3 320 928 R3 008 844 90,60
Mustek training July 2010 – June 2011 R2 292 200 R1 935 189 84,42
Mustek training July 2009 – June 2010 R1 172 213 R1 205 939 102,88
Rectron (Pty) Limited
Racial and gender profile
Race Total Race % Female Female % Male Male %
African 135 44,41 85 55,19 50 33,33
Coloured 33 10,86 14 9,09 19 12,67
Indian 38 12,50 21 13,64 17 11,33
White 98 32,24 34 22,08 64 42,67
Total 304 100,00 154 100,00 150 100,00
Staff complement Jun 12 Jun 11 Jun 10 Jun 9 Jun 8 Jun 7 Jun 6
Gauteng 181 181 178 183 178 166 160
KwaZulu-Natal 50 44 44 44 45 44 43
Eastern Cape 44 15 15 15 12 16 16
Western Cape 15 52 50 49 54 55 58
Free State 14 14 14 14 17 17 17
Total 304 306 301 305 306 298 294
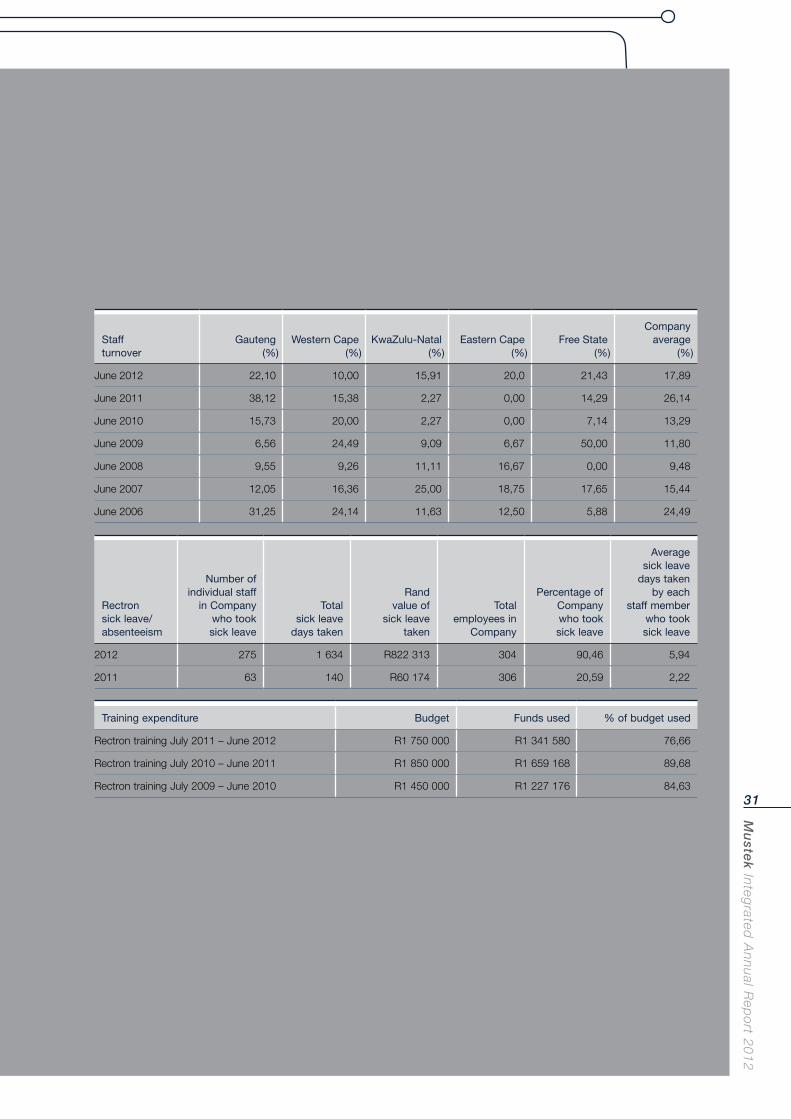
Mu
stek In
tegrated
An
nu
al Rep
ort 2
01
2
31
Staffturnover
Gauteng(%)
Western Cape (%)
KwaZulu-Natal (%)
Eastern Cape (%)
Free State (%)
Company average
(%)
June 2012 22,10 10,00 15,91 20,0 21,43 17,89
June 2011 38,12 15,38 2,27 0,00 14,29 26,14
June 2010 15,73 20,00 2,27 0,00 7,14 13,29
June 2009 6,56 24,49 9,09 6,67 50,00 11,80
June 2008 9,55 9,26 11,11 16,67 0,00 9,48
June 2007 12,05 16,36 25,00 18,75 17,65 15,44
June 2006 31,25 24,14 11,63 12,50 5,88 24,49
Rectron sick leave/absenteeism
Number of individual staff
in Company who took sick leave
Total sick leave
days taken
Rand value of
sick leave taken
Total employees in
Company
Percentage of Company who took sick leave
Average sick leave
days taken by each
staff member who took sick leave
2012 275 1 634 R822 313 304 90,46 5,94
2011 63 140 R60 174 306 20,59 2,22
Training expenditure Budget Funds used % of budget used
Rectron training July 2011 – June 2012 R1 750 000 R1 341 580 76,66
Rectron training July 2010 – June 2011 R1 850 000 R1 659 168 89,68
Rectron training July 2009 – June 2010 R1 450 000 R1 227 176 84,63
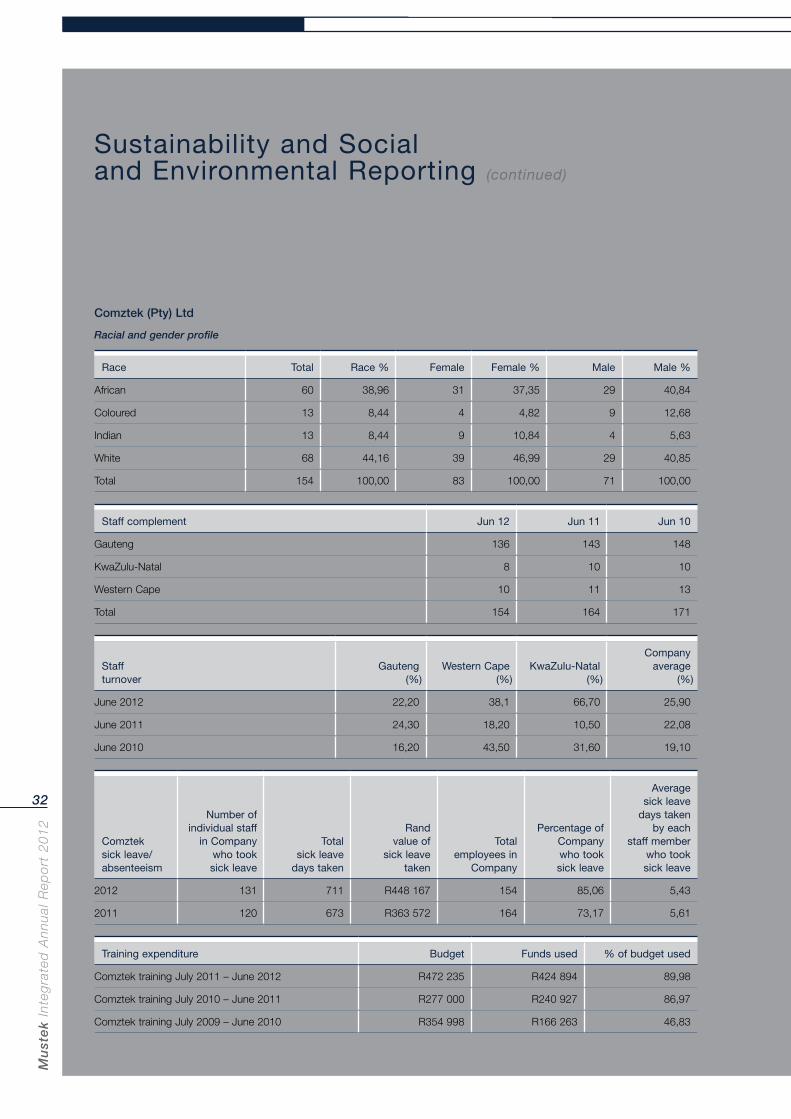
Mu
ste
k In
teg
rate
d A
nn
ual
Rep
ort
20
12
32
Sustainability and Social and Environmental Reporting (continued)
Comztek (Pty) Ltd
Racial and gender profile
Race Total Race % Female Female % Male Male %
African 60 38,96 31 37,35 29 40,84
Coloured 13 8,44 4 4,82 9 12,68
Indian 13 8,44 9 10,84 4 5,63
White 68 44,16 39 46,99 29 40,85
Total 154 100,00 83 100,00 71 100,00
Staff complement Jun 12 Jun 11 Jun 10
Gauteng 136 143 148
KwaZulu-Natal 8 10 10
Western Cape 10 11 13
Total 154 164 171
Staffturnover
Gauteng (%)
Western Cape (%)
KwaZulu-Natal (%)
Company average
(%)
June 2012 22,20 38,1 66,70 25,90
June 2011 24,30 18,20 10,50 22,08
June 2010 16,20 43,50 31,60 19,10
Comzteksick leave/absenteeism
Number of individual staff
in Company who tooksick leave
Totalsick leave
days taken
Randvalue of
sick leave taken
Total employees in
Company
Percentage of Companywho tooksick leave
Averagesick leave
days takenby each
staff member who tooksick leave
2012 131 711 R448 167 154 85,06 5,43
2011 120 673 R363 572 164 73,17 5,61
Training expenditure Budget Funds used % of budget used
Comztek training July 2011 – June 2012 R472 235 R424 894 89,98
Comztek training July 2010 – June 2011 R277 000 R240 927 86,97
Comztek training July 2009 – June 2010 R354 998 R166 263 46,83
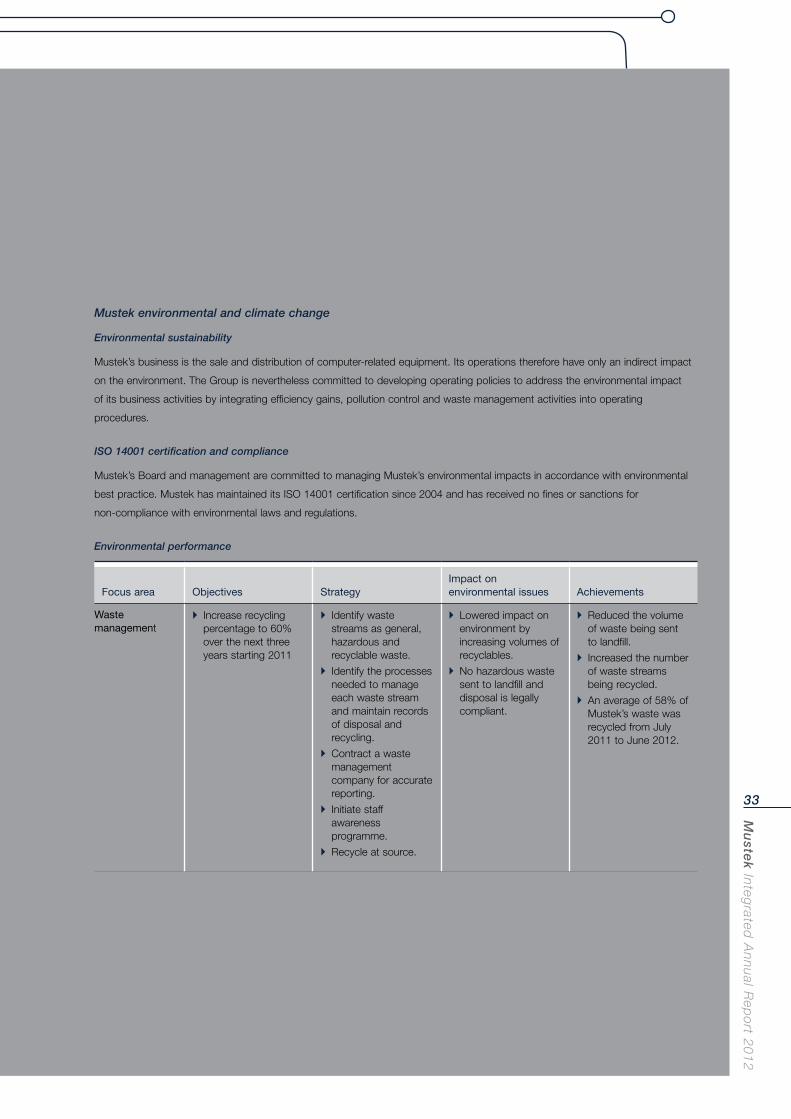
Mu
stek In
tegrated
An
nu
al Rep
ort 2
01
2
33
Mustek environmental and climate change
Environmental sustainability
Mustek’s business is the sale and distribution of computer-related equipment. Its operations therefore have only an indirect impact
on the environment. The Group is nevertheless committed to developing operating policies to address the environmental impact
of its business activities by integrating efficiency gains, pollution control and waste management activities into operating
procedures.
ISO 14001 certification and compliance
Mustek’s Board and management are committed to managing Mustek’s environmental impacts in accordance with environmental
best practice. Mustek has maintained its ISO 14001 certification since 2004 and has received no fines or sanctions for
non-compliance with environmental laws and regulations.
Environmental performance
Focus area Objectives StrategyImpact on environmental issues Achievements
Waste management
Increase recycling percentage to 60% over the next three years starting 2011
Identify waste streams as general, hazardous and recyclable waste.
Identify the processes needed to manage each waste stream and maintain records of disposal and recycling.
Contract a waste management company for accurate reporting.
Initiate staff awareness programme.
Recycle at source.
Lowered impact on environment by increasing volumes of recyclables.
No hazardous waste sent to landfill and disposal is legally compliant.
Reduced the volume of waste being sent to landfill.
Increased the number of waste streams being recycled.
An average of 58% of Mustek’s waste was recycled from July 2011 to June 2012.
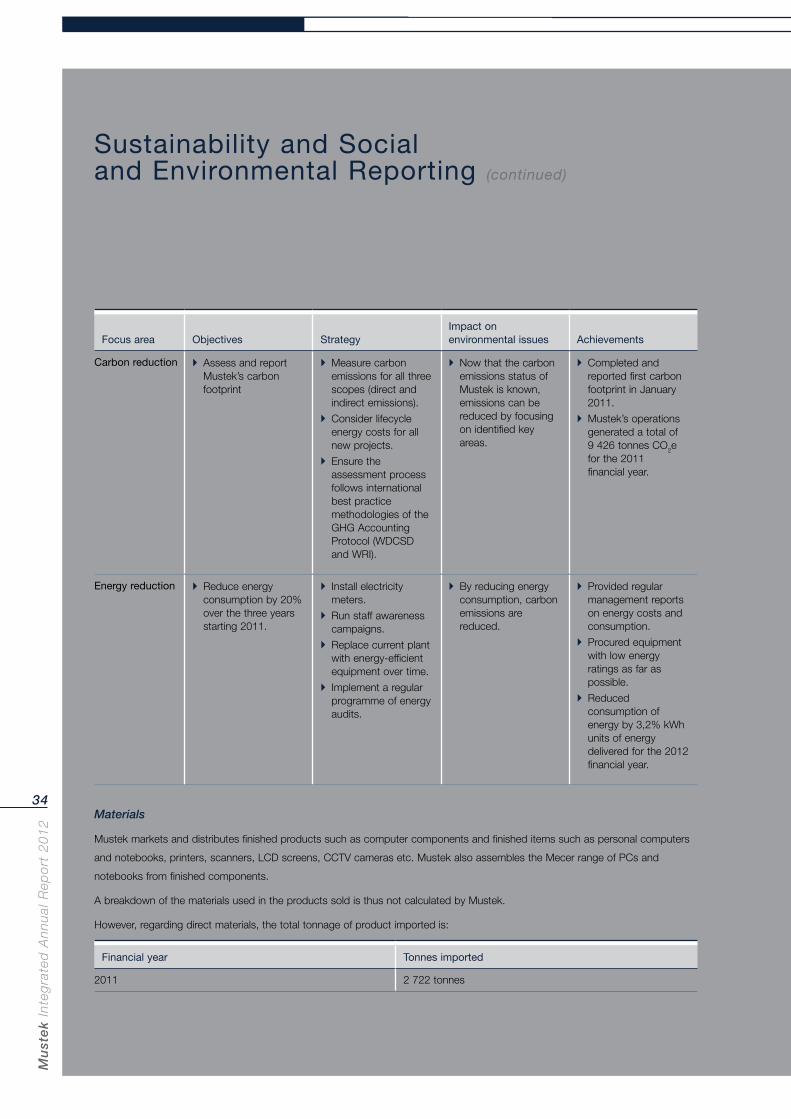
Mu
ste
k In
teg
rate
d A
nn
ual
Rep
ort
20
12
34
Sustainability and Social and Environmental Reporting (continued)
Focus area Objectives StrategyImpact on environmental issues Achievements
Carbon reduction Assess and report Mustek’s carbon footprint
Measure carbon emissions for all three scopes (direct and indirect emissions).
Consider lifecycle energy costs for all new projects.
Ensure the assessment process follows international best practice methodologies of the GHG Accounting Protocol (WDCSD and WRI).
Now that the carbon emissions status of Mustek is known, emissions can be reduced by focusing on identified key areas.
Completed and reported first carbon footprint in January 2011.
Mustek’s operations generated a total of 9 426 tonnes CO2e for the 2011 financial year.
Energy reduction Reduce energy consumption by 20% over the three years starting 2011.
Install electricity meters.
Run staff awareness campaigns.
Replace current plant with energy-efficient equipment over time.
Implement a regular programme of energy audits.
By reducing energy consumption, carbon emissions are reduced.
Provided regular management reports on energy costs and consumption.
Procured equipment with low energy ratings as far as possible.
Reduced consumption of energy by 3,2% kWh units of energy delivered for the 2012 financial year.
Materials
Mustek markets and distributes finished products such as computer components and finished items such as personal computers
and notebooks, printers, scanners, LCD screens, CCTV cameras etc. Mustek also assembles the Mecer range of PCs and
notebooks from finished components.
A breakdown of the materials used in the products sold is thus not calculated by Mustek.
However, regarding direct materials, the total tonnage of product imported is:
Financial year Tonnes imported
2011 2 722 tonnes
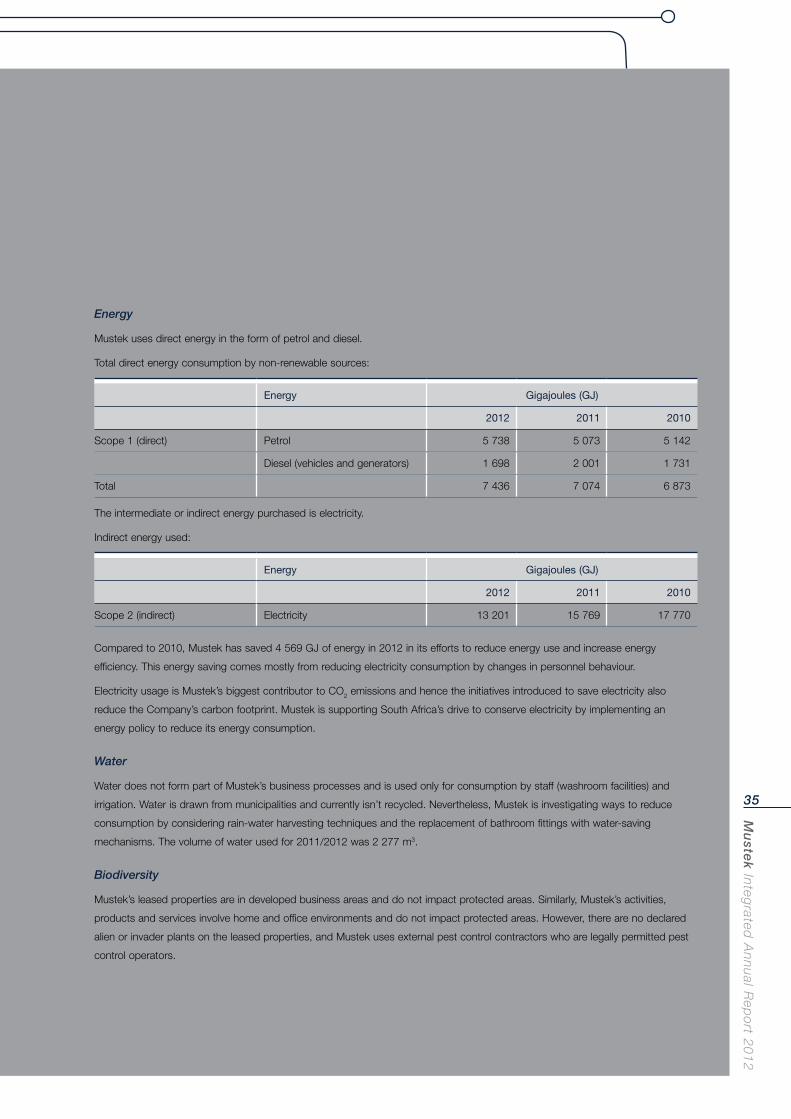
Mu
stek In
tegrated
An
nu
al Rep
ort 2
01
2
35
Energy
Mustek uses direct energy in the form of petrol and diesel.
Total direct energy consumption by non-renewable sources:
Energy Gigajoules (GJ)
2012 2011 2010
Scope 1 (direct) Petrol 5 738 5 073 5 142
Diesel (vehicles and generators) 1 698 2 001 1 731
Total 7 436 7 074 6 873
The intermediate or indirect energy purchased is electricity.
Indirect energy used:
Energy Gigajoules (GJ)
2012 2011 2010
Scope 2 (indirect) Electricity 13 201 15 769 17 770
Compared to 2010, Mustek has saved 4 569 GJ of energy in 2012 in its efforts to reduce energy use and increase energy
efficiency. This energy saving comes mostly from reducing electricity consumption by changes in personnel behaviour.
Electricity usage is Mustek’s biggest contributor to CO2 emissions and hence the initiatives introduced to save electricity also
reduce the Company’s carbon footprint. Mustek is supporting South Africa’s drive to conserve electricity by implementing an
energy policy to reduce its energy consumption.
Water
Water does not form part of Mustek’s business processes and is used only for consumption by staff (washroom facilities) and
irrigation. Water is drawn from municipalities and currently isn’t recycled. Nevertheless, Mustek is investigating ways to reduce
consumption by considering rain-water harvesting techniques and the replacement of bathroom fittings with water-saving
mechanisms. The volume of water used for 2011/2012 was 2 277 m3.
Biodiversity
Mustek’s leased properties are in developed business areas and do not impact protected areas. Similarly, Mustek’s activities,
products and services involve home and office environments and do not impact protected areas. However, there are no declared
alien or invader plants on the leased properties, and Mustek uses external pest control contractors who are legally permitted pest
control operators.
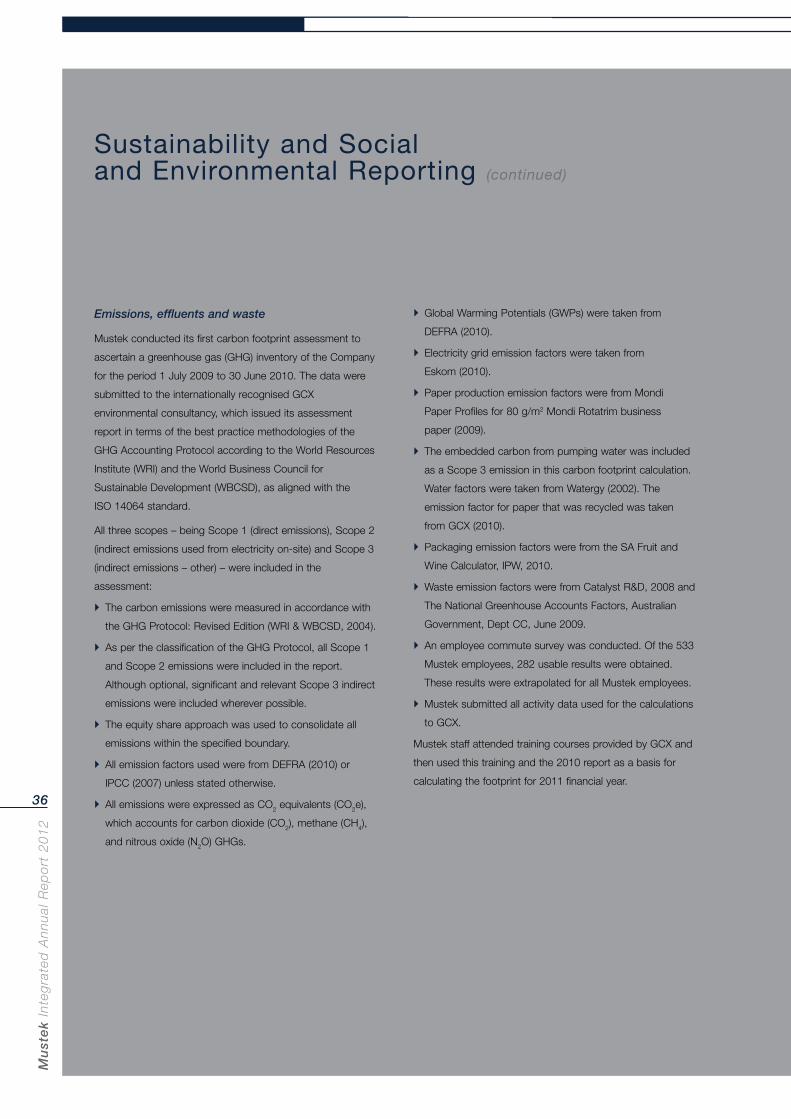
Mu
ste
k In
teg
rate
d A
nn
ual
Rep
ort
20
12
36
Sustainability and Social and Environmental Reporting (continued)
Emissions, effluents and waste
Mustek conducted its first carbon footprint assessment to
ascertain a greenhouse gas (GHG) inventory of the Company
for the period 1 July 2009 to 30 June 2010. The data were
submitted to the internationally recognised GCX
environmental consultancy, which issued its assessment
report in terms of the best practice methodologies of the
GHG Accounting Protocol according to the World Resources
Institute (WRI) and the World Business Council for
Sustainable Development (WBCSD), as aligned with the
ISO 14064 standard.
All three scopes – being Scope 1 (direct emissions), Scope 2
(indirect emissions used from electricity on-site) and Scope 3
(indirect emissions – other) – were included in the
assessment:
The carbon emissions were measured in accordance with
the GHG Protocol: Revised Edition (WRI & WBCSD, 2004).
As per the classification of the GHG Protocol, all Scope 1
and Scope 2 emissions were included in the report.
Although optional, significant and relevant Scope 3 indirect
emissions were included wherever possible.
The equity share approach was used to consolidate all
emissions within the specified boundary.
All emission factors used were from DEFRA (2010) or
IPCC (2007) unless stated otherwise.
All emissions were expressed as CO2 equivalents (CO2e),
which accounts for carbon dioxide (CO2), methane (CH4),
and nitrous oxide (N2O) GHGs.
Global Warming Potentials (GWPs) were taken from
DEFRA (2010).
Electricity grid emission factors were taken from
Eskom (2010).
Paper production emission factors were from Mondi
Paper Profiles for 80 g/m2 Mondi Rotatrim business
paper (2009).
The embedded carbon from pumping water was included
as a Scope 3 emission in this carbon footprint calculation.
Water factors were taken from Watergy (2002). The
emission factor for paper that was recycled was taken
from GCX (2010).
Packaging emission factors were from the SA Fruit and
Wine Calculator, IPW, 2010.
Waste emission factors were from Catalyst R&D, 2008 and
The National Greenhouse Accounts Factors, Australian
Government, Dept CC, June 2009.
An employee commute survey was conducted. Of the 533
Mustek employees, 282 usable results were obtained.
These results were extrapolated for all Mustek employees.
Mustek submitted all activity data used for the calculations
to GCX.
Mustek staff attended training courses provided by GCX and
then used this training and the 2010 report as a basis for
calculating the footprint for 2011 financial year.
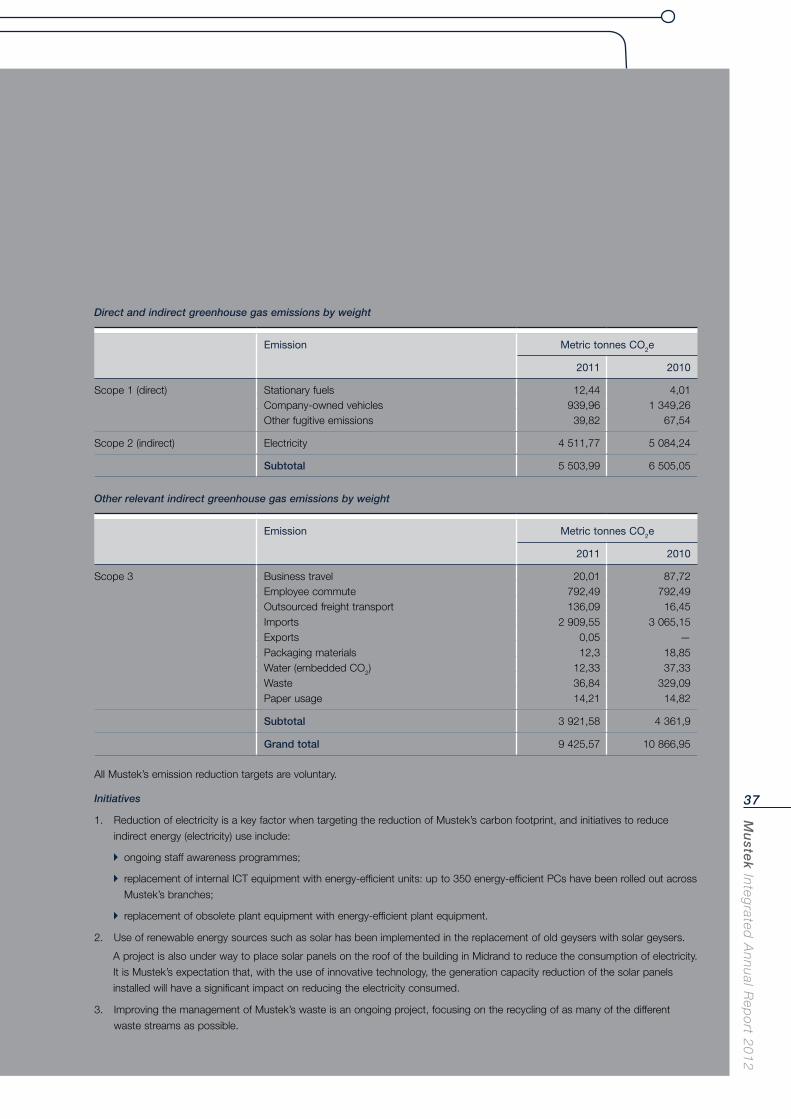
Mu
stek In
tegrated
An
nu
al Rep
ort 2
01
2
37
Direct and indirect greenhouse gas emissions by weight
Emission Metric tonnes CO2e
2011 2010
Scope 1 (direct) Stationary fuels 12,44 4,01Company-owned vehicles 939,96 1 349,26Other fugitive emissions 39,82 67,54
Scope 2 (indirect) Electricity 4 511,77 5 084,24
Subtotal 5 503,99 6 505,05
Other relevant indirect greenhouse gas emissions by weight
Emission Metric tonnes CO2e
2011 2010
Scope 3 Business travel 20,01 87,72Employee commute 792,49 792,49Outsourced freight transport 136,09 16,45Imports 2 909,55 3 065,15Exports 0,05 —Packaging materials 12,3 18,85Water (embedded CO2) 12,33 37,33Waste 36,84 329,09Paper usage 14,21 14,82
Subtotal 3 921,58 4 361,9
Grand total 9 425,57 10 866,95
All Mustek’s emission reduction targets are voluntary.
Initiatives
1. Reduction of electricity is a key factor when targeting the reduction of Mustek’s carbon footprint, and initiatives to reduce
indirect energy (electricity) use include:
ongoing staff awareness programmes;
replacement of internal ICT equipment with energy-efficient units: up to 350 energy-efficient PCs have been rolled out across
Mustek’s branches;
replacement of obsolete plant equipment with energy-efficient plant equipment.
2. Use of renewable energy sources such as solar has been implemented in the replacement of old geysers with solar geysers.
A project is also under way to place solar panels on the roof of the building in Midrand to reduce the consumption of electricity.
It is Mustek’s expectation that, with the use of innovative technology, the generation capacity reduction of the solar panels
installed will have a significant impact on reducing the electricity consumed.
3. Improving the management of Mustek’s waste is an ongoing project, focusing on the recycling of as many of the different
waste streams as possible.
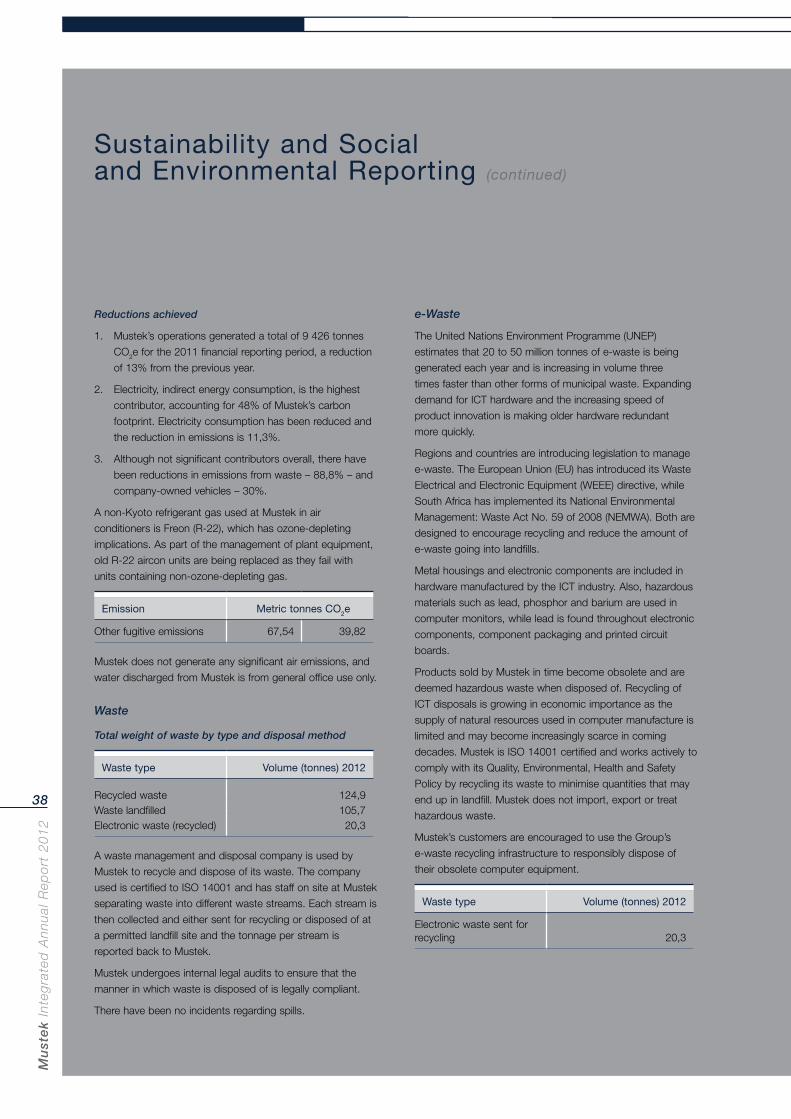
Mu
ste
k In
teg
rate
d A
nn
ual
Rep
ort
20
12
38
Sustainability and Social and Environmental Reporting (continued)
Reductions achieved
1. Mustek’s operations generated a total of 9 426 tonnes
CO2e for the 2011 financial reporting period, a reduction
of 13% from the previous year.
2. Electricity, indirect energy consumption, is the highest
contributor, accounting for 48% of Mustek’s carbon
footprint. Electricity consumption has been reduced and
the reduction in emissions is 11,3%.
3. Although not significant contributors overall, there have
been reductions in emissions from waste – 88,8% – and
company-owned vehicles – 30%.
A non-Kyoto refrigerant gas used at Mustek in air
conditioners is Freon (R-22), which has ozone-depleting
implications. As part of the management of plant equipment,
old R-22 aircon units are being replaced as they fail with
units containing non-ozone-depleting gas.
Emission Metric tonnes CO2e
Other fugitive emissions 67,54 39,82
Mustek does not generate any significant air emissions, and
water discharged from Mustek is from general office use only.
Waste
Total weight of waste by type and disposal method
Waste type Volume (tonnes) 2012
Recycled waste 124,9Waste landfilled 105,7Electronic waste (recycled) 20,3
A waste management and disposal company is used by
Mustek to recycle and dispose of its waste. The company
used is certified to ISO 14001 and has staff on site at Mustek
separating waste into different waste streams. Each stream is
then collected and either sent for recycling or disposed of at
a permitted landfill site and the tonnage per stream is
reported back to Mustek.
Mustek undergoes internal legal audits to ensure that the
manner in which waste is disposed of is legally compliant.
There have been no incidents regarding spills.
e-Waste
The United Nations Environment Programme (UNEP)
estimates that 20 to 50 million tonnes of e-waste is being
generated each year and is increasing in volume three
times faster than other forms of municipal waste. Expanding
demand for ICT hardware and the increasing speed of
product innovation is making older hardware redundant
more quickly.
Regions and countries are introducing legislation to manage
e-waste. The European Union (EU) has introduced its Waste
Electrical and Electronic Equipment (WEEE) directive, while
South Africa has implemented its National Environmental
Management: Waste Act No. 59 of 2008 (NEMWA). Both are
designed to encourage recycling and reduce the amount of
e-waste going into landfills.
Metal housings and electronic components are included in
hardware manufactured by the ICT industry. Also, hazardous
materials such as lead, phosphor and barium are used in
computer monitors, while lead is found throughout electronic
components, component packaging and printed circuit
boards.
Products sold by Mustek in time become obsolete and are
deemed hazardous waste when disposed of. Recycling of
ICT disposals is growing in economic importance as the
supply of natural resources used in computer manufacture is
limited and may become increasingly scarce in coming
decades. Mustek is ISO 14001 certified and works actively to
comply with its Quality, Environmental, Health and Safety
Policy by recycling its waste to minimise quantities that may
end up in landfill. Mustek does not import, export or treat
hazardous waste.
Mustek’s customers are encouraged to use the Group’s
e-waste recycling infrastructure to responsibly dispose of
their obsolete computer equipment.
Waste type Volume (tonnes) 2012
Electronic waste sent for recycling 20,3
Mu
stek In
tegrated
An
nu
al Rep
ort 2
01
2
39
Transport
The sales and distribution of computer-related equipment is a
core process of Mustek’s business. Greenhouse gas
emissions of transport-related impacts were calculated for
Mustek’s carbon footprint and the percentage contribution of
transport to Mustek’s carbon footprint is thus significant at
42%, 4006 CO2e. This calculation includes emissions from
company-owned vehicles, business travel and outsourced
freight transport.
The impact on the environment from local deliveries is
managed by strict maintenance of Mustek’s vehicles,
including measuring vehicle emissions and noise. Delivery
routes are also carefully planned and managed to maximise
deliveries while optimising fuel usage.
Social impacts
Corporate social investment (CSI)
Mustek has a consistent record in community support and
corporate social investment (CSI). The Group traditionally
focuses our CSI efforts on childrens’ needs – in particular
their education – but also supports charities, sporting events
and community facilities.
Local engagement remains the responsibility of each
operation, which carries out their own socio-economic
development programmes based on our Company policy.
The primary focus of our CSI spend is educational initiatives,
and our approach ensures that the most sustainable and
significant positive impact on local communities is achieved
and that value will be created on a long-term basis. All
operations engage their local communities appropriately.
Our value creation includes offering children from previously
disadvantaged communities fully fledged computer labs with
the latest technological offerings to ensure learning on an
interactive level. These communities will now have the
opportunity to be taught on the same platforms as their more
privileged counterparts, which in essence places them on a
level playing field when entering the employment market.
Financial contributions are made by sponsoring disabled men
and women in specifically sought-out learning institutions,
which are adapted for their special needs. These institutions
will ensure they obtain the appropriate skills to pursue a
career in information technology. These graduates will
provide recruitment opportunities for us in the future.
Current initiatives are:
Action for the Blind and Disabled
NNMU
Khayalami School
Bongi Ngema Zuma Foundation
Afrika Tikkun.
Our investment in local communities has increased over the
last three years at an average rate of 11% pa.
Given the nature of the Group’s operations, none has
significant potential or actual negative impacts on local
communities. None of the Company’s operations has
significant potential or actual negative impacts on local
communities, so mitigation measures are not required.
Mustek remains committed to investing in the development
and growth of the economy through our current enterprise
development initiatives. We have sought to partner with
qualifying small and medium enterprises by providing financial
and non-financial support. These initiatives will ensure the
development of these SMMEs and, in turn, enable them to
gain access to the mainstream economy.
No significant indirect economic impacts can currently be
reported on.
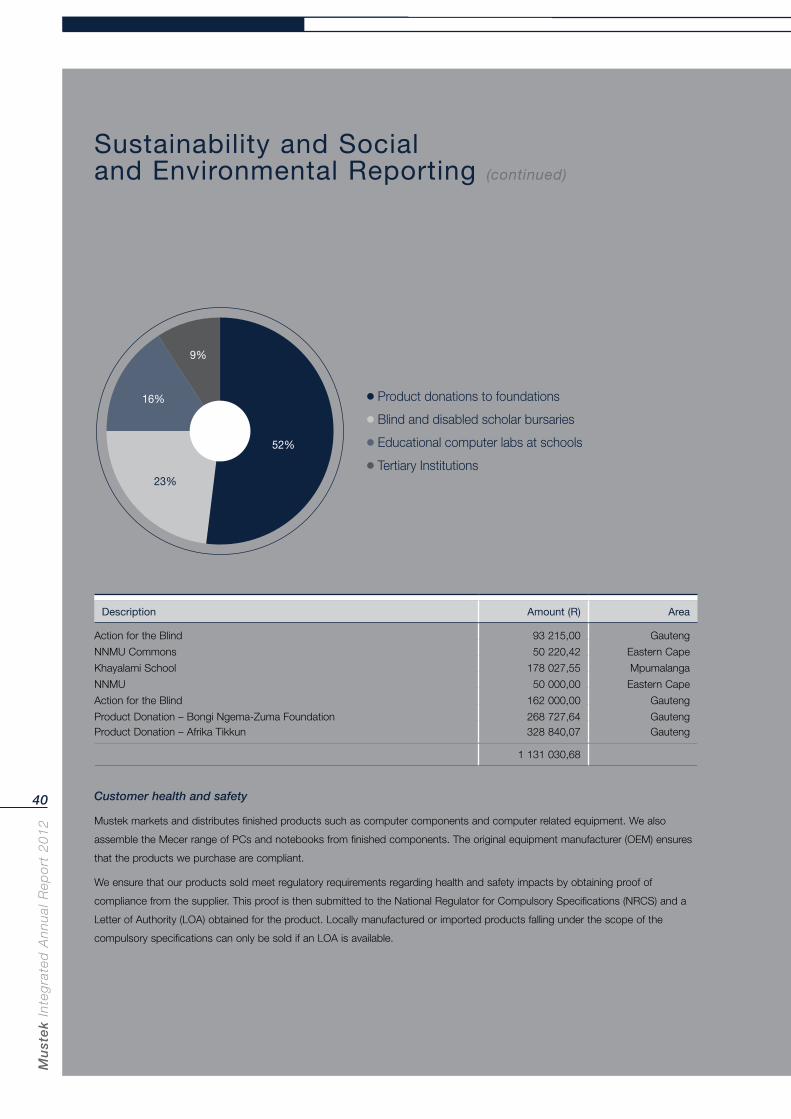
Mu
ste
k In
teg
rate
d A
nn
ual
Rep
ort
20
12
40
Sustainability and Social and Environmental Reporting (continued)
Description Amount (R) Area
Action for the Blind 93 215,00 Gauteng
NNMU Commons 50 220,42 Eastern Cape
Khayalami School 178 027,55 Mpumalanga
NNMU 50 000,00 Eastern Cape
Action for the Blind 162 000,00 Gauteng
Product Donation – Bongi Ngema-Zuma Foundation 268 727,64 GautengProduct Donation – Afrika Tikkun 328 840,07 Gauteng
1 131 030,68
Customer health and safety
Mustek markets and distributes finished products such as computer components and computer related equipment. We also
assemble the Mecer range of PCs and notebooks from finished components. The original equipment manufacturer (OEM) ensures
that the products we purchase are compliant.
We ensure that our products sold meet regulatory requirements regarding health and safety impacts by obtaining proof of
compliance from the supplier. This proof is then submitted to the National Regulator for Compulsory Specifications (NRCS) and a
Letter of Authority (LOA) obtained for the product. Locally manufactured or imported products falling under the scope of the
compulsory specifications can only be sold if an LOA is available.
● Product donations to foundations
● Blind and disabled scholar bursaries
● Educational computer labs at schools
● Tertiary Institutions
52%
23%
16%
9%
Mu
stek In
tegrated
An
nu
al Rep
ort 2
01
2
41
with applicable environmental legislation and to preventing
pollution, with an emphasis on supplier, tenant and customer
influence.
The Group’s occupational health and safety performance is
managed to fully comply with the Occupational Health and
Safety (OHS) Act.
Culture, ethics and values
There is a comprehensive Code of Ethics and Business
Conduct in place to entrench the concepts of fair dealing and
integrity in the conduct of all of the Group’s business. This
commitment, which is actively endorsed by the Board of
Directors, is based on a fundamental belief that business
should be conducted honestly, fairly and legally. Mustek
expects all employees to share its commitment to high
moral, ethical and legal standards.
The code is designed to inform all Mustek’s stakeholders of
policies in various areas, including:
compliance with laws and regulations;
conflicts of interest;
relationships with clients, customers and suppliers;
gifts, hospitality and favours;
discrimination;
health and safety;
environmental management;
political support;
fraud and dishonesty;
external communications;
privacy and confidentiality; and
obligations of employees.
The standards for electrical and electronic apparatus for
compulsory safety are the International Electrotechnical
Commission’s (IEC) Standards. SANS IEC 60950 is the
standard in particular that relates to the safety of information
technology equipment and related equipment. An LOA
confirms product safety, and LOAs are only issued by the
NRCS after successful evaluation of the specified test
reports. There have been no incidents of non-compliance.
Product and service labelling
Labelling regarding the safe use of Mustek’s products is
ensured by obtaining the regulatory ‘Letters of Authority’.
This is a requirement for all computer-related equipment that
Mustek sells. Waste electrical and electronic equipment –
that is, office, information and communication equipment – is
categorised as hazardous. This information is communicated
on the packaging of Mecer machines. There have been no
incidents of non-compliance.
Quality, environmental, health and safety policy
Mustek’s management and personnel are committed to
providing computer-related equipment and services of the
highest quality and technological standards to ensure
continued customer satisfaction. This commitment is
balanced with recognition of the importance of protecting the
environment and a refusal to compromise the occupational
health and safety of employees.
Mustek complies with the requirements of ISO 9001 and
ISO 14001 as measures to provide continuous improvement
in delivering products and services to its customers, as well
as in managing environmental impacts. Mustek is committed
to managing its environmental performance in compliance
Mu
ste
k In
teg
rate
d A
nn
ual
Rep
ort
20
12
42
Corporate Governance Report
Corporate Governance
The King Code of corporate practices and conduct
Mustek strives to maintain and enhance governance
standards by constantly reviewing current and emerging
trends. The Board is committed to complying with the
recommendations of the King Code and Report on
Corporate Governance for South Africa 2009 (King III). All
requirements in terms of the JSE Listings Requirements
dealing with governance are reported on in this report and a
detailed summary of the application of all the King III
principles are listed at the end of the Governance Report.
The directors have recognised the need to conduct the
enterprise with integrity and in accordance with generally
accepted corporate practices.
Code of ethics and conduct
It is a fundamental policy of the Group to conduct its
business with honesty and integrity and in accordance with
the highest legal and ethical standards. All employees at
Group and Company level are required to comply with the
spirit as well as the letter of this policy, and to maintain the
highest standards of conduct in all dealings.
The Board has adopted a Code of Ethics and Conduct for
the Group in order to:
clearly state what is acceptable and unacceptable practice
and behaviour;
guide policy and practices by providing a set of ethical
corporate standards;
encourage continual ethical behaviour of the Board,
managers and employees at all levels;
guide ongoing ethical decision-making;
make infringements easy to identify and respond decisively
thereto;
promote awareness of, and sensitivity to, ethical issues; and
help resolve conflicts expeditiously.
There has been full compliance with the Group’s Code of
Ethics and Conduct during the year under review.
Corporate code of conduct
The Group is committed to:
trading with customers and suppliers who subscribe to
ethical business practices;
non-discriminatory employment practices and the
promotion of employees to realise their potential through
training and development of their skills;
the highest standards of integrity in all its dealings with its
stakeholders and society at large;
carrying-on of business through fair commercial
competitive practices; and
being proactive towards environmental and social
sustainability issues.
Board of DirectorsComposition of the Board
The Group has a unitary Board of Directors that currently
comprises four independent non-executive directors and
three executive directors. No changes to the Board were
made during the reporting period.
The executive directors have overall responsibility for
implementing the Group’s strategy and managing its
day-to-day operations.
Non-executive directors complement the skills and
experience of the executive directors and bring judgement to
bear, independent of management, on issues of strategy,
budgets, performance, resources, transformation, diversity,
employment equity, standards of conduct and evaluation of
performance, contributing to the formulation of policy and
decision-making through their knowledge and experience.
The Board is of the view that all non-executive directors bring
independent judgement to bear on material decisions of the
Company.

Mu
stek In
tegrated
An
nu
al Rep
ort 2
01
2
43
value-added technology
Mu
ste
k In
teg
rate
d A
nn
ual
Rep
ort
20
12
44
Corporate Governance (continued)
Corporate Governance Report (continued)
The Board and its committees are supplied with full and
timely information which enables them to discharge their
responsibilities. They have unrestricted access to all Group
information, records, documents and property. Non-executive
directors have access to management and meet separately
with management without the attendance of executive
directors periodically. The information needs of the Board are
well-defined and regularly monitored. All directors have
access to the advice and services of the Company Secretary
and there is an agreed procedure by which directors may
obtain independent and professional advice at the Group’s
expense, when they deem this necessary.
The Board defines levels of authority, reserving specific
powers to itself and delegating other matters with the
necessary authority to management. These matters are
monitored and evaluated on a regular basis.
Through the Audit and Risk Committee, the Board identifies
the key risk areas and key performance indicators for the
Group. The Board has a process by which these risks are
updated regularly.
On an ongoing basis, the Board reviews the required mix of
skills, experience and other qualities such as its
demographics and diversity in order to assess its
effectiveness.
Procedures for appointment to the Board are formal and
transparent. Following the appointment of new directors to
the Board, visits to the Group’s businesses and meetings
with senior management, as appropriate, as well as
induction, are offered to facilitate their understanding of the
Group and their fiduciary responsibilities.
The Chairman is independent and the roles of the Chairman
and Chief Executive Officer are separate and a clear division
of responsibility exists. Details of the directorate are provided
on page 64 of the integrated annual report. There are no
other contracts of service between any of the directors and
any subsidiaries within the Group.
The non-executive directors take responsibility for ensuring
that the Chairman encourages proper deliberation of all
matters requiring the Board’s attention. The Board ensures
that there is an appropriate balance of power and authority
so that no one individual or block of individuals can dominate
the Board’s decision-making process.
The Board is the focal point for and custodian of corporate
governance and gives strategic direction to the Group under
the chairmanship of Dr Len Konar. The Board meets at least
four times a year and has a formal schedule of matters
reserved to it as recorded in its Board Charter. The Board
retains full and effective control over the Group and monitors
executive management in implementing plans and strategies.
The Board has established a comprehensive control
environment ensuring that risks are mitigated and the
Group’s objectives are attained. This control environment
sets the tone for the Group and covers ethical values,
management’s philosophy and the competence of
employees.
The Board ensures that the Group complies with all relevant
laws, regulations and codes of business practice and that it
communicates with its shareholders and relevant internal and
external stakeholders transparently, promptly and with
substance prevailing over form.
Mr Ralph Patmore is the chairman of the Audit and Risk
Committee and chairs the remuneration-related issues on the
Remuneration and Nomination Committee of the Company.
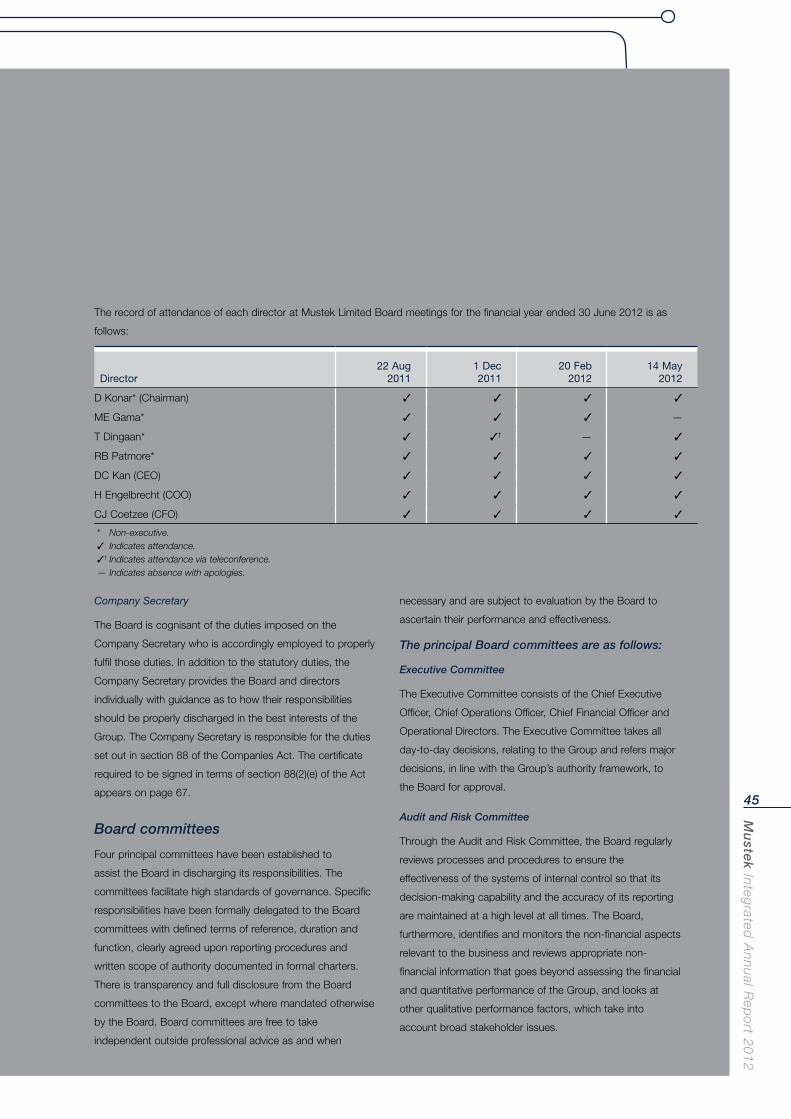
Mu
stek In
tegrated
An
nu
al Rep
ort 2
01
2
45
The record of attendance of each director at Mustek Limited Board meetings for the financial year ended 30 June 2012 is as
follows:
Director22 Aug
20111 Dec2011
20 Feb2012
14 May2012
D Konar* (Chairman) 3 3 3 3
ME Gama* 3 3 3 —
T Dingaan* 3 3† — 3
RB Patmore* 3 3 3 3
DC Kan (CEO) 3 3 3 3
H Engelbrecht (COO) 3 3 3 3
CJ Coetzee (CFO) 3 3 3 3
* Non-executive. 3 Indicates attendance. 3† Indicates attendance via teleconference. — Indicates absence with apologies.
Company Secretary
The Board is cognisant of the duties imposed on the
Company Secretary who is accordingly employed to properly
fulfil those duties. In addition to the statutory duties, the
Company Secretary provides the Board and directors
individually with guidance as to how their responsibilities
should be properly discharged in the best interests of the
Group. The Company Secretary is responsible for the duties
set out in section 88 of the Companies Act. The certificate
required to be signed in terms of section 88(2)(e) of the Act
appears on page 67.
Board committees
Four principal committees have been established to
assist the Board in discharging its responsibilities. The
committees facilitate high standards of governance. Specific
responsibilities have been formally delegated to the Board
committees with defined terms of reference, duration and
function, clearly agreed upon reporting procedures and
written scope of authority documented in formal charters.
There is transparency and full disclosure from the Board
committees to the Board, except where mandated otherwise
by the Board. Board committees are free to take
independent outside professional advice as and when
necessary and are subject to evaluation by the Board to
ascertain their performance and effectiveness.
The principal Board committees are as follows:
Executive Committee
The Executive Committee consists of the Chief Executive
Officer, Chief Operations Officer, Chief Financial Officer and
Operational Directors. The Executive Committee takes all
day-to-day decisions, relating to the Group and refers major
decisions, in line with the Group’s authority framework, to
the Board for approval.
Audit and Risk Committee
Through the Audit and Risk Committee, the Board regularly
reviews processes and procedures to ensure the
effectiveness of the systems of internal control so that its
decision-making capability and the accuracy of its reporting
are maintained at a high level at all times. The Board,
furthermore, identifies and monitors the non-financial aspects
relevant to the business and reviews appropriate non-
financial information that goes beyond assessing the financial
and quantitative performance of the Group, and looks at
other qualitative performance factors, which take into
account broad stakeholder issues.
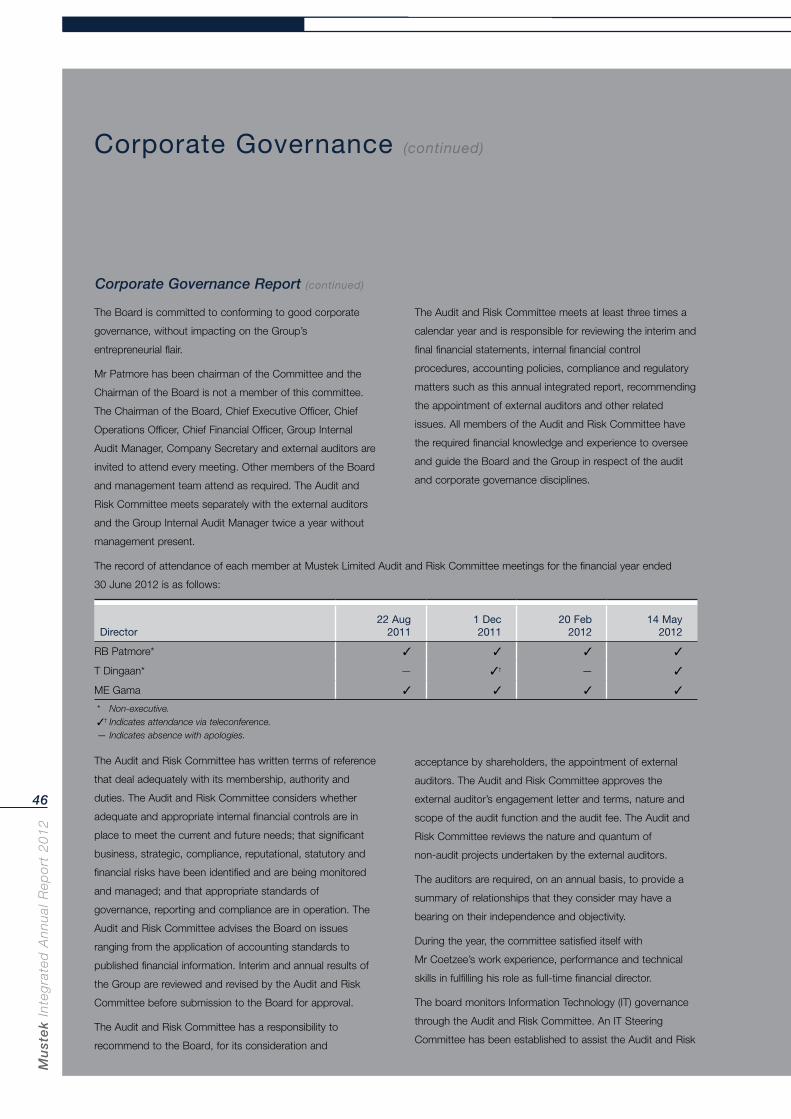
Mu
ste
k In
teg
rate
d A
nn
ual
Rep
ort
20
12
46
Corporate Governance (continued)
Corporate Governance Report (continued)
The Audit and Risk Committee meets at least three times a
calendar year and is responsible for reviewing the interim and
final financial statements, internal financial control
procedures, accounting policies, compliance and regulatory
matters such as this annual integrated report, recommending
the appointment of external auditors and other related
issues. All members of the Audit and Risk Committee have
the required financial knowledge and experience to oversee
and guide the Board and the Group in respect of the audit
and corporate governance disciplines.
The Board is committed to conforming to good corporate
governance, without impacting on the Group’s
entrepreneurial flair.
Mr Patmore has been chairman of the Committee and the
Chairman of the Board is not a member of this committee.
The Chairman of the Board, Chief Executive Officer, Chief
Operations Officer, Chief Financial Officer, Group Internal
Audit Manager, Company Secretary and external auditors are
invited to attend every meeting. Other members of the Board
and management team attend as required. The Audit and
Risk Committee meets separately with the external auditors
and the Group Internal Audit Manager twice a year without
management present.
The record of attendance of each member at Mustek Limited Audit and Risk Committee meetings for the financial year ended
30 June 2012 is as follows:
Director22 Aug
20111 Dec2011
20 Feb2012
14 May2012
RB Patmore* 3 3 3 3
T Dingaan* — 3† — 3
ME Gama 3 3 3 3
* Non-executive. 3† Indicates attendance via teleconference. — Indicates absence with apologies.
The Audit and Risk Committee has written terms of reference
that deal adequately with its membership, authority and
duties. The Audit and Risk Committee considers whether
adequate and appropriate internal financial controls are in
place to meet the current and future needs; that significant
business, strategic, compliance, reputational, statutory and
financial risks have been identified and are being monitored
and managed; and that appropriate standards of
governance, reporting and compliance are in operation. The
Audit and Risk Committee advises the Board on issues
ranging from the application of accounting standards to
published financial information. Interim and annual results of
the Group are reviewed and revised by the Audit and Risk
Committee before submission to the Board for approval.
The Audit and Risk Committee has a responsibility to
recommend to the Board, for its consideration and
acceptance by shareholders, the appointment of external
auditors. The Audit and Risk Committee approves the
external auditor’s engagement letter and terms, nature and
scope of the audit function and the audit fee. The Audit and
Risk Committee reviews the nature and quantum of
non-audit projects undertaken by the external auditors.
The auditors are required, on an annual basis, to provide a
summary of relationships that they consider may have a
bearing on their independence and objectivity.
During the year, the committee satisfied itself with
Mr Coetzee’s work experience, performance and technical
skills in fulfilling his role as full-time financial director.
The board monitors Information Technology (IT) governance
through the Audit and Risk Committee. An IT Steering
Committee has been established to assist the Audit and Risk
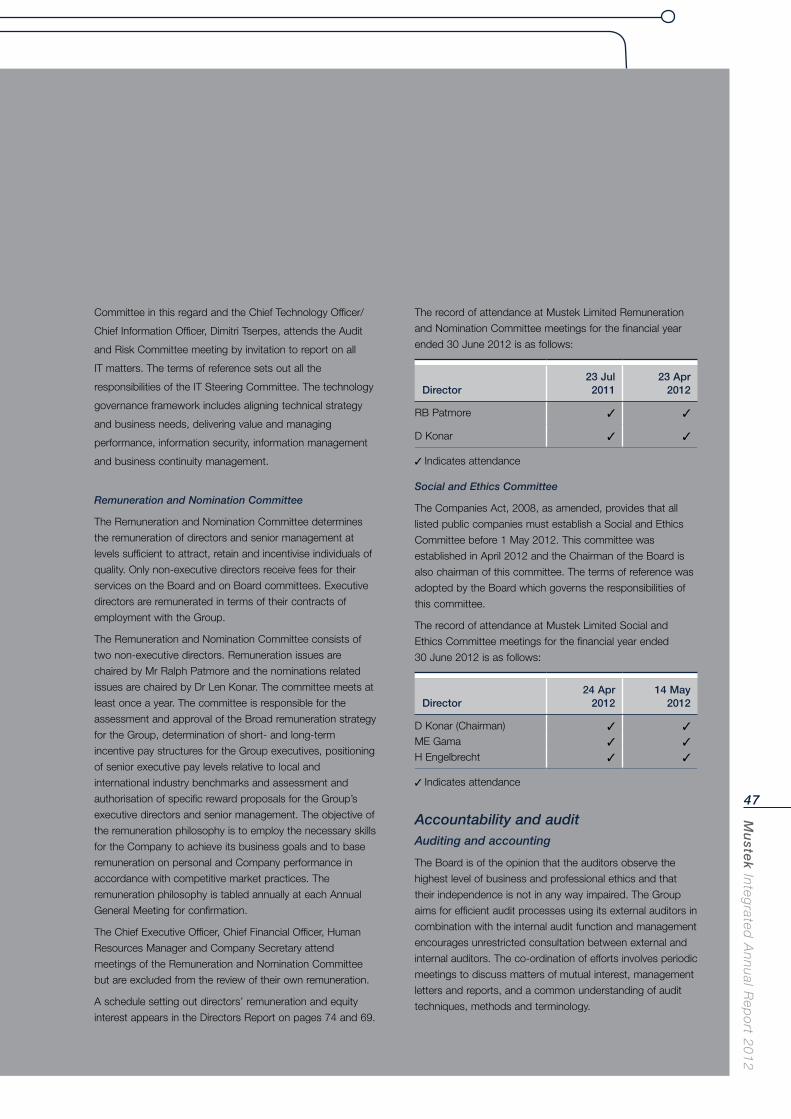
Mu
stek In
tegrated
An
nu
al Rep
ort 2
01
2
47
The record of attendance at Mustek Limited Remuneration
and Nomination Committee meetings for the financial year
ended 30 June 2012 is as follows:
Director23 Jul 2011
23 Apr2012
RB Patmore 3 3
D Konar 3 3
3 Indicates attendance
Social and Ethics Committee
The Companies Act, 2008, as amended, provides that all
listed public companies must establish a Social and Ethics
Committee before 1 May 2012. This committee was
established in April 2012 and the Chairman of the Board is
also chairman of this committee. The terms of reference was
adopted by the Board which governs the responsibilities of
this committee.
The record of attendance at Mustek Limited Social and
Ethics Committee meetings for the financial year ended
30 June 2012 is as follows:
Director24 Apr
201214 May
2012
D Konar (Chairman) 3 3
ME Gama 3 3
H Engelbrecht 3 3
3 Indicates attendance
Accountability and auditAuditing and accounting
The Board is of the opinion that the auditors observe the
highest level of business and professional ethics and that
their independence is not in any way impaired. The Group
aims for efficient audit processes using its external auditors in
combination with the internal audit function and management
encourages unrestricted consultation between external and
internal auditors. The co-ordination of efforts involves periodic
meetings to discuss matters of mutual interest, management
letters and reports, and a common understanding of audit
techniques, methods and terminology.
Committee in this regard and the Chief Technology Officer/
Chief Information Officer, Dimitri Tserpes, attends the Audit
and Risk Committee meeting by invitation to report on all
IT matters. The terms of reference sets out all the
responsibilities of the IT Steering Committee. The technology
governance framework includes aligning technical strategy
and business needs, delivering value and managing
performance, information security, information management
and business continuity management.
Remuneration and Nomination Committee
The Remuneration and Nomination Committee determines
the remuneration of directors and senior management at
levels sufficient to attract, retain and incentivise individuals of
quality. Only non-executive directors receive fees for their
services on the Board and on Board committees. Executive
directors are remunerated in terms of their contracts of
employment with the Group.
The Remuneration and Nomination Committee consists of
two non-executive directors. Remuneration issues are
chaired by Mr Ralph Patmore and the nominations related
issues are chaired by Dr Len Konar. The committee meets at
least once a year. The committee is responsible for the
assessment and approval of the Broad remuneration strategy
for the Group, determination of short- and long-term
incentive pay structures for the Group executives, positioning
of senior executive pay levels relative to local and
international industry benchmarks and assessment and
authorisation of specific reward proposals for the Group’s
executive directors and senior management. The objective of
the remuneration philosophy is to employ the necessary skills
for the Company to achieve its business goals and to base
remuneration on personal and Company performance in
accordance with competitive market practices. The
remuneration philosophy is tabled annually at each Annual
General Meeting for confirmation.
The Chief Executive Officer, Chief Financial Officer, Human
Resources Manager and Company Secretary attend
meetings of the Remuneration and Nomination Committee
but are excluded from the review of their own remuneration.
A schedule setting out directors’ remuneration and equity
interest appears in the Directors Report on pages 74 and 69.
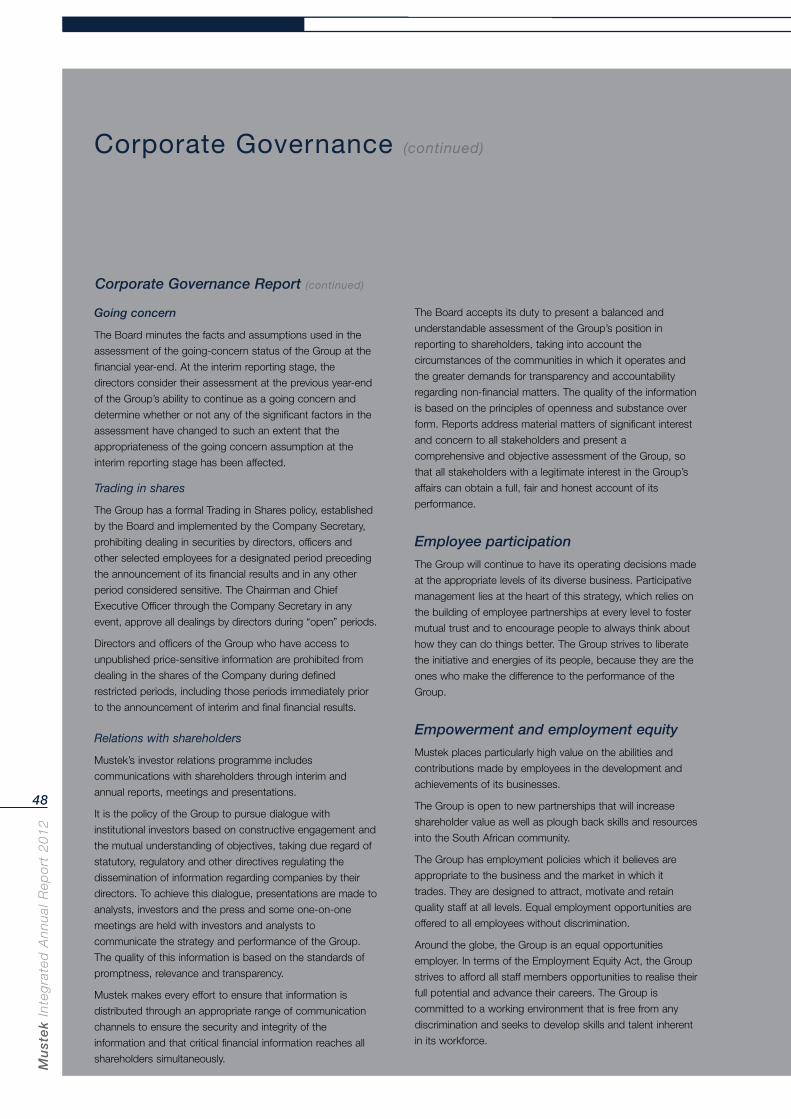
Mu
ste
k In
teg
rate
d A
nn
ual
Rep
ort
20
12
48
Corporate Governance (continued)
Corporate Governance Report (continued)
The Board accepts its duty to present a balanced and
understandable assessment of the Group’s position in
reporting to shareholders, taking into account the
circumstances of the communities in which it operates and
the greater demands for transparency and accountability
regarding non-financial matters. The quality of the information
is based on the principles of openness and substance over
form. Reports address material matters of significant interest
and concern to all stakeholders and present a
comprehensive and objective assessment of the Group, so
that all stakeholders with a legitimate interest in the Group’s
affairs can obtain a full, fair and honest account of its
performance.
Employee participation
The Group will continue to have its operating decisions made
at the appropriate levels of its diverse business. Participative
management lies at the heart of this strategy, which relies on
the building of employee partnerships at every level to foster
mutual trust and to encourage people to always think about
how they can do things better. The Group strives to liberate
the initiative and energies of its people, because they are the
ones who make the difference to the performance of the
Group.
Empowerment and employment equity
Mustek places particularly high value on the abilities and
contributions made by employees in the development and
achievements of its businesses.
The Group is open to new partnerships that will increase
shareholder value as well as plough back skills and resources
into the South African community.
The Group has employment policies which it believes are
appropriate to the business and the market in which it
trades. They are designed to attract, motivate and retain
quality staff at all levels. Equal employment opportunities are
offered to all employees without discrimination.
Around the globe, the Group is an equal opportunities
employer. In terms of the Employment Equity Act, the Group
strives to afford all staff members opportunities to realise their
full potential and advance their careers. The Group is
committed to a working environment that is free from any
discrimination and seeks to develop skills and talent inherent
in its workforce.
Going concern
The Board minutes the facts and assumptions used in the
assessment of the going-concern status of the Group at the
financial year-end. At the interim reporting stage, the
directors consider their assessment at the previous year-end
of the Group’s ability to continue as a going concern and
determine whether or not any of the significant factors in the
assessment have changed to such an extent that the
appropriateness of the going concern assumption at the
interim reporting stage has been affected.
Trading in shares
The Group has a formal Trading in Shares policy, established
by the Board and implemented by the Company Secretary,
prohibiting dealing in securities by directors, officers and
other selected employees for a designated period preceding
the announcement of its financial results and in any other
period considered sensitive. The Chairman and Chief
Executive Officer through the Company Secretary in any
event, approve all dealings by directors during “open” periods.
Directors and officers of the Group who have access to
unpublished price-sensitive information are prohibited from
dealing in the shares of the Company during defined
restricted periods, including those periods immediately prior
to the announcement of interim and final financial results.
Relations with shareholders
Mustek’s investor relations programme includes
communications with shareholders through interim and
annual reports, meetings and presentations.
It is the policy of the Group to pursue dialogue with
institutional investors based on constructive engagement and
the mutual understanding of objectives, taking due regard of
statutory, regulatory and other directives regulating the
dissemination of information regarding companies by their
directors. To achieve this dialogue, presentations are made to
analysts, investors and the press and some one-on-one
meetings are held with investors and analysts to
communicate the strategy and performance of the Group.
The quality of this information is based on the standards of
promptness, relevance and transparency.
Mustek makes every effort to ensure that information is
distributed through an appropriate range of communication
channels to ensure the security and integrity of the
information and that critical financial information reaches all
shareholders simultaneously.
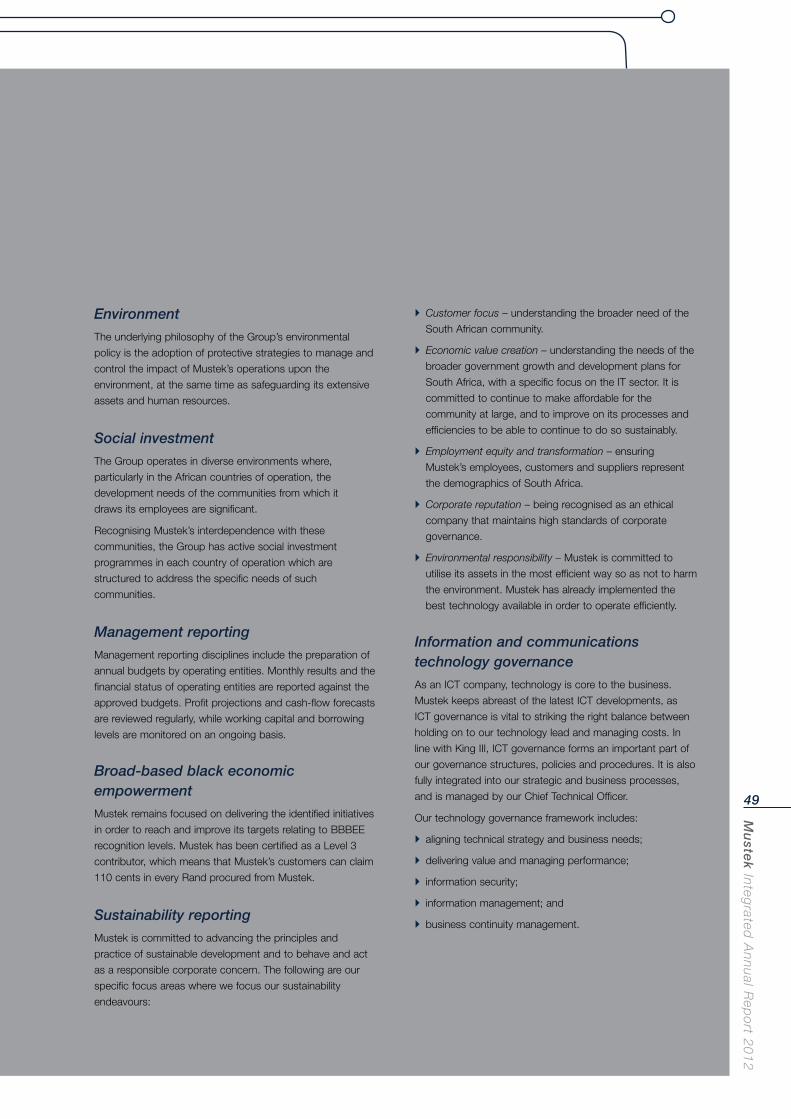
Mu
stek In
tegrated
An
nu
al Rep
ort 2
01
2
49
Customer focus – understanding the broader need of the
South African community.
Economic value creation – understanding the needs of the
broader government growth and development plans for
South Africa, with a specific focus on the IT sector. It is
committed to continue to make affordable for the
community at large, and to improve on its processes and
efficiencies to be able to continue to do so sustainably.
Employment equity and transformation – ensuring
Mustek’s employees, customers and suppliers represent
the demographics of South Africa.
Corporate reputation – being recognised as an ethical
company that maintains high standards of corporate
governance.
Environmental responsibility – Mustek is committed to
utilise its assets in the most efficient way so as not to harm
the environment. Mustek has already implemented the
best technology available in order to operate efficiently.
Information and communications technology governance
As an ICT company, technology is core to the business.
Mustek keeps abreast of the latest ICT developments, as
ICT governance is vital to striking the right balance between
holding on to our technology lead and managing costs. In
line with King III, ICT governance forms an important part of
our governance structures, policies and procedures. It is also
fully integrated into our strategic and business processes,
and is managed by our Chief Technical Officer.
Our technology governance framework includes:
aligning technical strategy and business needs;
delivering value and managing performance;
information security;
information management; and
business continuity management.
Environment
The underlying philosophy of the Group’s environmental
policy is the adoption of protective strategies to manage and
control the impact of Mustek’s operations upon the
environment, at the same time as safeguarding its extensive
assets and human resources.
Social investment
The Group operates in diverse environments where,
particularly in the African countries of operation, the
development needs of the communities from which it
draws its employees are significant.
Recognising Mustek’s interdependence with these
communities, the Group has active social investment
programmes in each country of operation which are
structured to address the specific needs of such
communities.
Management reporting
Management reporting disciplines include the preparation of
annual budgets by operating entities. Monthly results and the
financial status of operating entities are reported against the
approved budgets. Profit projections and cash-flow forecasts
are reviewed regularly, while working capital and borrowing
levels are monitored on an ongoing basis.
Broad-based black economic empowerment
Mustek remains focused on delivering the identified initiatives
in order to reach and improve its targets relating to BBBEE
recognition levels. Mustek has been certified as a Level 3
contributor, which means that Mustek’s customers can claim
110 cents in every Rand procured from Mustek.
Sustainability reporting
Mustek is committed to advancing the principles and
practice of sustainable development and to behave and act
as a responsible corporate concern. The following are our
specific focus areas where we focus our sustainability
endeavours:
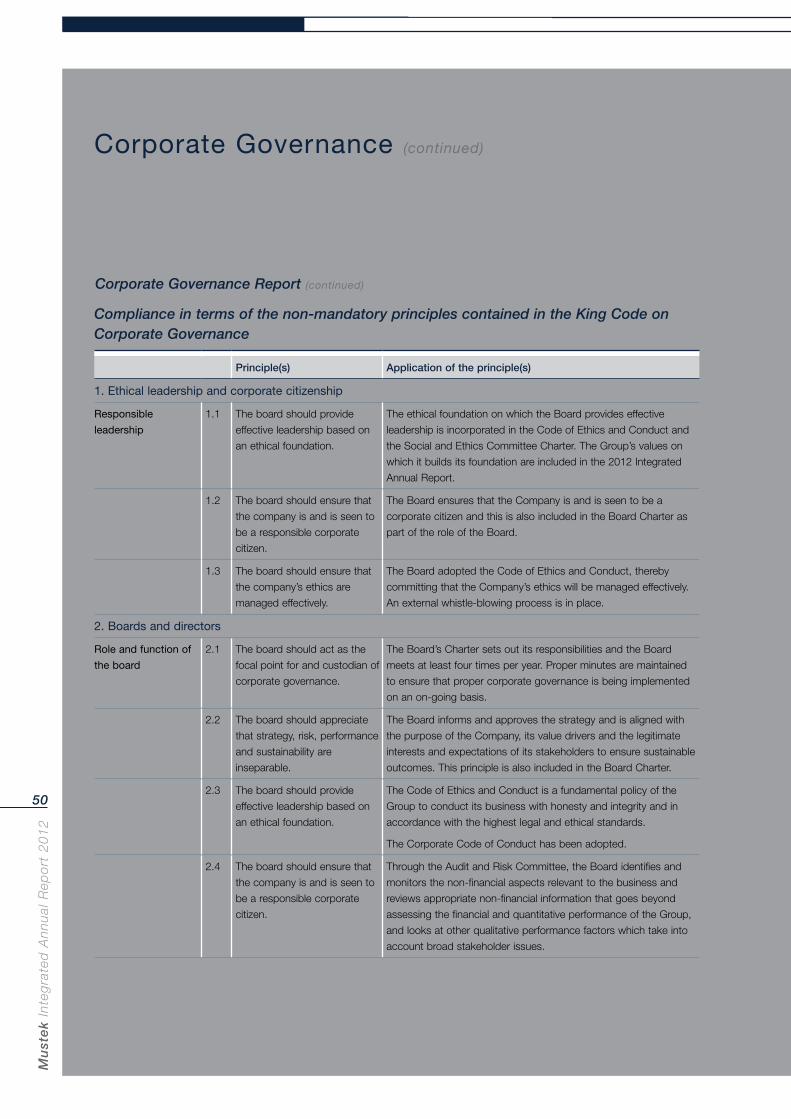
Mu
ste
k In
teg
rate
d A
nn
ual
Rep
ort
20
12
50
Corporate Governance (continued)
Corporate Governance Report (continued)
Compliance in terms of the non-mandatory principles contained in the King Code on Corporate Governance
Principle(s) Application of the principle(s)
1. Ethical leadership and corporate citizenship
Responsible
leadership
1.1 The board should provide
effective leadership based on
an ethical foundation.
The ethical foundation on which the Board provides effective
leadership is incorporated in the Code of Ethics and Conduct and
the Social and Ethics Committee Charter. The Group’s values on
which it builds its foundation are included in the 2012 Integrated
Annual Report.
1.2 The board should ensure that
the company is and is seen to
be a responsible corporate
citizen.
The Board ensures that the Company is and is seen to be a
corporate citizen and this is also included in the Board Charter as
part of the role of the Board.
1.3 The board should ensure that
the company’s ethics are
managed effectively.
The Board adopted the Code of Ethics and Conduct, thereby
committing that the Company’s ethics will be managed effectively.
An external whistle-blowing process is in place.
2. Boards and directors
Role and function of
the board
2.1 The board should act as the
focal point for and custodian of
corporate governance.
The Board’s Charter sets out its responsibilities and the Board
meets at least four times per year. Proper minutes are maintained
to ensure that proper corporate governance is being implemented
on an on-going basis.
2.2 The board should appreciate
that strategy, risk, performance
and sustainability are
inseparable.
The Board informs and approves the strategy and is aligned with
the purpose of the Company, its value drivers and the legitimate
interests and expectations of its stakeholders to ensure sustainable
outcomes. This principle is also included in the Board Charter.
2.3 The board should provide
effective leadership based on
an ethical foundation.
The Code of Ethics and Conduct is a fundamental policy of the
Group to conduct its business with honesty and integrity and in
accordance with the highest legal and ethical standards.
The Corporate Code of Conduct has been adopted.
2.4 The board should ensure that
the company is and is seen to
be a responsible corporate
citizen.
Through the Audit and Risk Committee, the Board identifies and
monitors the non-financial aspects relevant to the business and
reviews appropriate non-financial information that goes beyond
assessing the financial and quantitative performance of the Group,
and looks at other qualitative performance factors which take into
account broad stakeholder issues.
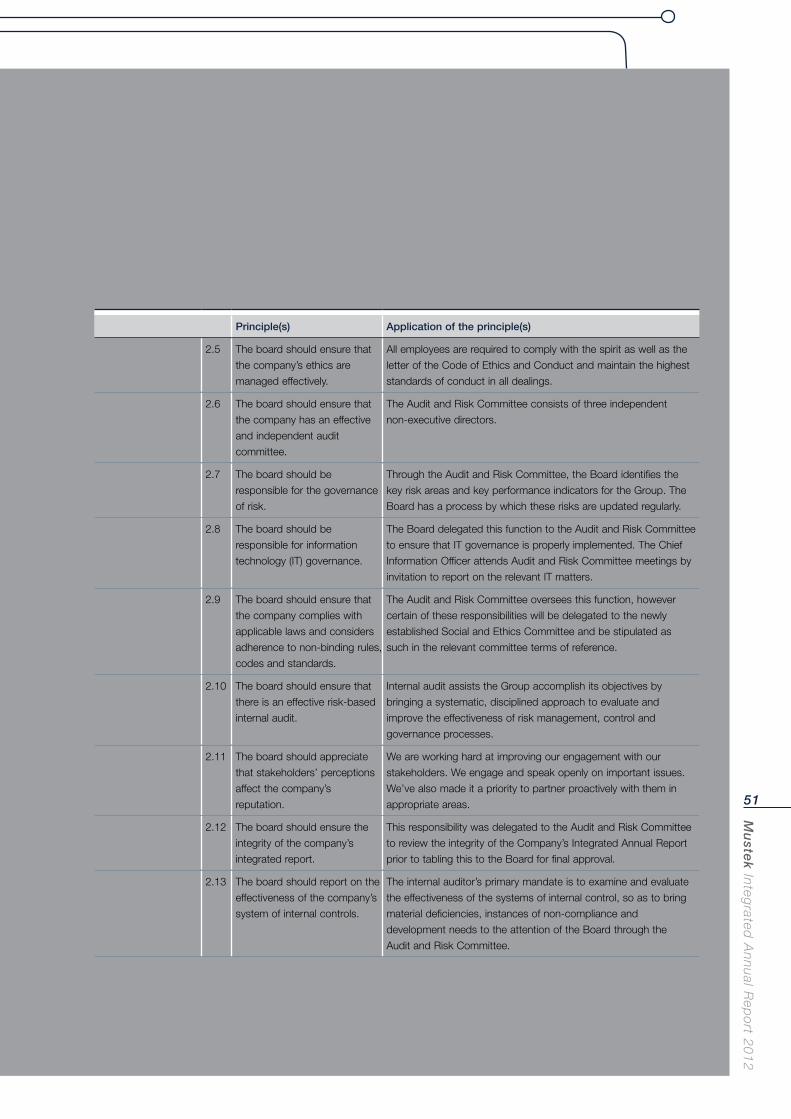
Mu
stek In
tegrated
An
nu
al Rep
ort 2
01
2
51
Principle(s) Application of the principle(s)
2.5 The board should ensure that
the company’s ethics are
managed effectively.
All employees are required to comply with the spirit as well as the
letter of the Code of Ethics and Conduct and maintain the highest
standards of conduct in all dealings.
2.6 The board should ensure that
the company has an effective
and independent audit
committee.
The Audit and Risk Committee consists of three independent
non-executive directors.
2.7 The board should be
responsible for the governance
of risk.
Through the Audit and Risk Committee, the Board identifies the
key risk areas and key performance indicators for the Group. The
Board has a process by which these risks are updated regularly.
2.8 The board should be
responsible for information
technology (IT) governance.
The Board delegated this function to the Audit and Risk Committee
to ensure that IT governance is properly implemented. The Chief
Information Officer attends Audit and Risk Committee meetings by
invitation to report on the relevant IT matters.
2.9 The board should ensure that
the company complies with
applicable laws and considers
adherence to non-binding rules,
codes and standards.
The Audit and Risk Committee oversees this function, however
certain of these responsibilities will be delegated to the newly
established Social and Ethics Committee and be stipulated as
such in the relevant committee terms of reference.
2.10 The board should ensure that
there is an effective risk-based
internal audit.
Internal audit assists the Group accomplish its objectives by
bringing a systematic, disciplined approach to evaluate and
improve the effectiveness of risk management, control and
governance processes.
2.11 The board should appreciate
that stakeholders’ perceptions
affect the company’s
reputation.
We are working hard at improving our engagement with our
stakeholders. We engage and speak openly on important issues.
We’ve also made it a priority to partner proactively with them in
appropriate areas.
2.12 The board should ensure the
integrity of the company’s
integrated report.
This responsibility was delegated to the Audit and Risk Committee
to review the integrity of the Company’s Integrated Annual Report
prior to tabling this to the Board for final approval.
2.13 The board should report on the
effectiveness of the company’s
system of internal controls.
The internal auditor’s primary mandate is to examine and evaluate
the effectiveness of the systems of internal control, so as to bring
material deficiencies, instances of non-compliance and
development needs to the attention of the Board through the
Audit and Risk Committee.
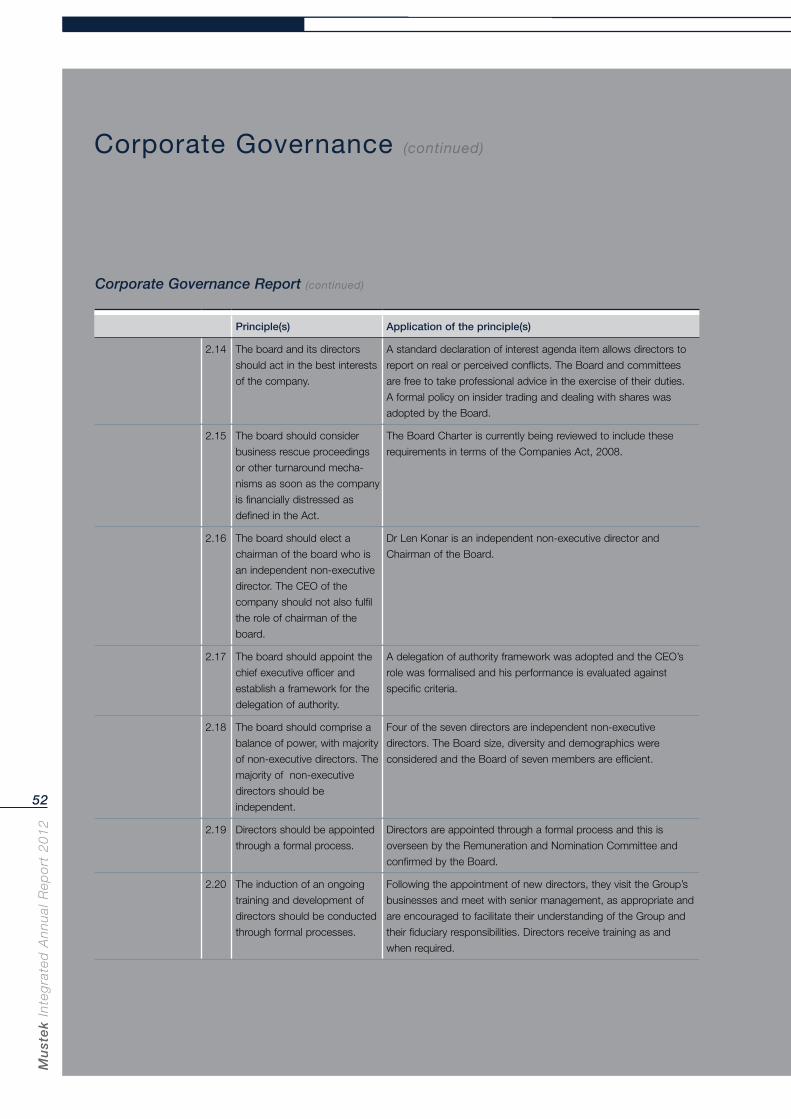
Mu
ste
k In
teg
rate
d A
nn
ual
Rep
ort
20
12
52
Corporate Governance (continued)
Corporate Governance Report (continued)
Principle(s) Application of the principle(s)
2.14 The board and its directors
should act in the best interests
of the company.
A standard declaration of interest agenda item allows directors to
report on real or perceived conflicts. The Board and committees
are free to take professional advice in the exercise of their duties.
A formal policy on insider trading and dealing with shares was
adopted by the Board.
2.15 The board should consider
business rescue proceedings
or other turnaround mecha-
nisms as soon as the company
is financially distressed as
defined in the Act.
The Board Charter is currently being reviewed to include these
requirements in terms of the Companies Act, 2008.
2.16 The board should elect a
chairman of the board who is
an independent non-executive
director. The CEO of the
company should not also fulfil
the role of chairman of the
board.
Dr Len Konar is an independent non-executive director and
Chairman of the Board.
2.17 The board should appoint the
chief executive officer and
establish a framework for the
delegation of authority.
A delegation of authority framework was adopted and the CEO’s
role was formalised and his performance is evaluated against
specific criteria.
2.18 The board should comprise a
balance of power, with majority
of non-executive directors. The
majority of non-executive
directors should be
independent.
Four of the seven directors are independent non-executive
directors. The Board size, diversity and demographics were
considered and the Board of seven members are efficient.
2.19 Directors should be appointed
through a formal process.
Directors are appointed through a formal process and this is
overseen by the Remuneration and Nomination Committee and
confirmed by the Board.
2.20 The induction of an ongoing
training and development of
directors should be conducted
through formal processes.
Following the appointment of new directors, they visit the Group’s
businesses and meet with senior management, as appropriate and
are encouraged to facilitate their understanding of the Group and
their fiduciary responsibilities. Directors receive training as and
when required.
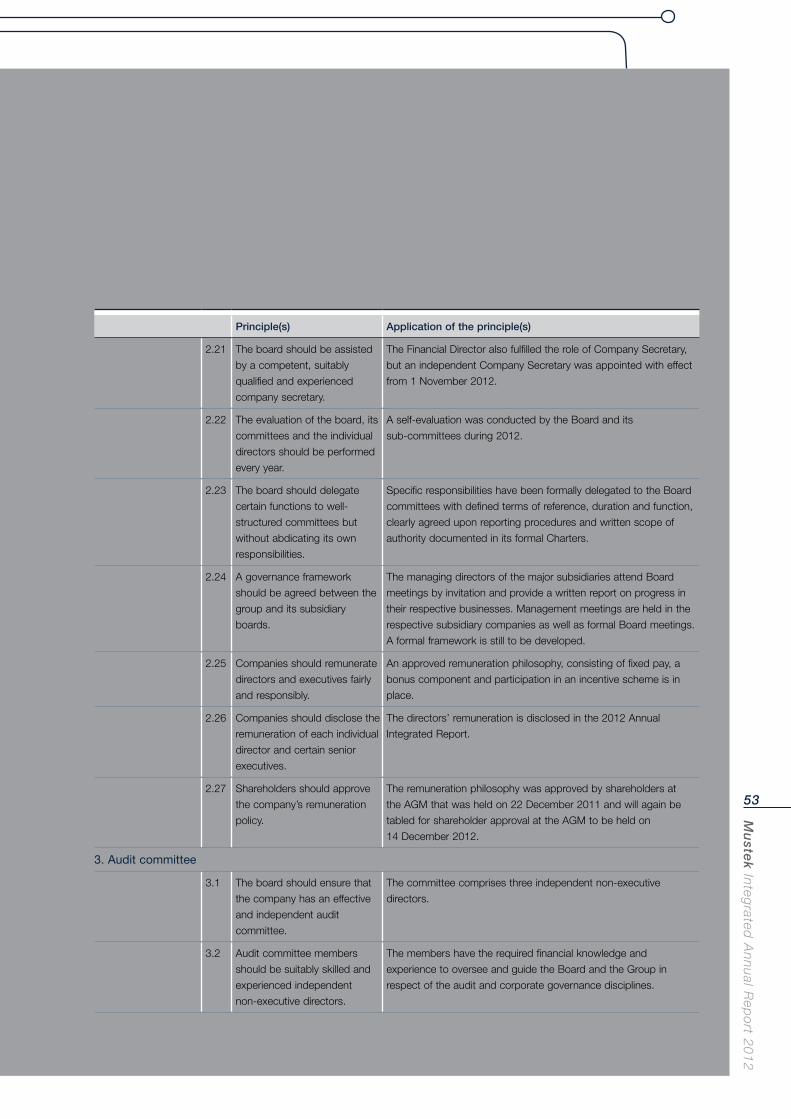
Mu
stek In
tegrated
An
nu
al Rep
ort 2
01
2
53
Principle(s) Application of the principle(s)
2.21 The board should be assisted
by a competent, suitably
qualified and experienced
company secretary.
The Financial Director also fulfilled the role of Company Secretary,
but an independent Company Secretary was appointed with effect
from 1 November 2012.
2.22 The evaluation of the board, its
committees and the individual
directors should be performed
every year.
A self-evaluation was conducted by the Board and its
sub-committees during 2012.
2.23 The board should delegate
certain functions to well-
structured committees but
without abdicating its own
responsibilities.
Specific responsibilities have been formally delegated to the Board
committees with defined terms of reference, duration and function,
clearly agreed upon reporting procedures and written scope of
authority documented in its formal Charters.
2.24 A governance framework
should be agreed between the
group and its subsidiary
boards.
The managing directors of the major subsidiaries attend Board
meetings by invitation and provide a written report on progress in
their respective businesses. Management meetings are held in the
respective subsidiary companies as well as formal Board meetings.
A formal framework is still to be developed.
2.25 Companies should remunerate
directors and executives fairly
and responsibly.
An approved remuneration philosophy, consisting of fixed pay, a
bonus component and participation in an incentive scheme is in
place.
2.26 Companies should disclose the
remuneration of each individual
director and certain senior
executives.
The directors’ remuneration is disclosed in the 2012 Annual
Integrated Report.
2.27 Shareholders should approve
the company’s remuneration
policy.
The remuneration philosophy was approved by shareholders at
the AGM that was held on 22 December 2011 and will again be
tabled for shareholder approval at the AGM to be held on
14 December 2012.
3. Audit committee
3.1 The board should ensure that
the company has an effective
and independent audit
committee.
The committee comprises three independent non-executive
directors.
3.2 Audit committee members
should be suitably skilled and
experienced independent
non-executive directors.
The members have the required financial knowledge and
experience to oversee and guide the Board and the Group in
respect of the audit and corporate governance disciplines.
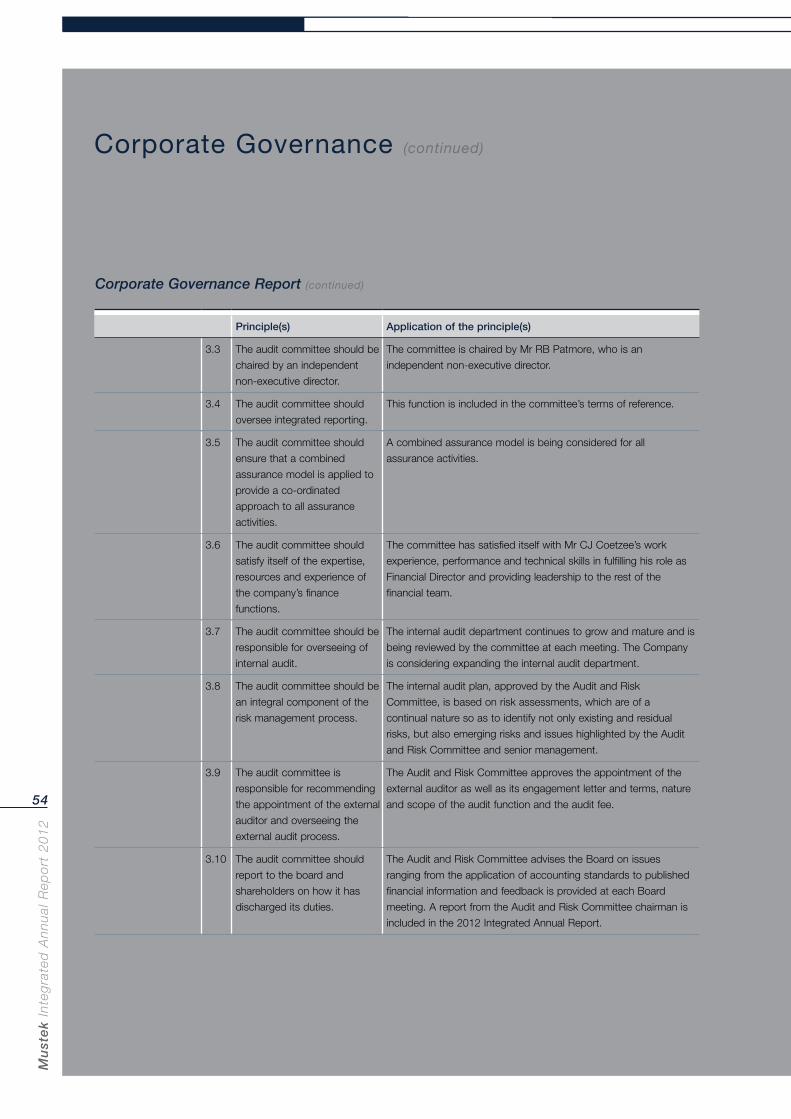
Mu
ste
k In
teg
rate
d A
nn
ual
Rep
ort
20
12
54
Corporate Governance (continued)
Corporate Governance Report (continued)
Principle(s) Application of the principle(s)
3.3 The audit committee should be
chaired by an independent
non-executive director.
The committee is chaired by Mr RB Patmore, who is an
independent non-executive director.
3.4 The audit committee should
oversee integrated reporting.
This function is included in the committee’s terms of reference.
3.5 The audit committee should
ensure that a combined
assurance model is applied to
provide a co-ordinated
approach to all assurance
activities.
A combined assurance model is being considered for all
assurance activities.
3.6 The audit committee should
satisfy itself of the expertise,
resources and experience of
the company’s finance
functions.
The committee has satisfied itself with Mr CJ Coetzee’s work
experience, performance and technical skills in fulfilling his role as
Financial Director and providing leadership to the rest of the
financial team.
3.7 The audit committee should be
responsible for overseeing of
internal audit.
The internal audit department continues to grow and mature and is
being reviewed by the committee at each meeting. The Company
is considering expanding the internal audit department.
3.8 The audit committee should be
an integral component of the
risk management process.
The internal audit plan, approved by the Audit and Risk
Committee, is based on risk assessments, which are of a
continual nature so as to identify not only existing and residual
risks, but also emerging risks and issues highlighted by the Audit
and Risk Committee and senior management.
3.9 The audit committee is
responsible for recommending
the appointment of the external
auditor and overseeing the
external audit process.
The Audit and Risk Committee approves the appointment of the
external auditor as well as its engagement letter and terms, nature
and scope of the audit function and the audit fee.
3.10 The audit committee should
report to the board and
shareholders on how it has
discharged its duties.
The Audit and Risk Committee advises the Board on issues
ranging from the application of accounting standards to published
financial information and feedback is provided at each Board
meeting. A report from the Audit and Risk Committee chairman is
included in the 2012 Integrated Annual Report.
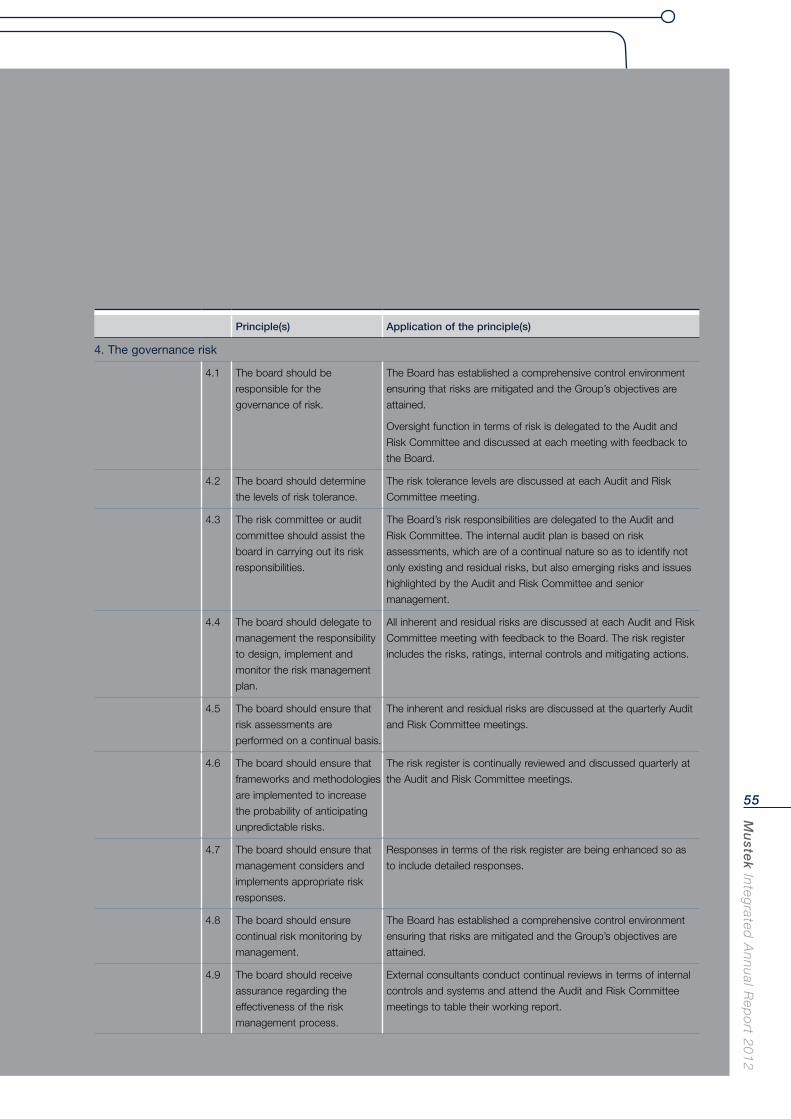
Mu
stek In
tegrated
An
nu
al Rep
ort 2
01
2
55
Principle(s) Application of the principle(s)
4. The governance risk
4.1 The board should be
responsible for the
governance of risk.
The Board has established a comprehensive control environment
ensuring that risks are mitigated and the Group’s objectives are
attained.
Oversight function in terms of risk is delegated to the Audit and
Risk Committee and discussed at each meeting with feedback to
the Board.
4.2 The board should determine
the levels of risk tolerance.
The risk tolerance levels are discussed at each Audit and Risk
Committee meeting.
4.3 The risk committee or audit
committee should assist the
board in carrying out its risk
responsibilities.
The Board’s risk responsibilities are delegated to the Audit and
Risk Committee. The internal audit plan is based on risk
assessments, which are of a continual nature so as to identify not
only existing and residual risks, but also emerging risks and issues
highlighted by the Audit and Risk Committee and senior
management.
4.4 The board should delegate to
management the responsibility
to design, implement and
monitor the risk management
plan.
All inherent and residual risks are discussed at each Audit and Risk
Committee meeting with feedback to the Board. The risk register
includes the risks, ratings, internal controls and mitigating actions.
4.5 The board should ensure that
risk assessments are
performed on a continual basis.
The inherent and residual risks are discussed at the quarterly Audit
and Risk Committee meetings.
4.6 The board should ensure that
frameworks and methodologies
are implemented to increase
the probability of anticipating
unpredictable risks.
The risk register is continually reviewed and discussed quarterly at
the Audit and Risk Committee meetings.
4.7 The board should ensure that
management considers and
implements appropriate risk
responses.
Responses in terms of the risk register are being enhanced so as
to include detailed responses.
4.8 The board should ensure
continual risk monitoring by
management.
The Board has established a comprehensive control environment
ensuring that risks are mitigated and the Group’s objectives are
attained.
4.9 The board should receive
assurance regarding the
effectiveness of the risk
management process.
External consultants conduct continual reviews in terms of internal
controls and systems and attend the Audit and Risk Committee
meetings to table their working report.
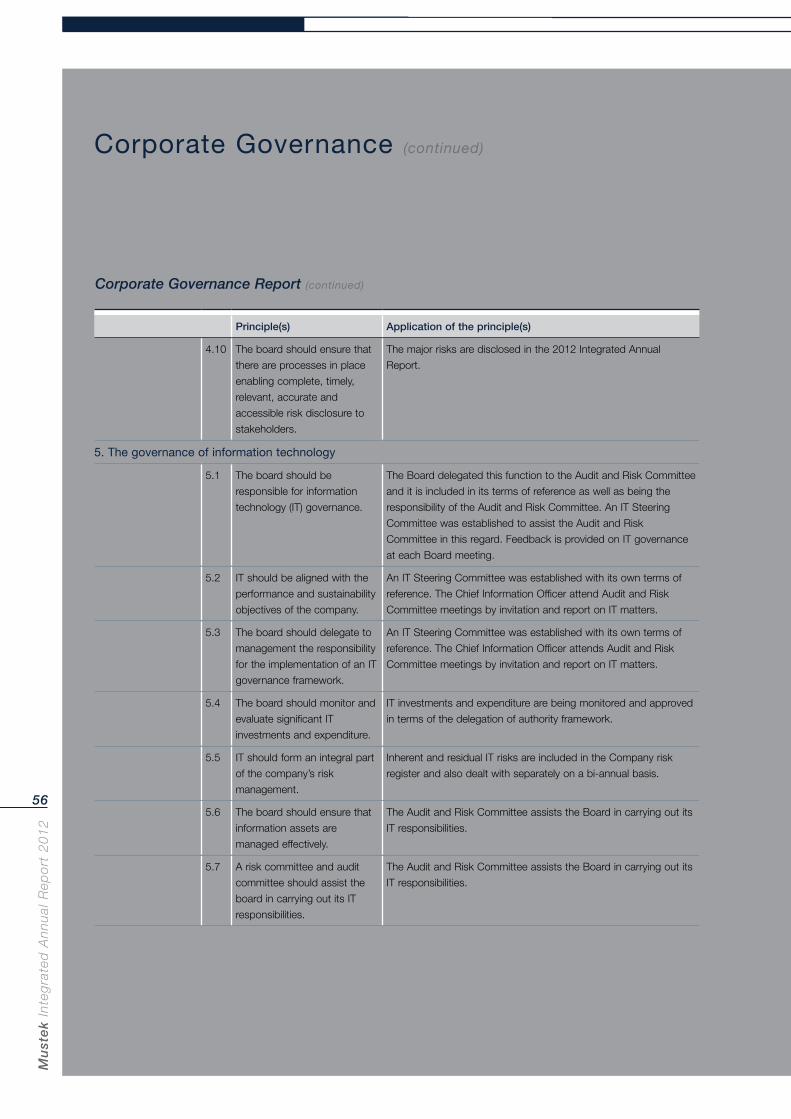
Mu
ste
k In
teg
rate
d A
nn
ual
Rep
ort
20
12
56
Corporate Governance (continued)
Corporate Governance Report (continued)
Principle(s) Application of the principle(s)
4.10 The board should ensure that
there are processes in place
enabling complete, timely,
relevant, accurate and
accessible risk disclosure to
stakeholders.
The major risks are disclosed in the 2012 Integrated Annual
Report.
5. The governance of information technology
5.1 The board should be
responsible for information
technology (IT) governance.
The Board delegated this function to the Audit and Risk Committee
and it is included in its terms of reference as well as being the
responsibility of the Audit and Risk Committee. An IT Steering
Committee was established to assist the Audit and Risk
Committee in this regard. Feedback is provided on IT governance
at each Board meeting.
5.2 IT should be aligned with the
performance and sustainability
objectives of the company.
An IT Steering Committee was established with its own terms of
reference. The Chief Information Officer attend Audit and Risk
Committee meetings by invitation and report on IT matters.
5.3 The board should delegate to
management the responsibility
for the implementation of an IT
governance framework.
An IT Steering Committee was established with its own terms of
reference. The Chief Information Officer attends Audit and Risk
Committee meetings by invitation and report on IT matters.
5.4 The board should monitor and
evaluate significant IT
investments and expenditure.
IT investments and expenditure are being monitored and approved
in terms of the delegation of authority framework.
5.5 IT should form an integral part
of the company’s risk
management.
Inherent and residual IT risks are included in the Company risk
register and also dealt with separately on a bi-annual basis.
5.6 The board should ensure that
information assets are
managed effectively.
The Audit and Risk Committee assists the Board in carrying out its
IT responsibilities.
5.7 A risk committee and audit
committee should assist the
board in carrying out its IT
responsibilities.
The Audit and Risk Committee assists the Board in carrying out its
IT responsibilities.
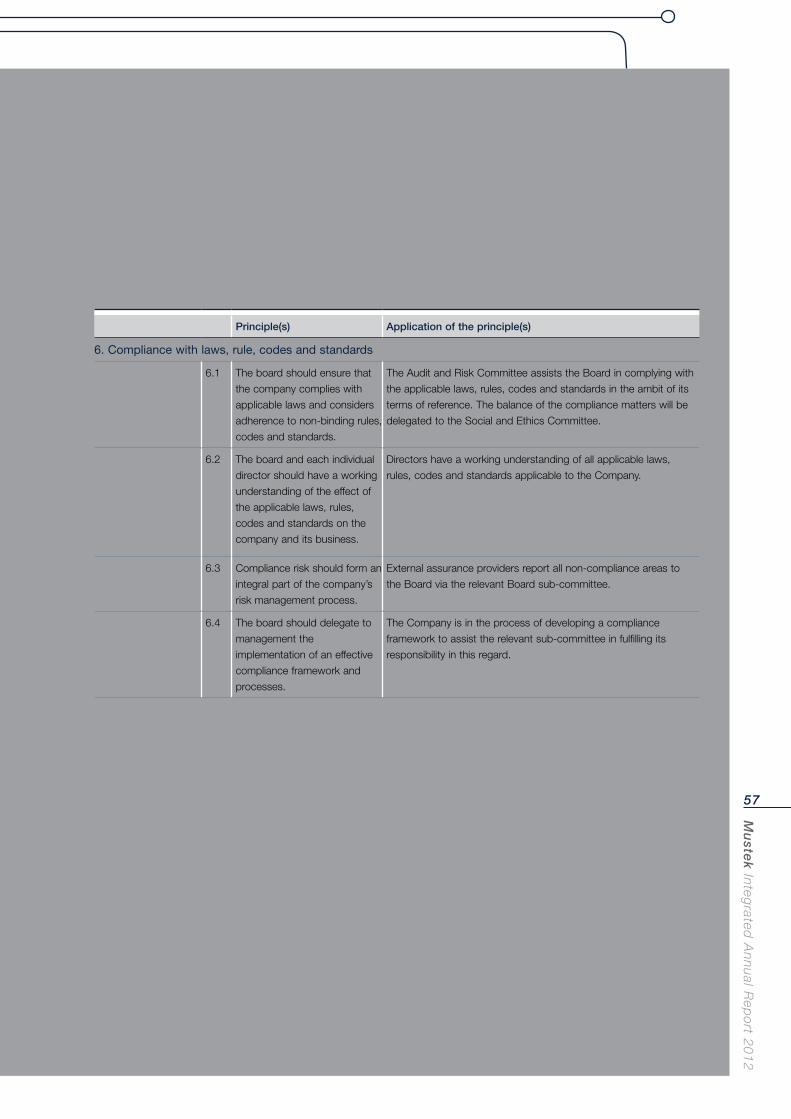
Mu
stek In
tegrated
An
nu
al Rep
ort 2
01
2
57
Principle(s) Application of the principle(s)
6. Compliance with laws, rule, codes and standards
6.1 The board should ensure that
the company complies with
applicable laws and considers
adherence to non-binding rules,
codes and standards.
The Audit and Risk Committee assists the Board in complying with
the applicable laws, rules, codes and standards in the ambit of its
terms of reference. The balance of the compliance matters will be
delegated to the Social and Ethics Committee.
6.2 The board and each individual
director should have a working
understanding of the effect of
the applicable laws, rules,
codes and standards on the
company and its business.
Directors have a working understanding of all applicable laws,
rules, codes and standards applicable to the Company.
6.3 Compliance risk should form an
integral part of the company’s
risk management process.
External assurance providers report all non-compliance areas to
the Board via the relevant Board sub-committee.
6.4 The board should delegate to
management the
implementation of an effective
compliance framework and
processes.
The Company is in the process of developing a compliance
framework to assist the relevant sub-committee in fulfilling its
responsibility in this regard.
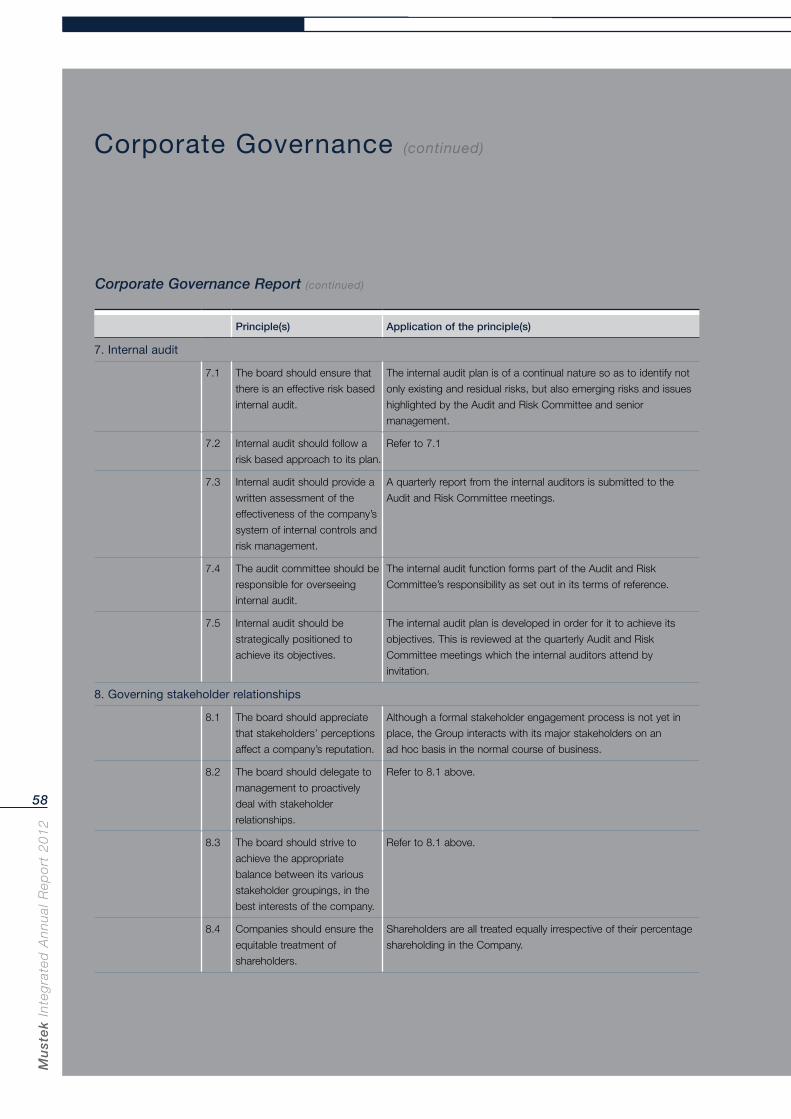
Mu
ste
k In
teg
rate
d A
nn
ual
Rep
ort
20
12
58
Corporate Governance (continued)
Corporate Governance Report (continued)
Principle(s) Application of the principle(s)
7. Internal audit
7.1 The board should ensure that
there is an effective risk based
internal audit.
The internal audit plan is of a continual nature so as to identify not
only existing and residual risks, but also emerging risks and issues
highlighted by the Audit and Risk Committee and senior
management.
7.2 Internal audit should follow a
risk based approach to its plan.
Refer to 7.1
7.3 Internal audit should provide a
written assessment of the
effectiveness of the company’s
system of internal controls and
risk management.
A quarterly report from the internal auditors is submitted to the
Audit and Risk Committee meetings.
7.4 The audit committee should be
responsible for overseeing
internal audit.
The internal audit function forms part of the Audit and Risk
Committee’s responsibility as set out in its terms of reference.
7.5 Internal audit should be
strategically positioned to
achieve its objectives.
The internal audit plan is developed in order for it to achieve its
objectives. This is reviewed at the quarterly Audit and Risk
Committee meetings which the internal auditors attend by
invitation.
8. Governing stakeholder relationships
8.1 The board should appreciate
that stakeholders’ perceptions
affect a company’s reputation.
Although a formal stakeholder engagement process is not yet in
place, the Group interacts with its major stakeholders on an
ad hoc basis in the normal course of business.
8.2 The board should delegate to
management to proactively
deal with stakeholder
relationships.
Refer to 8.1 above.
8.3 The board should strive to
achieve the appropriate
balance between its various
stakeholder groupings, in the
best interests of the company.
Refer to 8.1 above.
8.4 Companies should ensure the
equitable treatment of
shareholders.
Shareholders are all treated equally irrespective of their percentage
shareholding in the Company.
Mu
stek In
tegrated
An
nu
al Rep
ort 2
01
2
59
Principle(s) Application of the principle(s)
8.5 Transparent and effective
communication with
stakeholders is essential for
building and maintaining their
trust and confidence.
The Board strives to ensure that reporting to stakeholders is
relevant, transparent and accurate.
8.6 The board should ensure that
disputes are resolved as
effectively, efficiently and
expeditiously as possible.
All internal dispute resolutions are in place.
9. Integrated reporting and disclosure
9.1 The board should ensure the
integrity of the company’s
integrated report.
This forms part of the responsibilities of the Audit and Risk
Committee and is included as such in its terms of reference prior
to presenting the report to the Board.
9.2 Sustainability reporting and
disclosure should be integrated
with the company’s financial
reporting.
The Group endeavours to integrate all information to stakeholders
in the form of the Integrated Report, focusing on sustainability on
all levels, including finances.
9.3 Sustainability reporting and
disclosure should be
independently assured.
Sustainability reporting is currently being self-assured, however,
this is being reviewed.
Mu
ste
k In
teg
rate
d A
nn
ual
Rep
ort
20
12
60
Corporate Governance (continued)
Remuneration Report
Group remuneration philosophy
Recognising that the Group is operating in a competitive
environment, the Mustek remuneration philosophy:
plays an integral part in supporting the implementation of
Mustek’s business strategies;
motivates and reinforces individual and team performance;
is applied equitably, fairly and consistently in relation to job
responsibility, the employment market and personal
performance.
Mustek’s application of remuneration practices in all
businesses and functions:
aims to be market competitive in specific labour markets in
which people are employed;
determines the value proposition of the various positions
within job families or functions;
ensures that performance management forms an integral
part of remuneration, thereby influencing the remuneration
components of base pay and incentives; and
applies good governance to remuneration practices within
approved structures.
The alignment of these remuneration principles aims to meet
the strategic objectives of:
attracting, retaining and motivating key and talented
people;
competing in the marketplace with the intention of being a
preferred employer;
rewarding individual and business performance and
encouraging superior performance.
The remuneration policy distinguishes between three main
elements of remuneration:
fixed remuneration;
short-term incentive – Annual performance bonus;
long-term incentive – Mustek Share Incentive and Share
Appreciation Rights Schemes.
Fixed remuneration
Following established best market practice, salaries are set
with reference to external market data. Individual
performance is also taken into consideration. For this
benchmarking process, the Remuneration and Nomination
Committee has determined to set the base salary for
executive directors at the median of similar companies to
ensure sustainable performance and market competitiveness.
Employees receive guaranteed packages which include
membership of one of the Group’s medical health care
schemes and a travel or vehicle allowance for necessary
business travel. Retirement and risk benefits, including
death-in-service benefits, also apply, subject to the rules of
the post-retirement funds.
Employees’ fixed remuneration is reviewed and increased
annually in July by the Remuneration and Nomination
Committee.
Short-term incentive – Annual performance bonus
In addition to guaranteed packages, executive directors and
members of senior management participate in an annual
performance bonus scheme to reward the achievement of
agreed Group financial, strategic and personal performance
objectives. These targets are determined by the
Remuneration and Nomination Committee and include
measures of corporate performance.
For the year ended 30 June 2012, the weighting set by the
Remuneration and Nomination Committee for the bonus,
was as follows:
50% Profit before tax (PBT)
30% Cash flow
20% Revenue growth
These components were scored as follows:
PBT
On budget = score of 50%
5% above = score of 75%
10% above = score of 100%
Cash flow
Cash from operations is 50% of Profit from operations =
score of 50%
Cash from operations is 65% of Profit from operations =
score of 75%
Cash from operations is 80% of Profit from operations =
score of 100%
Revenue
On budget = score of 50%
5% above = score of 75%
10% above = score of 100%
Mu
stek In
tegrated
An
nu
al Rep
ort 2
01
2
61
Executive directors were able to earn up to 100% of their
annual cost-to-company packages as bonuses and Rectron
and Mustek’s EXCO teams were able to earn up to 50% of
their annual cost-to-company packages as bonuses.
The executive directors’ short-term bonuses were weighted
50/50 based on Mustek and Rectron’s performances and
were calculated as follows:
((% score for Mustek x 50%) + (% score for Rectron x
50%)) times total cost-to-company annual package.
No bonus is payable to the relevant EXCOs if the PBT target
is not reached. Furthermore, the bonus paid will be the lower
of the bonus as calculated or the amount of the
overachievement above the budgeted PBT for the relevant
company.
Long-term incentive – Mustek Share Incentive and Share Appreciation Rights Schemes
Executive directors and a limited number of executive
management participate in the Mustek Share Incentive and
Share Appreciation Rights Schemes, which are designed to
recognise the contributions of senior staff to the growth in
the value of the Group’s financial position and performance
and to retain key employees. Within the limits imposed by
the company’s shareholders and the JSE Limited, options
are allocated to executive directors and senior staff in
proportion to their contributions to the business as reflected
by their seniority.
The Remuneration and Nomination Committee grants share
options as follows:
When an employee is promoted or appointed to the
relevant management level or positions;
Supplementary share option grants are normally granted
annually, as approved by the Remuneration and
Nomination Committee.
Details of the benefits held by executive directors under the
existing long-term incentive schemes are detailed in the
Report of the Directors.
Policy on Directors’ fees and remuneration
The directors are appointed to the Board to bring
competencies and experience appropriate to achieving the
Group’s objectives.
Executive directors
The current employment agreements of executive directors
outline the components of their remuneration. At present,
remuneration is divided into two components: a fixed
component and a variable component comprising an annual
performance bonus and long-term incentives in the form of
the current Mustek Share Incentive and Share Appreciation
Rights Schemes, ensuring that a portion of their package is
linked to the achievement of improved business
performance.
Non-executive directors
The Remuneration and Nomination Committee recommends
fees payable to the Chairman and directors for approval by
the shareholders. Fees are approved for an annual period
commencing on 1 July each year. The annual fees payable to
non-executive directors for the period commencing on 1 July
2011 were approved by the shareholders at the Annual
General Meeting of members on 22 December 2011.
Directors’ service contracts
There are no fixed-term service contracts for executive or
non-executive directors.
Although shareholders appoint non-executive directors at
annual general meetings, appointments may be made
between annual general meetings. Such appointees may not
serve beyond the following annual general meeting and may
make themselves available for re-election by shareholders.
Nomination
The Remuneration and Nomination Committee is responsible
for securing nominations for the board whenever vacancies
arise. The Committee investigates nominees’ backgrounds
and whether their qualifications are in accordance with the
JSE requirements for listed companies.
The committee is also responsible for striving that the
composition of the Board has optimal ethnic and gender
diversity, qualifications, professional skills, industry knowledge
and expertise to best serve its purpose. The committee also
assesses the effectiveness of the Board and its committees.
Interests of directors in share capital
Details of the directors’ interests in share capital are detailed
in the Report of the Directors.
Mu
ste
k In
teg
rate
d A
nn
ual
Rep
ort
20
12
62
Corporate Governance (continued)
Risk Management Report
Risk management
The focus of risk management in Mustek is on identifying,
assessing, mitigating, managing and monitoring all known
forms of risk across the group. Management is involved in
a continual process of developing and enhancing its
comprehensive systems for risk identification and
management. The risks to the business encompass such
areas as the world IT component and product prices,
exchange rates, political and economic factors, local and
international competition, legislation and national regulations,
interest rates, people skills, and general operational and
financial risks.
The major risks are the subject of the ongoing attention of
the Board of directors and are given particular consideration
in the annual strategic plan which is approved by the Board.
A strategic risk assessment is carried out on an annual basis.
The management of operational risk is a line function,
conducted in compliance with a comprehensive set of group
policies and standards to cover all aspects of operational risk
control. Performance is measured on a regular basis by
means of both self-assessments and audits by independent
consultants. In addition, the Group promotes ongoing
commitment to risk management and control by participating
in externally organised risk management and safety systems.
Insurance cover on assets is based upon current
replacement values. Consistent with the high standard of risk
management, a substantial portion of risk is self-insured at
costs well below market premiums. All risks are adequately
covered, except where the premium cost is excessive in
relation to the probability and extent of loss.
Key risks
Macroeconomic environment
As a global player, the Group is exposed to the world’s
developed and developing markets, and its operations and
financial results will be impacted by trends in the macro-
economic environment.
Market risk
The Group’s activities expose it primarily to the risks of
fluctuations in foreign currency exchange rates. Foreign
currency risk refers to the risk that the fair value or future
cash flows of a financial instrument will fluctuate because of
changes in foreign exchange rates. The Group enters into
various derivative financial instruments to manage its
exposure to foreign currency risk, including foreign exchange
forward contracts and call and put options to manage the
exchange rate risk arising on foreign denominated
transactions. The Board cannot predict the effect of
exchange rate fluctuations upon future operating results and
there can be no assurance that exchange rate fluctuations
will not have a material effect on its business, operating
results or financial condition.
Working capital
The Group’s business is working-capital intensive as
accounts receivable and inventories are financed. The Group
largely relies on revolving credit and vendor financing for its
working capital needs. The Group typically carries sufficient
inventory to meet its customers’ anticipated needs. Decline
in demand or technological change could lead to excess or
obsolete inventory.
Dependence on key personnel
Certain key employees who would be difficult to replace have
relationships with principal vendors and customers. The loss
of any or all of these employees could harm the business
and prospects of the Group. The appropriate incentive
schemes are in place to ensure that key personnel remain
within the Group.
Internal financial controls
The directors are responsible for ensuring that internal control
systems exist that provide reasonable assurance regarding
the safeguarding of assets and the prevention of their
unauthorised use or disposition, proper accounting records
are maintained and the financial and operational information
used in the businesses is reliable.
Mu
stek In
tegrated
An
nu
al Rep
ort 2
01
2
63
Internal audit function
The internal audit department continues to grow and mature
at Mustek and is an independent appraisal function whose
primary mandate is to examine and evaluate the
effectiveness of the applicable operational activities, the
attendant business risks, including those that arise
subsequent to the year-end and the systems of internal
financial control, so as to bring material deficiencies,
instances of non-compliance and development needs to the
attention of the Audit and Risk Committee, external auditors
and operational management for resolution.
Internal audit is an independent, objective assurance and
consulting activity to add value and improve the Group’s
operations. It helps the Group accomplish its objectives by
bringing a systematic, disciplined approach to evaluate and
improve the effectiveness of risk management, control and
governance processes.
It provides:
assurance that the management processes are adequate
to identify and monitor significant risks;
confirmation of the adequacy and effective operation of the
established internal control systems; and
credible processes for feedback on risk management
and assurance.
The internal audit function makes its reports available to the
external auditors to ensure proper coverage and to minimise
duplication of effort. Internal audit plans are tabled
periodically to take account of changing business needs.
Follow-up audits are conducted in areas where weaknesses
are identified.
The internal audit plan is of a continual nature so as to
identify not only existing and residual risks, but also emerging
risks and issues highlighted by the Audit and Risk Committee
and senior management.
Mu
ste
k In
teg
rate
d A
nn
ual
Rep
ort
20
12
64
Directorate
Executive directors
David Kan
Chief Executive Officer
David Kan, aged 53, is the co-founder and a major shareholder
of Mustek, and its CEO since the Group’s inception in 1987.
He holds a BSc (Eng) degree, with a major in mechanical
engineering.
Hein Engelbrecht
Executive director
Hein Engelbrecht, aged 43, holds a BCom (Hons) degree, is a
registered chartered accountant, and joined the Group in 1997
as Group Financial Manager. He completed his articles with
Grant Thornton Kessel Feinstein and spent two-and-a-half
years as financial manager of Office Directions (Pty) Limited.
He was appointed to the Board on 1 September 2000.
Neels Coetzee
Financial director
Neels Coetzee, aged 37, is a registered chartered accountant
and joined the Group in 2001 as Group Financial Manager
after completing his articles with Deloitte & Touche in 2000.
He was appointed to the Board as Financial Director on
29 August 2008.
Non-executive directors
Dr Len Konar
Independent non-executive Chairman
Dr Len Konar, aged 58, joined the Mustek Board on
25 November 2003 and was appointed as Chairman on
16 October 2009. Len is a chartered accountant and was
previously executive director of The Independent
Development Trust where he was, amongst other activities,
responsible for the internal audit and investments portfolios.
Prior to that, he was professor and head of the Department
of Accountancy at the University of Durban-Westville. He is
the past patron of the Institute of Internal Auditors
South Africa, and a member of the King Committee on
Corporate Governance, the Securities Regulation Panel, the
Corporate Governance Forum and the Institute of Directors.
Dr Konar is also a non-executive director of Old Mutual
South Africa, the South African Reserve Bank, JD Group,
Sappi and Steinhoff International Holdings.
Mdu Gama
Independent non-executive director
Mdu Gama, aged 43, was appointed as director of Mustek
in 2002. He holds an MBA degree, a PhD (Finance) degree
and various management qualifications from SA, US and
UK universities. He is currently the CEO of Resultant
Finance (Pty) Limited and a non-executive director of
Comztek (Pty) Limited.
Thembisa Dingaan
Independent non-executive director
Thembisa Dingaan, aged 39, holds an LLM degree and
joined the Mustek Board on 6 February 2009. She is also a
director of the Development Bank of Southern Africa, where
she is also a member of the credit and investment, audit and
finance committees. She is a member of the Trade and
Industry Standing Advisory Committee on Company Law.
In August 2008, she was appointed by Cabinet as a board
member of the Export Credit Insurance Corporation of
South Africa (ECIC).
Ralph Patmore
Independent non-executive director
Ralph Patmore, aged 60, was appointed to the Board on
16 October 2009. He holds a BCom degree and an MBL from
Unisa’s School of Business Leadership. He was the CEO of
Iliad Africa Limited since inception in 1998 to retirement in
September 2008. He is also a non-executive director of
Sentula Mining Limited, Calgro M3 Holdings Limited and
ARB Holdings Limited.
Executive Committee
This committee is responsible for managing Mustek’s
operations, developing strategy and policy proposals for the
Board’s consideration and implementing the Board’s directives.
It has a properly constituted mandate and terms of reference.
The committee’s responsibilities include:
leading executives, management and employees;
developing the annual budget and business plans for the
Board’s approval; and
developing, implementing and monitoring policies and
procedures, internal controls, governance, risk
management, ethics and authority levels across the Group.
Leadership
Mu
stek In
tegrated
An
nu
al Rep
ort 2
01
2
65
Annual Financial Statements
Fin
an
cia
l Sta
tem
en
ts
Audit and Risk Committee Report 66
Directors’ Responsibility for Financial Reporting 67
Certification by Company Secretary 67
Independent Auditors’ Report 68
Report of the Directors 69
Consolidated Statement of Comprehensive Income 78
Consolidated Statement of Financial Position 79
Consolidated Statement of Changes in Equity 80
Consolidated Cash Flow Statement 81
Company Statement of Comprehensive Income 82
Company Statement of Financial Position 83
Company Statement of Changes in Equity 84
Company Cash Flow Statement 85
Accounting Policies 86
Notes to the Annual Financial Statements 102
Mu
ste
k In
teg
rate
d A
nn
ual
Rep
ort
20
12
66
Audit and Risk Committee Report
The Audit and Risk Committee comprised the following
non-executive directors during the year and to the date of
this report:
Mr RB Patmore – Chairman
Dr ME Gama
Ms T Dingaan.
The Audit and Risk Committee reports that it has adopted
formal terms of reference as its charter, and has regulated its
affairs in compliance with its charter, and has discharged all
of the responsibilities set out herein.
The Audit and Risk Committee considered the matters
set out in section 94(7) of the Companies Act (71 of 2008),
and is satisfied with the independence and objectivity
of Deloitte & Touche as external auditors and
Mr Bester Greyling as the designated auditor. The Audit and
Risk Committee further approved the fees to be paid to
Deloitte & Touche and its terms of engagement and
pre-approved any proposed contract with Deloitte & Touche
for the provision of non-audit services to the Company up
to 25% of the audit fee in aggregate.
As required by the JSE Listings Requirement 3.84(h), the
Audit and Risk Committee has satisfied itself that the
Chief Financial Officer has the appropriate expertise and
experience.
The Audit and Risk Committee is satisfied that there was no
material breakdown in the internal accounting controls during
the financial year. This is based on the information and
explanations given by management and the internal audit
function.
The Audit and Risk Committee has evaluated the financial
statements of Mustek Limited and the Group for the year
ended 30 June 2012 and, based on the information provided
to the Audit and Risk Committee, considers that the Group
complies, in all material aspects, with the requirements of the
Companies Act (71 of 2008), as amended, and International
Financial Reporting Standards (IFRS).
RB Patmore
27 August 2012
Mu
stek In
tegrated
An
nu
al Rep
ort 2
01
2
67
Directors’ Responsibility for Financial Reporting
The directors of the Company are responsible for the
maintenance of adequate accounting records and the
preparation and integrity of the annual financial statements
and related information. The financial statements are based
on appropriate accounting policies supported by reasonable
and prudent judgements, with estimates that have been
consistently applied and have been prepared in accordance
with International Financial Reporting Standards and in the
manner required by the Companies Act of South Africa. The
Group’s independent external auditors, Deloitte & Touche,
have audited the financial statements and their unmodified
report appears on page 68.
The directors are also responsible for the systems of internal
control. These are designed to provide reasonable, but not
absolute, assurance as to the reliability of the financial
statements, and to adequately safeguard, verify and maintain
accountability of assets, and to prevent and detect material
misstatement and loss. The systems are implemented and
monitored by suitably trained personnel with an appropriate
segregation of authority and duties. Nothing has come to the
attention of the directors to indicate that any material
breakdown in the functioning of these controls, procedures
and systems has occurred during the year under review.
The annual financial statements are prepared on a going-
concern basis. Nothing has come to the attention of the
directors to indicate that the Company will not remain a
going concern for the foreseeable future.
The annual financial statements set out on pages 69 to 161
were approved by the Board of Directors on 27 August 2012
and are signed on their behalf by:
D Konar DC Kan
Chairman Chief Executive Officer
Johannesburg
27 August 2012
Certification by Company Secretary
In terms of section 88(2)(e) of the Companies Act
(Act 71 of 2008), as amended (the “Act”), I certify that for the
year ended 30 June 2012, Mustek Limited has lodged with
the Companies and Intellectual Property Commission all such
returns as are required of a public company in terms of the
Act and that all such returns are true, correct and up to date.
CJ Coetzee
Company Secretary
27 August 2012
The annual financial statements have been prepared by
Ernst Nieuwoudt, Group Accountant.
Mu
ste
k In
teg
rate
d A
nn
ual
Rep
ort
20
12
68
Independent Auditors’ Reportfor the year ended 30 June 2012
accounting estimates made by management, as well as
evaluating the overall presentation of the financial statements.
We believe that the audit evidence we have obtained is
sufficient and appropriate to provide a basis for our audit
opinion.
Opinion
In our opinion, the consolidated and separate financial
statements present fairly, in all material respects,
the consolidated and separate financial position of
Mustek Limited as at 30 June 2012, and its consolidated
and separate financial performance and consolidated and
separate cash flows for the year then ended, in accordance
with International Financial Reporting Standards and the
requirements of the Companies Act of South Africa.
Other reports required by the Companies Act
As part of our audit of the consolidated and separate
financial statements for the year ended 30 June 2012,
we have read the Directors’ Report, the Audit and Risk
Committee’s Report and the Company Secretary’s Certificate
for the purpose of identifying whether there are material
inconsistencies between these reports and the audited
consolidated and separate financial statements. These
reports are the responsibility of the respective preparers.
Based on reading these reports we have not identified
material inconsistencies between these reports and the
audited consolidated and separate financial statements.
However, we have not audited these reports and accordingly
do not express an opinion on these reports.
Deloitte & Touche
Registered Auditor
Per Bester Greyling
Partner
Pretoria, South Africa
27 August 2012
To the shareholders of Mustek Limited
We have audited the consolidated and separate financial
statements of Mustek Limited, set out on pages 69 to 161,
which comprise the statements of financial position as at
30 June 2012, the statements of comprehensive income, the
statements of changes in equity, the cash flow statements for
the year then ended, and the notes, comprising a summary
of significant accounting policies and other explanatory
statements of information.
Directors’ responsibility for the financial statements
The Company’s directors are responsible for the preparation
and fair presentation of the consolidated and separate
financial statements in accordance with International Financial
Reporting Standards and the requirements of the Companies
Act of South Africa and for such internal control as the
directors determine is necessary to enable the preparation
of the consolidated and separate financial statements that
are free from material misstatements, whether due to fraud
or error.
Auditors’ responsibility
Our responsibility is to express an opinion on these
consolidated and separate financial statements based on our
audit. We conducted our audit in accordance with
International Standards on Auditing. Those standards require
that we comply with ethical requirements and plan and
perform the audit to obtain reasonable assurance whether
the consolidated and separate financial statements are free
from material misstatement.
An audit involves performing procedures to obtain audit
evidence about the amounts and disclosure in the financial
statements. The procedures selected depend on the
auditors’ judgement, including the assessment of the risks of
material misstatement of the financial statements, whether
due to fraud or error. In making those risk assessments, the
auditor considers internal control relevant to the entity’s
preparation and fair presentation of the financial statements
in order to design audit procedures that are appropriate in
the circumstances, but not for the purpose of expressing an
opinion on the effectiveness of the entity’s internal control.
An audit also includes evaluating the appropriateness of
accounting policies used and the reasonableness of
Mu
stek In
tegrated
An
nu
al Rep
ort 2
01
2
69
Report of the Directorsfor the year ended 30 June 2012
Introduction
The directors have pleasure in presenting their report on the activities of the Company and the Group for the year ended 30 June 2012.
General review
Mustek Limited is a company incorporated in South Africa and listed on the JSE Limited and the Group’s major activities comprise
the procurement, assembly, distribution and servicing of computers, computer components and allied products. The Group’s profit
before taxation from these activities was R109,3 million (2011: R132,7 million).
Share capital
The authorised and issued share capital of the Company is detailed in note 20 to the annual financial statements. During the current
financial year, 1 078 000 depository receipts representing 1 078 000 ordinary shares, were bought back on the Taiwan Stock Exchange.
Directors
The directors in office at the date of this report are as follows:
Non-executive Executive Business address Postal address
D Konar (Chairman)1, 3, 4, 5 DC Kan (Chief Executive Officer) 322 15th Road PO Box 1638ME Gama1, 2, 4, 5 H Engelbrecht4 Randjespark ParklandsT Dingaan1, 2 CJ Coetzee Midrand 2121RB Patmore1, 2, 3 1685
1Independent.2Audit and Risk Committee member.3Remuneration and Nomination Committee member.4Social and Ethics Committee member.5 These directors are retiring in terms of the Company’s articles of association. In terms of the statutes of the Company, D Konar and ME Gama are available for re-election at the next annual general meeting. Biographical details of all the directors are set out on page 64.
Company Secretary
CJ Coetzee
Directors’ shareholding
At 30 June 2012, the directors collectively held the following direct and indirect interests in shares in the Company, which represents
11,3% (2011: 10,3%) of the issued share capital of the Company. (No change occurred between 30 June 2012 and 27 August 2012):
Beneficial Non-beneficialDirect Indirect Indirect
2012 2011 2012 2011 2012 2011
DC Kan 46 46 2 460 083 654 843 9 032 442 10 032 442H Engelbrecht 430 000 430 000 — — — —CJ Coetzee* 307 700 184 800 — — — —D Konar 25 303 25 303 — — — —
763 049 640 149 2 460 083 654 843 9 032 442 10 032 442
These shareholdings exclude options held. The remainder of the directors do not hold any shares.
* The 2012 holding includes 172 700 shares held through 1 727 single stock future contracts (2011: 49 800 shares held through 498 single stock future contracts).
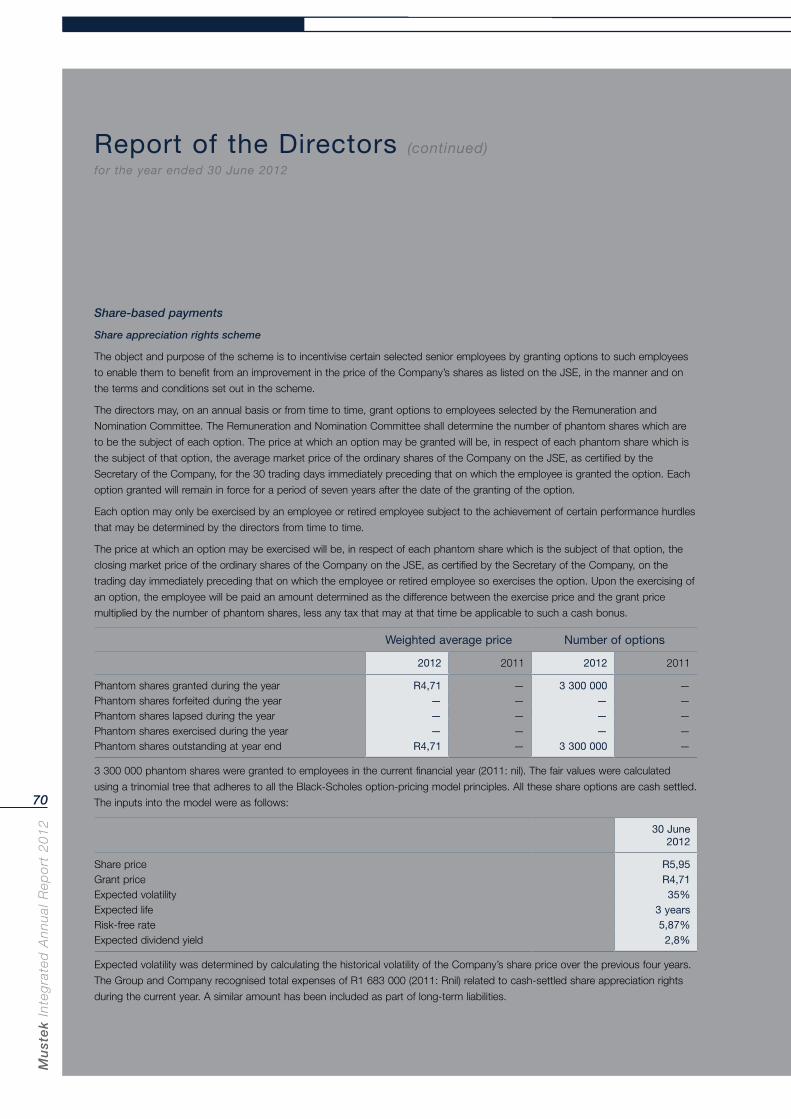
Mu
ste
k In
teg
rate
d A
nn
ual
Rep
ort
20
12
70
Report of the Directors (continued)for the year ended 30 June 2012
Share-based payments
Share appreciation rights scheme
The object and purpose of the scheme is to incentivise certain selected senior employees by granting options to such employees
to enable them to benefit from an improvement in the price of the Company’s shares as listed on the JSE, in the manner and on
the terms and conditions set out in the scheme.
The directors may, on an annual basis or from time to time, grant options to employees selected by the Remuneration and
Nomination Committee. The Remuneration and Nomination Committee shall determine the number of phantom shares which are
to be the subject of each option. The price at which an option may be granted will be, in respect of each phantom share which is
the subject of that option, the average market price of the ordinary shares of the Company on the JSE, as certified by the
Secretary of the Company, for the 30 trading days immediately preceding that on which the employee is granted the option. Each
option granted will remain in force for a period of seven years after the date of the granting of the option.
Each option may only be exercised by an employee or retired employee subject to the achievement of certain performance hurdles
that may be determined by the directors from time to time.
The price at which an option may be exercised will be, in respect of each phantom share which is the subject of that option, the
closing market price of the ordinary shares of the Company on the JSE, as certified by the Secretary of the Company, on the
trading day immediately preceding that on which the employee or retired employee so exercises the option. Upon the exercising of
an option, the employee will be paid an amount determined as the difference between the exercise price and the grant price
multiplied by the number of phantom shares, less any tax that may at that time be applicable to such a cash bonus.
Weighted average price Number of options
2012 2011 2012 2011
Phantom shares granted during the year R4,71 — 3 300 000 —Phantom shares forfeited during the year — — — —Phantom shares lapsed during the year — — — —Phantom shares exercised during the year — — — —Phantom shares outstanding at year end R4,71 — 3 300 000 —
3 300 000 phantom shares were granted to employees in the current financial year (2011: nil). The fair values were calculated
using a trinomial tree that adheres to all the Black-Scholes option-pricing model principles. All these share options are cash settled.
The inputs into the model were as follows:
30 June2012
Share price R5,95Grant price R4,71Expected volatility 35%Expected life 3 yearsRisk-free rate 5,87%Expected dividend yield 2,8%
Expected volatility was determined by calculating the historical volatility of the Company’s share price over the previous four years.
The Group and Company recognised total expenses of R1 683 000 (2011: Rnil) related to cash-settled share appreciation rights
during the current year. A similar amount has been included as part of long-term liabilities.
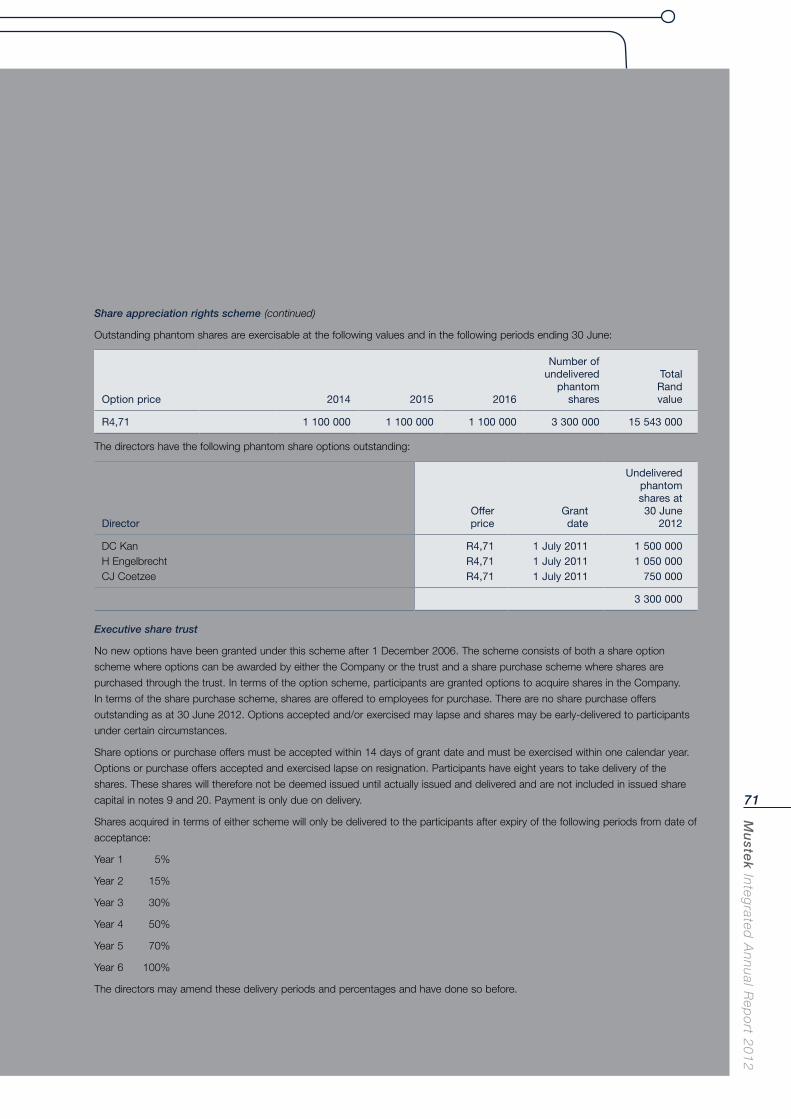
Mu
stek In
tegrated
An
nu
al Rep
ort 2
01
2
71
Share appreciation rights scheme (continued)
Outstanding phantom shares are exercisable at the following values and in the following periods ending 30 June:
Option price 2014 2015 2016
Number of undelivered
phantomshares
Total Rand value
R4,71 1 100 000 1 100 000 1 100 000 3 300 000 15 543 000
The directors have the following phantom share options outstanding:
DirectorOffer price
Grant date
Undeliveredphantomshares at30 June
2012
DC Kan R4,71 1 July 2011 1 500 000H Engelbrecht R4,71 1 July 2011 1 050 000CJ Coetzee R4,71 1 July 2011 750 000
3 300 000
Executive share trust
No new options have been granted under this scheme after 1 December 2006. The scheme consists of both a share option
scheme where options can be awarded by either the Company or the trust and a share purchase scheme where shares are
purchased through the trust. In terms of the option scheme, participants are granted options to acquire shares in the Company.
In terms of the share purchase scheme, shares are offered to employees for purchase. There are no share purchase offers
outstanding as at 30 June 2012. Options accepted and/or exercised may lapse and shares may be early-delivered to participants
under certain circumstances.
Share options or purchase offers must be accepted within 14 days of grant date and must be exercised within one calendar year.
Options or purchase offers accepted and exercised lapse on resignation. Participants have eight years to take delivery of the
shares. These shares will therefore not be deemed issued until actually issued and delivered and are not included in issued share
capital in notes 9 and 20. Payment is only due on delivery.
Shares acquired in terms of either scheme will only be delivered to the participants after expiry of the following periods from date of
acceptance:
Year 1 5%
Year 2 15%
Year 3 30%
Year 4 50%
Year 5 70%
Year 6 100%
The directors may amend these delivery periods and percentages and have done so before.
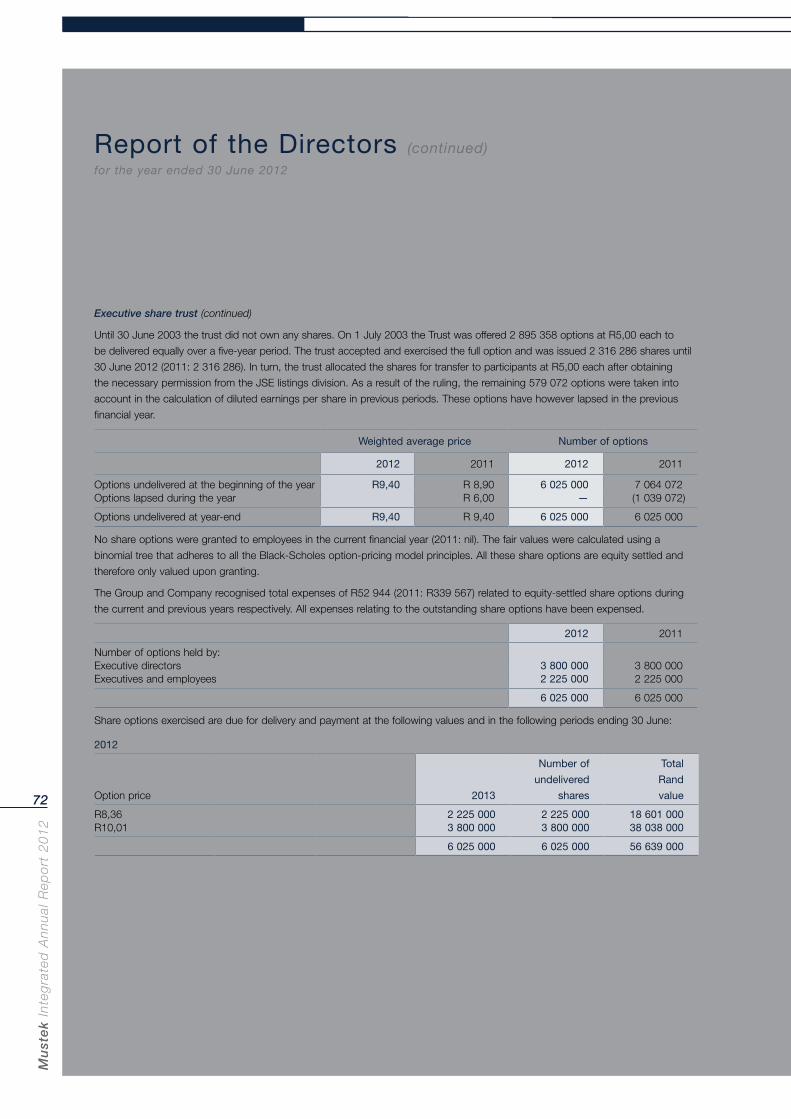
Mu
ste
k In
teg
rate
d A
nn
ual
Rep
ort
20
12
72
Report of the Directors (continued)for the year ended 30 June 2012
Executive share trust (continued)
Until 30 June 2003 the trust did not own any shares. On 1 July 2003 the Trust was offered 2 895 358 options at R5,00 each to
be delivered equally over a five-year period. The trust accepted and exercised the full option and was issued 2 316 286 shares until
30 June 2012 (2011: 2 316 286). In turn, the trust allocated the shares for transfer to participants at R5,00 each after obtaining
the necessary permission from the JSE listings division. As a result of the ruling, the remaining 579 072 options were taken into
account in the calculation of diluted earnings per share in previous periods. These options have however lapsed in the previous
financial year.
Weighted average price Number of options
2012 2011 2012 2011
Options undelivered at the beginning of the year R9,40 R 8,90 6 025 000 7 064 072Options lapsed during the year R 6,00 — (1 039 072)
Options undelivered at year-end R9,40 R 9,40 6 025 000 6 025 000
No share options were granted to employees in the current financial year (2011: nil). The fair values were calculated using a
binomial tree that adheres to all the Black-Scholes option-pricing model principles. All these share options are equity settled and
therefore only valued upon granting.
The Group and Company recognised total expenses of R52 944 (2011: R339 567) related to equity-settled share options during
the current and previous years respectively. All expenses relating to the outstanding share options have been expensed.
2012 2011
Number of options held by:Executive directors 3 800 000 3 800 000Executives and employees 2 225 000 2 225 000
6 025 000 6 025 000
Share options exercised are due for delivery and payment at the following values and in the following periods ending 30 June:
2012
Option price 2013
Number of
undelivered
shares
Total
Rand
value
R8,36 2 225 000 2 225 000 18 601 000R10,01 3 800 000 3 800 000 38 038 000
6 025 000 6 025 000 56 639 000
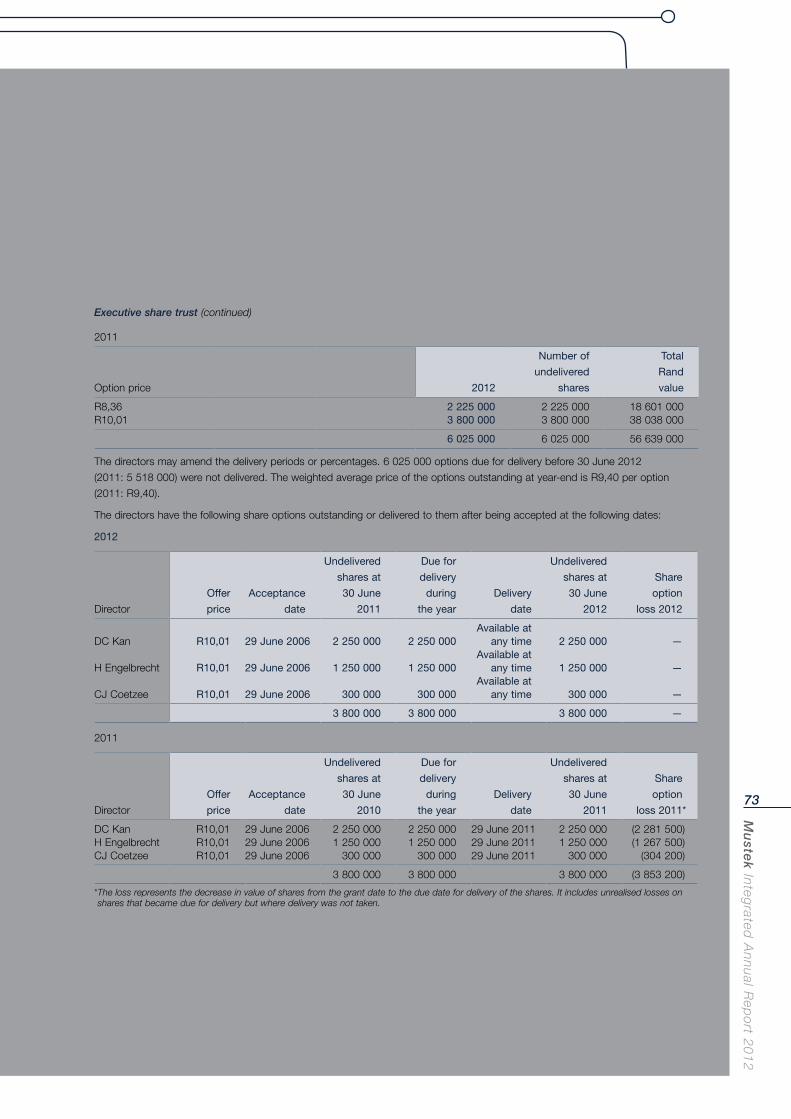
Mu
stek In
tegrated
An
nu
al Rep
ort 2
01
2
73
Executive share trust (continued)
2011
Option price 2012
Number of
undelivered
shares
Total
Rand
value
R8,36 2 225 000 2 225 000 18 601 000R10,01 3 800 000 3 800 000 38 038 000
6 025 000 6 025 000 56 639 000
The directors may amend the delivery periods or percentages. 6 025 000 options due for delivery before 30 June 2012
(2011: 5 518 000) were not delivered. The weighted average price of the options outstanding at year-end is R9,40 per option
(2011: R9,40).
The directors have the following share options outstanding or delivered to them after being accepted at the following dates:
2012
Director
Offer
price
Acceptance
date
Undelivered
shares at
30 June
2011
Due for
delivery
during
the year
Delivery
date
Undelivered
shares at
30 June
2012
Share
option
loss 2012
DC Kan R10,01 29 June 2006 2 250 000 2 250 000Available at
any time 2 250 000 —
H Engelbrecht R10,01 29 June 2006 1 250 000 1 250 000Available at
any time 1 250 000 —
CJ Coetzee R10,01 29 June 2006 300 000 300 000Available at
any time 300 000 —
3 800 000 3 800 000 3 800 000 —
2011
Director
Offer
price
Acceptance
date
Undelivered
shares at
30 June
2010
Due for
delivery
during
the year
Delivery
date
Undelivered
shares at
30 June
2011
Share
option
loss 2011*
DC Kan R10,01 29 June 2006 2 250 000 2 250 000 29 June 2011 2 250 000 (2 281 500)H Engelbrecht R10,01 29 June 2006 1 250 000 1 250 000 29 June 2011 1 250 000 (1 267 500)CJ Coetzee R10,01 29 June 2006 300 000 300 000 29 June 2011 300 000 (304 200)
3 800 000 3 800 000 3 800 000 (3 853 200)
* The loss represents the decrease in value of shares from the grant date to the due date for delivery of the shares. It includes unrealised losses on shares that became due for delivery but where delivery was not taken.
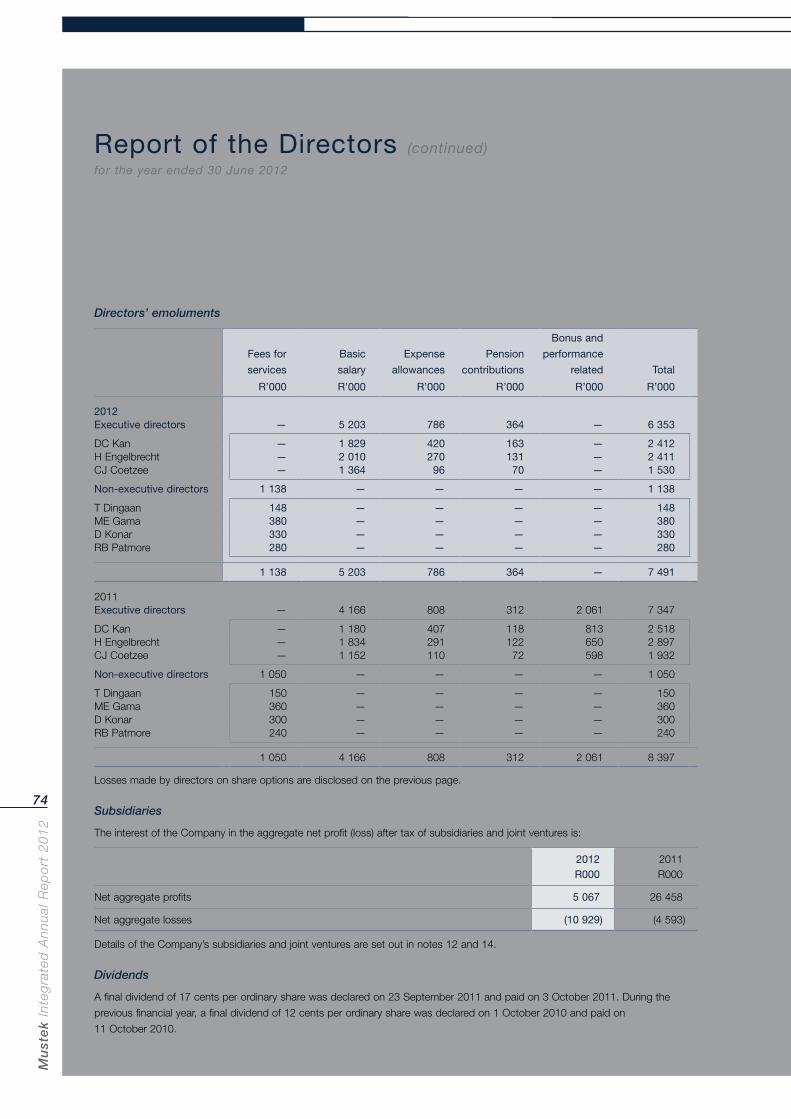
Mu
ste
k In
teg
rate
d A
nn
ual
Rep
ort
20
12
74
Report of the Directors (continued)for the year ended 30 June 2012
Directors’ emoluments
Fees for
services
Basic
salary
Expense
allowances
Pension
contributions
Bonus and
performance
related Total
R’000 R’000 R’000 R’000 R’000 R’000
2012Executive directors — 5 203 786 364 — 6 353
DC Kan — 1 829 420 163 — 2 412H Engelbrecht — 2 010 270 131 — 2 411CJ Coetzee — 1 364 96 70 — 1 530
Non-executive directors 1 138 — — — — 1 138
T Dingaan 148 — — — — 148ME Gama 380 — — — — 380D Konar 330 — — — — 330RB Patmore 280 — — — — 280
1 138 5 203 786 364 — 7 491
2011Executive directors — 4 166 808 312 2 061 7 347
DC Kan — 1 180 407 118 813 2 518H Engelbrecht — 1 834 291 122 650 2 897CJ Coetzee — 1 152 110 72 598 1 932
Non-executive directors 1 050 — — — — 1 050
T Dingaan 150 — — — — 150ME Gama 360 — — — — 360D Konar 300 — — — — 300RB Patmore 240 — — — — 240
1 050 4 166 808 312 2 061 8 397
Losses made by directors on share options are disclosed on the previous page.
Subsidiaries
The interest of the Company in the aggregate net profit (loss) after tax of subsidiaries and joint ventures is:
2012 2011R000 R000
Net aggregate profits 5 067 26 458
Net aggregate losses (10 929) (4 593)
Details of the Company’s subsidiaries and joint ventures are set out in notes 12 and 14.
Dividends
A final dividend of 17 cents per ordinary share was declared on 23 September 2011 and paid on 3 October 2011. During the
previous financial year, a final dividend of 12 cents per ordinary share was declared on 1 October 2010 and paid on
11 October 2010.
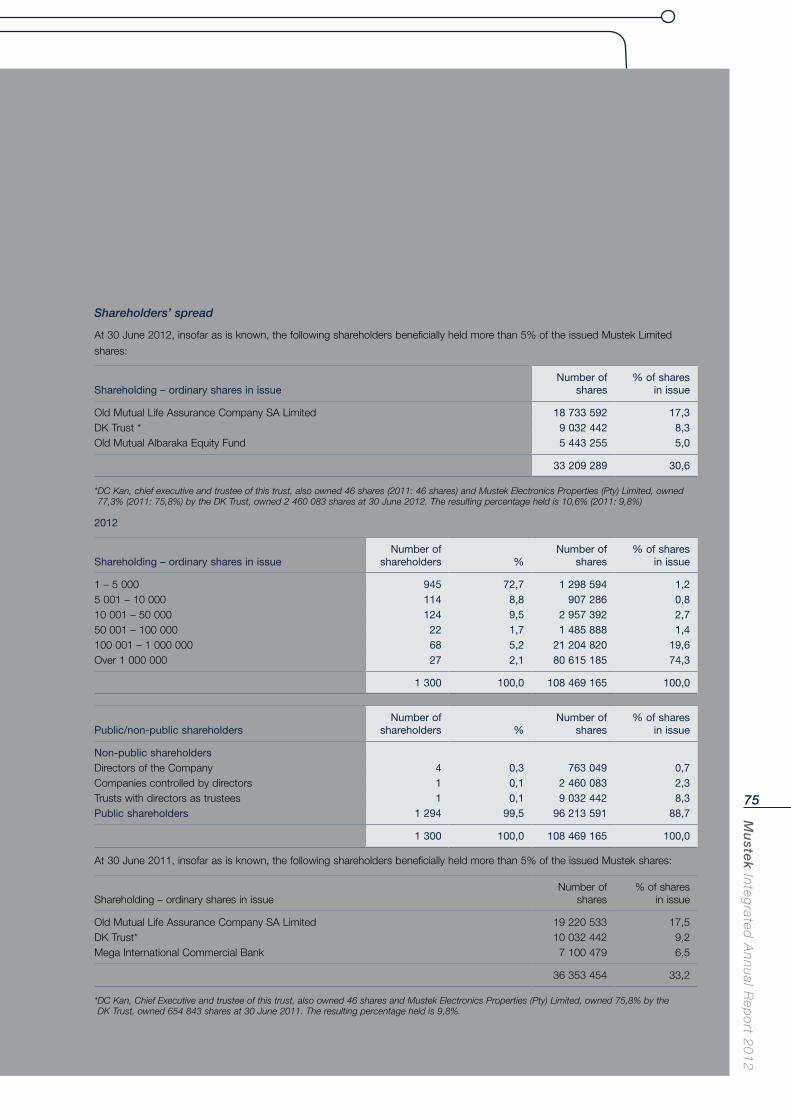
Mu
stek In
tegrated
An
nu
al Rep
ort 2
01
2
75
Shareholders’ spread
At 30 June 2012, insofar as is known, the following shareholders beneficially held more than 5% of the issued Mustek Limited
shares:
Shareholding – ordinary shares in issueNumber of
shares% of shares
in issue
Old Mutual Life Assurance Company SA Limited 18 733 592 17,3DK Trust * 9 032 442 8,3Old Mutual Albaraka Equity Fund 5 443 255 5,0
33 209 289 30,6
* DC Kan, chief executive and trustee of this trust, also owned 46 shares (2011: 46 shares) and Mustek Electronics Properties (Pty) Limited, owned 77,3% (2011: 75,8%) by the DK Trust, owned 2 460 083 shares at 30 June 2012. The resulting percentage held is 10,6% (2011: 9,8%)
2012
Shareholding – ordinary shares in issueNumber of
shareholders %Number of
shares% of shares
in issue
1 – 5 000 945 72,7 1 298 594 1,25 001 – 10 000 114 8,8 907 286 0,810 001 – 50 000 124 9,5 2 957 392 2,750 001 – 100 000 22 1,7 1 485 888 1,4100 001 – 1 000 000 68 5,2 21 204 820 19,6Over 1 000 000 27 2,1 80 615 185 74,3
1 300 100,0 108 469 165 100,0
Public/non-public shareholdersNumber of
shareholders %Number of
shares% of shares
in issue
Non-public shareholdersDirectors of the Company 4 0,3 763 049 0,7Companies controlled by directors 1 0,1 2 460 083 2,3Trusts with directors as trustees 1 0,1 9 032 442 8,3Public shareholders 1 294 99,5 96 213 591 88,7
1 300 100,0 108 469 165 100,0
At 30 June 2011, insofar as is known, the following shareholders beneficially held more than 5% of the issued Mustek shares:
Shareholding – ordinary shares in issueNumber of
shares% of shares
in issue
Old Mutual Life Assurance Company SA Limited 19 220 533 17,5DK Trust* 10 032 442 9,2Mega International Commercial Bank 7 100 479 6,5
36 353 454 33,2
* DC Kan, Chief Executive and trustee of this trust, also owned 46 shares and Mustek Electronics Properties (Pty) Limited, owned 75,8% by the DK Trust, owned 654 843 shares at 30 June 2011. The resulting percentage held is 9,8%.
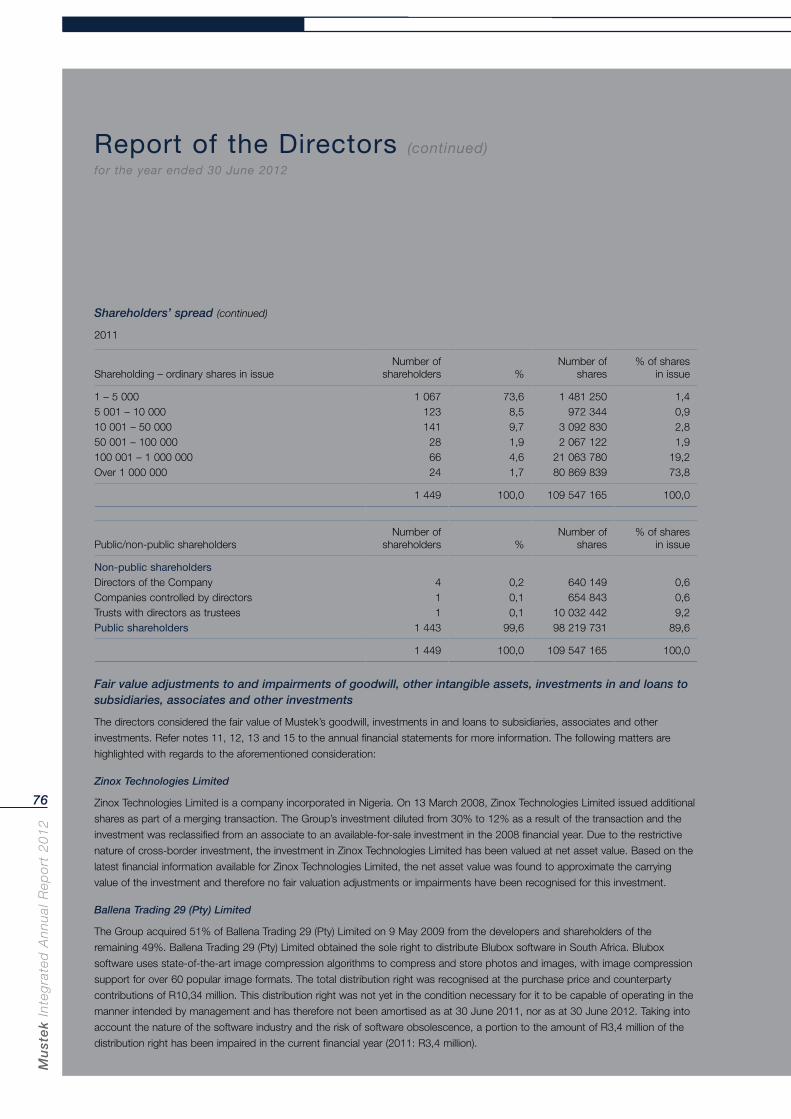
Mu
ste
k In
teg
rate
d A
nn
ual
Rep
ort
20
12
76
Report of the Directors (continued)for the year ended 30 June 2012
Shareholders’ spread (continued)
2011
Shareholding – ordinary shares in issueNumber of
shareholders %Number of
shares% of shares
in issue
1 – 5 000 1 067 73,6 1 481 250 1,45 001 – 10 000 123 8,5 972 344 0,910 001 – 50 000 141 9,7 3 092 830 2,850 001 – 100 000 28 1,9 2 067 122 1,9100 001 – 1 000 000 66 4,6 21 063 780 19,2Over 1 000 000 24 1,7 80 869 839 73,8
1 449 100,0 109 547 165 100,0
Public/non-public shareholdersNumber of
shareholders %Number of
shares% of shares
in issue
Non-public shareholdersDirectors of the Company 4 0,2 640 149 0,6Companies controlled by directors 1 0,1 654 843 0,6Trusts with directors as trustees 1 0,1 10 032 442 9,2Public shareholders 1 443 99,6 98 219 731 89,6
1 449 100,0 109 547 165 100,0
Fair value adjustments to and impairments of goodwill, other intangible assets, investments in and loans to subsidiaries, associates and other investments
The directors considered the fair value of Mustek’s goodwill, investments in and loans to subsidiaries, associates and other
investments. Refer notes 11, 12, 13 and 15 to the annual financial statements for more information. The following matters are
highlighted with regards to the aforementioned consideration:
Zinox Technologies Limited
Zinox Technologies Limited is a company incorporated in Nigeria. On 13 March 2008, Zinox Technologies Limited issued additional
shares as part of a merging transaction. The Group’s investment diluted from 30% to 12% as a result of the transaction and the
investment was reclassified from an associate to an available-for-sale investment in the 2008 financial year. Due to the restrictive
nature of cross-border investment, the investment in Zinox Technologies Limited has been valued at net asset value. Based on the
latest financial information available for Zinox Technologies Limited, the net asset value was found to approximate the carrying
value of the investment and therefore no fair valuation adjustments or impairments have been recognised for this investment.
Ballena Trading 29 (Pty) Limited
The Group acquired 51% of Ballena Trading 29 (Pty) Limited on 9 May 2009 from the developers and shareholders of the
remaining 49%. Ballena Trading 29 (Pty) Limited obtained the sole right to distribute Blubox software in South Africa. Blubox
software uses state-of-the-art image compression algorithms to compress and store photos and images, with image compression
support for over 60 popular image formats. The total distribution right was recognised at the purchase price and counterparty
contributions of R10,34 million. This distribution right was not yet in the condition necessary for it to be capable of operating in the
manner intended by management and has therefore not been amortised as at 30 June 2011, nor as at 30 June 2012. Taking into
account the nature of the software industry and the risk of software obsolescence, a portion to the amount of R3,4 million of the
distribution right has been impaired in the current financial year (2011: R3,4 million).
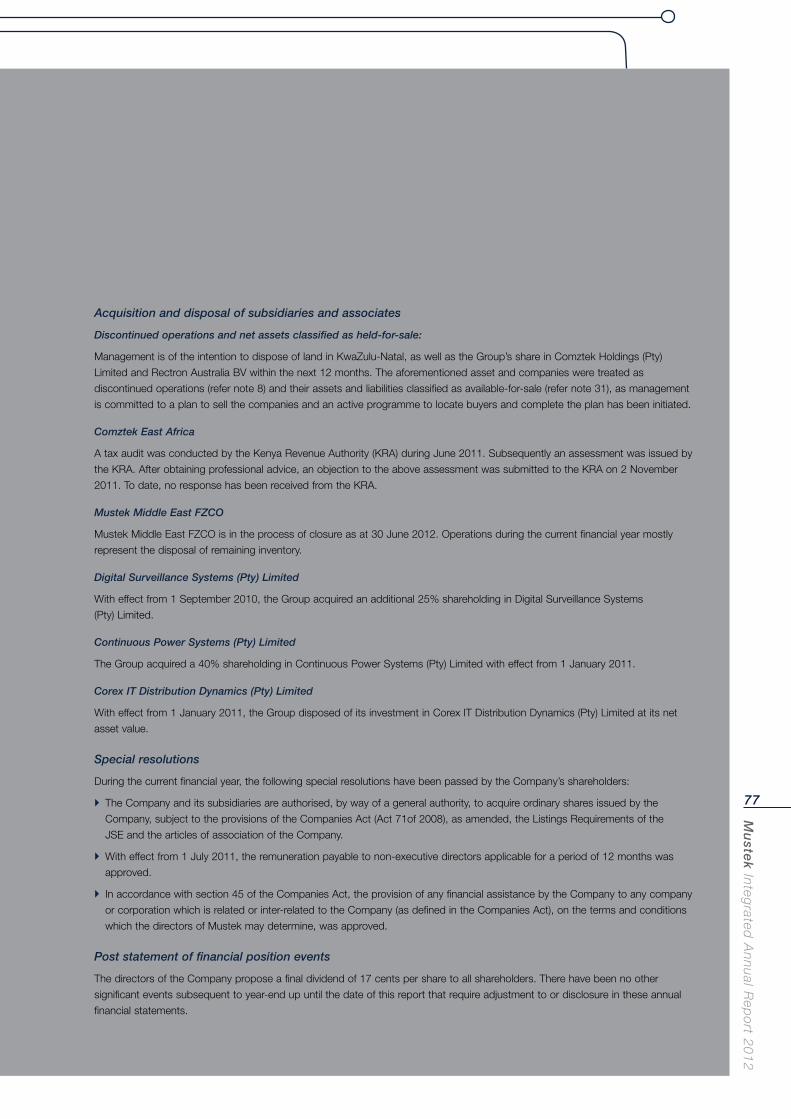
Mu
stek In
tegrated
An
nu
al Rep
ort 2
01
2
77
Acquisition and disposal of subsidiaries and associates
Discontinued operations and net assets classified as held-for-sale:
Management is of the intention to dispose of land in KwaZulu-Natal, as well as the Group’s share in Comztek Holdings (Pty)
Limited and Rectron Australia BV within the next 12 months. The aforementioned asset and companies were treated as
discontinued operations (refer note 8) and their assets and liabilities classified as available-for-sale (refer note 31), as management
is committed to a plan to sell the companies and an active programme to locate buyers and complete the plan has been initiated.
Comztek East Africa
A tax audit was conducted by the Kenya Revenue Authority (KRA) during June 2011. Subsequently an assessment was issued by
the KRA. After obtaining professional advice, an objection to the above assessment was submitted to the KRA on 2 November
2011. To date, no response has been received from the KRA.
Mustek Middle East FZCO
Mustek Middle East FZCO is in the process of closure as at 30 June 2012. Operations during the current financial year mostly
represent the disposal of remaining inventory.
Digital Surveillance Systems (Pty) Limited
With effect from 1 September 2010, the Group acquired an additional 25% shareholding in Digital Surveillance Systems
(Pty) Limited.
Continuous Power Systems (Pty) Limited
The Group acquired a 40% shareholding in Continuous Power Systems (Pty) Limited with effect from 1 January 2011.
Corex IT Distribution Dynamics (Pty) Limited
With effect from 1 January 2011, the Group disposed of its investment in Corex IT Distribution Dynamics (Pty) Limited at its net
asset value.
Special resolutions
During the current financial year, the following special resolutions have been passed by the Company’s shareholders:
The Company and its subsidiaries are authorised, by way of a general authority, to acquire ordinary shares issued by the
Company, subject to the provisions of the Companies Act (Act 71of 2008), as amended, the Listings Requirements of the
JSE and the articles of association of the Company.
With effect from 1 July 2011, the remuneration payable to non-executive directors applicable for a period of 12 months was
approved.
In accordance with section 45 of the Companies Act, the provision of any financial assistance by the Company to any company
or corporation which is related or inter-related to the Company (as defined in the Companies Act), on the terms and conditions
which the directors of Mustek may determine, was approved.
Post statement of financial position events
The directors of the Company propose a final dividend of 17 cents per share to all shareholders. There have been no other
significant events subsequent to year-end up until the date of this report that require adjustment to or disclosure in these annual
financial statements.
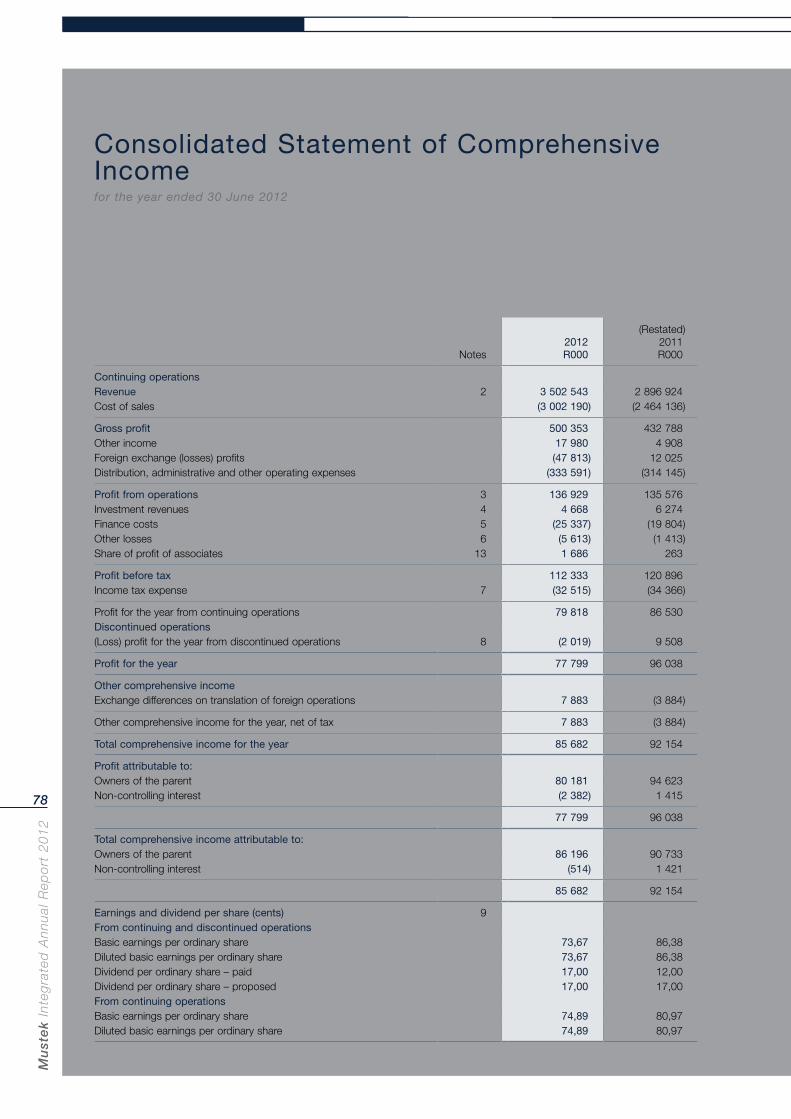
Mu
ste
k In
teg
rate
d A
nn
ual
Rep
ort
20
12
78
Consolidated Statement of Comprehensive Incomefor the year ended 30 June 2012
Notes2012R000
(Restated)2011R000
Continuing operationsRevenue 2 3 502 543 2 896 924 Cost of sales (3 002 190) (2 464 136)
Gross profit 500 353 432 788 Other income 17 980 4 908 Foreign exchange (losses) profits (47 813) 12 025 Distribution, administrative and other operating expenses (333 591) (314 145)
Profit from operations 3 136 929 135 576 Investment revenues 4 4 668 6 274 Finance costs 5 (25 337) (19 804)Other losses 6 (5 613) (1 413)Share of profit of associates 13 1 686 263
Profit before tax 112 333 120 896 Income tax expense 7 (32 515) (34 366)
Profit for the year from continuing operations 79 818 86 530 Discontinued operations(Loss) profit for the year from discontinued operations 8 (2 019) 9 508
Profit for the year 77 799 96 038
Other comprehensive incomeExchange differences on translation of foreign operations 7 883 (3 884)
Other comprehensive income for the year, net of tax 7 883 (3 884)
Total comprehensive income for the year 85 682 92 154
Profit attributable to:Owners of the parent 80 181 94 623Non-controlling interest (2 382) 1 415
77 799 96 038
Total comprehensive income attributable to:Owners of the parent 86 196 90 733Non-controlling interest (514) 1 421
85 682 92 154
Earnings and dividend per share (cents) 9From continuing and discontinued operationsBasic earnings per ordinary share 73,67 86,38Diluted basic earnings per ordinary share 73,67 86,38Dividend per ordinary share – paid 17,00 12,00Dividend per ordinary share – proposed 17,00 17,00From continuing operationsBasic earnings per ordinary share 74,89 80,97Diluted basic earnings per ordinary share 74,89 80,97
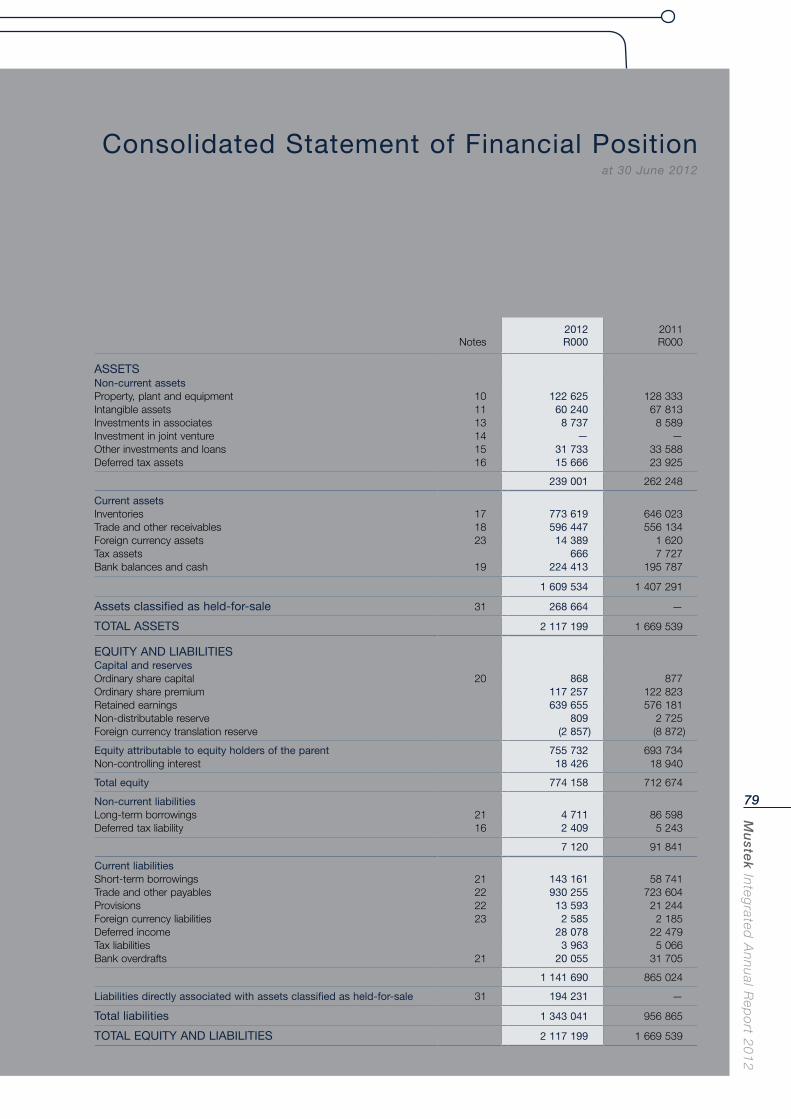
Mu
stek In
tegrated
An
nu
al Rep
ort 2
01
2
79
Consolidated Statement of Financial Position at 30 June 2012
Notes2012 R000
2011R000
ASSETSNon-current assetsProperty, plant and equipment 10 122 625 128 333Intangible assets 11 60 240 67 813Investments in associates 13 8 737 8 589Investment in joint venture 14 — —Other investments and loans 15 31 733 33 588Deferred tax assets 16 15 666 23 925
239 001 262 248
Current assetsInventories 17 773 619 646 023Trade and other receivables 18 596 447 556 134Foreign currency assets 23 14 389 1 620Tax assets 666 7 727Bank balances and cash 19 224 413 195 787
1 609 534 1 407 291
Assets classified as held-for-sale 31 268 664 —
TOTAL ASSETS 2 117 199 1 669 539
EQUITY AND LIABILITIESCapital and reservesOrdinary share capital 20 868 877Ordinary share premium 117 257 122 823Retained earnings 639 655 576 181Non-distributable reserve 809 2 725Foreign currency translation reserve (2 857) (8 872)
Equity attributable to equity holders of the parent 755 732 693 734Non-controlling interest 18 426 18 940
Total equity 774 158 712 674
Non-current liabilitiesLong-term borrowings 21 4 711 86 598Deferred tax liability 16 2 409 5 243
7 120 91 841
Current liabilitiesShort-term borrowings 21 143 161 58 741Trade and other payables 22 930 255 723 604Provisions 22 13 593 21 244Foreign currency liabilities 23 2 585 2 185Deferred income 28 078 22 479Tax liabilities 3 963 5 066Bank overdrafts 21 20 055 31 705
1 141 690 865 024
Liabilities directly associated with assets classified as held-for-sale 31 194 231 —
Total liabilities 1 343 041 956 865
TOTAL EQUITY AND LIABILITIES 2 117 199 1 669 539
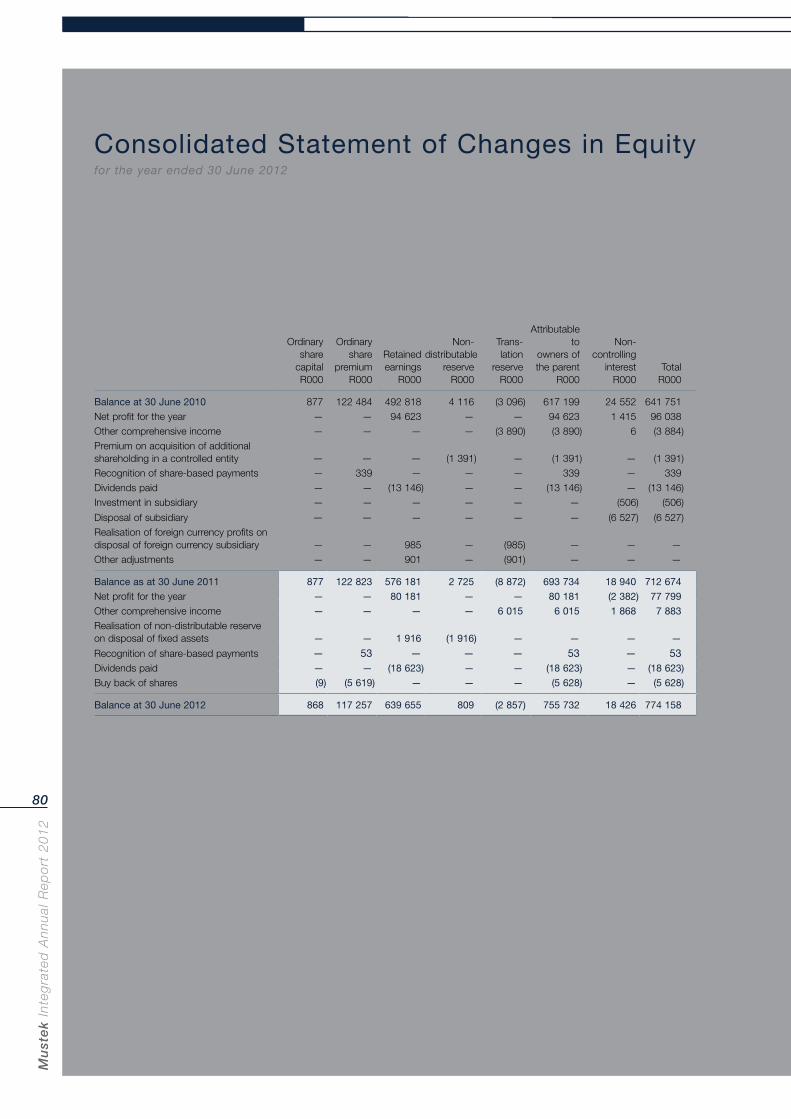
Mu
ste
k In
teg
rate
d A
nn
ual
Rep
ort
20
12
80
Consolidated Statement of Changes in Equity for the year ended 30 June 2012
Ordinaryshare
capitalR000
Ordinaryshare
premiumR000
Retainedearnings
R000
Non-distributable
reserveR000
Trans-lation
reserveR000
Attributableto
owners ofthe parent
R000
Non-controlling
interestR000
TotalR000
Balance at 30 June 2010 877 122 484 492 818 4 116 (3 096) 617 199 24 552 641 751Net profit for the year — — 94 623 — — 94 623 1 415 96 038Other comprehensive income — — — — (3 890) (3 890) 6 (3 884)Premium on acquisition of additional shareholding in a controlled entity — — — (1 391) — (1 391) — (1 391)Recognition of share-based payments — 339 — — — 339 — 339Dividends paid — — (13 146) — — (13 146) — (13 146)Investment in subsidiary — — — — — — (506) (506)
Disposal of subsidiary — — — — — — (6 527) (6 527)Realisation of foreign currency profits on disposal of foreign currency subsidiary — — 985 — (985) — — —Other adjustments — — 901 — (901) — — —
Balance as at 30 June 2011 877 122 823 576 181 2 725 (8 872) 693 734 18 940 712 674
Net profit for the year — — 80 181 — — 80 181 (2 382) 77 799
Other comprehensive income — — — — 6 015 6 015 1 868 7 883
Realisation of non-distributable reserve on disposal of fixed assets — — 1 916 (1 916) — — — —
Recognition of share-based payments — 53 — — — 53 — 53Dividends paid — — (18 623) — — (18 623) — (18 623)
Buy back of shares (9) (5 619) — — — (5 628) — (5 628)
Balance at 30 June 2012 868 117 257 639 655 809 (2 857) 755 732 18 426 774 158
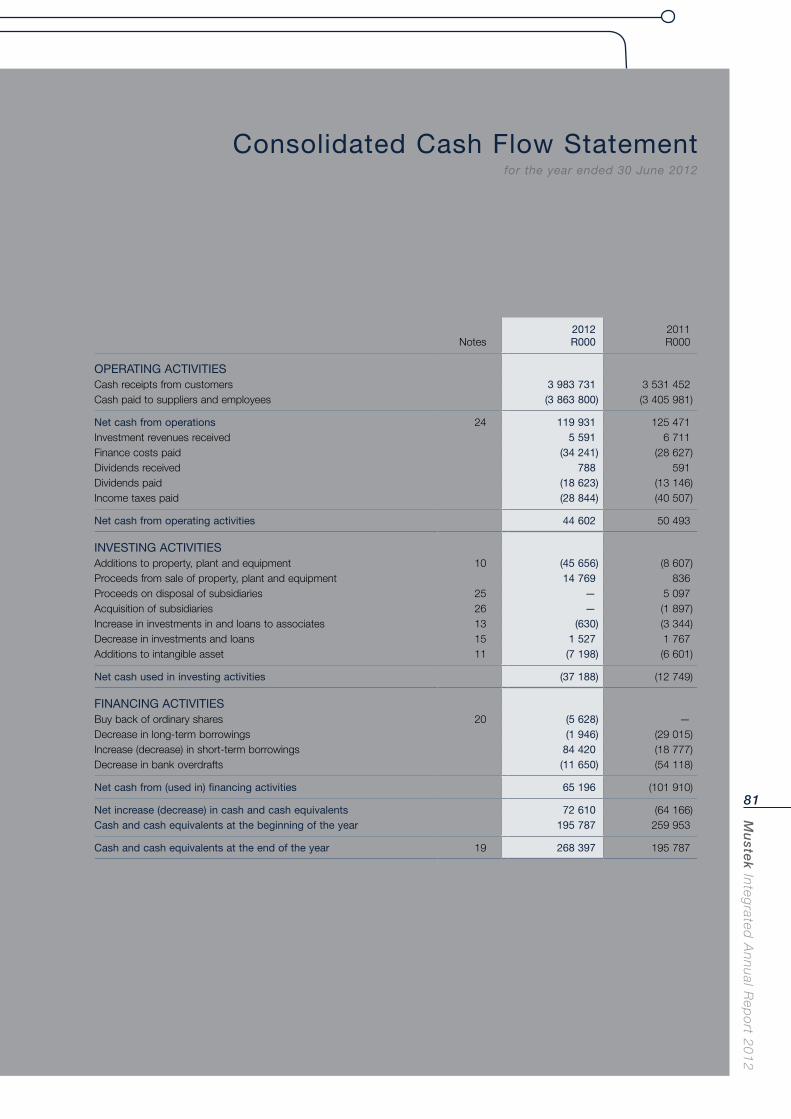
Mu
stek In
tegrated
An
nu
al Rep
ort 2
01
2
81
Consolidated Cash Flow Statementfor the year ended 30 June 2012
Notes2012R000
2011R000
OPERATING ACTIVITIESCash receipts from customers 3 983 731 3 531 452Cash paid to suppliers and employees (3 863 800) (3 405 981)
Net cash from operations 24 119 931 125 471Investment revenues received 5 591 6 711Finance costs paid (34 241) (28 627)Dividends received 788 591Dividends paid (18 623) (13 146)Income taxes paid (28 844) (40 507)
Net cash from operating activities 44 602 50 493
INVESTING ACTIVITIESAdditions to property, plant and equipment 10 (45 656) (8 607)Proceeds from sale of property, plant and equipment 14 769 836Proceeds on disposal of subsidiaries 25 — 5 097Acquisition of subsidiaries 26 — (1 897)Increase in investments in and loans to associates 13 (630) (3 344)Decrease in investments and loans 15 1 527 1 767Additions to intangible asset 11 (7 198) (6 601)
Net cash used in investing activities (37 188) (12 749)
FINANCING ACTIVITIESBuy back of ordinary shares 20 (5 628) —Decrease in long-term borrowings (1 946) (29 015)Increase (decrease) in short-term borrowings 84 420 (18 777)Decrease in bank overdrafts (11 650) (54 118)
Net cash from (used in) financing activities 65 196 (101 910)
Net increase (decrease) in cash and cash equivalents 72 610 (64 166)Cash and cash equivalents at the beginning of the year 195 787 259 953
Cash and cash equivalents at the end of the year 19 268 397 195 787
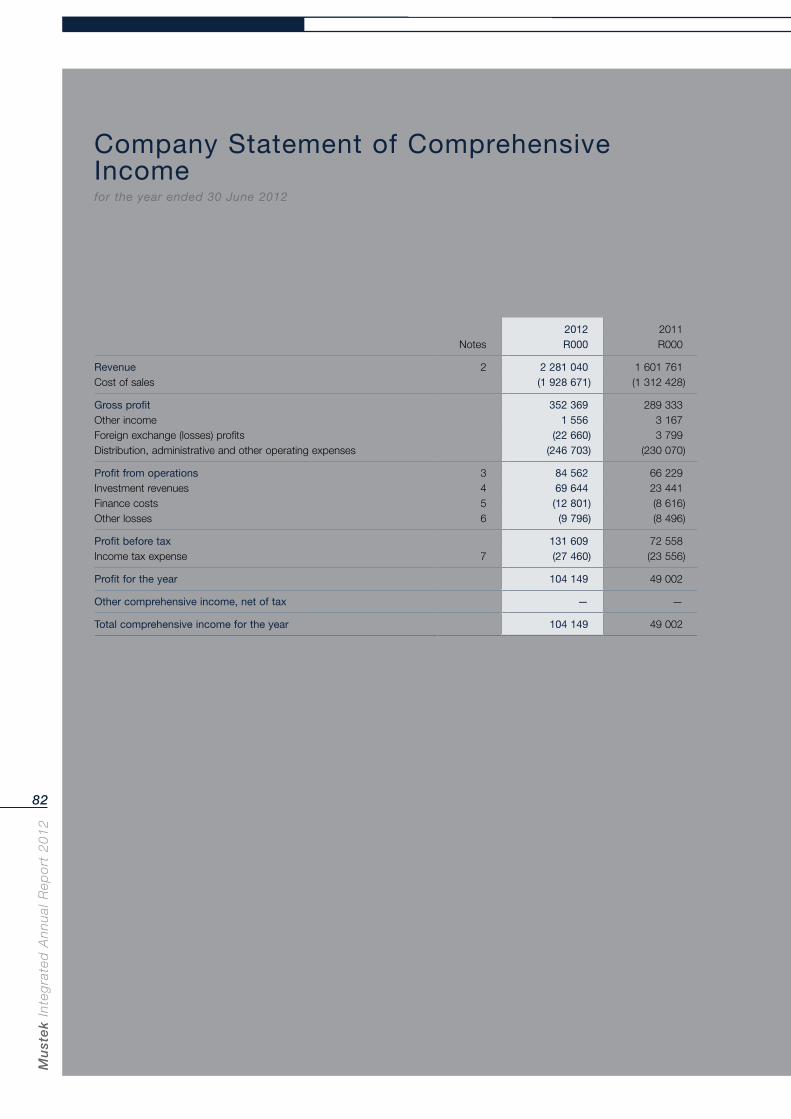
Mu
ste
k In
teg
rate
d A
nn
ual
Rep
ort
20
12
82
Company Statement of Comprehensive Incomefor the year ended 30 June 2012
2012 2011 Notes R000 R000
Revenue 2 2 281 040 1 601 761Cost of sales (1 928 671) (1 312 428)
Gross profit 352 369 289 333Other income 1 556 3 167Foreign exchange (losses) profits (22 660) 3 799Distribution, administrative and other operating expenses (246 703) (230 070)
Profit from operations 3 84 562 66 229Investment revenues 4 69 644 23 441Finance costs 5 (12 801) (8 616)Other losses 6 (9 796) (8 496)
Profit before tax 131 609 72 558Income tax expense 7 (27 460) (23 556)
Profit for the year 104 149 49 002
Other comprehensive income, net of tax — —
Total comprehensive income for the year 104 149 49 002
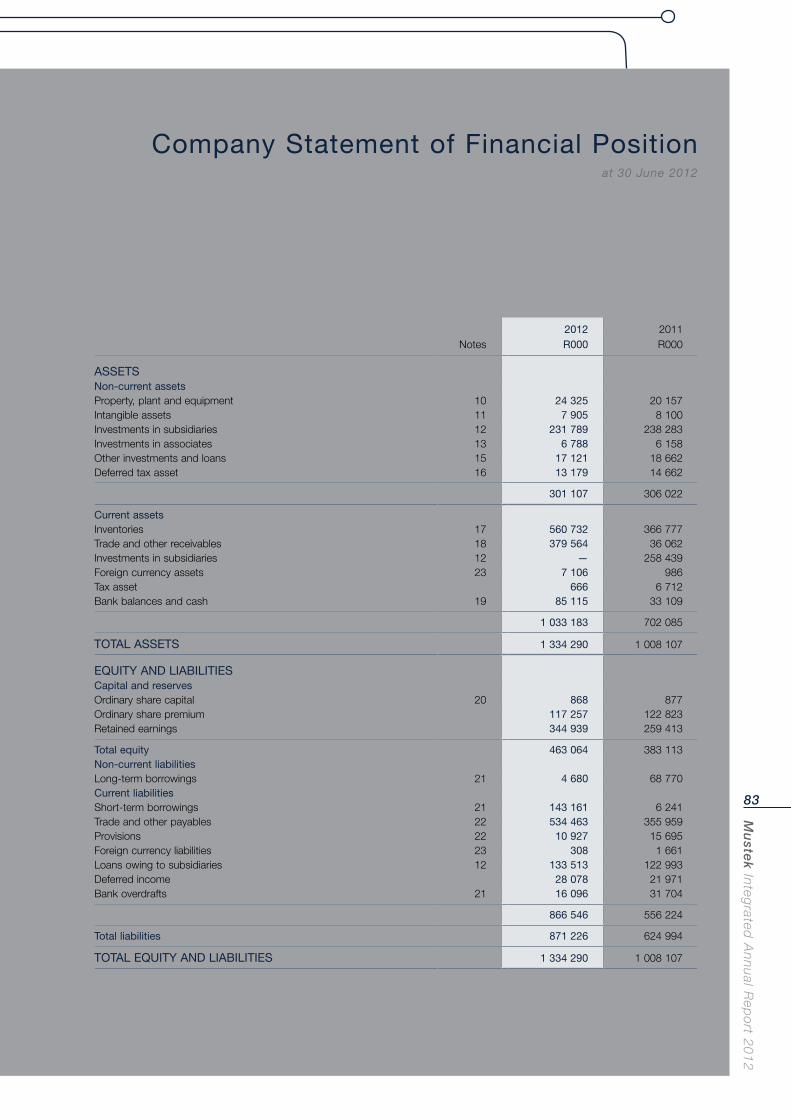
Mu
stek In
tegrated
An
nu
al Rep
ort 2
01
2
83
Company Statement of Financial Positionat 30 June 2012
2012 2011 Notes R000 R000
ASSETSNon-current assetsProperty, plant and equipment 10 24 325 20 157Intangible assets 11 7 905 8 100Investments in subsidiaries 12 231 789 238 283Investments in associates 13 6 788 6 158Other investments and loans 15 17 121 18 662Deferred tax asset 16 13 179 14 662
301 107 306 022
Current assets Inventories 17 560 732 366 777Trade and other receivables 18 379 564 36 062Investments in subsidiaries 12 — 258 439Foreign currency assets 23 7 106 986Tax asset 666 6 712Bank balances and cash 19 85 115 33 109
1 033 183 702 085
TOTAL ASSETS 1 334 290 1 008 107
EQUITY AND LIABILITIESCapital and reservesOrdinary share capital 20 868 877Ordinary share premium 117 257 122 823Retained earnings 344 939 259 413
Total equity 463 064 383 113Non-current liabilitiesLong-term borrowings 21 4 680 68 770Current liabilitiesShort-term borrowings 21 143 161 6 241Trade and other payables 22 534 463 355 959Provisions 22 10 927 15 695Foreign currency liabilities 23 308 1 661Loans owing to subsidiaries 12 133 513 122 993Deferred income 28 078 21 971Bank overdrafts 21 16 096 31 704
866 546 556 224
Total liabilities 871 226 624 994
TOTAL EQUITY AND LIABILITIES 1 334 290 1 008 107
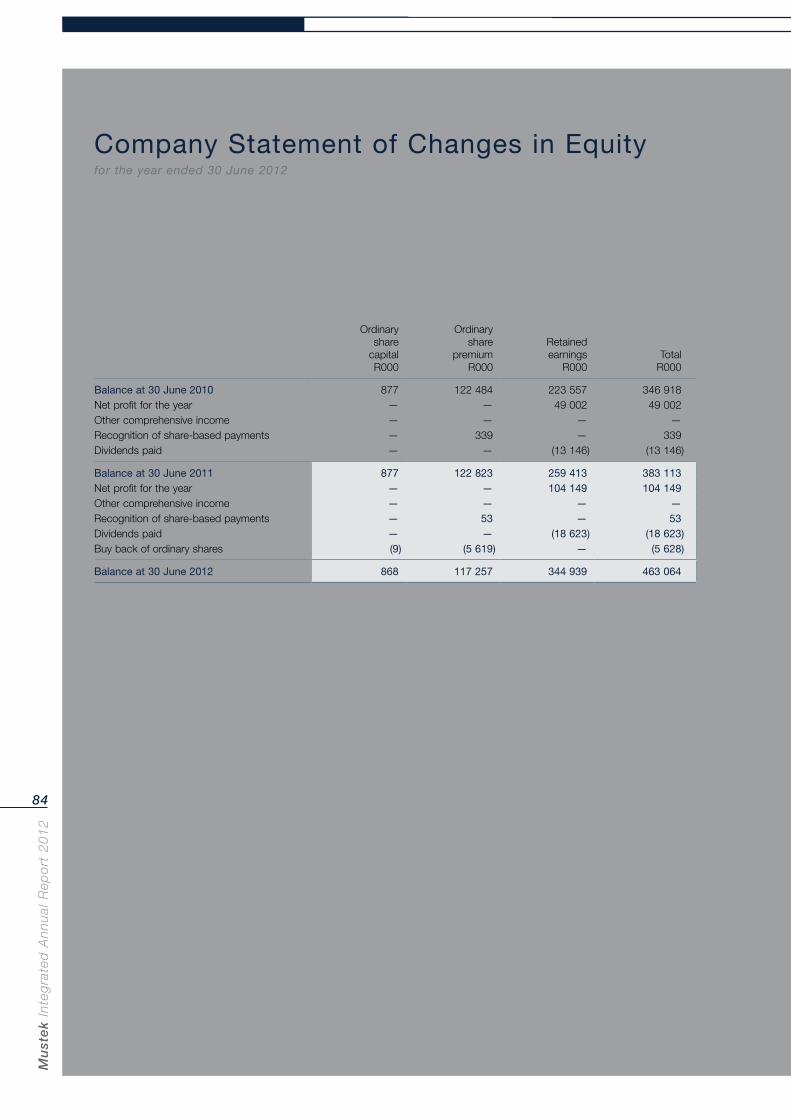
Mu
ste
k In
teg
rate
d A
nn
ual
Rep
ort
20
12
84
Company Statement of Changes in Equityfor the year ended 30 June 2012
Ordinaryshare
capitalR000
Ordinaryshare
premiumR000
Retainedearnings
R000Total
R000
Balance at 30 June 2010 877 122 484 223 557 346 918Net profit for the year — — 49 002 49 002Other comprehensive income — — — —Recognition of share-based payments — 339 — 339Dividends paid — — (13 146) (13 146)
Balance at 30 June 2011 877 122 823 259 413 383 113Net profit for the year — — 104 149 104 149Other comprehensive income — — — —Recognition of share-based payments — 53 — 53Dividends paid — — (18 623) (18 623)Buy back of ordinary shares (9) (5 619) — (5 628)
Balance at 30 June 2012 868 117 257 344 939 463 064
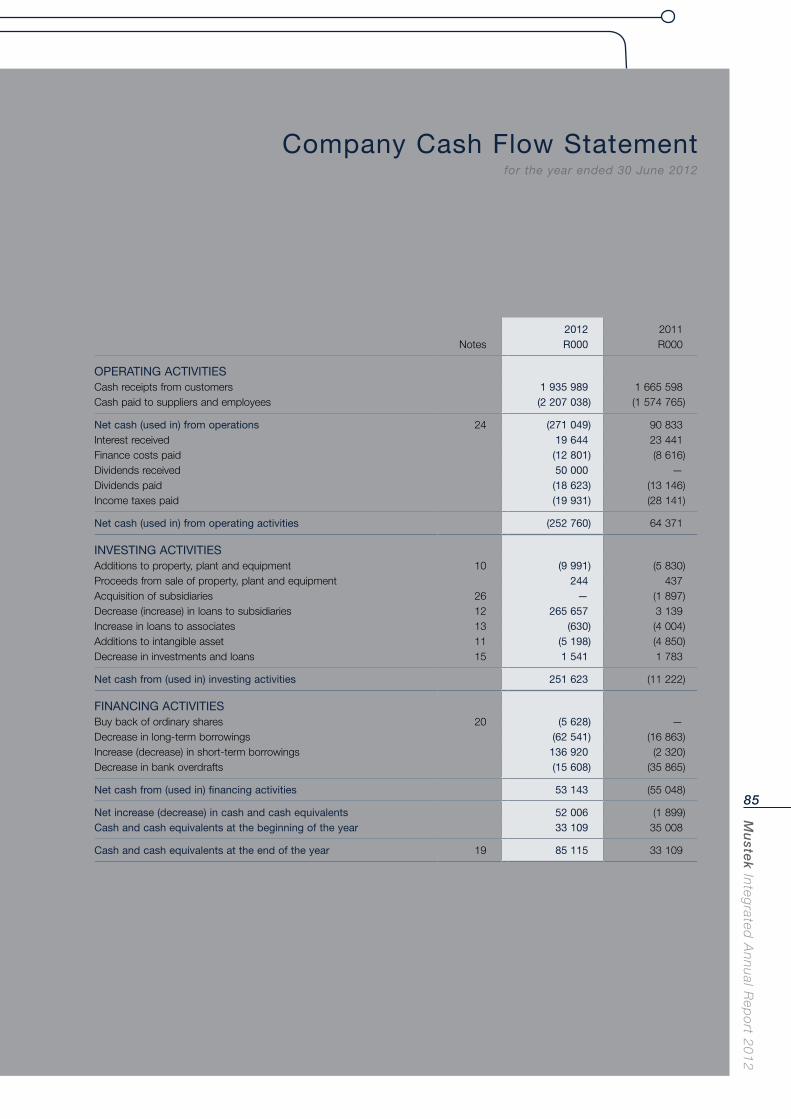
Mu
stek In
tegrated
An
nu
al Rep
ort 2
01
2
85
Company Cash Flow Statementfor the year ended 30 June 2012
2012 2011 Notes R000 R000
OPERATING ACTIVITIESCash receipts from customers 1 935 989 1 665 598Cash paid to suppliers and employees (2 207 038) (1 574 765)
Net cash (used in) from operations 24 (271 049) 90 833Interest received 19 644 23 441Finance costs paid (12 801) (8 616)Dividends received 50 000 —Dividends paid (18 623) (13 146)Income taxes paid (19 931) (28 141)
Net cash (used in) from operating activities (252 760) 64 371
INVESTING ACTIVITIESAdditions to property, plant and equipment 10 (9 991) (5 830)Proceeds from sale of property, plant and equipment 244 437Acquisition of subsidiaries 26 — (1 897)Decrease (increase) in loans to subsidiaries 12 265 657 3 139Increase in loans to associates 13 (630) (4 004)Additions to intangible asset 11 (5 198) (4 850)Decrease in investments and loans 15 1 541 1 783
Net cash from (used in) investing activities 251 623 (11 222)
FINANCING ACTIVITIESBuy back of ordinary shares 20 (5 628) —Decrease in long-term borrowings (62 541) (16 863)Increase (decrease) in short-term borrowings 136 920 (2 320)Decrease in bank overdrafts (15 608) (35 865)
Net cash from (used in) financing activities 53 143 (55 048)
Net increase (decrease) in cash and cash equivalents 52 006 (1 899)Cash and cash equivalents at the beginning of the year 33 109 35 008
Cash and cash equivalents at the end of the year 19 85 115 33 109
Mu
ste
k In
teg
rate
d A
nn
ual
Rep
ort
20
12
86
Accounting Policiesfor the year ended 30 June 2012
The financial statements have been prepared in accordance
with International Financial Reporting Standards (IFRSs) and
the manner required by the Companies Act of South Africa.
The financial statements have been prepared on the historical
cost basis except for the revaluation of certain non-current
assets and financial instruments. The principal accounting
policies are set out below, and are presented in South African
Rand. These are consistent with the policies applied in the
preparation of the annual financial statements for the financial
year ended 30 June 2011.
Adoption of new and revised International Financial Reporting Standards and Interpretations
No new Standards and Interpretations were adopted in the
current financial year.
The following Standards and Interpretations are also effective
for the current period, but had no material impact on
accounting policies, transactions, balances or disclosures:
IFRS 1 First-time Adoption of International Financial
Reporting Standards – Amendments to Severe
Hyperinflation and Removal of Fixed Dates for
First-time Adopters effective for annual periods
beginning on or after 1 July 2011
IFRS 1 First-time Adoption of International Financial
Reporting Standards – Amendments as a result of
the IASB’s 2008-2010 cycle of annual
improvements effective for annual reporting
periods beginning on or after 1 January 2011
IFRS 1 Severe Hyperinflation and Removal of Fixed dates
for first-time Adopters, effective for annual periods
beginning on or after 1 July 2011
IFRS 1 Limited Exemption from Comparative IFRS 7
Disclosures for First-time Adopters, effective for
annual periods beginning on or after 1 July 2010
IFRS 1 First-time Adoption of International Financial
Reporting Standards – Amendments relating to oil
and gas assets and determining whether an
arrangement contains a lease effective for annual
periods beginning on or after 1 January 2010
IFRS 1 First-time Adoption of International Financial
Reporting Standards – Amendment relating to
cost of an investment on first-time adoption
effective for annual periods beginning on or after
1 January 2009
IFRS 2 Share-based Payment – Amendments relating to
group cash-settled share-based payment
transactions effective for annual periods beginning
on or after 1 January 2010
IFRS 2 Share-based Payment – Amendment relating to
vesting conditions and cancellations effective for
annual periods beginning on or after 1 January
2009
IFRS 2 Share-based Payment – Amendments resulting
from April 2009 Annual Improvements to IFRSs
effective for annual periods beginning on or after
1 July 2009
IFRS 3/ Clarification of transition requirements,
IAS 27 measurement of non-controlling interests,
unreplaced and voluntarily replaced share-based
payment awards – Amendments as a result of the
IASB’s 2008-2010 cycle of annual improvements
effective for annual reporting periods beginning on
or after 1 July 2010
IFRS 3 Business Combinations – Comprehensive revision
on applying the acquisition method effective for
annual periods beginning on or after 1 July 2009
IFRS 5 Non-current Assets Held for Sale and
Discontinued Operations – Amendments resulting
from April 2009 Annual Improvements to IFRSs
effective for annual periods beginning on or after
1 January 2010
IFRS 5 Non-current Assets Held for Sale and
Discontinued Operations – Amendments resulting
from May 2008 Annual Improvements to IFRSs
effective for annual periods beginning on or after
1 July 2009
IFRS 7 Financial Instruments: Disclosures – Amendments
to disclosures resulting from the IASB’s
comprehensive review of off balance sheet
activities effective for annual periods beginning on
or after 1 July 2011
IFRS 7 Financial Instruments: Disclosures – Amendments
as a result of the IASB’s 2008-2010 cycle of
annual improvements effective for annual reporting
periods beginning on or after 1 January 2011
IFRS 7 Financial Instruments: Disclosures – Transfers of
Financial Assets, effective for annual periods
beginning on or after 1 July 2011
Mu
stek In
tegrated
An
nu
al Rep
ort 2
01
2
87
IFRS 8 Operating Segments – Amendments resulting
from April 2009 Annual Improvements to IFRSs
effective for annual periods beginning on or after
1 January 2010
IAS 1 Presentation of Financial Statements –
Amendments resulting from April 2009 Annual
Improvements to IFRSs effective for annual
periods beginning on or after 1 January 2010
IAS 1 Presentation of Financial Statements –
Amendments to revise the way other
comprehensive income is presented effective for
annual reporting periods beginning on or after
1 July 2012
IAS 1 Financial statement disclosures – Amendments as
a result of the IASB’s 2008-2010 cycle of annual
improvements effective for annual reporting
periods beginning on or after 1 January 2011
IAS 1 Presentation of Financial Statements –
Amendments relating to disclosure of puttable
instruments and obligations arising on liquidation
effective for annual periods beginning on or after
1 January 2009
IAS 1 Presentation of Financial Statements –
Amendments resulting from May 2008 Annual
Improvements to IFRSs effective for annual
periods beginning on or after 1 January 2009
IAS 7 Statement of Cash Flows – Amendments resulting
from April 2009 Annual Improvements to IFRSs
effective for annual periods beginning on or after
1 January 2010
IAS 16 Property, Plant and Equipment – Amendments
resulting from May 2008 Annual Improvements to
IFRSs effective for annual periods beginning on or
after 1 January 2009
IAS 17 Leases – Amendments resulting from April 2009
Annual Improvements to IFRSs effective for annual
periods beginning on or after 1 January 2010
IAS 19 Employee Benefits – Amendments resulting from
May 2008 Annual Improvements to IFRSs
effective for annual periods beginning on or after
1 January 2009
IAS 20 Government Grants and Disclosure of Government
Assistance – Amendments resulting from May
2008 Annual Improvements to IFRSs effective
for annual periods beginning on or after
1 January 2009
IAS 23 Borrowing Costs – Amendments resulting from
May 2008 Annual Improvements to IFRSs
effective for annual periods beginning on or after
1 January 2009
IAS 24 Related Party Disclosures (2009) – Amends the
requirements of the previous version of IAS 24
effective for annual periods beginning on or after
1 January 2011
IAS 27 Consolidated and Separate Financial Statements
– Consequential amendments arising from
amendments to IFRS 3 effective for annual periods
beginning on or after 1 July 2009
IAS 27 Consolidated and Separate Financial Statements
– Amendment relating to cost of an investment on
first-time adoption effective for annual periods
beginning on or after 1 January 2009
IAS 27 Consolidated and Separate Financial Statements
– Amendments resulting from May 2008 Annual
Improvements to IFRSs effective for annual
periods beginning on or after 1 January 2009
IAS 28 Investments in Associates – Consequential
amendments arising from amendments to IFRS 3
effective for annual periods beginning on or after
1 July 2009
IAS 28 Investments in Associates – Amendments resulting
from May 2008 Annual Improvements to IFRSs
effective for annual periods beginning on or after
1 January 2009
IAS 29 Financial Reporting in Hyperinflationary Economies
– Amendments resulting from May 2008 Annual
Improvements to IFRSs effective for annual
periods beginning on or after 1 January 2009
IAS 31 Interests in Joint Ventures – Consequential
amendments arising from amendments to IFRS 3
effective for annual periods beginning on or after
1 July 2009
IAS 31 Interests in Joint Ventures – Amendments resulting
from May 2008 Annual Improvements to IFRSs
effective for annual periods beginning on or after
1 January 2009
IAS 32 Financial Instruments: Presentation – Amendments
relating to puttable instruments and obligations
arising on liquidation effective for annual periods
beginning on or after 1 January 2009
IAS 34 Interim Financial Reporting – Amendments as a
result of the IASB’s 2008-2010 cycle of annual
Mu
ste
k In
teg
rate
d A
nn
ual
Rep
ort
20
12
88
Accounting Policies (continued)for the year ended 30 June 2012
improvements effective for annual reporting
periods beginning on or after 1 January 2011
IAS 36 Impairment of Assets – Amendments resulting
from April 2009 Annual Improvements to IFRSs
effective for annual periods beginning on or after
1 January 2010
IAS 36 Impairment of Assets – Amendments resulting
from May 2008 Annual Improvements to IFRSs
effective for annual periods beginning on or after
1 January 2009
IAS 38 Intangible Assets – Amendments resulting from
May 2008 Annual Improvements to IFRSs
effective for annual periods beginning on or after
1 January 2009
IAS 38 Intangible Assets – Amendments resulting from
April 2009 Annual Improvements to IFRSs
effective for annual periods beginning on or after
1 July 2009
IAS 39 Financial Instruments: Recognition and
Measurement – Amendments resulting from
April 2009 Annual Improvements to IFRSs
effective for annual periods beginning on or after
1 January 2010
IAS 39 Financial Instruments: Recognition and
Measurement – Amendments resulting from
May 2008 Annual Improvements to IFRSs
effective for annual periods beginning on or after
1 January 2009
IAS 39 Financial Instruments: Recognition and
Measurement – Amendments for eligible hedged
items effective for annual periods beginning on or
after 1 July 2009
IAS 40 Investment Property – Amendments resulting from
May 2008 Annual Improvements to IFRSs
effective for annual periods beginning on or after
1 January 2009
IAS 41 Agriculture – Amendments resulting from May
2008 Annual Improvements to IFRSs effective
for annual periods beginning on or after
1 January 2009
IFRIC 13 Fair value of award credits – Amendments as a
result of the IASB’s 2008-2010 cycle of annual
improvements effective for annual reporting
periods beginning on or after 1 January 2011
IFRIC 14/ The Limit on a Defined Benefit Asset, Minimum
IAS 19 Funding Requirements and their Interaction
– Limited-application amendments effective for
annual periods beginning on or after 1 January
2011 (applied retrospectively from the beginning of
the earliest comparative period presented)
IFRIC 15 Agreements for the Construction of Real Estate
effective for annual periods beginning on or after
1 January 2009
IFRIC 16 Hedges of a Net Investment in a Foreign
Operation effective for annual periods beginning
on or after 1 October 2008
IFRIC 17 Distributions of Non-cash Assets to Owners
effective for annual periods beginning on or after
1 July 2009
IFRIC 18 Transfers of Assets from Customers effective for
transfers received on or after 1 July 2009
At the date of authorisation of these financial statements, the
following Standards and Interpretations were in issue but not
yet effective:
IFRS 1 First-time Adoption of International Financial
Reporting Standards – Amendments due to
Annual Improvements 2009-2011 Cycle effective
for annual periods beginning on or after 1 January
2013
IFRS 1 First-time Adoption of International Financial
Reporting Standards – Amendments to
Government Loans effective for annual periods
beginning on or after 1 January 2013
IFRS 1 First-time Adoption of International Financial
Reporting Standards – Amendments to Severe
Hyperinflation and Removal of Fixed Dates for
First-time Adopters effective for annual periods
beginning on or after 1 January 2012
IFRS 7 Financial Instruments: Disclosures – Amendments
to Offsetting Financial Assets and Financial
Liabilities effective for annual periods beginning on
or after 1 January 2013 and interim periods within
those periods
IFRS 9 Financial Instruments, effective for annual periods
beginning on or after 1 January 2013.
IFRS 9 Financial Instruments (2010) – A revised version of
IFRS 9 incorporating revised requirements for the
classification and measurement of financial
Mu
stek In
tegrated
An
nu
al Rep
ort 2
01
2
89
liabilities, and carrying over the existing
derecognition requirements from IAS 39 Financial
Instruments: Recognition and Measurement
effective for annual periods beginning on or after
1 January 2015
IFRS 9 Financial Instruments (2009) – Introduces new
requirements for classifying and measuring
financial assets effective on a modified
retrospective basis to annual periods beginning
on or after 1 January 2015
IFRS 10 Consolidated Financial Statements – Amendments
due to Transition Guidance effective for annual
periods beginning on or after 1 January 2013
IFRS 10 Consolidated Financial Statements – Requires a
parent to present consolidated financial
statements as those of a single economic entity,
replacing the requirements previously contained in
IAS 27 Consolidated and Separate Financial
Statements and SIC-12 Consolidation – Special
Purpose Entities effective for annual reporting
periods beginning on or after 1 January 2013
IFRS 11 Joint Arrangements – Amendments due to
Transition Guidance effective for annual periods
beginning on or after 1 January 2013
IFRS 11 Joint Arrangements – Replaces IAS 31 Interests in
Joint Ventures effective for annual reporting
periods beginning on or after 1 January 2013
IFRS 12 Disclosure of Interests in Other Entities –
Amendments due to Transition Guidance
effective for annual periods beginning on or after
1 January 2013
IFRS 12 Disclosure of Interests in Other Entities – Requires
the extensive disclosure of information that
enables users of financial statements to evaluate
the nature of, and risks associated with, interests
in other entities and the effects of those interests
on its financial position, financial performance and
cash flows effective for annual reporting periods
beginning on or after 1 January 2013
IFRS 13 Fair Value Measurement – Replaces the guidance
on fair value measurement in existing IFRS
accounting literature with a single standard
effective for annual reporting periods beginning on
or after 1 January 2013
IAS 1 Presentation of Financial Statements –
Amendments due to Annual Improvements
2009-2011 Cycle effective for annual periods
beginning on or after 1 January 2013
IAS 12 Income Taxes – Amendments effective for annual
periods beginning on or after 1 January 2012
IAS 12 Deferred Tax – Recovery of Underlying Assets,
effective for annual periods beginning on or after
1 January 2012
IAS 16 Property, Plant and Equipment – Amendments
due to Annual Improvements 2009-2011 Cycle
effective for annual periods beginning on or after
1 January 2013
IAS 19 Employee Benefits – Amendments effective for
annual reporting periods beginning on or after
1 January 2013
IAS 27 Separate Financial Statements (2011) – Amended
version of IAS 27 which now only deals with the
requirements for separate financial statements
effective for annual reporting periods beginning on
or after 1 January 2013
IAS 28 Investments in Associates and Joint Ventures
(2011) – This Standard supersedes IAS 28
Investments in Associates and prescribes the
accounting for investments in associates and sets
out the requirements for the application of the
equity method when accounting for investments
in associates and joint ventures effective for
annual reporting periods beginning on or after
1 January 2013
IAS 32 Financial Instruments: Presentation – Amendments
due to Annual Improvements 2009-2011 Cycle
effective for annual periods beginning on or after
1 January 2013
IAS 32 Financial Instruments: Presentation – Amendments
to Offsetting Financial Assets and Financial
Liabilities effective for annual periods beginning on
or after 1 January 2014
IAS 34 Interim Financial Reporting – Amendments due
to Annual Improvements 2009-2011 Cycle
effective for annual periods beginning on or after
1 January 2013
Mu
ste
k In
teg
rate
d A
nn
ual
Rep
ort
20
12
90
Accounting Policies (continued)for the year ended 30 June 2012
The directors anticipate that all of the above Standards and
Interpretations will be adopted in the Group and Company’s
financial statements for the periods commencing after 1 July
2012 and that the adoption of those Interpretations will have
no material impact on the financial statements of the Group
and Company in the period of initial application.
Basis of consolidation
The consolidated financial statements incorporate the
financial statements of the Company and entities (including
special purpose entities) controlled by the Company (its
subsidiaries). Control is achieved where the Company has
the power to govern the financial and operating policies of an
entity so as to obtain benefits from its activities.
The results of subsidiaries acquired or disposed of during the
year are included in the consolidated statement of
comprehensive income from the effective date of acquisition
or up to the effective date of disposal, as appropriate.
Where necessary, adjustments are made to the financial
statements of subsidiaries to bring their accounting policies
into line with those used by other members of the Group. All
intra-group transactions, balances, income and expenses are
eliminated on consolidation.
Non-controlling interests in the net assets of consolidated
subsidiaries are identified separately from the Group’s equity
therein. Non-controlling interests consist of the amount of
those interests at the date of the original business
combination (see below) and the non-controlling
shareholder’s share of changes in equity since the date of the
combination. Losses applicable to the non-controlling
shareholder in excess of the non-controlling shareholder’s
interest in the subsidiary’s equity are allocated against the
interests of the Group except to the extent that the non-
controlling shareholder has a binding obligation and is able
to make an additional investment to cover the losses.
Business combinations
The acquisition of subsidiaries and businesses is accounted
for using the acquisition method. The consideration of the
acquisition is measured at the aggregate of the fair values, at
the date of exchange, of assets given, liabilities incurred or
assumed, and equity instruments issued by the Group in
exchange for control of the acquiree, plus any costs directly
attributable to the business combination. The acquiree’s
identifiable assets, liabilities and contingent liabilities that
meet the conditions for recognition under IFRS 3 are
recognised at their fair values at the acquisition date, except
for non-current assets (or disposal groups) that are classified
as held for sale in accordance with IFRS 5 – Non-Current
Assets Held for Sale and Discontinued Operations, which are
recognised and measured at fair value less costs to sell.
Goodwill arising on acquisition is recognised as an asset and
initially measured at cost, being the excess of the cost of the
business combination over the Group’s interest in the net fair
value of the identifiable assets, liabilities and contingent
liabilities recognised. If, after reassessment, the Group’s
interest in the net fair value of the acquiree’s identifiable
assets, liabilities and contingent liabilities exceeds the cost of
the business combination, the excess is recognised
immediately in profit or loss.
The interest of non-controlling shareholders in the acquiree is
initially measured at the non-controlling shareholder’s
proportion of the net fair value of the assets, liabilities and
contingent liabilities recognised.
Investments in associates
An associate is an entity over which the Group has significant
influence and that is neither a subsidiary nor an interest in a
joint venture. Significant influence is the power to participate
in the financial and operating policy decisions of the investee
but is not control or joint control over those policies.
The results and assets and liabilities of associates are
incorporated in these financial statements using the equity
method of accounting, except when the investment is
classified as held for sale, in which case it is accounted for
under IFRS 5 – Non-current Assets Held for Sale and
Discontinued Operations. Under the equity method,
investments in associates are carried in the consolidated
statement of financial position at cost as adjusted for
post-acquisition changes in the Group’s share of the net
assets of the associate, less any impairment in the value of
individual investments. Losses of an associate in excess of
the Group’s interest in that associate (which includes any
long-term interests that, in substance, form part of the
Group’s net investment in the associate) are not recognised.
Any excess of the cost of acquisition over the Group’s share
of the net fair value of the identifiable assets, liabilities and
contingent liabilities of the associate recognised at the date
of acquisition is recognised as goodwill. The goodwill is
included within the carrying amount of the investment and
is assessed for impairment as part of the investment.
Any excess of the Group’s share of the net fair value of the
Mu
stek In
tegrated
An
nu
al Rep
ort 2
01
2
91
identifiable assets, liabilities and contingent liabilities over
the cost of acquisition, after reassessment, is recognised
immediately in profit or loss.
Where a Group entity transacts with an associate of the
Group, profits and losses are eliminated to the extent of the
Group’s interest in the relevant associate.
Interests in joint ventures
Joint venture arrangements that involve the establishment of
a separate entity in which each venturer has an interest, are
referred to as jointly controlled entities. The Group reports its
interests in jointly controlled entities using proportionate
consolidation, except when the investment is classified as
held for sale, in which case it is accounted for in accordance
with IFRS 5 – Non-current Assets Held for Sale and
Discontinued Operations. The Group’s share of the assets,
liabilities, income and expenses of jointly controlled entities
is combined with the equivalent items in the consolidated
financial statements on a line-by-line basis.
Any goodwill arising on the acquisition of the Group’s interest
in a jointly controlled entity is accounted for in accordance
with the Group’s accounting policy for goodwill arising on the
acquisition of a subsidiary (see below).
Where the Group transacts with its jointly controlled entities,
unrealised profits and losses are eliminated to the extent of
the Group’s interest in the joint venture.
Goodwill
Goodwill arising on the acquisition of a subsidiary or a jointly
controlled entity represents the excess of the cost of
acquisition over the Group’s interest in the net fair value of
the identifiable assets, liabilities and contingent liabilities of
the subsidiary or jointly controlled entity recognised at the
date of acquisition. Goodwill is initially recognised as an asset
at cost and is subsequently measured at cost less any
accumulated impairment losses.
For the purpose of impairment testing, goodwill is allocated
to each of the Group’s cash-generating units expected to
benefit from the synergies of the combination. Cash-
generating units to which goodwill has been allocated are
tested for impairment annually, or more frequently when there
is an indication that the unit may be impaired. If the
recoverable amount of the cash-generating unit is less than
the carrying amount of the unit, the impairment loss is
allocated first to reduce the carrying amount of any goodwill
allocated to the unit and then to the other assets of the unit
pro rata on the basis of the carrying amount of each asset in
the unit. An impairment loss recognised for goodwill is not
reversed in a subsequent period.
On disposal of a subsidiary or a jointly controlled entity, the
attributable amount of goodwill is included in the
determination of the profit or loss on disposal.
The Group’s policy for goodwill arising on the acquisition of
an associate is described under ‘Investments in associates’
above.
Non-current assets held for sale
Non-current assets and disposal groups are classified as
held for sale if their carrying amount will be recovered
principally through a sale transaction rather than through
continuing use. This condition is regarded as met only when
the sale is highly probable and the asset (or disposal group)
is available for immediate sale in its present condition.
Management must be committed to the sale, which should
be expected to qualify for recognition as a completed sale
within one year from the date of classification.
Non-current assets (and disposal groups) classified as held
for sale are measured at the lower of their previous carrying
amount and fair value less costs to sell.
Revenue recognition
Revenue is measured at the fair value of the consideration
received or receivable and represents amounts receivable for
goods and services provided in the normal course of
business, net of discounts and sales related taxes.
Consolidated revenue excludes sales to Group companies.
Sales of goods
Revenue from the sale of goods is recognised when all the
following conditions are satisfied:
The Group has transferred to the buyer the significant risks
and rewards of ownership of the goods.
The Group retains neither continuing managerial
involvement to the degree usually associated with
ownership nor effective control over the goods sold.
The amount of revenue can be measured reliably.
It is probable that the economic benefits associated with
the transaction will flow to the entity.
The costs incurred or to be incurred in respect of the
transaction can be measured reliably.
Mu
ste
k In
teg
rate
d A
nn
ual
Rep
ort
20
12
92
Accounting Policies (continued)for the year ended 30 June 2012
Revenue for services
Revenue from a contract to provide services is recognised by
reference to the stage of completion of the contract. The
stage of completion of the contract is determined as follows:
Installation fees are recognised by reference to the stage of
completion of the installation, determined as the proportion
of the total time expected to install that has elapsed at
statement of financial position date.
Servicing fees included in the price of the products sold
are recognised by reference to the proportion of the total
cost of providing the service for the product, taking into
account historical trends in the number of services actually
provided on past goods sold.
Revenue from time and material contracts is recognised at
the contractual rates as labour hours are delivered and
direct expenses are incurred.
Deferred revenue represents amounts received for services
not yet rendered.
Dividend and interest revenue
Dividend revenue from investments is recognised when the
shareholders’ rights to receive payment have been
established.
Interest revenue is accrued on a time basis, by reference to
the principal outstanding and at the effective interest rate
applicable, which is the rate that exactly discounts estimated
future cash receipts through the expected life of the financial
asset to that asset’s net carrying amount.
Leasing
Leases are classified as finance leases whenever the terms
of the lease transfer substantially all the risks and rewards of
ownership to the lessee. All other leases are classified as
operating leases.
The Group as lessee
Assets held under finance leases are recognised as assets of
the Group at their fair value at the date of acquisition. The
corresponding liability to the lessor is included in the
statement of financial position as a finance lease obligation.
Lease payments are apportioned between finance charges
and reduction of the lease obligation so as to achieve a
constant rate of interest on the remaining balance of the
liability. Finance charges are charged directly to profit or loss,
unless they are directly attributable to qualifying assets, in
which case they are capitalised in accordance with the
Group’s general policy on borrowing costs. Contingent
rentals are recognised as expenses in the periods in which
they are incurred.
Operating lease payments are recognised as an expense on
a straight-line basis over the lease term, except where
another systematic basis is more representative of the time
pattern in which economic benefits from the leased asset are
consumed. Contingent rentals arising under operating leases
are recognised as an expense in the period in which they are
incurred.
In the event that lease incentives are received to enter into
operating leases, such incentives are recognised as a liability.
The aggregate benefit of incentives is recognised as a
reduction of rental expense on a straight-line basis, except
where another systematic basis is more representative of the
time pattern in which economic benefits from the leased
asset are consumed.
Foreign currencies
The individual financial statements of each Group entity are
presented in the currency of the primary economic
environment in which the entity operates (its functional
currency). For the purpose of the consolidated financial
statements, the results and financial position of each entity
are expressed in Currency Units, which is the functional
currency of the Company, and the presentation currency for
the consolidated financial statements.
In preparing the financial statements of the individual entities,
transactions in currencies other than the entity’s functional
currency (foreign currencies) are recorded at the rates of
exchange prevailing on the dates of the transactions. At each
statement of financial position date, monetary items
denominated in foreign currencies are retranslated at the
rates prevailing on the statement of financial position date.
Non-monetary items carried at fair value that are
denominated in foreign currencies are retranslated at the
rates prevailing on the date when the fair value was
determined. Non-monetary items that are measured in terms
of historical cost in a foreign currency are not retranslated.
Exchange differences are recognised in profit or loss in the
period in which they arise except for:
exchange differences which relate to assets under
construction for future productive use, which are included
in the cost of those assets when they are regarded as an
adjustment to interest costs on foreign currency
borrowings;
Mu
stek In
tegrated
An
nu
al Rep
ort 2
01
2
93
exchange differences on transactions entered into in order
to hedge certain foreign currency risks; and
exchange differences on monetary items receivable from or
payable to a foreign operation for which settlement is
neither planned nor likely to occur, which form part of the
net investment in a foreign operation, and which are
recognised in the foreign currency translation reserve and
recognised in profit or loss on disposal of the net
investment.
For the purpose of presenting consolidated financial
statements, the assets and liabilities of the Group’s foreign
operations (including comparatives) are expressed in
Currency Units using exchange rates prevailing on the
statement of financial position date. Income and expense
items (including comparatives) are translated at the average
exchange rates for the period, unless exchange rates
fluctuated significantly during that period, in which case the
exchange rates at the dates of the transactions are used.
Exchange differences arising, if any, are classified as equity
and transferred to the Group’s translation reserve. Such
translation differences are recognised in profit or loss in the
period in which the foreign operation is disposed of.
Goodwill and fair value adjustments arising on the acquisition
of a foreign operation are treated as assets and liabilities of
the foreign operation and translated at the closing rate.
Borrowing costs
Borrowing costs directly attributable to the acquisition,
construction or production of qualifying assets, which are
assets that necessarily take a substantial period of time to
get ready for their intended use or sale, are added to the
cost of those assets, until such time as the assets are
substantially ready for their intended use or sale.
To the extent that variable rate borrowings are used to
finance a qualifying asset and are hedged in an effective cash
flow hedge of interest rate risk, the effective portion of the
derivative is deferred in equity and released to profit or loss
when the qualifying asset impacts profit or loss. To the extent
that fixed rate borrowings are used to finance a qualifying
asset and are hedged in an effective fair value hedge of
interest rate risk, the capitalised borrowing costs reflect the
hedged interest rate.
Investment income earned on the temporary investment of
specific borrowings pending their expenditure on qualifying
assets is deducted from the borrowing costs eligible for
capitalisation.
All other borrowing costs are recognised in profit or loss in
the period in which they are incurred.
Retirement benefit costs
Contributions to defined contribution retirement benefit plans
are recognised as an expense as they fall due. Contributions
made to state-managed retirement benefit schemes are dealt
with as contributions to defined contribution plans where the
Group’s obligations under the plans are equivalent to those
arising in a defined contribution retirement benefit plan.
For defined benefit retirement benefit plans, the cost of
providing benefits is determined using the Projected Unit
Credit Method, with actuarial valuations being carried out at
each statement of financial position date. Actuarial gains and
losses that exceed 10% of the greater of the present value of
the Group’s defined benefit obligation and the fair value of
plan assets are amortised over the expected average
remaining working lives of the participating employees. Past
service cost is recognised immediately to the extent that the
benefits are already vested, and otherwise is amortised on a
straight-line basis over the average period until the benefits
become vested.
The retirement benefit obligation recognised in the statement
of financial position represents the present value of the
defined benefit obligation as adjusted for unrecognised
actuarial gains and losses and unrecognised past service
cost, and as reduced by the fair value of plan assets. Any
asset resulting from this calculation is limited to unrecognised
actuarial losses and past service cost, plus the present value
of available refunds and reductions in future contributions to
the plan.
Share-based payments
The Group issues equity-settled share options to certain
employees. Equity-settled share-based payments to
employees and others providing similar services are
measured at the fair value of the equity instruments at the
grant date.
Fair value is measured using a binomial tree that adheres to
all the Black-Scholes option pricing principles. The expected
life used in the model has been adjusted, based on
management’s best estimate, for the effects of non-
transferability, exercise restrictions and behavioural
considerations.
The fair value determined at the grant date of the equity-
settled share-based payments is expensed on a straight-line
Mu
ste
k In
teg
rate
d A
nn
ual
Rep
ort
20
12
94
Accounting Policies (continued)for the year ended 30 June 2012
basis over the vesting period, based on the Group’s estimate
of equity instruments that will eventually vest. At each
statement of financial position date, the Group revises its
estimate of the number of equity instruments expected to
vest. The impact of the revision of the original estimates, if
any, is recognised in profit or loss over the remaining vesting
period, with a corresponding adjustment to the equity-settled
employee benefits reserve.
Equity-settled share-based payment transactions with other
parties are measured at the fair value of the goods or
services received, except where the fair value cannot be
estimated reliably, in which case they are measured at the fair
value of the equity instruments granted, measured at the
date the entity obtains the goods or the counterparty renders
the service.
For cash-settled share-based payments, a liability equal to
the portion of the goods or services received is recognised at
the current fair value determined at each statement of
financial position date.
Taxation
Income tax expense represents the sum of the tax currently
payable and deferred tax.
Current tax
The tax currently payable is based on taxable profit for the
year. Taxable profit differs from profit as reported in the
consolidated statement of comprehensive income because it
excludes items of income or expense that are taxable or
deductible in other years and it further excludes items that
are never taxable or deductible. The Group’s liability for
current tax is calculated using tax rates that have been
enacted or substantively enacted by the statement of
financial position date.
Deferred tax
Deferred tax is recognised on differences between the
carrying amounts of assets and liabilities in the financial
statements and the corresponding tax bases used in the
computation of taxable profit, and are accounted for using
the statement of financial position liability method. Deferred
tax liabilities are generally recognised for all taxable temporary
differences, and deferred tax assets are generally recognised
for all deductible temporary differences to the extent that it is
probable that taxable profits will be available against which
those deductible temporary differences can be utilised. Such
assets and liabilities are not recognised if the temporary
difference arises from goodwill or from the initial recognition
(other than in a business combination) of other assets and
liabilities in a transaction that affects neither the taxable profit
nor the accounting profit.
Deferred tax liabilities are recognised for taxable temporary
differences associated with investments in subsidiaries and
associates, and interests in joint ventures, except where the
Group is able to control the reversal of the temporary
difference and it is probable that the temporary difference will
not reverse in the foreseeable future. Deferred tax assets
arising from deductible temporary differences associated with
such investments and interests are only recognised to the
extent that it is probable that there will be sufficient taxable
profits against which to utilise the benefits of the temporary
differences and they are expected to reverse in the
foreseeable future.
The carrying amount of deferred tax assets is reviewed at
each statement of financial position date and reduced to the
extent that it is no longer probable that sufficient taxable
profits will be available to allow all or part of the asset to be
recovered.
Deferred tax assets and liabilities are measured at the tax
rates that are expected to apply in the period in which the
liability is settled or the asset realised, based on tax rates
(and tax laws) that have been enacted or substantively
enacted by the statement of financial position date. The
measurement of deferred tax liabilities and assets reflects the
tax consequences that would follow from the manner in
which the Group expects, at the reporting date, to recover or
settle the carrying amount of its assets and liabilities.
Deferred tax assets and liabilities are offset when there is a
legally enforceable right to set off current tax assets against
current tax liabilities and when they relate to income taxes
levied by the same taxation authority and the Group intends
to settle its current tax assets and liabilities on a net basis.
Current and deferred tax for the period
Current and deferred tax are recognised as an expense or
income in profit or loss, except when they relate to items
credited or debited directly to equity, in which case the tax is
also recognised directly in equity, or where they arise from
the initial accounting for a business combination. In the case
of a business combination, the tax effect is taken into
account in calculating goodwill or in determining the excess
of the acquirer’s interest in the net fair value of the acquiree’s
identifiable assets, liabilities and contingent liabilities over the
cost of the business combination.
Mu
stek In
tegrated
An
nu
al Rep
ort 2
01
2
95
Property, plant and equipment
All items of plant and equipment are stated at cost less
accumulated depreciation, except for land, which is not
depreciated.
Depreciation is charged so as to write off the cost of assets
over their estimated useful lives, using the straight-line
method. The estimated useful lives, residual values and
depreciation methods are reviewed at each year-end, with
the effect of any changes in the estimates accounted for
prospectively.
The gain or loss arising on the disposal or retirement of an
asset is determined as the difference between the sales
proceeds and the carrying amount of the asset and is
recognised in the statement of comprehensive income.
Investment property
Investment property, which is property held to earn rentals
and/or for capital appreciation, is measured initially at its
cost, including transaction costs. Subsequent to initial
recognition, investment property is measured at fair value.
Gains and losses arising from changes in the fair value of
investment property are included in profit or loss in the period
in which they arise.
Intangible assets
Intangible assets acquired separately
Intangible assets acquired separately are reported at cost
less accumulated amortisation and accumulated impairment
losses. Amortisation is charged on a straight-line basis over
their estimated useful lives. The estimated useful life and
amortisation method are reviewed at the end of each annual
reporting period, with the effect of any changes in estimate
being accounted for on a prospective basis.
Internally-generated intangible assets – research and
development expenditure
Expenditure on research activities is recognised as an
expense in the period in which it is incurred. An internally-
generated intangible asset arising from development (or from
the development phase of an internal project) is recognised
if, and only if, all of the following have been demonstrated:
The technical feasibility of completing the intangible asset
so that it will be available for use or sale.
The intention to complete the intangible asset and use or
sell it.
The ability to use or sell the intangible asset.
How the intangible asset will generate probable future
economic benefits.
The availability of adequate technical, financial and other
resources to complete the development and to use or sell
the intangible asset.
The ability to measure reliably the expenditure attributable
to the intangible asset during its development.
The amount initially recognised for internally-generated
intangible assets is the sum of the expenditure incurred from
the date when the intangible asset first meets the recognition
criteria listed above. Where no internally-generated intangible
asset can be recognised, development expenditure is
charged to profit or loss in the period in which it is incurred.
Subsequent to initial recognition, internally-generated
intangible assets are reported at cost less accumulated
amortisation and accumulated impairment losses, on the
same basis as intangible assets acquired separately.
Intangible assets acquired in a business combination
Intangible assets acquired in a business combination are
identified and recognised separately from goodwill where
they satisfy the definition of an intangible asset and their fair
values can be measured reliably. The cost of such intangible
assets is their fair value at the acquisition date.
Subsequent to initial recognition, intangible assets acquired
in a business combination are reported at cost less
accumulated amortisation and accumulated impairment
losses, on the same basis as intangible assets acquired
separately.
Impairment of intangible and tangible assets, excluding goodwill
At the end of each reporting period, the Group reviews the
carrying amounts of its tangible and intangible assets to
determine whether there is any indication that those assets
have suffered an impairment loss. If any such indication
exists, the recoverable amount of the asset is estimated in
order to determine the extent of the impairment loss (if any).
Where it is not possible to estimate the recoverable amount
of an individual asset, the Group estimates the recoverable
amount of the cash-generating unit to which the asset
belongs. Where a reasonable and consistent basis of
allocation can be identified, corporate assets are also
allocated to individual cash-generating units, or otherwise
they are allocated to the smallest group of cash-generating
units for which a reasonable and consistent allocation basis
can be identified.
Mu
ste
k In
teg
rate
d A
nn
ual
Rep
ort
20
12
96
Accounting Policies (continued)for the year ended 30 June 2012
Intangible assets with indefinite useful lives and intangible
assets not yet available for use are tested for impairment
annually, and whenever there is an indication that the asset
may be impaired.
Recoverable amount is the higher of fair value less costs to
sell and value in use. In assessing value in use, the estimated
future cash flows are discounted to their present value using
a pre-tax discount rate that reflects current market
assessments of the time value of money and the risks
specific to the asset for which the estimates of future cash
flows have not been adjusted.
If the recoverable amount of an asset (or cash-generating
unit) is estimated to be less than its carrying amount, the
carrying amount of the asset (or cash-generating unit) is
reduced to its recoverable amount. An impairment loss is
recognised immediately in profit or loss, unless the relevant
asset is carried at a revalued amount, in which case the
impairment loss is treated as a revaluation decrease.
Where an impairment loss subsequently reverses, the
carrying amount of the asset (or cash-generating unit) is
increased to the revised estimate of its recoverable amount,
but so that the increased carrying amount does not exceed
the carrying amount that would have been determined
had no impairment loss been recognised for the asset
(or cash-generating unit) in prior years. A reversal of an
impairment loss is recognised immediately in profit or loss,
unless the relevant asset is carried at a revalued amount, in
which case the reversal of the impairment loss is treated as
a revaluation increase.
Inventories
Inventories are stated at the lower of cost or net realisable
value. Cost comprises direct materials and, where applicable,
direct labour costs and those overheads that have been
incurred in bringing the inventories to their present location
and condition. Cost is calculated using the weighted average
method. Net realisable value represents the estimated selling
price less all estimated costs to completion and costs to be
incurred in marketing, selling and distribution.
Provisions
Provisions are recognised when the Group has a present
obligation (legal or constructive) as a result of a past event, it
is probable that the Group will be required to settle the
obligation, and a reliable estimate can be made of the
amount of the obligation.
The amount recognised as a provision is the best estimate of
the consideration required to settle the present obligation at
the statement of financial position date, taking into account
the risks and uncertainties surrounding the obligation. Where
a provision is measured using the cash flows estimated to
settle the present obligation, its carrying amount is the
present value of those cash flows.
When some or all of the economic benefits required to settle
a provision are expected to be recovered from a third party,
the receivable is recognised as an asset if it is virtually certain
that reimbursement will be received and the amount of the
receivable can be measured reliably.
Onerous contracts
Present obligations arising under onerous contracts are
recognised and measured as provisions. An onerous contract
is considered to exist where the Group has a contract under
which the unavoidable costs of meeting the obligations under
the contract exceed the economic benefits expected to be
received under it.
Restructurings
A restructuring provision is recognised when the Group has
developed a detailed formal plan for the restructuring and
has raised a valid expectation in those affected that it will
carry out the restructuring by starting to implement the plan
or announcing its main features to those affected by it. The
measurement of a restructuring provision includes only the
direct expenditures arising from the restructuring, which are
those amounts that are both necessarily entailed by the
restructuring and not associated with the ongoing activities
of the entity.
Warranties
Provisions for warranty costs are recognised at the date of
sale of the relevant products, at the directors’ best estimate
of the expenditure required to settle the Group’s obligation.
Contingent liabilities acquired in a business combination
Contingent liabilities acquired in a business combination are
initially measured at fair value at the date of acquisition. At
subsequent reporting dates, such contingent liabilities are
measured at the higher of the amount that would be
recognised in accordance with IAS 37 – Provisions,
Contingent Liabilities and Contingent Assets and the amount
initially recognised less cumulative amortisation recognised in
accordance with IAS 18 – Revenue.
Mu
stek In
tegrated
An
nu
al Rep
ort 2
01
2
97
Financial assets
Investments are recognised and derecognised on trade date
where the purchase or sale of an investment is under a
contract whose terms require delivery of the investment
within the timeframe established by the market concerned,
and are initially measured at fair value, plus transaction
costs, except for those financial assets classified as at fair
value through profit or loss, which are initially measured at
fair value.
Financial assets are classified into the following specified
categories: financial assets ‘at fair value through profit or
loss’ (FVTPL), ‘held-to-maturity’ investments, ‘available-for-
sale’ (AFS) financial assets and ‘loans and receivables’.
The classification depends on the nature and purpose of
the financial assets and is determined at the time of initial
recognition.
Effective interest method
The effective interest method is a method of calculating the
amortised cost of a financial asset and of allocating interest
income over the relevant period. The effective interest rate is
the rate that exactly discounts estimated future cash receipts
(including all fees on points paid or received that form an
integral part of the effective interest rate, transaction costs
and other premiums or discounts) through the expected life
of the financial asset, or, where appropriate, a shorter period.
Income is recognised on an effective interest basis for debt
instruments other than those financial assets designated as
at FVTPL.
Financial assets at FVTPL
Financial assets are classified as at FVTPL where the financial
asset is either held for trading or it is designated as at FVTPL.
A financial asset is classified as held-for-trading if:
it has been acquired principally for the purpose of selling in
the near future; or
it is a part of an identified portfolio of financial instruments
that the Group manages together and has a recent actual
pattern of short-term profit-taking; or
it is a derivative that is not designated and effective as a
hedging instrument.
A financial asset other than a financial asset held-for-trading
may be designated as at FVTPL upon initial recognition if:
such designation eliminates or significantly reduces a
measurement or recognition inconsistency that would
otherwise arise; or
the financial asset forms part of a group of financial assets
or financial liabilities or both, which is managed and its
performance is evaluated on a fair value basis, in
accordance with the Group’s documented risk
management or investment strategy, and information about
the grouping is provided internally on that basis; or
it forms part of a contract containing one or more
embedded derivatives, and IAS 39 – Financial Instruments:
Recognition and Measurement permits the entire combined
contract (asset or liability) to be designated as at FVTPL.
Financial assets at FVTPL are stated at fair value, with any
resultant gain or loss recognised in profit or loss. The net
gain or loss recognised in profit or loss incorporates any
dividend or interest earned on the financial asset. Fair value is
determined in the manner described in note 23.
Held-to-maturity investments
Bills of exchange and debentures with fixed or determinable
payments and fixed maturity dates that the Group has the
positive intent and ability to hold to maturity are classified as
held-to-maturity investments. Held-to-maturity investments
are recorded at amortised cost using the effective interest
method less any impairment, with revenue recognised on an
effective yield basis.
AFS financial assets
Unlisted shares and listed redeemable notes held by the
Group that are traded in an active market are classified as
being AFS and are stated at fair value. Fair value is
determined in the manner described in note 23. Gains and
losses arising from changes in fair value are recognised
directly in equity in the investments revaluation reserve with
the exception of impairment losses, interest calculated using
the effective interest method and foreign exchange gains and
losses on monetary assets, which are recognised directly in
profit or loss. Where the investment is disposed of or is
determined to be impaired, the cumulative gain or loss
previously recognised in the investments revaluation reserve
is included in profit or loss for the period.
Dividends on AFS equity instruments are recognised in profit
or loss when the Group’s right to receive the dividends is
established.
The fair value of AFS monetary assets denominated in a
foreign currency is determined in that foreign currency and
translated at the spot rate at the statement of financial
position date. The change in fair value attributable to
Mu
ste
k In
teg
rate
d A
nn
ual
Rep
ort
20
12
98
Accounting Policies (continued)for the year ended 30 June 2012
translation differences that result from a change in amortised
cost of the asset is recognised in profit or loss, and other
changes are recognised in equity.
Loans and receivables
Trade receivables, loans, and other receivables that have
fixed or determinable payments that are not quoted in an
active market are classified as loans and receivables. Loans
and receivables are measured at amortised cost using the
effective interest method, less any impairment. Interest
income is recognised by applying the effective interest rate,
except for short-term receivables when the recognition of
interest would be immaterial.
Impairment of financial assets
Financial assets, other than those at FVTPL, are assessed for
indicators of impairment at each statement of financial
position date. Financial assets are impaired where there is
objective evidence that, as a result of one or more events
that occurred after the initial recognition of the financial asset,
the estimated future cash flows of the investment have been
impacted.
For unlisted shares classified as AFS, a significant or
prolonged decline in the fair value of the security below its
cost is considered to be objective evidence of impairment.
For all other financial assets, including redeemable notes
classified as AFS and finance lease receivables, objective
evidence of impairment could include:
significant financial difficulty of the issuer or counterparty;
or
default or delinquency in interest or principal payments; or
it becoming probable that the borrower will enter
bankruptcy or financial reorganisation.
For certain categories of financial assets, such as trade
receivables, assets that are assessed not to be impaired
individually are subsequently assessed for impairment on a
collective basis. Objective evidence of impairment for a
portfolio of receivables could include the Group’s past
experience of collecting payments, an increase in the number
of delayed payments in the portfolio past the average credit
period of approximately 60 days, as well as observable
changes in national or local economic conditions that
correlate with default on receivables.
For financial assets carried at amortised cost, the amount of
the impairment is the difference between the asset’s carrying
amount and the present value of estimated future cash
flows, discounted at the financial asset’s original effective
interest rate.
The carrying amount of the financial asset is reduced by the
impairment loss directly for all financial assets with the
exception of trade receivables, where the carrying amount is
reduced through the use of an allowance account. When a
trade receivable is considered uncollectible, it is written off
against the allowance account. Subsequent recoveries of
amounts previously written off are credited against the
allowance account. Changes in the carrying amount of
the allowance account are recognised in profit or loss.
With the exception of AFS equity instruments, if, in a
subsequent period, the amount of the impairment loss
decreases and the decrease can be related objectively to an
event occurring after the impairment was recognised, the
previously recognised impairment loss is reversed through
profit or loss to the extent that the carrying amount of the
investment at the date the impairment is reversed does not
exceed what the amortised cost would have been had the
impairment not been recognised.
In respect of AFS equity securities, impairment losses
previously recognised through profit or loss are not reversed
through profit or loss. Any increase in fair value subsequent
to an impairment loss is recognised directly in equity.
Derecognition of financial assets
The Group derecognises a financial asset only when the
contractual rights to the cash flows from the asset expire; or
it transfers the financial asset and substantially all the risks
and rewards of ownership of the asset to another entity. If the
Group neither transfers nor retains substantially all the risks
and rewards of ownership and continues to control the
transferred asset, the Group recognises its retained interest
in the asset and an associated liability for amounts it may
have to pay. If the Group retains substantially all the risks and
rewards of ownership of a transferred financial asset, the
Group continues to recognise the financial asset and also
recognises a collateralised borrowing for the proceeds
received.
Mu
stek In
tegrated
An
nu
al Rep
ort 2
01
2
99
Financial liabilities and equity instruments issued by the Group
Classification as debt or equity
Debt and equity instruments are classified as either financial
liabilities or as equity in accordance with the substance of the
contractual arrangement.
Equity instruments
An equity instrument is any contract that evidences a residual
interest in the assets of an entity after deducting all of its
liabilities. Equity instruments issued by the Group are
recorded at the proceeds received, net of direct issue costs.
Compound instruments
The component parts of compound instruments issued by
the Group are classified separately as financial liabilities and
equity in accordance with the substance of the contractual
arrangement. At the date of issue, the fair value of the liability
component is estimated using the prevailing market interest
rate for a similar non-convertible instrument. This amount is
recorded as a liability on an amortised cost basis using the
effective interest method until extinguished upon conversion
or at the instrument’s maturity date. The equity component is
determined by deducting the amount of the liability
component from the fair value of the compound instrument
as a whole. This is recognised and included in equity, net of
income tax effects, and is not subsequently remeasured.
Financial guarantee contract liabilities
Financial guarantee contract liabilities are measured initially
at their fair values and are subsequently measured at the
higher of:
the amount of the obligation under the contract, as
determined in accordance with IAS 37 – Provisions,
Contingent Liabilities and Contingent Assets; and
the amount initially recognised less, where appropriate,
cumulative amortisation recognised in accordance with
the revenue recognition policies set out above.
Financial liabilities
Financial liabilities are classified as either financial liabilities
‘at FVTPL’ or ‘other financial liabilities’.
Financial liabilities at FVTPL
Financial liabilities are classified as at FVTPL where the
financial liability is either held-for-trading or it is designated as
at FVTPL.
A financial liability is classified as held-for-trading if:
it has been incurred principally for the purpose of
repurchasing in the near future; or
it is a part of an identified portfolio of financial instruments
that the Group manages together and has a recent actual
pattern of short-term profit-taking; or
it is a derivative that is not designated and effective as a
hedging instrument.
A financial liability other than a financial liability held-for-
trading may be designated as at FVTPL upon initial
recognition if:
such designation eliminates or significantly reduces a
measurement or recognition inconsistency that would
otherwise arise; or
the financial liability forms part of a group of financial
assets or financial liabilities or both, which is managed and
its performance is evaluated on a fair value basis, in
accordance with the Group’s documented risk
management or investment strategy, and information about
the grouping is provided internally on that basis; or
it forms part of a contract containing one or more
embedded derivatives, and IAS 39 – Financial Instruments:
Recognition and Measurement permits the entire combined
contract (asset or liability) to be designated as at FVTPL.
Financial liabilities at FVTPL are stated at fair value, with any
resultant gain or loss recognised in profit or loss. The net
gain or loss recognised in profit or loss incorporates any
interest paid on the financial liability. Fair value is determined
in the manner described in note 23.
Other financial liabilities
Other financial liabilities, including borrowings, are initially
measured at fair value, net of transaction costs.
Other financial liabilities are subsequently measured at
amortised cost using the effective interest method, with
interest expense recognised on an effective yield basis.
The effective interest method is a method of calculating the
amortised cost of a financial liability and of allocating interest
Mu
ste
k In
teg
rate
d A
nn
ual
Rep
ort
20
12
100
Accounting Policies (continued)for the year ended 30 June 2012
expense over the relevant period. The effective interest rate is
the rate that exactly discounts estimated future cash
payments through the expected life of the financial liability, or,
where appropriate, a shorter period.
Derecognition of financial liabilities
The Group derecognises financial liabilities when, and only
when, the Group’s obligations are discharged, cancelled or
they expire.
Derivative financial instruments
The Group enters into a variety of derivative financial
instruments to manage its exposure to interest rate and
foreign exchange rate risk, including foreign exchange
forward contracts, interest rate swaps and cross-currency
swaps.
The use of financial derivatives is governed by the Group’s
policies approved by the Board of Directors, which provide
written principles on the use of financial derivatives consistent
with the Group’s risk management strategy. The Group does
not use derivative financial instruments for speculative
purposes.
Derivatives are initially recognised at fair value at the date a
derivative contract is entered into and are subsequently
remeasured to their fair value at the end of each reporting
period. The resulting gain or loss is recognised in profit or
loss immediately unless the derivative is designated and
effective as a hedging instrument, in which event the timing
of the recognition in profit or loss depends on the nature of
the hedge relationship. The Group designates certain
derivatives as either hedges of the fair value of recognised
assets or liabilities or firm commitments (fair value hedges),
hedges of highly probable forecast transactions or hedges of
foreign currency risk of firm commitments (cash flow hedges),
or hedges of net investments in foreign operations.
A derivative is presented as a non-current asset or a
non-current liability if the remaining maturity of the instrument
is more than 12 months and it is not expected to be realised
or settled within 12 months. Other derivatives are presented
as current assets or current liabilities.
Embedded derivatives
Derivatives embedded in other financial instruments or other
host contracts are treated as separate derivatives when their
risks and characteristics are not closely related to those of
the host contracts and the host contracts are not
measured at fair value with changes in fair value recognised
in profit or loss.
Interest rate swaps
The carrying amounts of interest rate swaps, which comprise
net interest receivables and payables accrued, are included
in trade receivables and trade payables, respectively.
Payments and receipts under interest rate swap contracts
are recognised in the statement of comprehensive income on
a basis consistent with corresponding fluctuations in the
interest payments on floating rate financial liabilities.
Redeemable preference shares
Preference shares, which are redeemable on a specific date
or at the option of the shareholder, are presented in
long-term liabilities. The dividends received on preference
shares are recognised as investment income. The dividends
paid on preference shares are recognised as finance costs.
Segments
All segment revenue and expenses are directly attributable to
the segments. Segment assets include all operating assets
used by a segment and segment liabilities include all
operating liabilities. These assets and liabilities are all directly
attributable to the segments. Segment revenue, expenses
and result include transfers between business segments
(primary segments) and between geographical segments
(secondary segments). Such transfers are accounted for at
competitive market prices charged to unaffiliated customers
for similar goods. These transfers are eliminated on
consolidation.
Mu
stek In
tegrated
An
nu
al Rep
ort 2
01
2
101
Critical accounting judgements and key sources of estimation uncertainty
In the application of the Group’s accounting policies, the
directors are required to make judgements, estimates and
assumptions about the carrying amounts of assets and
liabilities that are not readily apparent from other sources.
The estimates and associated assumptions are based on
historical experience and other factors that are considered to
be relevant. Actual results may differ from these estimates.
The estimates and underlying assumptions are reviewed on
an ongoing basis. Revisions to accounting estimates are
recognised in the period in which the estimate is revised if
the revision affects only that period or in the period of the
revision and future periods if the revision affects both current
and future periods.
Critical judgements in applying accounting policies
The following are the critical judgements, apart from those
involving estimations (see below), that the directors have
made in the process of applying the entity’s accounting
policies and that have the most significant effect on the
amounts recognised in financial statements.
Revenue recognition (refer note 2).
Key sources of estimation uncertainty
The following are the key assumptions concerning the future,
and other key sources of estimation uncertainty at the end of
each reporting period, that have a significant risk of causing
a material adjustment to the carrying amounts of assets and
liabilities within the next financial year:
Residual values and useful lives of property, plant and
equipment (refer note 10).
Impairment of goodwill (refer note 11).
Valuation of investments (refer report of the directors and
note 23).
Inventory provisions (refer note 17).
Recoverability of accounts receivable (refer note 18).
Bonus and leave pay provisions (refer note 22).
Fair value of derivatives and other financial instruments
(refer note 23).
Valuation of assets classified as held for sale, as well as
liabilities directly associated with assets classified as held
for sale (refer note 31).
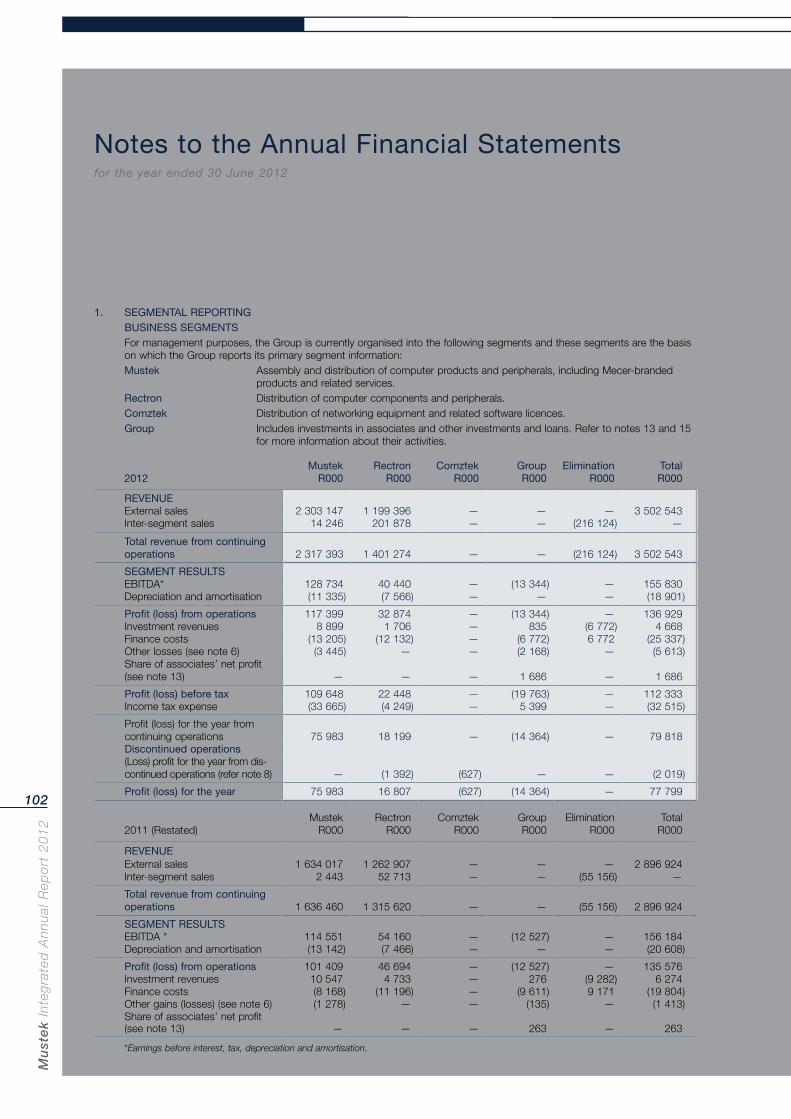
Mu
ste
k In
teg
rate
d A
nn
ual
Rep
ort
20
12
102
Notes to the Annual Financial Statementsfor the year ended 30 June 2012
1. SEGMENTAL REPORTINGBUSINESS SEGMENTSFor management purposes, the Group is currently organised into the following segments and these segments are the basis on which the Group reports its primary segment information: Mustek Assembly and distribution of computer products and peripherals, including Mecer-branded
products and related services.Rectron Distribution of computer components and peripherals.Comztek Distribution of networking equipment and related software licences.Group Includes investments in associates and other investments and loans. Refer to notes 13 and 15
for more information about their activities.
2012Mustek
R000Rectron
R000Comztek
R000GroupR000
EliminationR000
TotalR000
REVENUEExternal sales 2 303 147 1 199 396 — — — 3 502 543Inter-segment sales 14 246 201 878 — — (216 124) —
Total revenue from continuing operations 2 317 393 1 401 274 — — (216 124) 3 502 543
SEGMENT RESULTSEBITDA* 128 734 40 440 — (13 344) — 155 830Depreciation and amortisation (11 335) (7 566) — — — (18 901)
Profit (loss) from operations 117 399 32 874 — (13 344) — 136 929Investment revenues 8 899 1 706 — 835 (6 772) 4 668Finance costs (13 205) (12 132) — (6 772) 6 772 (25 337)Other losses (see note 6) (3 445) — — (2 168) — (5 613)Share of associates’ net profit (see note 13) — — — 1 686 — 1 686
Profit (loss) before tax 109 648 22 448 — (19 763) — 112 333Income tax expense (33 665) (4 249) — 5 399 — (32 515)
Profit (loss) for the year from continuing operations 75 983 18 199 — (14 364) — 79 818Discontinued operations(Loss) profit for the year from dis- continued operations (refer note 8) — (1 392) (627) — — (2 019)
Profit (loss) for the year 75 983 16 807 (627) (14 364) — 77 799
2011 (Restated)Mustek
R000Rectron
R000Comztek
R000GroupR000
EliminationR000
TotalR000
REVENUEExternal sales 1 634 017 1 262 907 — — — 2 896 924Inter-segment sales 2 443 52 713 — — (55 156) —
Total revenue from continuing operations 1 636 460 1 315 620 — — (55 156) 2 896 924
SEGMENT RESULTSEBITDA * 114 551 54 160 — (12 527) — 156 184Depreciation and amortisation (13 142) (7 466) — — — (20 608)
Profit (loss) from operations 101 409 46 694 — (12 527) — 135 576Investment revenues 10 547 4 733 — 276 (9 282) 6 274Finance costs (8 168) (11 196) — (9 611) 9 171 (19 804)Other gains (losses) (see note 6) (1 278) — — (135) — (1 413)Share of associates’ net profit (see note 13) — — — 263 — 263
*Earnings before interest, tax, depreciation and amortisation.
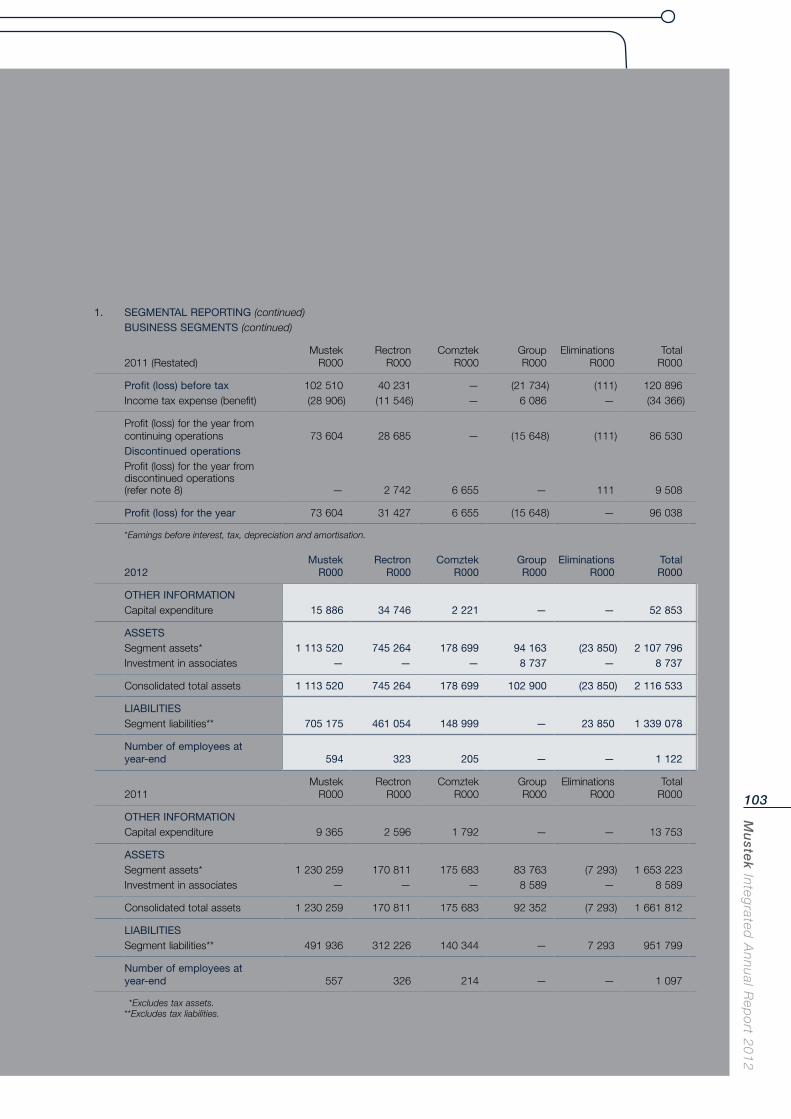
Mu
stek In
tegrated
An
nu
al Rep
ort 2
01
2
103
1. SEGMENTAL REPORTING (continued)BUSINESS SEGMENTS (continued)
2011 (Restated)Mustek
R000Rectron
R000Comztek
R000GroupR000
EliminationsR000
TotalR000
Profit (loss) before tax 102 510 40 231 — (21 734) (111) 120 896Income tax expense (benefit) (28 906) (11 546) — 6 086 — (34 366)
Profit (loss) for the year from continuing operations 73 604 28 685 — (15 648) (111) 86 530Discontinued operationsProfit (loss) for the year from discontinued operations (refer note 8) — 2 742 6 655 — 111 9 508
Profit (loss) for the year 73 604 31 427 6 655 (15 648) — 96 038
*Earnings before interest, tax, depreciation and amortisation.
2012Mustek
R000Rectron
R000Comztek
R000GroupR000
EliminationsR000
TotalR000
OTHER INFORMATIONCapital expenditure 15 886 34 746 2 221 — — 52 853
ASSETSSegment assets* 1 113 520 745 264 178 699 94 163 (23 850) 2 107 796Investment in associates — — — 8 737 — 8 737
Consolidated total assets 1 113 520 745 264 178 699 102 900 (23 850) 2 116 533
LIABILITIESSegment liabilities** 705 175 461 054 148 999 — 23 850 1 339 078
Number of employees at year-end 594 323 205 — — 1 122
2011Mustek
R000Rectron
R000Comztek
R000GroupR000
EliminationsR000
TotalR000
OTHER INFORMATIONCapital expenditure 9 365 2 596 1 792 — — 13 753
ASSETSSegment assets* 1 230 259 170 811 175 683 83 763 (7 293) 1 653 223Investment in associates — — — 8 589 — 8 589
Consolidated total assets 1 230 259 170 811 175 683 92 352 (7 293) 1 661 812
LIABILITIESSegment liabilities** 491 936 312 226 140 344 — 7 293 951 799
Number of employees at year-end 557 326 214 — — 1 097
*Excludes tax assets.**Excludes tax liabilities.
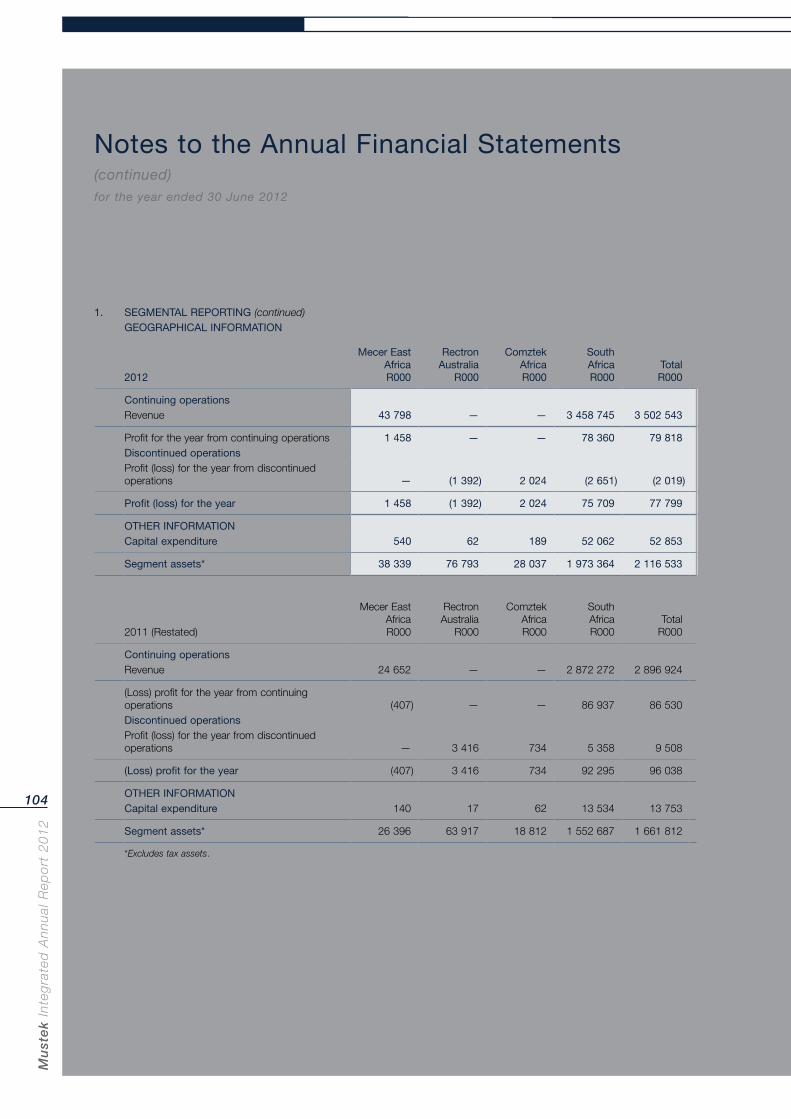
Mu
ste
k In
teg
rate
d A
nn
ual
Rep
ort
20
12
104
Notes to the Annual Financial Statements (continued)for the year ended 30 June 2012
1. SEGMENTAL REPORTING (continued)GEOGRAPHICAL INFORMATION
2012
Mecer East AfricaR000
Rectron Australia
R000
Comztek AfricaR000
South AfricaR000
TotalR000
Continuing operationsRevenue 43 798 — — 3 458 745 3 502 543
Profit for the year from continuing operations 1 458 — — 78 360 79 818Discontinued operationsProfit (loss) for the year from discontinued operations — (1 392) 2 024 (2 651) (2 019)
Profit (loss) for the year 1 458 (1 392) 2 024 75 709 77 799
OTHER INFORMATIONCapital expenditure 540 62 189 52 062 52 853
Segment assets* 38 339 76 793 28 037 1 973 364 2 116 533
2011 (Restated)
Mecer East AfricaR000
Rectron Australia
R000
Comztek AfricaR000
South AfricaR000
TotalR000
Continuing operationsRevenue 24 652 — — 2 872 272 2 896 924
(Loss) profit for the year from continuing operations (407) — — 86 937 86 530Discontinued operationsProfit (loss) for the year from discontinued operations — 3 416 734 5 358 9 508
(Loss) profit for the year (407) 3 416 734 92 295 96 038
OTHER INFORMATIONCapital expenditure 140 17 62 13 534 13 753
Segment assets* 26 396 63 917 18 812 1 552 687 1 661 812
*Excludes tax assets.
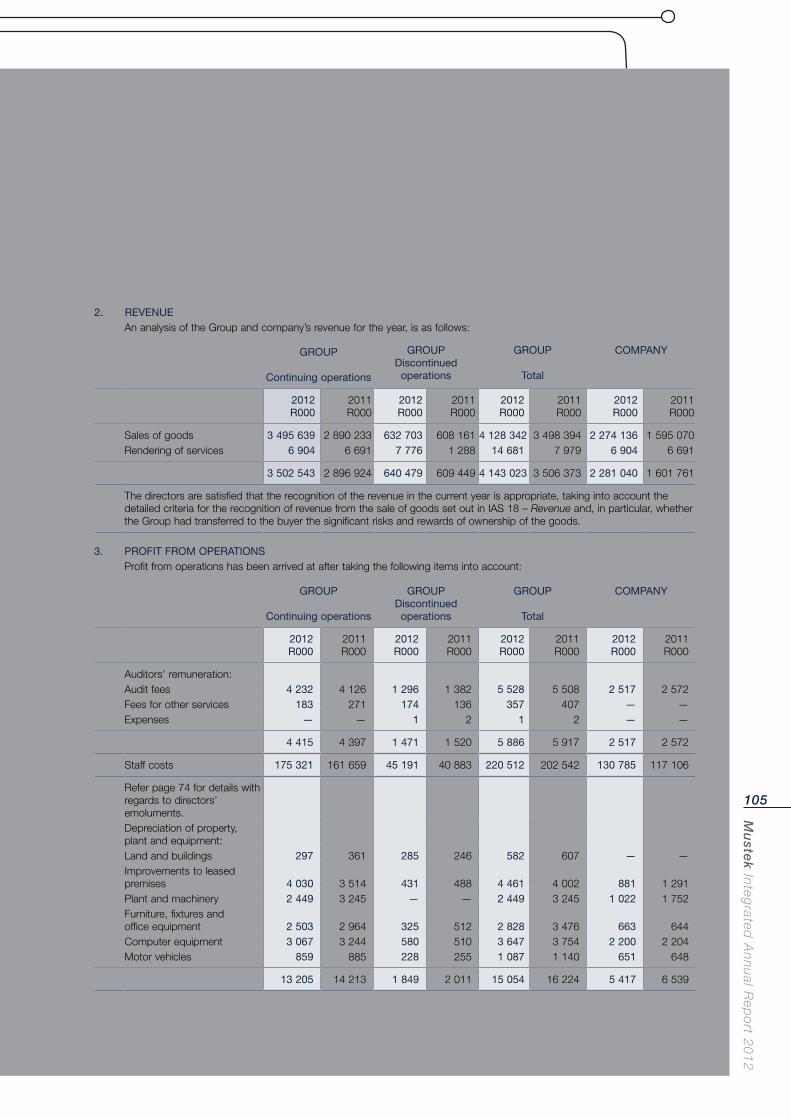
Mu
stek In
tegrated
An
nu
al Rep
ort 2
01
2
105
2. REVENUEAn analysis of the Group and company’s revenue for the year, is as follows:
GROUP
Continuing operations
GROUPDiscontinued
operations
GROUP
Total
COMPANY
2012R000
2011R000
2012R000
2011R000
2012R000
2011R000
2012R000
2011R000
Sales of goods 3 495 639 2 890 233 632 703 608 161 4 128 342 3 498 394 2 274 136 1 595 070Rendering of services 6 904 6 691 7 776 1 288 14 681 7 979 6 904 6 691
3 502 543 2 896 924 640 479 609 449 4 143 023 3 506 373 2 281 040 1 601 761
The directors are satisfied that the recognition of the revenue in the current year is appropriate, taking into account the detailed criteria for the recognition of revenue from the sale of goods set out in IAS 18 – Revenue and, in particular, whether the Group had transferred to the buyer the significant risks and rewards of ownership of the goods.
3. PROFIT FROM OPERATIONSProfit from operations has been arrived at after taking the following items into account:
GROUP
Continuing operations
GROUPDiscontinued
operations
GROUP
Total
COMPANY
2012R000
2011R000
2012R000
2011R000
2012R000
2011R000
2012R000
2011R000
Auditors’ remuneration:Audit fees 4 232 4 126 1 296 1 382 5 528 5 508 2 517 2 572Fees for other services 183 271 174 136 357 407 — —Expenses — — 1 2 1 2 — —
4 415 4 397 1 471 1 520 5 886 5 917 2 517 2 572
Staff costs 175 321 161 659 45 191 40 883 220 512 202 542 130 785 117 106
Refer page 74 for details with regards to directors’ emoluments.Depreciation of property, plant and equipment:Land and buildings 297 361 285 246 582 607 — —Improvements to leased premises 4 030 3 514 431 488 4 461 4 002 881 1 291Plant and machinery 2 449 3 245 — — 2 449 3 245 1 022 1 752Furniture, fixtures and office equipment 2 503 2 964 325 512 2 828 3 476 663 644Computer equipment 3 067 3 244 580 510 3 647 3 754 2 200 2 204Motor vehicles 859 885 228 255 1 087 1 140 651 648
13 205 14 213 1 849 2 011 15 054 16 224 5 417 6 539
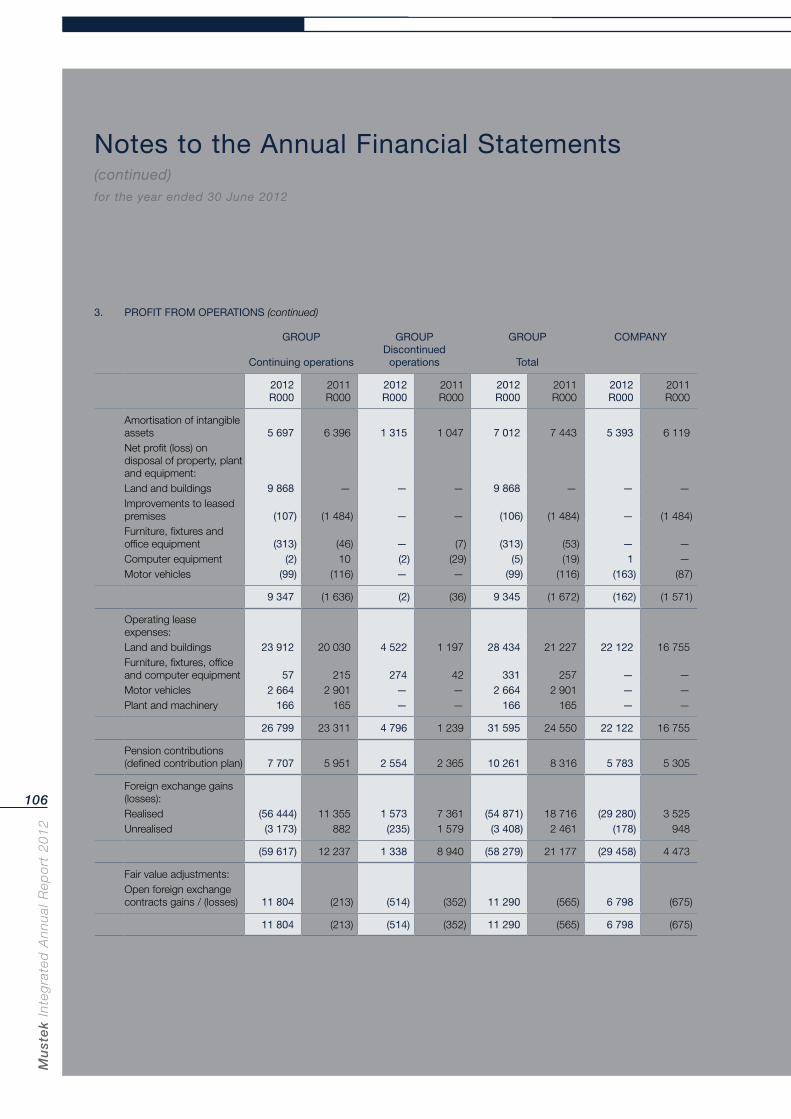
Mu
ste
k In
teg
rate
d A
nn
ual
Rep
ort
20
12
106
Notes to the Annual Financial Statements (continued)for the year ended 30 June 2012
3. PROFIT FROM OPERATIONS (continued)
GROUP
Continuing operations
GROUP Discontinued
operations
GROUP
Total
COMPANY
2012R000
2011R000
2012R000
2011R000
2012R000
2011R000
2012R000
2011R000
Amortisation of intangible assets 5 697 6 396 1 315 1 047 7 012 7 443 5 393 6 119Net profit (loss) on disposal of property, plant and equipment:Land and buildings 9 868 — — — 9 868 — — —Improvements to leased premises (107) (1 484) — — (106) (1 484) — (1 484)Furniture, fixtures and office equipment (313) (46) — (7) (313) (53) — —Computer equipment (2) 10 (2) (29) (5) (19) 1 —Motor vehicles (99) (116) — — (99) (116) (163) (87)
9 347 (1 636) (2) (36) 9 345 (1 672) (162) (1 571)
Operating lease expenses:Land and buildings 23 912 20 030 4 522 1 197 28 434 21 227 22 122 16 755Furniture, fixtures, office and computer equipment 57 215 274 42 331 257 — —Motor vehicles 2 664 2 901 — — 2 664 2 901 — —Plant and machinery 166 165 — — 166 165 — —
26 799 23 311 4 796 1 239 31 595 24 550 22 122 16 755
Pension contributions (defined contribution plan) 7 707 5 951 2 554 2 365 10 261 8 316 5 783 5 305
Foreign exchange gains (losses):Realised (56 444) 11 355 1 573 7 361 (54 871) 18 716 (29 280) 3 525Unrealised (3 173) 882 (235) 1 579 (3 408) 2 461 (178) 948
(59 617) 12 237 1 338 8 940 (58 279) 21 177 (29 458) 4 473
Fair value adjustments:Open foreign exchange contracts gains / (losses) 11 804 (213) (514) (352) 11 290 (565) 6 798 (675)
11 804 (213) (514) (352) 11 290 (565) 6 798 (675)
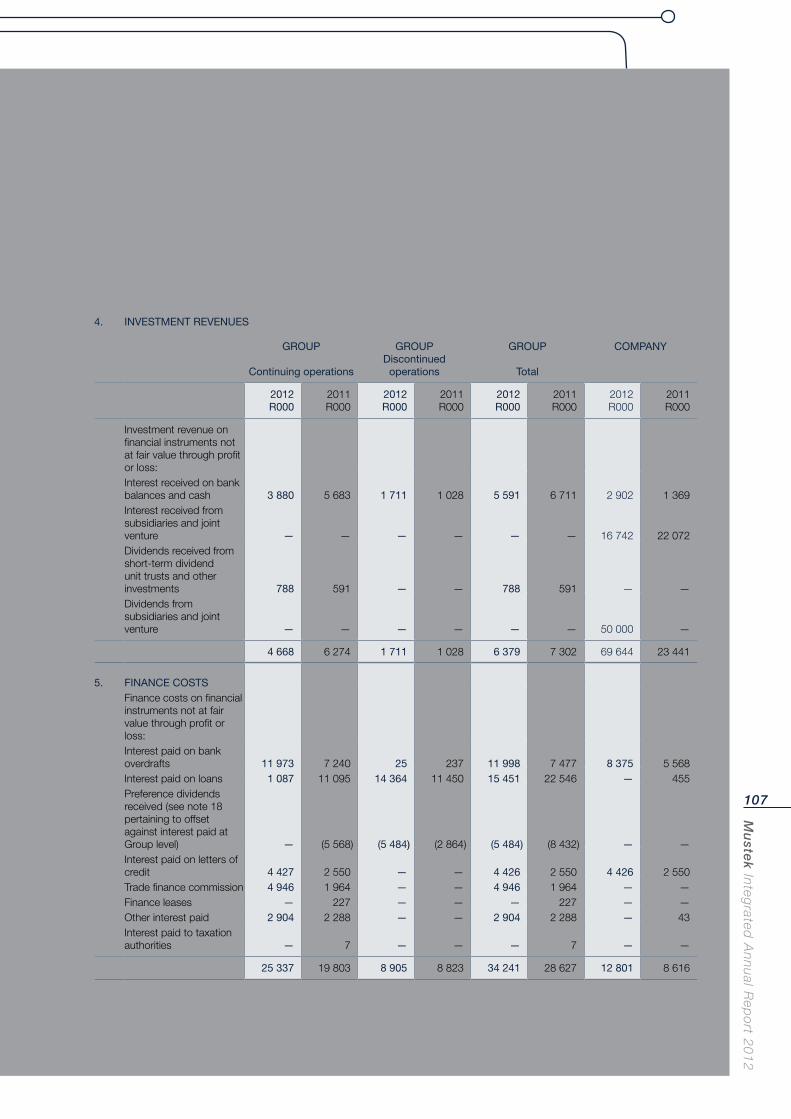
Mu
stek In
tegrated
An
nu
al Rep
ort 2
01
2
107
4. INVESTMENT REVENUES
GROUP
Continuing operations
GROUP Discontinued
operations
GROUP
Total
COMPANY
2012R000
2011R000
2012R000
2011R000
2012R000
2011R000
2012R000
2011R000
Investment revenue on financial instruments not at fair value through profit or loss:Interest received on bank balances and cash 3 880 5 683 1 711 1 028 5 591 6 711 2 902 1 369Interest received from subsidiaries and joint venture — — — — — — 16 742 22 072Dividends received from short-term dividend unit trusts and other investments 788 591 — — 788 591 — —Dividends from subsidiaries and joint venture — — — — — — 50 000 —
4 668 6 274 1 711 1 028 6 379 7 302 69 644 23 441
5. FINANCE COSTSFinance costs on financial instruments not at fair value through profit or loss:Interest paid on bank overdrafts 11 973 7 240 25 237 11 998 7 477 8 375 5 568Interest paid on loans 1 087 11 095 14 364 11 450 15 451 22 546 — 455Preference dividends received (see note 18 pertaining to offset against interest paid at Group level) — (5 568) (5 484) (2 864) (5 484) (8 432) — —Interest paid on letters of credit 4 427 2 550 — — 4 426 2 550 4 426 2 550Trade finance commission 4 946 1 964 — — 4 946 1 964 — —Finance leases — 227 — — — 227 — —Other interest paid 2 904 2 288 — — 2 904 2 288 — 43Interest paid to taxation authorities — 7 — — — 7 — —
25 337 19 803 8 905 8 823 34 241 28 627 12 801 8 616
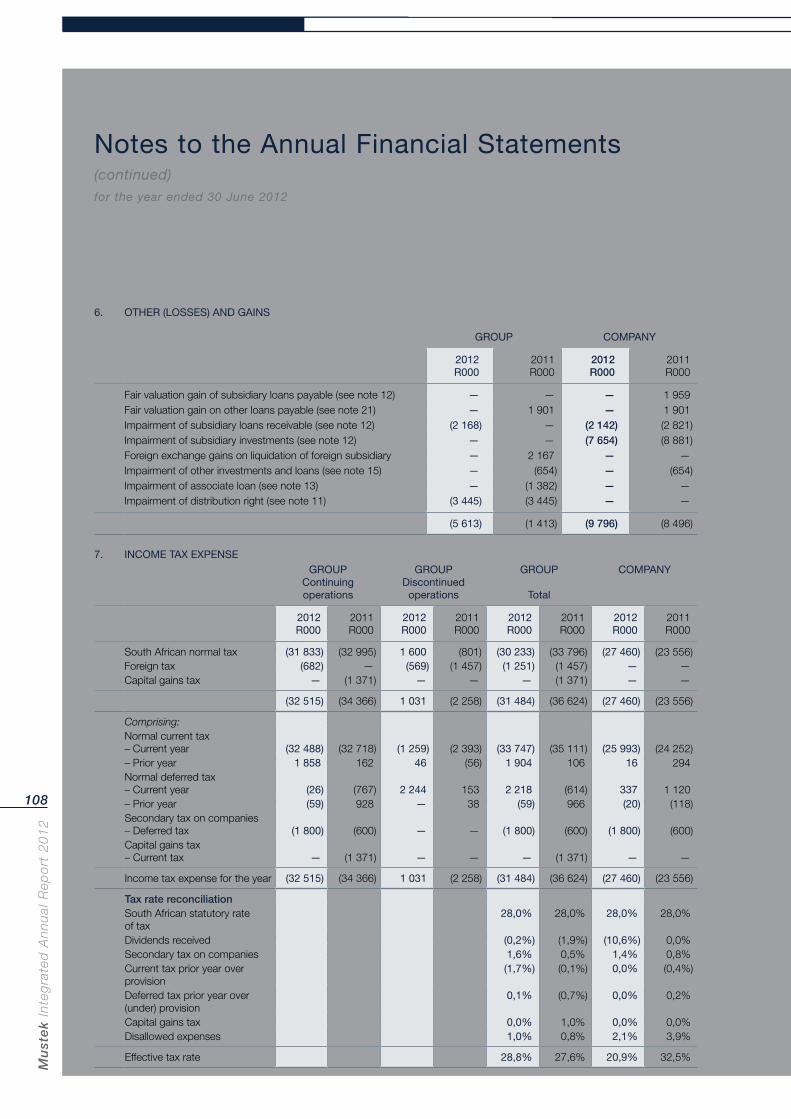
Mu
ste
k In
teg
rate
d A
nn
ual
Rep
ort
20
12
108
Notes to the Annual Financial Statements (continued)for the year ended 30 June 2012
6. OTHER (LOSSES) AND GAINS
GROUP COMPANY
2012R000
2011R000
2012R000
2011R000
Fair valuation gain of subsidiary loans payable (see note 12) — — — 1 959Fair valuation gain on other loans payable (see note 21) — 1 901 — 1 901Impairment of subsidiary loans receivable (see note 12) (2 168) — (2 142) (2 821)Impairment of subsidiary investments (see note 12) — — (7 654) (8 881)Foreign exchange gains on liquidation of foreign subsidiary — 2 167 — —Impairment of other investments and loans (see note 15) — (654) — (654)Impairment of associate loan (see note 13) — (1 382) — —Impairment of distribution right (see note 11) (3 445) (3 445) — —
(5 613) (1 413) (9 796) (8 496)
7. INCOME TAX EXPENSEGROUP
Continuing operations
GROUPDiscontinued
operations
GROUP
Total
COMPANY
2012R000
2011R000
2012R000
2011R000
2012R000
2011R000
2012R000
2011R000
South African normal tax (31 833) (32 995) 1 600 (801) (30 233) (33 796) (27 460) (23 556)Foreign tax (682) — (569) (1 457) (1 251) (1 457) — —Capital gains tax — (1 371) — — — (1 371) — —
(32 515) (34 366) 1 031 (2 258) (31 484) (36 624) (27 460) (23 556)
Comprising:Normal current tax – Current year (32 488) (32 718) (1 259) (2 393) (33 747) (35 111) (25 993) (24 252)– Prior year 1 858 162 46 (56) 1 904 106 16 294Normal deferred tax – Current year (26) (767) 2 244 153 2 218 (614) 337 1 120– Prior year (59) 928 — 38 (59) 966 (20) (118)Secondary tax on companies – Deferred tax (1 800) (600) — — (1 800) (600) (1 800) (600)Capital gains tax – Current tax — (1 371) — — — (1 371) — —
Income tax expense for the year (32 515) (34 366) 1 031 (2 258) (31 484) (36 624) (27 460) (23 556)
Tax rate reconciliationSouth African statutory rate of tax
28,0% 28,0% 28,0% 28,0%
Dividends received (0,2%) (1,9%) (10,6%) 0,0%Secondary tax on companies 1,6% 0,5% 1,4% 0,8%Current tax prior year over provision
(1,7%) (0,1%) 0,0% (0,4%)
Deferred tax prior year over (under) provision
0,1% (0,7%) 0,0% 0,2%
Capital gains tax 0,0% 1,0% 0,0% 0,0%Disallowed expenses 1,0% 0,8% 2,1% 3,9%
Effective tax rate 28,8% 27,6% 20,9% 32,5%
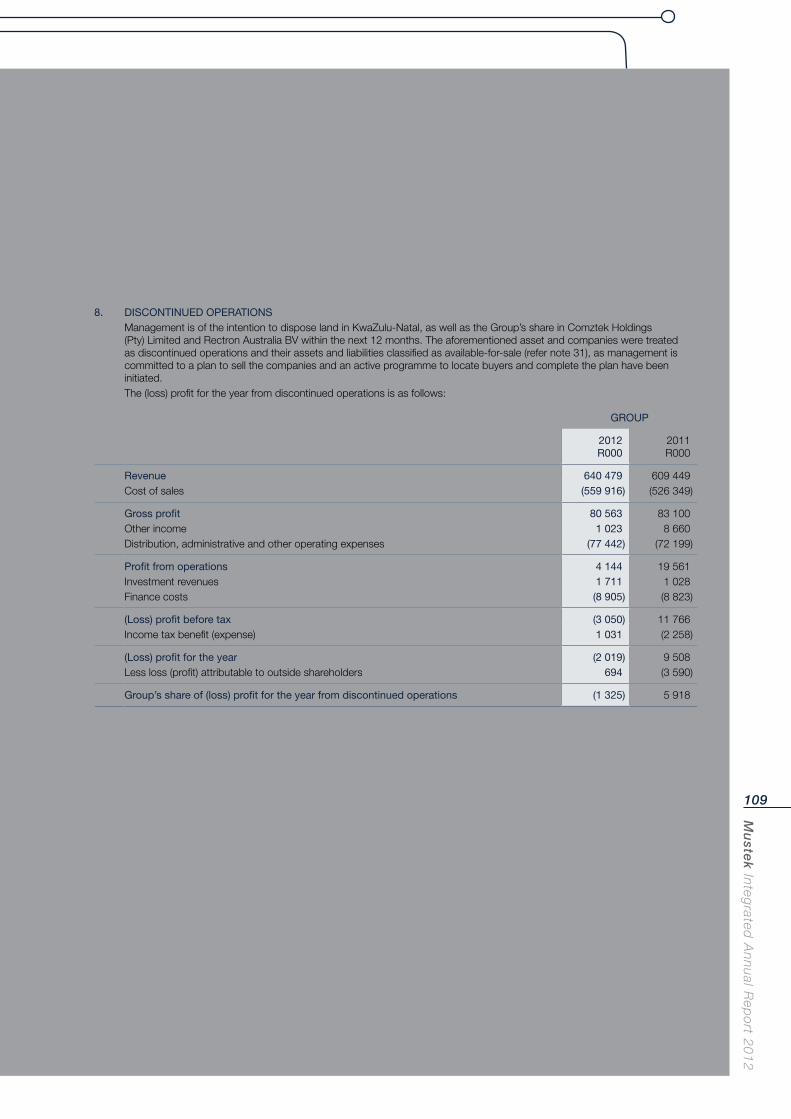
Mu
stek In
tegrated
An
nu
al Rep
ort 2
01
2
109
8. DISCONTINUED OPERATIONSManagement is of the intention to dispose land in KwaZulu-Natal, as well as the Group’s share in Comztek Holdings (Pty) Limited and Rectron Australia BV within the next 12 months. The aforementioned asset and companies were treated as discontinued operations and their assets and liabilities classified as available-for-sale (refer note 31), as management is committed to a plan to sell the companies and an active programme to locate buyers and complete the plan have been initiated.The (loss) profit for the year from discontinued operations is as follows:
GROUP
2012R000
2011R000
Revenue 640 479 609 449Cost of sales (559 916) (526 349)
Gross profit 80 563 83 100Other income 1 023 8 660Distribution, administrative and other operating expenses (77 442) (72 199)
Profit from operations 4 144 19 561Investment revenues 1 711 1 028Finance costs (8 905) (8 823)
(Loss) profit before tax (3 050) 11 766Income tax benefit (expense) 1 031 (2 258)
(Loss) profit for the year (2 019) 9 508Less loss (profit) attributable to outside shareholders 694 (3 590)
Group’s share of (loss) profit for the year from discontinued operations (1 325) 5 918
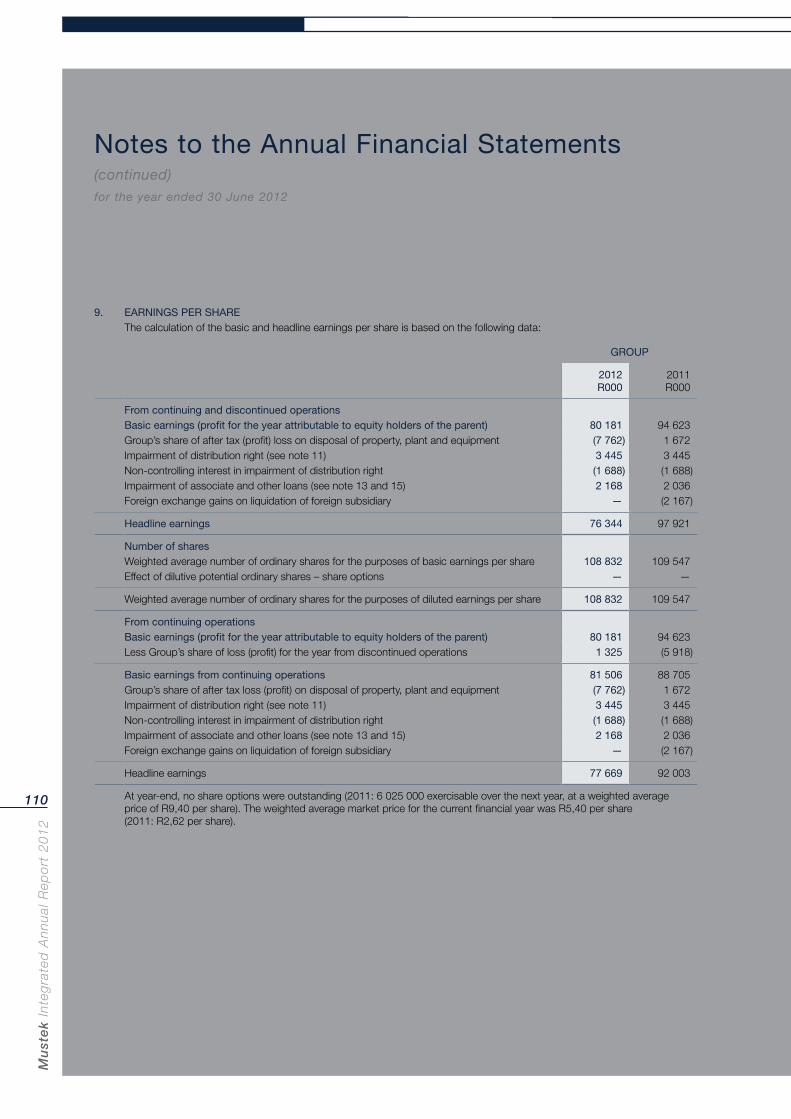
Mu
ste
k In
teg
rate
d A
nn
ual
Rep
ort
20
12
110
Notes to the Annual Financial Statements (continued)for the year ended 30 June 2012
9. EARNINGS PER SHAREThe calculation of the basic and headline earnings per share is based on the following data:
GROUP
2012R000
2011R000
From continuing and discontinued operationsBasic earnings (profit for the year attributable to equity holders of the parent) 80 181 94 623Group’s share of after tax (profit) loss on disposal of property, plant and equipment (7 762) 1 672Impairment of distribution right (see note 11) 3 445 3 445Non-controlling interest in impairment of distribution right (1 688) (1 688)Impairment of associate and other loans (see note 13 and 15) 2 168 2 036Foreign exchange gains on liquidation of foreign subsidiary — (2 167)
Headline earnings 76 344 97 921
Number of shares Weighted average number of ordinary shares for the purposes of basic earnings per share 108 832 109 547Effect of dilutive potential ordinary shares – share options — —
Weighted average number of ordinary shares for the purposes of diluted earnings per share 108 832 109 547
From continuing operationsBasic earnings (profit for the year attributable to equity holders of the parent) 80 181 94 623Less Group’s share of loss (profit) for the year from discontinued operations 1 325 (5 918)
Basic earnings from continuing operations 81 506 88 705Group’s share of after tax loss (profit) on disposal of property, plant and equipment (7 762) 1 672Impairment of distribution right (see note 11) 3 445 3 445Non-controlling interest in impairment of distribution right (1 688) (1 688)Impairment of associate and other loans (see note 13 and 15) 2 168 2 036Foreign exchange gains on liquidation of foreign subsidiary — (2 167)
Headline earnings 77 669 92 003
At year-end, no share options were outstanding (2011: 6 025 000 exercisable over the next year, at a weighted average price of R9,40 per share). The weighted average market price for the current financial year was R5,40 per share (2011: R2,62 per share).
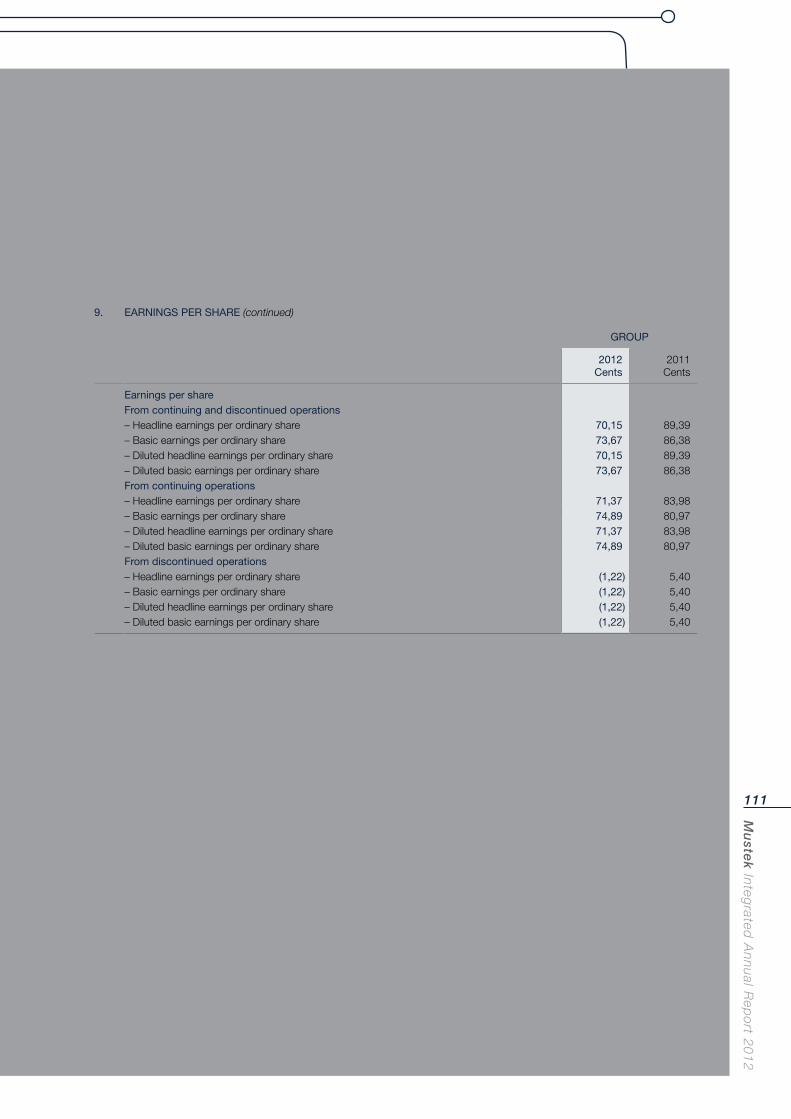
Mu
stek In
tegrated
An
nu
al Rep
ort 2
01
2
111
9. EARNINGS PER SHARE (continued)
GROUP
2012Cents
2011Cents
Earnings per shareFrom continuing and discontinued operations– Headline earnings per ordinary share 70,15 89,39– Basic earnings per ordinary share 73,67 86,38– Diluted headline earnings per ordinary share 70,15 89,39– Diluted basic earnings per ordinary share 73,67 86,38From continuing operations– Headline earnings per ordinary share 71,37 83,98– Basic earnings per ordinary share 74,89 80,97– Diluted headline earnings per ordinary share 71,37 83,98– Diluted basic earnings per ordinary share 74,89 80,97From discontinued operations– Headline earnings per ordinary share (1,22) 5,40– Basic earnings per ordinary share (1,22) 5,40– Diluted headline earnings per ordinary share (1,22) 5,40– Diluted basic earnings per ordinary share (1,22) 5,40
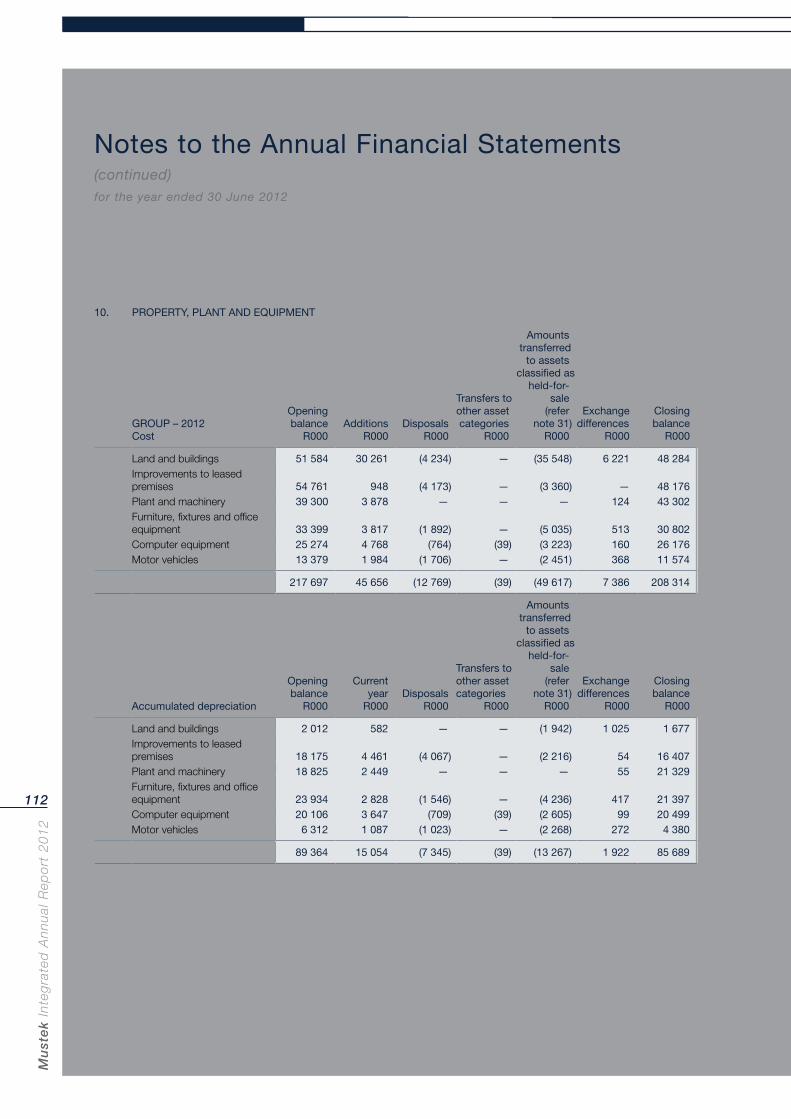
Mu
ste
k In
teg
rate
d A
nn
ual
Rep
ort
20
12
112
Notes to the Annual Financial Statements (continued)for the year ended 30 June 2012
10. PROPERTY, PLANT AND EQUIPMENT
GROUP – 2012Cost
Opening balance
R000Additions
R000Disposals
R000
Transfers to other asset categories
R000
Amounts transferred
to assets classified as
held-for-sale
(refer note 31)
R000
Exchange differences
R000
Closing balance
R000
Land and buildings 51 584 30 261 (4 234) — (35 548) 6 221 48 284Improvements to leased premises 54 761 948 (4 173) — (3 360) — 48 176Plant and machinery 39 300 3 878 — — — 124 43 302Furniture, fixtures and office equipment 33 399 3 817 (1 892) — (5 035) 513 30 802Computer equipment 25 274 4 768 (764) (39) (3 223) 160 26 176Motor vehicles 13 379 1 984 (1 706) — (2 451) 368 11 574
217 697 45 656 (12 769) (39) (49 617) 7 386 208 314
Accumulated depreciation
Opening balance
R000
Current yearR000
DisposalsR000
Transfers to other asset categories
R000
Amounts transferred
to assets classified as
held-for- sale
(refer note 31)
R000
Exchange differences
R000
Closing balance
R000
Land and buildings 2 012 582 — — (1 942) 1 025 1 677Improvements to leased premises 18 175 4 461 (4 067) — (2 216) 54 16 407Plant and machinery 18 825 2 449 — — — 55 21 329Furniture, fixtures and office equipment 23 934 2 828 (1 546) — (4 236) 417 21 397Computer equipment 20 106 3 647 (709) (39) (2 605) 99 20 499Motor vehicles 6 312 1 087 (1 023) — (2 268) 272 4 380
89 364 15 054 (7 345) (39) (13 267) 1 922 85 689
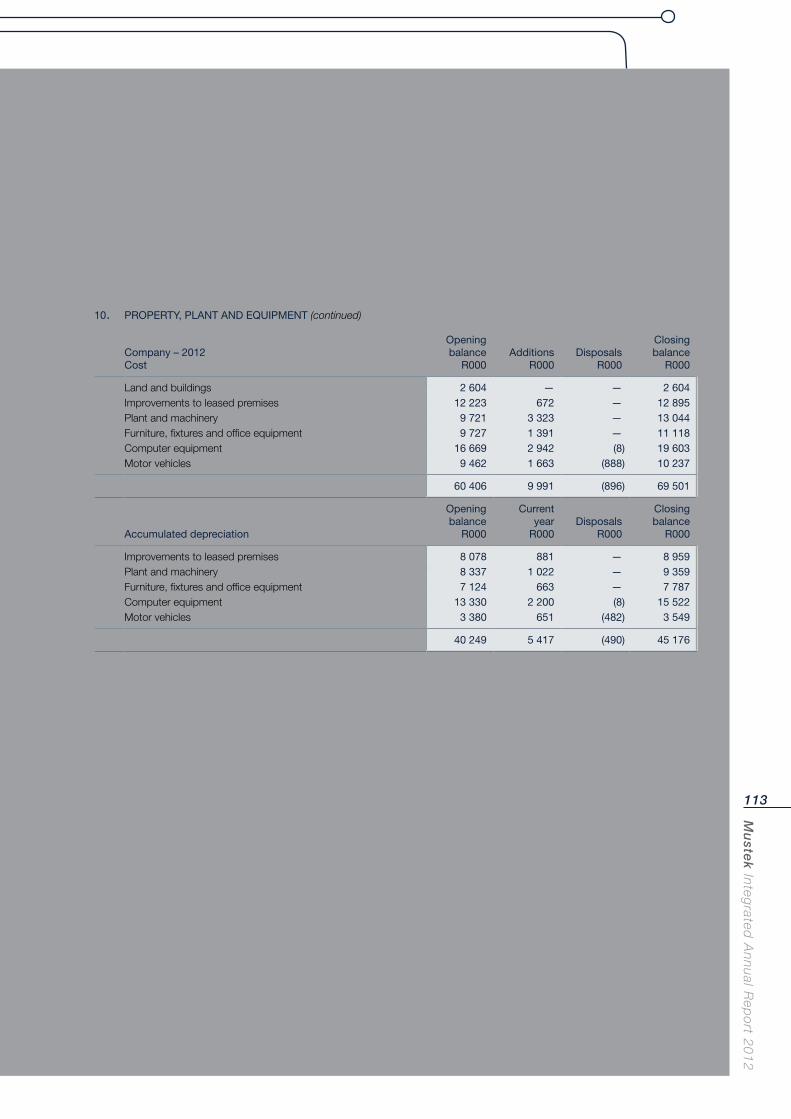
Mu
stek In
tegrated
An
nu
al Rep
ort 2
01
2
113
10. PROPERTY, PLANT AND EQUIPMENT (continued)
Company – 2012Cost
Opening balance
R000Additions
R000Disposals
R000
Closing balance
R000
Land and buildings 2 604 — — 2 604Improvements to leased premises 12 223 672 — 12 895Plant and machinery 9 721 3 323 — 13 044Furniture, fixtures and office equipment 9 727 1 391 — 11 118Computer equipment 16 669 2 942 (8) 19 603Motor vehicles 9 462 1 663 (888) 10 237
60 406 9 991 (896) 69 501
Accumulated depreciation
Opening balance
R000
Current year
R000Disposals
R000
Closing balance
R000
Improvements to leased premises 8 078 881 — 8 959Plant and machinery 8 337 1 022 — 9 359Furniture, fixtures and office equipment 7 124 663 — 7 787Computer equipment 13 330 2 200 (8) 15 522Motor vehicles 3 380 651 (482) 3 549
40 249 5 417 (490) 45 176
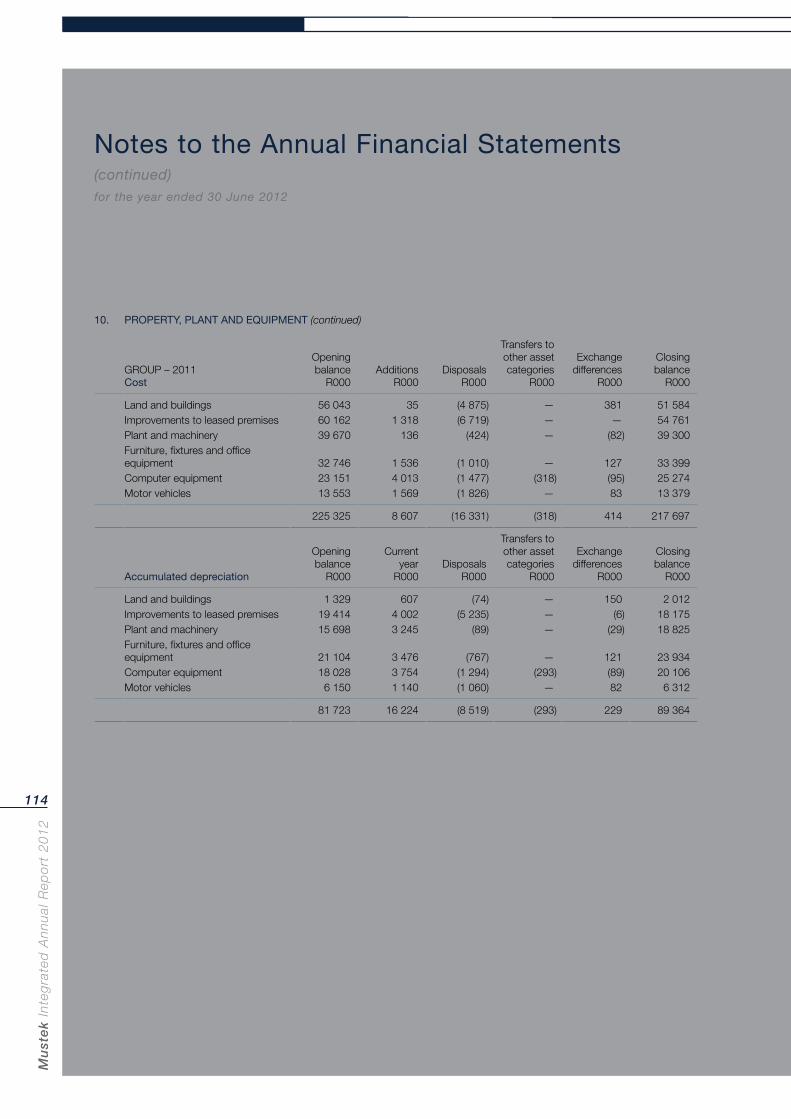
Mu
ste
k In
teg
rate
d A
nn
ual
Rep
ort
20
12
114
Notes to the Annual Financial Statements (continued)for the year ended 30 June 2012
10. PROPERTY, PLANT AND EQUIPMENT (continued)
GROUP – 2011Cost
Opening balance
R000Additions
R000Disposals
R000
Transfers to other asset categories
R000
Exchange differences
R000
Closing balance
R000
Land and buildings 56 043 35 (4 875) — 381 51 584Improvements to leased premises 60 162 1 318 (6 719) — — 54 761Plant and machinery 39 670 136 (424) — (82) 39 300Furniture, fixtures and office equipment 32 746 1 536 (1 010) — 127 33 399Computer equipment 23 151 4 013 (1 477) (318) (95) 25 274Motor vehicles 13 553 1 569 (1 826) — 83 13 379
225 325 8 607 (16 331) (318) 414 217 697
Accumulated depreciation
Opening balance
R000
Current year
R000Disposals
R000
Transfers to other asset
categoriesR000
Exchange differences
R000
Closing balance
R000
Land and buildings 1 329 607 (74) — 150 2 012Improvements to leased premises 19 414 4 002 (5 235) — (6) 18 175Plant and machinery 15 698 3 245 (89) — (29) 18 825Furniture, fixtures and office equipment 21 104 3 476 (767) — 121 23 934Computer equipment 18 028 3 754 (1 294) (293) (89) 20 106Motor vehicles 6 150 1 140 (1 060) — 82 6 312
81 723 16 224 (8 519) (293) 229 89 364
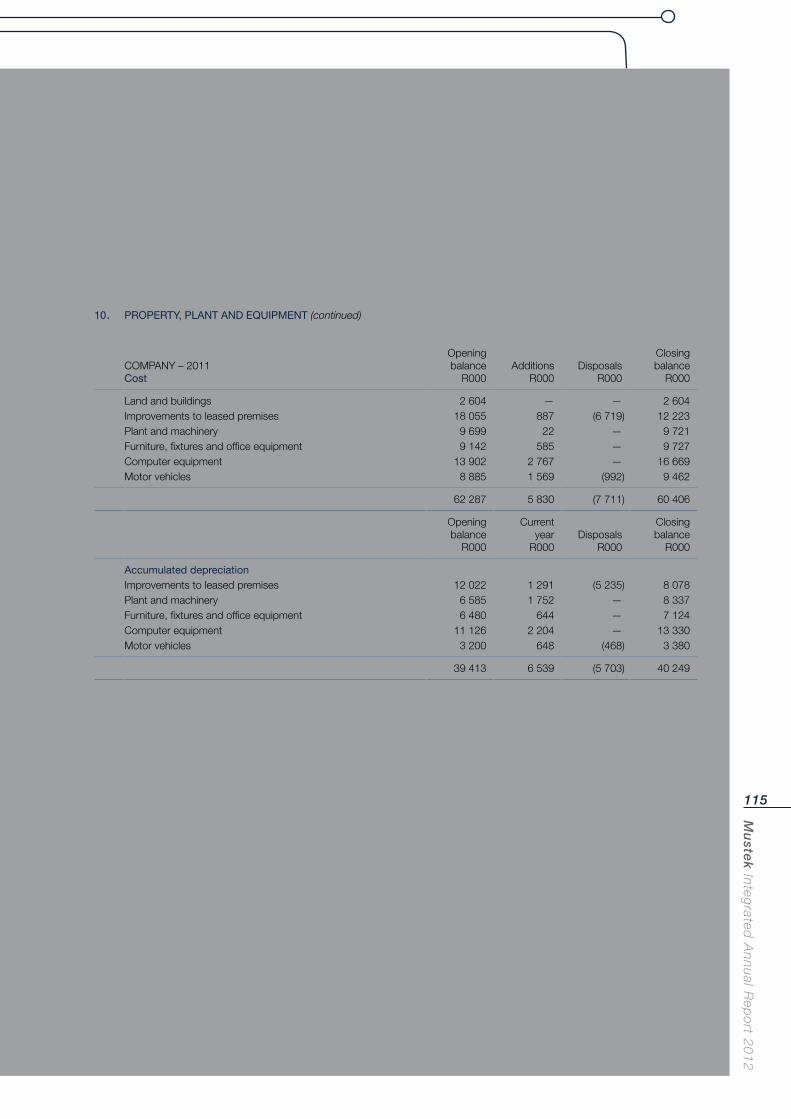
Mu
stek In
tegrated
An
nu
al Rep
ort 2
01
2
115
10. PROPERTY, PLANT AND EQUIPMENT (continued)
COMPANY – 2011Cost
Opening balance
R000Additions
R000Disposals
R000
Closing balance
R000
Land and buildings 2 604 — — 2 604Improvements to leased premises 18 055 887 (6 719) 12 223Plant and machinery 9 699 22 — 9 721Furniture, fixtures and office equipment 9 142 585 — 9 727Computer equipment 13 902 2 767 — 16 669Motor vehicles 8 885 1 569 (992) 9 462
62 287 5 830 (7 711) 60 406
Opening balance
R000
Current yearR000
DisposalsR000
Closing balance
R000
Accumulated depreciationImprovements to leased premises 12 022 1 291 (5 235) 8 078Plant and machinery 6 585 1 752 — 8 337Furniture, fixtures and office equipment 6 480 644 — 7 124Computer equipment 11 126 2 204 — 13 330Motor vehicles 3 200 648 (468) 3 380
39 413 6 539 (5 703) 40 249
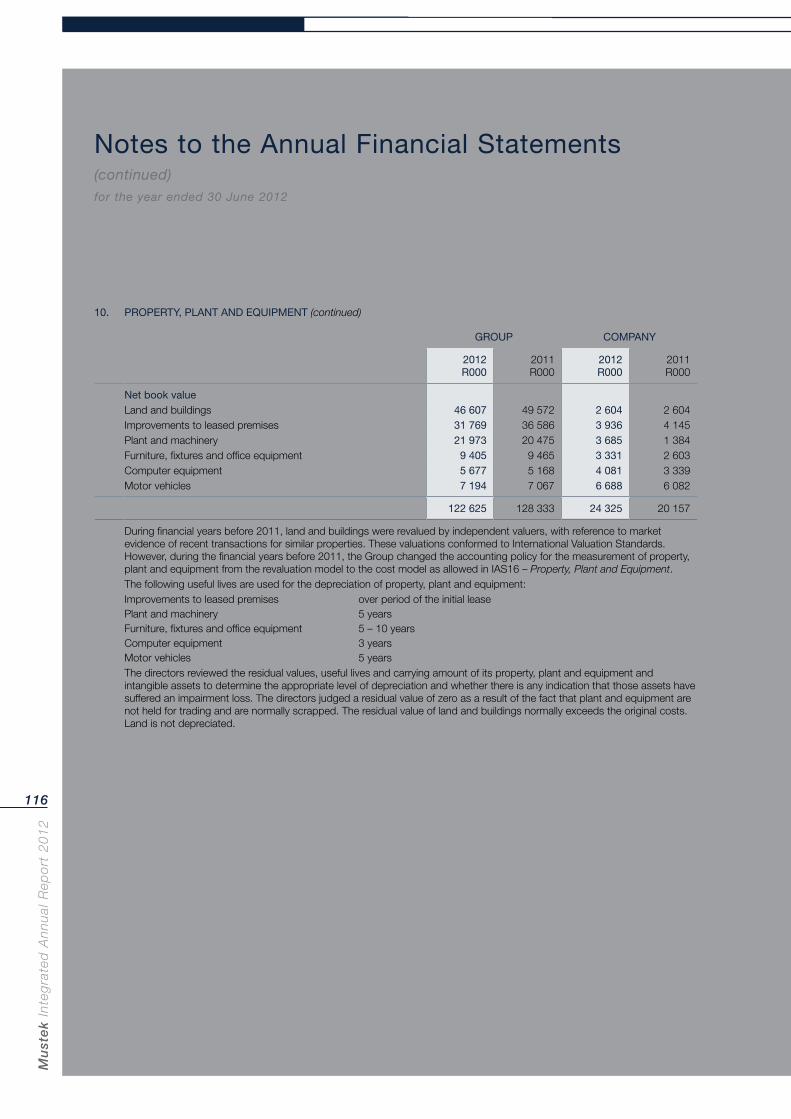
Mu
ste
k In
teg
rate
d A
nn
ual
Rep
ort
20
12
116
Notes to the Annual Financial Statements (continued)for the year ended 30 June 2012
10. PROPERTY, PLANT AND EQUIPMENT (continued)
GROUP COMPANY
2012R000
2011R000
2012R000
2011R000
Net book valueLand and buildings 46 607 49 572 2 604 2 604Improvements to leased premises 31 769 36 586 3 936 4 145Plant and machinery 21 973 20 475 3 685 1 384Furniture, fixtures and office equipment 9 405 9 465 3 331 2 603Computer equipment 5 677 5 168 4 081 3 339Motor vehicles 7 194 7 067 6 688 6 082
122 625 128 333 24 325 20 157
During financial years before 2011, land and buildings were revalued by independent valuers, with reference to market evidence of recent transactions for similar properties. These valuations conformed to International Valuation Standards.However, during the financial years before 2011, the Group changed the accounting policy for the measurement of property, plant and equipment from the revaluation model to the cost model as allowed in IAS16 – Property, Plant and Equipment.The following useful lives are used for the depreciation of property, plant and equipment:Improvements to leased premises over period of the initial leasePlant and machinery 5 yearsFurniture, fixtures and office equipment 5 – 10 yearsComputer equipment 3 yearsMotor vehicles 5 yearsThe directors reviewed the residual values, useful lives and carrying amount of its property, plant and equipment and intangible assets to determine the appropriate level of depreciation and whether there is any indication that those assets have suffered an impairment loss. The directors judged a residual value of zero as a result of the fact that plant and equipment are not held for trading and are normally scrapped. The residual value of land and buildings normally exceeds the original costs. Land is not depreciated.
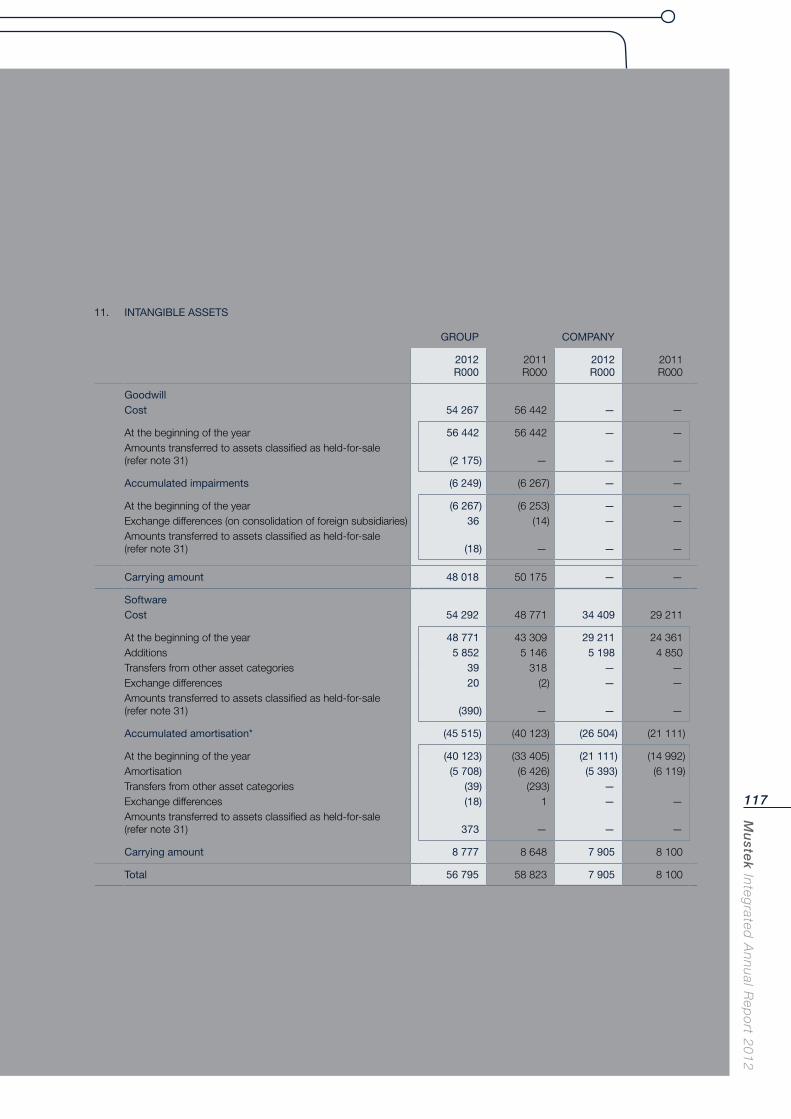
Mu
stek In
tegrated
An
nu
al Rep
ort 2
01
2
117
11. INTANGIBLE ASSETS
GROUP COMPANY
2012R000
2011R000
2012R000
2011R000
GoodwillCost 54 267 56 442 — —
At the beginning of the year 56 442 56 442 — —Amounts transferred to assets classified as held-for-sale (refer note 31) (2 175) — — —
Accumulated impairments (6 249) (6 267) — —
At the beginning of the year (6 267) (6 253) — —Exchange differences (on consolidation of foreign subsidiaries) 36 (14) — —Amounts transferred to assets classified as held-for-sale (refer note 31) (18) — — —
Carrying amount 48 018 50 175 — —
SoftwareCost 54 292 48 771 34 409 29 211
At the beginning of the year 48 771 43 309 29 211 24 361Additions 5 852 5 146 5 198 4 850Transfers from other asset categories 39 318 — —Exchange differences 20 (2) — —Amounts transferred to assets classified as held-for-sale (refer note 31) (390) — — —
Accumulated amortisation* (45 515) (40 123) (26 504) (21 111)
At the beginning of the year (40 123) (33 405) (21 111) (14 992)Amortisation (5 708) (6 426) (5 393) (6 119)Transfers from other asset categories (39) (293) —Exchange differences (18) 1 — —Amounts transferred to assets classified as held-for-sale (refer note 31) 373 — — —
Carrying amount 8 777 8 648 7 905 8 100
Total 56 795 58 823 7 905 8 100
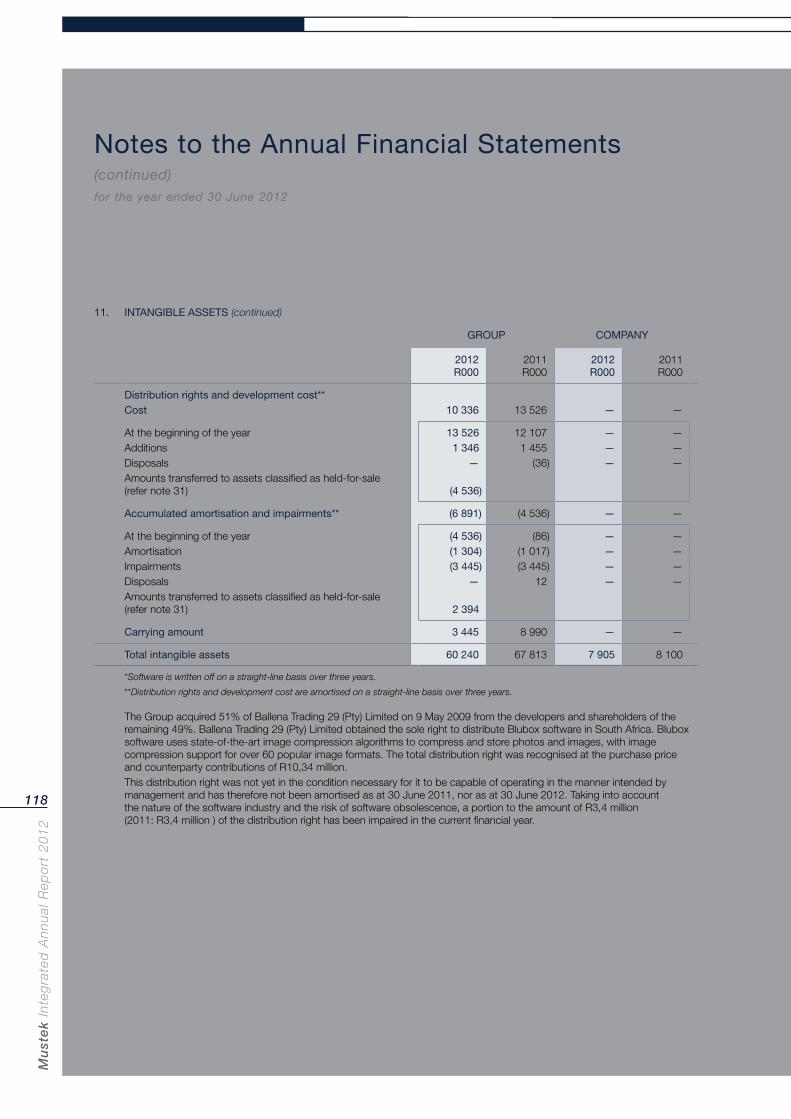
Mu
ste
k In
teg
rate
d A
nn
ual
Rep
ort
20
12
118
Notes to the Annual Financial Statements (continued)for the year ended 30 June 2012
11. INTANGIBLE ASSETS (continued)
GROUP COMPANY
2012R000
2011R000
2012R000
2011R000
Distribution rights and development cost**Cost 10 336 13 526 — —
At the beginning of the year 13 526 12 107 — —Additions 1 346 1 455 — —Disposals — (36) — —Amounts transferred to assets classified as held-for-sale (refer note 31) (4 536)
Accumulated amortisation and impairments** (6 891) (4 536) — —
At the beginning of the year (4 536) (86) — —Amortisation (1 304) (1 017) — —Impairments (3 445) (3 445) — —Disposals — 12 — —Amounts transferred to assets classified as held-for-sale (refer note 31) 2 394
Carrying amount 3 445 8 990 — —
Total intangible assets 60 240 67 813 7 905 8 100
*Software is written off on a straight-line basis over three years.
**Distribution rights and development cost are amortised on a straight-line basis over three years.
The Group acquired 51% of Ballena Trading 29 (Pty) Limited on 9 May 2009 from the developers and shareholders of the remaining 49%. Ballena Trading 29 (Pty) Limited obtained the sole right to distribute Blubox software in South Africa. Blubox software uses state-of-the-art image compression algorithms to compress and store photos and images, with image compression support for over 60 popular image formats. The total distribution right was recognised at the purchase price and counterparty contributions of R10,34 million.This distribution right was not yet in the condition necessary for it to be capable of operating in the manner intended by management and has therefore not been amortised as at 30 June 2011, nor as at 30 June 2012. Taking into account the nature of the software industry and the risk of software obsolescence, a portion to the amount of R3,4 million (2011: R3,4 million ) of the distribution right has been impaired in the current financial year.

Mu
stek In
tegrated
An
nu
al Rep
ort 2
01
2
119
11. INTANGIBLE ASSETS (continued)
GROUP
2012R000
2011R000
The carrying amount of goodwill had been allocated as follows:
Mecer Free State Province 3 205 3 205Brotek 16 069 16 069Mecer East Africa 468 468Netshield — 1 927Comztek Zambia — 230Rectron 27 276 27 276Digital Surveillance Systems 1 000 1 000
48 018 50 175
Goodwill acquired in a business combination is allocated, at acquisition, to the cash generating units that are expected to benefit from that business combination. The Group tests goodwill annually for impairment, or more frequently if there are indications that goodwill might be impaired. The recoverable amounts of the cash generating units were determined from value-in-use calculations. The key assumptions for the value-in-use calculations are those regarding discount rates, expected volume growth rates, and expected changes to selling prices and direct costs. Management estimates discount rates using pre-tax rates that reflect management’s assessment of the time value of money and their views on the risks specific to the cash generating units. The growth rates are based on management experience and their expectations of industry and market share growth. Expectation of changes in gross margins and changes in indirect costs are based on past practices, expectations of future changes in the market and a view on expected inflation rates.Management prepared a five-year cash flow forecast and a perpetual cash flow forecast, based on the 2012 financial year revenue generated by the cash generating units to which goodwill can be attributed and applying a long-term growth rate of 5% (2011: 5%) per annum, gross profit percentage of 14,6% (2011: 14,6%), overheads of 10,1% (2011: 10,1%), capital expenditure of 0,4% (2011: 0,4%), net working capital turnover of 57 days (2011: 57 days) and discounted at a rate of 12,5% (2011:14,5%). The net present value of these cash flows was found to exceed the carrying amount of goodwill and therefore the goodwill is not expected to be impaired.On 8 June 2007, Mustek acquired the remaining 34,2% of Rectron Limited (Rectron). The agreed purchase price between the parties is based on the best estimate profit target for Rectron over a five-year period with the first cash payment of R49,8 million made on 3 July 2007. The potential further consideration will be a minimum of R10 million, if the cumulative net profit before tax of Rectron over the five-year period is above R100 million, with a maximum further consideration of R75,2 million. No further consideration is payable if the cumulative net profit before tax is below R100 million over the five-year period. The best estimate purchase price has been recorded at the date of sale with the difference between this purchase price and the outside shareholder interest acquired, being recorded as goodwill. The unpaid portion of the best estimate purchase price is regarded as a fair value through profit or loss financial instrument and with any resultant gain or loss recognised in profit or loss (see note 21). The best estimate purchase price was adjusted by Rnil during the current financial year (2011: decreased by R1,9 million) (refer note 6).During the previous financial year, a further 25% shareholding in Digital Surveillance Systems (Pty) Limited has been acquired at a purchase price of R1,9 million, giving rise to a premium on acquisition of R1,4 million. No further goodwill is raised, as Mustek Limited already had control of Digital Surveillance Systems (Pty) Limited before the acquisition of the additional shareholding.
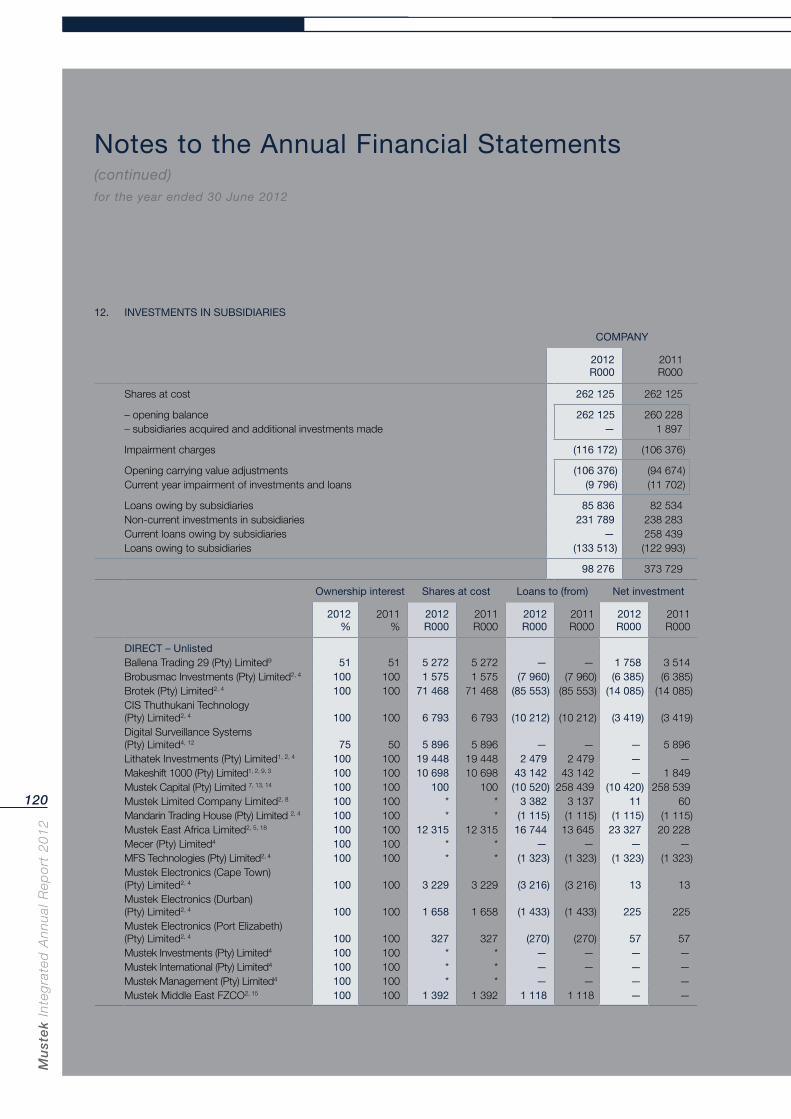
Mu
ste
k In
teg
rate
d A
nn
ual
Rep
ort
20
12
120
Notes to the Annual Financial Statements (continued)for the year ended 30 June 2012
12. INVESTMENTS IN SUBSIDIARIES
COMPANY
2012R000
2011R000
Shares at cost 262 125 262 125
– opening balance 262 125 260 228– subsidiaries acquired and additional investments made — 1 897
Impairment charges (116 172) (106 376)
Opening carrying value adjustments (106 376) (94 674)Current year impairment of investments and loans (9 796) (11 702)
Loans owing by subsidiaries 85 836 82 534Non-current investments in subsidiaries 231 789 238 283Current loans owing by subsidiaries — 258 439Loans owing to subsidiaries (133 513) (122 993)
98 276 373 729
Ownership interest Shares at cost Loans to (from) Net investment
2012%
2011%
2012R000
2011R000
2012R000
2011R000
2012R000
2011R000
DIRECT – UnlistedBallena Trading 29 (Pty) Limited9 51 51 5 272 5 272 — — 1 758 3 514Brobusmac Investments (Pty) Limited2, 4 100 100 1 575 1 575 (7 960) (7 960) (6 385) (6 385)Brotek (Pty) Limited2, 4 100 100 71 468 71 468 (85 553) (85 553) (14 085) (14 085)CIS Thuthukani Technology (Pty) Limited2, 4 100 100 6 793 6 793 (10 212) (10 212) (3 419) (3 419)Digital Surveillance Systems (Pty) Limited4, 12 75 50 5 896 5 896 — — — 5 896Lithatek Investments (Pty) Limited1, 2, 4 100 100 19 448 19 448 2 479 2 479 — —Makeshift 1000 (Pty) Limited1, 2, 9, 3 100 100 10 698 10 698 43 142 43 142 — 1 849Mustek Capital (Pty) Limited 7, 13, 14 100 100 100 100 (10 520) 258 439 (10 420) 258 539Mustek Limited Company Limited2, 8 100 100 * * 3 382 3 137 11 60Mandarin Trading House (Pty) Limited 2, 4 100 100 * * (1 115) (1 115) (1 115) (1 115)Mustek East Africa Limited2, 5, 18 100 100 12 315 12 315 16 744 13 645 23 327 20 228Mecer (Pty) Limited4 100 100 * * — — — —MFS Technologies (Pty) Limited2, 4 100 100 * * (1 323) (1 323) (1 323) (1 323)Mustek Electronics (Cape Town) (Pty) Limited2, 4 100 100 3 229 3 229 (3 216) (3 216) 13 13Mustek Electronics (Durban) (Pty) Limited2, 4 100 100 1 658 1 658 (1 433) (1 433) 225 225Mustek Electronics (Port Elizabeth) (Pty) Limited2, 4 100 100 327 327 (270) (270) 57 57Mustek Investments (Pty) Limited4 100 100 * * — — — —Mustek International (Pty) Limited4 100 100 * * — — — —Mustek Management (Pty) Limited4 100 100 * * — — — —Mustek Middle East FZCO2, 15 100 100 1 392 1 392 1 118 1 118 — —
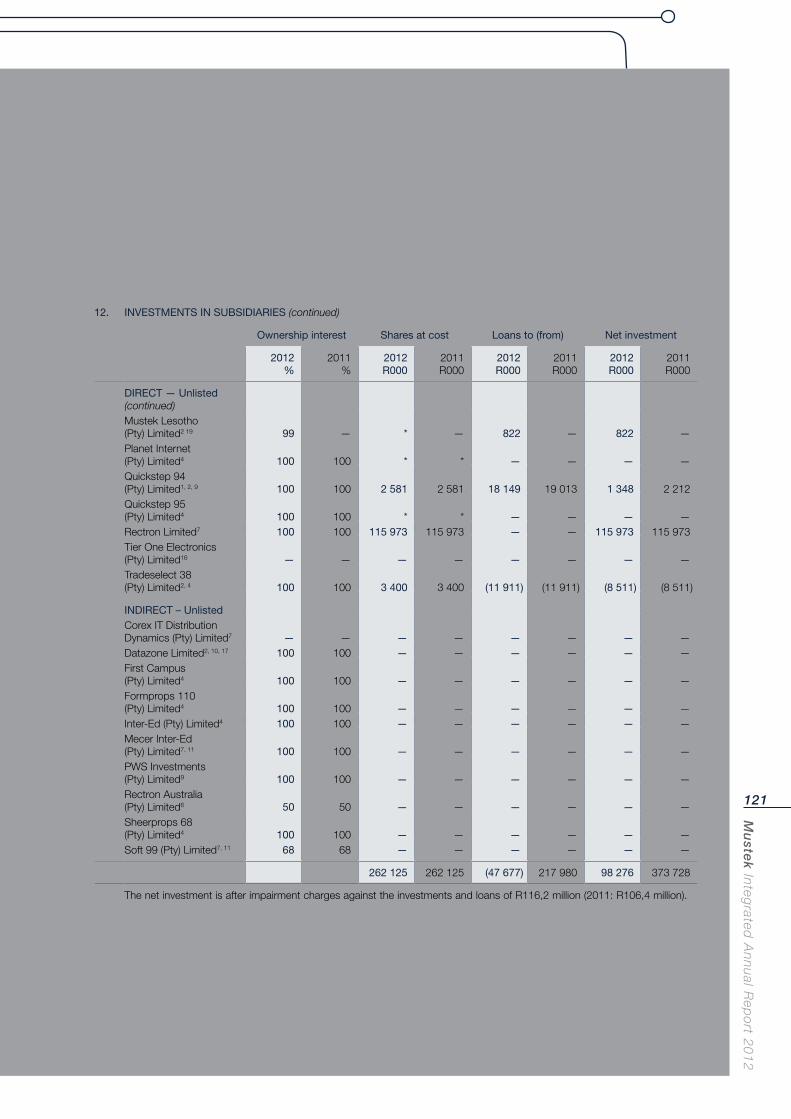
Mu
stek In
tegrated
An
nu
al Rep
ort 2
01
2
121
12. INVESTMENTS IN SUBSIDIARIES (continued)
Ownership interest Shares at cost Loans to (from) Net investment
2012%
2011%
2012R000
2011R000
2012R000
2011R000
2012R000
2011R000
DIRECT — Unlisted (continued)Mustek Lesotho (Pty) Limited2 19 99 — * — 822 — 822 —Planet Internet (Pty) Limited4 100 100 * * — — — —Quickstep 94 (Pty) Limited1, 2, 9 100 100 2 581 2 581 18 149 19 013 1 348 2 212Quickstep 95 (Pty) Limited4 100 100 * * — — — —Rectron Limited7 100 100 115 973 115 973 — — 115 973 115 973Tier One Electronics (Pty) Limited16 — — — — — — — —Tradeselect 38 (Pty) Limited2, 4 100 100 3 400 3 400 (11 911) (11 911) (8 511) (8 511)
INDIRECT – UnlistedCorex IT Distribution Dynamics (Pty) Limited7 — — — — — — — —Datazone Limited2, 10, 17 100 100 — — — — — —First Campus (Pty) Limited4 100 100 — — — — — —Formprops 110 (Pty) Limited4 100 100 — — — — — —Inter-Ed (Pty) Limited4 100 100 — — — — — —Mecer Inter-Ed (Pty) Limited7, 11 100 100 — — — — — —PWS Investments (Pty) Limited9 100 100 — — — — — —Rectron Australia (Pty) Limited6 50 50 — — — — — —Sheerprops 68 (Pty) Limited4 100 100 — — — — — —Soft 99 (Pty) Limited7, 11 68 68 — — — — — —
262 125 262 125 (47 677) 217 980 98 276 373 728
The net investment is after impairment charges against the investments and loans of R116,2 million (2011: R106,4 million).
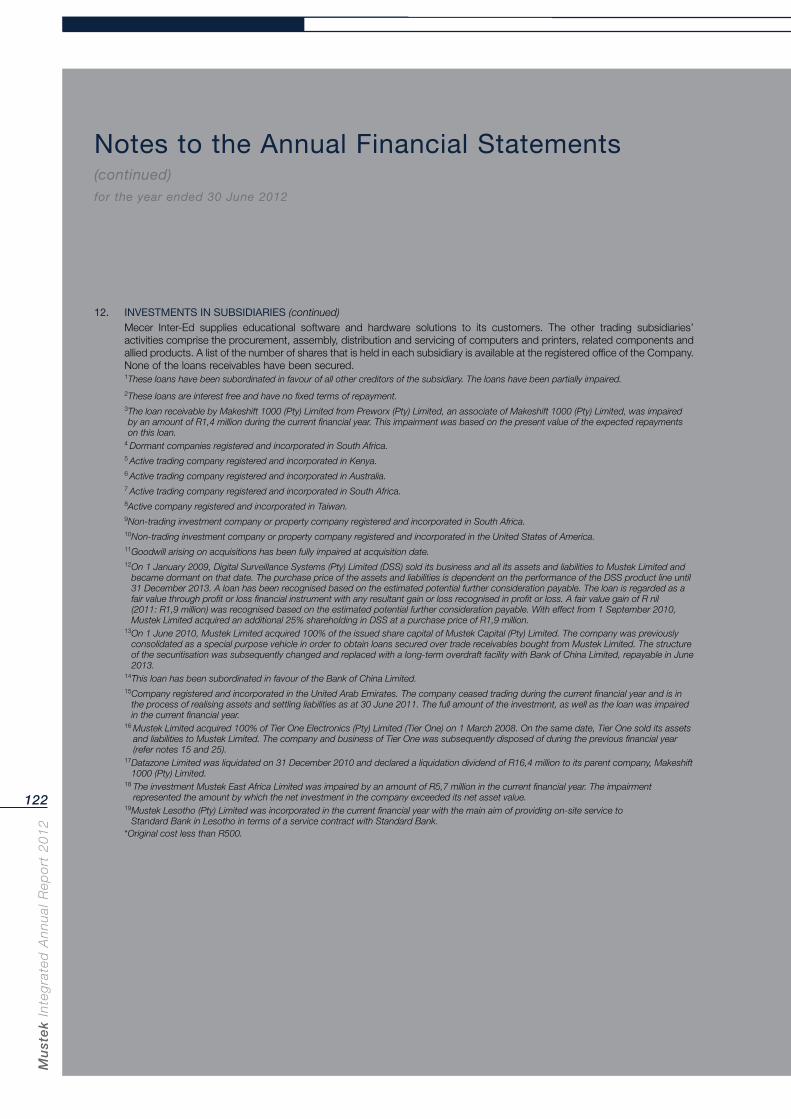
Mu
ste
k In
teg
rate
d A
nn
ual
Rep
ort
20
12
122
Notes to the Annual Financial Statements (continued)for the year ended 30 June 2012
12. INVESTMENTS IN SUBSIDIARIES (continued)Mecer Inter-Ed supplies educational software and hardware solutions to its customers. The other trading subsidiaries’ activities comprise the procurement, assembly, distribution and servicing of computers and printers, related components and allied products. A list of the number of shares that is held in each subsidiary is available at the registered office of the Company. None of the loans receivables have been secured.1These loans have been subordinated in favour of all other creditors of the subsidiary. The loans have been partially impaired.2These loans are interest free and have no fixed terms of repayment.3 The loan receivable by Makeshift 1000 (Pty) Limited from Preworx (Pty) Limited, an associate of Makeshift 1000 (Pty) Limited, was impaired by an amount of R1,4 million during the current financial year. This impairment was based on the present value of the expected repayments on this loan.
4 Dormant companies registered and incorporated in South Africa.5 Active trading company registered and incorporated in Kenya.6 Active trading company registered and incorporated in Australia.7 Active trading company registered and incorporated in South Africa.8Active company registered and incorporated in Taiwan.9Non-trading investment company or property company registered and incorporated in South Africa.10Non-trading investment company or property company registered and incorporated in the United States of America.11Goodwill arising on acquisitions has been fully impaired at acquisition date.12 On 1 January 2009, Digital Surveillance Systems (Pty) Limited (DSS) sold its business and all its assets and liabilities to Mustek Limited and
became dormant on that date. The purchase price of the assets and liabilities is dependent on the performance of the DSS product line until 31 December 2013. A loan has been recognised based on the estimated potential further consideration payable. The loan is regarded as a fair value through profit or loss financial instrument with any resultant gain or loss recognised in profit or loss. A fair value gain of R nil (2011: R1,9 million) was recognised based on the estimated potential further consideration payable. With effect from 1 September 2010, Mustek Limited acquired an additional 25% shareholding in DSS at a purchase price of R1,9 million.
13 On 1 June 2010, Mustek Limited acquired 100% of the issued share capital of Mustek Capital (Pty) Limited. The company was previously consolidated as a special purpose vehicle in order to obtain loans secured over trade receivables bought from Mustek Limited. The structure of the securitisation was subsequently changed and replaced with a long-term overdraft facility with Bank of China Limited, repayable in June 2013.
14This loan has been subordinated in favour of the Bank of China Limited.15 Company registered and incorporated in the United Arab Emirates. The company ceased trading during the current financial year and is in
the process of realising assets and settling liabilities as at 30 June 2011. The full amount of the investment, as well as the loan was impaired in the current financial year.
16 Mustek Limited acquired 100% of Tier One Electronics (Pty) Limited (Tier One) on 1 March 2008. On the same date, Tier One sold its assets and liabilities to Mustek Limited. The company and business of Tier One was subsequently disposed of during the previous financial year (refer notes 15 and 25).
17 Datazone Limited was liquidated on 31 December 2010 and declared a liquidation dividend of R16,4 million to its parent company, Makeshift 1000 (Pty) Limited.
18 The investment Mustek East Africa Limited was impaired by an amount of R5,7 million in the current financial year. The impairment represented the amount by which the net investment in the company exceeded its net asset value.
19 Mustek Lesotho (Pty) Limited was incorporated in the current financial year with the main aim of providing on-site service to Standard Bank in Lesotho in terms of a service contract with Standard Bank.
*Original cost less than R500.
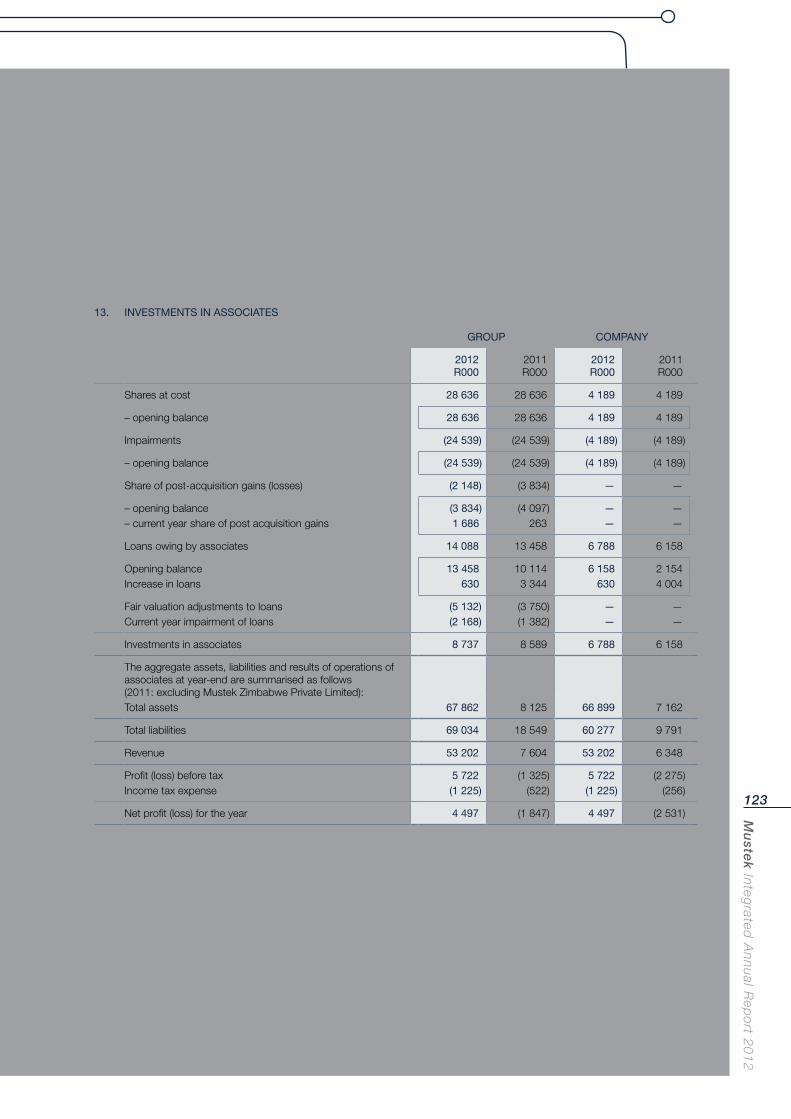
Mu
stek In
tegrated
An
nu
al Rep
ort 2
01
2
123
13. INVESTMENTS IN ASSOCIATES
GROUP COMPANY
2012R000
2011R000
2012R000
2011R000
Shares at cost 28 636 28 636 4 189 4 189
– opening balance 28 636 28 636 4 189 4 189
Impairments (24 539) (24 539) (4 189) (4 189)
– opening balance (24 539) (24 539) (4 189) (4 189)
Share of post-acquisition gains (losses) (2 148) (3 834) — —
– opening balance (3 834) (4 097) — —– current year share of post acquisition gains 1 686 263 — —
Loans owing by associates 14 088 13 458 6 788 6 158
Opening balance 13 458 10 114 6 158 2 154Increase in loans 630 3 344 630 4 004
Fair valuation adjustments to loans (5 132) (3 750) — —Current year impairment of loans (2 168) (1 382) — —
Investments in associates 8 737 8 589 6 788 6 158
The aggregate assets, liabilities and results of operations of associates at year-end are summarised as follows (2011: excluding Mustek Zimbabwe Private Limited):Total assets 67 862 8 125 66 899 7 162
Total liabilities 69 034 18 549 60 277 9 791
Revenue 53 202 7 604 53 202 6 348
Profit (loss) before tax 5 722 (1 325) 5 722 (2 275)Income tax expense (1 225) (522) (1 225) (256)
Net profit (loss) for the year 4 497 (1 847) 4 497 (2 531)
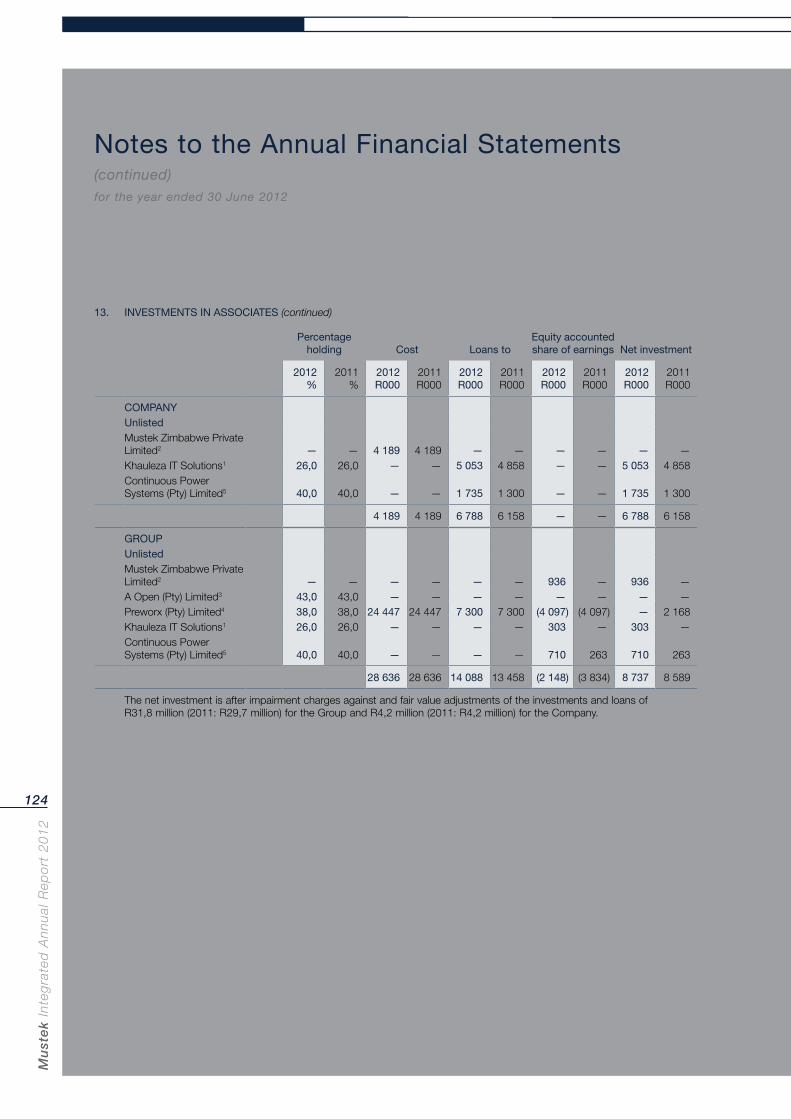
Mu
ste
k In
teg
rate
d A
nn
ual
Rep
ort
20
12
124
Notes to the Annual Financial Statements (continued)for the year ended 30 June 2012
13. INVESTMENTS IN ASSOCIATES (continued)
Percentage holding Cost Loans to
Equity accounted share of earnings Net investment
2012%
2011%
2012R000
2011R000
2012R000
2011R000
2012R000
2011R000
2012R000
2011R000
COMPANYUnlistedMustek Zimbabwe Private Limited2 — — 4 189 4 189 — — — — — —Khauleza IT Solutions1 26,0 26,0 — — 5 053 4 858 — — 5 053 4 858Continuous Power Systems (Pty) Limited5 40,0 40,0 — — 1 735 1 300 — — 1 735 1 300
4 189 4 189 6 788 6 158 — — 6 788 6 158
GROUPUnlistedMustek Zimbabwe Private Limited2 — — — — — — 936 — 936 —A Open (Pty) Limited3 43,0 43,0 — — — — — — — —Preworx (Pty) Limited4 38,0 38,0 24 447 24 447 7 300 7 300 (4 097) (4 097) — 2 168Khauleza IT Solutions1 26,0 26,0 — — — — 303 — 303 —Continuous Power Systems (Pty) Limited5 40,0 40,0 — — — — 710 263 710 263
28 636 28 636 14 088 13 458 (2 148) (3 834) 8 737 8 589
The net investment is after impairment charges against and fair value adjustments of the investments and loans of R31,8 million (2011: R29,7 million) for the Group and R4,2 million (2011: R4,2 million) for the Company.
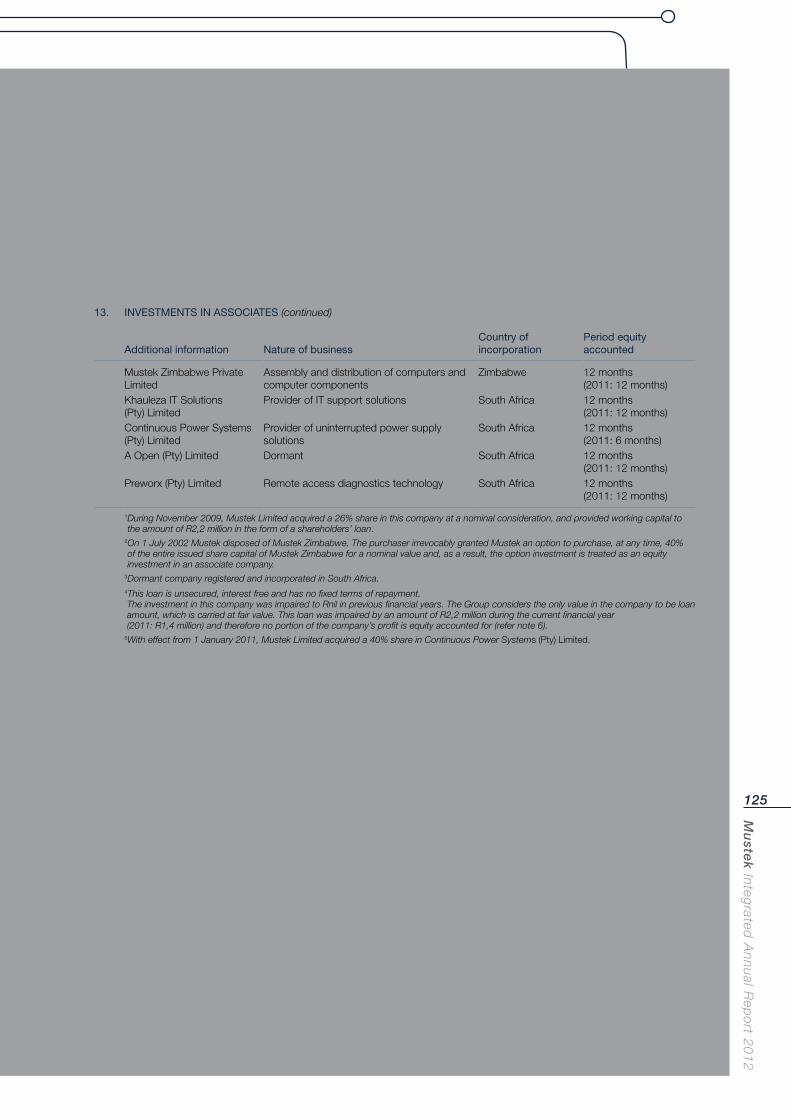
Mu
stek In
tegrated
An
nu
al Rep
ort 2
01
2
125
13. INVESTMENTS IN ASSOCIATES (continued)
Additional information Nature of businessCountry of incorporation
Period equity accounted
Mustek Zimbabwe Private Limited
Assembly and distribution of computers and computer components
Zimbabwe 12 months (2011: 12 months)
Khauleza IT Solutions (Pty) Limited
Provider of IT support solutions South Africa 12 months (2011: 12 months)
Continuous Power Systems (Pty) Limited
Provider of uninterrupted power supply solutions
South Africa 12 months (2011: 6 months)
A Open (Pty) Limited Dormant South Africa 12 months (2011: 12 months)
Preworx (Pty) Limited Remote access diagnostics technology South Africa 12 months (2011: 12 months)
1 During November 2009, Mustek Limited acquired a 26% share in this company at a nominal consideration, and provided working capital to the amount of R2,2 million in the form of a shareholders’ loan.
2 On 1 July 2002 Mustek disposed of Mustek Zimbabwe. The purchaser irrevocably granted Mustek an option to purchase, at any time, 40% of the entire issued share capital of Mustek Zimbabwe for a nominal value and, as a result, the option investment is treated as an equity investment in an associate company.
3 Dormant company registered and incorporated in South Africa.4 This loan is unsecured, interest free and has no fixed terms of repayment. The investment in this company was impaired to Rnil in previous financial years. The Group considers the only value in the company to be loan amount, which is carried at fair value. This loan was impaired by an amount of R2,2 million during the current financial year (2011: R1,4 million) and therefore no portion of the company’s profit is equity accounted for (refer note 6).
5With effect from 1 January 2011, Mustek Limited acquired a 40% share in Continuous Power Systems (Pty) Limited.
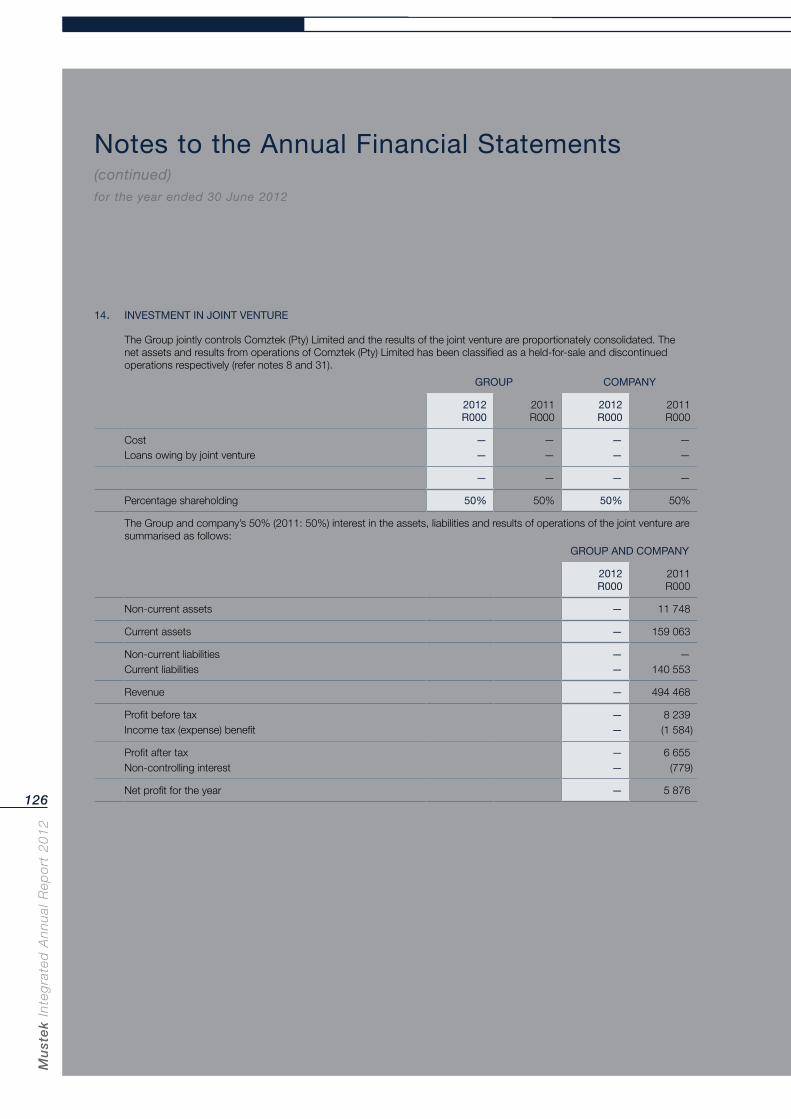
Mu
ste
k In
teg
rate
d A
nn
ual
Rep
ort
20
12
126
Notes to the Annual Financial Statements (continued)for the year ended 30 June 2012
14. INVESTMENT IN JOINT VENTURE
The Group jointly controls Comztek (Pty) Limited and the results of the joint venture are proportionately consolidated. The net assets and results from operations of Comztek (Pty) Limited has been classified as a held-for-sale and discontinued operations respectively (refer notes 8 and 31).
GROUP COMPANY
2012R000
2011R000
2012R000
2011R000
Cost — — — —Loans owing by joint venture — — — —
— — — —
Percentage shareholding 50% 50% 50% 50%
The Group and company’s 50% (2011: 50%) interest in the assets, liabilities and results of operations of the joint venture are summarised as follows:
GROUP AND COMPANY
2012R000
2011R000
Non-current assets — 11 748
Current assets — 159 063
Non-current liabilities — —Current liabilities — 140 553
Revenue — 494 468
Profit before tax — 8 239Income tax (expense) benefit — (1 584)
Profit after tax — 6 655Non-controlling interest — (779)
Net profit for the year — 5 876
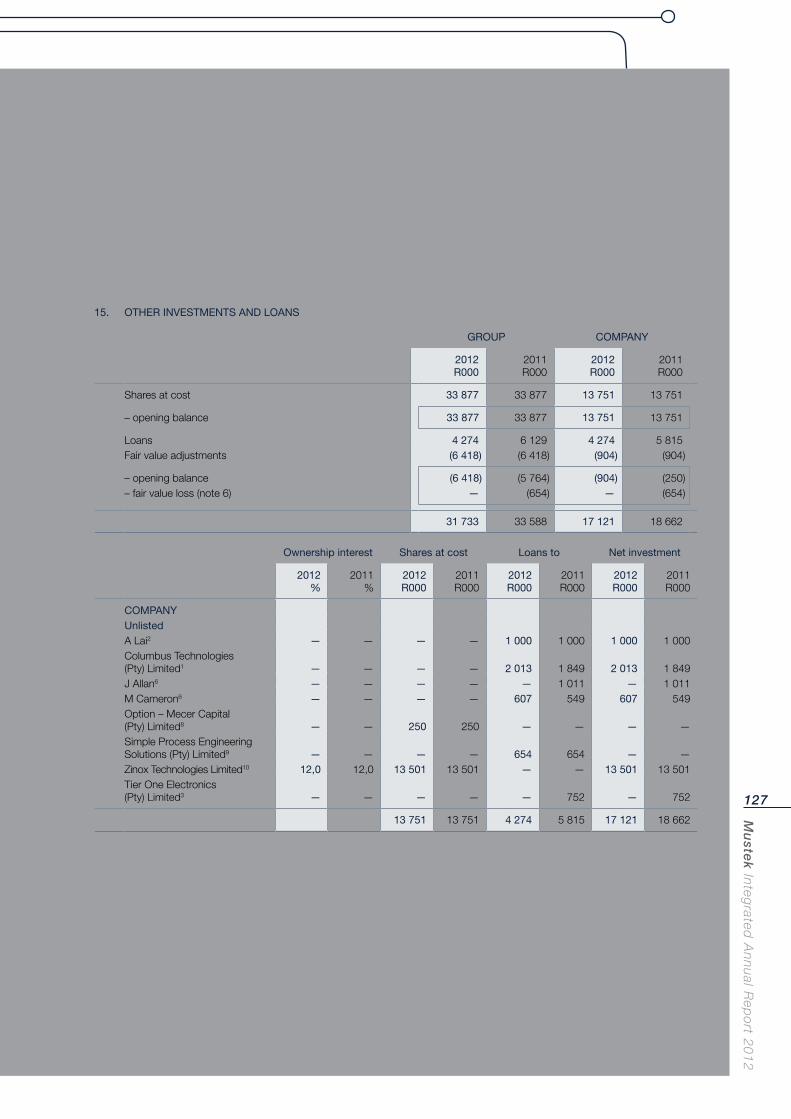
Mu
stek In
tegrated
An
nu
al Rep
ort 2
01
2
127
15. OTHER INVESTMENTS AND LOANS
GROUP COMPANY
2012R000
2011R000
2012R000
2011R000
Shares at cost 33 877 33 877 13 751 13 751
– opening balance 33 877 33 877 13 751 13 751
Loans 4 274 6 129 4 274 5 815Fair value adjustments (6 418) (6 418) (904) (904)
– opening balance (6 418) (5 764) (904) (250)– fair value loss (note 6) — (654) — (654)
31 733 33 588 17 121 18 662
Ownership interest Shares at cost Loans to Net investment
2012%
2011%
2012R000
2011R000
2012R000
2011R000
2012R000
2011R000
COMPANYUnlistedA Lai2 — — — — 1 000 1 000 1 000 1 000Columbus Technologies (Pty) Limited1 — — — — 2 013 1 849 2 013 1 849J Allan6 — — — — — 1 011 — 1 011M Cameron6 — — — — 607 549 607 549Option – Mecer Capital (Pty) Limited8 — — 250 250 — — — —Simple Process Engineering Solutions (Pty) Limited9 — — — — 654 654 — —Zinox Technologies Limited10 12,0 12,0 13 501 13 501 — — 13 501 13 501Tier One Electronics (Pty) Limited3 — — — — — 752 — 752
13 751 13 751 4 274 5 815 17 121 18 662
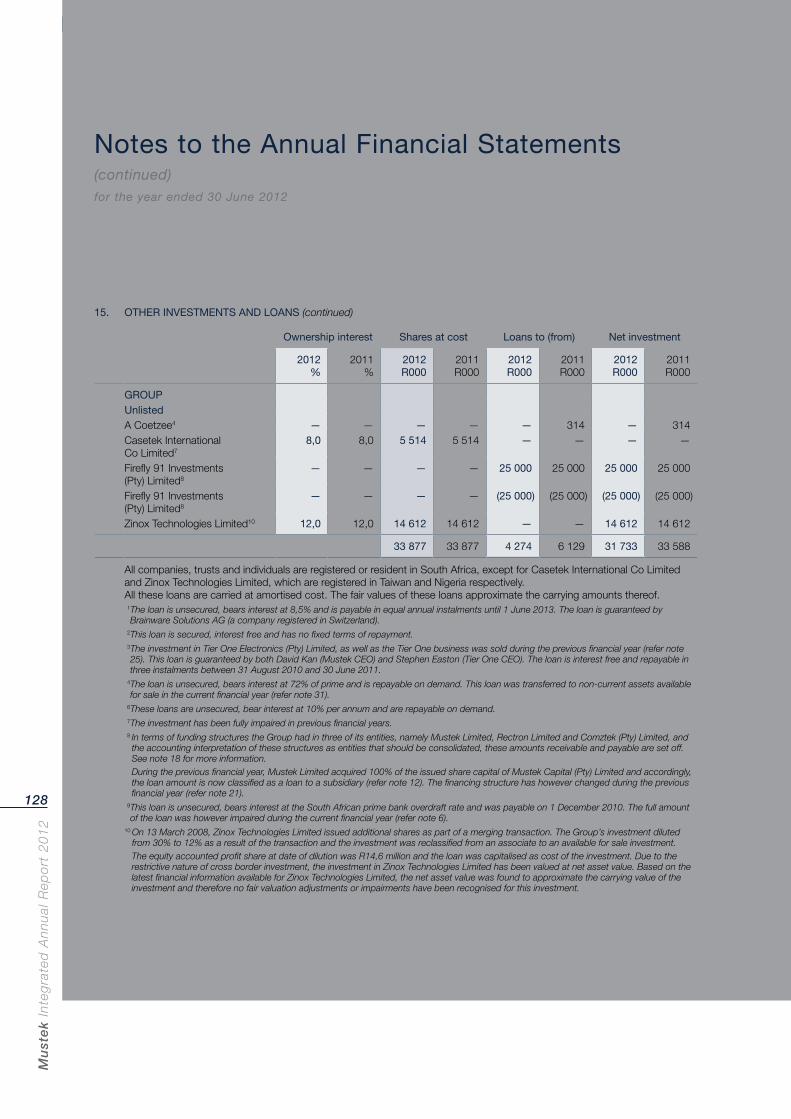
Mu
ste
k In
teg
rate
d A
nn
ual
Rep
ort
20
12
128
Notes to the Annual Financial Statements (continued)for the year ended 30 June 2012
15. OTHER INVESTMENTS AND LOANS (continued)
Ownership interest Shares at cost Loans to (from) Net investment
2012%
2011%
2012R000
2011R000
2012R000
2011R000
2012R000
2011R000
GROUPUnlisted A Coetzee4 — — — — — 314 — 314Casetek International Co Limited7
8,0 8,0 5 514 5 514 — — — —
Firefly 91 Investments (Pty) Limited8
— — — — 25 000 25 000 25 000 25 000
Firefly 91 Investments (Pty) Limited8
— — — — (25 000) (25 000) (25 000) (25 000)
Zinox Technologies Limited10 12,0 12,0 14 612 14 612 — — 14 612 14 612
33 877 33 877 4 274 6 129 31 733 33 588
All companies, trusts and individuals are registered or resident in South Africa, except for Casetek International Co Limited and Zinox Technologies Limited, which are registered in Taiwan and Nigeria respectively.All these loans are carried at amortised cost. The fair values of these loans approximate the carrying amounts thereof. 1 The loan is unsecured, bears interest at 8,5% and is payable in equal annual instalments until 1 June 2013. The loan is guaranteed by
Brainware Solutions AG (a company registered in Switzerland). 2This loan is secured, interest free and has no fixed terms of repayment. 3 The investment in Tier One Electronics (Pty) Limited, as well as the Tier One business was sold during the previous financial year (refer note
25). This loan is guaranteed by both David Kan (Mustek CEO) and Stephen Easton (Tier One CEO). The loan is interest free and repayable in three instalments between 31 August 2010 and 30 June 2011.
4 The loan is unsecured, bears interest at 72% of prime and is repayable on demand. This loan was transferred to non-current assets available for sale in the current financial year (refer note 31).
6These loans are unsecured, bear interest at 10% per annum and are repayable on demand. 7The investment has been fully impaired in previous financial years. 8 In terms of funding structures the Group had in three of its entities, namely Mustek Limited, Rectron Limited and Comztek (Pty) Limited, and
the accounting interpretation of these structures as entities that should be consolidated, these amounts receivable and payable are set off. See note 18 for more information.
During the previous financial year, Mustek Limited acquired 100% of the issued share capital of Mustek Capital (Pty) Limited and accordingly, the loan amount is now classified as a loan to a subsidiary (refer note 12). The financing structure has however changed during the previous financial year (refer note 21).
9 This loan is unsecured, bears interest at the South African prime bank overdraft rate and was payable on 1 December 2010. The full amount of the loan was however impaired during the current financial year (refer note 6).
10 On 13 March 2008, Zinox Technologies Limited issued additional shares as part of a merging transaction. The Group’s investment diluted from 30% to 12% as a result of the transaction and the investment was reclassified from an associate to an available for sale investment.
The equity accounted profit share at date of dilution was R14,6 million and the loan was capitalised as cost of the investment. Due to the restrictive nature of cross border investment, the investment in Zinox Technologies Limited has been valued at net asset value. Based on the latest financial information available for Zinox Technologies Limited, the net asset value was found to approximate the carrying value of the investment and therefore no fair valuation adjustments or impairments have been recognised for this investment.
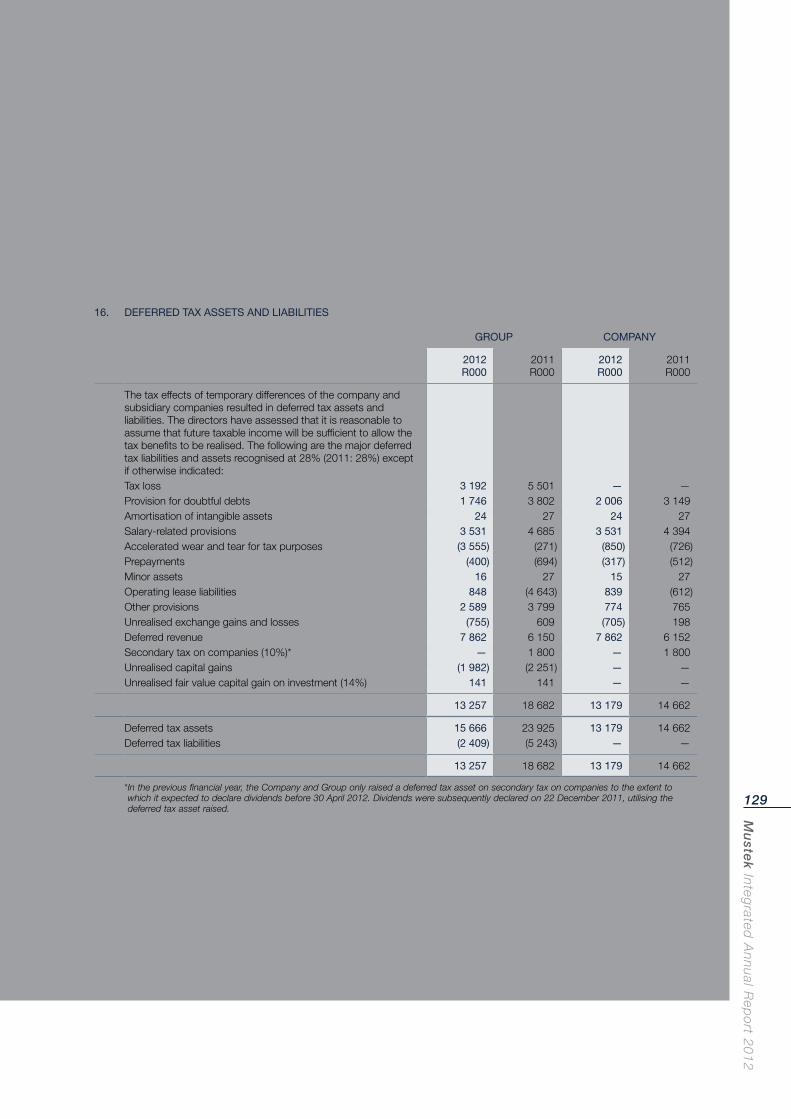
Mu
stek In
tegrated
An
nu
al Rep
ort 2
01
2
129
16. DEFERRED TAX ASSETS AND LIABILITIES
GROUP COMPANY
2012R000
2011R000
2012R000
2011R000
The tax effects of temporary differences of the company and subsidiary companies resulted in deferred tax assets and liabilities. The directors have assessed that it is reasonable to assume that future taxable income will be sufficient to allow the tax benefits to be realised. The following are the major deferred tax liabilities and assets recognised at 28% (2011: 28%) except if otherwise indicated:Tax loss 3 192 5 501 — —Provision for doubtful debts 1 746 3 802 2 006 3 149Amortisation of intangible assets 24 27 24 27Salary-related provisions 3 531 4 685 3 531 4 394Accelerated wear and tear for tax purposes (3 555) (271) (850) (726)Prepayments (400) (694) (317) (512)Minor assets 16 27 15 27Operating lease liabilities 848 (4 643) 839 (612)Other provisions 2 589 3 799 774 765Unrealised exchange gains and losses (755) 609 (705) 198Deferred revenue 7 862 6 150 7 862 6 152Secondary tax on companies (10%)* — 1 800 — 1 800Unrealised capital gains (1 982) (2 251) — —Unrealised fair value capital gain on investment (14%) 141 141 — —
13 257 18 682 13 179 14 662
Deferred tax assets 15 666 23 925 13 179 14 662Deferred tax liabilities (2 409) (5 243) — —
13 257 18 682 13 179 14 662
* In the previous financial year, the Company and Group only raised a deferred tax asset on secondary tax on companies to the extent to which it expected to declare dividends before 30 April 2012. Dividends were subsequently declared on 22 December 2011, utilising the deferred tax asset raised.
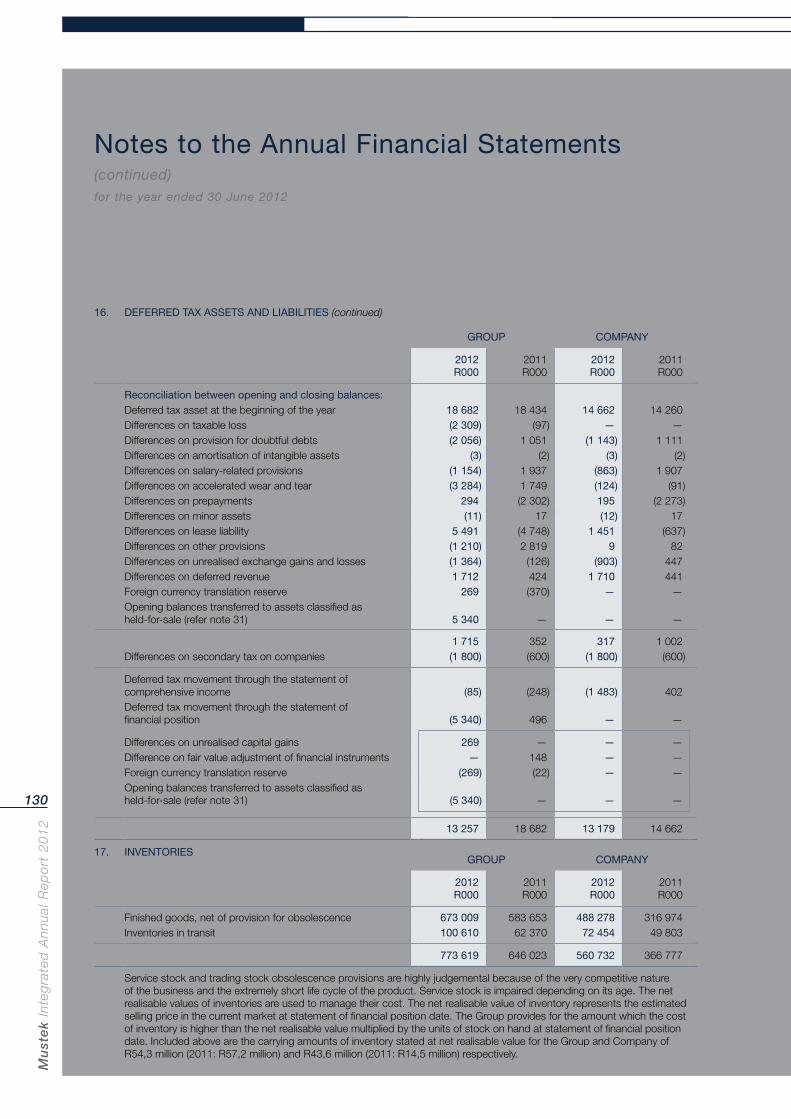
Mu
ste
k In
teg
rate
d A
nn
ual
Rep
ort
20
12
130
Notes to the Annual Financial Statements (continued)for the year ended 30 June 2012
16. DEFERRED TAX ASSETS AND LIABILITIES (continued)
GROUP COMPANY
2012R000
2011R000
2012R000
2011R000
Reconciliation between opening and closing balances:Deferred tax asset at the beginning of the year 18 682 18 434 14 662 14 260Differences on taxable loss (2 309) (97) — —Differences on provision for doubtful debts (2 056) 1 051 (1 143) 1 111Differences on amortisation of intangible assets (3) (2) (3) (2)Differences on salary-related provisions (1 154) 1 937 (863) 1 907Differences on accelerated wear and tear (3 284) 1 749 (124) (91)Differences on prepayments 294 (2 302) 195 (2 273)Differences on minor assets (11) 17 (12) 17Differences on lease liability 5 491 (4 748) 1 451 (637)Differences on other provisions (1 210) 2 819 9 82Differences on unrealised exchange gains and losses (1 364) (126) (903) 447Differences on deferred revenue 1 712 424 1 710 441Foreign currency translation reserve 269 (370) — —Opening balances transferred to assets classified as held-for-sale (refer note 31) 5 340 — — —
1 715 352 317 1 002Differences on secondary tax on companies (1 800) (600) (1 800) (600)
Deferred tax movement through the statement of comprehensive income (85) (248) (1 483) 402Deferred tax movement through the statement of financial position (5 340) 496 — —
Differences on unrealised capital gains 269 — — —Difference on fair value adjustment of financial instruments — 148 — —Foreign currency translation reserve (269) (22) — —Opening balances transferred to assets classified as held-for-sale (refer note 31) (5 340) — — —
13 257 18 682 13 179 14 662
17. INVENTORIESGROUP COMPANY
2012R000
2011R000
2012R000
2011R000
Finished goods, net of provision for obsolescence 673 009 583 653 488 278 316 974Inventories in transit 100 610 62 370 72 454 49 803
773 619 646 023 560 732 366 777
Service stock and trading stock obsolescence provisions are highly judgemental because of the very competitive nature of the business and the extremely short life cycle of the product. Service stock is impaired depending on its age. The net realisable values of inventories are used to manage their cost. The net realisable value of inventory represents the estimated selling price in the current market at statement of financial position date. The Group provides for the amount which the cost of inventory is higher than the net realisable value multiplied by the units of stock on hand at statement of financial position date. Included above are the carrying amounts of inventory stated at net realisable value for the Group and Company of R54,3 million (2011: R57,2 million) and R43,6 million (2011: R14,5 million) respectively.
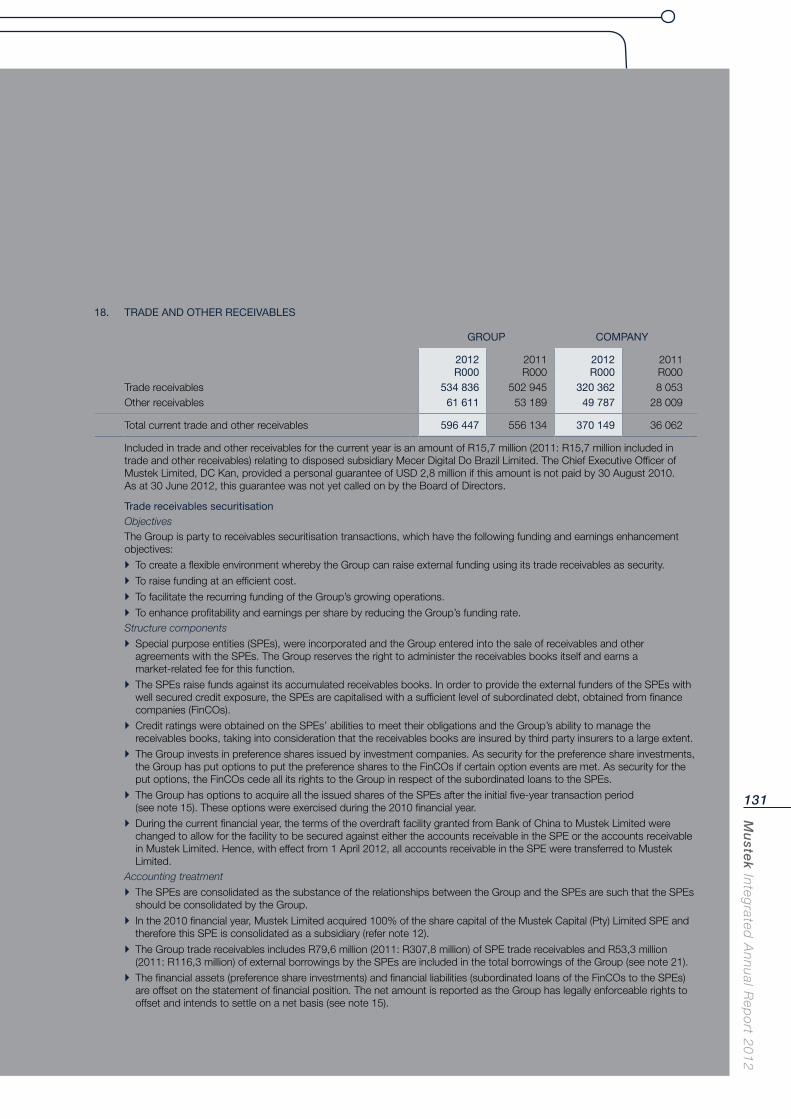
Mu
stek In
tegrated
An
nu
al Rep
ort 2
01
2
131
18. TRADE AND OTHER RECEIVABLES
GROUP COMPANY
2012R000
2011R000
2012R000
2011R000
Trade receivables 534 836 502 945 320 362 8 053Other receivables 61 611 53 189 49 787 28 009
Total current trade and other receivables 596 447 556 134 370 149 36 062
Included in trade and other receivables for the current year is an amount of R15,7 million (2011: R15,7 million included in trade and other receivables) relating to disposed subsidiary Mecer Digital Do Brazil Limited. The Chief Executive Officer of Mustek Limited, DC Kan, provided a personal guarantee of USD 2,8 million if this amount is not paid by 30 August 2010. As at 30 June 2012, this guarantee was not yet called on by the Board of Directors.
Trade receivables securitisationObjectivesThe Group is party to receivables securitisation transactions, which have the following funding and earnings enhancement objectives:
To create a flexible environment whereby the Group can raise external funding using its trade receivables as security.
To raise funding at an efficient cost.
To facilitate the recurring funding of the Group’s growing operations.
To enhance profitability and earnings per share by reducing the Group’s funding rate.Structure components
Special purpose entities (SPEs), were incorporated and the Group entered into the sale of receivables and other agreements with the SPEs. The Group reserves the right to administer the receivables books itself and earns a market-related fee for this function.
The SPEs raise funds against its accumulated receivables books. In order to provide the external funders of the SPEs with well secured credit exposure, the SPEs are capitalised with a sufficient level of subordinated debt, obtained from finance companies (FinCOs).
Credit ratings were obtained on the SPEs’ abilities to meet their obligations and the Group’s ability to manage the receivables books, taking into consideration that the receivables books are insured by third party insurers to a large extent.
The Group invests in preference shares issued by investment companies. As security for the preference share investments, the Group has put options to put the preference shares to the FinCOs if certain option events are met. As security for the put options, the FinCOs cede all its rights to the Group in respect of the subordinated loans to the SPEs.
The Group has options to acquire all the issued shares of the SPEs after the initial five-year transaction period (see note 15). These options were exercised during the 2010 financial year.
During the current financial year, the terms of the overdraft facility granted from Bank of China to Mustek Limited were changed to allow for the facility to be secured against either the accounts receivable in the SPE or the accounts receivable in Mustek Limited. Hence, with effect from 1 April 2012, all accounts receivable in the SPE were transferred to Mustek Limited.
Accounting treatment
The SPEs are consolidated as the substance of the relationships between the Group and the SPEs are such that the SPEs should be consolidated by the Group.
In the 2010 financial year, Mustek Limited acquired 100% of the share capital of the Mustek Capital (Pty) Limited SPE and therefore this SPE is consolidated as a subsidiary (refer note 12).
The Group trade receivables includes R79,6 million (2011: R307,8 million) of SPE trade receivables and R53,3 million (2011: R116,3 million) of external borrowings by the SPEs are included in the total borrowings of the Group (see note 21).
The financial assets (preference share investments) and financial liabilities (subordinated loans of the FinCOs to the SPEs) are offset on the statement of financial position. The net amount is reported as the Group has legally enforceable rights to offset and intends to settle on a net basis (see note 15).

Mu
ste
k In
teg
rate
d A
nn
ual
Rep
ort
20
12
132
Notes to the Annual Financial Statements (continued)for the year ended 30 June 2012
18. TRADE AND OTHER RECEIVABLES (continued)
Since the statement of financial position items are offset, it is appropriate to offset the corresponding income and expense items, being the dividends received from the preference share investments and the interest paid on the subordinated loans (see notes 4 and 5).
The directors considered the derecognition of accounts receivable at the company level appropriate as the SPE carries the risk of these amounts receivable.
Other information
The directors consider that the carrying amount of trade and other receivables approximates to their fair value.
The Group’s credit risk is primarily attributable to its trade and other receivables. The amounts presented in the statement of financial position are net of allowances for doubtful receivables, estimated by the Group’s management based on prior experience and the current economic environment. The provision for doubtful debts was based on a combination of specifically identified doubtful debtors and providing for older debtors. The directors believe that the provision appears to be appropriate and not excessive. The Group has no significant concentration of credit risk, with exposure spread over a large number of counterparties and customers. The Group performs ongoing credit valuations of the financial condition of customers, and where appropriate, credit guarantee insurance is purchased for 85% (2011: 85%) of the value of individual trade receivables subject to an insurance deductible. Note that the majority of trade receivables are encumbered (see above and note 21).
The average credit period on sale of goods and services, are between 30 and 60 days (2011: 30 and 60 days) from date of invoice. Generally, no interest is charged on trade receivables. Of the trade receivable balance at year end, R120,0 million (2011: R67,4 million) and R16,3 million (2011: R36,8 million) is due from the Group and the Company’s largest customers, respectively. Trade receivables are stated at amortised cost, which normally approximate their fair value due to short-term maturity.
It is the Group’s policy to provide credit terms with deferred payment terms to approved dealers, government departments and parastatals, and to allow an account to exceed its credit limit by a maximum of 50% of the original credit limit for temporary periods, subject to the necessary approval. Limits are revised regularly according to the customer’s requirements and payment history. When an insured limit is exceeded temporarily, an application is immediately sent to the insurer requesting an extension of the insured limit.
Doubtful debt allowanceThe Group and Company’s trade receivables are stated after allowances for doubtful debts based on management’s assessment of creditworthiness, an analysis of which is as follows:
GROUP COMPANY
2012R000
2011R000
2012R000
2011R000
Balance at the beginning of the year 19 169 21 157 12 404 10 545Net amounts written off as uncollectable (2 072) (5 824) — —Charged to profit and loss (2 110) 3 836 (5 151) 1 859Amounts transferred to assets classified as held-for-sale (refer note 31) (4 024) — —
Balance at the end of the year 10 963 19 169 7 253 12 404
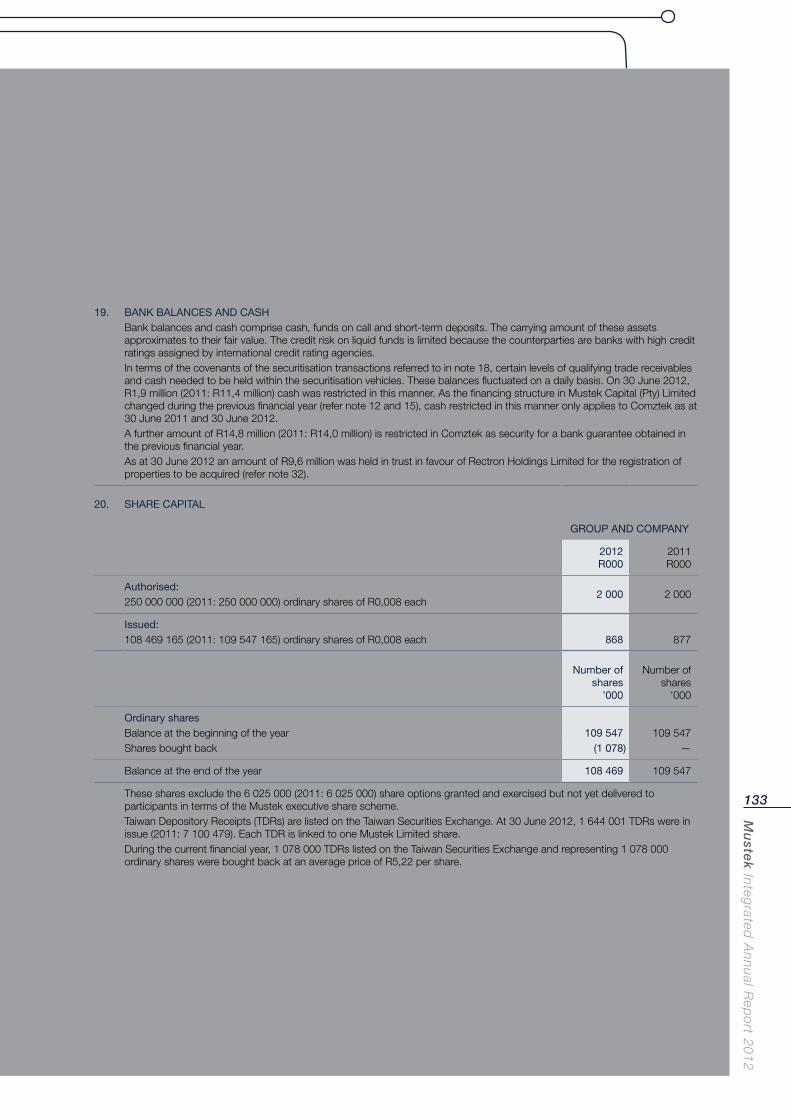
Mu
stek In
tegrated
An
nu
al Rep
ort 2
01
2
133
19. BANK BALANCES AND CASHBank balances and cash comprise cash, funds on call and short-term deposits. The carrying amount of these assets approximates to their fair value. The credit risk on liquid funds is limited because the counterparties are banks with high credit ratings assigned by international credit rating agencies.In terms of the covenants of the securitisation transactions referred to in note 18, certain levels of qualifying trade receivables and cash needed to be held within the securitisation vehicles. These balances fluctuated on a daily basis. On 30 June 2012, R1,9 million (2011: R11,4 million) cash was restricted in this manner. As the financing structure in Mustek Capital (Pty) Limited changed during the previous financial year (refer note 12 and 15), cash restricted in this manner only applies to Comztek as at 30 June 2011 and 30 June 2012.A further amount of R14,8 million (2011: R14,0 million) is restricted in Comztek as security for a bank guarantee obtained in the previous financial year.As at 30 June 2012 an amount of R9,6 million was held in trust in favour of Rectron Holdings Limited for the registration of properties to be acquired (refer note 32).
20. SHARE CAPITAL
GROUP AND COMPANY
2012R000
2011R000
Authorised:250 000 000 (2011: 250 000 000) ordinary shares of R0,008 each
2 000 2 000
Issued:108 469 165 (2011: 109 547 165) ordinary shares of R0,008 each 868 877
Number of shares
’000
Number of shares
’000
Ordinary sharesBalance at the beginning of the year 109 547 109 547Shares bought back (1 078) —
Balance at the end of the year 108 469 109 547
These shares exclude the 6 025 000 (2011: 6 025 000) share options granted and exercised but not yet delivered to participants in terms of the Mustek executive share scheme.Taiwan Depository Receipts (TDRs) are listed on the Taiwan Securities Exchange. At 30 June 2012, 1 644 001 TDRs were in issue (2011: 7 100 479). Each TDR is linked to one Mustek Limited share.During the current financial year, 1 078 000 TDRs listed on the Taiwan Securities Exchange and representing 1 078 000 ordinary shares were bought back at an average price of R5,22 per share.
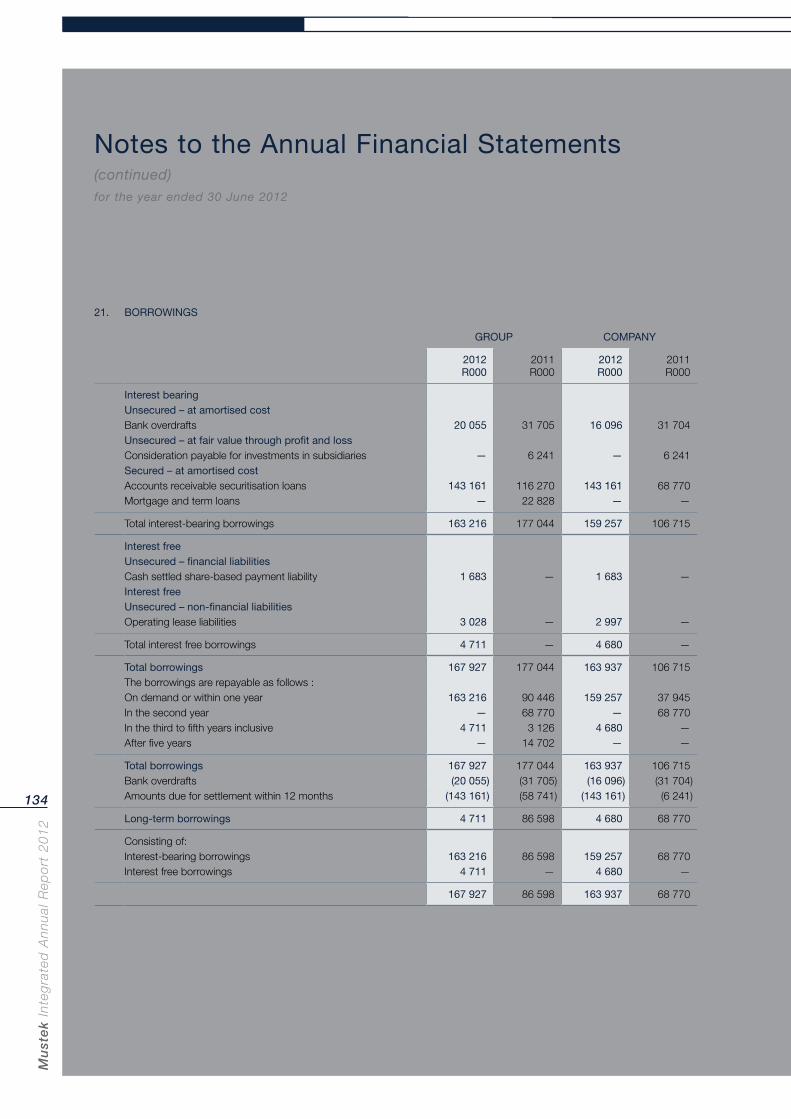
Mu
ste
k In
teg
rate
d A
nn
ual
Rep
ort
20
12
134
Notes to the Annual Financial Statements (continued)for the year ended 30 June 2012
21. BORROWINGS
GROUP COMPANY
2012R000
2011R000
2012R000
2011R000
Interest bearingUnsecured – at amortised costBank overdrafts 20 055 31 705 16 096 31 704Unsecured – at fair value through profit and lossConsideration payable for investments in subsidiaries — 6 241 — 6 241Secured – at amortised costAccounts receivable securitisation loans 143 161 116 270 143 161 68 770Mortgage and term loans — 22 828 — —
Total interest-bearing borrowings 163 216 177 044 159 257 106 715
Interest freeUnsecured – financial liabilitiesCash settled share-based payment liability 1 683 — 1 683 —Interest freeUnsecured – non-financial liabilitiesOperating lease liabilities 3 028 — 2 997 —
Total interest free borrowings 4 711 — 4 680 —
Total borrowings 167 927 177 044 163 937 106 715The borrowings are repayable as follows :On demand or within one year 163 216 90 446 159 257 37 945In the second year — 68 770 — 68 770In the third to fifth years inclusive 4 711 3 126 4 680 —After five years — 14 702 — —
Total borrowings 167 927 177 044 163 937 106 715Bank overdrafts (20 055) (31 705) (16 096) (31 704)Amounts due for settlement within 12 months (143 161) (58 741) (143 161) (6 241)
Long-term borrowings 4 711 86 598 4 680 68 770
Consisting of:Interest-bearing borrowings 163 216 86 598 159 257 68 770Interest free borrowings 4 711 — 4 680 —
167 927 86 598 163 937 68 770
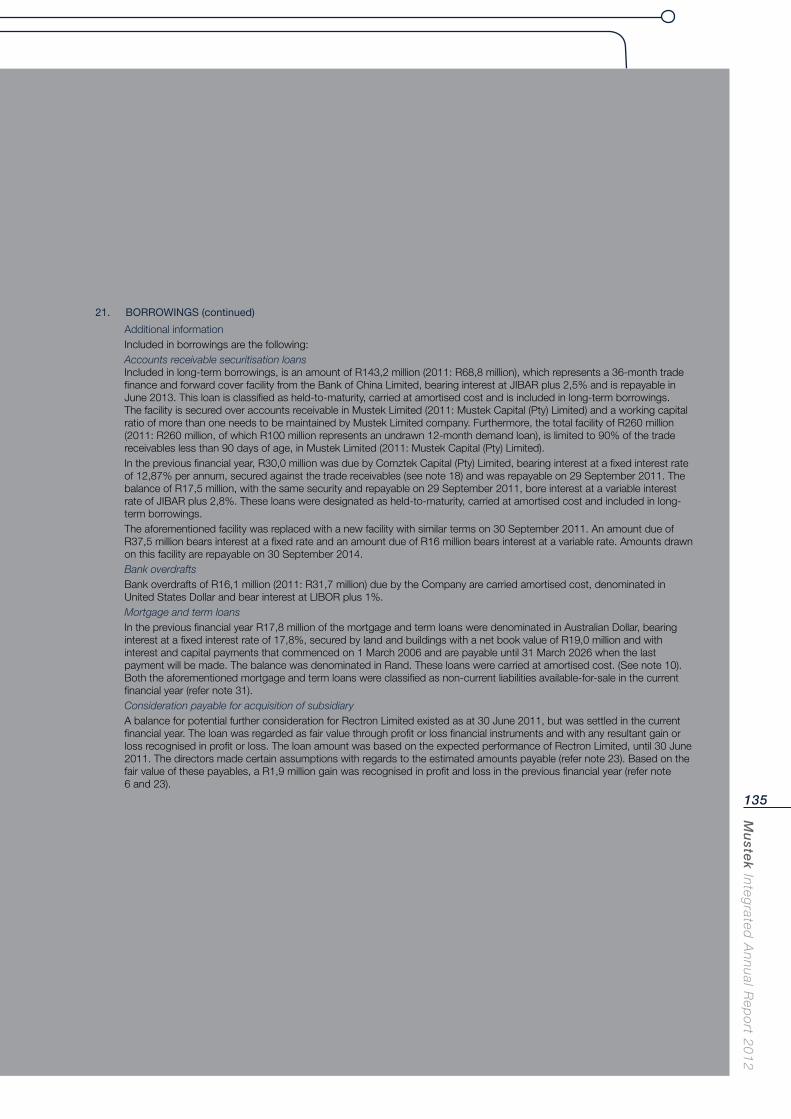
Mu
stek In
tegrated
An
nu
al Rep
ort 2
01
2
135
21. BORROWINGS (continued)
Additional informationIncluded in borrowings are the following:Accounts receivable securitisation loansIncluded in long-term borrowings, is an amount of R143,2 million (2011: R68,8 million), which represents a 36-month trade finance and forward cover facility from the Bank of China Limited, bearing interest at JIBAR plus 2,5% and is repayable in June 2013. This loan is classified as held-to-maturity, carried at amortised cost and is included in long-term borrowings. The facility is secured over accounts receivable in Mustek Limited (2011: Mustek Capital (Pty) Limited) and a working capital ratio of more than one needs to be maintained by Mustek Limited company. Furthermore, the total facility of R260 million (2011: R260 million, of which R100 million represents an undrawn 12-month demand loan), is limited to 90% of the trade receivables less than 90 days of age, in Mustek Limited (2011: Mustek Capital (Pty) Limited).In the previous financial year, R30,0 million was due by Comztek Capital (Pty) Limited, bearing interest at a fixed interest rate of 12,87% per annum, secured against the trade receivables (see note 18) and was repayable on 29 September 2011. The balance of R17,5 million, with the same security and repayable on 29 September 2011, bore interest at a variable interest rate of JIBAR plus 2,8%. These loans were designated as held-to-maturity, carried at amortised cost and included in long- term borrowings.The aforementioned facility was replaced with a new facility with similar terms on 30 September 2011. An amount due of R37,5 million bears interest at a fixed rate and an amount due of R16 million bears interest at a variable rate. Amounts drawn on this facility are repayable on 30 September 2014.Bank overdraftsBank overdrafts of R16,1 million (2011: R31,7 million) due by the Company are carried amortised cost, denominated in United States Dollar and bear interest at LIBOR plus 1%.Mortgage and term loansIn the previous financial year R17,8 million of the mortgage and term loans were denominated in Australian Dollar, bearing interest at a fixed interest rate of 17,8%, secured by land and buildings with a net book value of R19,0 million and with interest and capital payments that commenced on 1 March 2006 and are payable until 31 March 2026 when the last payment will be made. The balance was denominated in Rand. These loans were carried at amortised cost. (See note 10). Both the aforementioned mortgage and term loans were classified as non-current liabilities available-for-sale in the current financial year (refer note 31).Consideration payable for acquisition of subsidiaryA balance for potential further consideration for Rectron Limited existed as at 30 June 2011, but was settled in the current financial year. The loan was regarded as fair value through profit or loss financial instruments and with any resultant gain or loss recognised in profit or loss. The loan amount was based on the expected performance of Rectron Limited, until 30 June 2011. The directors made certain assumptions with regards to the estimated amounts payable (refer note 23). Based on the fair value of these payables, a R1,9 million gain was recognised in profit and loss in the previous financial year (refer note 6 and 23).
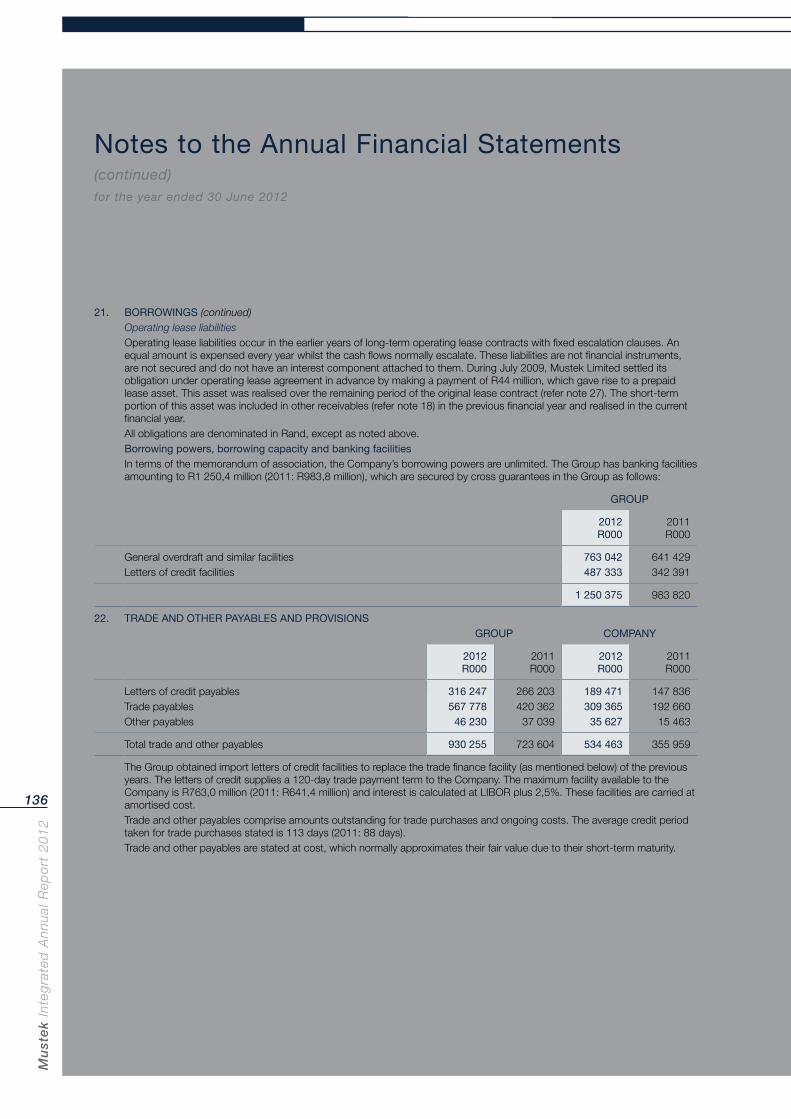
Mu
ste
k In
teg
rate
d A
nn
ual
Rep
ort
20
12
136
Notes to the Annual Financial Statements (continued)for the year ended 30 June 2012
21. BORROWINGS (continued)Operating lease liabilitiesOperating lease liabilities occur in the earlier years of long-term operating lease contracts with fixed escalation clauses. An equal amount is expensed every year whilst the cash flows normally escalate. These liabilities are not financial instruments, are not secured and do not have an interest component attached to them. During July 2009, Mustek Limited settled its obligation under operating lease agreement in advance by making a payment of R44 million, which gave rise to a prepaid lease asset. This asset was realised over the remaining period of the original lease contract (refer note 27). The short-term portion of this asset was included in other receivables (refer note 18) in the previous financial year and realised in the current financial year.All obligations are denominated in Rand, except as noted above.Borrowing powers, borrowing capacity and banking facilitiesIn terms of the memorandum of association, the Company’s borrowing powers are unlimited. The Group has banking facilities amounting to R1 250,4 million (2011: R983,8 million), which are secured by cross guarantees in the Group as follows:
GROUP
2012R000
2011R000
General overdraft and similar facilities 763 042 641 429Letters of credit facilities 487 333 342 391
1 250 375 983 820
22. TRADE AND OTHER PAYABLES AND PROVISIONSGROUP COMPANY
2012R000
2011R000
2012R000
2011R000
Letters of credit payables 316 247 266 203 189 471 147 836Trade payables 567 778 420 362 309 365 192 660Other payables 46 230 37 039 35 627 15 463
Total trade and other payables 930 255 723 604 534 463 355 959
The Group obtained import letters of credit facilities to replace the trade finance facility (as mentioned below) of the previous years. The letters of credit supplies a 120-day trade payment term to the Company. The maximum facility available to the Company is R763,0 million (2011: R641,4 million) and interest is calculated at LIBOR plus 2,5%. These facilities are carried at amortised cost.Trade and other payables comprise amounts outstanding for trade purchases and ongoing costs. The average credit period taken for trade purchases stated is 113 days (2011: 88 days).Trade and other payables are stated at cost, which normally approximates their fair value due to their short-term maturity.
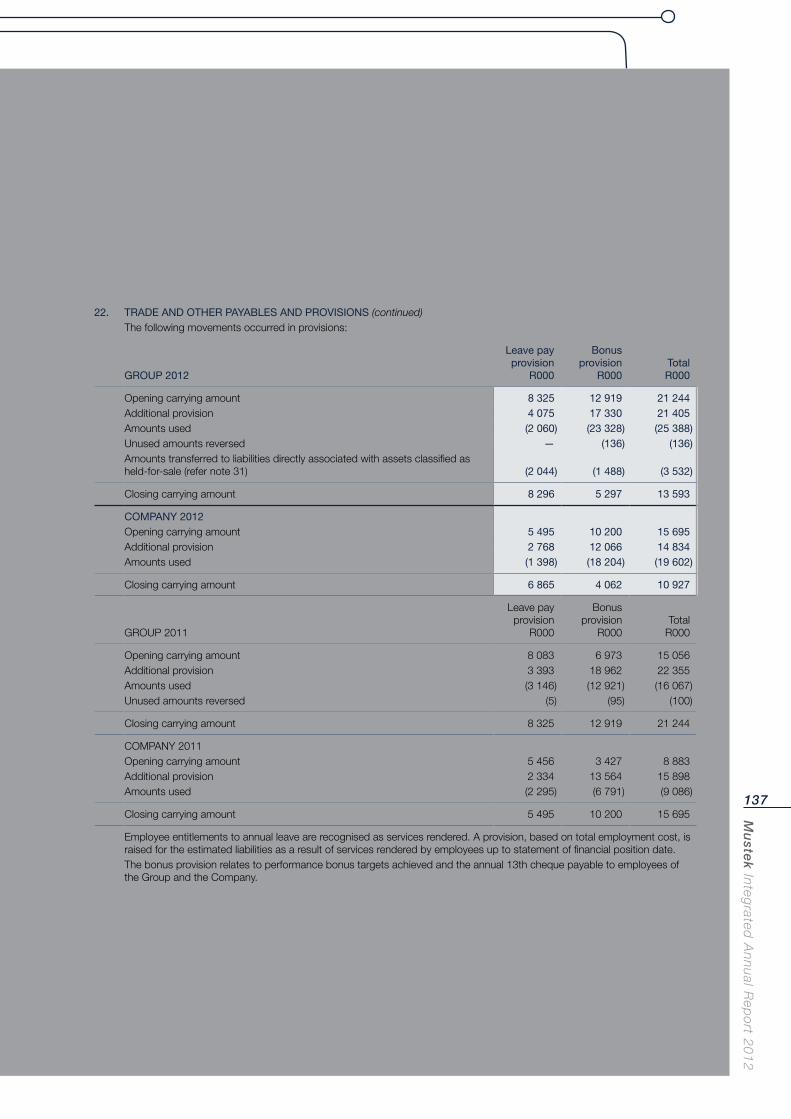
Mu
stek In
tegrated
An
nu
al Rep
ort 2
01
2
137
22. TRADE AND OTHER PAYABLES AND PROVISIONS (continued)The following movements occurred in provisions:
GROUP 2012
Leave pay provision
R000
Bonus provision
R000TotalR000
Opening carrying amount 8 325 12 919 21 244Additional provision 4 075 17 330 21 405Amounts used (2 060) (23 328) (25 388)Unused amounts reversed — (136) (136)Amounts transferred to liabilities directly associated with assets classified as held-for-sale (refer note 31) (2 044) (1 488) (3 532)
Closing carrying amount 8 296 5 297 13 593
COMPANY 2012Opening carrying amount 5 495 10 200 15 695Additional provision 2 768 12 066 14 834Amounts used (1 398) (18 204) (19 602)
Closing carrying amount 6 865 4 062 10 927
GROUP 2011
Leave pay provision
R000
Bonus provision
R000Total
R000
Opening carrying amount 8 083 6 973 15 056Additional provision 3 393 18 962 22 355Amounts used (3 146) (12 921) (16 067)Unused amounts reversed (5) (95) (100)
Closing carrying amount 8 325 12 919 21 244
COMPANY 2011Opening carrying amount 5 456 3 427 8 883Additional provision 2 334 13 564 15 898Amounts used (2 295) (6 791) (9 086)
Closing carrying amount 5 495 10 200 15 695
Employee entitlements to annual leave are recognised as services rendered. A provision, based on total employment cost, is raised for the estimated liabilities as a result of services rendered by employees up to statement of financial position date.The bonus provision relates to performance bonus targets achieved and the annual 13th cheque payable to employees of the Group and the Company.
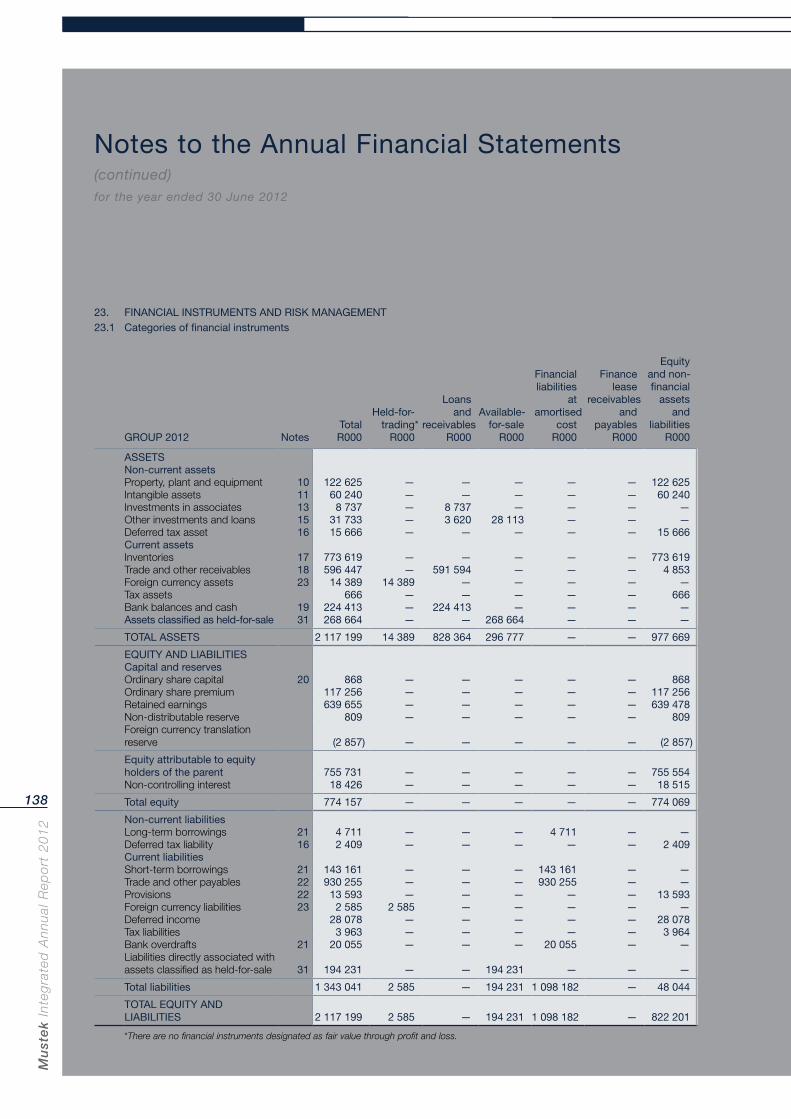
Mu
ste
k In
teg
rate
d A
nn
ual
Rep
ort
20
12
138
Notes to the Annual Financial Statements (continued)for the year ended 30 June 2012
23. FINANCIAL INSTRUMENTS AND RISK MANAGEMENT23.1 Categories of financial instruments
GROUP 2012 NotesTotal
R000
Held-for- trading*
R000
Loans and
receivables R000
Available- for-sale
R000
Financial liabilities
at amortised
cost R000
Finance lease
receivables and
payables R000
Equity and non-
financial assets
and liabilities
R000
ASSETSNon-current assetsProperty, plant and equipment 10 122 625 — — — — — 122 625Intangible assets 11 60 240 — — — — — 60 240Investments in associates 13 8 737 — 8 737 — — — —Other investments and loans 15 31 733 — 3 620 28 113 — — —Deferred tax asset 16 15 666 — — — — — 15 666Current assetsInventories 17 773 619 — — — — — 773 619Trade and other receivables 18 596 447 — 591 594 — — — 4 853Foreign currency assets 23 14 389 14 389 — — — — —Tax assets 666 — — — — — 666Bank balances and cash 19 224 413 — 224 413 — — — —Assets classified as held-for-sale 31 268 664 — — 268 664 — — —
TOTAL ASSETS 2 117 199 14 389 828 364 296 777 — — 977 669
EQUITY AND LIABILITIESCapital and reservesOrdinary share capital 20 868 — — — — — 868Ordinary share premium 117 256 — — — — — 117 256Retained earnings 639 655 — — — — — 639 478Non-distributable reserve 809 — — — — — 809Foreign currency translation reserve (2 857) — — — — — (2 857)
Equity attributable to equity holders of the parent 755 731 — — — — — 755 554Non-controlling interest 18 426 — — — — — 18 515
Total equity 774 157 — — — — — 774 069
Non-current liabilitiesLong-term borrowings 21 4 711 — — — 4 711 — —Deferred tax liability 16 2 409 — — — — — 2 409Current liabilitiesShort-term borrowings 21 143 161 — — — 143 161 — —Trade and other payables 22 930 255 — — — 930 255 — —Provisions 22 13 593 — — — — — 13 593Foreign currency liabilities 23 2 585 2 585 — — — — —Deferred income 28 078 — — — — — 28 078Tax liabilities 3 963 — — — — — 3 964Bank overdrafts 21 20 055 — — — 20 055 — —Liabilities directly associated with assets classified as held-for-sale 31 194 231 — — 194 231 — — —
Total liabilities 1 343 041 2 585 — 194 231 1 098 182 — 48 044
TOTAL EQUITY AND LIABILITIES 2 117 199 2 585 — 194 231 1 098 182 — 822 201
*There are no financial instruments designated as fair value through profit and loss.
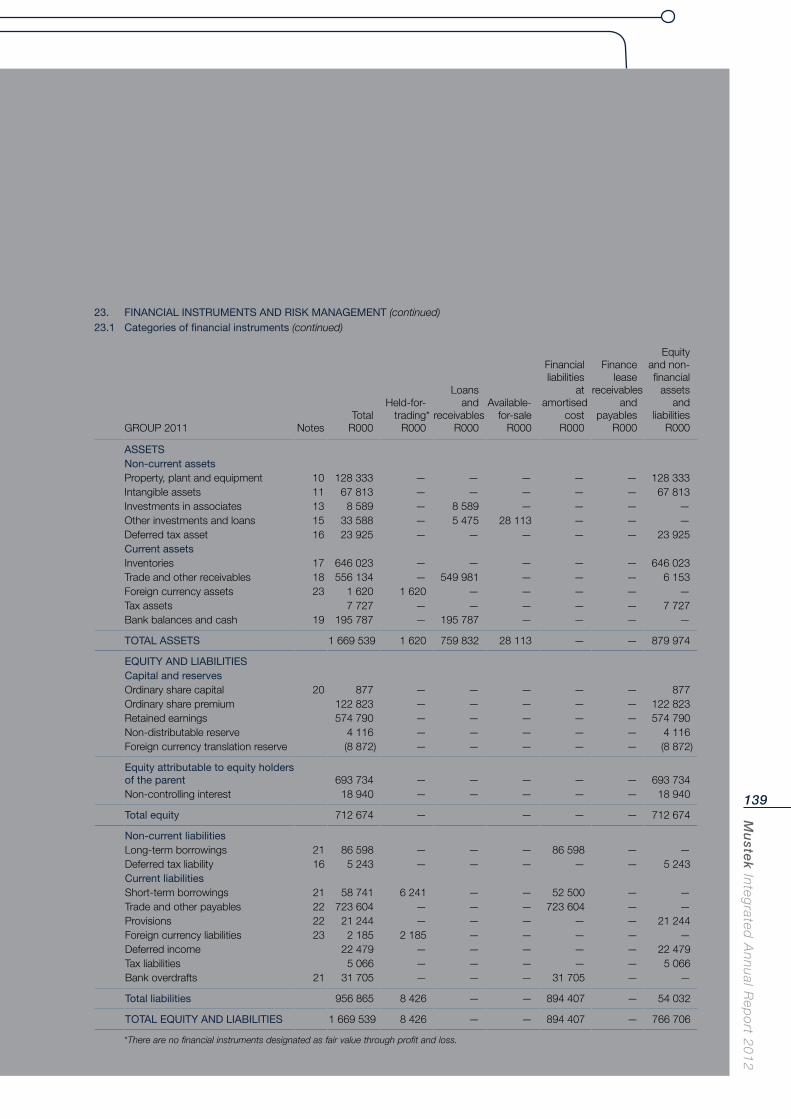
Mu
stek In
tegrated
An
nu
al Rep
ort 2
01
2
139
23. FINANCIAL INSTRUMENTS AND RISK MANAGEMENT (continued)23.1 Categories of financial instruments (continued)
GROUP 2011 NotesTotal
R000
Held-for-trading*
R000
Loans and
receivables R000
Available- for-sale
R000
Financial liabilities
at amortised
cost R000
Finance lease
receivables and
payables R000
Equity and non-
financial assets
and liabilities
R000
ASSETSNon-current assetsProperty, plant and equipment 10 128 333 — — — — — 128 333Intangible assets 11 67 813 — — — — — 67 813Investments in associates 13 8 589 — 8 589 — — — —Other investments and loans 15 33 588 — 5 475 28 113 — — —Deferred tax asset 16 23 925 — — — — — 23 925Current assetsInventories 17 646 023 — — — — — 646 023Trade and other receivables 18 556 134 — 549 981 — — — 6 153Foreign currency assets 23 1 620 1 620 — — — — —Tax assets 7 727 — — — — — 7 727Bank balances and cash 19 195 787 — 195 787 — — — —
TOTAL ASSETS 1 669 539 1 620 759 832 28 113 — — 879 974
EQUITY AND LIABILITIESCapital and reservesOrdinary share capital 20 877 — — — — — 877Ordinary share premium 122 823 — — — — — 122 823Retained earnings 574 790 — — — — — 574 790Non-distributable reserve 4 116 — — — — — 4 116Foreign currency translation reserve (8 872) — — — — — (8 872)
Equity attributable to equity holders of the parent 693 734 — — — — — 693 734Non-controlling interest 18 940 — — — — — 18 940
Total equity 712 674 — — — — 712 674
Non-current liabilitiesLong-term borrowings 21 86 598 — — — 86 598 — —Deferred tax liability 16 5 243 — — — — — 5 243Current liabilitiesShort-term borrowings 21 58 741 6 241 — — 52 500 — —Trade and other payables 22 723 604 — — — 723 604 — —Provisions 22 21 244 — — — — — 21 244Foreign currency liabilities 23 2 185 2 185 — — — — —Deferred income 22 479 — — — — — 22 479Tax liabilities 5 066 — — — — — 5 066Bank overdrafts 21 31 705 — — — 31 705 — —
Total liabilities 956 865 8 426 — — 894 407 — 54 032
TOTAL EQUITY AND LIABILITIES 1 669 539 8 426 — — 894 407 — 766 706
*There are no financial instruments designated as fair value through profit and loss.
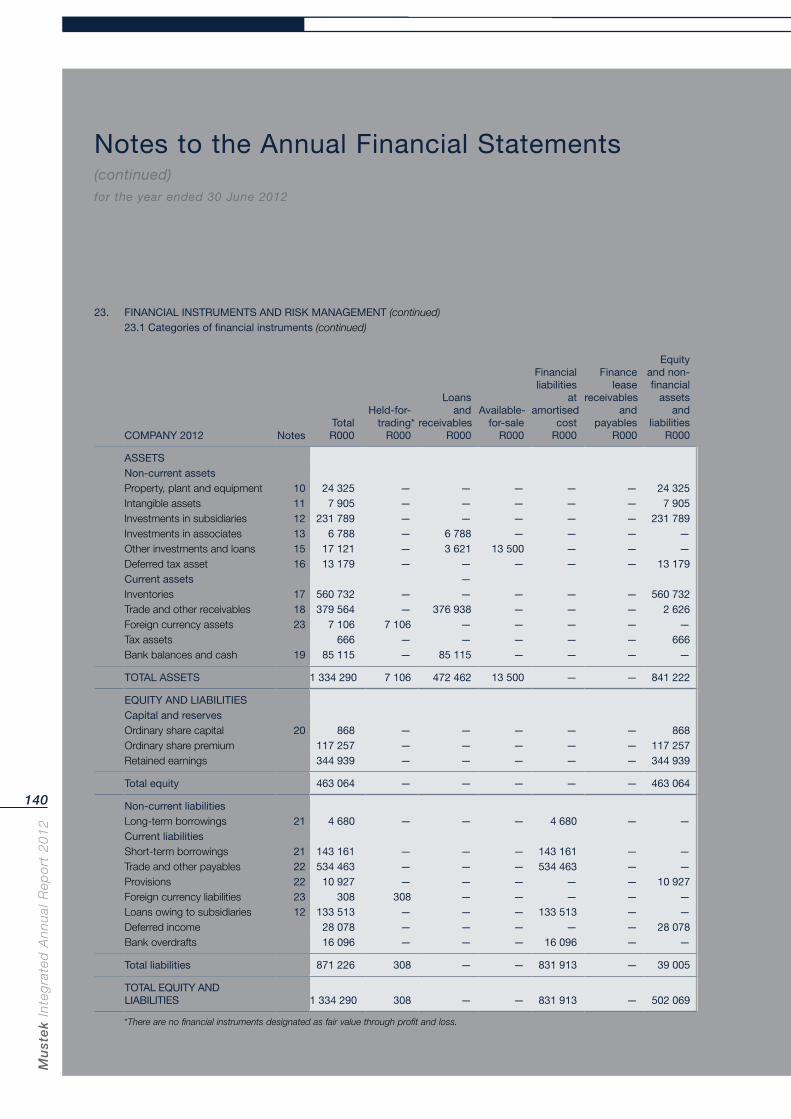
Mu
ste
k In
teg
rate
d A
nn
ual
Rep
ort
20
12
140
Notes to the Annual Financial Statements (continued)for the year ended 30 June 2012
23. FINANCIAL INSTRUMENTS AND RISK MANAGEMENT (continued)23.1 Categories of financial instruments (continued)
COMPANY 2012 NotesTotal
R000
Held-for- trading*
R000
Loansand
receivables R000
Available- for-sale
R000
Financialliabilities
at amortised
cost R000
Finance lease
receivables and
payables R000
Equityand non- financial
assets and
liabilities R000
ASSETSNon-current assetsProperty, plant and equipment 10 24 325 — — — — — 24 325Intangible assets 11 7 905 — — — — — 7 905Investments in subsidiaries 12 231 789 — — — — — 231 789Investments in associates 13 6 788 — 6 788 — — — —Other investments and loans 15 17 121 — 3 621 13 500 — — —Deferred tax asset 16 13 179 — — — — — 13 179Current assets —Inventories 17 560 732 — — — — — 560 732Trade and other receivables 18 379 564 — 376 938 — — — 2 626Foreign currency assets 23 7 106 7 106 — — — — —Tax assets 666 — — — — — 666Bank balances and cash 19 85 115 — 85 115 — — — —
TOTAL ASSETS 1 334 290 7 106 472 462 13 500 — — 841 222
EQUITY AND LIABILITIESCapital and reservesOrdinary share capital 20 868 — — — — — 868Ordinary share premium 117 257 — — — — — 117 257Retained earnings 344 939 — — — — — 344 939
Total equity 463 064 — — — — — 463 064
Non-current liabilitiesLong-term borrowings 21 4 680 — — — 4 680 — —Current liabilitiesShort-term borrowings 21 143 161 — — — 143 161 — —Trade and other payables 22 534 463 — — — 534 463 — —Provisions 22 10 927 — — — — — 10 927Foreign currency liabilities 23 308 308 — — — — —Loans owing to subsidiaries 12 133 513 — — — 133 513 — —Deferred income 28 078 — — — — — 28 078Bank overdrafts 16 096 — — — 16 096 — —
Total liabilities 871 226 308 — — 831 913 — 39 005
TOTAL EQUITY AND LIABILITIES 1 334 290 308 — — 831 913 — 502 069
*There are no financial instruments designated as fair value through profit and loss.
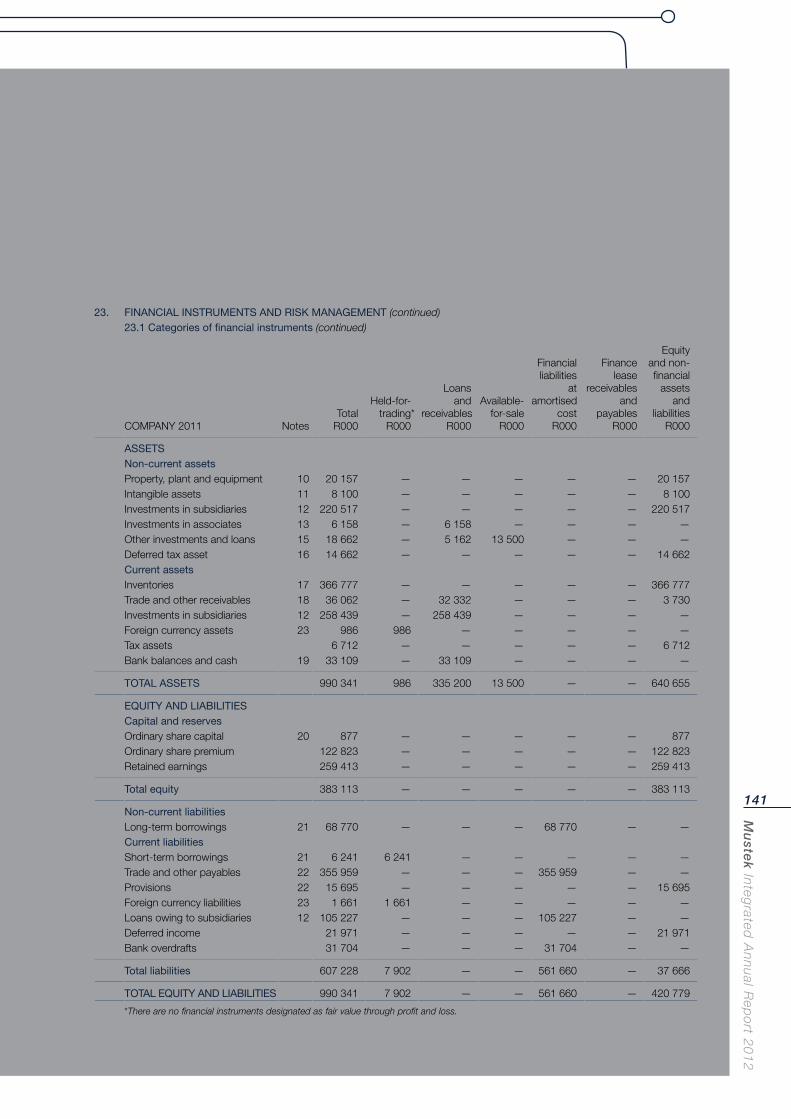
Mu
stek In
tegrated
An
nu
al Rep
ort 2
01
2
141
23. FINANCIAL INSTRUMENTS AND RISK MANAGEMENT (continued)23.1 Categories of financial instruments (continued)
COMPANY 2011 NotesTotal
R000
Held-for- trading*
R000
Loans and
receivables R000
Available- for-sale
R000
Financial liabilities
at amortised
cost R000
Finance lease
receivables and
payables R000
Equity and non- financial
assets and
liabilities R000
ASSETSNon-current assetsProperty, plant and equipment 10 20 157 — — — — — 20 157Intangible assets 11 8 100 — — — — — 8 100Investments in subsidiaries 12 220 517 — — — — — 220 517Investments in associates 13 6 158 — 6 158 — — — —Other investments and loans 15 18 662 — 5 162 13 500 — — —Deferred tax asset 16 14 662 — — — — — 14 662Current assetsInventories 17 366 777 — — — — — 366 777Trade and other receivables 18 36 062 — 32 332 — — — 3 730Investments in subsidiaries 12 258 439 — 258 439 — — — —Foreign currency assets 23 986 986 — — — — —Tax assets 6 712 — — — — — 6 712Bank balances and cash 19 33 109 — 33 109 — — — —
TOTAL ASSETS 990 341 986 335 200 13 500 — — 640 655
EQUITY AND LIABILITIESCapital and reservesOrdinary share capital 20 877 — — — — — 877Ordinary share premium 122 823 — — — — — 122 823Retained earnings 259 413 — — — — — 259 413
Total equity 383 113 — — — — — 383 113
Non-current liabilitiesLong-term borrowings 21 68 770 — — — 68 770 — —Current liabilitiesShort-term borrowings 21 6 241 6 241 — — — — —Trade and other payables 22 355 959 — — — 355 959 — —Provisions 22 15 695 — — — — — 15 695Foreign currency liabilities 23 1 661 1 661 — — — — —Loans owing to subsidiaries 12 105 227 — — — 105 227 — —Deferred income 21 971 — — — — — 21 971Bank overdrafts 31 704 — — — 31 704 — —
Total liabilities 607 228 7 902 — — 561 660 — 37 666
TOTAL EQUITY AND LIABILITIES 990 341 7 902 — — 561 660 — 420 779
*There are no financial instruments designated as fair value through profit and loss.
Mu
ste
k In
teg
rate
d A
nn
ual
Rep
ort
20
12
142
Notes to the Annual Financial Statements (continued)for the year ended 30 June 2012
23. FINANCIAL INSTRUMENTS AND RISK MANAGEMENT (continued)23.2 Risk managementThe Group’s Board of Directors provides financial risk management services to the business, coordinates access to domestic and international financial markets, monitors and manages the financial risks relating to the operations of the Group. These risks include market risk (including foreign currency risk and interest rate risk), credit risk and liquidity risk. The Group’s objectives, policies and processes for measuring and managing these risks are detailed below.The Group seeks to minimise the effects of these risks by using derivative financial instruments to hedge these risk exposures. The use of financial derivatives and exposure levels are governed by the Group’s policies approved by the Board of Directors. The Group does not use derivative financial instruments for speculative purposes. The Group enters into financial instruments to manage and reduce the possible adverse impact on earnings of changes in interest rates and foreign currency exchange rates.
23.2.1 Market riskThe Group’s activities expose it primarily to the risks of fluctuations in foreign currency exchange rates, interest rates and equity price risks.Foreign currency risk refers to the risk that the fair value or future cash flows of a financial instrument will fluctuate because of changes in foreign exchange rates.Interest rate risk refers to the risk that the fair value or future cash flows of a financial instrument will fluctuate because of changes in market interest rates.Price risk refers to the risk that the fair value or future cash flows of a financial instrument will fluctuate because of changes in market prices other than those arising from interest rate risk or currency risk.The Group enters into various derivative financial instruments to manage its exposure to foreign currency risk, including foreign exchange forward contracts and call and put options to manage the exchange rate risk arising on foreign denominated transactions.Market risk exposures are measured using sensitivity analysis. A sensitivity analysis shows how profit before taxation and equity would have been affected by changes in the relevant risk variable that were reasonably possible at the reporting date.
23.2.1.1 Foreign currency risk managementThe Group undertakes certain transactions denominated in foreign currencies, hence exposures to exchange rate fluctuations arise. It is the Group’s policy to enter into foreign exchange forward contracts to buy/sell specified amounts of foreign currencies in the future at a predetermined exchange rate for approximately 50% of the Group’s foreign currency commitments. The Group uses contracts with terms of up to 120 days. The contracts are entered into to manage the Group’s exposure to fluctuations in foreign currency exchange rates.
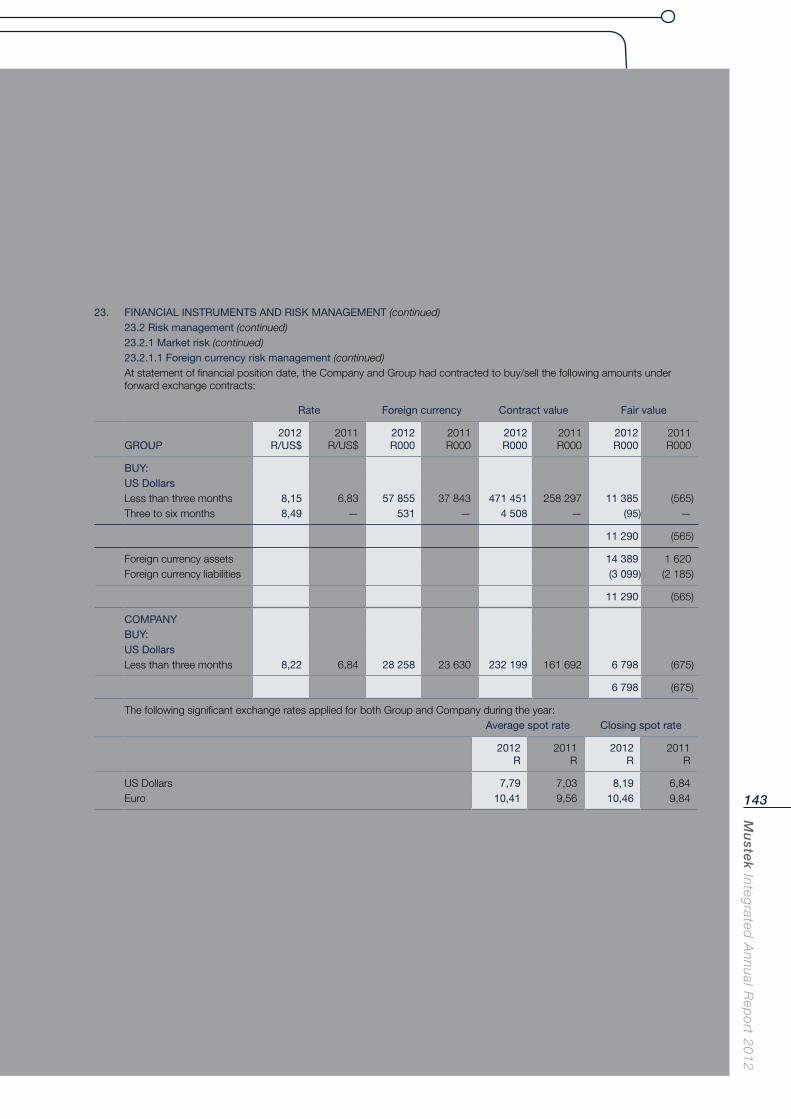
Mu
stek In
tegrated
An
nu
al Rep
ort 2
01
2
143
23. FINANCIAL INSTRUMENTS AND RISK MANAGEMENT (continued)23.2 Risk management (continued)23.2.1 Market risk (continued)23.2.1.1 Foreign currency risk management (continued)At statement of financial position date, the Company and Group had contracted to buy/sell the following amounts under forward exchange contracts:
Rate Foreign currency Contract value Fair value
GROUP2012
R/US$2011
R/US$2012R000
2011R000
2012R000
2011R000
2012R000
2011R000
BUY:US DollarsLess than three months 8,15 6,83 57 855 37 843 471 451 258 297 11 385 (565)Three to six months 8,49 — 531 — 4 508 — (95) —
11 290 (565)
Foreign currency assets 14 389 1 620Foreign currency liabilities (3 099) (2 185)
11 290 (565)
COMPANYBUY:US DollarsLess than three months 8,22 6,84 28 258 23 630 232 199 161 692 6 798 (675)
6 798 (675)
The following significant exchange rates applied for both Group and Company during the year:Average spot rate Closing spot rate
2012R
2011R
2012R
2011R
US Dollars 7,79 7,03 8,19 6,84Euro 10,41 9,56 10,46 9,84
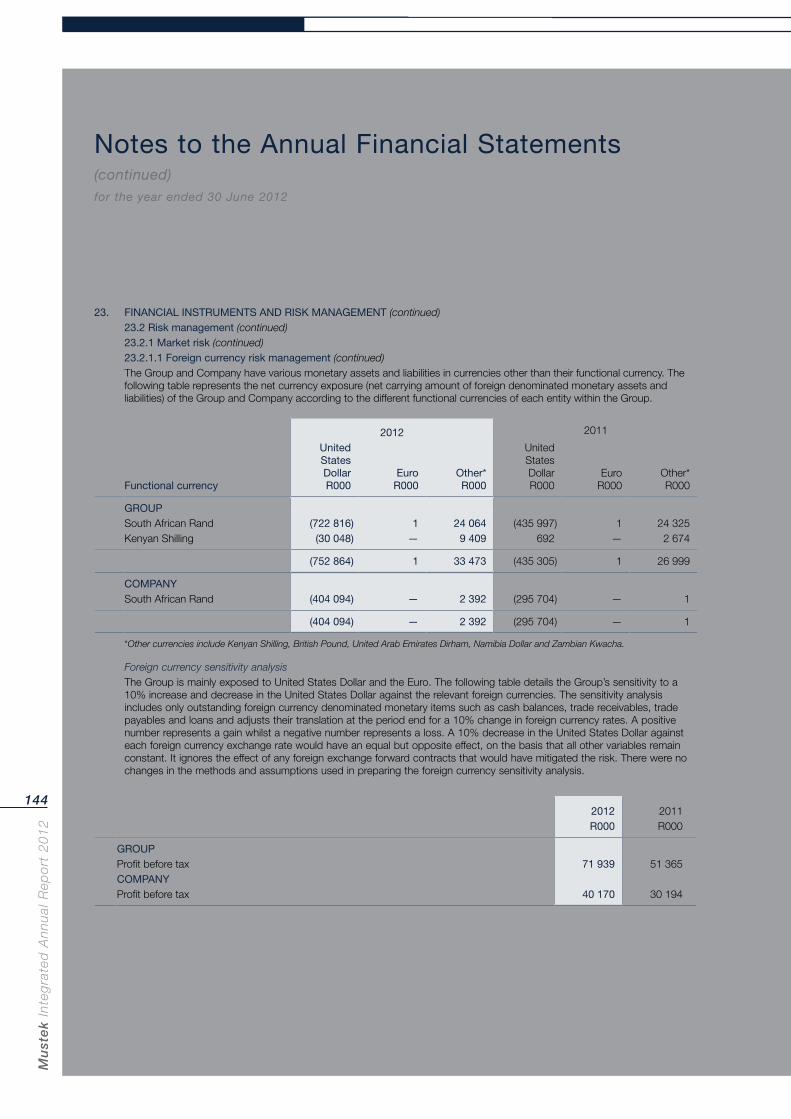
Mu
ste
k In
teg
rate
d A
nn
ual
Rep
ort
20
12
144
Notes to the Annual Financial Statements (continued)for the year ended 30 June 2012
23. FINANCIAL INSTRUMENTS AND RISK MANAGEMENT (continued)23.2 Risk management (continued)23.2.1 Market risk (continued)23.2.1.1 Foreign currency risk management (continued)The Group and Company have various monetary assets and liabilities in currencies other than their functional currency. The following table represents the net currency exposure (net carrying amount of foreign denominated monetary assets and liabilities) of the Group and Company according to the different functional currencies of each entity within the Group.
2012 2011
Functional currency
United States DollarR000
EuroR000
Other*R000
United States DollarR000
EuroR000
Other*R000
GROUPSouth African Rand (722 816) 1 24 064 (435 997) 1 24 325Kenyan Shilling (30 048) — 9 409 692 — 2 674
(752 864) 1 33 473 (435 305) 1 26 999
COMPANYSouth African Rand (404 094) — 2 392 (295 704) — 1
(404 094) — 2 392 (295 704) — 1
*Other currencies include Kenyan Shilling, British Pound, United Arab Emirates Dirham, Namibia Dollar and Zambian Kwacha.
Foreign currency sensitivity analysisThe Group is mainly exposed to United States Dollar and the Euro. The following table details the Group’s sensitivity to a 10% increase and decrease in the United States Dollar against the relevant foreign currencies. The sensitivity analysis includes only outstanding foreign currency denominated monetary items such as cash balances, trade receivables, trade payables and loans and adjusts their translation at the period end for a 10% change in foreign currency rates. A positive number represents a gain whilst a negative number represents a loss. A 10% decrease in the United States Dollar against each foreign currency exchange rate would have an equal but opposite effect, on the basis that all other variables remain constant. It ignores the effect of any foreign exchange forward contracts that would have mitigated the risk. There were no changes in the methods and assumptions used in preparing the foreign currency sensitivity analysis.
2012 2011R000 R000
GROUPProfit before tax 71 939 51 365COMPANY Profit before tax 40 170 30 194
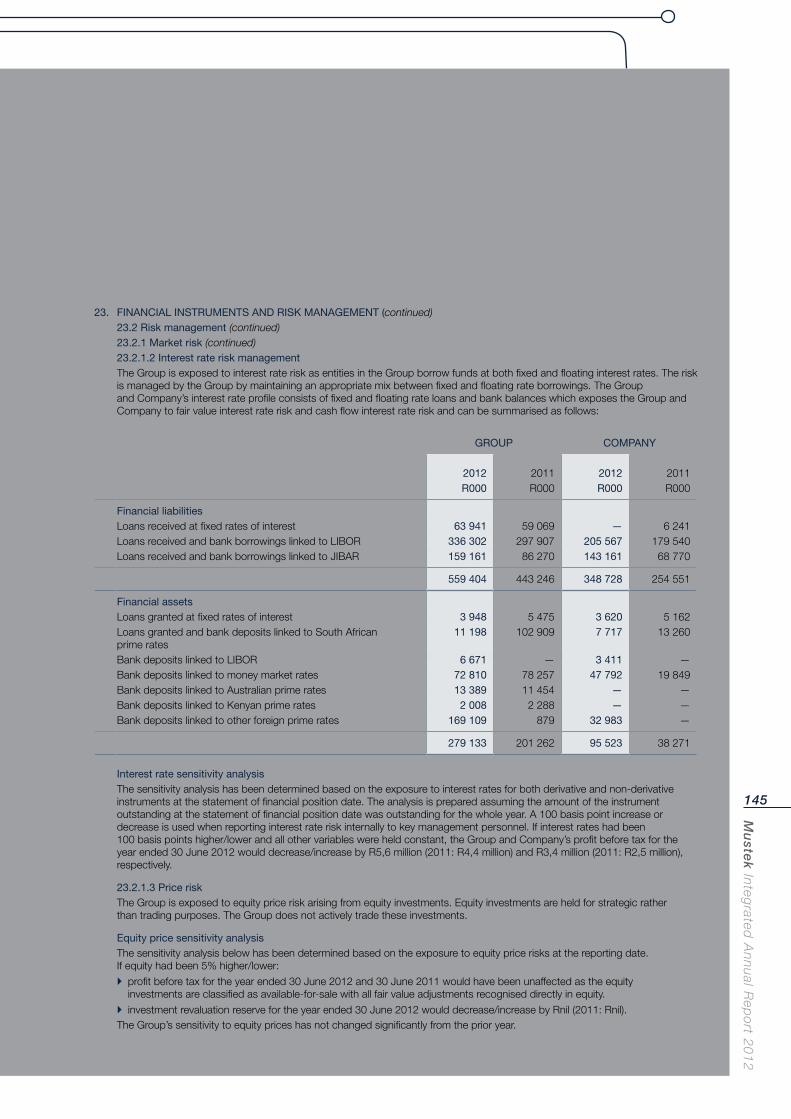
Mu
stek In
tegrated
An
nu
al Rep
ort 2
01
2
145
23. FINANCIAL INSTRUMENTS AND RISK MANAGEMENT (continued)23.2 Risk management (continued)23.2.1 Market risk (continued)23.2.1.2 Interest rate risk managementThe Group is exposed to interest rate risk as entities in the Group borrow funds at both fixed and floating interest rates. The risk is managed by the Group by maintaining an appropriate mix between fixed and floating rate borrowings. The Group and Company’s interest rate profile consists of fixed and floating rate loans and bank balances which exposes the Group and Company to fair value interest rate risk and cash flow interest rate risk and can be summarised as follows:
GROUP COMPANY
2012 2011 2012 2011R000 R000 R000 R000
Financial liabilitiesLoans received at fixed rates of interest 63 941 59 069 — 6 241Loans received and bank borrowings linked to LIBOR 336 302 297 907 205 567 179 540Loans received and bank borrowings linked to JIBAR 159 161 86 270 143 161 68 770
559 404 443 246 348 728 254 551
Financial assetsLoans granted at fixed rates of interest 3 948 5 475 3 620 5 162Loans granted and bank deposits linked to South African prime rates
11 198 102 909 7 717 13 260
Bank deposits linked to LIBOR 6 671 — 3 411 —Bank deposits linked to money market rates 72 810 78 257 47 792 19 849Bank deposits linked to Australian prime rates 13 389 11 454 — —Bank deposits linked to Kenyan prime rates 2 008 2 288 — —Bank deposits linked to other foreign prime rates 169 109 879 32 983 —
279 133 201 262 95 523 38 271
Interest rate sensitivity analysisThe sensitivity analysis has been determined based on the exposure to interest rates for both derivative and non-derivative instruments at the statement of financial position date. The analysis is prepared assuming the amount of the instrument outstanding at the statement of financial position date was outstanding for the whole year. A 100 basis point increase or decrease is used when reporting interest rate risk internally to key management personnel. If interest rates had been 100 basis points higher/lower and all other variables were held constant, the Group and Company’s profit before tax for the year ended 30 June 2012 would decrease/increase by R5,6 million (2011: R4,4 million) and R3,4 million (2011: R2,5 million), respectively.
23.2.1.3 Price riskThe Group is exposed to equity price risk arising from equity investments. Equity investments are held for strategic rather than trading purposes. The Group does not actively trade these investments.
Equity price sensitivity analysisThe sensitivity analysis below has been determined based on the exposure to equity price risks at the reporting date. If equity had been 5% higher/lower:
profit before tax for the year ended 30 June 2012 and 30 June 2011 would have been unaffected as the equity investments are classified as available-for-sale with all fair value adjustments recognised directly in equity.
investment revaluation reserve for the year ended 30 June 2012 would decrease/increase by Rnil (2011: Rnil).The Group’s sensitivity to equity prices has not changed significantly from the prior year.
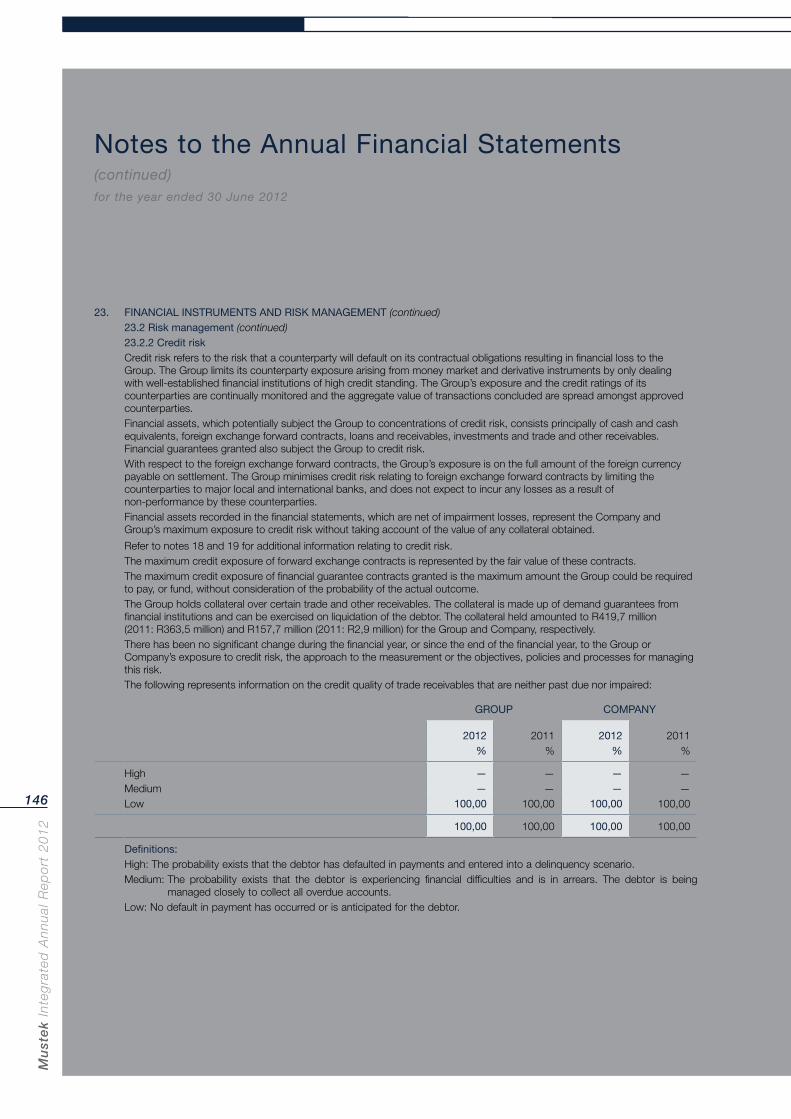
Mu
ste
k In
teg
rate
d A
nn
ual
Rep
ort
20
12
146
Notes to the Annual Financial Statements (continued)for the year ended 30 June 2012
23. FINANCIAL INSTRUMENTS AND RISK MANAGEMENT (continued)23.2 Risk management (continued)23.2.2 Credit riskCredit risk refers to the risk that a counterparty will default on its contractual obligations resulting in financial loss to the Group. The Group limits its counterparty exposure arising from money market and derivative instruments by only dealing with well-established financial institutions of high credit standing. The Group’s exposure and the credit ratings of its counterparties are continually monitored and the aggregate value of transactions concluded are spread amongst approved counterparties.Financial assets, which potentially subject the Group to concentrations of credit risk, consists principally of cash and cash equivalents, foreign exchange forward contracts, loans and receivables, investments and trade and other receivables. Financial guarantees granted also subject the Group to credit risk.With respect to the foreign exchange forward contracts, the Group’s exposure is on the full amount of the foreign currency payable on settlement. The Group minimises credit risk relating to foreign exchange forward contracts by limiting the counterparties to major local and international banks, and does not expect to incur any losses as a result of non-performance by these counterparties.Financial assets recorded in the financial statements, which are net of impairment losses, represent the Company and Group’s maximum exposure to credit risk without taking account of the value of any collateral obtained.
Refer to notes 18 and 19 for additional information relating to credit risk.The maximum credit exposure of forward exchange contracts is represented by the fair value of these contracts.The maximum credit exposure of financial guarantee contracts granted is the maximum amount the Group could be required to pay, or fund, without consideration of the probability of the actual outcome.The Group holds collateral over certain trade and other receivables. The collateral is made up of demand guarantees from financial institutions and can be exercised on liquidation of the debtor. The collateral held amounted to R419,7 million (2011: R363,5 million) and R157,7 million (2011: R2,9 million) for the Group and Company, respectively.There has been no significant change during the financial year, or since the end of the financial year, to the Group or Company’s exposure to credit risk, the approach to the measurement or the objectives, policies and processes for managing this risk.The following represents information on the credit quality of trade receivables that are neither past due nor impaired:
GROUP COMPANY
2012 2011 2012 2011% % % %
High — — — —Medium — — — —Low 100,00 100,00 100,00 100,00
100,00 100,00 100,00 100,00
Definitions:High: The probability exists that the debtor has defaulted in payments and entered into a delinquency scenario.Medium: The probability exists that the debtor is experiencing financial difficulties and is in arrears. The debtor is being
managed closely to collect all overdue accounts.Low: No default in payment has occurred or is anticipated for the debtor.
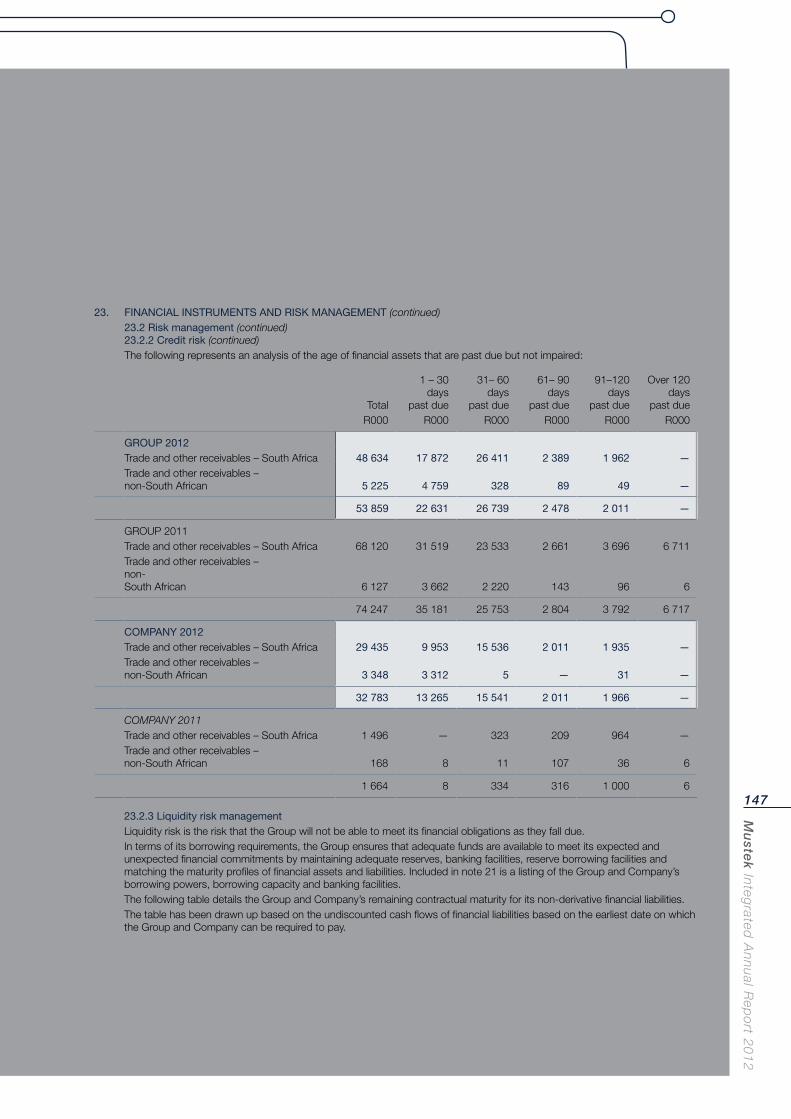
Mu
stek In
tegrated
An
nu
al Rep
ort 2
01
2
147
23. FINANCIAL INSTRUMENTS AND RISK MANAGEMENT (continued)23.2 Risk management (continued)23.2.2 Credit risk (continued)The following represents an analysis of the age of financial assets that are past due but not impaired:
Total
1 – 30 days
past due
31– 60 days
past due
61– 90 days
past due
91–120 days
past due
Over 120 days
past dueR000 R000 R000 R000 R000 R000
GROUP 2012Trade and other receivables – South Africa 48 634 17 872 26 411 2 389 1 962 —Trade and other receivables – non-South African 5 225 4 759 328 89 49 —
53 859 22 631 26 739 2 478 2 011 —
GROUP 2011Trade and other receivables – South Africa 68 120 31 519 23 533 2 661 3 696 6 711Trade and other receivables – non- South African 6 127 3 662 2 220 143 96 6
74 247 35 181 25 753 2 804 3 792 6 717
COMPANY 2012Trade and other receivables – South Africa 29 435 9 953 15 536 2 011 1 935 —Trade and other receivables – non-South African 3 348 3 312 5 — 31 —
32 783 13 265 15 541 2 011 1 966 —
COMPANY 2011Trade and other receivables – South Africa 1 496 — 323 209 964 —Trade and other receivables – non-South African 168 8 11 107 36 6
1 664 8 334 316 1 000 6
23.2.3 Liquidity risk managementLiquidity risk is the risk that the Group will not be able to meet its financial obligations as they fall due.In terms of its borrowing requirements, the Group ensures that adequate funds are available to meet its expected and unexpected financial commitments by maintaining adequate reserves, banking facilities, reserve borrowing facilities and matching the maturity profiles of financial assets and liabilities. Included in note 21 is a listing of the Group and Company’s borrowing powers, borrowing capacity and banking facilities.The following table details the Group and Company’s remaining contractual maturity for its non-derivative financial liabilities. The table has been drawn up based on the undiscounted cash flows of financial liabilities based on the earliest date on which the Group and Company can be required to pay.
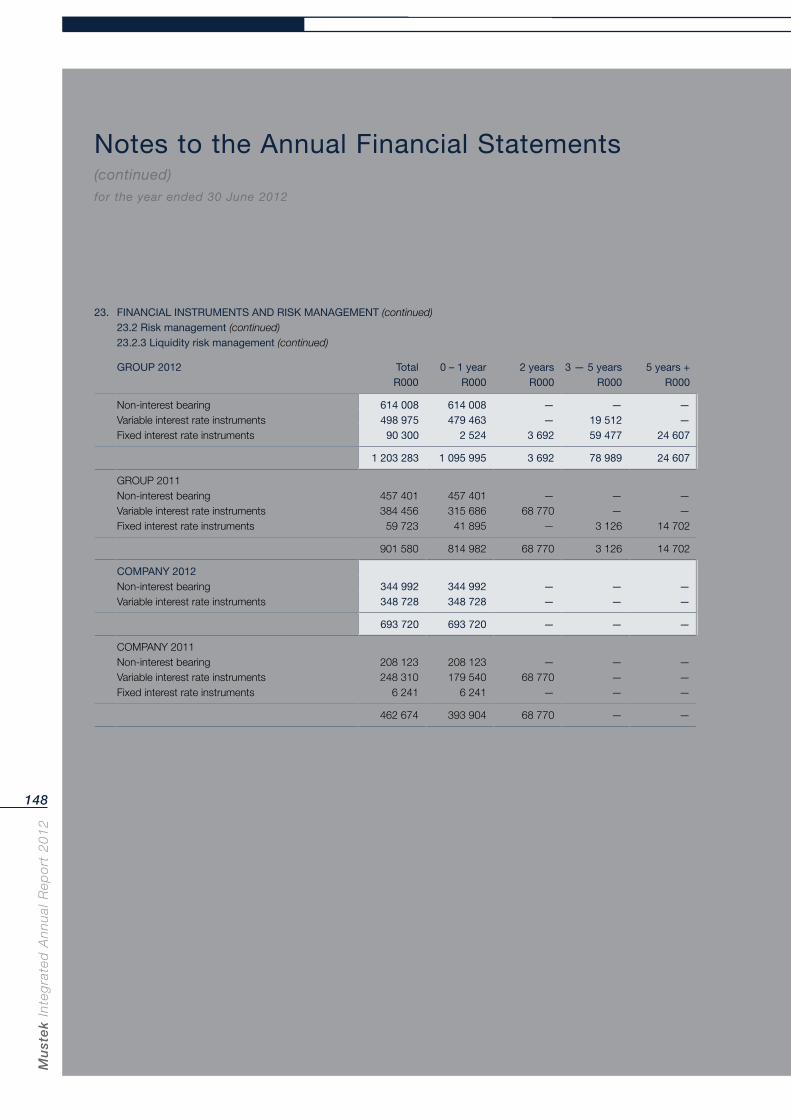
Mu
ste
k In
teg
rate
d A
nn
ual
Rep
ort
20
12
148
Notes to the Annual Financial Statements (continued)for the year ended 30 June 2012
23. FINANCIAL INSTRUMENTS AND RISK MANAGEMENT (continued)23.2 Risk management (continued)23.2.3 Liquidity risk management (continued)
GROUP 2012 Total 0 – 1 year 2 years 3 — 5 years 5 years +R000 R000 R000 R000 R000
Non-interest bearing 614 008 614 008 — — —Variable interest rate instruments 498 975 479 463 — 19 512 —Fixed interest rate instruments 90 300 2 524 3 692 59 477 24 607
1 203 283 1 095 995 3 692 78 989 24 607
GROUP 2011Non-interest bearing 457 401 457 401 — — —Variable interest rate instruments 384 456 315 686 68 770 — —Fixed interest rate instruments 59 723 41 895 — 3 126 14 702
901 580 814 982 68 770 3 126 14 702
COMPANY 2012Non-interest bearing 344 992 344 992 — — —Variable interest rate instruments 348 728 348 728 — — —
693 720 693 720 — — —
COMPANY 2011Non-interest bearing 208 123 208 123 — — —Variable interest rate instruments 248 310 179 540 68 770 — —Fixed interest rate instruments 6 241 6 241 — — —
462 674 393 904 68 770 — —
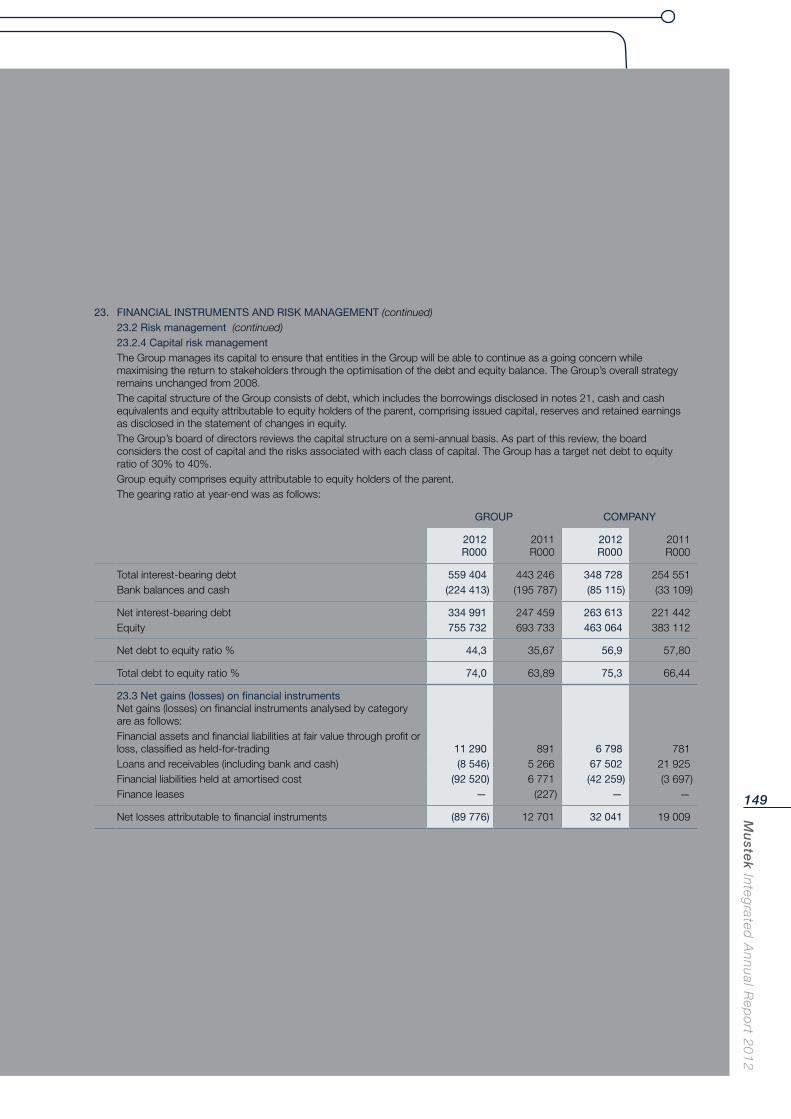
Mu
stek In
tegrated
An
nu
al Rep
ort 2
01
2
149
23. FINANCIAL INSTRUMENTS AND RISK MANAGEMENT (continued)23.2 Risk management (continued)23.2.4 Capital risk managementThe Group manages its capital to ensure that entities in the Group will be able to continue as a going concern while maximising the return to stakeholders through the optimisation of the debt and equity balance. The Group’s overall strategy remains unchanged from 2008.The capital structure of the Group consists of debt, which includes the borrowings disclosed in notes 21, cash and cash equivalents and equity attributable to equity holders of the parent, comprising issued capital, reserves and retained earnings as disclosed in the statement of changes in equity.The Group’s board of directors reviews the capital structure on a semi-annual basis. As part of this review, the board considers the cost of capital and the risks associated with each class of capital. The Group has a target net debt to equity ratio of 30% to 40%.Group equity comprises equity attributable to equity holders of the parent.The gearing ratio at year-end was as follows:
GROUP COMPANY
2012R000
2011R000
2012R000
2011R000
Total interest-bearing debt 559 404 443 246 348 728 254 551Bank balances and cash (224 413) (195 787) (85 115) (33 109)
Net interest-bearing debt 334 991 247 459 263 613 221 442Equity 755 732 693 733 463 064 383 112
Net debt to equity ratio % 44,3 35,67 56,9 57,80
Total debt to equity ratio % 74,0 63,89 75,3 66,44
23.3 Net gains (losses) on financial instrumentsNet gains (losses) on financial instruments analysed by category are as follows:Financial assets and financial liabilities at fair value through profit or loss, classified as held-for-trading 11 290 891 6 798 781Loans and receivables (including bank and cash) (8 546) 5 266 67 502 21 925Financial liabilities held at amortised cost (92 520) 6 771 (42 259) (3 697)Finance leases — (227) — —
Net losses attributable to financial instruments (89 776) 12 701 32 041 19 009
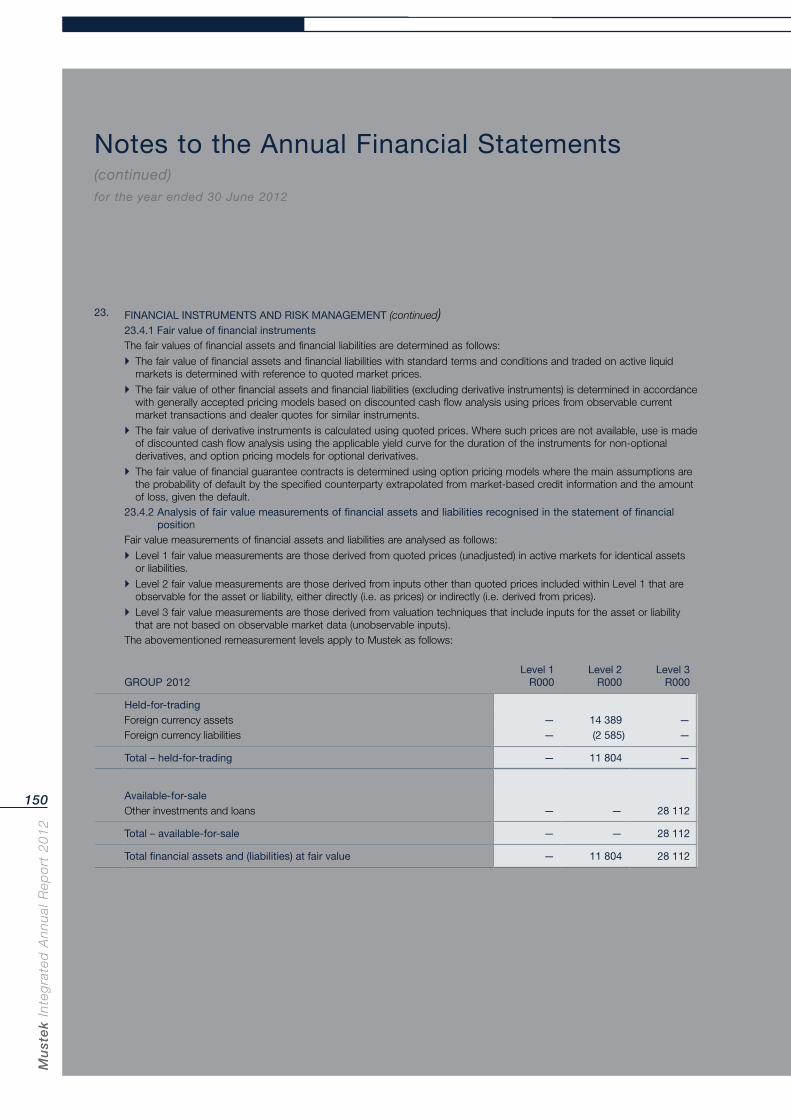
Mu
ste
k In
teg
rate
d A
nn
ual
Rep
ort
20
12
150
Notes to the Annual Financial Statements (continued)for the year ended 30 June 2012
23. FINANCIAL INSTRUMENTS AND RISK MANAGEMENT (continued)23.4.1 Fair value of financial instrumentsThe fair values of financial assets and financial liabilities are determined as follows:
The fair value of financial assets and financial liabilities with standard terms and conditions and traded on active liquid markets is determined with reference to quoted market prices.
The fair value of other financial assets and financial liabilities (excluding derivative instruments) is determined in accordance with generally accepted pricing models based on discounted cash flow analysis using prices from observable current market transactions and dealer quotes for similar instruments.
The fair value of derivative instruments is calculated using quoted prices. Where such prices are not available, use is made of discounted cash flow analysis using the applicable yield curve for the duration of the instruments for non-optional derivatives, and option pricing models for optional derivatives.
The fair value of financial guarantee contracts is determined using option pricing models where the main assumptions are the probability of default by the specified counterparty extrapolated from market-based credit information and the amount of loss, given the default.
23.4.2 Analysis of fair value measurements of financial assets and liabilities recognised in the statement of financial position
Fair value measurements of financial assets and liabilities are analysed as follows:
Level 1 fair value measurements are those derived from quoted prices (unadjusted) in active markets for identical assets or liabilities.
Level 2 fair value measurements are those derived from inputs other than quoted prices included within Level 1 that are observable for the asset or liability, either directly (i.e. as prices) or indirectly (i.e. derived from prices).
Level 3 fair value measurements are those derived from valuation techniques that include inputs for the asset or liability that are not based on observable market data (unobservable inputs).
The abovementioned remeasurement levels apply to Mustek as follows:
GROUP 2012Level 1
R000Level 2
R000Level 3
R000
Held-for-tradingForeign currency assets — 14 389 —Foreign currency liabilities — (2 585) —
Total – held-for-trading — 11 804 —
Available-for-saleOther investments and loans — — 28 112
Total – available-for-sale — — 28 112
Total financial assets and (liabilities) at fair value — 11 804 28 112
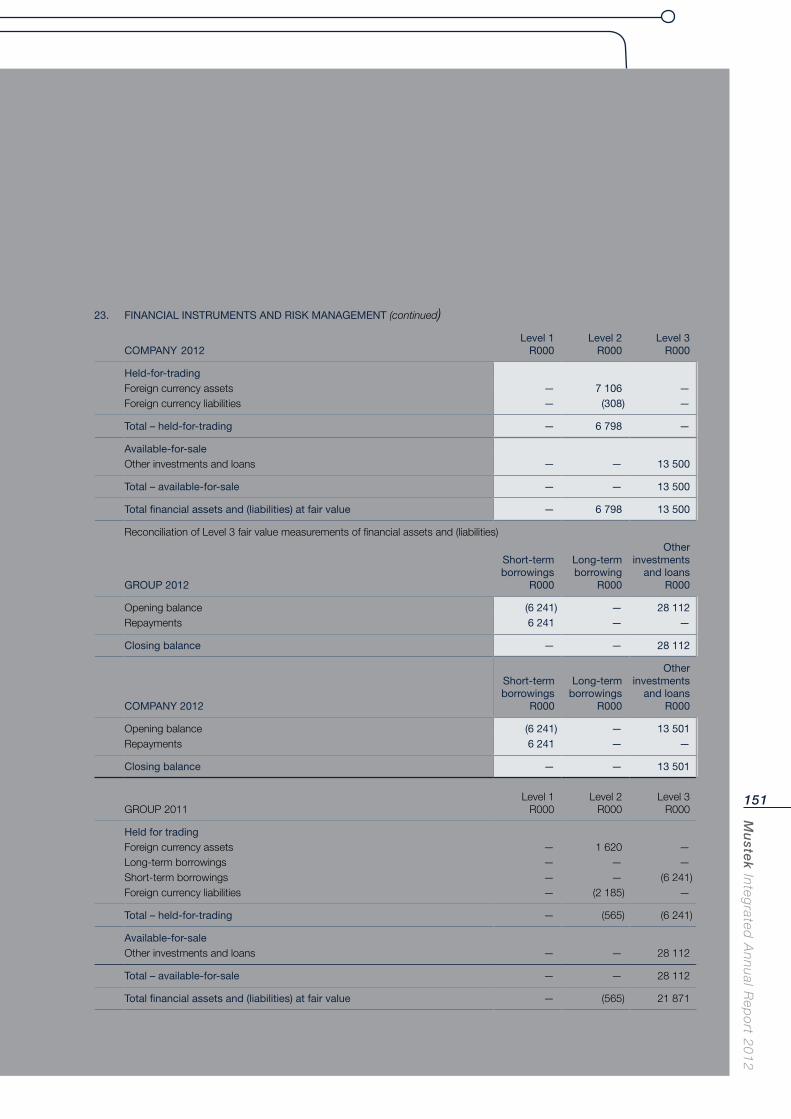
Mu
stek In
tegrated
An
nu
al Rep
ort 2
01
2
151
23. FINANCIAL INSTRUMENTS AND RISK MANAGEMENT (continued)
COMPANY 2012Level 1
R000Level 2
R000Level 3
R000
Held-for-tradingForeign currency assets — 7 106 —Foreign currency liabilities — (308) —
Total – held-for-trading — 6 798 —
Available-for-saleOther investments and loans — — 13 500
Total – available-for-sale — — 13 500
Total financial assets and (liabilities) at fair value — 6 798 13 500
Reconciliation of Level 3 fair value measurements of financial assets and (liabilities)
GROUP 2012
Short-term borrowings
R000
Long-term borrowing
R000
Other investments
and loansR000
Opening balance (6 241) — 28 112Repayments 6 241 — —
Closing balance — — 28 112
COMPANY 2012
Short-term borrowings
R000
Long-term borrowings
R000
Other investments
and loansR000
Opening balance (6 241) — 13 501Repayments 6 241 — —
Closing balance — — 13 501
GROUP 2011Level 1
R000Level 2
R000Level 3
R000
Held for tradingForeign currency assets — 1 620 —Long-term borrowings — — —Short-term borrowings — — (6 241)Foreign currency liabilities — (2 185) —
Total – held-for-trading — (565) (6 241)
Available-for-saleOther investments and loans — — 28 112
Total – available-for-sale — — 28 112
Total financial assets and (liabilities) at fair value — (565) 21 871
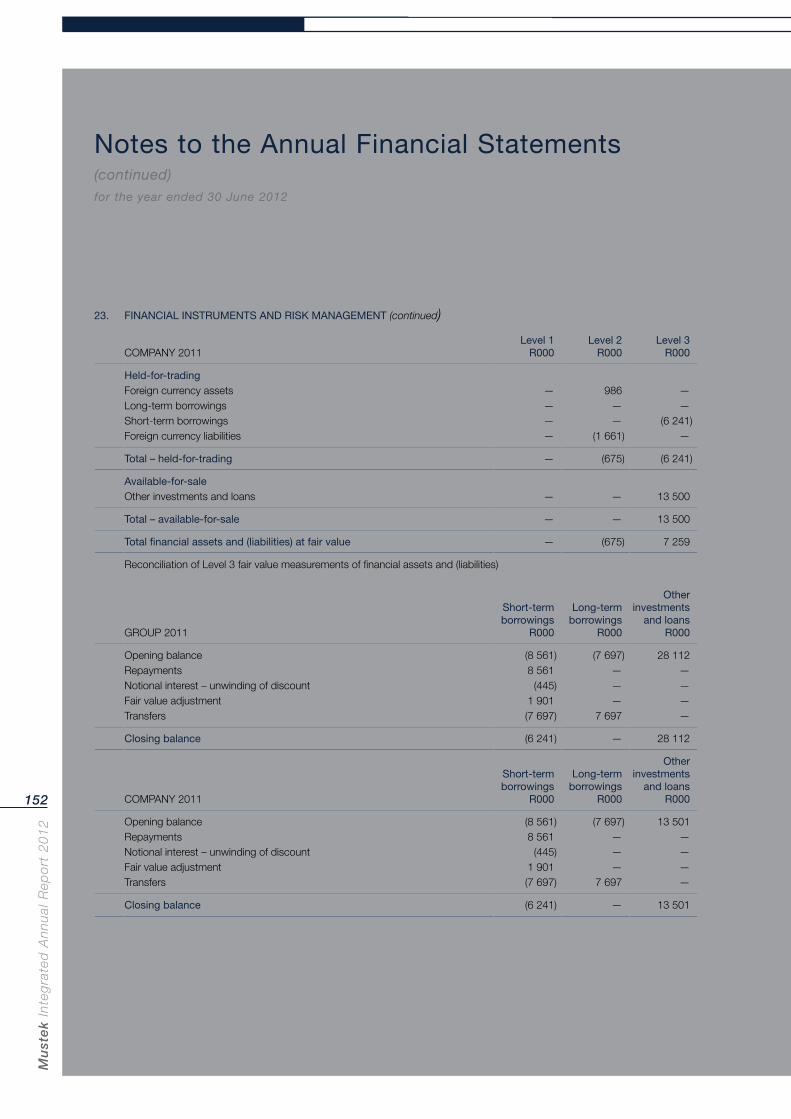
Mu
ste
k In
teg
rate
d A
nn
ual
Rep
ort
20
12
152
Notes to the Annual Financial Statements (continued)for the year ended 30 June 2012
23. FINANCIAL INSTRUMENTS AND RISK MANAGEMENT (continued)
COMPANY 2011Level 1
R000Level 2
R000Level 3
R000
Held-for-tradingForeign currency assets — 986 —Long-term borrowings — — —Short-term borrowings — — (6 241)Foreign currency liabilities — (1 661) —
Total – held-for-trading — (675) (6 241)
Available-for-saleOther investments and loans — — 13 500
Total – available-for-sale — — 13 500
Total financial assets and (liabilities) at fair value — (675) 7 259
Reconciliation of Level 3 fair value measurements of financial assets and (liabilities)
GROUP 2011
Short-term borrowings
R000
Long-term borrowings
R000
Other investments
and loansR000
Opening balance (8 561) (7 697) 28 112Repayments 8 561 — —Notional interest – unwinding of discount (445) — —Fair value adjustment 1 901 — —Transfers (7 697) 7 697 —
Closing balance (6 241) — 28 112
COMPANY 2011
Short-term borrowings
R000
Long-term borrowings
R000
Other investments
and loansR000
Opening balance (8 561) (7 697) 13 501Repayments 8 561 — —Notional interest – unwinding of discount (445) — —Fair value adjustment 1 901 — —Transfers (7 697) 7 697 —
Closing balance (6 241) — 13 501
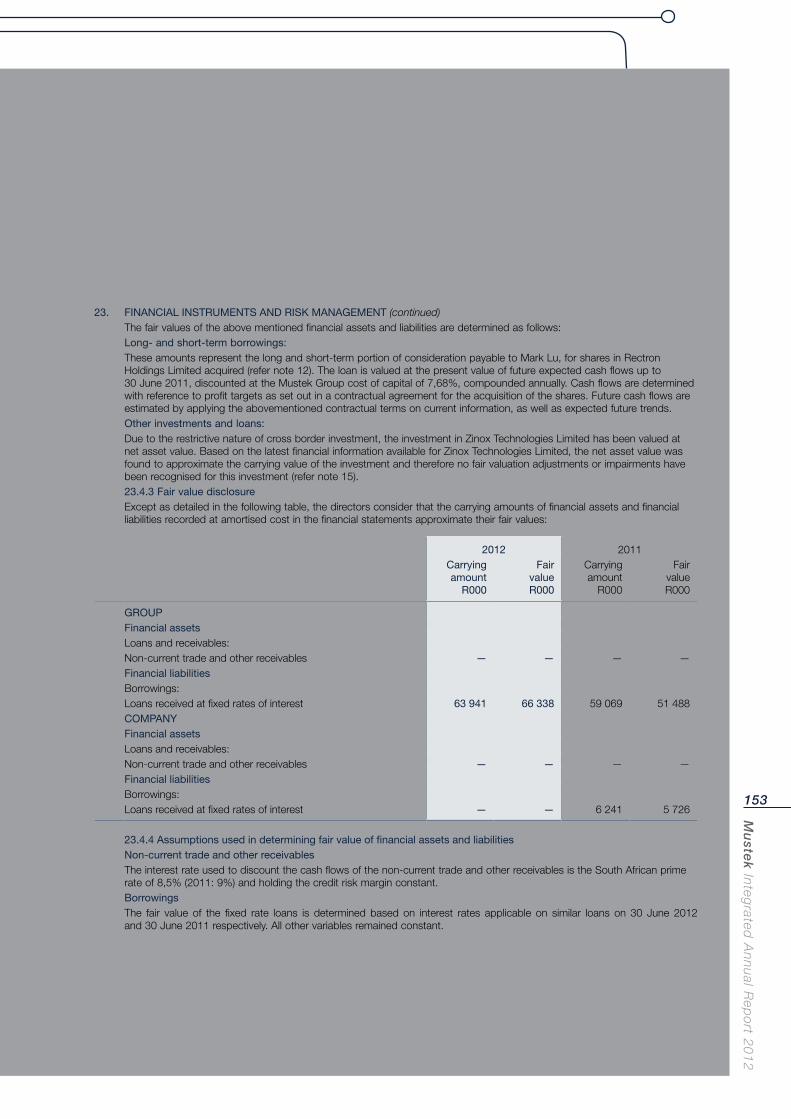
Mu
stek In
tegrated
An
nu
al Rep
ort 2
01
2
153
23. FINANCIAL INSTRUMENTS AND RISK MANAGEMENT (continued)The fair values of the above mentioned financial assets and liabilities are determined as follows:Long- and short-term borrowings:These amounts represent the long and short-term portion of consideration payable to Mark Lu, for shares in Rectron Holdings Limited acquired (refer note 12). The loan is valued at the present value of future expected cash flows up to 30 June 2011, discounted at the Mustek Group cost of capital of 7,68%, compounded annually. Cash flows are determined with reference to profit targets as set out in a contractual agreement for the acquisition of the shares. Future cash flows are estimated by applying the abovementioned contractual terms on current information, as well as expected future trends.Other investments and loans:Due to the restrictive nature of cross border investment, the investment in Zinox Technologies Limited has been valued at net asset value. Based on the latest financial information available for Zinox Technologies Limited, the net asset value was found to approximate the carrying value of the investment and therefore no fair valuation adjustments or impairments have been recognised for this investment (refer note 15).23.4.3 Fair value disclosureExcept as detailed in the following table, the directors consider that the carrying amounts of financial assets and financial liabilities recorded at amortised cost in the financial statements approximate their fair values:
2012 2011Carrying amount
R000
FairvalueR000
Carrying amount
R000
Fair valueR000
GROUPFinancial assetsLoans and receivables:Non-current trade and other receivables — — — —Financial liabilities Borrowings: Loans received at fixed rates of interest 63 941 66 338 59 069 51 488COMPANY Financial assets Loans and receivables: Non-current trade and other receivables — — — —Financial liabilities Borrowings: Loans received at fixed rates of interest — — 6 241 5 726
23.4.4 Assumptions used in determining fair value of financial assets and liabilitiesNon-current trade and other receivablesThe interest rate used to discount the cash flows of the non-current trade and other receivables is the South African prime rate of 8,5% (2011: 9%) and holding the credit risk margin constant.BorrowingsThe fair value of the fixed rate loans is determined based on interest rates applicable on similar loans on 30 June 2012 and 30 June 2011 respectively. All other variables remained constant.
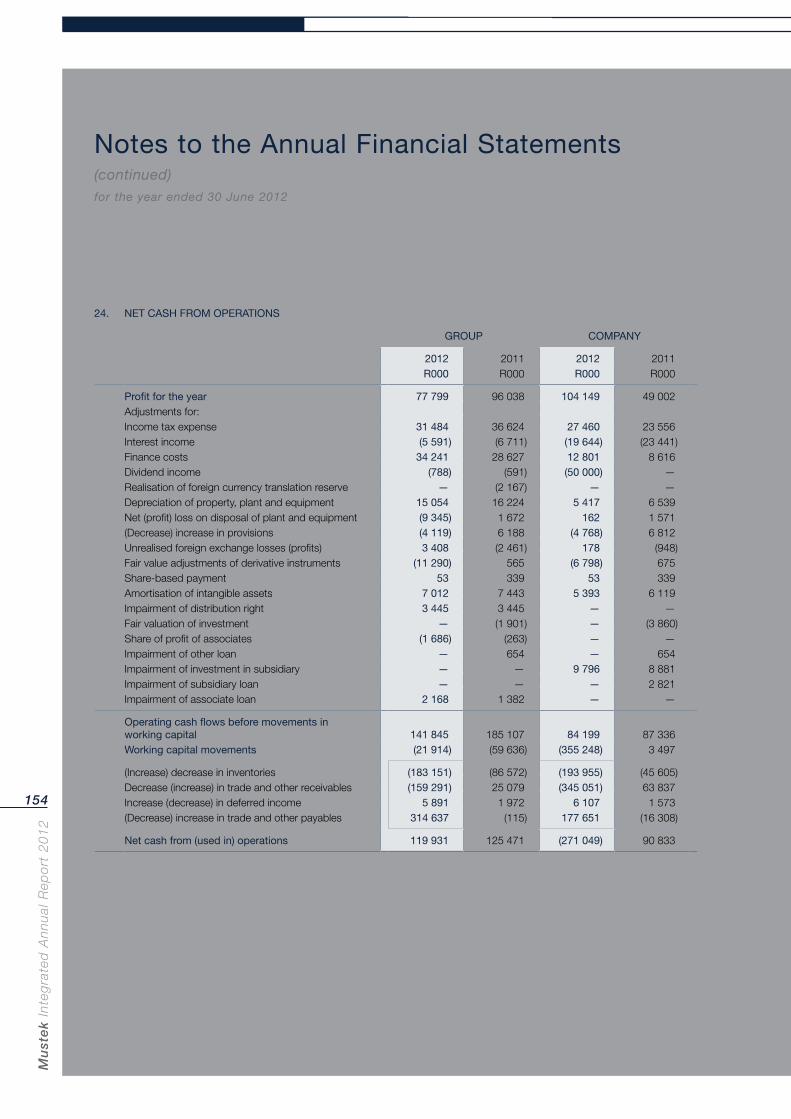
Mu
ste
k In
teg
rate
d A
nn
ual
Rep
ort
20
12
154
Notes to the Annual Financial Statements (continued)for the year ended 30 June 2012
24. NET CASH FROM OPERATIONS
GROUP COMPANY
2012 2011 2012 2011R000 R000 R000 R000
Profit for the year 77 799 96 038 104 149 49 002Adjustments for:Income tax expense 31 484 36 624 27 460 23 556Interest income (5 591) (6 711) (19 644) (23 441)Finance costs 34 241 28 627 12 801 8 616Dividend income (788) (591) (50 000) —Realisation of foreign currency translation reserve — (2 167) — —Depreciation of property, plant and equipment 15 054 16 224 5 417 6 539Net (profit) loss on disposal of plant and equipment (9 345) 1 672 162 1 571(Decrease) increase in provisions (4 119) 6 188 (4 768) 6 812Unrealised foreign exchange losses (profits) 3 408 (2 461) 178 (948)Fair value adjustments of derivative instruments (11 290) 565 (6 798) 675Share-based payment 53 339 53 339Amortisation of intangible assets 7 012 7 443 5 393 6 119Impairment of distribution right 3 445 3 445 — —Fair valuation of investment — (1 901) — (3 860)Share of profit of associates (1 686) (263) — —Impairment of other loan — 654 — 654Impairment of investment in subsidiary — — 9 796 8 881Impairment of subsidiary loan — — — 2 821Impairment of associate loan 2 168 1 382 — —
Operating cash flows before movements in working capital 141 845 185 107 84 199 87 336Working capital movements (21 914) (59 636) (355 248) 3 497
(Increase) decrease in inventories (183 151) (86 572) (193 955) (45 605)Decrease (increase) in trade and other receivables (159 291) 25 079 (345 051) 63 837Increase (decrease) in deferred income 5 891 1 972 6 107 1 573(Decrease) increase in trade and other payables 314 637 (115) 177 651 (16 308)
Net cash from (used in) operations 119 931 125 471 (271 049) 90 833
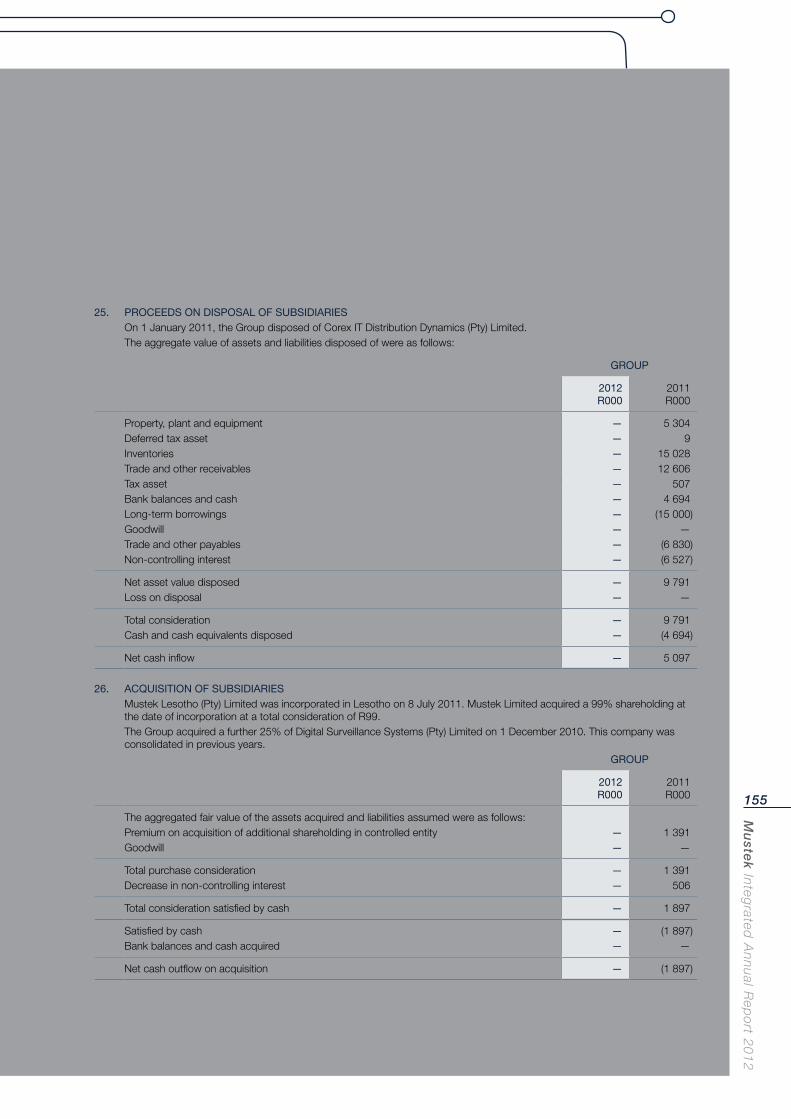
Mu
stek In
tegrated
An
nu
al Rep
ort 2
01
2
155
25. PROCEEDS ON DISPOSAL OF SUBSIDIARIESOn 1 January 2011, the Group disposed of Corex IT Distribution Dynamics (Pty) Limited.The aggregate value of assets and liabilities disposed of were as follows:
GROUP
2012R000
2011R000
Property, plant and equipment — 5 304Deferred tax asset — 9Inventories — 15 028Trade and other receivables — 12 606Tax asset — 507Bank balances and cash — 4 694Long-term borrowings — (15 000)Goodwill — —Trade and other payables — (6 830)Non-controlling interest — (6 527)
Net asset value disposed — 9 791Loss on disposal — —
Total consideration — 9 791Cash and cash equivalents disposed — (4 694)
Net cash inflow — 5 097
26. ACQUISITION OF SUBSIDIARIESMustek Lesotho (Pty) Limited was incorporated in Lesotho on 8 July 2011. Mustek Limited acquired a 99% shareholding at the date of incorporation at a total consideration of R99.The Group acquired a further 25% of Digital Surveillance Systems (Pty) Limited on 1 December 2010. This company was consolidated in previous years.
GROUP
2012R000
2011R000
The aggregated fair value of the assets acquired and liabilities assumed were as follows:Premium on acquisition of additional shareholding in controlled entity — 1 391Goodwill — —
Total purchase consideration — 1 391Decrease in non-controlling interest — 506
Total consideration satisfied by cash — 1 897
Satisfied by cash — (1 897)Bank balances and cash acquired — —
Net cash outflow on acquisition — (1 897)
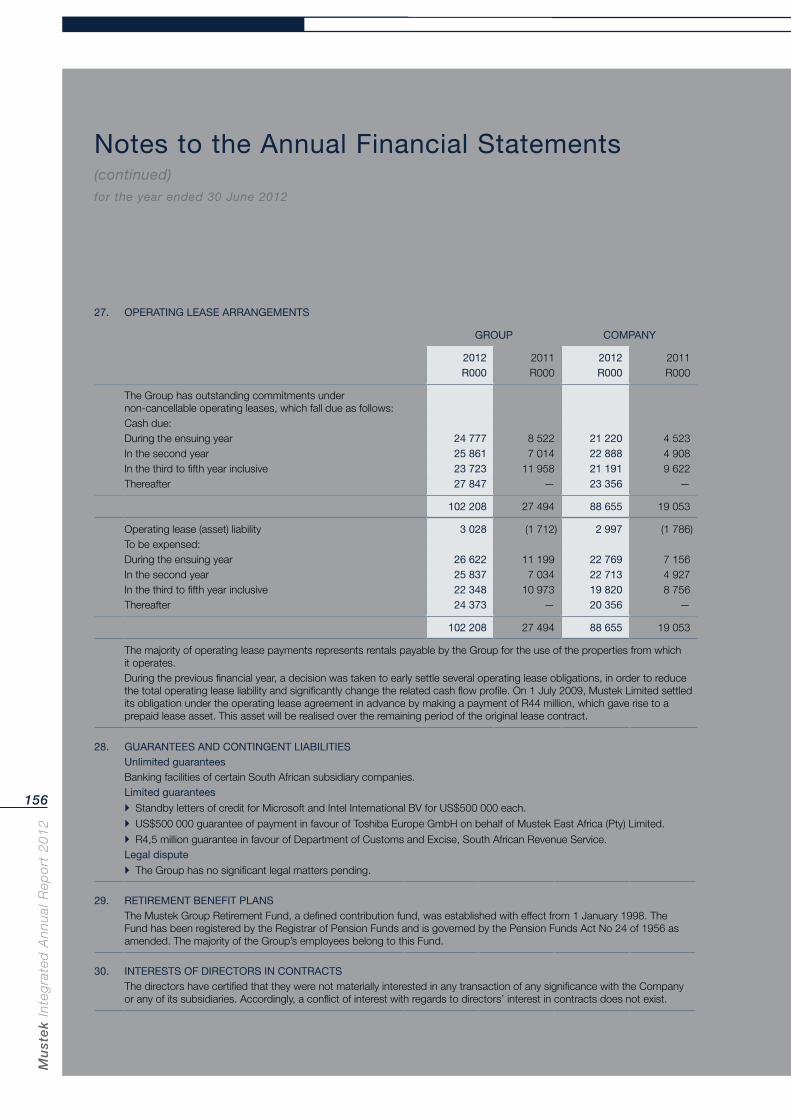
Mu
ste
k In
teg
rate
d A
nn
ual
Rep
ort
20
12
156
Notes to the Annual Financial Statements (continued)for the year ended 30 June 2012
27. OPERATING LEASE ARRANGEMENTS
GROUP COMPANY
2012 2011 2012 2011R000 R000 R000 R000
The Group has outstanding commitments under non-cancellable operating leases, which fall due as follows:Cash due:During the ensuing year 24 777 8 522 21 220 4 523In the second year 25 861 7 014 22 888 4 908In the third to fifth year inclusive 23 723 11 958 21 191 9 622Thereafter 27 847 — 23 356 —
102 208 27 494 88 655 19 053
Operating lease (asset) liability 3 028 (1 712) 2 997 (1 786)To be expensed:During the ensuing year 26 622 11 199 22 769 7 156In the second year 25 837 7 034 22 713 4 927In the third to fifth year inclusive 22 348 10 973 19 820 8 756Thereafter 24 373 — 20 356 —
102 208 27 494 88 655 19 053
The majority of operating lease payments represents rentals payable by the Group for the use of the properties from which it operates.During the previous financial year, a decision was taken to early settle several operating lease obligations, in order to reduce the total operating lease liability and significantly change the related cash flow profile. On 1 July 2009, Mustek Limited settled its obligation under the operating lease agreement in advance by making a payment of R44 million, which gave rise to a prepaid lease asset. This asset will be realised over the remaining period of the original lease contract.
28. GUARANTEES AND CONTINGENT LIABILITIESUnlimited guaranteesBanking facilities of certain South African subsidiary companies.Limited guarantees
Standby letters of credit for Microsoft and Intel International BV for US$500 000 each.
US$500 000 guarantee of payment in favour of Toshiba Europe GmbH on behalf of Mustek East Africa (Pty) Limited.
R4,5 million guarantee in favour of Department of Customs and Excise, South African Revenue Service.Legal dispute
The Group has no significant legal matters pending.
29. RETIREMENT BENEFIT PLANSThe Mustek Group Retirement Fund, a defined contribution fund, was established with effect from 1 January 1998. The Fund has been registered by the Registrar of Pension Funds and is governed by the Pension Funds Act No 24 of 1956 as amended. The majority of the Group’s employees belong to this Fund.
30. INTERESTS OF DIRECTORS IN CONTRACTSThe directors have certified that they were not materially interested in any transaction of any significance with the Company or any of its subsidiaries. Accordingly, a conflict of interest with regards to directors’ interest in contracts does not exist.
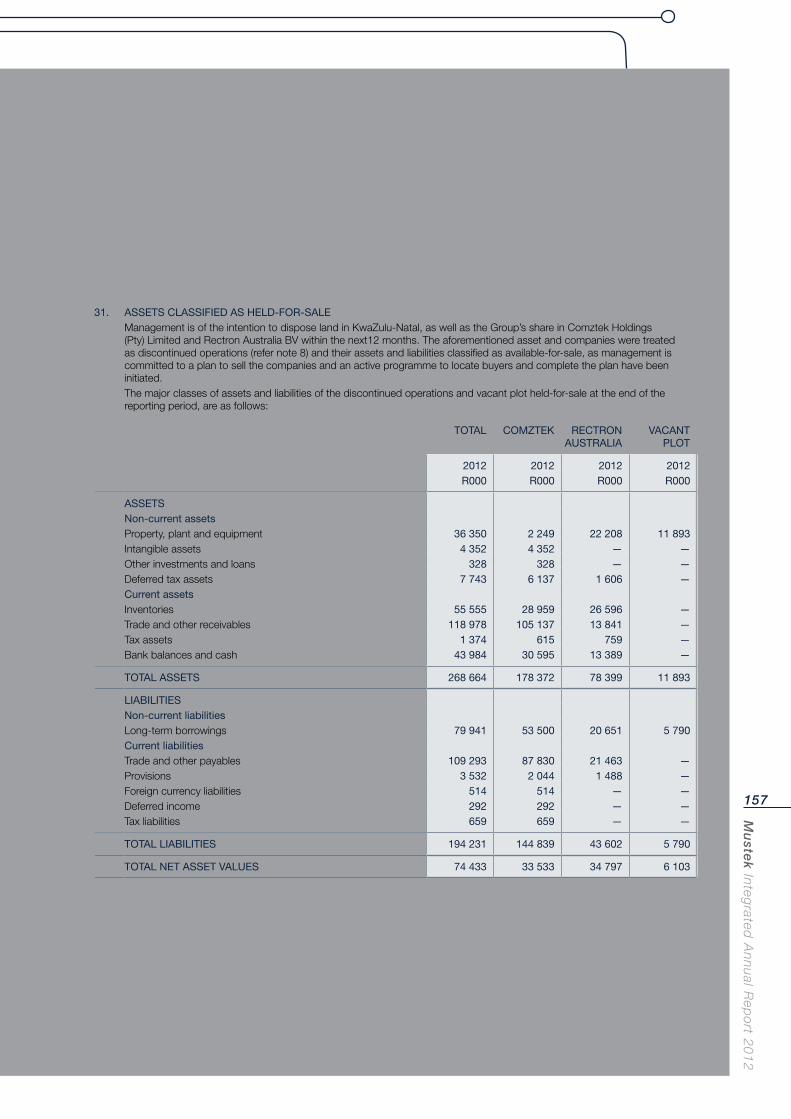
Mu
stek In
tegrated
An
nu
al Rep
ort 2
01
2
157
31. ASSETS CLASSIFIED AS HELD-FOR-SALEManagement is of the intention to dispose land in KwaZulu-Natal, as well as the Group’s share in Comztek Holdings (Pty) Limited and Rectron Australia BV within the next12 months. The aforementioned asset and companies were treated as discontinued operations (refer note 8) and their assets and liabilities classified as available-for-sale, as management is committed to a plan to sell the companies and an active programme to locate buyers and complete the plan have been initiated.The major classes of assets and liabilities of the discontinued operations and vacant plot held-for-sale at the end of the reporting period, are as follows:
TOTAL COMZTEK RECTRONAUSTRALIA
VACANT PLOT
2012 2012 2012 2012R000 R000 R000 R000
ASSETSNon-current assetsProperty, plant and equipment 36 350 2 249 22 208 11 893Intangible assets 4 352 4 352 — —Other investments and loans 328 328 — —Deferred tax assets 7 743 6 137 1 606 —Current assetsInventories 55 555 28 959 26 596 —Trade and other receivables 118 978 105 137 13 841 —Tax assets 1 374 615 759 —Bank balances and cash 43 984 30 595 13 389 —
TOTAL ASSETS 268 664 178 372 78 399 11 893
LIABILITIESNon-current liabilitiesLong-term borrowings 79 941 53 500 20 651 5 790Current liabilitiesTrade and other payables 109 293 87 830 21 463 —Provisions 3 532 2 044 1 488 —Foreign currency liabilities 514 514 — —Deferred income 292 292 — —Tax liabilities 659 659 — —
TOTAL LIABILITIES 194 231 144 839 43 602 5 790
TOTAL NET ASSET VALUES 74 433 33 533 34 797 6 103
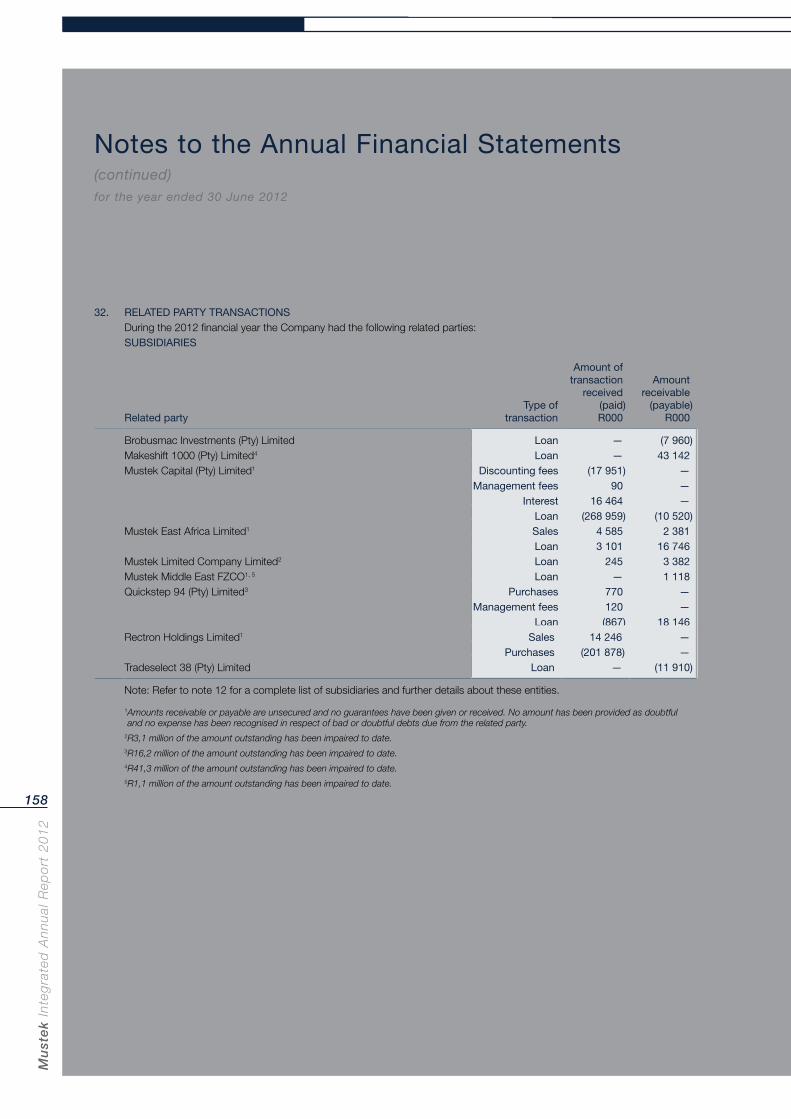
Mu
ste
k In
teg
rate
d A
nn
ual
Rep
ort
20
12
158
Notes to the Annual Financial Statements (continued)for the year ended 30 June 2012
32. RELATED PARTY TRANSACTIONSDuring the 2012 financial year the Company had the following related parties:SUBSIDIARIES
Related partyType of
transaction
Amount of transaction
received (paid)R000
Amount receivable
(payable)R000
Brobusmac Investments (Pty) Limited Loan — (7 960)Makeshift 1000 (Pty) Limited4 Loan — 43 142Mustek Capital (Pty) Limited1 Discounting fees (17 951) —
Management fees 90 —Interest 16 464 —
Loan (268 959) (10 520)Mustek East Africa Limited1 Sales 4 585 2 381
Loan 3 101 16 746Mustek Limited Company Limited2 Loan 245 3 382Mustek Middle East FZCO1, 5 Loan — 1 118Quickstep 94 (Pty) Limited3 Purchases 770 —
Management fees 120 —Loan (867) 18 146
Rectron Holdings Limited1 Sales 14 246 —Purchases (201 878) —
Tradeselect 38 (Pty) Limited Loan — (11 910)
Note: Refer to note 12 for a complete list of subsidiaries and further details about these entities.
1 Amounts receivable or payable are unsecured and no guarantees have been given or received. No amount has been provided as doubtful and no expense has been recognised in respect of bad or doubtful debts due from the related party.
2R3,1 million of the amount outstanding has been impaired to date.3R16,2 million of the amount outstanding has been impaired to date. 4R41,3 million of the amount outstanding has been impaired to date.5R1,1 million of the amount outstanding has been impaired to date.
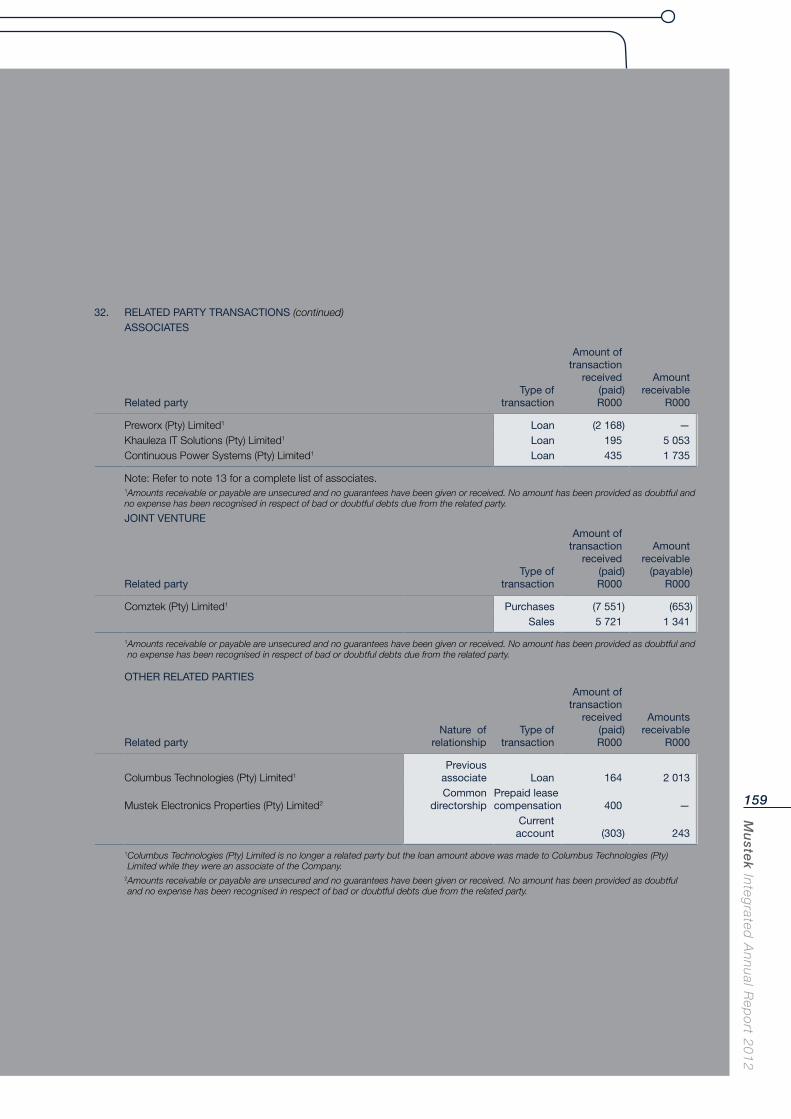
Mu
stek In
tegrated
An
nu
al Rep
ort 2
01
2
159
32. RELATED PARTY TRANSACTIONS (continued)ASSOCIATES
Related partyType of
transaction
Amount of transaction
received (paid)R000
Amount receivable
R000
Preworx (Pty) Limited1 Loan (2 168) —Khauleza IT Solutions (Pty) Limited1 Loan 195 5 053Continuous Power Systems (Pty) Limited1 Loan 435 1 735
Note: Refer to note 13 for a complete list of associates.1Amounts receivable or payable are unsecured and no guarantees have been given or received. No amount has been provided as doubtful and no expense has been recognised in respect of bad or doubtful debts due from the related party. JOINT VENTURE
Related partyType of
transaction
Amount of transaction
received (paid)R000
Amount receivable (payable)
R000
Comztek (Pty) Limited1 Purchases (7 551) (653)Sales 5 721 1 341
1 Amounts receivable or payable are unsecured and no guarantees have been given or received. No amount has been provided as doubtful and no expense has been recognised in respect of bad or doubtful debts due from the related party.
OTHER RELATED PARTIES
Related partyNature of
relationship
Type of
transaction
Amount of transaction
received (paid)R000
Amounts receivable
R000
Columbus Technologies (Pty) Limited1Previous
associate Loan 164 2 013
Mustek Electronics Properties (Pty) Limited2Common
directorshipPrepaid lease compensation 400 —
Current account (303) 243
1 Columbus Technologies (Pty) Limited is no longer a related party but the loan amount above was made to Columbus Technologies (Pty) Limited while they were an associate of the Company.
2 Amounts receivable or payable are unsecured and no guarantees have been given or received. No amount has been provided as doubtful and no expense has been recognised in respect of bad or doubtful debts due from the related party.

Mu
ste
k In
teg
rate
d A
nn
ual
Rep
ort
20
12
160
Notes to the Annual Financial Statements (continued)for the year ended 30 June 2012
32. RELATED PARTY TRANSACTIONS (continued)During the 2011 financial year the company had the following related parties:SUBSIDIARIES
Related party Type of
transaction
Amount of transaction
received (paid)R000
Amount receivable
(payable)R000
Brobusmac Investments (Pty) Limited Loan 552 (7 960)Makeshift 1000 (Pty) Limited4 Loan (981) 43 142Mustek Capital (Pty) Limited1 Discounting fees (23 772) —
Management fees 120 —Interest 21 850 —
Loan (632) 258 439Mustek East Africa Limited1 Sales 3 347 4 712
Loan (1 741) 13 645Mustek Limited Company Limited2 Loan 355 3 137Mustek Middle East FZCO1, 5 Loan (219) 1 118Quickstep 94 (Pty) Limited3 Purchases (256) —
Management fees 120 —Loan (91) 19 013
Rectron Holdings Limited1 Sales 2 443 130Purchases 5 2713 (3 311)
Tradeselect 38 (Pty) Limited Loan — (11 911)
Note: Refer to note 12 for a complete list of subsidiaries and further details about these entities.
1 Amounts receivable or payable are unsecured and no guarantees have been given or received. No amount has been provided as doubtful and no expense has been recognised in respect of bad or doubtful debts due from the related party.
2R3,1 million of the amount outstanding has been impaired to date.3R16,2 million of the amount outstanding has been impaired to date. 4R41,3 million of the amount outstanding has been impaired to date.5R1,1 million of the amount outstanding has been impaired to date.
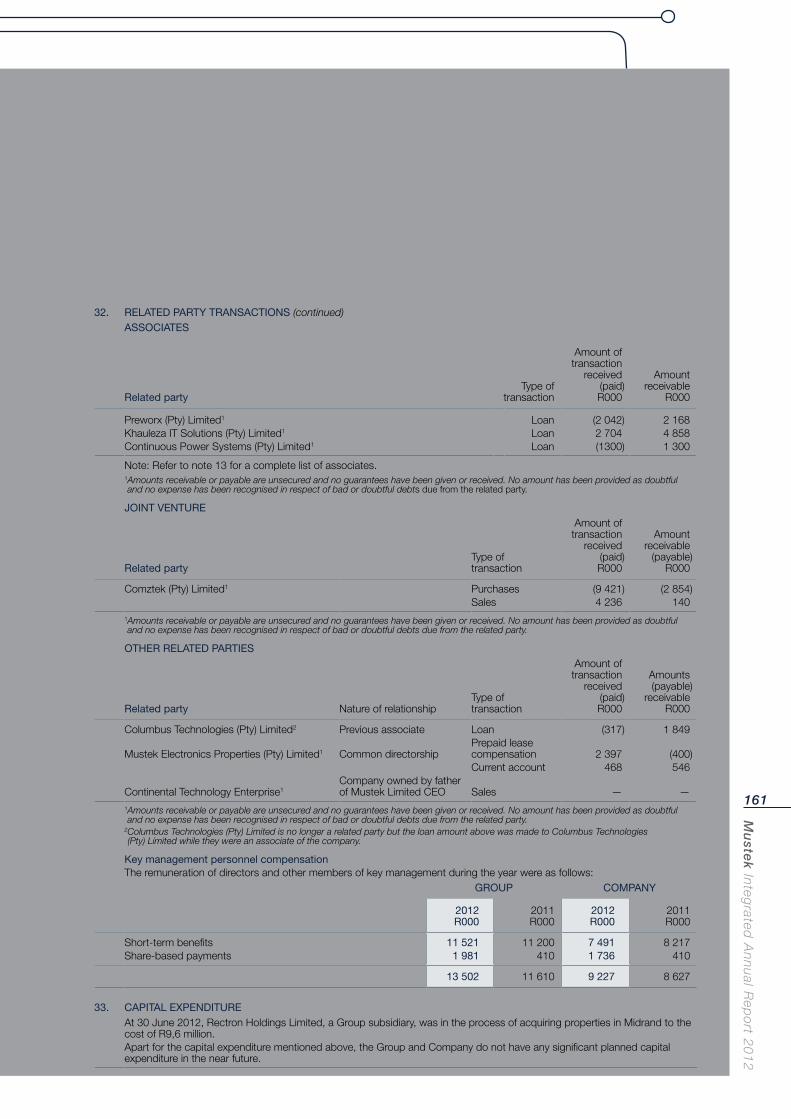
Mu
stek In
tegrated
An
nu
al Rep
ort 2
01
2
161
32. RELATED PARTY TRANSACTIONS (continued)ASSOCIATES
Related partyType of
transaction
Amount of transaction
received (paid)R000
Amount receivable
R000
Preworx (Pty) Limited1 Loan (2 042) 2 168Khauleza IT Solutions (Pty) Limited1 Loan 2 704 4 858Continuous Power Systems (Pty) Limited1 Loan (1300) 1 300
Note: Refer to note 13 for a complete list of associates.1 Amounts receivable or payable are unsecured and no guarantees have been given or received. No amount has been provided as doubtful and no expense has been recognised in respect of bad or doubtful debts due from the related party.
JOINT VENTURE
Related partyType of transaction
Amount of transaction
received (paid)R000
Amount receivable (payable)
R000
Comztek (Pty) Limited1 Purchases (9 421) (2 854)Sales 4 236 140
1 Amounts receivable or payable are unsecured and no guarantees have been given or received. No amount has been provided as doubtful and no expense has been recognised in respect of bad or doubtful debts due from the related party.
OTHER RELATED PARTIES
Related party Nature of relationshipType of transaction
Amount of transaction
received (paid)R000
Amounts (payable)
receivableR000
Columbus Technologies (Pty) Limited2 Previous associate Loan (317) 1 849
Mustek Electronics Properties (Pty) Limited1 Common directorshipPrepaid lease compensation 2 397 (400)Current account 468 546
Continental Technology Enterprise1Company owned by father of Mustek Limited CEO Sales — —
1 Amounts receivable or payable are unsecured and no guarantees have been given or received. No amount has been provided as doubtful and no expense has been recognised in respect of bad or doubtful debts due from the related party.
2 Columbus Technologies (Pty) Limited is no longer a related party but the loan amount above was made to Columbus Technologies (Pty) Limited while they were an associate of the company.
Key management personnel compensationThe remuneration of directors and other members of key management during the year were as follows:
GROUP COMPANY
2012R000
2011R000
2012R000
2011R000
Short-term benefits 11 521 11 200 7 491 8 217Share-based payments 1 981 410 1 736 410
13 502 11 610 9 227 8 627
33. CAPITAL EXPENDITUREAt 30 June 2012, Rectron Holdings Limited, a Group subsidiary, was in the process of acquiring properties in Midrand to the cost of R9,6 million.Apart for the capital expenditure mentioned above, the Group and Company do not have any significant planned capital expenditure in the near future.
Mu
ste
k In
teg
rate
d A
nn
ual
Rep
ort
20
12
162
Shareholder Information
Notice of Annual General Meeting
Notice is hereby given that the Annual General Meeting of the Company’s shareholders will be held at Mustek Limited’s head office at 322 15th Road, Randjespark, Midrand on Friday, 14 December 2012 at 10:00 (“the Annual General Meeting”).
Purpose
The purpose of the meeting is to transact the business set out in this notice of Annual General Meeting (“AGM notice”) by considering and, if deemed fit, passing, with or without modification, the ordinary and special resolutions hereunder. For the avoidance of doubt, the memorandum and articles of association of the Company are referred to as the memorandum of incorporation in accordance with the terminology used in the new Companies Act 2008 (Act 71 of 2008), as amended (“the Companies Act”), which became effective on 1 May 2011.
Agenda
1. Presentation and consideration of the annual financial statements of the Company, including the reports of the directors and the Audit and Risk Committee for the year ended 30 June 2012 as set out in the Company’s Integrated Annual Report 2012 of which this AGM notice forms part; and
2. To consider and, if deemed fit, approve, with or without modification, the following special and ordinary resolutions:
Note: For any of the ordinary resolutions numbers 1 to 10 and 12 to be adopted, more than 50% of the voting rights exercised on each such ordinary resolution must be exercised in favour thereof.
For any of the special resolutions numbers 1 to 5 to be adopted, more than 75% of the voting rights exercised on each such ordinary resolution must be exercised in favour thereof.
For ordinary resolution number 11 to be adopted, more than 75% of the voting rights exercised on each such ordinary resolution must be exercised in favour thereof.
1. Ordinary business
1.1 Re-election of directors
1.1.1 Ordinary resolution number 1: Re-election of ME Gama
“Resolved that ME Gama, who retires by rotation in terms of the memorandum of incorporation of the Company and, being eligible and offering himself
for re-election, be and is hereby re-elected as director.”
An abbreviated curriculum vitae in respect of ME Gama may be viewed on page 64 of the Annual Integrated Report of which this notice forms part.
1.1.2 Ordinary resolution number 2: Re-election of D Konar
“Resolved that D Konar, who retires by rotation in terms of the memorandum of incorporation of the Company and, being eligible and offering himself for re-election, be and is hereby re-elected as director.”
An abbreviated curriculum vitae in respect of D Konar may be viewed on page 64 of the Integrated Annual Report of which this notice forms part.
Reason for ordinary resolutions numbers 1 and 2
The reason for ordinary resolutions numbers 1 and 2 is that article 65 of the memorandum of incorporation of the Company and, to the extent applicable, the Companies Act, requires that a component of the non-executive directors rotate at the Annual General Meeting and, being eligible may offer themselves for re-election as directors.
1.2 Re-appointment of auditors
1.2.1 Ordinary resolution number 3: Confirmation of the re-appointment of the auditors
“Resolved that the re-appointment of Deloitte & Touche as independent auditors of the Company for the ensuing year (the designated auditor being Mr BE Greyling) on the recommendation of the Company’s Audit and Risk Committee be hereby ratified.”
Reason for ordinary resolution number 3
The reason for ordinary resolution number 3 is that the Company, being a public listed Company, must have its financial results audited and such auditor must be appointed or re-appointed each year at the Annual General Meeting of the Company as required by the Companies Act.
Mustek Limited(Incorporated in the Republic of South Africa) (Registration number: 1987/070161/06)
Share code: MST ISIN: ZAE000012373(“Mustek” or “the Company”)
Mu
stek In
tegrated
An
nu
al Rep
ort 2
01
2
163
1.3 Auditors’ remuneration
1.3.1 Ordinary resolution number 4: Confirmation of the auditors’ remuneration
“Resolved that the auditors’ remuneration for the year ended 30 June 2012 as determined by the Audit and Risk Committee of the Company be and is hereby confirmed.”
Reason for ordinary resolution number 4
The reason for ordinary resolution number 4 is that the memorandum of incorporation of the Company requires that the remuneration of the auditor be considered at the Annual General Meeting.
1.4 Election of members to the Audit and Risk Committee
1.4.1 Ordinary resolution number 5: Appointment of RB Patmore as a member to the Audit and Risk Committee
“Resolved that RB Patmore be elected a member of the Audit and Risk Committee, with effect from the conclusion of this Annual General Meeting in terms of section 94(2) of the Companies Act.”
An abbreviated curriculum vitae in respect of RB Patmore may be viewed on page 64 of the Integrated Annual Report of which this notice forms part.
1.4.2 Ordinary resolution number 6: Appointment of T Dingaan as a member to the Audit and Risk Committee
“Resolved that T Dingaan be elected a member of the Audit and Risk Committee, with effect from the conclusion of this Annual General Meeting in terms of section 94(2) of the Companies Act.”
An abbreviated curriculum vitae in respect of T Dingaan may be viewed on page 64 of the Integrated Annual Report of which this notice forms part.
1.4.3 Ordinary resolution number 7: Appointment of ME Gama as a member to the Audit and Risk Committee
“Resolved that ME Gama be elected a member of the Audit and Risk Committee,
with effect from the conclusion of this Annual General Meeting in terms of section 94(2) of the Companies Act.”
An abbreviated curriculum vitae in respect of ME Gama may be viewed on page 64 of the Integrated Annual Report of which this notice forms part.
Reason for ordinary resolutions number 5 to 7
The reason for ordinary resolution numbers 5 to 7 (inclusive) is that the Company, being a public listed company, must appoint an audit committee as prescribed by sections 66(2) and 94(2) of the Companies Act, which also requires that the members of such audit committee be appointed, or re-appointed, as the case may be, at each Annual General Meeting of a company.
1.5 Ordinary resolution number 8: Endorsement of Remuneration Philosophy
To endorse the Company’s remuneration philosophy, as set out in the Remuneration Report on pages 60 and 61 of the Integrated Annual Report, by way of a non-binding advisory note.
Reason for ordinary resolution number 8
The reason for ordinary resolution number 8 is that King III recommends that the remuneration policy of the company be endorsed through a non-binding advisory vote by shareholders at the annual general meeting of a company.
1.6 Unissued shares placed under control of the directors
1.6.1 Ordinary resolution number 9: Placing unissued shares under directors’ control
“Resolved that the unissued shares in the company, limited to 5% of the number of shares in issue at 14 December 2012, be and are hereby placed under the control of the directors until the next Annual General Meeting and that they be and are hereby authorised to issue any such shares as they may deem fit, subject to the Companies Act, the memorandum of incorporation of the Company, and the provisions of the Listings Requirements of the JSE Limited (JSE), save that the aforementioned 5%
Mu
ste
k In
teg
rate
d A
nn
ual
Rep
ort
20
12
164
Shareholder Information (continued)
limitation shall not apply to any shares issued in terms of a rights offer.”
Reason for ordinary resolution number 9
The reason for ordinary resolution number 9 is that the Board requires authority from shareholders in terms of article 3 of its memorandum of incorporation to issue shares in the Company. This general authority, once granted, allows the Board from time to time, when it is appropriate to do so, to issue ordinary shares as may be required inter alia in terms of capital raising exercises, and to maintain a healthy capital adequacy ratio that may be required from time to time. This general authority is subject to the restriction that it is limited to 5% of the number of shares in issue at 14 December 2012 on the terms more fully set out in ordinary resolution number 9 and subject to the further restrictions set out in ordinary resolution number 11 below.
1.6.2 Ordinary resolution number 10: Placing a specific number of unissued shares under directors’ control in terms of the Mustek Executive Share Trust
“Resolved that 6 025 000 ordinary shares in the authorised but unissued share capital of the Company be and are hereby placed under the control of the directors of the Company as a specific authority for the allotment and issue of shares in terms of the Mustek Executive Share Trust.”
Reason for ordinary resolution number 10
The reason for ordinary resolution number 10 is that the Board requires authority from shareholders in terms of the Rules of the Mustek Executive Share Trust to execute the share options, previously issued in terms of this Trust.
1.7 General Authority to issue shares for cash
1.7.1 Ordinary resolution number 11: General authority to issue shares for cash
“Resolved that the directors of the Company be and are hereby authorised by way of a general authority, to allot and issue any of its unissued shares for cash placed
under their control as they in their discretion may deem fit, without restriction, subject to the provisions of the Listings Requirements of the JSE, and subject to the provision that the aggregate number of ordinary shares able to be allotted and issued in terms of this resolution, shall be limited to 5% of the issued share capital at 14 December 2012, provided that:
the approval shall be valid until the date of the next Annual General Meeting of the Company, provided it shall not extend beyond 15 months from the date of this resolution;
a paid press announcement giving full details, including the impact on net asset value and earnings per share, will be published after any issue representing, on a cumulative basis within any one financial year, 5% or more of the number of shares in issue prior to such issue;
the general issues of shares for cash in the aggregate in any one financial year may not exceed 5% of the Company’s issued share capital (number of securities) of that class. For purposes of determining whether the aforementioned 5% has been or will be reached, the securities of a particular class will be aggregated with the securities that are compulsorily convertible into securities of that class and, in the case of the issue of compulsorily convertible securities, aggregated with the securities of that class into which they are compulsorily convertible. The number of securities of a class which may be issued shall be based on the number of securities of that class in issue at the date of such application less any securities of the class issued during the current financial year, provided that any securities of that class to be issued pursuant to a rights issue (announced and irrevocable and underwritten) or acquisition (concluded up to the date of application) may be included as though they were securities in issue at the date of application;
Notice of Annual General Meeting (continued)
Mu
stek In
tegrated
An
nu
al Rep
ort 2
01
2
165
in determining the price at which an issue of shares will be made in terms of this authority the maximum discount permitted will be 10% of the weighted average traded price of such shares, as determined over the 30 trading days prior to the date that the price of the issue is agreed between the Company and the party subscribing for the securities. The JSE should be consulted for a ruling if the securities have not traded in such 30 business day period;
any such issue will only be made to public shareholders as defined in paragraphs 4.25 to 4.27 of the Listings Requirements of the JSE and not to related parties; and
any such issue will only be securities of a class already in issue or, if this is not the case, will be limited to such securities or rights that are convertible into a class already in issue.”
The reason for ordinary resolution number 11
For listed entities wishing to issue shares, it is necessary for the Board not only to obtain the prior authority of the shareholders as may be required in terms of their memorandum of incorporation contemplated in ordinary resolution number 11 above but it is also necessary to obtain the prior authority of shareholders in accordance with the Listings Requirements of the JSE. The reason for this resolution is accordingly to obtain a general authority from shareholders to issue shares in compliance with the Listings Requirements of the JSE. The authority granted in terms of this resolution number 9 must accordingly be read together with authority granted in terms of ordinary resolution
number 11 above and any exercise thereof will be subject to the conditions contained in ordinary resolution number 11.
Note: This resolution requires the approval of not less than 75% of the votes cast by shareholders present or represented by proxy and entitled to vote at this Annual General Meeting.
1.8 Authorised directors and /or the Company Secretary
1.8.2 Ordinary Resolution Number 12: Authority to action
“Resolved that any one director of the Company and/or the Company Secretary is hereby authorised to do all such things and sign all such documents as deemed necessary to implement the ordinary and special resolutions as set out in this notice convening the Annual General Meeting at which these resolutions will be considered.”
The reason for ordinary resolution number 12
The reason for ordinary resolution number 12 is to ensure that the resolutions voted favourably upon is duly implemented through the delegation of powers provided for in terms of article 52 of the Company’s memorandum of incorporation.
2. Special business
2.1 Special resolution number 1: Remuneration of non-executive directors
“Resolved that the remuneration payable to the non-executive directors be approved on the following basis with effect from this Annual General Meeting until the next Annual General Meeting held in 2013:
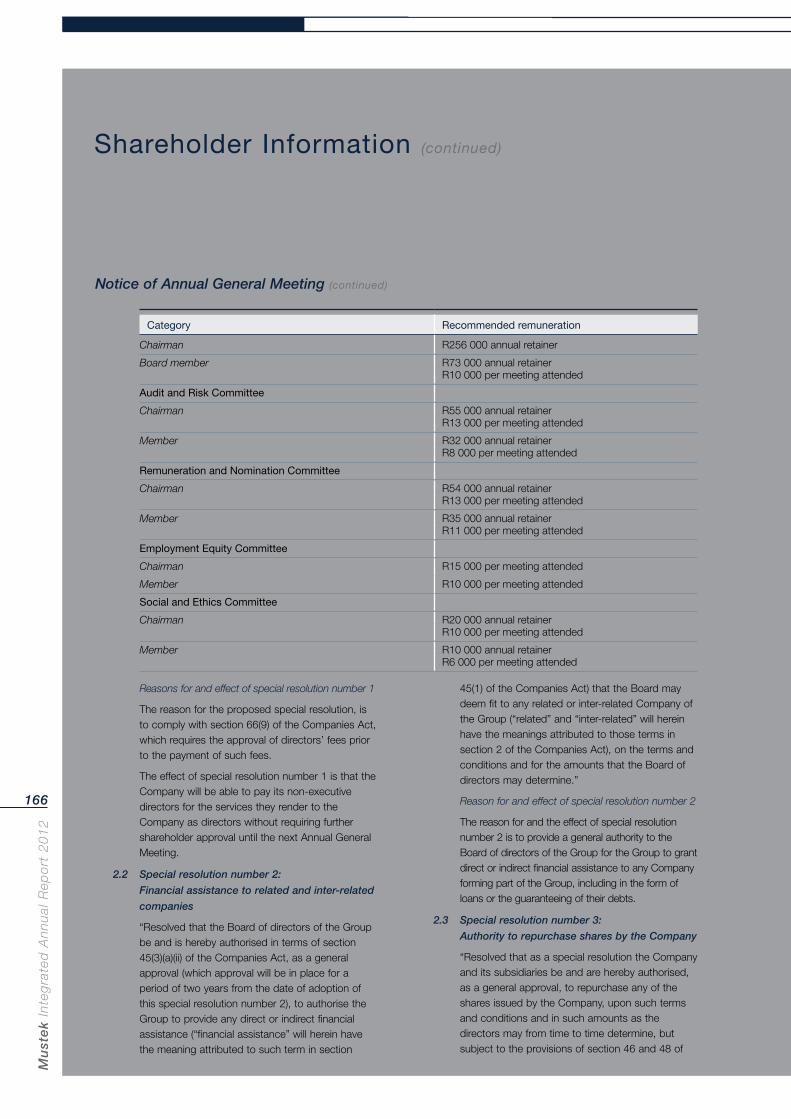
Mu
ste
k In
teg
rate
d A
nn
ual
Rep
ort
20
12
166
Category Recommended remuneration
Chairman R256 000 annual retainer
Board member R73 000 annual retainerR10 000 per meeting attended
Audit and Risk Committee
Chairman R55 000 annual retainerR13 000 per meeting attended
Member R32 000 annual retainerR8 000 per meeting attended
Remuneration and Nomination Committee
Chairman R54 000 annual retainerR13 000 per meeting attended
Member R35 000 annual retainerR11 000 per meeting attended
Employment Equity Committee
Chairman R15 000 per meeting attended
Member R10 000 per meeting attended
Social and Ethics Committee
Chairman R20 000 annual retainerR10 000 per meeting attended
Member R10 000 annual retainerR6 000 per meeting attended
Reasons for and effect of special resolution number 1
The reason for the proposed special resolution, is to comply with section 66(9) of the Companies Act, which requires the approval of directors’ fees prior to the payment of such fees.
The effect of special resolution number 1 is that the Company will be able to pay its non-executive directors for the services they render to the Company as directors without requiring further shareholder approval until the next Annual General Meeting.
2.2 Special resolution number 2:
Financial assistance to related and inter-related
companies
“Resolved that the Board of directors of the Group be and is hereby authorised in terms of section 45(3)(a)(ii) of the Companies Act, as a general approval (which approval will be in place for a period of two years from the date of adoption of this special resolution number 2), to authorise the Group to provide any direct or indirect financial assistance (“financial assistance” will herein have the meaning attributed to such term in section
45(1) of the Companies Act) that the Board may deem fit to any related or inter-related Company of the Group (“related” and “inter-related” will herein have the meanings attributed to those terms in section 2 of the Companies Act), on the terms and conditions and for the amounts that the Board of directors may determine.”
Reason for and effect of special resolution number 2
The reason for and the effect of special resolution number 2 is to provide a general authority to the Board of directors of the Group for the Group to grant direct or indirect financial assistance to any Company forming part of the Group, including in the form of loans or the guaranteeing of their debts.
2.3 Special resolution number 3:
Authority to repurchase shares by the Company
“Resolved that as a special resolution the Company and its subsidiaries be and are hereby authorised, as a general approval, to repurchase any of the shares issued by the Company, upon such terms and conditions and in such amounts as the directors may from time to time determine, but subject to the provisions of section 46 and 48 of
Shareholder Information (continued)
Notice of Annual General Meeting (continued)
Mu
stek In
tegrated
An
nu
al Rep
ort 2
01
2
167
the Companies Act, the memorandum of incorporation of the Company, the Listings Requirements of the JSE and the requirements of any other stock exchange on which the shares of the Company may be quoted or listed, namely that:
the general repurchase of the shares may only be implemented on the open market of the JSE and done without any prior understanding or arrangement between the Company and the counterparty;
this general authority shall only be valid until the next Annual General Meeting of the Company, provided that it shall not extend beyond 15 months from the date of this resolution;
an announcement must be published as soon as the Company has acquired shares constituting, on a cumulative basis, 3% of the number of shares in issue prior to the acquisition, pursuant to which the aforesaid 3% threshold is reached, containing full details thereof, as well as for each 3% in aggregate of the initial number of shares acquired thereafter;
the general authority to repurchase is limited to a maximum of 20% in the aggregate in any one financial year of the Company’s issued share capital at the time the authority is granted;
a resolution has been passed by the Board of directors approving the purchase, that the Company has satisfied the solvency and liquidity test as defined in the Companies Act and that since the solvency and liquidity test was applied there have been no material changes to the financial position or required shareholder spread of the Group;
the general repurchase is authorised by the Company’s memorandum of incorporation;
repurchases must not be made at a price more than 10% above the weighted average of the market value of the shares for five business days immediately preceding the date that the transaction is effected. The JSE should be consulted for a ruling if the applicant’s securities have not traded in such five business day period;
the Company may at any point in time only appoint one agent to effect any repurchase(s) on the Company’s behalf;
the Company and its subsidiaries may not effect a repurchase during any prohibited period as defined in terms of the Listings Requirements of the JSE unless there is a repurchase programme in place as contemplated in terms of 5.72(g) of the Listings Requirements of the JSE; and
the Company must ensure that its sponsor provides the JSE with the required working capital letters before it commences the repurchase of any shares.”
Reason and effect of special resolution number 3
The reason for and effect of special resolution number 3 is to grant the directors a general authority in terms of its memorandum of incorporation and the Listings Requirements of the JSE for the acquisition by the Company and/or its subsidiaries of shares issued by it on the basis reflected in the special resolution.
In terms of the Listings Requirements of the JSE any general repurchase by the Company and/or its subsidiaries must, inter alia, be limited to a maximum of 20% of the Company’s issued share capital in any one financial year of that class at the time the authority is granted.
2.4 Special resolution number 4:
Conversion of authorised share capital
“Resolved that, in terms of regulation 31 of the Companies Act Regulations 2011, all the ordinary shares in the share capital of the Company, comprising 250 000 000 authorised and 109 547 165 issued ordinary shares having a par value of R0,008 each, are without altering the substance of the specific rights and privileges associated therewith, converted into ordinary shares having no par value on the basis that each ordinary no par value share shall have the same value, rights and privileges as the value, rights and privileges which attached to such shares immediately prior to the passing of this special resolution number 4 and that the whole of the amounts standing to the credit of the share capital account and the share premium account of the Company be transferred to the stated capital account of the Company.”
Note: The Companies Act has abolished with the maintenance of capital rule and prescribes that all
Mu
ste
k In
teg
rate
d A
nn
ual
Rep
ort
20
12
168
shares to be issued henceforth shall have no par value. In order to bring the Company’s share capital structure into harmony with the provisions of the Companies Act the Board proposes a conversion of the current authorised shares into shares of no par value. The preferences, rights, limitations and other terms attaching to the no par value shares in the Company will be the same as the preferences, rights, limitations and other terms which are attached to the current authorised shares, immediately prior to their conversion into no par value shares.
In accordance with regulation 31(7) of the Companies Act Regulations 2011, the Board has prepared a report as set out in Appendix 1 forming part of and attached to this AGM notice which will be submitted to the Companies and Intellectual Property Commission (CIPC) and the South African Revenue Services (SARS) prior to the Annual General Meeting.
Reason for and effect of special resolution number 4
The reason for special resolution number 4 is to convert the ordinary shares in the Company’s authorised share capital from ordinary par value shares into ordinary shares of no par value.
The effect of special resolution number 4 is that the authorised and issued ordinary share capital of the Company shall be converted to shares of no par value.
2.5 Special resolution number 5:
Adoption of new memorandum of incorporation
“Resolved that subject to the passing of special resolution number 4 and in terms of section 16(1)(c)(ii) of the Companies Act, and item 4(2) of Schedule 5 to the Companies Act, the existing memorandum and articles of association of the Group be and are hereby amended and substituted in its entirety by the new memorandum of incorporation signed by the Chairman of the Annual General Meeting on the first page thereof for identification purposes, with effect from the date of filing of the required notice of amendment with CIPC.”
Reason for and effect of special resolution number 5
Special resolution number 5 is proposed in order to adopt a new memorandum of incorporation in
substitution for the existing memorandum and articles of association of the Group which contains provisions which are in conflict with the provisions of the Companies Act, but which conflicting provisions generally override the provisions of the Companies Act, which became effective on 1 May 2011, for a period of two years after the effective date of the Companies Act, in order to bring the Group’s constitutional documents in harmony with the provisions of the Companies Act. In terms of Item 4(2) of Schedule 5 to the Companies Act, a Company that existed prior to the effective date of the Companies Act may at any time within two years immediately following the effective date file, without charge, an amendment to its memorandum and articles of association to bring it in harmony with the Companies Act.
Copies of the new memorandum of incorporation will be available for inspection by any person who has a beneficial interest in any securities of the Group at the registered office of the Group at 322 15th Road, Randjespark, Midrand, during normal office hours from the date of issue of this AGM notice up to and including the date of the Annual General Meeting or any adjourned meeting. Alternatively shareholders may view or download the new memorandum of incorporation at the Company’s website address www.mustek.co.za.
3. Other business
To transact such other business as may be transacted at an Annual General Meeting or raised by shareholders with or without advance notice to the Company.
INFORMATION RELATING TO THE SPECIAL RESOLUTIONS
1. The directors of the Company or its subsidiaries will only utilise the general authority to purchase shares of the Company and/or the subsidiary as set out in special resolutions numbers 3 and 4 to the extent that the directors, after considering the maximum shares to be purchased, are of the opinion that the Group position would not be compromised as to the following:
The Group’s ability in the ordinary course of business to pay its debts for a period of 12 months after the date of this Annual General Meeting and for a period of 12 months after the purchase;
Shareholder Information (continued)
Notice of Annual General Meeting (continued)
Mu
stek In
tegrated
An
nu
al Rep
ort 2
01
2
169
The consolidated assets of the Group will at the time of the Annual General Meeting and at the time of making such determination be in excess of the consolidated liabilities of the Group. The assets and liabilities should be recognised and measured in accordance with the accounting policies used in the latest audited annual financial statements of the Group;
The ordinary capital and reserves of the Group after the purchase will remain adequate for the purpose of the business of the Group for a period of 12 months after the Annual General Meeting and after the date of the share purchase; and
The working capital available to the Group after the purchase will be sufficient for the Group’s requirements for a period of 12 months after the date of the notice of the Annual General Meeting,
and the directors have passed a resolution authorising the repurchase, resolving that the Company has satisfied the solvency and liquidity test as defined in the Companies Act and resolving that since the solvency and liquidity test had been applied, there have been no material changes to the financial position of the Group.
2. For the purposes of considering special resolution number 3, and in compliance with paragraph 11.26 of the Listings Requirements, the information listed below has been included in the Integrated Annual Report, in which this notice of Annual General Meeting is included, at the places indicated:
Directors and management (page 64);
Major shareholders (page 75);
Directors’ interests in securities (page 69);
Share capital of the Company (page 133);
Contingent liabilities (page 156);
Responsibility statement (page 169);
Litigation statement (page 169); and
Material changes (page 169).
3. For purposes of special resolution number 2, the Board of Directors of the Company will only utilise the general authority bestowed upon them to provide direct or indirect financial assistance related to inter related companies to the extent that the directors, after considering the amount of financial assistance to be granted, are of the opinion that:
immediately after providing the financial assistance, the Company would satisfy the solvency and liquidity test (as defined in the Companies Act, 2008);
the terms under which the financial assistance is proposed to be given are fair and reasonable to the Company; and
all conditions or restrictions regarding the granting of financial assistance as set out in the Company’s memorandum of incorporation have been satisfied and that the Board of directors has passed a resolution authorising the grant of the said financial assistance (the Board resolution) under their general authority so granted, the Company which will then provide written notice of the Board resolution to all shareholders:
within 10 days after adoption of the Board resolution, if the total value of all loans, debts, obligations or assistance contemplated in that resolution, together with any previous such resolution(s) during the financial year, exceeds one-tenth of 1% of the Company’s net worth at the time of the Board resolution; or
within 30 business days after the end of the financial year, in any other case.
4. The Company is not involved in any legal or arbitration proceedings, nor are any proceedings pending or threatened of which the Company is aware that may have or have had in the previous 12 months, a material effect on the Company’s financial position.
5. The directors, whose names are reflected in this Integrated Annual Report of which this notice forms part, collectively and individually accept full responsibility for the accuracy of the information given and certify that to the best of their knowledge and belief there are no facts that have been omitted which would make any statement false or misleading, and that all reasonable enquiries to ascertain such facts that have been made and that the notice contains all information required by the Listings Requirements of the JSE.
6. Other than the facts and developments reported on in the Integrated Annual Report, there have been no material changes in the financial or trading position of the Company and its subsidiaries since the date of signature of the audit report up to the date of this notice.
Mu
ste
k In
teg
rate
d A
nn
ual
Rep
ort
20
12
170
Record date, attendance and voting
1. The date on which shareholders must be recorded as such in the share register maintained by the transfer secretaries of the Company (“the Share Register”) for purposes of being entitled to receive this notice is Friday, 2 November 2012.
2. The date on which shareholders must be recorded in the Share Register for purposes of being entitled to attend and vote at this meeting is Friday, 7 December 2012 with the last day to trade being Friday, 30 November 2012.
3. Meeting participants will be required to provide proof of identification to the reasonable satisfaction of the Chairman of the Annual General Meeting and must accordingly bring a copy of their identity document, passport or drivers’ licence. If in doubt as to whether any document will be regarded as satisfactory proof of identification, meeting participants should contact the transfer secretaries for guidance.
4. Shareholders entitled to attend and vote at the Annual General Meeting may appoint one or more proxies to attend, speak and vote thereat in their stead. A proxy need not be a member of the Company. A form of proxy, in which is set out the relevant instructions for its completion, is enclosed for the use of a certificated shareholder or own-name registered dematerialised shareholder who wishes to be represented at the Annual General Meeting. Completion of a form of proxy will not preclude such shareholder from attending and voting (in preference to that shareholder’s proxy) at the Annual General Meeting.
5. The instrument appointing a proxy and the authority (if any) under which it is signed must reach the transfer secretaries of the Company at the address given below by not later than 10:00 on Wednesday, 12 December 2012.
6. Dematerialised shareholders, other than own-name registered dematerialised shareholders, who wish to attend the Annual General Meeting in person will need to request their Central Securities Depository Participant
(CSDP) or broker to provide them with the necessary authority in terms of the custody agreement entered into between such shareholders and the CSDP or broker.
7. Dematerialised shareholders, other than own-name registered dematerialised shareholders, who are unable to attend the Annual General Meeting and who wish to be represented thereat, must provide their CSDP or broker with their voting instructions in terms of the custody agreement entered into between them and the CSDP or broker in the manner and time stipulated therein.
8. Shareholders present in person, by proxy or by authorised representative shall, on a show of hands, have one vote each and, on a poll, will have one vote in respect of each share held.
9. In terms of the Companies Act, any shareholder or proxy who intends to attend or participate at the Annual General Meeting must be able to present reasonably satisfactory identification at the meeting for such shareholder or proxy to attend and participate at the Annual General Meeting. A green bar-coded identification document issued by the South African Department of Home Affairs, a driver’s licence or a valid passport will be accepted at the Annual General Meeting as sufficient identification.
By order of the Board
S van Schalkwyk
Company Secretary
Johannesburg
13 November 2012
Shareholder Information (continued)
Notice of Annual General Meeting (continued)
Mu
stek In
tegrated
An
nu
al Rep
ort 2
01
2
171
Appendix 1
Report in terms of regulation 31(7) of the companies regulations, 2011
In accordance with Regulation 31(7), it is the opinion of the Board of Directors of Mustek Limited (Mustek or the Company) that:
a) the value of the Mustek shareholders will be unaffected by the conversion of its ordinary share capital to shares of no par value;
b) the Company’s issued share capital consists of one class of ordinary shares and would therefore be unaffected;
c) there will be no material effect on the rights of Mustek shareholders; and
d) there will be no material adverse effects of the proposed arrangement due to any compensations.
Appendix 2
Salient dates and times in respect of the conversion of the authorised share capital
Salient dates and times
Record date in order to be eligible to receive the Notice of Annual General Meeting Friday, 2 November 2012
Notice of Annual General Meeting posted to shareholders Tuesday, 13 November 2012
Last date to trade in order to be eligible to vote at the Annual General Meeting Friday, 30 November 2012
Record date in order to be eligible to vote at the Annual General Meeting Friday, 7 December 2012
Last day to lodge forms of proxy for the Annual General Meeting (by 10:00) Wednesday, 12 December 2012
Annual General Meeting (at 10:00) Friday, 14 December 2012
Results of the Annual General Meeting released on SENS Friday, 14 December 2012
Submission of special resolutions to CIPC Monday, 17 December 2012
Anticipated date for registration of the special resolutions by the CIPC by no later than1 Friday, 18 January 2013
Publication of date that shares will trade as no par value shares on or about Friday, 18 January 2013
Notes:All times indicated above and below are local times in South Africa. The dates and times indicated in the table above are subject to change. Any such changes will be released on SENS and published in the press.
1Anticipated dates are dependent on the date of registration of the special resolutions at CIPC.
Appendices
Mu
ste
k In
teg
rate
d A
nn
ual
Rep
ort
20
12
172
Appendix 3
Salient features of the memorandum of incorporation
1. The new Companies Act, 2008 (“the Companies Act”
or “the new Companies Act”) became effective on
1 May 2011. The Companies Act differs substantially
from the Companies Act, 1973 (“the 1973 Companies
Act”) and the memorandum and articles of association
of companies need to be amended to bring it into
harmony with the new Companies Act. In future a
company will only have one constitutional document,
being a memorandum of Incorporation. In terms of the
transitional provisions of the new Companies Act, a
company has until 30 April 2013 to bring its
memorandum and articles of association into harmony
with the new Companies Act. In this transitional two-
year period, provisions of a company’s existing
memorandum and articles of association that are in
conflict with the provision of the new Companies Act,
will, to the extent of the conflict, prevail, subject
however to a few exceptions. A company that existed
prior to the effective date of the new Companies Act
may at any time within the two-year transitional period
file, without charge, an amendment to its memorandum
and articles of association to bring it in harmony with
the new Companies Act.
2. The new memorandum of Incorporation of Mustek
Limited (“Mustek or “the Company”) to be considered
and if, approved, adopted at the Annual General
Meeting of 2012 to be held on Friday, 14 December
2012 is consistent with the provisions of the new
Companies Act and is proposed to replace the existing
memorandum and articles of association of Mustek.
3. The approach adopted in preparing the memorandum
of incorporation, was to, as far as possible, retain the
provisions of the existing articles of association of
Mustek that are not inconsistent with the new
Companies Act (and to the extent that there were
material deviations from this approach, details of such
deviations are set out below). The memorandum of
incorporation was prepared with a view to such
document serving as a manual to the officers of Mustek
and others when dealing with the day-to-day corporate
issues affecting the Company, without the need to
consult the Companies Act and Regulations to the
Companies Act on each and every point.
4. The following matters contained in the proposed
memorandum of incorporation should be noted in
particular:
4.1 The share capital of Mustek is not affected by
the new memorandum of incorporation and in
particular its shares will remain no par value
shares [clause 2.1 and Schedule 1].
4.2 The power to amend the authorisation (including
increasing or decreasing the number) and
classification of shares (including determining
rights, limitations, preferences and other terms),
is subject to the approval of the shareholders by
way of a special resolution [clause 1.3.1].
4.3 Subject to the provisions of the Companies Act
and the JSE Listings Requirements where a
special resolution is required for the approval of
an issue of shares, the Board may issue shares
at any time, and/or grant options to subscribe
for shares but only to the extent that such issue
or option has been approved by an ordinary
resolution of shareholders, either by way of a
general or specific authority. Such authority shall
endure for the period provided in the resolution
in question but may be revoked by ordinary
resolution at any time [clause 2.1.4]
4.4 The Board may authorise the Company to issue
secured or unsecured debt instruments [e.g.
debentures], but no special privileges
associated with any such debt instruments,
such as voting rights or right to appoint
directors may be granted [clause 2.2].
4.5 The Company may by special resolution and
subject to the JSE Listings Requirements buy
back its share capital [clause 2.1.10].
4.6 The Company may provide financial assistance
to any person for the purpose of the
subscription of any option, or any securities,
issued or to be issued by the Company, or for
the purchase of any such securities, subject to
a general or specific approval by special
resolution [clause 2.1.8].
Appendices (continued)
Shareholder Information (continued)
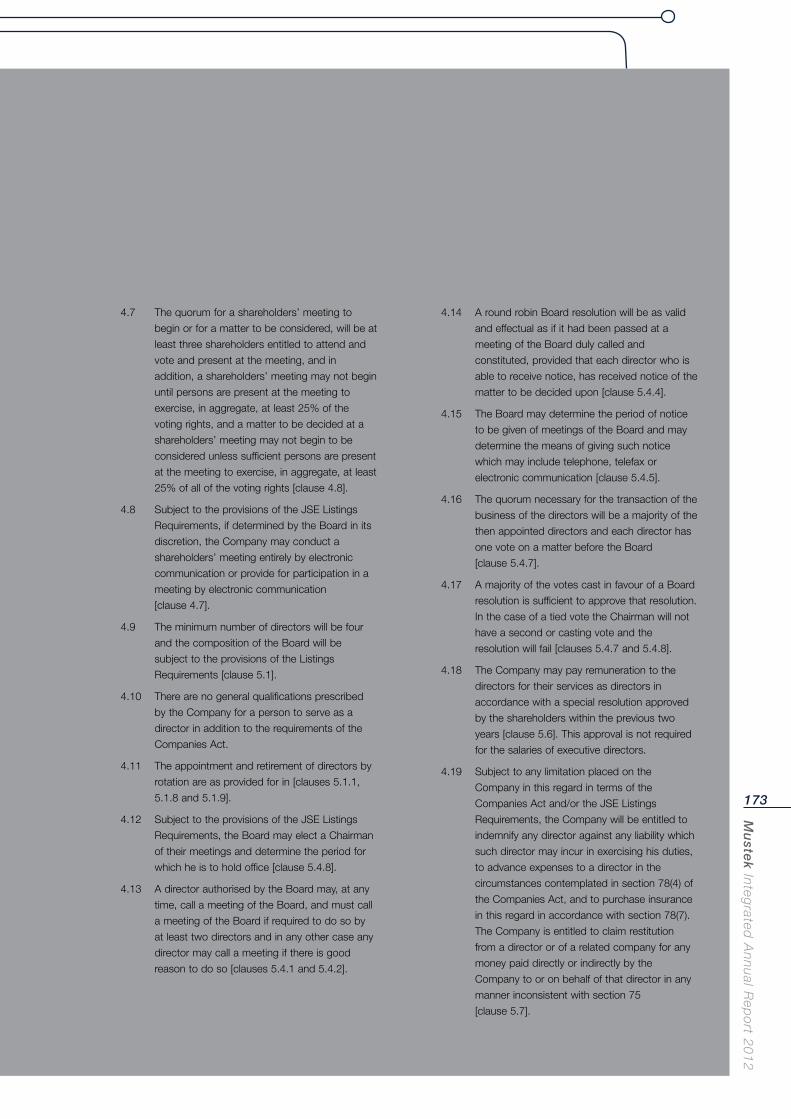
Mu
stek In
tegrated
An
nu
al Rep
ort 2
01
2
173
4.7 The quorum for a shareholders’ meeting to
begin or for a matter to be considered, will be at
least three shareholders entitled to attend and
vote and present at the meeting, and in
addition, a shareholders’ meeting may not begin
until persons are present at the meeting to
exercise, in aggregate, at least 25% of the
voting rights, and a matter to be decided at a
shareholders’ meeting may not begin to be
considered unless sufficient persons are present
at the meeting to exercise, in aggregate, at least
25% of all of the voting rights [clause 4.8].
4.8 Subject to the provisions of the JSE Listings
Requirements, if determined by the Board in its
discretion, the Company may conduct a
shareholders’ meeting entirely by electronic
communication or provide for participation in a
meeting by electronic communication
[clause 4.7].
4.9 The minimum number of directors will be four
and the composition of the Board will be
subject to the provisions of the Listings
Requirements [clause 5.1].
4.10 There are no general qualifications prescribed
by the Company for a person to serve as a
director in addition to the requirements of the
Companies Act.
4.11 The appointment and retirement of directors by
rotation are as provided for in [clauses 5.1.1,
5.1.8 and 5.1.9].
4.12 Subject to the provisions of the JSE Listings
Requirements, the Board may elect a Chairman
of their meetings and determine the period for
which he is to hold office [clause 5.4.8].
4.13 A director authorised by the Board may, at any
time, call a meeting of the Board, and must call
a meeting of the Board if required to do so by
at least two directors and in any other case any
director may call a meeting if there is good
reason to do so [clauses 5.4.1 and 5.4.2].
4.14 A round robin Board resolution will be as valid
and effectual as if it had been passed at a
meeting of the Board duly called and
constituted, provided that each director who is
able to receive notice, has received notice of the
matter to be decided upon [clause 5.4.4].
4.15 The Board may determine the period of notice
to be given of meetings of the Board and may
determine the means of giving such notice
which may include telephone, telefax or
electronic communication [clause 5.4.5].
4.16 The quorum necessary for the transaction of the
business of the directors will be a majority of the
then appointed directors and each director has
one vote on a matter before the Board
[clause 5.4.7].
4.17 A majority of the votes cast in favour of a Board
resolution is sufficient to approve that resolution.
In the case of a tied vote the Chairman will not
have a second or casting vote and the
resolution will fail [clauses 5.4.7 and 5.4.8].
4.18 The Company may pay remuneration to the
directors for their services as directors in
accordance with a special resolution approved
by the shareholders within the previous two
years [clause 5.6]. This approval is not required
for the salaries of executive directors.
4.19 Subject to any limitation placed on the
Company in this regard in terms of the
Companies Act and/or the JSE Listings
Requirements, the Company will be entitled to
indemnify any director against any liability which
such director may incur in exercising his duties,
to advance expenses to a director in the
circumstances contemplated in section 78(4) of
the Companies Act, and to purchase insurance
in this regard in accordance with section 78(7).
The Company is entitled to claim restitution
from a director or of a related company for any
money paid directly or indirectly by the
Company to or on behalf of that director in any
manner inconsistent with section 75
[clause 5.7].
Mu
ste
k In
teg
rate
d A
nn
ual
Rep
ort
20
12
174
4.20 The business and affairs of the Company will be
managed by the Board, which has the authority
to exercise all of the powers and perform any of
the functions of the Company, except to the
extent that the Companies Act provides
otherwise [clause 5.3.1].
4.21 Subject to the provisions of the Companies Act,
the Board may, from time to time, at its
discretion, raise or borrow or secure the
payment of any sum or sums of money for the
purposes of the Company [clause 5.5]. This
provision is required in terms of the JSE Listings
Requirements.
4.22 The Board may appoint any number of Board
committees and delegate to such committees
any authority of the Board [clause 5.8]. The
Board must appoint an Audit Committee and a
Social and Ethics Committee [clause 5.8.1, 5.10
and 5.11].
4.23 The Board must appoint a Company Secretary
[clause 5.12].
4.24 The Company may make distributions from
time to time, provided that it will comply with
section 46 of the Companies Act and the JSE
Listings Requirements (to the extent applicable)
in respect of each distribution to be made. A
dividend may be declared by the Board or by
the Company in general meeting, provided that
the Company in general meeting will not be
entitled to declare a dividend greater that that
recommended by the Board [clause 6.1.1].
4.25 All unclaimed dividends or other distributions
must be held by the Company in trust until
claimed, provided that any dividend (but not any
other distribution which shall be held by the
Company until lawfully claimed) remaining
unclaimed for a period of not less than three
years from the date on which it became payable
may be forfeited by resolution of the Board for
the benefit of the Company [clause 6.1.5].
4.26 Save for correcting errors substantiated as such
from objective evidence or which are self-
evident errors in the memorandum of
incorporation, which the Board is empowered to
do, all amendments of the memorandum of
incorporation should be effected by a special
resolution of shareholders [clauses 1.3.1 and
1.4.1].
4.27 In terms of the JSE Listings Requirements the
Company is prohibited from making rules
[clause 1.3.5].
Shareholder Information (continued)
Appendices (continued)
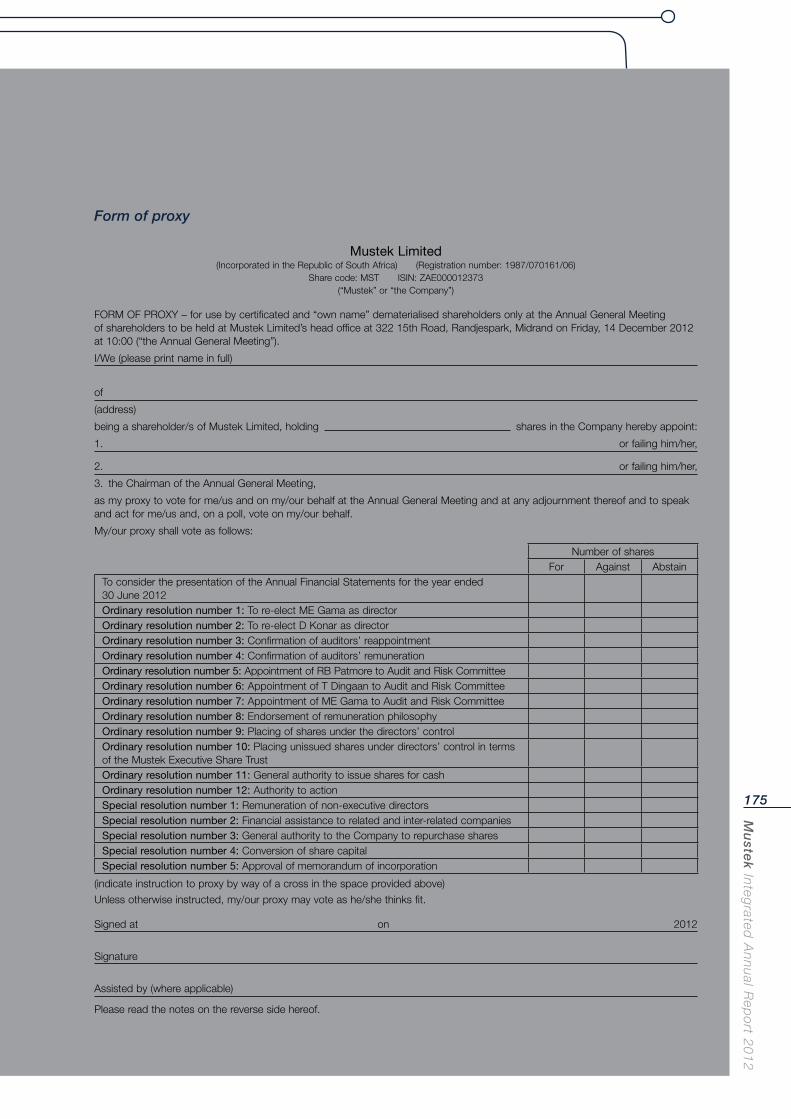
Mu
stek In
tegrated
An
nu
al Rep
ort 2
01
2
175
Mustek Limited(Incorporated in the Republic of South Africa) (Registration number: 1987/070161/06)
Share code: MST ISIN: ZAE000012373(“Mustek” or “the Company”)
FORM OF PROXY – for use by certificated and “own name” dematerialised shareholders only at the Annual General Meeting of shareholders to be held at Mustek Limited’s head office at 322 15th Road, Randjespark, Midrand on Friday, 14 December 2012 at 10:00 (“the Annual General Meeting”).
I/We (please print name in full)
of
(address)
being a shareholder/s of Mustek Limited, holding shares in the Company hereby appoint:
1. or failing him/her,
2. or failing him/her,
3. the Chairman of the Annual General Meeting,
as my proxy to vote for me/us and on my/our behalf at the Annual General Meeting and at any adjournment thereof and to speak and act for me/us and, on a poll, vote on my/our behalf.
My/our proxy shall vote as follows:
Number of sharesFor Against Abstain
To consider the presentation of the Annual Financial Statements for the year ended 30 June 2012Ordinary resolution number 1: To re-elect ME Gama as directorOrdinary resolution number 2: To re-elect D Konar as directorOrdinary resolution number 3: Confirmation of auditors’ reappointmentOrdinary resolution number 4: Confirmation of auditors’ remunerationOrdinary resolution number 5: Appointment of RB Patmore to Audit and Risk CommitteeOrdinary resolution number 6: Appointment of T Dingaan to Audit and Risk CommitteeOrdinary resolution number 7: Appointment of ME Gama to Audit and Risk CommitteeOrdinary resolution number 8: Endorsement of remuneration philosophy Ordinary resolution number 9: Placing of shares under the directors’ controlOrdinary resolution number 10: Placing unissued shares under directors’ control in terms of the Mustek Executive Share TrustOrdinary resolution number 11: General authority to issue shares for cashOrdinary resolution number 12: Authority to actionSpecial resolution number 1: Remuneration of non-executive directorsSpecial resolution number 2: Financial assistance to related and inter-related companiesSpecial resolution number 3: General authority to the Company to repurchase sharesSpecial resolution number 4: Conversion of share capitalSpecial resolution number 5: Approval of memorandum of incorporation
(indicate instruction to proxy by way of a cross in the space provided above)
Unless otherwise instructed, my/our proxy may vote as he/she thinks fit.
Signed at on 2012
Signature
Assisted by (where applicable)
Please read the notes on the reverse side hereof.
Form of proxy
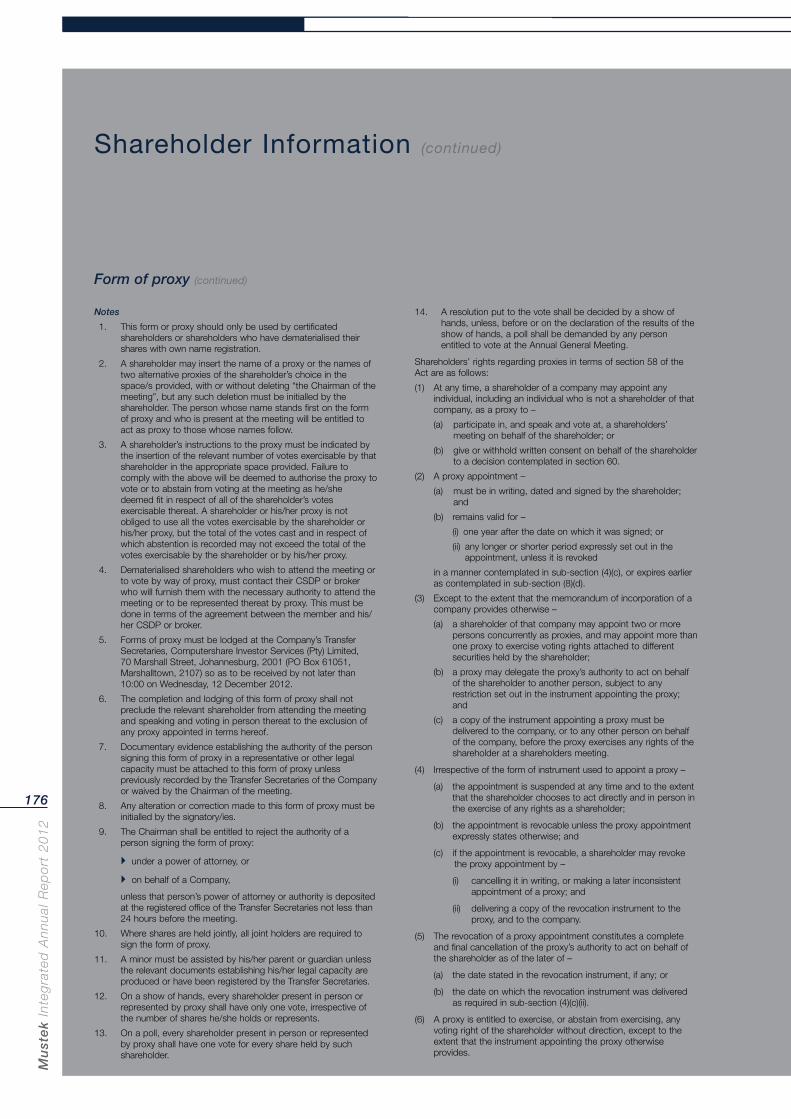
Mu
ste
k In
teg
rate
d A
nn
ual
Rep
ort
20
12
176
Shareholder Information (continued)
Notes
1. This form or proxy should only be used by certificated shareholders or shareholders who have dematerialised their shares with own name registration.
2. A shareholder may insert the name of a proxy or the names of two alternative proxies of the shareholder’s choice in the space/s provided, with or without deleting “the Chairman of the meeting”, but any such deletion must be initialled by the shareholder. The person whose name stands first on the form of proxy and who is present at the meeting will be entitled to act as proxy to those whose names follow.
3. A shareholder’s instructions to the proxy must be indicated by the insertion of the relevant number of votes exercisable by that shareholder in the appropriate space provided. Failure to comply with the above will be deemed to authorise the proxy to vote or to abstain from voting at the meeting as he/she deemed fit in respect of all of the shareholder’s votes exercisable thereat. A shareholder or his/her proxy is not obliged to use all the votes exercisable by the shareholder or his/her proxy, but the total of the votes cast and in respect of which abstention is recorded may not exceed the total of the votes exercisable by the shareholder or by his/her proxy.
4. Dematerialised shareholders who wish to attend the meeting or to vote by way of proxy, must contact their CSDP or broker who will furnish them with the necessary authority to attend the meeting or to be represented thereat by proxy. This must be done in terms of the agreement between the member and his/her CSDP or broker.
5. Forms of proxy must be lodged at the Company’s Transfer Secretaries, Computershare Investor Services (Pty) Limited, 70 Marshall Street, Johannesburg, 2001 (PO Box 61051, Marshalltown, 2107) so as to be received by not later than 10:00 on Wednesday, 12 December 2012.
6. The completion and lodging of this form of proxy shall not preclude the relevant shareholder from attending the meeting and speaking and voting in person thereat to the exclusion of any proxy appointed in terms hereof.
7. Documentary evidence establishing the authority of the person signing this form of proxy in a representative or other legal capacity must be attached to this form of proxy unless previously recorded by the Transfer Secretaries of the Company or waived by the Chairman of the meeting.
8. Any alteration or correction made to this form of proxy must be initialled by the signatory/ies.
9. The Chairman shall be entitled to reject the authority of a person signing the form of proxy:
under a power of attorney, or
on behalf of a Company,
unless that person’s power of attorney or authority is deposited at the registered office of the Transfer Secretaries not less than 24 hours before the meeting.
10. Where shares are held jointly, all joint holders are required to sign the form of proxy.
11. A minor must be assisted by his/her parent or guardian unless the relevant documents establishing his/her legal capacity are produced or have been registered by the Transfer Secretaries.
12. On a show of hands, every shareholder present in person or represented by proxy shall have only one vote, irrespective of the number of shares he/she holds or represents.
13. On a poll, every shareholder present in person or represented by proxy shall have one vote for every share held by such shareholder.
14. A resolution put to the vote shall be decided by a show of hands, unless, before or on the declaration of the results of the show of hands, a poll shall be demanded by any person entitled to vote at the Annual General Meeting.
Shareholders’ rights regarding proxies in terms of section 58 of the Act are as follows:
(1) At any time, a shareholder of a company may appoint any individual, including an individual who is not a shareholder of that company, as a proxy to –
(a) participate in, and speak and vote at, a shareholders’ meeting on behalf of the shareholder; or
(b) give or withhold written consent on behalf of the shareholder to a decision contemplated in section 60.
(2) A proxy appointment –
(a) must be in writing, dated and signed by the shareholder; and
(b) remains valid for –
(i) one year after the date on which it was signed; or
(ii) any longer or shorter period expressly set out in the appointment, unless it is revoked
in a manner contemplated in sub-section (4)(c), or expires earlier as contemplated in sub-section (8)(d).
(3) Except to the extent that the memorandum of incorporation of a company provides otherwise –
(a) a shareholder of that company may appoint two or more persons concurrently as proxies, and may appoint more than one proxy to exercise voting rights attached to different securities held by the shareholder;
(b) a proxy may delegate the proxy’s authority to act on behalf of the shareholder to another person, subject to any restriction set out in the instrument appointing the proxy; and
(c) a copy of the instrument appointing a proxy must be delivered to the company, or to any other person on behalf of the company, before the proxy exercises any rights of the shareholder at a shareholders meeting.
(4) Irrespective of the form of instrument used to appoint a proxy –
(a) the appointment is suspended at any time and to the extent that the shareholder chooses to act directly and in person in the exercise of any rights as a shareholder;
(b) the appointment is revocable unless the proxy appointment expressly states otherwise; and
(c) i f the appointment is revocable, a shareholder may revoke the proxy appointment by –
(i) cancelling it in writing, or making a later inconsistent appointment of a proxy; and
(ii) delivering a copy of the revocation instrument to the proxy, and to the company.
(5) The revocation of a proxy appointment constitutes a complete and final cancellation of the proxy’s authority to act on behalf of the shareholder as of the later of –
(a) the date stated in the revocation instrument, if any; or
(b) the date on which the revocation instrument was delivered as required in sub-section (4)(c)(ii).
(6) A proxy is entitled to exercise, or abstain from exercising, any voting right of the shareholder without direction, except to the extent that the instrument appointing the proxy otherwise provides.
Form of proxy (continued)
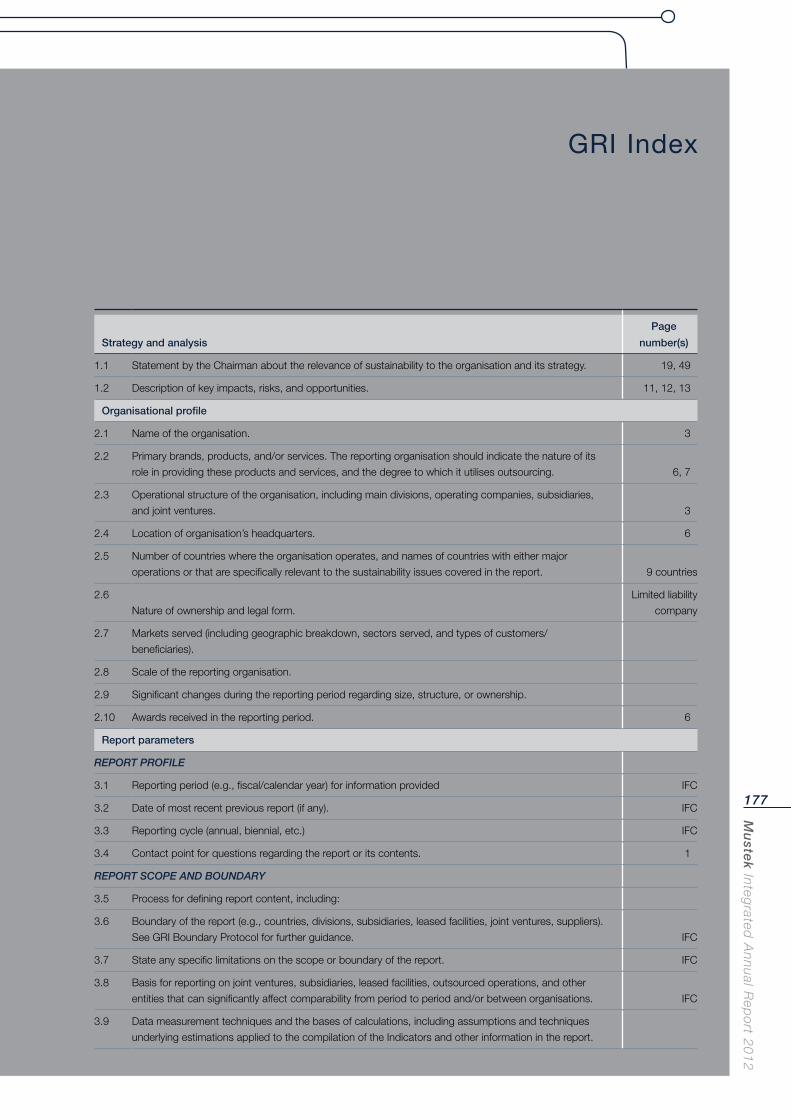
Mu
stek In
tegrated
An
nu
al Rep
ort 2
01
2
177
Strategy and analysis
Page
number(s)
1.1 Statement by the Chairman about the relevance of sustainability to the organisation and its strategy. 19, 49
1.2 Description of key impacts, risks, and opportunities. 11, 12, 13
Organisational profile
2.1 Name of the organisation. 3
2.2 Primary brands, products, and/or services. The reporting organisation should indicate the nature of its
role in providing these products and services, and the degree to which it utilises outsourcing. 6, 7
2.3 Operational structure of the organisation, including main divisions, operating companies, subsidiaries,
and joint ventures. 3
2.4 Location of organisation’s headquarters. 6
2.5 Number of countries where the organisation operates, and names of countries with either major
operations or that are specifically relevant to the sustainability issues covered in the report. 9 countries
2.6
Nature of ownership and legal form.
Limited liability
company
2.7 Markets served (including geographic breakdown, sectors served, and types of customers/
beneficiaries).
2.8 Scale of the reporting organisation.
2.9 Significant changes during the reporting period regarding size, structure, or ownership.
2.10 Awards received in the reporting period. 6
Report parameters
REPORT PROFILE
3.1 Reporting period (e.g., fiscal/calendar year) for information provided IFC
3.2 Date of most recent previous report (if any). IFC
3.3 Reporting cycle (annual, biennial, etc.) IFC
3.4 Contact point for questions regarding the report or its contents. 1
REPORT SCOPE AND BOUNDARY
3.5 Process for defining report content, including:
3.6 Boundary of the report (e.g., countries, divisions, subsidiaries, leased facilities, joint ventures, suppliers).
See GRI Boundary Protocol for further guidance. IFC
3.7 State any specific limitations on the scope or boundary of the report. IFC
3.8 Basis for reporting on joint ventures, subsidiaries, leased facilities, outsourced operations, and other
entities that can significantly affect comparability from period to period and/or between organisations. IFC
3.9 Data measurement techniques and the bases of calculations, including assumptions and techniques
underlying estimations applied to the compilation of the Indicators and other information in the report.
GRI Index
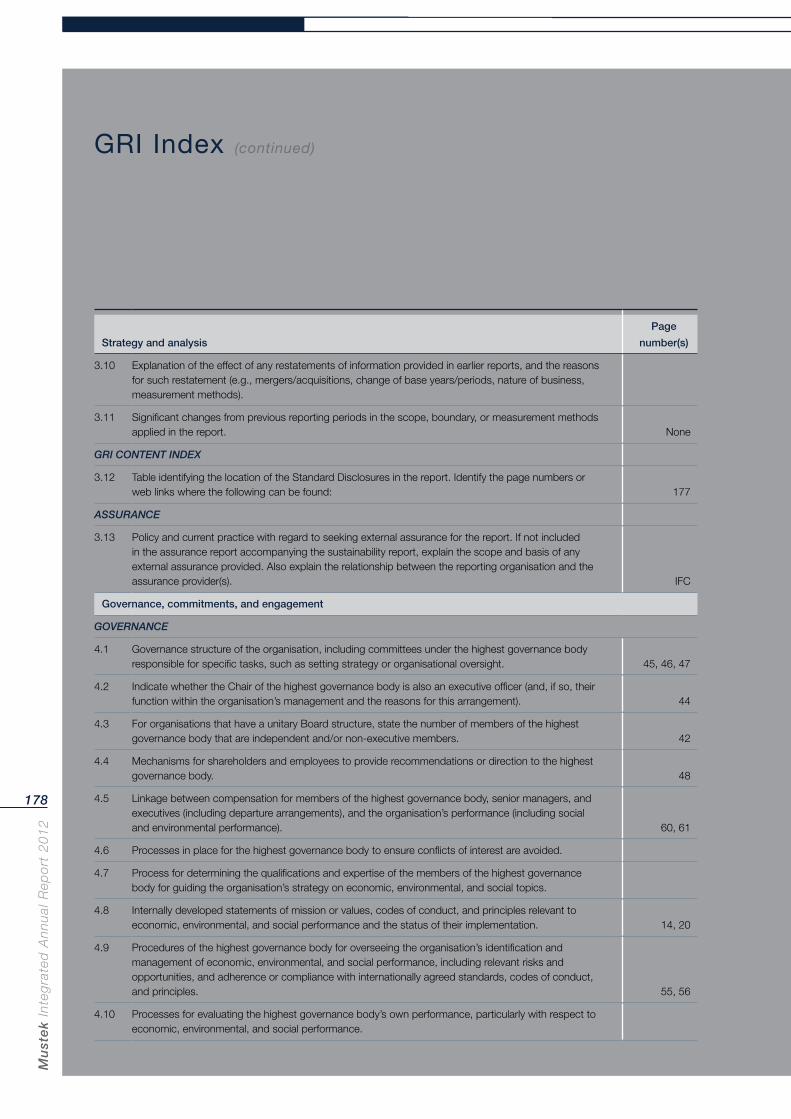
Mu
ste
k In
teg
rate
d A
nn
ual
Rep
ort
20
12
178
Strategy and analysis
Page
number(s)
3.10 Explanation of the effect of any restatements of information provided in earlier reports, and the reasons for such restatement (e.g., mergers/acquisitions, change of base years/periods, nature of business, measurement methods).
3.11 Significant changes from previous reporting periods in the scope, boundary, or measurement methods applied in the report. None
GRI CONTENT INDEX
3.12 Table identifying the location of the Standard Disclosures in the report. Identify the page numbers or web links where the following can be found: 177
ASSURANCE
3.13 Policy and current practice with regard to seeking external assurance for the report. If not included in the assurance report accompanying the sustainability report, explain the scope and basis of any external assurance provided. Also explain the relationship between the reporting organisation and the assurance provider(s). IFC
Governance, commitments, and engagement
GOVERNANCE
4.1 Governance structure of the organisation, including committees under the highest governance body responsible for specific tasks, such as setting strategy or organisational oversight. 45, 46, 47
4.2 Indicate whether the Chair of the highest governance body is also an executive officer (and, if so, their function within the organisation’s management and the reasons for this arrangement). 44
4.3 For organisations that have a unitary Board structure, state the number of members of the highest governance body that are independent and/or non-executive members. 42
4.4 Mechanisms for shareholders and employees to provide recommendations or direction to the highest governance body. 48
4.5 Linkage between compensation for members of the highest governance body, senior managers, and executives (including departure arrangements), and the organisation’s performance (including social and environmental performance). 60, 61
4.6 Processes in place for the highest governance body to ensure conflicts of interest are avoided.
4.7 Process for determining the qualifications and expertise of the members of the highest governance body for guiding the organisation’s strategy on economic, environmental, and social topics.
4.8 Internally developed statements of mission or values, codes of conduct, and principles relevant to economic, environmental, and social performance and the status of their implementation. 14, 20
4.9 Procedures of the highest governance body for overseeing the organisation’s identification and management of economic, environmental, and social performance, including relevant risks and opportunities, and adherence or compliance with internationally agreed standards, codes of conduct, and principles. 55, 56
4.10 Processes for evaluating the highest governance body’s own performance, particularly with respect to economic, environmental, and social performance.
GRI Index (continued)
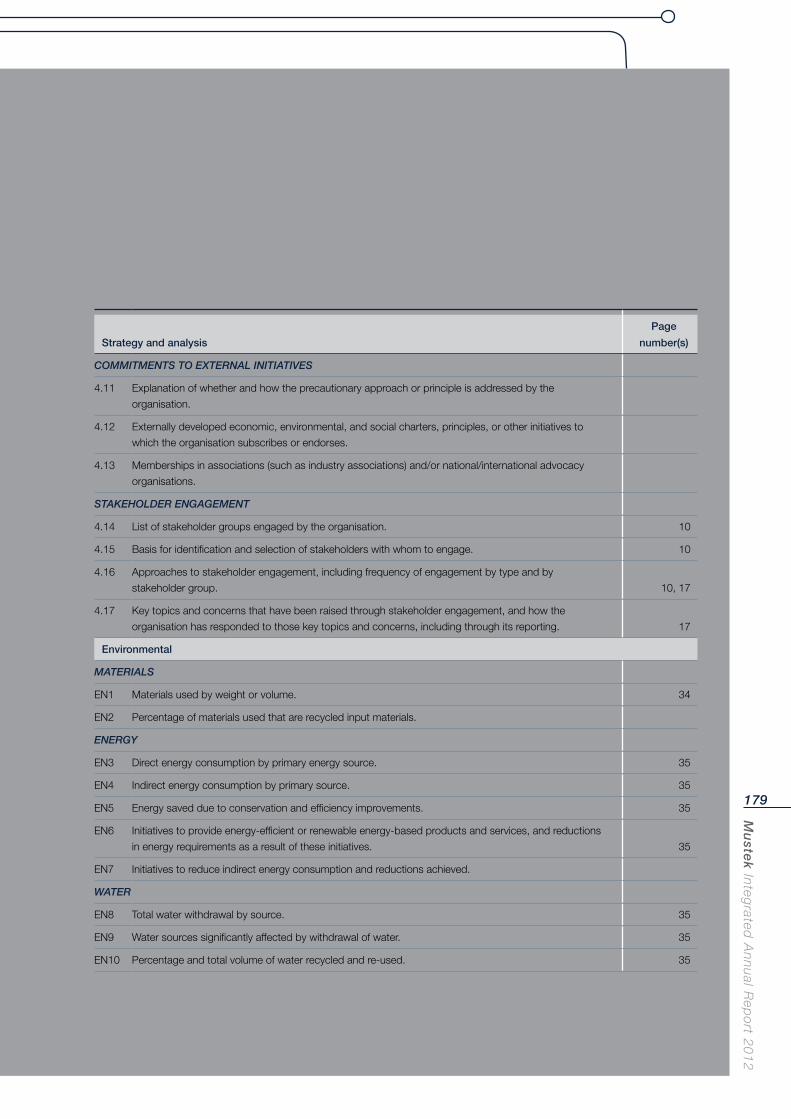
Mu
stek In
tegrated
An
nu
al Rep
ort 2
01
2
179
Strategy and analysis
Page
number(s)
COMMITMENTS TO EXTERNAL INITIATIVES
4.11 Explanation of whether and how the precautionary approach or principle is addressed by the
organisation.
4.12 Externally developed economic, environmental, and social charters, principles, or other initiatives to
which the organisation subscribes or endorses.
4.13 Memberships in associations (such as industry associations) and/or national/international advocacy
organisations.
STAKEHOLDER ENGAGEMENT
4.14 List of stakeholder groups engaged by the organisation. 10
4.15 Basis for identification and selection of stakeholders with whom to engage. 10
4.16 Approaches to stakeholder engagement, including frequency of engagement by type and by
stakeholder group. 10, 17
4.17 Key topics and concerns that have been raised through stakeholder engagement, and how the
organisation has responded to those key topics and concerns, including through its reporting. 17
Environmental
MATERIALS
EN1 Materials used by weight or volume. 34
EN2 Percentage of materials used that are recycled input materials.
ENERGY
EN3 Direct energy consumption by primary energy source. 35
EN4 Indirect energy consumption by primary source. 35
EN5 Energy saved due to conservation and efficiency improvements. 35
EN6 Initiatives to provide energy-efficient or renewable energy-based products and services, and reductions
in energy requirements as a result of these initiatives. 35
EN7 Initiatives to reduce indirect energy consumption and reductions achieved.
WATER
EN8 Total water withdrawal by source. 35
EN9 Water sources significantly affected by withdrawal of water. 35
EN10 Percentage and total volume of water recycled and re-used. 35
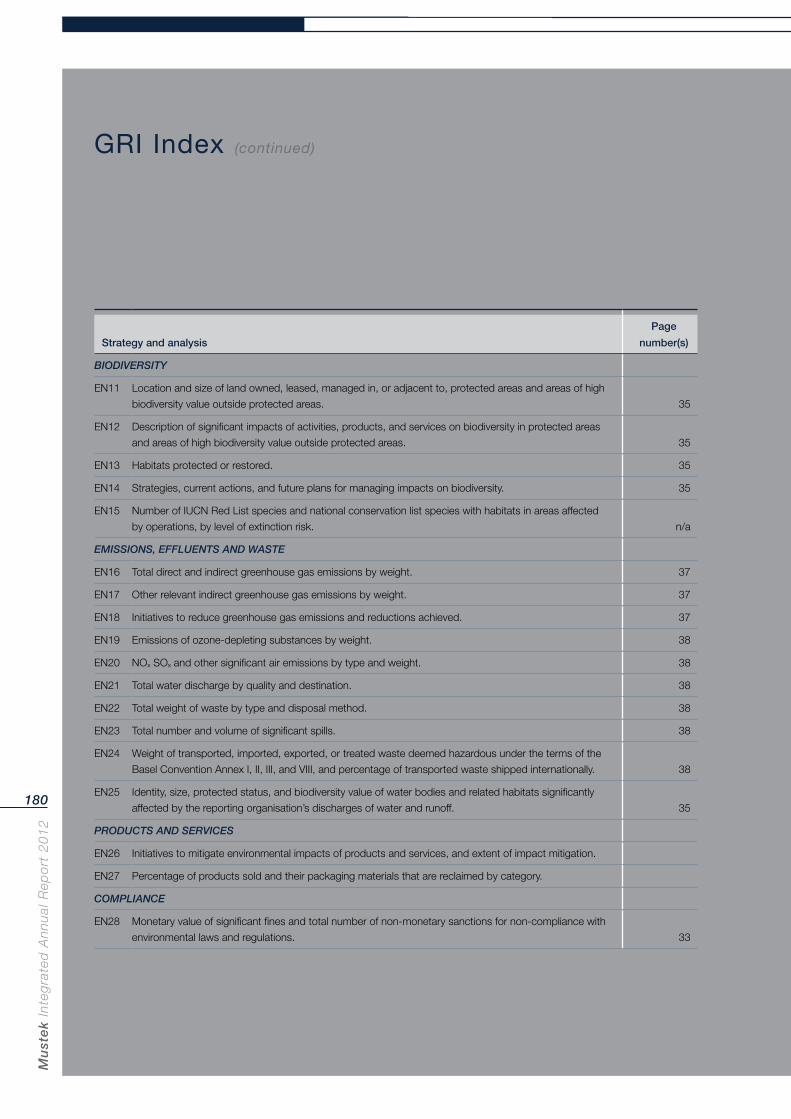
Mu
ste
k In
teg
rate
d A
nn
ual
Rep
ort
20
12
180
Strategy and analysis
Page
number(s)
BIODIVERSITY
EN11 Location and size of land owned, leased, managed in, or adjacent to, protected areas and areas of high
biodiversity value outside protected areas. 35
EN12 Description of significant impacts of activities, products, and services on biodiversity in protected areas
and areas of high biodiversity value outside protected areas. 35
EN13 Habitats protected or restored. 35
EN14 Strategies, current actions, and future plans for managing impacts on biodiversity. 35
EN15 Number of IUCN Red List species and national conservation list species with habitats in areas affected
by operations, by level of extinction risk. n/a
EMISSIONS, EFFLUENTS AND WASTE
EN16 Total direct and indirect greenhouse gas emissions by weight. 37
EN17 Other relevant indirect greenhouse gas emissions by weight. 37
EN18 Initiatives to reduce greenhouse gas emissions and reductions achieved. 37
EN19 Emissions of ozone-depleting substances by weight. 38
EN20 NOx SOx and other significant air emissions by type and weight. 38
EN21 Total water discharge by quality and destination. 38
EN22 Total weight of waste by type and disposal method. 38
EN23 Total number and volume of significant spills. 38
EN24 Weight of transported, imported, exported, or treated waste deemed hazardous under the terms of the
Basel Convention Annex I, II, III, and VIII, and percentage of transported waste shipped internationally. 38
EN25 Identity, size, protected status, and biodiversity value of water bodies and related habitats significantly
affected by the reporting organisation’s discharges of water and runoff. 35
PRODUCTS AND SERVICES
EN26 Initiatives to mitigate environmental impacts of products and services, and extent of impact mitigation.
EN27 Percentage of products sold and their packaging materials that are reclaimed by category.
COMPLIANCE
EN28 Monetary value of significant fines and total number of non-monetary sanctions for non-compliance with
environmental laws and regulations. 33
GRI Index (continued)
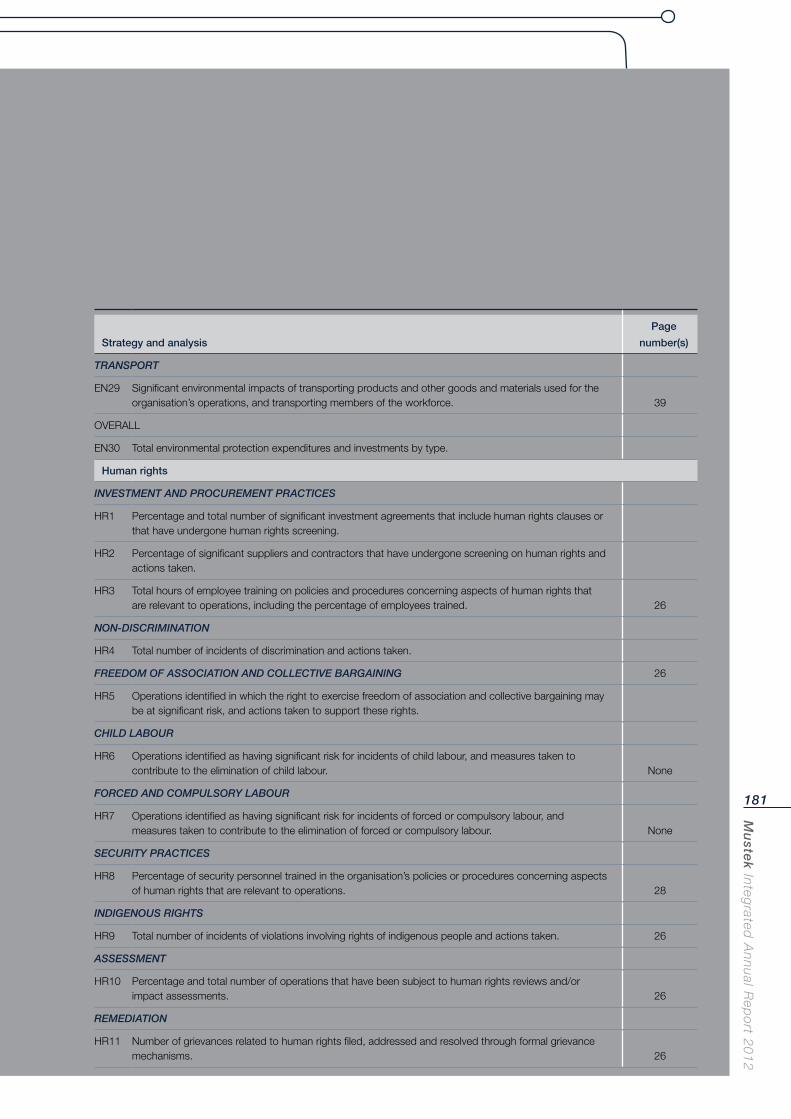
Mu
stek In
tegrated
An
nu
al Rep
ort 2
01
2
181
Strategy and analysis
Page
number(s)
TRANSPORT
EN29 Significant environmental impacts of transporting products and other goods and materials used for the organisation’s operations, and transporting members of the workforce. 39
OVERALL
EN30 Total environmental protection expenditures and investments by type.
Human rights
INVESTMENT AND PROCUREMENT PRACTICES
HR1 Percentage and total number of significant investment agreements that include human rights clauses or that have undergone human rights screening.
HR2 Percentage of significant suppliers and contractors that have undergone screening on human rights and actions taken.
HR3 Total hours of employee training on policies and procedures concerning aspects of human rights that are relevant to operations, including the percentage of employees trained. 26
NON-DISCRIMINATION
HR4 Total number of incidents of discrimination and actions taken.
FREEDOM OF ASSOCIATION AND COLLECTIVE BARGAINING 26
HR5 Operations identified in which the right to exercise freedom of association and collective bargaining may be at significant risk, and actions taken to support these rights.
CHILD LABOUR
HR6 Operations identified as having significant risk for incidents of child labour, and measures taken to contribute to the elimination of child labour. None
FORCED AND COMPULSORY LABOUR
HR7 Operations identified as having significant risk for incidents of forced or compulsory labour, and measures taken to contribute to the elimination of forced or compulsory labour. None
SECURITY PRACTICES
HR8 Percentage of security personnel trained in the organisation’s policies or procedures concerning aspects of human rights that are relevant to operations. 28
INDIGENOUS RIGHTS
HR9 Total number of incidents of violations involving rights of indigenous people and actions taken. 26
ASSESSMENT
HR10 Percentage and total number of operations that have been subject to human rights reviews and/or impact assessments. 26
REMEDIATION
HR11 Number of grievances related to human rights filed, addressed and resolved through formal grievance mechanisms. 26
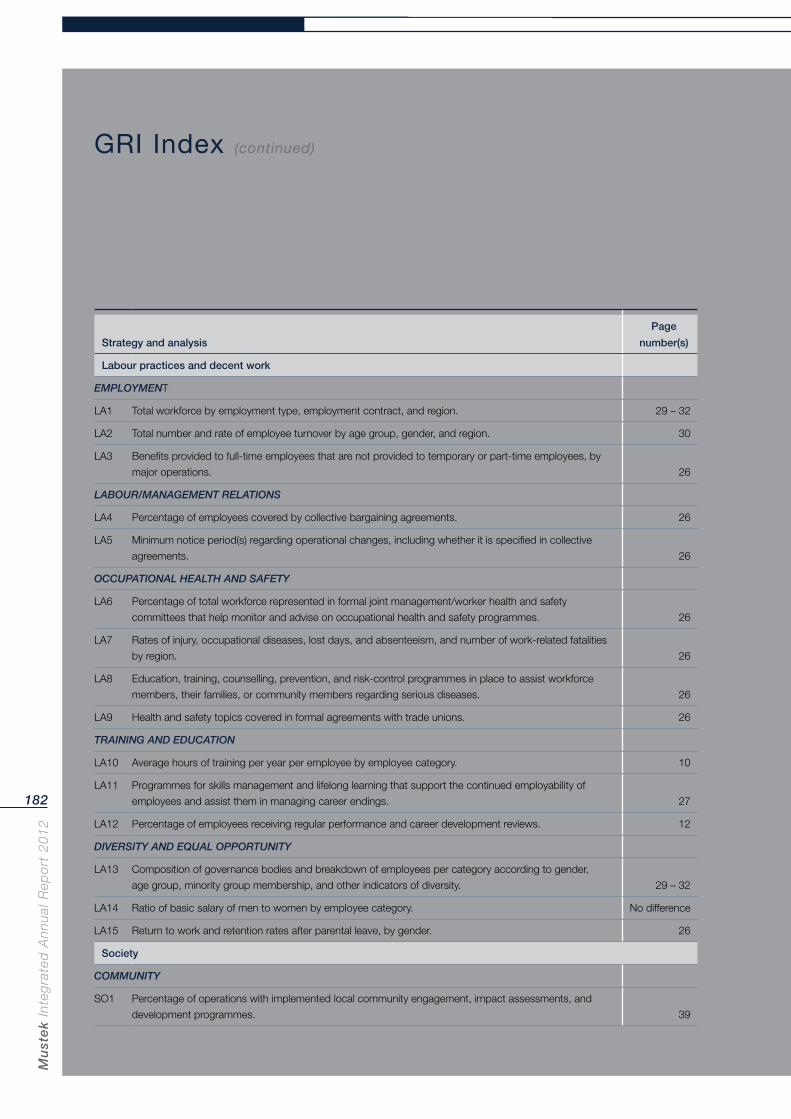
Mu
ste
k In
teg
rate
d A
nn
ual
Rep
ort
20
12
182
Strategy and analysis
Page
number(s)
Labour practices and decent work
EMPLOYMENT
LA1 Total workforce by employment type, employment contract, and region. 29 – 32
LA2 Total number and rate of employee turnover by age group, gender, and region. 30
LA3 Benefits provided to full-time employees that are not provided to temporary or part-time employees, by
major operations. 26
LABOUR/MANAGEMENT RELATIONS
LA4 Percentage of employees covered by collective bargaining agreements. 26
LA5 Minimum notice period(s) regarding operational changes, including whether it is specified in collective
agreements. 26
OCCUPATIONAL HEALTH AND SAFETY
LA6 Percentage of total workforce represented in formal joint management/worker health and safety
committees that help monitor and advise on occupational health and safety programmes. 26
LA7 Rates of injury, occupational diseases, lost days, and absenteeism, and number of work-related fatalities
by region. 26
LA8 Education, training, counselling, prevention, and risk-control programmes in place to assist workforce
members, their families, or community members regarding serious diseases. 26
LA9 Health and safety topics covered in formal agreements with trade unions. 26
TRAINING AND EDUCATION
LA10 Average hours of training per year per employee by employee category. 10
LA11 Programmes for skills management and lifelong learning that support the continued employability of
employees and assist them in managing career endings. 27
LA12 Percentage of employees receiving regular performance and career development reviews. 12
DIVERSITY AND EQUAL OPPORTUNITY
LA13 Composition of governance bodies and breakdown of employees per category according to gender,
age group, minority group membership, and other indicators of diversity. 29 – 32
LA14 Ratio of basic salary of men to women by employee category. No difference
LA15 Return to work and retention rates after parental leave, by gender. 26
Society
COMMUNITY
SO1 Percentage of operations with implemented local community engagement, impact assessments, and
development programmes. 39
GRI Index (continued)

Mu
stek In
tegrated
An
nu
al Rep
ort 2
01
2
183
Strategy and analysis
Page
number(s)
CORRUPTION
SO2 Percentage and total number of business units analysed for risks related to corruption.
SO3 Percentage of employees trained in organisation’s anti-corruption policies and procedures.
SO4 Actions taken in response to incidents of corruption. None needed
PUBLIC POLICY
SO5 Public policy positions and participation in public policy development and lobbying.
SO6 Total value of financial and in-kind contributions to political parties, politicians, and related institutions by
country. R250 000 (SA)
ANTI-COMPETITIVE BEHAVIOUR
SO7 Total number of legal actions for anti-competitive behaviour, anti-trust, and monopoly practices and their
outcomes. None
COMPLIANCE
SO8 Monetary value of significant fines and total number of non-monetary sanctions for non-compliance with
laws and regulations. None
SO9 Operations with significant potential or actual negative impacts on local communities. 39
SO10 Prevention and mitigation measures implemented in operations with significant potential or actual
negative impacts on local communities. 39
Product responsibility
CUSTOMER HEALTH AND SAFETY
PR1 Life-cycle stages in which health and safety impacts of products and services are assessed for
improvement, and percentage of significant products and services categories subject to such
procedures. 41
PR2 Total number of incidents of non-compliance with regulations and voluntary codes concerning health
and safety impacts of products and services during their life cycle, by type of outcomes. 41
PRODUCT AND SERVICE LABELLING
PR3 Type of product and service information required by procedures, and percentage of significant products
and services subject to such information requirements. 41
PR4 Total number of incidents of non-compliance with regulations and voluntary codes concerning product
and service information and labelling, by type of outcomes. 41
PR5 Practices related to customer satisfaction, including results of surveys measuring customer satisfaction.
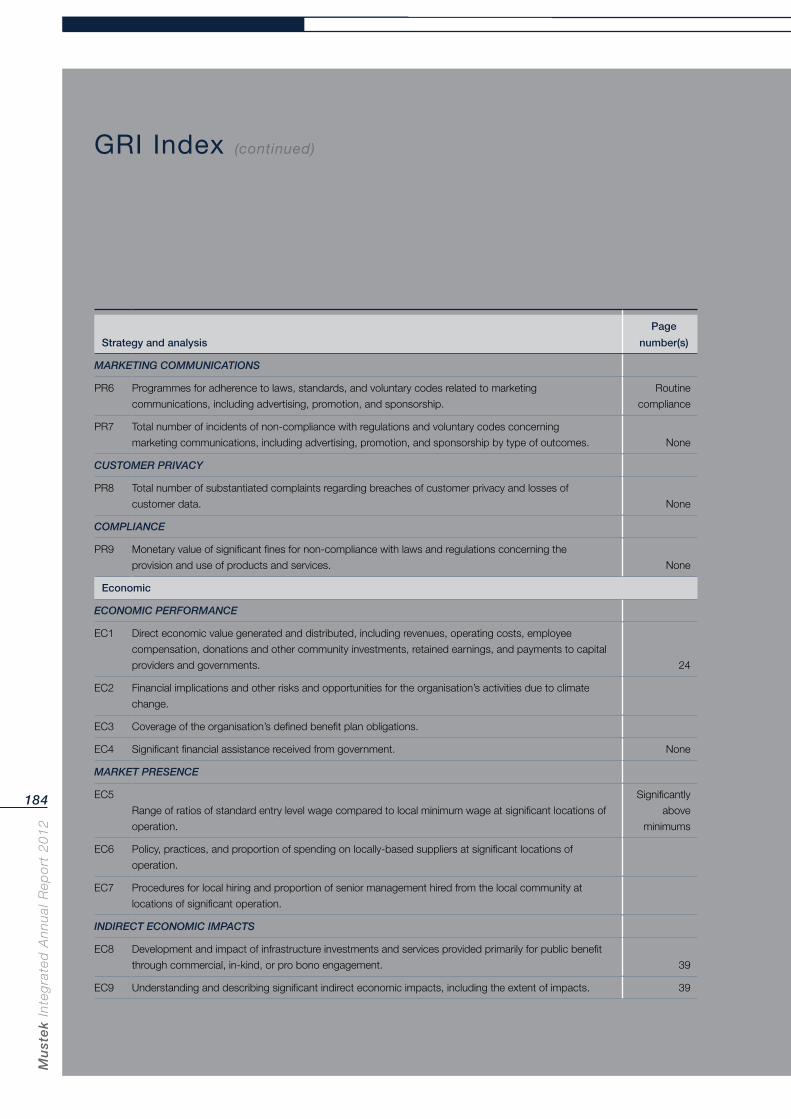
Mu
ste
k In
teg
rate
d A
nn
ual
Rep
ort
20
12
184
Strategy and analysis
Page
number(s)
MARKETING COMMUNICATIONS
PR6 Programmes for adherence to laws, standards, and voluntary codes related to marketing
communications, including advertising, promotion, and sponsorship.
Routine
compliance
PR7 Total number of incidents of non-compliance with regulations and voluntary codes concerning
marketing communications, including advertising, promotion, and sponsorship by type of outcomes. None
CUSTOMER PRIVACY
PR8 Total number of substantiated complaints regarding breaches of customer privacy and losses of
customer data. None
COMPLIANCE
PR9 Monetary value of significant fines for non-compliance with laws and regulations concerning the
provision and use of products and services. None
Economic
ECONOMIC PERFORMANCE
EC1 Direct economic value generated and distributed, including revenues, operating costs, employee
compensation, donations and other community investments, retained earnings, and payments to capital
providers and governments. 24
EC2 Financial implications and other risks and opportunities for the organisation’s activities due to climate
change.
EC3 Coverage of the organisation’s defined benefit plan obligations.
EC4 Significant financial assistance received from government. None
MARKET PRESENCE
EC5
Range of ratios of standard entry level wage compared to local minimum wage at significant locations of
operation.
Significantly
above
minimums
EC6 Policy, practices, and proportion of spending on locally-based suppliers at significant locations of
operation.
EC7 Procedures for local hiring and proportion of senior management hired from the local community at
locations of significant operation.
INDIRECT ECONOMIC IMPACTS
EC8 Development and impact of infrastructure investments and services provided primarily for public benefit
through commercial, in-kind, or pro bono engagement. 39
EC9 Understanding and describing significant indirect economic impacts, including the extent of impacts. 39
GRI Index (continued)
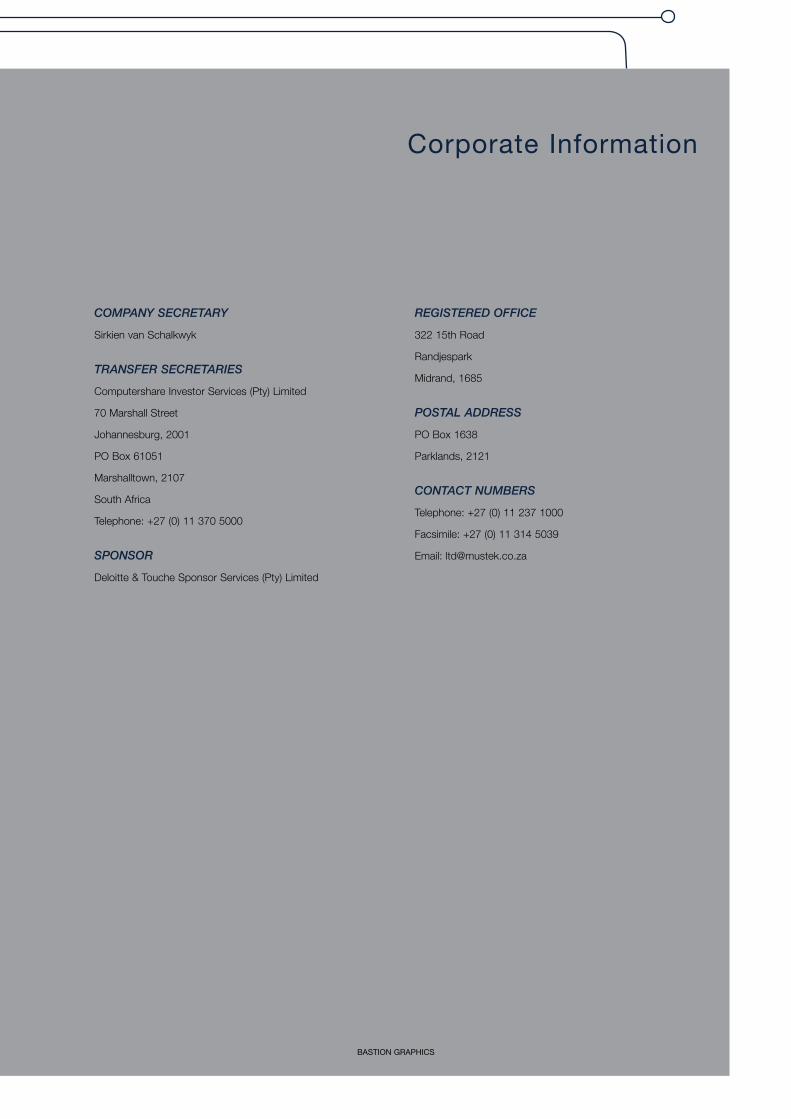
Corporate Information
COMPANY SECRETARY
Sirkien van Schalkwyk
TRANSFER SECRETARIES
Computershare Investor Services (Pty) Limited
70 Marshall Street
Johannesburg, 2001
PO Box 61051
Marshalltown, 2107
South Africa
Telephone: +27 (0) 11 370 5000
SPONSOR
Deloitte & Touche Sponsor Services (Pty) Limited
REGISTERED OFFICE
322 15th Road
Randjespark
Midrand, 1685
POSTAL ADDRESS
PO Box 1638
Parklands, 2121
CONTACT NUMBERS
Telephone: +27 (0) 11 237 1000
Facsimile: +27 (0) 11 314 5039
Email: [email protected]
BASTION GRAPHICS

www.mustek.co.zawww.mustek.coo.zzaa