INTECH Investment Management LLC...INTECH Investment Management LLC (INTECH) claims compliance with...
88
INTECH Investment Management LLC Enhanced Index North America Composite For the periods from July 1, 2012 through December 31, 2013
Transcript of INTECH Investment Management LLC...INTECH Investment Management LLC (INTECH) claims compliance with...

INTECH Investment Management LLC Enhanced Index North America Composite For the periods from July 1, 2012 through December 31, 2013

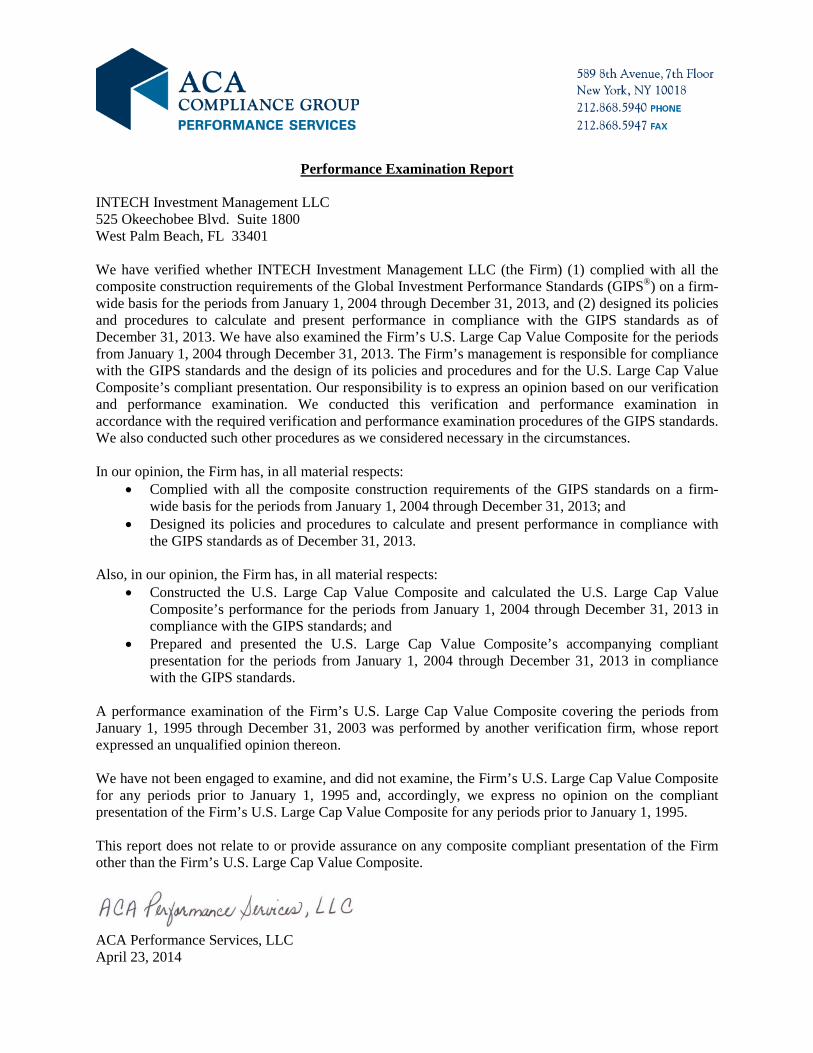
Performance Examination Report
INTECH Investment Management LLC 525 Okeechobee Blvd. Suite 1800 West Palm Beach, FL 33401 We have verified whether INTECH Investment Management LLC (the Firm) (1) complied with all the composite construction requirements of the Global Investment Performance Standards (GIPS®) on a firm-wide basis for the periods from January 1, 2004 through December 31, 2013, and (2) designed its policies and procedures to calculate and present performance in compliance with the GIPS standards as of December 31, 2013. We have also examined the Firm’s Enhanced Index North America Composite for the periods from July 1, 2012 through December 31, 2013. The Firm’s management is responsible for compliance with the GIPS standards and the design of its policies and procedures and for the Enhanced Index North America Composite’s compliant presentation. Our responsibility is to express an opinion based on our verification and performance examination. We conducted this verification and performance examination in accordance with the required verification and performance examination procedures of the GIPS standards. We also conducted such other procedures as we considered necessary in the circumstances. In our opinion, the Firm has, in all material respects:
• Complied with all the composite construction requirements of the GIPS standards on a firm-wide basis for the periods from January 1, 2004 through December 31, 2013; and
• Designed its policies and procedures to calculate and present performance in compliance with the GIPS standards as of December 31, 2013.
Also, in our opinion, the Firm has, in all material respects:
• Constructed the Enhanced Index North America Composite and calculated the Enhanced Index North America Composite’s performance for the periods from July 1, 2012 through December 31, 2013 in compliance with the GIPS standards; and
• Prepared and presented the Enhanced Index North America Composite’s accompanying compliant presentation for the periods from July 1, 2012 through December 31, 2013 in compliance with the GIPS standards.
This report does not relate to or provide assurance on any composite compliant presentation of the Firm other than the Firm’s Enhanced Index North America Composite.
ACA Performance Services, LLC April 23, 2014
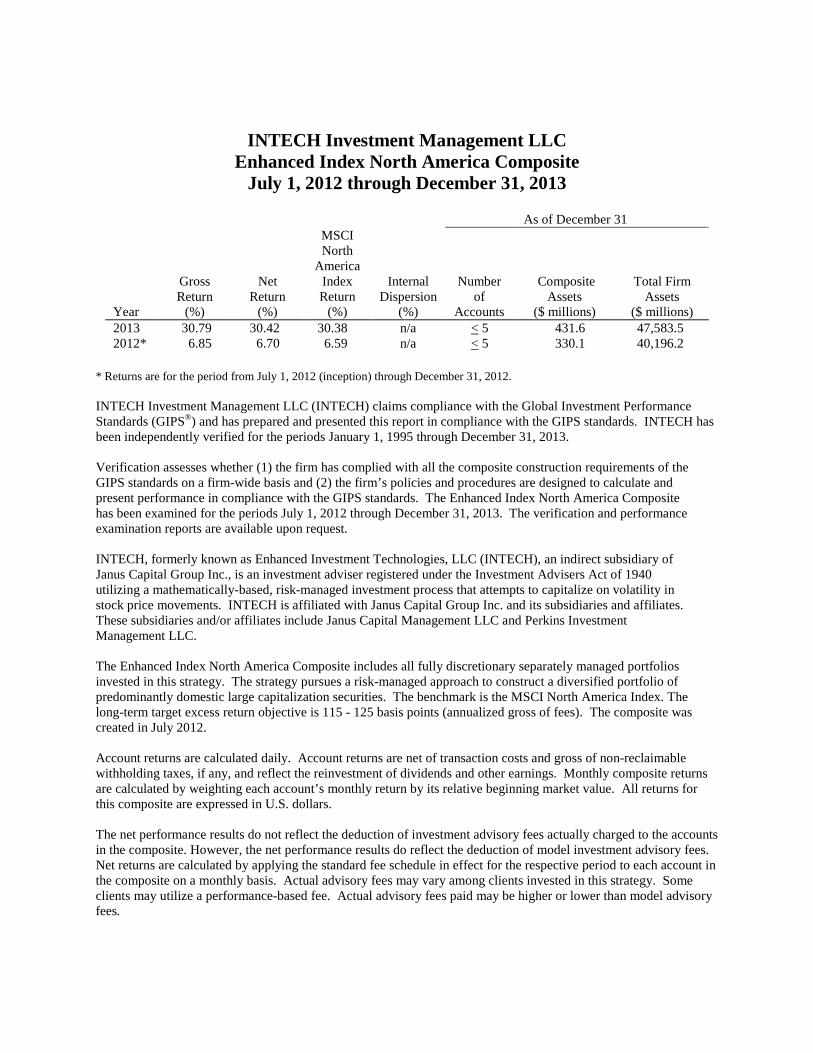
INTECH Investment Management LLC Enhanced Index North America Composite
July 1, 2012 through December 31, 2013
As of December 31
Year
Gross Return
(%)
Net Return
(%)
MSCI North
America Index Return
(%)
Internal Dispersion
(%)
Number of
Accounts
Composite Assets
($ millions)
Total Firm Assets
($ millions) 2013 30.79 30.42 30.38 n/a < 5 431.6 47,583.5 2012* 6.85 6.70 6.59 n/a < 5 330.1 40,196.2
* Returns are for the period from July 1, 2012 (inception) through December 31, 2012. INTECH Investment Management LLC (INTECH) claims compliance with the Global Investment Performance Standards (GIPS®) and has prepared and presented this report in compliance with the GIPS standards. INTECH has been independently verified for the periods January 1, 1995 through December 31, 2013. Verification assesses whether (1) the firm has complied with all the composite construction requirements of the GIPS standards on a firm-wide basis and (2) the firm’s policies and procedures are designed to calculate and present performance in compliance with the GIPS standards. The Enhanced Index North America Composite has been examined for the periods July 1, 2012 through December 31, 2013. The verification and performance examination reports are available upon request. INTECH, formerly known as Enhanced Investment Technologies, LLC (INTECH), an indirect subsidiary of Janus Capital Group Inc., is an investment adviser registered under the Investment Advisers Act of 1940 utilizing a mathematically-based, risk-managed investment process that attempts to capitalize on volatility in stock price movements. INTECH is affiliated with Janus Capital Group Inc. and its subsidiaries and affiliates. These subsidiaries and/or affiliates include Janus Capital Management LLC and Perkins Investment Management LLC. The Enhanced Index North America Composite includes all fully discretionary separately managed portfolios invested in this strategy. The strategy pursues a risk-managed approach to construct a diversified portfolio of predominantly domestic large capitalization securities. The benchmark is the MSCI North America Index. The long-term target excess return objective is 115 - 125 basis points (annualized gross of fees). The composite was created in July 2012. Account returns are calculated daily. Account returns are net of transaction costs and gross of non-reclaimable withholding taxes, if any, and reflect the reinvestment of dividends and other earnings. Monthly composite returns are calculated by weighting each account’s monthly return by its relative beginning market value. All returns for this composite are expressed in U.S. dollars. The net performance results do not reflect the deduction of investment advisory fees actually charged to the accounts in the composite. However, the net performance results do reflect the deduction of model investment advisory fees. Net returns are calculated by applying the standard fee schedule in effect for the respective period to each account in the composite on a monthly basis. Actual advisory fees may vary among clients invested in this strategy. Some clients may utilize a performance-based fee. Actual advisory fees paid may be higher or lower than model advisory fees.

The current standard fee schedule in effect is as follows: 0.35% on the first $100 million; 0.30% on the next $100 million; 0.25% on the next $100 million; 0.225% on the next $200 million; and 0.20% on amounts over $500 million. MSCI North America Index is a free float-adjusted market capitalization-weighted index that is designed to measure the performance of the developed equity markets in Canada and the United States. The MSCI North America Index returns are provided to represent the investment environment existing during the time periods shown and are not covered by the report of independent verifiers. For comparison purposes, the index is fully invested, which includes the reinvestment of dividends and capital gains. The returns for the index do not include any transaction costs, management fees or other costs. Composition of each separately managed account portfolio may differ from securities in the corresponding benchmark index. The index is used as a performance benchmark only, as INTECH does not attempt to replicate an index. Because INTECH’s sector weightings are a residual of portfolio construction, significant differences between sector weightings in client portfolios and the index are common. The internal dispersion of annual returns is measured by the asset weighted standard deviation of account gross returns represented within the composite for the full year. For those periods with five or fewer accounts included for the entire year, “n/a” is noted as the dispersion is not considered meaningful. At December 31, 2013, the three-year annualized ex-post standard deviation of the composite gross and the benchmark returns are not presented because 36 monthly composite returns are not available. A list of INTECH’s composite descriptions and policies for valuing portfolios, calculating performance, and preparing compliant presentations are available upon request. Performance figures are based upon historical information and do not guarantee future results.

INTECH Investment Management LLC U.S. Low Volatility Composite For the periods from August 1, 2012 through December 31, 2013

Performance Examination Report
INTECH Investment Management LLC 525 Okeechobee Blvd. Suite 1800 West Palm Beach, FL 33401 We have verified whether INTECH Investment Management LLC (the Firm) (1) complied with all the composite construction requirements of the Global Investment Performance Standards (GIPS®) on a firm-wide basis for the periods from January 1, 2004 through December 31, 2013, and (2) designed its policies and procedures to calculate and present performance in compliance with the GIPS standards as of December 31, 2013. We have also examined the Firm’s U.S. Low Volatility Composite for the periods from August 1, 2012 through December 31, 2013. The Firm’s management is responsible for compliance with the GIPS standards and the design of its policies and procedures and for the U.S. Low Volatility Composite’s compliant presentation. Our responsibility is to express an opinion based on our verification and performance examination. We conducted this verification and performance examination in accordance with the required verification and performance examination procedures of the GIPS standards. We also conducted such other procedures as we considered necessary in the circumstances. In our opinion, the Firm has, in all material respects:
• Complied with all the composite construction requirements of the GIPS standards on a firm-wide basis for the periods from January 1, 2004 through December 31, 2013; and
• Designed its policies and procedures to calculate and present performance in compliance with the GIPS standards as of December 31, 2013.
Also, in our opinion, the Firm has, in all material respects:
• Constructed the U.S. Low Volatility Composite and calculated the U.S. Low Volatility Composite’s performance for the periods from August 1, 2012 through December 31, 2013 in compliance with the GIPS standards; and
• Prepared and presented the U.S. Low Volatility Composite’s accompanying compliant presentation for the periods from August 1, 2012 through December 31, 2013 in compliance with the GIPS standards.
This report does not relate to or provide assurance on any composite compliant presentation of the Firm other than the Firm’s U.S. Low Volatility Composite.
ACA Performance Services, LLC April 23, 2014
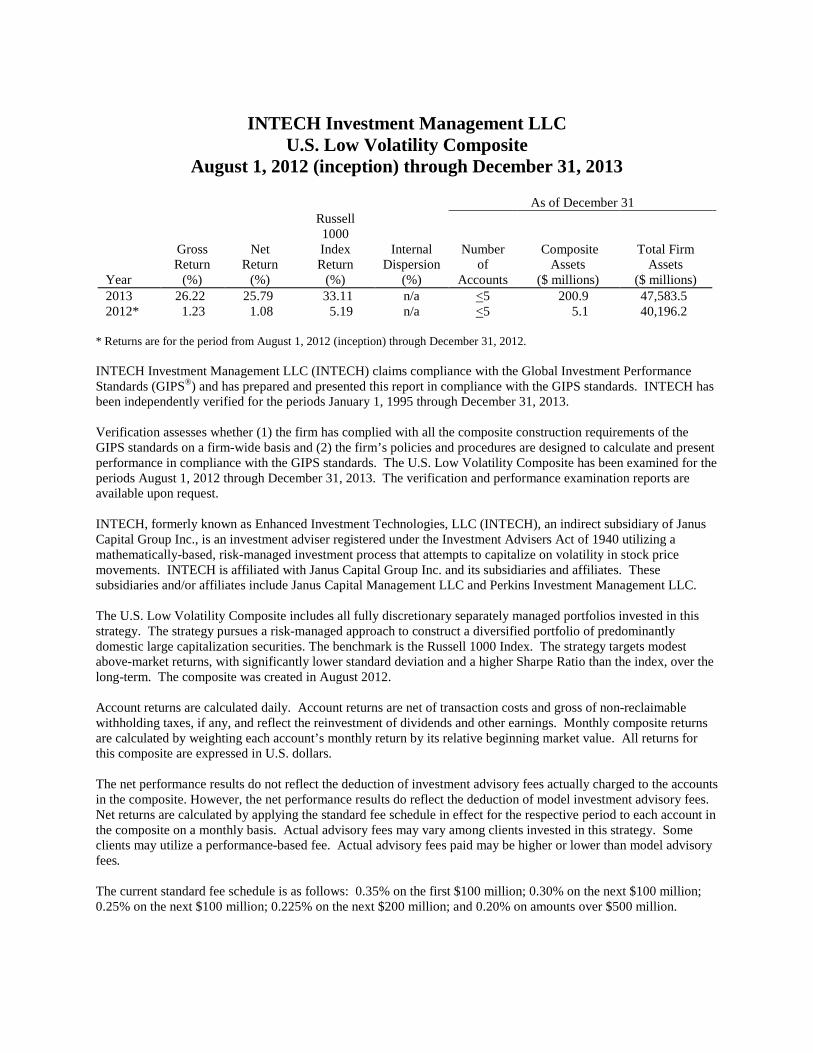
INTECH Investment Management LLC
U.S. Low Volatility Composite August 1, 2012 (inception) through December 31, 2013
As of December 31
Year
Gross Return
(%)
Net Return
(%)
Russell 1000 Index Return
(%)
Internal Dispersion
(%)
Number of
Accounts
Composite Assets
($ millions)
Total Firm Assets
($ millions) 2013 26.22 25.79 33.11 n/a <5 200.9 47,583.5 2012* 1.23 1.08 5.19 n/a <5 5.1 40,196.2
* Returns are for the period from August 1, 2012 (inception) through December 31, 2012. INTECH Investment Management LLC (INTECH) claims compliance with the Global Investment Performance Standards (GIPS®) and has prepared and presented this report in compliance with the GIPS standards. INTECH has been independently verified for the periods January 1, 1995 through December 31, 2013. Verification assesses whether (1) the firm has complied with all the composite construction requirements of the GIPS standards on a firm-wide basis and (2) the firm’s policies and procedures are designed to calculate and present performance in compliance with the GIPS standards. The U.S. Low Volatility Composite has been examined for the periods August 1, 2012 through December 31, 2013. The verification and performance examination reports are available upon request. INTECH, formerly known as Enhanced Investment Technologies, LLC (INTECH), an indirect subsidiary of Janus Capital Group Inc., is an investment adviser registered under the Investment Advisers Act of 1940 utilizing a mathematically-based, risk-managed investment process that attempts to capitalize on volatility in stock price movements. INTECH is affiliated with Janus Capital Group Inc. and its subsidiaries and affiliates. These subsidiaries and/or affiliates include Janus Capital Management LLC and Perkins Investment Management LLC. The U.S. Low Volatility Composite includes all fully discretionary separately managed portfolios invested in this strategy. The strategy pursues a risk-managed approach to construct a diversified portfolio of predominantly domestic large capitalization securities. The benchmark is the Russell 1000 Index. The strategy targets modest above-market returns, with significantly lower standard deviation and a higher Sharpe Ratio than the index, over the long-term. The composite was created in August 2012. Account returns are calculated daily. Account returns are net of transaction costs and gross of non-reclaimable withholding taxes, if any, and reflect the reinvestment of dividends and other earnings. Monthly composite returns are calculated by weighting each account’s monthly return by its relative beginning market value. All returns for this composite are expressed in U.S. dollars. The net performance results do not reflect the deduction of investment advisory fees actually charged to the accounts in the composite. However, the net performance results do reflect the deduction of model investment advisory fees. Net returns are calculated by applying the standard fee schedule in effect for the respective period to each account in the composite on a monthly basis. Actual advisory fees may vary among clients invested in this strategy. Some clients may utilize a performance-based fee. Actual advisory fees paid may be higher or lower than model advisory fees. The current standard fee schedule is as follows: 0.35% on the first $100 million; 0.30% on the next $100 million; 0.25% on the next $100 million; 0.225% on the next $200 million; and 0.20% on amounts over $500 million.

The Russell 1000 Index returns are provided to represent the investment environment existing during the time periods shown and are not covered by the report of independent verifiers. For comparison purposes, the index is fully invested, which includes the reinvestment of dividends and capital gains. The returns for the index do not include any transaction costs, management fees or other costs. Composition of each separately managed account portfolio may differ from securities in the corresponding benchmark index. The index is used as a performance benchmark only, as INTECH does not attempt to replicate an index. Because INTECH’s sector weightings are a residual of portfolio construction, significant differences between sector weightings in client portfolios and the index are common. The internal dispersion of annual returns is measured by the asset weighted standard deviation of account gross returns represented within the composite for the full year. For those periods with five or fewer accounts included for the entire year, “n/a” is noted as the dispersion is not considered meaningful. At December 31, 2013, the three-year annualized ex-post standard deviation of the composite gross and the benchmark returns are not presented because 36 monthly composite returns are not available. A list of INTECH’s composite descriptions and policies for valuing portfolios, calculating performance, and preparing compliant presentations are available upon request.
Performance figures are based upon historical information and do not guarantee future results.

INTECH Investment Management LLC U.S. Large Cap Value Composite For the periods from July 1, 1993 through December 31, 2013
Performance Examination Report
INTECH Investment Management LLC 525 Okeechobee Blvd. Suite 1800 West Palm Beach, FL 33401 We have verified whether INTECH Investment Management LLC (the Firm) (1) complied with all the composite construction requirements of the Global Investment Performance Standards (GIPS®) on a firm-wide basis for the periods from January 1, 2004 through December 31, 2013, and (2) designed its policies and procedures to calculate and present performance in compliance with the GIPS standards as of December 31, 2013. We have also examined the Firm’s U.S. Large Cap Value Composite for the periods from January 1, 2004 through December 31, 2013. The Firm’s management is responsible for compliance with the GIPS standards and the design of its policies and procedures and for the U.S. Large Cap Value Composite’s compliant presentation. Our responsibility is to express an opinion based on our verification and performance examination. We conducted this verification and performance examination in accordance with the required verification and performance examination procedures of the GIPS standards. We also conducted such other procedures as we considered necessary in the circumstances. In our opinion, the Firm has, in all material respects:
• Complied with all the composite construction requirements of the GIPS standards on a firm-wide basis for the periods from January 1, 2004 through December 31, 2013; and
• Designed its policies and procedures to calculate and present performance in compliance with the GIPS standards as of December 31, 2013.
Also, in our opinion, the Firm has, in all material respects:
• Constructed the U.S. Large Cap Value Composite and calculated the U.S. Large Cap Value Composite’s performance for the periods from January 1, 2004 through December 31, 2013 in compliance with the GIPS standards; and
• Prepared and presented the U.S. Large Cap Value Composite’s accompanying compliant presentation for the periods from January 1, 2004 through December 31, 2013 in compliance with the GIPS standards.
A performance examination of the Firm’s U.S. Large Cap Value Composite covering the periods from January 1, 1995 through December 31, 2003 was performed by another verification firm, whose report expressed an unqualified opinion thereon. We have not been engaged to examine, and did not examine, the Firm’s U.S. Large Cap Value Composite for any periods prior to January 1, 1995 and, accordingly, we express no opinion on the compliant presentation of the Firm’s U.S. Large Cap Value Composite for any periods prior to January 1, 1995. This report does not relate to or provide assurance on any composite compliant presentation of the Firm other than the Firm’s U.S. Large Cap Value Composite.
ACA Performance Services, LLC April 23, 2014

INTECH Investment Management LLC U.S. Large Cap Value Composite
July 1, 1993 through December 31, 2013
As of December 31
Year
Gross Return
(%)
Net Return
(%)
Value Index -
Blended Return
(%)
Internal Dispersion
(%)
Number of
Accounts
Composite Assets
($ millions)
Percent Non-Fee Paying
(%)
Total Firm Assets
($ millions) 2013 31.50 30.99 31.98 n/a < 5 4.3 0 47.583.5 2012 17.41 16.96 17.68 n/a < 5 3.7 0 40,196.2 2011 3.34 2.94 -0.48 n/a < 5 3.2 0 39,895.8 2010 16.92 16.46 15.10 n/a < 5 7.8 0 43,968.9 2009 19.06 18.60 21.18 n/a < 5 6.7 0 47,962.0 2008 -37.06 -37.31 -39.22 n/a < 5 5.6 0 42,383.9 2007 3.58 3.17 2.00 n/a < 5 15.0 0 69,686.7 2006 20.23 19.76 20.81 n/a < 5 14.5 0 62,336.4 2005 10.39 9.96 6.33 n/a < 5 16.6 0 44,730.8 2004 19.89 19.43 15.71 n/a < 5 18.0 0 25,809.4 2003 28.83 28.34 31.79 n/a < 5 5.5 0 14,260.6 2002 -15.30 -15.64 -20.85 n/a < 5 4.3 0 7,333.3 2001 -4.67 -5.04 -11.71 n/a < 5 5.0 0 5,685.4 2000 18.99 18.53 6.08 n/a < 5 22.5 100 5,406.1 1999 9.49 9.07 12.72 n/a < 5 26.1 100 5,929.6 1998 17.90 17.44 14.67 n/a < 5 23.8 100 5,287.7 1997 25.16 24.68 29.98 n/a < 5 20.2 100 5,217.0 1996 22.46 21.98 22.00 n/a < 5 16.1 0 5,230.0 1995 37.45 36.92 36.99 n/a < 5 15.6 0 4,339.5 1994 0.39 0.00 -0.64 n/a < 5 10.2 0 3,313.5 1993* 5.50 5.29 5.62 n/a < 5 10.6 0 2,067.6
* Returns are for the period from July 1, 1993 (inception) through December 31, 1993. INTECH Investment Management LLC (INTECH) claims compliance with the Global Investment Performance Standards (GIPS®) and has prepared and presented this report in compliance with the GIPS standards. INTECH has been independently verified for the periods January 1, 1995 through December 31, 2013. Verification assesses whether (1) the firm has complied with all the composite construction requirements of the GIPS standards on a firm-wide basis and (2) the firm’s policies and procedures are designed to calculate and present performance in compliance with the GIPS standards. The U.S. Large Cap Value Composite has been examined for the periods January 1, 1995 through December 31, 2013. The verification and performance examination reports are available upon request. INTECH, formerly known as Enhanced Investment Technologies, LLC (INTECH), an indirect subsidiary of Janus Capital Group Inc., is an investment adviser registered under the Investment Advisers Act of 1940 utilizing a mathematically-based, risk-managed investment process that attempts to capitalize on volatility in stock price movements. INTECH is affiliated with Janus Capital Group Inc. and its subsidiaries and affiliates. These subsidiaries and/or affiliates include Janus Capital Management LLC and Perkins Investment Management LLC. The U.S. Large Cap Value Composite includes all fully discretionary separately managed portfolios invested in this strategy. The strategy pursues a risk-managed approach to construct a diversified portfolio of predominantly domestic large capitalization value securities. The benchmark is the S&P Value Index. The long-term target excess return objective is 175 – 200 basis points (annualized gross of fees). The composite was created in July 1993. From January 1997 through June 2001, the composite contained one non-fee paying account managed for the then parent company.
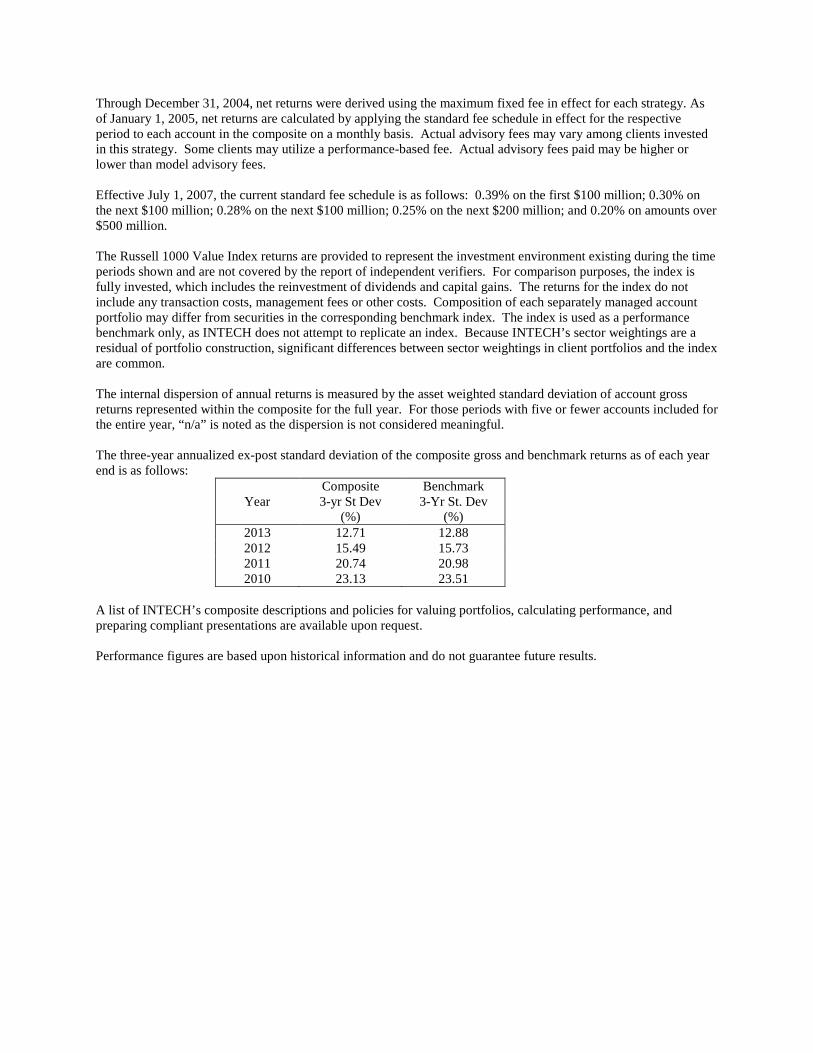
Account returns are calculated daily. Account returns are net of transaction costs and gross of non-reclaimable withholding taxes, if any, and reflect the reinvestment of dividends and other earnings. Monthly composite returns are calculated by weighting each account’s monthly return by its relative beginning market value. All returns for this composite are expressed in U.S. dollars. The net performance results do not reflect the deduction of investment advisory fees actually charged to the accounts in the composite. However, the net performance results do reflect the deduction of model investment advisory fees. Through December 31, 2004, net returns were derived using the maximum fixed fee in effect for each strategy. As of January 1, 2005, net returns are calculated by applying the standard fee schedule in effect for the respective period to each account in the composite on a monthly basis. Actual advisory fees may vary among clients invested in this strategy. Some clients may utilize a performance-based fee. Actual advisory fees paid may be higher or lower than model advisory fees. Effective July 1, 2007, the current standard fee schedule is as follows: 0.39% on the first $100 million; 0.30% on the next $100 million; 0.28% on the next $100 million; 0.25% on the next $200 million; and 0.20% on amounts over $500 million. The Value Index - Blended returns are provided to represent the investment environment existing during the time periods shown and are not covered by the report of independent verifiers. For comparison purposes, the index is fully invested, which includes the reinvestment of dividends and capital gains. The returns for the index do not include any transaction costs, management fees or other costs. Composition of each separately managed account portfolio may differ from securities in the corresponding benchmark index. The index is used as a performance benchmark only, as INTECH does not attempt to replicate an index. Because INTECH’s sector weightings are a residual of portfolio construction, significant differences between sector weightings in client portfolios and the index are common. From inception to 12/31/2005, the composite's benchmark was the S&P 500/Barra Value Index (the "Barra Value Index"). In 2005, S&P announced index name and methodology changes affecting the Barra Value Index, which later became the S&P 500/Citigroup Value Index (the "Citigroup Value Index"). During the transitional period from 1/01/2006 to 3/31/2006, the benchmark return consisted partially of the return of the Barra Value Index and the Citigroup Value Index. On 4/1/06, the composite’s benchmark was changed to the Citigroup Value Index. Effective 12/9/2009, the Citigroup Value Index's name was changed to S&P 500 Value Index. The Value Index - Blended data above is representative of these changes. The S&P 500 Value Index is a market-capitalization-weighted index developed by Standard and Poor's consisting of those stocks within the S&P 500 Index that exhibit strong value characteristics. The index measures the performance of the value style of investing in large cap U.S. stocks. The S&P 500 Value Index uses a numerical ranking system based on value factors and growth factors to determine the constituents and their weightings. The S&P 500 Value Index will be reconstituted annually. The internal dispersion of annual returns is measured by the asset weighted standard deviation of account gross returns represented within the composite for the full year. For those periods with five or fewer accounts included for the entire year, “n/a” is noted as the dispersion is not considered meaningful. The three-year annualized ex-post standard deviation of the composite gross and benchmark returns as of each year end is as follows:
Year
Composite 3-yr St Dev
(%)
Benchmark 3-Yr St. Dev
(%) 2013 12.88 13.16 2012 15.73 15.98 2011 21.52 21.40 2010 24.36 24.24
A list of INTECH’s composite descriptions and policies for valuing portfolios, calculating performance, and preparing compliant presentations are available upon request. Performance figures are based upon historical information and do not guarantee future results.
INTECH Investment Management LLC U.S. Large Cap Growth Composite For the periods from July 1, 1993 through December 31, 2013

Performance Examination Report
INTECH Investment Management LLC 525 Okeechobee Blvd. Suite 1800 West Palm Beach, FL 33401 We have verified whether INTECH Investment Management LLC (the Firm) (1) complied with all the composite construction requirements of the Global Investment Performance Standards (GIPS®) on a firm-wide basis for the periods from January 1, 2004 through December 31, 2013, and (2) designed its policies and procedures to calculate and present performance in compliance with the GIPS standards as of December 31, 2013. We have also examined the Firm’s U.S. Large Cap Growth Composite for the periods from January 1, 2004 through December 31, 2013. The Firm’s management is responsible for compliance with the GIPS standards and the design of its policies and procedures and for the U.S. Large Cap Growth Composite’s compliant presentation. Our responsibility is to express an opinion based on our verification and performance examination. We conducted this verification and performance examination in accordance with the required verification and performance examination procedures of the GIPS standards. We also conducted such other procedures as we considered necessary in the circumstances. In our opinion, the Firm has, in all material respects:
• Complied with all the composite construction requirements of the GIPS standards on a firm-wide basis for the periods from January 1, 2004 through December 31, 2013; and
• Designed its policies and procedures to calculate and present performance in compliance with the GIPS standards as of December 31, 2013.
Also, in our opinion, the Firm has, in all material respects:
• Constructed the U.S. Large Cap Growth Composite and calculated the U.S. Large Cap Growth Composite’s performance for the periods from January 1, 2004 through December 31, 2013 in compliance with the GIPS standards; and
• Prepared and presented the U.S. Large Cap Growth Composite’s accompanying compliant presentation for the periods from January 1, 2004 through December 31, 2013 in compliance with the GIPS standards.
A performance examination of the Firm’s U.S. Large Cap Growth Composite covering the periods from January 1, 1995 through December 31, 2003 was performed by another verification firm, whose report expressed an unqualified opinion thereon. We have not been engaged to examine, and did not examine, the Firm’s U.S. Large Cap Growth Composite for any periods prior to January 1, 1995 and, accordingly, we express no opinion on the compliant presentation of the Firm’s U.S. Large Cap Growth Composite for any periods prior to January 1, 1995. This report does not relate to or provide assurance on any composite compliant presentation of the Firm other than the Firm’s U.S. Large Cap Growth Composite.
ACA Performance Services, LLC April 23, 2014

INTECH Investment Management LLC U.S. Large Cap Growth Composite
July 1, 1993 through December 31, 2013
As of December 31
Year
Gross Return
(%)
Net Return
(%)
Growth Index – Blended Return
(%)
Internal Dispersion
(%)
Number of
Accounts
Composite Assets
($ millions)
Percent Non-Fee Paying
(%)
Total Firm Assets
($ millions) 2013 34.11 33.48 32.75 0.31 54 5,591.5 0 47,583.5 2012 15.29 14.76 14.61 0.28 64 5,899.3 0 40,196.2 2011 2.23 1.76 4.65 0.41 73 6,891.0 0 39,895.8 2010 17.49 16.95 15.05 0.16 80 8,030.2 0 43,968.9 2009 27.64 27.05 31.57 0.32 109 9,819.8 0 47,962.0 2008 -33.82 -34.12 -34.92 0.17 123 9,360.0 0 42,383.9 2007 8.36 7.87 9.14 0.14 130 15,651.4 0 69,686.7 2006 7.98 7.50 10.86 0.11 139 15,542.2 0 62,336.4 2005 8.00 7.52 3.46 0.09 130 13,505.2 0 44,730.8 2004 15.82 15.18 6.13 0.21 87 7,518.1 0 25,809.4 2003 29.38 28.67 25.66 0.21 61 4,210.0 0 14,260.6 2002 -14.89 -15.36 -23.59 0.20 33 1,133.7 0 7,333.3 2001 -4.55 -5.07 -12.73 0.47 18 684.0 0 5,685.4 2000 -4.95 -5.47 -22.07 0.49 10 510.0 100 5,406.1 1999 26.59 25.90 28.25 n/a < 5 455.9 100 5,929.6 1998 58.32 57.45 42.16 n/a < 5 45.9 100 5,287.7 1997 41.91 41.13 36.54 n/a < 5 29.0 100 5,217.0 1996 24.04 23.37 23.98 n/a < 5 20.4 0 5,230.0 1995 46.02 45.22 38.12 n/a < 5 15.6 0 4,339.5 1994 -1.53 -2.07 3.13 n/a < 5 10.8 0 3,313.5 1993* 4.93 4.64 4.33 n/a < 5 10.5 0 2,067.6
* Returns are for the period from July 1, 1993 (inception) through December 31, 1993. INTECH Investment Management LLC (INTECH) claims compliance with the Global Investment Performance Standards (GIPS®) and has prepared and presented this report in compliance with the GIPS standards. INTECH has been independently verified for the periods January 1, 1995 through December 31, 2013. Verification assesses whether (1) the firm has complied with all the composite construction requirements of the GIPS standards on a firm-wide basis and (2) the firm’s policies and procedures are designed to calculate and present performance in compliance with the GIPS standards. The U.S. Large Cap Growth Composite has been examined for the periods January 1, 1995 through December 31, 2013. The verification and performance examination reports are available upon request. INTECH, formerly known as Enhanced Investment Technologies, LLC (INTECH), an indirect subsidiary of Janus Capital Group Inc., is an investment adviser registered under the Investment Advisers Act of 1940 utilizing a mathematically-based, risk-managed investment process that attempts to capitalize on volatility in stock price movements. INTECH is affiliated with Janus Capital Group Inc. and its subsidiaries and affiliates. These subsidiaries and/or affiliates include Janus Capital Management LLC and Perkins Investment Management LLC. The U.S. Large Cap Growth Composite includes all fully discretionary separately managed portfolios invested in this strategy. The strategy pursues a risk-managed approach to construct a diversified portfolio of predominantly domestic large capitalization growth securities. The benchmark is the S&P 500 Growth Index. The long-term target excess return objective is 300 – 400 basis points (annualized gross of fees). The composite was created in July 1993. From January 1997 through June 2001, the composite contained one non-fee paying account managed for the then parent company.

Account returns are calculated daily. Account returns are net of transaction costs and gross of non-reclaimable withholding taxes, if any, and reflect the reinvestment of dividends and other earnings. Monthly composite returns are calculated by weighting each account’s monthly return by its relative beginning market value. All returns for this composite are expressed in U.S. dollars. The net performance results do not reflect the deduction of investment advisory fees actually charged to the accounts in the composite. However, the net performance results do reflect the deduction of model investment advisory fees. Through December 31, 2004, net returns were derived using the maximum fixed fee in effect for each strategy. As of January 1, 2005, net returns are calculated by applying the standard fee schedule in effect for the respective period to each account in the composite on a monthly basis. Actual advisory fees may vary among clients invested in this strategy. Some clients may utilize a performance-based fee. Actual advisory fees paid may be higher or lower than model advisory fees. Effective July 1, 2007, the current standard fee schedule in effect is as follows: 0.55% on the first $100 million; 0.45% on the next $100 million; 0.40% on the next $100 million; 0.35% on the next $200 million; and 0.30% on amounts over $500 million. The Growth Index - Blended returns are provided to represent the investment environment existing during the time periods shown and are not covered by the report of independent verifiers. For comparison purposes, the index is fully invested, which includes the reinvestment of dividends and capital gains. The returns for the index do not include any transaction costs, management fees or other costs. Composition of each separately managed account portfolio may differ from securities in the corresponding benchmark index. The index is used as a performance benchmark only, as INTECH does not attempt to replicate an index. Because INTECH’s sector weightings are a residual of portfolio construction, significant differences between sector weightings in client portfolios and the index are common. From inception to 12/31/2005, the composite's benchmark was the S&P 500/Barra Growth Index (the "Barra Growth Index"). In 2005, S&P announced index name and methodology changes affecting the Barra Growth Index, which later became the S&P 500/Citigroup Growth Index (the "Citigroup Growth Index"). During the transitional period from 1/01/2006 to 3/31/2006, the benchmark return consisted partially of the return of the Barra Growth Index and the Citigroup Growth Index. On 4/1/06, the composite’s benchmark was changed to the Citigroup Growth Index. Effective 12/9/2009, the Citigroup Growth Index's name was changed to S&P 500 Growth Index. The Growth Index - Blended data above is representative of these changes. The S&P 500 Growth Index is a market-capitalization-weighted index developed by Standard and Poor's consisting of those stocks within the S&P 500 Index that exhibit strong growth characteristics. The index measures the performance of the growth style of investing in large cap U.S. stocks. The S&P 500 Growth Index uses a numerical ranking system based on growth factors and value factors to determine the constituents and their weightings. The S&P 500 Growth Index will be reconstituted annually. The internal dispersion of annual returns is measured by the asset weighted standard deviation of account gross returns represented within the composite for the full year. For those periods with five or fewer accounts included for the entire year, “n/a” is noted as the dispersion is not considered meaningful. The three-year annualized ex-post standard deviation of the composite gross and benchmark returns as of each year end is as follows:
Year
Composite 3-yr St Dev
(%)
Benchmark 3-Yr St. Dev
(%) 2013 12.40 11.42 2012 15.04 15.08 2011 16.56 17.31 2010 19.79 21.15
A list of INTECH’s composite descriptions and policies for valuing portfolios, calculating performance, and preparing compliant presentations are available upon request. Performance figures are based upon historical information and do not guarantee future results.

INTECH Investment Management LLC U.S. Large Cap Core Composite For the periods from January 1, 1992 through December 31, 2013

Performance Examination Report
INTECH Investment Management LLC 525 Okeechobee Blvd. Suite 1800 West Palm Beach, FL 33401 We have verified whether INTECH Investment Management LLC (the Firm) (1) complied with all the composite construction requirements of the Global Investment Performance Standards (GIPS®) on a firm-wide basis for the periods from January 1, 2004 through December 31, 2013, and (2) designed its policies and procedures to calculate and present performance in compliance with the GIPS standards as of December 31, 2013. We have also examined the Firm’s U.S. Large Cap Core Composite for the periods from January 1, 2004 through December 31, 2013. The Firm’s management is responsible for compliance with the GIPS standards and the design of its policies and procedures and for the U.S. Large Cap Core Composite’s compliant presentation. Our responsibility is to express an opinion based on our verification and performance examination. We conducted this verification and performance examination in accordance with the required verification and performance examination procedures of the GIPS standards. We also conducted such other procedures as we considered necessary in the circumstances. In our opinion, the Firm has, in all material respects:
• Complied with all the composite construction requirements of the GIPS standards on a firm-wide basis for the periods from January 1, 2004 through December 31, 2013; and
• Designed its policies and procedures to calculate and present performance in compliance with the GIPS standards as of December 31, 2013.
Also, in our opinion, the Firm has, in all material respects:
• Constructed the U.S. Large Cap Core Composite and calculated the U.S. Large Cap Core Composite’s performance for the periods from January 1, 2004 through December 31, 2013 in compliance with the GIPS standards; and
• Prepared and presented the U.S. Large Cap Core Composite’s accompanying compliant presentation for the periods from January 1, 2004 through December 31, 2013 in compliance with the GIPS standards.
A performance examination of the Firm’s U.S. Large Cap Core Composite covering the periods from January 1, 1995 through December 31, 2003 was performed by another verification firm, whose report expressed an unqualified opinion thereon. We have not been engaged to examine, and did not examine, the Firm’s U.S. Large Cap Core Composite for any periods prior to January 1, 1995 and, accordingly, we express no opinion on the compliant presentation of the Firm’s U.S. Large Cap Core Composite for any periods prior to January 1, 1995. This report does not relate to or provide assurance on any composite compliant presentation of the Firm other than the Firm’s U.S. Large Cap Core Composite.
ACA Performance Services, LLC April 23, 2014

INTECH Investment Management LLC U.S. Large Cap Core Composite
January 1, 1992 through December 31, 2013
As of December 31
Year
Gross Return
(%)
Net Return
(%)
S&P 500 Index Return
(%)
Internal Dispersion
(%)
Number of
Accounts
Composite Assets
($ millions)
Percent Non-Fee Paying
(%)
Total Firm Assets
($ millions) 2013 32.85 32.23 32.39 n/a < 5 572.3 0 47,583.5 2012 14.97 14.42 16.00 0.15 6 902.0 0 40,196.2 2011 4.11 3.61 2.11 0.28 6 781.8 0 39,895.8 2010 15.24 14.67 15.06 0.13 7 984.3 0 43,968.9 2009 24.11 23.48 26.46 0.33 9 1,015.9 0 47,962.0 2008 -35.93 -36.23 -37.00 0.24 8 740.6 0 42,383.9 2007 7.09 6.64 5.49 n/a 8 1,857.6 0 69,686.7 2006 12.05 11.60 15.80 n/a < 5 1,385.4 0 62,336.4 2005 12.44 11.86 4.91 n/a < 5 635.1 0 44,730.8 2004 19.13 18.60 10.88 n/a < 5 95.1 0 25,809.4 2003 29.51 28.93 28.68 n/a < 5 124.0 0 14,260.6 2002 -17.65 -18.02 -22.10 n/a < 5 224.8 0 7,333.3
8/01-12/01 -3.77* -3.95* -4.62* n/a < 5 252.5 0 5,685.4 1/01-3/01 -9.78* -9.90* -11.86*
2000 6.45 5.87 -9.11 n/a < 5 20.1 100 5,406.1 1999 14.34 13.71 21.05 n/a < 5 36.0 100 5,929.6 1998 29.35 28.64 28.58 n/a < 5 55.4 100 5,287.7 1997 30.36 29.65 33.36 n/a < 5 42.6 100 5,217.0 1996 19.55 18.90 22.96 n/a < 5 32.7 0 5,230.0 1995 37.87 37.12 37.58 n/a < 5 27.4 0 4,339.5 1994 -2.69 -3.22 1.32 n/a < 5 19.9 0 3,313.5 1993 16.73 16.09 10.08 n/a < 5 20.4 0 2,067.6 1992 8.86 8.26 7.62 n/a < 5 17.5 0 1,359.5 * from April 1, 2001 through July 31, 2001, no accounts were managed which qualified for inclusion in the composite. INTECH Investment Management LLC (INTECH) claims compliance with the Global Investment Performance Standards (GIPS®) and has prepared and presented this report in compliance with the GIPS standards. INTECH has been independently verified for the periods January 1, 1995 through December 31, 2013. Verification assesses whether (1) the firm has complied with all the composite construction requirements of the GIPS standards on a firm-wide basis and (2) the firm’s policies and procedures are designed to calculate and present performance in compliance with the GIPS standards. The U.S. Large Cap Core Composite has been examined for the periods January 1, 1995 through December 31, 2013. The verification and performance examination reports are available upon request. INTECH, formerly known as Enhanced Investment Technologies, LLC (INTECH), an indirect subsidiary of Janus Capital Group Inc., is an investment adviser registered under the Investment Advisers Act of 1940 utilizing a mathematically-based, risk-managed investment process that attempts to capitalize on volatility in stock price movements. INTECH is affiliated with Janus Capital Group Inc. and its subsidiaries and affiliates. These subsidiaries and/or affiliates include Janus Capital Management LLC and Perkins Investment Management LLC.
The U.S. Large Cap Core Composite includes all fully discretionary separately managed portfolios invested in this strategy. The strategy pursues a risk-managed approach to construct a diversified portfolio of predominantly domestic large capitalization securities. The benchmark is the S&P 500 Index. The long-term target excess return objective is 300 – 400 basis points (annualized gross of fees). The composite was created in January 1993. From January 1997 through June 2001, the composite contained one non-fee paying account managed for the then parent company. Account returns are calculated daily. Account returns are net of transaction costs and gross of non-reclaimable withholding taxes, if any, and reflect the reinvestment of dividends and other earnings. Monthly composite returns are calculated by weighting each account’s monthly return by its relative beginning market value. All returns for this composite are expressed in U.S. dollars. The net performance results do not reflect the deduction of investment advisory fees actually charged to the accounts in the composite. However, the net performance results do reflect the deduction of model investment advisory fees. Through December 31, 2004, net returns were derived using the maximum fixed fee in effect for each strategy. As of January 1, 2005, net returns are calculated by applying the standard fee schedule in effect for the respective period to each account in the composite on a monthly basis. Actual advisory fees may vary among clients invested in this strategy. Some clients may utilize a performance-based fee. Actual advisory fees paid may be higher or lower than model advisory fees. Effective July 1, 2007, the standard fee schedule in effect is as follows: 0.55% on the first $100 million; 0.45% on the next $100 million; 0.40% on the next $100 million; 0.35% on the next $200 million; and 0.30% on amounts over $500 million. The S&P 500 Index returns are provided to represent the investment environment existing during the time periods shown and are not covered by the report of independent verifiers. For comparison purposes, the index is fully invested, which includes the reinvestment of dividends and capital gains. The returns for the index do not include any transaction costs, management fees or other costs. Composition of each separately managed account portfolio may differ from securities in the corresponding benchmark index. The index is used as a performance benchmark only, as INTECH does not attempt to replicate an index. Because INTECH’s sector weightings are a residual of portfolio construction, significant differences between sector weightings in client portfolios and the index are common. The internal dispersion of annual returns is measured by the asset weighted standard deviation of account gross returns represented within the composite for the full year. For those periods with five or fewer accounts included for the entire year, “n/a” is noted as the dispersion is not considered meaningful. The three-year annualized ex-post standard deviation of the composite gross and benchmark returns as of each year end is as follows:
Year
Composite 3-yr St Dev
(%)
Benchmark 3-Yr St. Dev
(%) 2013 12.22 12.11 2012 14.80 15.30 2011 18.43 18.97 2010 21.64 22.16
A list of INTECH’s composite descriptions and policies for valuing portfolios, calculating performance, and preparing compliant presentations are available upon request. Performance figures are based upon historical information and do not guarantee future results.
INTECH Investment Management LLC U.S. Enhanced Plus Composite For the periods from July 1, 1987 through December 31, 2013
Performance Examination Report
INTECH Investment Management LLC 525 Okeechobee Blvd. Suite 1800 West Palm Beach, FL 33401 We have verified whether INTECH Investment Management LLC (the Firm) (1) complied with all the composite construction requirements of the Global Investment Performance Standards (GIPS®) on a firm-wide basis for the periods from January 1, 2004 through December 31, 2013, and (2) designed its policies and procedures to calculate and present performance in compliance with the GIPS standards as of December 31, 2013. We have also examined the Firm’s U.S. Enhanced Plus Composite for the periods from January 1, 2004 through December 31, 2013. The Firm’s management is responsible for compliance with the GIPS standards and the design of its policies and procedures and for the U.S. Enhanced Plus Composite’s compliant presentation. Our responsibility is to express an opinion based on our verification and performance examination. We conducted this verification and performance examination in accordance with the required verification and performance examination procedures of the GIPS standards. We also conducted such other procedures as we considered necessary in the circumstances. In our opinion, the Firm has, in all material respects:
• Complied with all the composite construction requirements of the GIPS standards on a firm-wide basis for the periods from January 1, 2004 through December 31, 2013; and
• Designed its policies and procedures to calculate and present performance in compliance with the GIPS standards as of December 31, 2013.
Also, in our opinion, the Firm has, in all material respects:
• Constructed the U.S. Enhanced Plus Composite and calculated the U.S. Enhanced Plus Composite’s performance for the periods from January 1, 2004 through December 31, 2013 in compliance with the GIPS standards; and
• Prepared and presented the U.S. Enhanced Plus Composite’s accompanying compliant presentation for the periods from January 1, 2004 through December 31, 2013 in compliance with the GIPS standards.
A performance examination of the Firm’s U.S. Enhanced Plus Composite covering the periods from January 1, 1995 through December 31, 2003 was performed by another verification firm, whose report expressed an unqualified opinion thereon. We have not been engaged to examine, and did not examine, the Firm’s U.S. Enhanced Plus Composite for any periods prior to January 1, 1995 and, accordingly, we express no opinion on the compliant presentation of the Firm’s U.S. Enhanced Plus Composite for any periods prior to January 1, 1995. This report does not relate to or provide assurance on any composite compliant presentation of the Firm other than the Firm’s U.S. Enhanced Plus Composite.
ACA Performance Services, LLC April 23, 2014

INTECH Investment Management LLC U.S. Enhanced Plus Composite
July 1, 1987 through December 31, 2013
As of December 31
Year
Gross Return
(%)
Net Return
(%)
S&P 500 Index Return
(%)
Internal Dispersion
(%)
Number of
Accounts
Composite Assets
($ millions)
Total Firm Assets
($ millions) 2013 32.80 32.41 32.39 0.12 48 13,368.8 47,583.5 2012 15.21 14.86 16.00 0.10 50 11,435.7 40,196.2 2011 4.37 4.05 2.11 0.29 50 9,865.8 39,895.8 2010 15.61 15.26 15.06 0.18 49 10,010.7 43,968.9 2009 25.38 24.98 26.46 0.26 52 9,816.2 47,962.0 2008 -36.55 -36.74 -37.00 0.28 56 8,319.5 42,383.9 2007 7.54 7.22 5.49 0.08 56 12,873.1 69,686.7 2006 14.64 14.29 15.80 0.07 53 10,711.5 62,336.4 2005 9.17 8.83 4.91 0.07 40 6,306.6 44,730.8 2004 15.58 15.13 10.88 0.07 34 7,372.0 25,809.4 2003 28.83 28.33 28.68 0.09 20 4,763.7 14,260.6 2002 -18.45 -18.77 -22.10 0.20 16 4,102.2 7,333.3 2001 -6.73 -7.09 -11.88 0.49 11 3,457.3 5,685.4 2000 -4.38 -4.75 -9.11 1.31 14 3,278.6 5,406.1 1999 21.54 21.07 21.03 0.54 17 4,038.3 5,929.6 1998 31.49 30.98 28.57 1.38 14 3,105.2 5,287.7 1997 30.51 30.00 33.36 0.62 19 3,842.0 5,217.0 1996 20.68 20.21 22.96 0.36 31 4,978.9 5,230.0 1995 37.71 37.18 37.58 0.44 36 4,213.0 4,339.5 1994 -0.28 -0.67 1.32 0.23 35 2,986.6 3,313.5 1993 13.43 12.99 10.08 0.20 18 1,890.4 2,067.6 1992 8.63 8.21 7.62 0.10 11 1,080.9 1,359.5 1991 33.66 33.14 30.47 0.13 7 734.3 968.5 1990 -1.01 -1.39 -3.11 0.18 6 496.6 496.6 1989 33.38 32.86 31.69 n/a <5 128.5 128.5 1988 15.92 15.47 16.61 n/a <5 53.0 53.0 1987* -16.77 -16.93 -17.41 n/a <5 45.8 45.8
* Returns are for the period from July 1, 1987 (inception) through December 31, 1987. INTECH Investment Management LLC (INTECH) claims compliance with the Global Investment Performance Standards (GIPS®) and has prepared and presented this report in compliance with the GIPS standards. INTECH has been independently verified for the periods January 1, 1995 through December 31, 2013. Verification assesses whether (1) the firm has complied with all the composite construction requirements of the GIPS standards on a firm-wide basis and (2) the firm’s policies and procedures are designed to calculate and present performance in compliance with the GIPS standards. The U.S. Enhanced Plus Composite has been examined for the periods January 1, 1995 through December 31, 2013. The verification and performance examination reports are available upon request. INTECH, formerly known as Enhanced Investment Technologies, LLC (INTECH), an indirect subsidiary of Janus Capital Group Inc., is an investment adviser registered under the Investment Advisers Act of 1940 utilizing a

mathematically-based, risk-managed investment process that attempts to capitalize on volatility in stock price movements. INTECH is affiliated with Janus Capital Group Inc. and its subsidiaries and affiliates. These subsidiaries and/or affiliates include Janus Capital Management LLC and Perkins Investment Management LLC. The U.S. Enhanced Plus Composite includes all fully discretionary separately managed portfolios invested in this strategy. The strategy pursues a risk-managed approach to construct a diversified portfolio of predominantly domestic large capitalization securities. The benchmark is the S&P 500 Index. The long-term target excess return objective over the benchmark is 175 – 200 basis points (annualized gross of fees). The composite was created in January 1993. Account returns are calculated daily. Account returns are net of transaction costs and gross of non-reclaimable withholding taxes, if any, and reflect the reinvestment of dividends and other earnings. Monthly composite returns are calculated by weighting each account’s monthly return by its relative beginning market value. All returns for this composite are expressed in U.S. dollars. The net performance results do not reflect the deduction of investment advisory fees actually charged to the accounts in the composite. However, the net performance results do reflect the deduction of model investment advisory fees. Through December 31, 2004, net returns were derived using the maximum fixed fee in effect for each strategy. As of January 1, 2005, net returns are calculated by applying the standard fee schedule in effect for the respective period to each account in the composite on a monthly basis. Actual advisory fees may vary among clients invested in this strategy. Some clients may utilize a performance-based fee. Actual advisory fees paid may be higher or lower than model advisory fees. Effective July 1, 2007, the current standard fee schedule is as follows: 0.39% on the first $100 million; 0.30% on the next $100 million; 0.28% on the next $100 million; 0.25% on the next $200 million; and 0.20% on amounts over $500 million. The S&P 500 Index returns are provided to represent the investment environment existing during the time periods shown and are not covered by the report of independent verifiers. For comparison purposes, the index is fully invested, which includes the reinvestment of dividends and capital gains. The returns for the index do not include any transaction costs, management fees or other costs. Composition of each separately managed account portfolio may differ from securities in the corresponding benchmark index. The index is used as a performance benchmark only, as INTECH does not attempt to replicate an index. Because INTECH’s sector weightings are a residual of portfolio construction, significant differences between sector weightings in client portfolios and the index are common. The internal dispersion of annual returns is measured by the asset weighted standard deviation of account gross returns represented within the composite for the full year. For those periods with five or fewer accounts included for the entire year, “n/a” is noted as the dispersion is not considered meaningful. The three-year annualized ex-post standard deviation of the composite gross and benchmark returns as of each year end is as follows:
Year
Composite 3-yr St Dev
(%)
Benchmark 3-Yr St. Dev
(%) 2013 12.05 12.11 2012 14.91 15.30 2011 18.55 18.97 2010 21.98 22.16
A list of INTECH’s composite descriptions and policies for valuing portfolios, calculating performance, and preparing compliant presentations are available upon request.
Performance figures are based upon historical information and do not guarantee future results.
INTECH Investment Management LLC U.S. Enhanced Index Composite For the periods from April 1, 1998 through December 31, 2013

Performance Examination Report
INTECH Investment Management LLC 525 Okeechobee Blvd. Suite 1800 West Palm Beach, FL 33401 We have verified whether INTECH Investment Management LLC (the Firm) (1) complied with all the composite construction requirements of the Global Investment Performance Standards (GIPS®) on a firm-wide basis for the periods from January 1, 2004 through December 31, 2013, and (2) designed its policies and procedures to calculate and present performance in compliance with the GIPS standards as of December 31, 2013. We have also examined the Firm’s U.S. Enhanced Index Composite for the periods from January 1, 2004 through December 31, 2013. The Firm’s management is responsible for compliance with the GIPS standards and the design of its policies and procedures and for the U.S. Enhanced Index Composite’s compliant presentation. Our responsibility is to express an opinion based on our verification and performance examination. We conducted this verification and performance examination in accordance with the required verification and performance examination procedures of the GIPS standards. We also conducted such other procedures as we considered necessary in the circumstances. In our opinion, the Firm has, in all material respects:
• Complied with all the composite construction requirements of the GIPS standards on a firm-wide basis for the periods from January 1, 2004 through December 31, 2013; and
• Designed its policies and procedures to calculate and present performance in compliance with the GIPS standards as of December 31, 2013.
Also, in our opinion, the Firm has, in all material respects:
• Constructed the U.S. Enhanced Index Composite and calculated the U.S. Enhanced Index Composite’s performance for the periods from January 1, 2004 through December 31, 2013 in compliance with the GIPS standards; and
• Prepared and presented the U.S. Enhanced Index Composite’s accompanying compliant presentation for the periods from January 1, 2004 through December 31, 2013 in compliance with the GIPS standards.
A performance examination of the Firm’s U.S. Enhanced Index Composite covering the periods from April 1, 1998 through December 31, 2003 was performed by another verification firm, whose report expressed an unqualified opinion thereon. This report does not relate to or provide assurance on any composite compliant presentation of the Firm other than the Firm’s U.S. Enhanced Index Composite.
ACA Performance Services, LLC April 23, 2014

INTECH Investment Management LLC U.S. Enhanced Index Composite
April 1, 1998 through December 31, 2013
As of December 31
Year
Gross Return
(%)
Net Return
(%)
S&P 500 Index Return
(%)
Internal Dispersion
(%)
Number of
Accounts
Composite Assets
($ millions)
Total Firm Assets
($ millions) 2013 31.61 31.19 32.39 0.11 13 2,428.4 47,583.5 2012 15.72 15.35 16.00 0.11 16 2,256.2 40,196.2 2011 3.76 3.43 2.11 0.22 19 2,728.0 39,895.8 2010 15.33 14.96 15.06 0.07 22 3,030.6 43,968.9 2009 25.76 25.35 26.46 0.19 22 2,675.1 47,962.0 2008 -35.23 -35.43 -37.00 0.29 23 2,182.5 42,383.9 2007 6.29 5.97 5.49 0.04 17 2,768.1 69,686.7 2006 14.21 13.88 15.80 0.16 15 2,803.9 62,336.4 2005 7.67 7.37 4.91 n/a 9 2,092.5 44,730.8 2004 12.80 12.41 10.88 n/a < 5 1,049.0 25,809.4 2003 27.52 27.08 28.68 n/a < 5 749.9 14,260.6 2002 -19.99 -20.27 -22.10 n/a < 5 526.6 7,333.3 2001 -9.19 -9.51 -11.88 n/a < 5 659.7 5,685.4 2000 -6.10 -6.42 -9.11 n/a < 5 727.8 5,406.1 1999 19.75 19.33 21.03 n/a < 5 910.0 5,929.6 1998* 15.22 14.92 12.84 n/a < 5 761.4 5,287.7
* Returns are for the period from April 1, 1998 (inception) through December 31, 1998. INTECH Investment Management LLC (INTECH) claims compliance with the Global Investment Performance Standards (GIPS®) and has prepared and presented this report in compliance with the GIPS standards. INTECH has been independently verified for the periods January 1, 1995 through December 31, 2013. Verification assesses whether (1) the firm has complied with all the composite construction requirements of the GIPS standards on a firm-wide basis and (2) the firm’s policies and procedures are designed to calculate and present performance in compliance with the GIPS standards. The U.S. Enhanced Index Composite has been examined for the periods April 1, 1998 through December 31, 2013. The verification and performance examination reports are available upon request. INTECH, formerly known as Enhanced Investment Technologies, LLC (INTECH), an indirect subsidiary of Janus Capital Group Inc., is an investment adviser registered under the Investment Advisers Act of 1940 utilizing a mathematically-based, risk-managed investment process that attempts to capitalize on volatility in stock price movements. INTECH is affiliated with Janus Capital Group Inc. and its subsidiaries and affiliates. These subsidiaries and/or affiliates include Janus Capital Management LLC and Perkins Investment Management LLC. The U.S. Enhanced Index Composite includes all fully discretionary separately managed portfolios invested in this strategy. The strategy pursues a risk-managed approach to construct a diversified portfolio of predominantly domestic large capitalization securities. The benchmark is the S&P 500 Index. The long-term target excess return objective is 125 – 135 basis points (annualized gross of fees). The composite was created in April 1998.

Account returns are calculated daily. Account returns are net of transaction costs and gross of non-reclaimable withholding taxes, if any, and reflect the reinvestment of dividends and other earnings. Monthly composite returns are calculated by weighting each account’s monthly return by its relative beginning market value. All returns for this composite are expressed in U.S. dollars. The net performance results do not reflect the deduction of investment advisory fees actually charged to the accounts in the composite. However, the net performance results do reflect the deduction of model investment advisory fees. Through December 31, 2004, net returns were derived using the maximum fixed fee in effect for each strategy. As of January 1, 2005, net returns are calculated by applying the standard fee schedule in effect for the respective period to each account in the composite on a monthly basis. Actual advisory fees may vary among clients invested in this strategy. Some clients may utilize a performance-based fee. Actual advisory fees paid may be higher or lower than model advisory fees. Effective July 1, 2007, the current standard fee schedule in effect is as follows: 0.35% on the first $100 million; 0.30% on the next $100 million; 0.25% on the next $100 million; 0.225% on the next $200 million; and 0.20% on amounts over $500 million. The S&P 500 Index returns are provided to represent the investment environment existing during the time periods shown and are not covered by the report of independent verifiers. For comparison purposes, the index is fully invested, which includes the reinvestment of dividends and capital gains. The returns for the index do not include any transaction costs, management fees or other costs. Composition of each separately managed account portfolio may differ from securities in the corresponding benchmark index. The index is used as a performance benchmark only, as INTECH does not attempt to replicate an index. Because INTECH’s sector weightings are a residual of portfolio construction, significant differences between sector weightings in client portfolios and the index are common. The internal dispersion of annual returns is measured by the asset weighted standard deviation of account gross returns represented within the composite for the full year. For those periods with five or fewer accounts included for the entire year, “n/a” is noted as the dispersion is not considered meaningful. The three-year annualized ex-post standard deviation of the composite gross and benchmark returns as of each year end is as follows:
Year
Composite 3-yr St Dev
(%)
Benchmark 3-Yr St. Dev
(%) 2013 12.17 12.11 2012 15.18 15.30 2011 19.01 18.97 2010 22.21 22.16
A list of INTECH’s composite descriptions and policies for valuing portfolios, calculating performance, and preparing compliant presentations are available upon request. Performance figures are based upon historical information and do not guarantee future results.
INTECH Investment Management LLC U.S. Broad Large Cap Value Composite For the periods from August 1, 2004 through December 31, 2013

Performance Examination Report
INTECH Investment Management LLC 525 Okeechobee Blvd. Suite 1800 West Palm Beach, FL 33401 We have verified whether INTECH Investment Management LLC (the Firm) (1) complied with all the composite construction requirements of the Global Investment Performance Standards (GIPS®) on a firm-wide basis for the periods from January 1, 2004 through December 31, 2013, and (2) designed its policies and procedures to calculate and present performance in compliance with the GIPS standards as of December 31, 2013. We have also examined the Firm’s U.S. Broad Large Cap Value Composite for the periods from August 1, 2004 through December 31, 2013. The Firm’s management is responsible for compliance with the GIPS standards and the design of its policies and procedures and for the U.S. Broad Large Cap Value Composite’s compliant presentation. Our responsibility is to express an opinion based on our verification and performance examination. We conducted this verification and performance examination in accordance with the required verification and performance examination procedures of the GIPS standards. We also conducted such other procedures as we considered necessary in the circumstances. In our opinion, the Firm has, in all material respects:
• Complied with all the composite construction requirements of the GIPS standards on a firm-wide basis for the periods from January 1, 2004 through December 31, 2013; and
• Designed its policies and procedures to calculate and present performance in compliance with the GIPS standards as of December 31, 2013.
Also, in our opinion, the Firm has, in all material respects:
• Constructed the U.S. Broad Large Cap Value Composite and calculated the U.S. Broad Large Cap Value Composite’s performance for the periods from August 1, 2004 through December 31, 2013 in compliance with the GIPS standards; and
• Prepared and presented the U.S. Broad Large Cap Value Composite’s accompanying compliant presentation for the periods from August 1, 2004 through December 31, 2013 in compliance with the GIPS standards.
This report does not relate to or provide assurance on any composite compliant presentation of the Firm other than the Firm’s U.S. Broad Large Cap Value Composite.
ACA Performance Services, LLC April 23, 2014
INTECH Investment Management LLC U.S. Broad Large Cap Value Composite
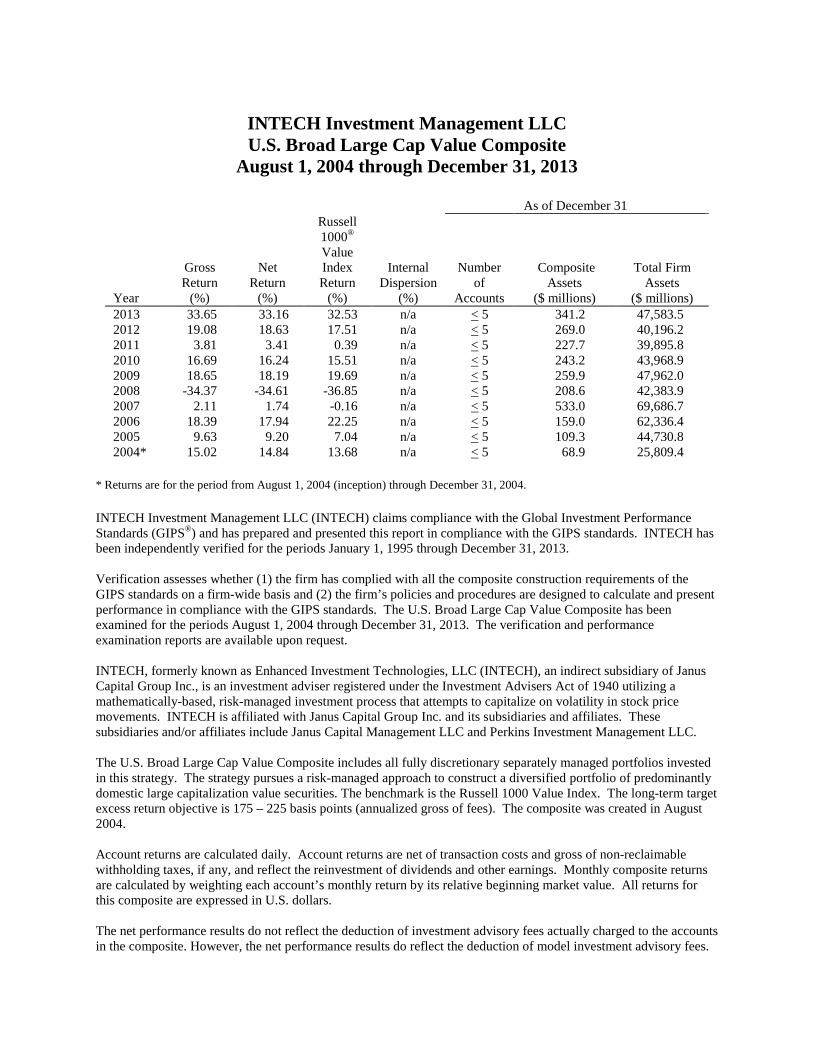
August 1, 2004 through December 31, 2013
As of December 31
Year
Gross Return
(%)
Net Return
(%)
Russell 1000® Value Index Return
(%)
Internal Dispersion
(%)
Number of
Accounts
Composite Assets
($ millions)
Total Firm Assets
($ millions) 2013 33.65 33.16 32.53 n/a < 5 341.2 47,583.5 2012 19.08 18.63 17.51 n/a < 5 269.0 40,196.2 2011 3.81 3.41 0.39 n/a < 5 227.7 39,895.8 2010 16.69 16.24 15.51 n/a < 5 243.2 43,968.9 2009 18.65 18.19 19.69 n/a < 5 259.9 47,962.0 2008 -34.37 -34.61 -36.85 n/a < 5 208.6 42,383.9 2007 2.11 1.74 -0.16 n/a < 5 533.0 69,686.7 2006 18.39 17.94 22.25 n/a < 5 159.0 62,336.4 2005 9.63 9.20 7.04 n/a < 5 109.3 44,730.8 2004* 15.02 14.84 13.68 n/a < 5 68.9 25,809.4
* Returns are for the period from August 1, 2004 (inception) through December 31, 2004. INTECH Investment Management LLC (INTECH) claims compliance with the Global Investment Performance Standards (GIPS®) and has prepared and presented this report in compliance with the GIPS standards. INTECH has been independently verified for the periods January 1, 1995 through December 31, 2013. Verification assesses whether (1) the firm has complied with all the composite construction requirements of the GIPS standards on a firm-wide basis and (2) the firm’s policies and procedures are designed to calculate and present performance in compliance with the GIPS standards. The U.S. Broad Large Cap Value Composite has been examined for the periods August 1, 2004 through December 31, 2013. The verification and performance examination reports are available upon request. INTECH, formerly known as Enhanced Investment Technologies, LLC (INTECH), an indirect subsidiary of Janus Capital Group Inc., is an investment adviser registered under the Investment Advisers Act of 1940 utilizing a mathematically-based, risk-managed investment process that attempts to capitalize on volatility in stock price movements. INTECH is affiliated with Janus Capital Group Inc. and its subsidiaries and affiliates. These subsidiaries and/or affiliates include Janus Capital Management LLC and Perkins Investment Management LLC. The U.S. Broad Large Cap Value Composite includes all fully discretionary separately managed portfolios invested in this strategy. The strategy pursues a risk-managed approach to construct a diversified portfolio of predominantly domestic large capitalization value securities. The benchmark is the Russell 1000 Value Index. The long-term target excess return objective is 175 – 225 basis points (annualized gross of fees). The composite was created in August 2004. Account returns are calculated daily. Account returns are net of transaction costs and gross of non-reclaimable withholding taxes, if any, and reflect the reinvestment of dividends and other earnings. Monthly composite returns are calculated by weighting each account’s monthly return by its relative beginning market value. All returns for this composite are expressed in U.S. dollars. The net performance results do not reflect the deduction of investment advisory fees actually charged to the accounts in the composite. However, the net performance results do reflect the deduction of model investment advisory fees.
Through December 31, 2004, net returns were derived using the maximum fixed fee in effect for each strategy. As of January 1, 2005, net returns are calculated by applying the standard fee schedule in effect for the respective period to each account in the composite on a monthly basis. Actual advisory fees may vary among clients invested in this strategy. Some clients may utilize a performance-based fee. Actual advisory fees paid may be higher or lower than model advisory fees. Effective July 1, 2007, the current standard fee schedule is as follows: 0.39% on the first $100 million; 0.30% on the next $100 million; 0.28% on the next $100 million; 0.25% on the next $200 million; and 0.20% on amounts over $500 million. The Russell 1000 Value Index returns are provided to represent the investment environment existing during the time periods shown and are not covered by the report of independent verifiers. For comparison purposes, the index is fully invested, which includes the reinvestment of dividends and capital gains. The returns for the index do not include any transaction costs, management fees or other costs. Composition of each separately managed account portfolio may differ from securities in the corresponding benchmark index. The index is used as a performance benchmark only, as INTECH does not attempt to replicate an index. Because INTECH’s sector weightings are a residual of portfolio construction, significant differences between sector weightings in client portfolios and the index are common. The internal dispersion of annual returns is measured by the asset weighted standard deviation of account gross returns represented within the composite for the full year. For those periods with five or fewer accounts included for the entire year, “n/a” is noted as the dispersion is not considered meaningful. The three-year annualized ex-post standard deviation of the composite gross and benchmark returns as of each year end is as follows:
Year
Composite 3-yr St Dev
(%)
Benchmark 3-Yr St. Dev
(%) 2013 12.71 12.88 2012 15.49 15.73 2011 20.74 20.98 2010 23.13 23.51
A list of INTECH’s composite descriptions and policies for valuing portfolios, calculating performance, and preparing compliant presentations are available upon request. Performance figures are based upon historical information and do not guarantee future results.

INTECH Investment Management LLC U.S. Broad Large Cap Growth Composite For the periods from November 1, 2000 through December 31, 2013

Performance Examination Report
INTECH Investment Management LLC 525 Okeechobee Blvd. Suite 1800 West Palm Beach, FL 33401 We have verified whether INTECH Investment Management LLC (the Firm) (1) complied with all the composite construction requirements of the Global Investment Performance Standards (GIPS®) on a firm-wide basis for the periods from January 1, 2004 through December 31, 2013, and (2) designed its policies and procedures to calculate and present performance in compliance with the GIPS standards as of December 31, 2013. We have also examined the Firm’s U.S. Broad Large Cap Growth Composite for the periods from January 1, 2004 through December 31, 2013. The Firm’s management is responsible for compliance with the GIPS standards and the design of its policies and procedures and for the U.S. Broad Large Cap Growth Composite’s compliant presentation. Our responsibility is to express an opinion based on our verification and performance examination. We conducted this verification and performance examination in accordance with the required verification and performance examination procedures of the GIPS standards. We also conducted such other procedures as we considered necessary in the circumstances. In our opinion, the Firm has, in all material respects:
• Complied with all the composite construction requirements of the GIPS standards on a firm-wide basis for the periods from January 1, 2004 through December 31, 2013; and
• Designed its policies and procedures to calculate and present performance in compliance with the GIPS standards as of December 31, 2013.
Also, in our opinion, the Firm has, in all material respects:
• Constructed the U.S. Broad Large Cap Growth Composite and calculated the U.S. Broad Large Cap Growth Composite’s performance for the periods from January 1, 2004 through December 31, 2013 in compliance with the GIPS standards; and
• Prepared and presented the U.S. Broad Large Cap Growth Composite’s accompanying compliant presentation for the periods from January 1, 2004 through December 31, 2013 in compliance with the GIPS standards.
A performance examination of the Firm’s U.S. Broad Large Cap Growth Composite covering the periods from November 1, 2000 through December 31, 2003 was performed by another verification firm, whose report expressed an unqualified opinion thereon. This report does not relate to or provide assurance on any composite compliant presentation of the Firm other than the Firm’s U.S. Broad Large Cap Growth Composite.
ACA Performance Services, LLC April 23, 2014

INTECH Investment Management LLC U.S. Broad Large Cap Growth Composite
November 1, 2000 through December 31, 2013
As of December 31
Year
Gross Return
(%)
Net Return
(%)
Russell 1000®
Growth Index Return
(%)
Internal Dispersion
(%)
Number of
Accounts
Composite Assets
($ millions)
Total Firm Assets
($ millions) 2013 34.41 33.74 33.48 0.58 29 3,486.0 47,583.5 2012 17.36 16.77 15.26 0.33 29 2,635.9 40,196.2 2011 1.90 1.39 2.64 0.64 36 3,093.5 39,895.8 2010 20.24 19.63 16.71 0.31 43 3,704.9 43,968.9 2009 34.18 33.49 37.21 0.35 63 4,984.6 47,962.0 2008 -41.85 -42.14 -38.44 0.40 78 4,997.9 42,383.9 2007 11.56 11.01 11.81 0.12 89 10,505.1 69,686.7 2006 7.92 7.39 9.09 0.12 83 9,112.1 62,336.4 2005 8.55 8.01 5.27 0.10 63 5,978.8 44,730.8 2004 13.87 13.25 6.30 0.12 42 3,956.2 25,809.4 2003 29.47 28.77 29.76 0.37 24 2,052.0 14,260.6 2002 -23.06 -23.48 -27.89 0.06 10 474.6 7,333.3 2001 -15.41 -15.88 -20.42 n/a < 5 175.7 5,685.4 2000* -6.93 -7.01 -17.43 n/a < 5 93.0 5,406.1
* Returns are for the period from November 1, 2000 (inception) through December 31, 2000. INTECH Investment Management LLC (INTECH) claims compliance with the Global Investment Performance Standards (GIPS®) and has prepared and presented this report in compliance with the GIPS standards. INTECH has been independently verified for the periods January 1, 1995 through December 31, 2013. Verification assesses whether (1) the firm has complied with all the composite construction requirements of the GIPS standards on a firm-wide basis and (2) the firm’s policies and procedures are designed to calculate and present performance in compliance with the GIPS standards. The U.S. Broad Large Cap Growth Composite has been examined for the periods November 1, 2000 through December 31, 2013. The verification and performance examination reports are available upon request. INTECH, formerly known as Enhanced Investment Technologies, LLC (INTECH), an indirect subsidiary of Janus Capital Group Inc., is an investment adviser registered under the Investment Advisers Act of 1940 utilizing a mathematically-based, risk-managed investment process that attempts to capitalize on volatility in stock price movements. INTECH is affiliated with Janus Capital Group Inc. and its subsidiaries and affiliates. These subsidiaries and/or affiliates include Janus Capital Management LLC and Perkins Investment Management LLC. The U.S. Broad Large Cap Growth Composite includes all fully discretionary separately managed portfolios invested in this strategy. The strategy pursues a risk-managed approach to construct a diversified portfolio of predominantly domestic large capitalization growth securities. The benchmark is the Russell 1000 Growth Index. The long-term target excess return objective is 300 – 400 basis points (annualized gross of fees). The composite was created in November 2000.

Account returns are calculated daily. Account returns are net of transaction costs and gross of non-reclaimable withholding taxes, if any, and reflect the reinvestment of dividends and other earnings. Monthly composite returns are calculated by weighting each account’s monthly return by its relative beginning market value. All returns for this composite are expressed in U.S. dollars. The net performance results do not reflect the deduction of investment advisory fees actually charged to the accounts in the composite. However, the net performance results do reflect the deduction of model investment advisory fees. Through December 31, 2004, net returns were derived using the maximum fixed fee in effect for each strategy. As of January 1, 2005, net returns are calculated by applying the standard fee schedule in effect for the respective period to each account in the composite on a monthly basis. Actual advisory fees may vary among clients invested in this strategy. Some clients may utilize a performance-based fee. Actual advisory fees paid may be higher or lower than model advisory fees. Effective July 1, 2007, the current standard fee schedule is as follows: 0.55% on the first $100 million; 0.45% on the next $100 million; 0.40% on the next $100 million; 0.35% on the next $200 million; and 0.30% on amounts over $500 million. The Russell 1000 Growth Index returns are provided to represent the investment environment existing during the time periods shown and are not covered by the report of independent verifiers. For comparison purposes, the index is fully invested, which includes the reinvestment of dividends and capital gains. The returns for the index do not include any transaction costs, management fees or other costs. Composition of each separately managed account portfolio may differ from securities in the corresponding benchmark index. The index is used as a performance benchmark only, as INTECH does not attempt to replicate an index. Because INTECH’s sector weightings are a residual of portfolio construction, significant differences between sector weightings in client portfolios and the index are common. The internal dispersion of annual returns is measured by the asset weighted standard deviation of account gross returns represented within the composite for the full year. For those periods with five or fewer accounts included for the entire year, “n/a” is noted as the dispersion is not considered meaningful. The three-year annualized ex-post standard deviation of the composite gross and benchmark returns as of each year end is as follows:
Year
Composite 3-yr St Dev
(%)
Benchmark 3-Yr St. Dev
(%) 2013 12.37 12.35 2012 15.13 15.88 2011 16.93 18.01 2010 22.17 22.42
A list of INTECH’s composite descriptions and policies for valuing portfolios, calculating performance, and preparing compliant presentations are available upon request. Performance figures are based upon historical information and do not guarantee future results.

INTECH Investment Management LLC U.S. Broad Enhanced Plus Composite For the periods from April 1, 2001 through December 31, 2013
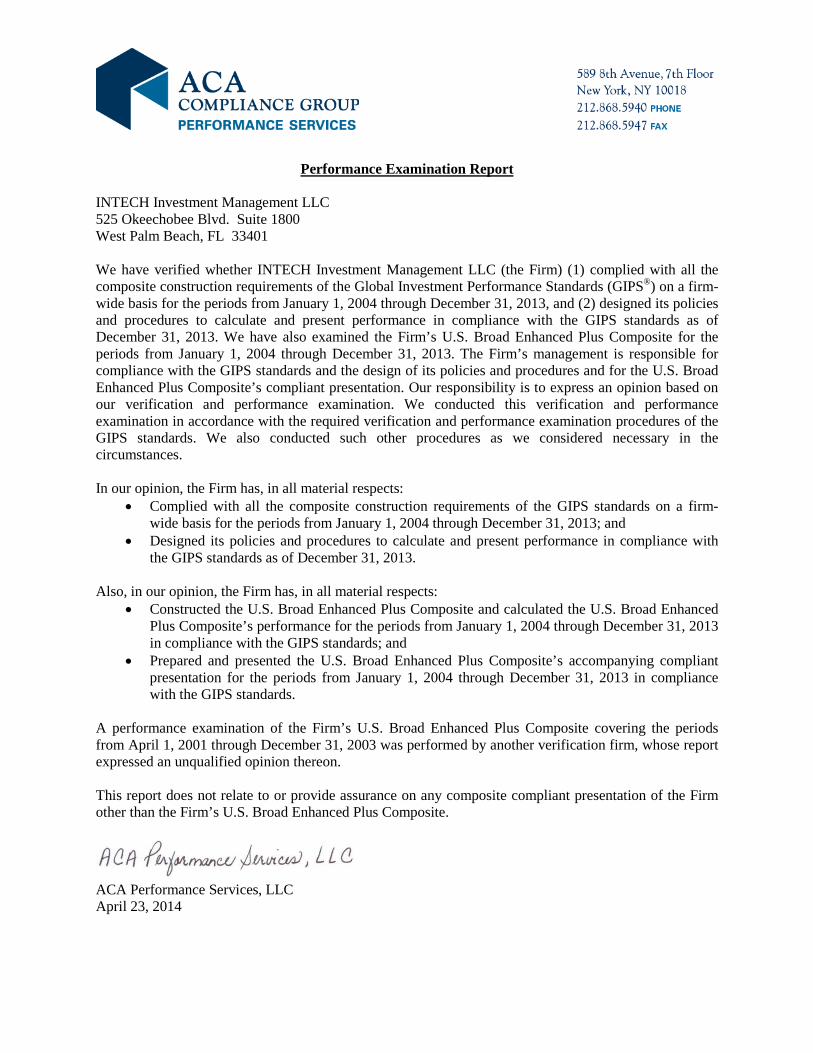
Performance Examination Report
INTECH Investment Management LLC 525 Okeechobee Blvd. Suite 1800 West Palm Beach, FL 33401 We have verified whether INTECH Investment Management LLC (the Firm) (1) complied with all the composite construction requirements of the Global Investment Performance Standards (GIPS®) on a firm-wide basis for the periods from January 1, 2004 through December 31, 2013, and (2) designed its policies and procedures to calculate and present performance in compliance with the GIPS standards as of December 31, 2013. We have also examined the Firm’s U.S. Broad Enhanced Plus Composite for the periods from January 1, 2004 through December 31, 2013. The Firm’s management is responsible for compliance with the GIPS standards and the design of its policies and procedures and for the U.S. Broad Enhanced Plus Composite’s compliant presentation. Our responsibility is to express an opinion based on our verification and performance examination. We conducted this verification and performance examination in accordance with the required verification and performance examination procedures of the GIPS standards. We also conducted such other procedures as we considered necessary in the circumstances. In our opinion, the Firm has, in all material respects:
• Complied with all the composite construction requirements of the GIPS standards on a firm-wide basis for the periods from January 1, 2004 through December 31, 2013; and
• Designed its policies and procedures to calculate and present performance in compliance with the GIPS standards as of December 31, 2013.
Also, in our opinion, the Firm has, in all material respects:
• Constructed the U.S. Broad Enhanced Plus Composite and calculated the U.S. Broad Enhanced Plus Composite’s performance for the periods from January 1, 2004 through December 31, 2013 in compliance with the GIPS standards; and
• Prepared and presented the U.S. Broad Enhanced Plus Composite’s accompanying compliant presentation for the periods from January 1, 2004 through December 31, 2013 in compliance with the GIPS standards.
A performance examination of the Firm’s U.S. Broad Enhanced Plus Composite covering the periods from April 1, 2001 through December 31, 2003 was performed by another verification firm, whose report expressed an unqualified opinion thereon. This report does not relate to or provide assurance on any composite compliant presentation of the Firm other than the Firm’s U.S. Broad Enhanced Plus Composite.
ACA Performance Services, LLC April 23, 2014
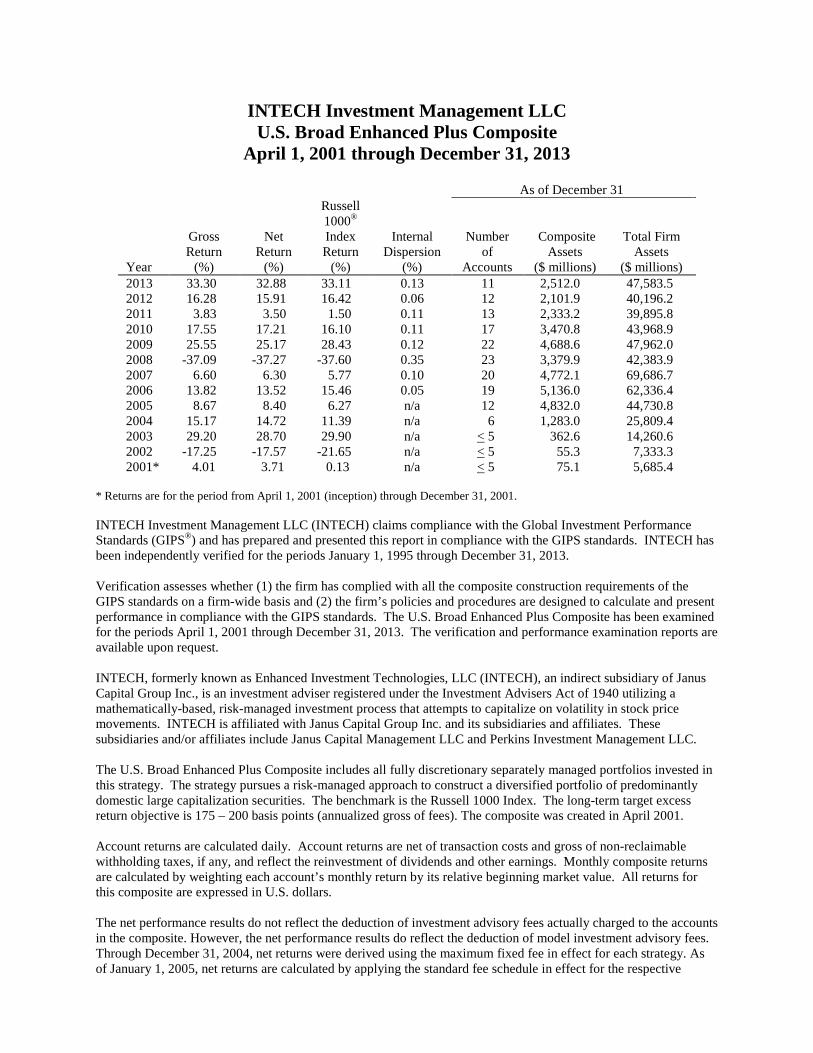
INTECH Investment Management LLC U.S. Broad Enhanced Plus Composite
April 1, 2001 through December 31, 2013
As of December 31
Year
Gross Return
(%)
Net Return
(%)
Russell 1000® Index Return
(%)
Internal Dispersion
(%)
Number of
Accounts
Composite Assets
($ millions)
Total Firm Assets
($ millions) 2013 33.30 32.88 33.11 0.13 11 2,512.0 47,583.5 2012 16.28 15.91 16.42 0.06 12 2,101.9 40,196.2 2011 3.83 3.50 1.50 0.11 13 2,333.2 39,895.8 2010 17.55 17.21 16.10 0.11 17 3,470.8 43,968.9 2009 25.55 25.17 28.43 0.12 22 4,688.6 47,962.0 2008 -37.09 -37.27 -37.60 0.35 23 3,379.9 42,383.9 2007 6.60 6.30 5.77 0.10 20 4,772.1 69,686.7 2006 13.82 13.52 15.46 0.05 19 5,136.0 62,336.4 2005 8.67 8.40 6.27 n/a 12 4,832.0 44,730.8 2004 15.17 14.72 11.39 n/a 6 1,283.0 25,809.4 2003 29.20 28.70 29.90 n/a < 5 362.6 14,260.6 2002 -17.25 -17.57 -21.65 n/a < 5 55.3 7,333.3 2001* 4.01 3.71 0.13 n/a < 5 75.1 5,685.4
* Returns are for the period from April 1, 2001 (inception) through December 31, 2001. INTECH Investment Management LLC (INTECH) claims compliance with the Global Investment Performance Standards (GIPS®) and has prepared and presented this report in compliance with the GIPS standards. INTECH has been independently verified for the periods January 1, 1995 through December 31, 2013. Verification assesses whether (1) the firm has complied with all the composite construction requirements of the GIPS standards on a firm-wide basis and (2) the firm’s policies and procedures are designed to calculate and present performance in compliance with the GIPS standards. The U.S. Broad Enhanced Plus Composite has been examined for the periods April 1, 2001 through December 31, 2013. The verification and performance examination reports are available upon request. INTECH, formerly known as Enhanced Investment Technologies, LLC (INTECH), an indirect subsidiary of Janus Capital Group Inc., is an investment adviser registered under the Investment Advisers Act of 1940 utilizing a mathematically-based, risk-managed investment process that attempts to capitalize on volatility in stock price movements. INTECH is affiliated with Janus Capital Group Inc. and its subsidiaries and affiliates. These subsidiaries and/or affiliates include Janus Capital Management LLC and Perkins Investment Management LLC. The U.S. Broad Enhanced Plus Composite includes all fully discretionary separately managed portfolios invested in this strategy. The strategy pursues a risk-managed approach to construct a diversified portfolio of predominantly domestic large capitalization securities. The benchmark is the Russell 1000 Index. The long-term target excess return objective is 175 – 200 basis points (annualized gross of fees). The composite was created in April 2001. Account returns are calculated daily. Account returns are net of transaction costs and gross of non-reclaimable withholding taxes, if any, and reflect the reinvestment of dividends and other earnings. Monthly composite returns are calculated by weighting each account’s monthly return by its relative beginning market value. All returns for this composite are expressed in U.S. dollars. The net performance results do not reflect the deduction of investment advisory fees actually charged to the accounts in the composite. However, the net performance results do reflect the deduction of model investment advisory fees. Through December 31, 2004, net returns were derived using the maximum fixed fee in effect for each strategy. As of January 1, 2005, net returns are calculated by applying the standard fee schedule in effect for the respective

period to each account in the composite on a monthly basis. Actual advisory fees may vary among clients invested in this strategy. Some clients may utilize a performance-based fee. Actual advisory fees paid may be higher or lower than model advisory fees. Effective July 1, 2007, the current standard fee schedule is as follows: 0.39% on the first $100 million; 0.30% on the next $100 million; 0.28% on the next $100 million; 0.25% on the next $200 million; and 0.20% on amounts over $500 million. The Russell 1000 Index returns are provided to represent the investment environment existing during the time periods shown and are not covered by the report of independent verifiers. For comparison purposes, the index is fully invested, which includes the reinvestment of dividends and capital gains. The returns for the index do not include any transaction costs, management fees or other costs. Composition of each separately managed account portfolio may differ from securities in the corresponding benchmark index. The index is used as a performance benchmark only, as INTECH does not attempt to replicate an index. Because INTECH’s sector weightings are a residual of portfolio construction, significant differences between sector weightings in client portfolios and the index are common. The internal dispersion of annual returns is measured by the asset weighted standard deviation of account gross returns represented within the composite for the full year. For those periods with five or fewer accounts included for the entire year, “n/a” is noted as the dispersion is not considered meaningful. The three-year annualized ex-post standard deviation of the composite gross and benchmark returns as of each year end is as follows:
Year
Composite 3-yr St Dev
(%)
Benchmark 3-Yr St. Dev
(%) 2013 12.24 12.43 2012 14.99 15.62 2011 18.62 19.22 2010 22.22 22.60
A list of INTECH’s composite descriptions and policies for valuing portfolios, calculating performance, and preparing compliant presentations are available upon request. Performance figures are based upon historical information and do not guarantee future results.

INTECH Investment Management LLC U.S. Broad Enhanced Index Composite For the periods from March 1, 2006 through December 31, 2013

Performance Examination Report
INTECH Investment Management LLC 525 Okeechobee Blvd. Suite 1800 West Palm Beach, FL 33401 We have verified whether INTECH Investment Management LLC (the Firm) (1) complied with all the composite construction requirements of the Global Investment Performance Standards (GIPS®) on a firm-wide basis for the periods from January 1, 2004 through December 31, 2013, and (2) designed its policies and procedures to calculate and present performance in compliance with the GIPS standards as of December 31, 2013. We have also examined the Firm’s U.S. Broad Enhanced Index Composite for the periods from March 1, 2006 through June 30, 2008 and October 1, 2008 through December 31, 2013. The Firm’s management is responsible for compliance with the GIPS standards and the design of its policies and procedures and for the U.S. Broad Enhanced Index Composite’s compliant presentation. Our responsibility is to express an opinion based on our verification and performance examination. We conducted this verification and performance examination in accordance with the required verification and performance examination procedures of the GIPS standards. We also conducted such other procedures as we considered necessary in the circumstances. In our opinion, the Firm has, in all material respects:
• Complied with all the composite construction requirements of the GIPS standards on a firm-wide basis for the periods from January 1, 2004 through December 31, 2013; and
• Designed its policies and procedures to calculate and present performance in compliance with the GIPS standards as of December 31, 2013.
Also, in our opinion, the Firm has, in all material respects:
• Constructed the U.S. Broad Enhanced Index Composite and calculated the U.S. Broad Enhanced Index Composite’s performance for the periods from March 1, 2006 through June 30, 2008 and October 1, 2008 through December 31, 2013 in compliance with the GIPS standards; and
• Prepared and presented the U.S. Broad Enhanced Index Composite’s accompanying compliant presentation for the periods from March 1, 2006 through June 30, 2008 and October 1, 2008 through December 31, 2013 in compliance with the GIPS standards.
This report does not relate to or provide assurance on any composite compliant presentation of the Firm other than the Firm’s U.S. Broad Enhanced Index Composite.
ACA Performance Services, LLC April 23, 2014

INTECH Investment Management LLC U.S. Broad Enhanced Index Composite
March 1, 2006 through December 31, 2013
As of December 31
Year
Gross Return
(%)
Net Return
(%)
Russell 1000® Index Return
(%)
Internal Dispersion
(%)
Number of
Accounts
Composite Assets
($ millions)
Total Firm Assets
($ millions) 2013 33.14 32.85 33.11 n/a <5 2,483.3 47,583.5 2012 16.69 16.43 16.42 n/a <5 1,870.1 40,196.2 2011 2.83 2.60 1.50 n/a <5 1,607.6 39,895.8 2010 16.13 15.82 16.10 n/a <5 1,324.3 43,968.9 2009 26.46 26.01 28.43 n/a <5 39.7 47,962.0
10/08-12/08 -22.36† -22.43† -22.48† n/a <5 31.8 42,383.9 01/08-06/08 -11.95† -12.05† -11.20†
2007 6.59 6.33 5.77 n/a <5 2,116.6 69,686.7 2006* 10.28 10.03 12.07 n/a <5 541.4 62,336.4
* Returns are for the period from March 1, 2006 through December 31, 2006. † from July 1, 2008 through September 30, 2008, no accounts were managed which qualified for inclusion in the composite. INTECH Investment Management LLC (INTECH) claims compliance with the Global Investment Performance Standards (GIPS®) and has prepared and presented this report in compliance with the GIPS standards. INTECH has been independently verified for the periods January 1, 1995 through December 31, 2013. Verification assesses whether (1) the firm has complied with all the composite construction requirements of the GIPS standards on a firm-wide basis and (2) the firm’s policies and procedures are designed to calculate and present performance in compliance with the GIPS standards. The U.S. Broad Enhanced Index Composite has been examined for the periods March 1, 2006 through December 31, 2013. The verification and performance examination reports are available upon request. INTECH, formerly known as Enhanced Investment Technologies, LLC (INTECH), an indirect subsidiary of Janus Capital Group Inc., is an investment adviser registered under the Investment Advisers Act of 1940 utilizing a mathematically-based, risk-managed investment process that attempts to capitalize on volatility in stock price movements. INTECH is affiliated with Janus Capital Group Inc. and its subsidiaries and affiliates. These subsidiaries and/or affiliates include Janus Capital Management LLC and Perkins Investment Management LLC. The U.S. Broad Enhanced Index Composite includes all fully discretionary separately managed portfolios invested in this strategy. The strategy pursues a risk-managed approach to construct a diversified portfolio of predominantly domestic large capitalization securities. The benchmark is the Russell 1000 Index. The long-term target excess return objective is 125 – 135 basis points (annualized gross of fees). The composite was created in March 2006. Account returns are calculated daily. Account returns are net of transaction costs and gross of non-reclaimable withholding taxes, if any, and reflect the reinvestment of dividends and other earnings. Monthly composite returns are calculated by weighting each account’s monthly return by its relative beginning market value. All returns for this composite are expressed in U.S. dollars. The net performance results do not reflect the deduction of investment advisory fees actually charged to the accounts in the composite. However, the net performance results do reflect the deduction of model investment advisory fees. Net returns are calculated by applying the standard fee schedule in effect for the respective period to each account in

the composite on a monthly basis. Actual advisory fees may vary among clients invested in this strategy. Some clients may utilize a performance-based fee. Actual advisory fees paid may be higher or lower than model advisory fees. The current standard fee schedule is as follows: 0.35% on the first $100 million; 0.30% on the next $100 million; 0.25% on the next $100 million; 0.225% on the next $200 million; and 0.20% on amounts over $500 million. The Russell 1000 Index returns are provided to represent the investment environment existing during the time periods shown and are not covered by the report of independent verifiers. For comparison purposes, the index is fully invested, which includes the reinvestment of dividends and capital gains. The returns for the index do not include any transaction costs, management fees or other costs. Composition of each separately managed account portfolio may differ from securities in the corresponding benchmark index. The index is used as a performance benchmark only, as INTECH does not attempt to replicate an index. Because INTECH’s sector weightings are a residual of portfolio construction, significant differences between sector weightings in client portfolios and the index are common. The internal dispersion of annual returns is measured by the asset weighted standard deviation of account gross returns represented within the composite for the full year. For those periods with five or fewer accounts included for the entire year, “n/a” is noted as the dispersion is not considered meaningful. The three-year annualized ex-post standard deviation of the composite gross and benchmark returns as of each year end is as follows:
Year
Composite 3-yr St Dev
(%)
Benchmark 3-Yr St. Dev
(%) 2013 12.45 12.43 2012 15.37 15.62 2011 19.13 19.22
A list of INTECH’s composite descriptions and policies for valuing portfolios, calculating performance, and preparing compliant presentations are available upon request. Performance figures are based upon historical information and do not guarantee future results.

INTECH Investment Management LLC Large Cap Core USA Composite For the periods from August 1, 2012 through December 31, 2013
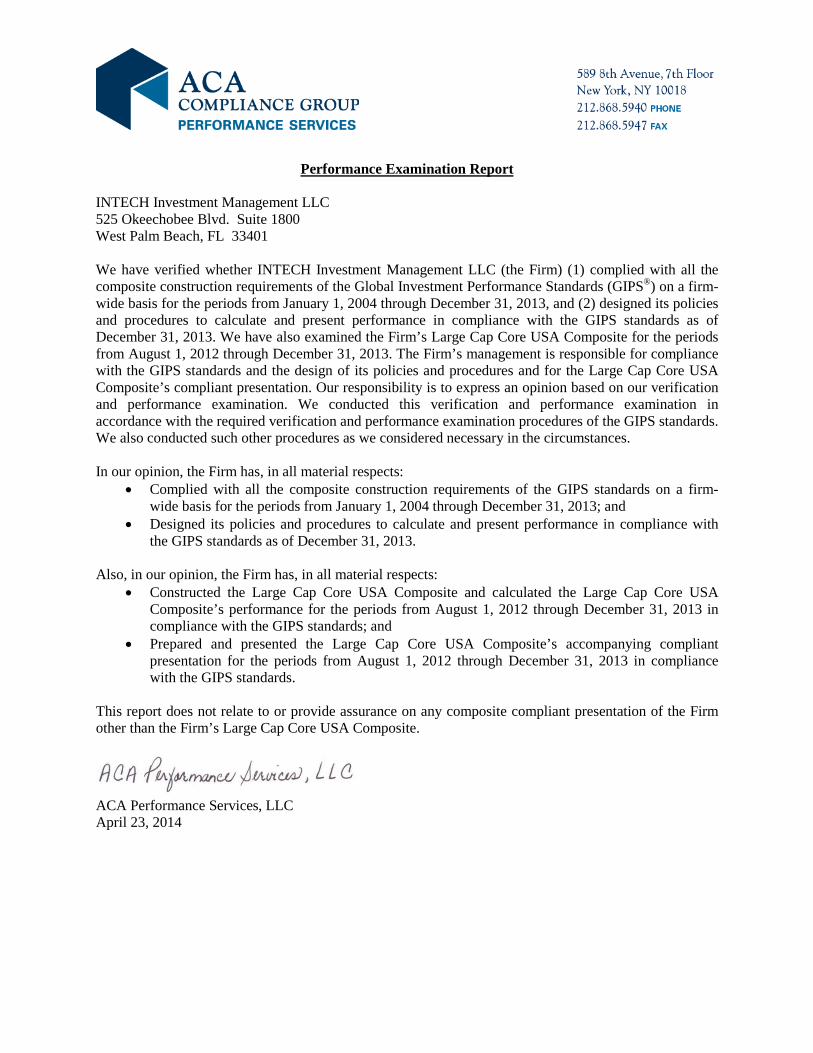
Performance Examination Report
INTECH Investment Management LLC 525 Okeechobee Blvd. Suite 1800 West Palm Beach, FL 33401 We have verified whether INTECH Investment Management LLC (the Firm) (1) complied with all the composite construction requirements of the Global Investment Performance Standards (GIPS®) on a firm-wide basis for the periods from January 1, 2004 through December 31, 2013, and (2) designed its policies and procedures to calculate and present performance in compliance with the GIPS standards as of December 31, 2013. We have also examined the Firm’s Large Cap Core USA Composite for the periods from August 1, 2012 through December 31, 2013. The Firm’s management is responsible for compliance with the GIPS standards and the design of its policies and procedures and for the Large Cap Core USA Composite’s compliant presentation. Our responsibility is to express an opinion based on our verification and performance examination. We conducted this verification and performance examination in accordance with the required verification and performance examination procedures of the GIPS standards. We also conducted such other procedures as we considered necessary in the circumstances. In our opinion, the Firm has, in all material respects:
• Complied with all the composite construction requirements of the GIPS standards on a firm-wide basis for the periods from January 1, 2004 through December 31, 2013; and
• Designed its policies and procedures to calculate and present performance in compliance with the GIPS standards as of December 31, 2013.
Also, in our opinion, the Firm has, in all material respects:
• Constructed the Large Cap Core USA Composite and calculated the Large Cap Core USA Composite’s performance for the periods from August 1, 2012 through December 31, 2013 in compliance with the GIPS standards; and
• Prepared and presented the Large Cap Core USA Composite’s accompanying compliant presentation for the periods from August 1, 2012 through December 31, 2013 in compliance with the GIPS standards.
This report does not relate to or provide assurance on any composite compliant presentation of the Firm other than the Firm’s Large Cap Core USA Composite.
ACA Performance Services, LLC April 23, 2014
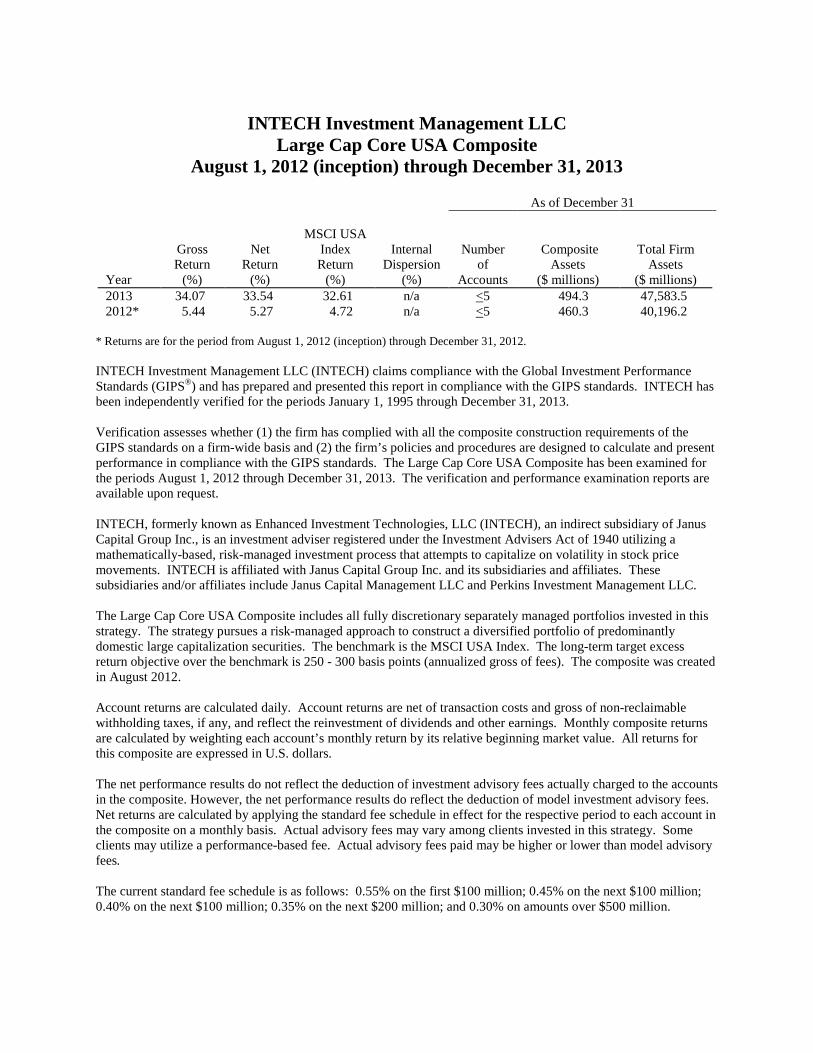
INTECH Investment Management LLC
Large Cap Core USA Composite August 1, 2012 (inception) through December 31, 2013
As of December 31
Year
Gross Return
(%)
Net Return
(%)
MSCI USA Index Return
(%)
Internal Dispersion
(%)
Number of
Accounts
Composite Assets
($ millions)
Total Firm Assets
($ millions) 2013 34.07 33.54 32.61 n/a <5 494.3 47,583.5 2012* 5.44 5.27 4.72 n/a <5 460.3 40,196.2
* Returns are for the period from August 1, 2012 (inception) through December 31, 2012. INTECH Investment Management LLC (INTECH) claims compliance with the Global Investment Performance Standards (GIPS®) and has prepared and presented this report in compliance with the GIPS standards. INTECH has been independently verified for the periods January 1, 1995 through December 31, 2013. Verification assesses whether (1) the firm has complied with all the composite construction requirements of the GIPS standards on a firm-wide basis and (2) the firm’s policies and procedures are designed to calculate and present performance in compliance with the GIPS standards. The Large Cap Core USA Composite has been examined for the periods August 1, 2012 through December 31, 2013. The verification and performance examination reports are available upon request. INTECH, formerly known as Enhanced Investment Technologies, LLC (INTECH), an indirect subsidiary of Janus Capital Group Inc., is an investment adviser registered under the Investment Advisers Act of 1940 utilizing a mathematically-based, risk-managed investment process that attempts to capitalize on volatility in stock price movements. INTECH is affiliated with Janus Capital Group Inc. and its subsidiaries and affiliates. These subsidiaries and/or affiliates include Janus Capital Management LLC and Perkins Investment Management LLC. The Large Cap Core USA Composite includes all fully discretionary separately managed portfolios invested in this strategy. The strategy pursues a risk-managed approach to construct a diversified portfolio of predominantly domestic large capitalization securities. The benchmark is the MSCI USA Index. The long-term target excess return objective over the benchmark is 250 - 300 basis points (annualized gross of fees). The composite was created in August 2012. Account returns are calculated daily. Account returns are net of transaction costs and gross of non-reclaimable withholding taxes, if any, and reflect the reinvestment of dividends and other earnings. Monthly composite returns are calculated by weighting each account’s monthly return by its relative beginning market value. All returns for this composite are expressed in U.S. dollars. The net performance results do not reflect the deduction of investment advisory fees actually charged to the accounts in the composite. However, the net performance results do reflect the deduction of model investment advisory fees. Net returns are calculated by applying the standard fee schedule in effect for the respective period to each account in the composite on a monthly basis. Actual advisory fees may vary among clients invested in this strategy. Some clients may utilize a performance-based fee. Actual advisory fees paid may be higher or lower than model advisory fees. The current standard fee schedule is as follows: 0.55% on the first $100 million; 0.45% on the next $100 million; 0.40% on the next $100 million; 0.35% on the next $200 million; and 0.30% on amounts over $500 million.

The MSCI USA Index is representative of 85% of the free float adjusted market capitalization, in each industry group, across the US equity market. The MSCI USA Index returns are provided to represent the investment environment existing during the time periods shown and are not covered by the report of independent verifiers. For comparison purposes, the index is fully invested, which includes the reinvestment of dividends and capital gains. The returns for the index do not include any transaction costs, management fees or other costs. Composition of each separately managed account portfolio may differ from securities in the corresponding benchmark index. The index is used as a performance benchmark only, as INTECH does not attempt to replicate an index. Because INTECH’s sector weightings are a residual of portfolio construction, significant differences between sector weightings in client portfolios and the index are common. The internal dispersion of annual returns is measured by the asset weighted standard deviation of account gross returns represented within the composite for the full year. For those periods with five or fewer accounts included for the entire year, “n/a” is noted as the dispersion is not considered meaningful. At December 31, 2013, the three-year annualized ex-post standard deviation of the composite gross and the benchmark returns are not presented because 36 monthly composite returns are not available. A list of INTECH’s composite descriptions and policies for valuing portfolios, calculating performance, and preparing compliant presentations are available upon request.
Performance figures are based upon historical information and do not guarantee future results.

INTECH Investment Management LLC International Large Cap Core Composite For the periods from November 1, 2006 through December 31, 2013
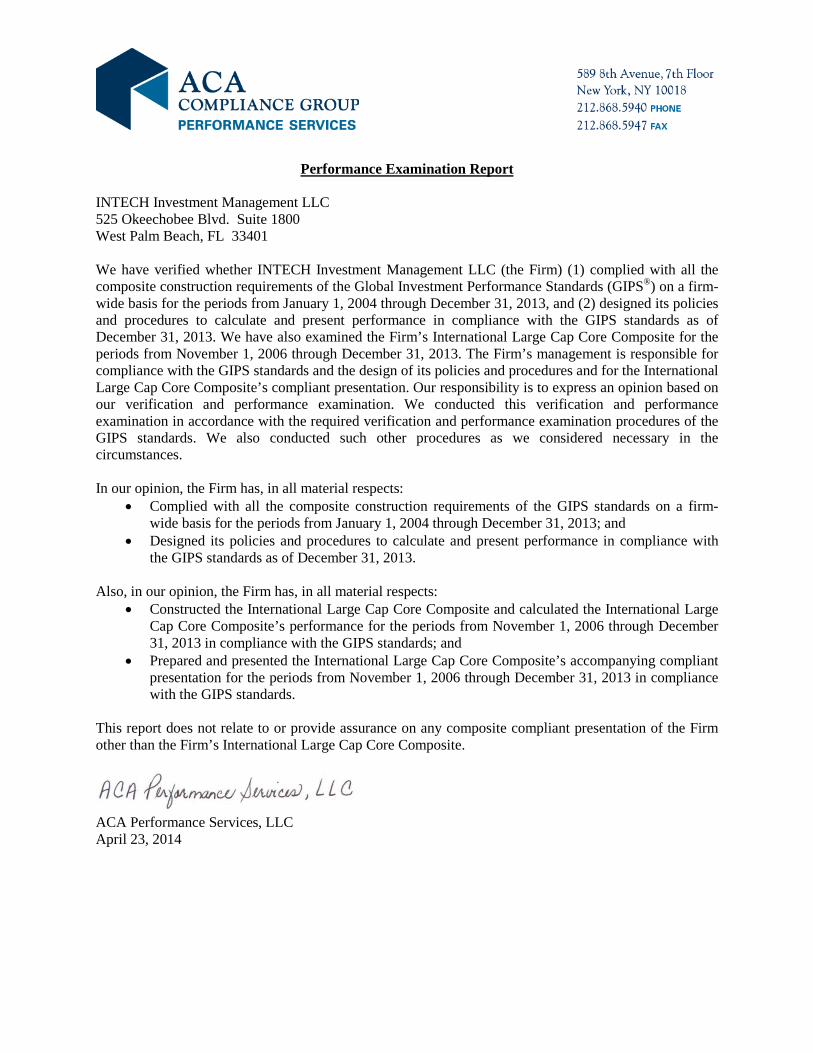
Performance Examination Report
INTECH Investment Management LLC 525 Okeechobee Blvd. Suite 1800 West Palm Beach, FL 33401 We have verified whether INTECH Investment Management LLC (the Firm) (1) complied with all the composite construction requirements of the Global Investment Performance Standards (GIPS®) on a firm-wide basis for the periods from January 1, 2004 through December 31, 2013, and (2) designed its policies and procedures to calculate and present performance in compliance with the GIPS standards as of December 31, 2013. We have also examined the Firm’s International Large Cap Core Composite for the periods from November 1, 2006 through December 31, 2013. The Firm’s management is responsible for compliance with the GIPS standards and the design of its policies and procedures and for the International Large Cap Core Composite’s compliant presentation. Our responsibility is to express an opinion based on our verification and performance examination. We conducted this verification and performance examination in accordance with the required verification and performance examination procedures of the GIPS standards. We also conducted such other procedures as we considered necessary in the circumstances. In our opinion, the Firm has, in all material respects:
• Complied with all the composite construction requirements of the GIPS standards on a firm-wide basis for the periods from January 1, 2004 through December 31, 2013; and
• Designed its policies and procedures to calculate and present performance in compliance with the GIPS standards as of December 31, 2013.
Also, in our opinion, the Firm has, in all material respects:
• Constructed the International Large Cap Core Composite and calculated the International Large Cap Core Composite’s performance for the periods from November 1, 2006 through December 31, 2013 in compliance with the GIPS standards; and
• Prepared and presented the International Large Cap Core Composite’s accompanying compliant presentation for the periods from November 1, 2006 through December 31, 2013 in compliance with the GIPS standards.
This report does not relate to or provide assurance on any composite compliant presentation of the Firm other than the Firm’s International Large Cap Core Composite.
ACA Performance Services, LLC April 23, 2014
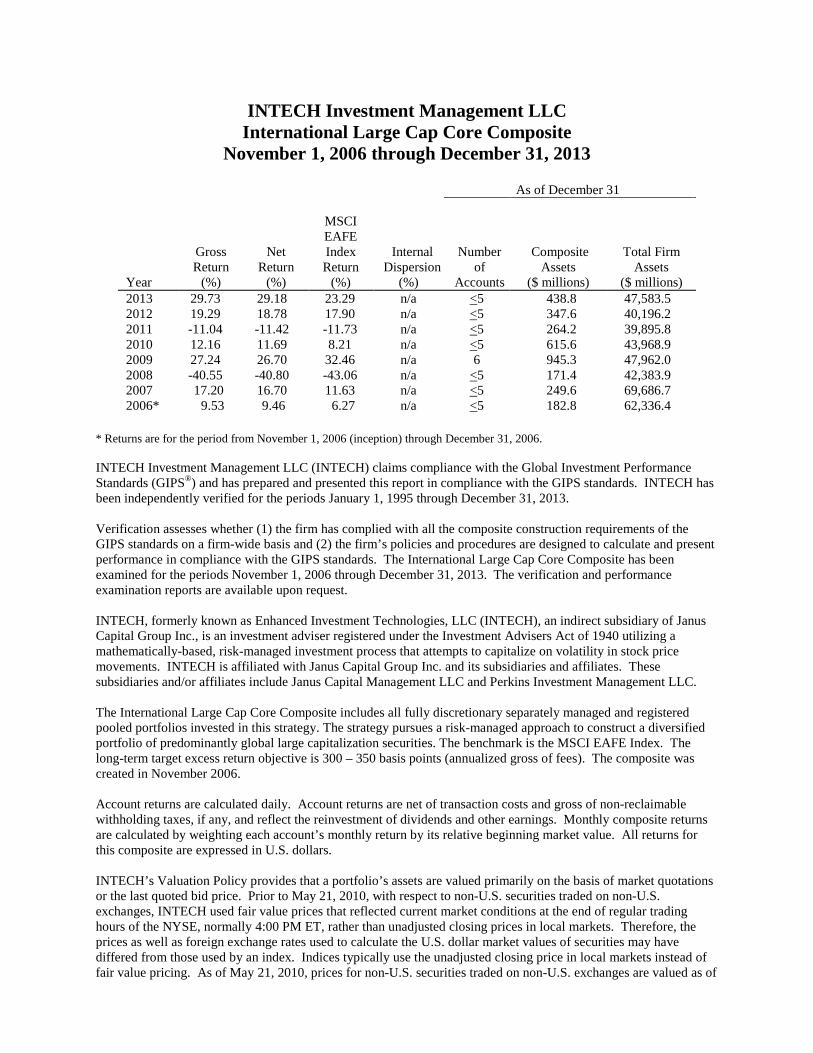
INTECH Investment Management LLC International Large Cap Core Composite
November 1, 2006 through December 31, 2013
As of December 31
Year
Gross Return
(%)
Net Return
(%)
MSCI EAFE Index Return
(%)
Internal Dispersion
(%)
Number of
Accounts
Composite Assets
($ millions)
Total Firm Assets
($ millions) 2013 29.73 29.18 23.29 n/a <5 438.8 47,583.5 2012 19.29 18.78 17.90 n/a <5 347.6 40,196.2 2011 -11.04 -11.42 -11.73 n/a <5 264.2 39,895.8 2010 12.16 11.69 8.21 n/a <5 615.6 43,968.9 2009 27.24 26.70 32.46 n/a 6 945.3 47,962.0 2008 -40.55 -40.80 -43.06 n/a <5 171.4 42,383.9 2007 17.20 16.70 11.63 n/a <5 249.6 69,686.7 2006* 9.53 9.46 6.27 n/a <5 182.8 62,336.4
* Returns are for the period from November 1, 2006 (inception) through December 31, 2006. INTECH Investment Management LLC (INTECH) claims compliance with the Global Investment Performance Standards (GIPS®) and has prepared and presented this report in compliance with the GIPS standards. INTECH has been independently verified for the periods January 1, 1995 through December 31, 2013. Verification assesses whether (1) the firm has complied with all the composite construction requirements of the GIPS standards on a firm-wide basis and (2) the firm’s policies and procedures are designed to calculate and present performance in compliance with the GIPS standards. The International Large Cap Core Composite has been examined for the periods November 1, 2006 through December 31, 2013. The verification and performance examination reports are available upon request. INTECH, formerly known as Enhanced Investment Technologies, LLC (INTECH), an indirect subsidiary of Janus Capital Group Inc., is an investment adviser registered under the Investment Advisers Act of 1940 utilizing a mathematically-based, risk-managed investment process that attempts to capitalize on volatility in stock price movements. INTECH is affiliated with Janus Capital Group Inc. and its subsidiaries and affiliates. These subsidiaries and/or affiliates include Janus Capital Management LLC and Perkins Investment Management LLC. The International Large Cap Core Composite includes all fully discretionary separately managed and registered pooled portfolios invested in this strategy. The strategy pursues a risk-managed approach to construct a diversified portfolio of predominantly global large capitalization securities. The benchmark is the MSCI EAFE Index. The long-term target excess return objective is 300 – 350 basis points (annualized gross of fees). The composite was created in November 2006. Account returns are calculated daily. Account returns are net of transaction costs and gross of non-reclaimable withholding taxes, if any, and reflect the reinvestment of dividends and other earnings. Monthly composite returns are calculated by weighting each account’s monthly return by its relative beginning market value. All returns for this composite are expressed in U.S. dollars. INTECH’s Valuation Policy provides that a portfolio’s assets are valued primarily on the basis of market quotations or the last quoted bid price. Prior to May 21, 2010, with respect to non-U.S. securities traded on non-U.S. exchanges, INTECH used fair value prices that reflected current market conditions at the end of regular trading hours of the NYSE, normally 4:00 PM ET, rather than unadjusted closing prices in local markets. Therefore, the prices as well as foreign exchange rates used to calculate the U.S. dollar market values of securities may have differed from those used by an index. Indices typically use the unadjusted closing price in local markets instead of fair value pricing. As of May 21, 2010, prices for non-U.S. securities traded on non-U.S. exchanges are valued as of

the close of their respective local markets. Non-U.S. securities are translated into U.S. dollars using the 4:00 PM London spot rate. Foreign investments are subject to certain risks of overseas investing, including currency fluctuations and changes in political and economic conditions, which could result in significant market fluctuations. The net performance results do not reflect the deduction of investment advisory fees actually charged to the accounts in the composite. However, the net performance results do reflect the deduction of model investment advisory fees. Net returns are calculated by applying the standard fee schedule in effect for the respective period to each account in the composite on a monthly basis. Actual advisory fees may vary among clients invested in this strategy. Some clients may utilize a performance-based fee. Actual advisory fees paid may be higher or lower than model advisory fees. Effective July 1, 2007, the current standard fee schedule is as follows: 0.425% on the first $250 million; 0.375% on the next $250 million; 0.325% on the next $500 million; 0.30% on the next $2 billion; and 0.25% on amounts over $3 billion. The MSCI EAFE Index is designed to measure the performance of the developed stock markets of Europe, Australasia and the Far East. The MSCI EAFE Index returns are provided to represent the investment environment existing during the time periods shown and are not covered by the report of independent verifiers. For comparison purposes, the index is fully invested, which includes the reinvestment of dividends and capital gains. The returns for the index do not include any transaction costs, management fees or other costs. Composition of each separately managed or registered pooled account portfolio may differ from securities in the corresponding benchmark index. The index is used as a performance benchmark only, as INTECH does not attempt to replicate an index. Because INTECH’s sector weightings are a residual of portfolio construction, significant differences between sector weightings in client portfolios and the index are common. The internal dispersion of annual returns is measured by the asset weighted standard deviation of account gross returns represented within the composite for the full year. For those periods with five or fewer accounts included for the entire year, “n/a” is noted as the dispersion is not considered meaningful. The three-year annualized ex-post standard deviation of the composite gross and benchmark returns as of each year end is as follows:
Year
Composite 3-yr St Dev
(%)
Benchmark 3-Yr St. Dev
(%) 2013 16.72 16.45 2012 19.34 19.59 2011 22.57 22.77 2010 25.64 26.65
A list of INTECH’s composite descriptions and policies for valuing portfolios, calculating performance, and preparing compliant presentations are available upon request. Performance figures are based upon historical information and do not guarantee future results.

INTECH Investment Management LLC Global Low Volatility Composite For the periods from January 1, 2012 through December 31, 2013

Performance Examination Report
INTECH Investment Management LLC 525 Okeechobee Blvd. Suite 1800 West Palm Beach, FL 33401 We have verified whether INTECH Investment Management LLC (the Firm) (1) complied with all the composite construction requirements of the Global Investment Performance Standards (GIPS®) on a firm-wide basis for the periods from January 1, 2004 through December 31, 2013, and (2) designed its policies and procedures to calculate and present performance in compliance with the GIPS standards as of December 31, 2013. We have also examined the Firm’s Global Low Volatility Composite for the periods from January 1, 2012 through December 31, 2013. The Firm’s management is responsible for compliance with the GIPS standards and the design of its policies and procedures and for the Global Low Volatility Composite’s compliant presentation. Our responsibility is to express an opinion based on our verification and performance examination. We conducted this verification and performance examination in accordance with the required verification and performance examination procedures of the GIPS standards. We also conducted such other procedures as we considered necessary in the circumstances. In our opinion, the Firm has, in all material respects:
• Complied with all the composite construction requirements of the GIPS standards on a firm-wide basis for the periods from January 1, 2004 through December 31, 2013; and
• Designed its policies and procedures to calculate and present performance in compliance with the GIPS standards as of December 31, 2013.
Also, in our opinion, the Firm has, in all material respects:
• Constructed the Global Low Volatility Composite and calculated the Global Low Volatility Composite’s performance for the periods from January 1, 2012 through December 31, 2013 in compliance with the GIPS standards; and
• Prepared and presented the Global Low Volatility Composite’s accompanying compliant presentation for the periods from January 1, 2012 through December 31, 2013 in compliance with the GIPS standards.
This report does not relate to or provide assurance on any composite compliant presentation of the Firm other than the Firm’s Global Low Volatility Composite.
ACA Performance Services, LLC April 23, 2014

INTECH Investment Management LLC Global Low Volatility Composite
January 1, 2012 (inception) through December 31, 2013
As of December 31
Year
Gross Return
(%)
Net Return
(%)
MSCI World Index Return
(%)
Internal Dispersion
(%)
Number of
Accounts
Composite Assets
($ millions)
Total Firm Assets
($ millions) 2013 24.30 23.86 27.36 n/a <5 21.7 47,583.5 2012 11.29 10.90 16.54 n/a <5 17.7 40,196.2
INTECH Investment Management LLC (INTECH) claims compliance with the Global Investment Performance Standards (GIPS®) and has prepared and presented this report in compliance with the GIPS standards. INTECH has been independently verified for the periods January 1, 1995 through December 31, 2013. Verification assesses whether (1) the firm has complied with all the composite construction requirements of the GIPS standards on a firm-wide basis and (2) the firm’s policies and procedures are designed to calculate and present performance in compliance with the GIPS standards. The Global Low Volatility Composite has been examined for the periods January 1, 2012 through December 31, 2013. The verification and performance examination reports are available upon request. INTECH, formerly known as Enhanced Investment Technologies, LLC (INTECH), an indirect subsidiary of Janus Capital Group Inc., is an investment adviser registered under the Investment Advisers Act of 1940 utilizing a mathematically-based, risk-managed investment process that attempts to capitalize on volatility in stock price movements. INTECH is affiliated with Janus Capital Group Inc. and its subsidiaries and affiliates. These subsidiaries and/or affiliates include Janus Capital Management LLC and Perkins Investment Management LLC. The Global Low Volatility Composite includes all fully discretionary separately managed portfolios invested in this strategy. The strategy pursues a risk-managed approach to construct a diversified portfolio of predominantly global large capitalization securities. The benchmark is the MSCI World Index. The strategy targets modest above-market returns, with significantly lower standard deviation than the index and a higher Sharpe Ratio, over the long-term. The composite was created in January 2012. Account returns are calculated daily. Account returns are net of transaction costs and gross of non-reclaimable withholding taxes, if any, and reflect the reinvestment of dividends and other earnings. Monthly composite returns are calculated by weighting each account’s monthly return by its relative beginning market value. All returns for this composite are expressed in U.S. dollars. INTECH’s Valuation Policy provides that a portfolio’s assets are valued primarily on the basis of market quotations or the last quoted bid price. Prices for non-U.S. securities traded on non-U.S. exchanges are valued as of the close of their respective local markets. Non-U.S. securities are translated into U.S. dollars using the 4:00 PM London spot rate. Foreign investments are subject to certain risks of overseas investing, including currency fluctuations and changes in political and economic conditions, which could result in significant market fluctuations. The net performance results do not reflect the deduction of investment advisory fees actually charged to the accounts in the composite. However, the net performance results do reflect the deduction of model investment advisory fees. Net returns are calculated by applying the standard fee schedule in effect for the respective period to each account in the composite on a monthly basis. Actual advisory fees may vary among clients invested in this strategy. Some clients may utilize a performance-based fee. Actual advisory fees paid may be higher or lower than model advisory fees. The current standard fee schedule is as follows: 0.35% on the first $100 million; 0.30% on the next $100 million; 0.25% on the next $100 million; 0.225% on the next $200 million; and 0.20% on amounts over $500 million.

The MSCI World Index is a free float adjusted market capitalization weighted index that is designed to measure the equity market performance of 23 developed market country indices. The MSCI World Index returns are provided to represent the investment environment existing during the time periods shown and are not covered by the report of independent verifiers. For comparison purposes, the index is fully invested, which includes the reinvestment of dividends and capital gains. The returns for the index do not include any transaction costs, management fees or other costs. Composition of each separately managed account portfolio may differ from securities in the corresponding benchmark index. The index is used as a performance benchmark only, as INTECH does not attempt to replicate an index. Because INTECH’s sector weightings are a residual of portfolio construction, significant differences between sector weightings in client portfolios and the index are common. The internal dispersion of annual returns is measured by the asset weighted standard deviation of account gross returns represented within the composite for the full year. For those periods with five or fewer accounts included for the entire year, “n/a” is noted as the dispersion is not considered meaningful. At December 31, 2013, the three-year annualized ex-post standard deviation of the composite gross and the benchmark returns are not presented because 36 monthly composite returns are not available. A list of INTECH’s composite descriptions and policies for valuing portfolios, calculating performance, and preparing compliant presentations are available upon request. Performance figures are based upon historical information and do not guarantee future results.
INTECH Investment Management LLC Global Large Cap Core ex Japan (Kokusai) Composite For the periods from May 1, 2009 through December 31, 2013

Performance Examination Report
INTECH Investment Management LLC 525 Okeechobee Blvd. Suite 1800 West Palm Beach, FL 33401 We have verified whether INTECH Investment Management LLC (the Firm) (1) complied with all the composite construction requirements of the Global Investment Performance Standards (GIPS®) on a firm-wide basis for the periods from January 1, 2004 through December 31, 2013, and (2) designed its policies and procedures to calculate and present performance in compliance with the GIPS standards as of December 31, 2013. We have also examined the Firm’s Global Large Cap Core ex Japan (Kokusai) Composite for the periods from May 1, 2009 through December 31, 2013. The Firm’s management is responsible for compliance with the GIPS standards and the design of its policies and procedures and for the Global Large Cap Core ex Japan (Kokusai) Composite’s compliant presentation. Our responsibility is to express an opinion based on our verification and performance examination. We conducted this verification and performance examination in accordance with the required verification and performance examination procedures of the GIPS standards. We also conducted such other procedures as we considered necessary in the circumstances. In our opinion, the Firm has, in all material respects:
• Complied with all the composite construction requirements of the GIPS standards on a firm-wide basis for the periods from January 1, 2004 through December 31, 2013; and
• Designed its policies and procedures to calculate and present performance in compliance with the GIPS standards as of December 31, 2013.
Also, in our opinion, the Firm has, in all material respects:
• Constructed the Global Large Cap Core ex Japan (Kokusai) Composite and calculated the Global Large Cap Core ex Japan (Kokusai) Composite’s performance for the periods from May 1, 2009 through December 31, 2013 in compliance with the GIPS standards; and
• Prepared and presented the Global Large Cap Core ex Japan (Kokusai) Composite’s accompanying compliant presentation for the periods from May 1, 2009 through December 31, 2013 in compliance with the GIPS standards.
This report does not relate to or provide assurance on any composite compliant presentation of the Firm other than the Firm’s Global Large Cap Core ex Japan (Kokusai) Composite.
ACA Performance Services, LLC April 23, 2014

INTECH Investment Management LLC Global Large Cap Core ex Japan (Kokusai) Composite
May 1, 2009 through December 31, 2013
As of December 31
Year
Gross Return
(%)
Net Return
(%)
MSCI Kokusai
(World ex Japan) Index Return
(%)
Internal Dispersion
(%)
Number of
Accounts
Composite Assets
($ millions)
Total Firm Assets
($ millions) 2013 32.06 31.38 27.37 n/a <5 1,871.7 47,583.5 2012 18.66 18.01 17.36 n/a <5 168.9 40,196.2 2011 -2.74 -3.27 -3.98 n/a <5 168.0 39,895.8 2010 14.61 13.99 11.99 n/a <5 133.3 43,968.9 2009* 30.85 30.39 35.26 n/a <5 190.2 47,962.0
* Returns are for the period from May 1, 2009 (inception) through December 31, 2009.
INTECH Investment Management LLC (INTECH) claims compliance with the Global Investment Performance Standards (GIPS®) and has prepared and presented this report in compliance with the GIPS standards. INTECH has been independently verified for the periods January 1, 1995 through December 31, 2013. Verification assesses whether (1) the firm has complied with all the composite construction requirements of the GIPS standards on a firm-wide basis and (2) the firm’s policies and procedures are designed to calculate and present performance in compliance with the GIPS standards. The Global Large Cap Core ex Japan (Kokusai) Composite has been examined for the periods May 1, 2009 through December 31, 2013. The verification and performance examination reports are available upon request. INTECH, formerly known as Enhanced Investment Technologies, LLC (INTECH), an indirect subsidiary of Janus Capital Group Inc., is an investment adviser registered under the Investment Advisers Act of 1940 utilizing a mathematically-based, risk-managed investment process that attempts to capitalize on volatility in stock price movements. INTECH is affiliated with Janus Capital Group Inc. and its subsidiaries and affiliates. These subsidiaries and/or affiliates include Janus Capital Management LLC and Perkins Investment Management LLC. The Global Large Cap Core ex Japan (Kokusai) Composite includes all fully discretionary separately managed portfolios invested in this strategy. The strategy pursues a risk-managed approach to construct a diversified portfolio of predominantly global large capitalization securities. The benchmark is the MSCI World ex Japan Index. The long-term target excess return objective is 250 – 350 basis points (annualized gross of fees). The composite was created in May 2009. Account returns are calculated daily. Account returns are net of transaction costs and gross of non-reclaimable withholding taxes, if any, and reflect the reinvestment of dividends and other earnings. Monthly composite returns are calculated by weighting each account’s monthly return by its relative beginning market value. All returns for this composite are expressed in U.S. dollars. INTECH’s Valuation Policy provides that a portfolio’s assets are valued primarily on the basis of market quotations or the last quoted bid price. Prior to May 21, 2010, with respect to non-U.S. securities traded on non-U.S. exchanges, INTECH used fair value prices that reflected current market conditions at the end of regular trading hours of the NYSE, normally 4:00 PM ET, rather than unadjusted closing prices in local markets. Therefore, the prices as well as foreign exchange rates used to calculate the U.S. dollar market values of securities may have differed from those used by an index. Indices typically use the unadjusted closing price in local markets instead of fair value pricing. As of May 21, 2010, prices for non-U.S. securities traded on non-U.S. exchanges are valued as of the close of their respective local markets. Non-U.S. securities are translated into U.S. dollars using the 4:00 PM

London spot rate. Foreign investments are subject to certain risks of overseas investing, including currency fluctuations and changes in political and economic conditions, which could result in significant market fluctuations. The net performance results do not reflect the deduction of investment advisory fees actually charged to the accounts in the composite. However, the net performance results do reflect the deduction of model investment advisory fees. Net returns are calculated by applying the standard fee schedule in effect for the respective period to each account in the composite on a monthly basis. Actual advisory fees may vary among clients invested in this strategy. Some clients may utilize a performance-based fee. Actual advisory fees paid may be higher or lower than model advisory fees. The current standard fee schedule is as follows: 0.55% on the first $100 million; 0.50% on the next $100 million; 0.45% on the next $100 million; 0.425% on the next $200 million; and 0.40% on amounts over $500 million. The MSCI Kokusai (World ex Japan) Index is a free float adjusted market capitalization weighted index that is designed to measure the equity market performance of developed markets excluding Japan. The MSCI Kokusai (World ex Japan) Index returns are provided to represent the investment environment existing during the time periods shown and are not covered by the report of independent verifiers. For comparison purposes, the index is fully invested, which includes the reinvestment of dividends and capital gains. The returns for the index do not include any transaction costs, management fees or other costs. Composition of each separately managed account portfolio may differ from securities in the corresponding benchmark index. The index is used as a performance benchmark only, as INTECH does not attempt to replicate an index. Because INTECH’s sector weightings are a residual of portfolio construction, significant differences between sector weightings in client portfolios and the index are common. The internal dispersion of annual returns is measured by the asset weighted standard deviation of account gross returns represented within the composite for the full year. For those periods with five or fewer accounts included for the entire year, “n/a” is noted as the dispersion is not considered meaningful. The three-year annualized ex-post standard deviation of the composite gross and benchmark returns as of each year end is as follows:
Year
Composite 3-yr St Dev
(%)
Benchmark 3-Yr St. Dev
(%) 2013 14.36 14.27 2012 17.22 17.72 2011 < 3 years < 3 years
At December 31, 2011, the three-year annualized ex-post standard deviation of the composite and the benchmark are not presented because 36 monthly composite returns are not available. A list of INTECH’s composite descriptions and policies for valuing portfolios, calculating performance, and preparing compliant presentations are available upon request. Performance figures are based upon historical information and do not guarantee future results.
INTECH Investment Management LLC Global Large Cap Core Composite For the periods from January 1, 2005 through December 31, 2013

Performance Examination Report
INTECH Investment Management LLC 525 Okeechobee Blvd. Suite 1800 West Palm Beach, FL 33401 We have verified whether INTECH Investment Management LLC (the Firm) (1) complied with all the composite construction requirements of the Global Investment Performance Standards (GIPS®) on a firm-wide basis for the periods from January 1, 2004 through December 31, 2013, and (2) designed its policies and procedures to calculate and present performance in compliance with the GIPS standards as of December 31, 2013. We have also examined the Firm’s Global Large Cap Core Composite for the periods from January 1, 2005 through December 31, 2013. The Firm’s management is responsible for compliance with the GIPS standards and the design of its policies and procedures and for the Global Large Cap Core Composite’s compliant presentation. Our responsibility is to express an opinion based on our verification and performance examination. We conducted this verification and performance examination in accordance with the required verification and performance examination procedures of the GIPS standards. We also conducted such other procedures as we considered necessary in the circumstances. In our opinion, the Firm has, in all material respects:
• Complied with all the composite construction requirements of the GIPS standards on a firm-wide basis for the periods from January 1, 2004 through December 31, 2013; and
• Designed its policies and procedures to calculate and present performance in compliance with the GIPS standards as of December 31, 2013.
Also, in our opinion, the Firm has, in all material respects:
• Constructed the Global Large Cap Core Composite and calculated the Global Large Cap Core Composite’s performance for the periods from January 1, 2005 through December 31, 2013 in compliance with the GIPS standards; and
• Prepared and presented the Global Large Cap Core Composite’s accompanying compliant presentation for the periods from January 1, 2005 through December 31, 2013 in compliance with the GIPS standards.
This report does not relate to or provide assurance on any composite compliant presentation of the Firm other than the Firm’s Global Large Cap Core Composite.
ACA Performance Services, LLC April 23, 2014
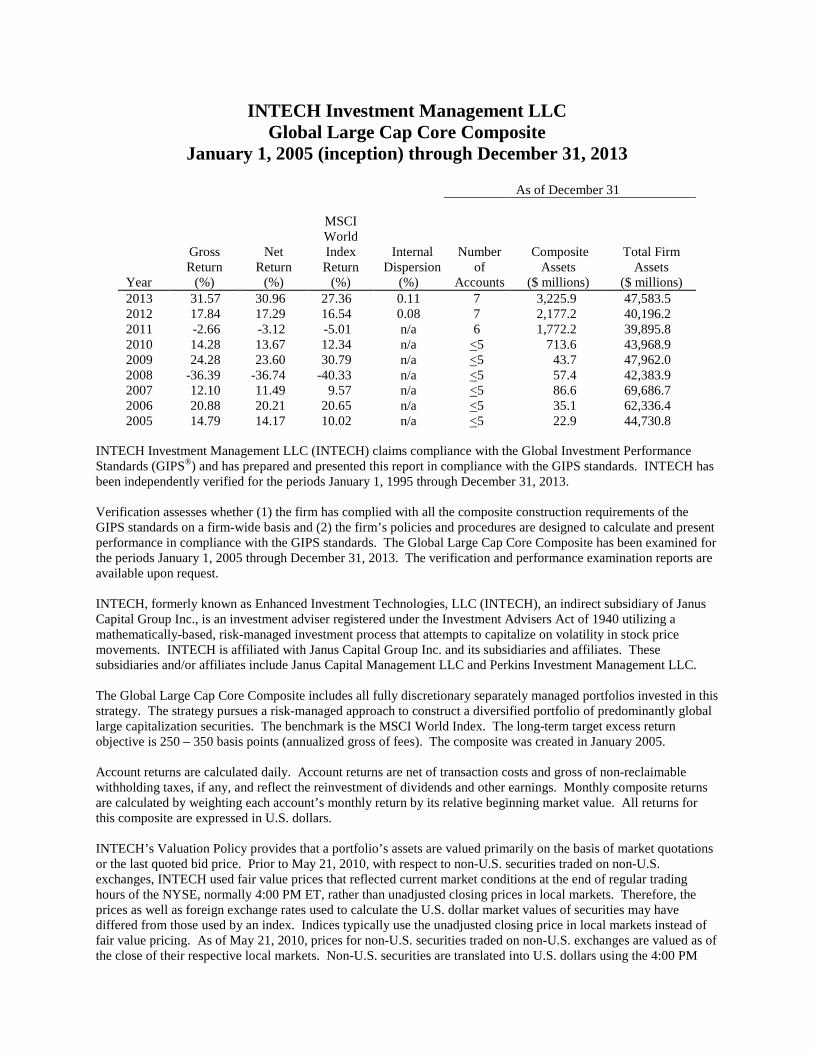
INTECH Investment Management LLC Global Large Cap Core Composite
January 1, 2005 (inception) through December 31, 2013
As of December 31
Year
Gross Return
(%)
Net Return
(%)
MSCI World Index Return
(%)
Internal Dispersion
(%)
Number of
Accounts
Composite Assets
($ millions)
Total Firm Assets
($ millions) 2013 31.57 30.96 27.36 0.11 7 3,225.9 47,583.5 2012 17.84 17.29 16.54 0.08 7 2,177.2 40,196.2 2011 -2.66 -3.12 -5.01 n/a 6 1,772.2 39,895.8 2010 14.28 13.67 12.34 n/a <5 713.6 43,968.9 2009 24.28 23.60 30.79 n/a <5 43.7 47,962.0 2008 -36.39 -36.74 -40.33 n/a <5 57.4 42,383.9 2007 12.10 11.49 9.57 n/a <5 86.6 69,686.7 2006 20.88 20.21 20.65 n/a <5 35.1 62,336.4 2005 14.79 14.17 10.02 n/a <5 22.9 44,730.8
INTECH Investment Management LLC (INTECH) claims compliance with the Global Investment Performance Standards (GIPS®) and has prepared and presented this report in compliance with the GIPS standards. INTECH has been independently verified for the periods January 1, 1995 through December 31, 2013. Verification assesses whether (1) the firm has complied with all the composite construction requirements of the GIPS standards on a firm-wide basis and (2) the firm’s policies and procedures are designed to calculate and present performance in compliance with the GIPS standards. The Global Large Cap Core Composite has been examined for the periods January 1, 2005 through December 31, 2013. The verification and performance examination reports are available upon request. INTECH, formerly known as Enhanced Investment Technologies, LLC (INTECH), an indirect subsidiary of Janus Capital Group Inc., is an investment adviser registered under the Investment Advisers Act of 1940 utilizing a mathematically-based, risk-managed investment process that attempts to capitalize on volatility in stock price movements. INTECH is affiliated with Janus Capital Group Inc. and its subsidiaries and affiliates. These subsidiaries and/or affiliates include Janus Capital Management LLC and Perkins Investment Management LLC. The Global Large Cap Core Composite includes all fully discretionary separately managed portfolios invested in this strategy. The strategy pursues a risk-managed approach to construct a diversified portfolio of predominantly global large capitalization securities. The benchmark is the MSCI World Index. The long-term target excess return objective is 250 – 350 basis points (annualized gross of fees). The composite was created in January 2005. Account returns are calculated daily. Account returns are net of transaction costs and gross of non-reclaimable withholding taxes, if any, and reflect the reinvestment of dividends and other earnings. Monthly composite returns are calculated by weighting each account’s monthly return by its relative beginning market value. All returns for this composite are expressed in U.S. dollars. INTECH’s Valuation Policy provides that a portfolio’s assets are valued primarily on the basis of market quotations or the last quoted bid price. Prior to May 21, 2010, with respect to non-U.S. securities traded on non-U.S. exchanges, INTECH used fair value prices that reflected current market conditions at the end of regular trading hours of the NYSE, normally 4:00 PM ET, rather than unadjusted closing prices in local markets. Therefore, the prices as well as foreign exchange rates used to calculate the U.S. dollar market values of securities may have differed from those used by an index. Indices typically use the unadjusted closing price in local markets instead of fair value pricing. As of May 21, 2010, prices for non-U.S. securities traded on non-U.S. exchanges are valued as of the close of their respective local markets. Non-U.S. securities are translated into U.S. dollars using the 4:00 PM

London spot rate. Foreign investments are subject to certain risks of overseas investing, including currency fluctuations and changes in political and economic conditions, which could result in significant market fluctuations. The net performance results do not reflect the deduction of investment advisory fees actually charged to the accounts in the composite. However, the net performance results do reflect the deduction of model investment advisory fees. Net returns are calculated by applying the standard fee schedule in effect for the respective period to each account in the composite on a monthly basis. Actual advisory fees may vary among clients invested in this strategy. Some clients may utilize a performance-based fee. Actual advisory fees paid may be higher or lower than model advisory fees. Effective July 1, 2007, the current standard fee schedule is as follows: 0.55% on the first $100 million; 0.50% on the next $100 million; 0.45% on the next $100 million; 0.425% on the next $200 million; and 0.40% on amounts over $500 million. The MSCI World Index is a free float adjusted market capitalization weighted index that is designed to measure the equity market performance of 23 developed market country indices. The MSCI World Index returns are provided to represent the investment environment existing during the time periods shown and are not covered by the report of independent verifiers. For comparison purposes, the index is fully invested, which includes the reinvestment of dividends and capital gains. The returns for the index do not include any transaction costs, management fees or other costs. Composition of each separately managed account portfolio may differ from securities in the corresponding benchmark index. The index is used as a performance benchmark only, as INTECH does not attempt to replicate an index. Because INTECH’s sector weightings are a residual of portfolio construction, significant differences between sector weightings in client portfolios and the index are common. The internal dispersion of annual returns is measured by the asset weighted standard deviation of account gross returns represented within the composite for the full year. For those periods with five or fewer accounts included for the entire year, “n/a” is noted as the dispersion is not considered meaningful. The three-year annualized ex-post standard deviation of the composite gross and benchmark returns as of each year end is as follows:
Year
Composite 3-yr St Dev
(%)
Benchmark 3-Yr St. Dev
(%) 2013 14.07 13.71 2012 16.80 16.96 2011 19.83 20.44 2010 22.80 24.08
A list of INTECH’s composite descriptions and policies for valuing portfolios, calculating performance, and preparing compliant presentations are available upon request. Performance figures are based upon historical information and do not guarantee future results.

INTECH Investment Management LLC Global High Dividend Core Composite For the periods from April 1, 2012 through December 31, 2013

Performance Examination Report
INTECH Investment Management LLC 525 Okeechobee Blvd. Suite 1800 West Palm Beach, FL 33401 We have verified whether INTECH Investment Management LLC (the Firm) (1) complied with all the composite construction requirements of the Global Investment Performance Standards (GIPS®) on a firm-wide basis for the periods from January 1, 2004 through December 31, 2013, and (2) designed its policies and procedures to calculate and present performance in compliance with the GIPS standards as of December 31, 2013. We have also examined the Firm’s Global High Dividend Core Composite for the periods from April 1, 2012 through December 31, 2013. The Firm’s management is responsible for compliance with the GIPS standards and the design of its policies and procedures and for the Global High Dividend Core Composite’s compliant presentation. Our responsibility is to express an opinion based on our verification and performance examination. We conducted this verification and performance examination in accordance with the required verification and performance examination procedures of the GIPS standards. We also conducted such other procedures as we considered necessary in the circumstances. In our opinion, the Firm has, in all material respects:
• Complied with all the composite construction requirements of the GIPS standards on a firm-wide basis for the periods from January 1, 2004 through December 31, 2013; and
• Designed its policies and procedures to calculate and present performance in compliance with the GIPS standards as of December 31, 2013.
Also, in our opinion, the Firm has, in all material respects:
• Constructed the Global High Dividend Core Composite and calculated the Global High Dividend Core Composite’s performance for the periods from April 1, 2012 through December 31, 2013 in compliance with the GIPS standards; and
• Prepared and presented the Global High Dividend Core Composite’s accompanying compliant presentation for the periods from April 1, 2012 through December 31, 2013 in compliance with the GIPS standards.
This report does not relate to or provide assurance on any composite compliant presentation of the Firm other than the Firm’s Global High Dividend Core Composite.
ACA Performance Services, LLC April 23, 2014
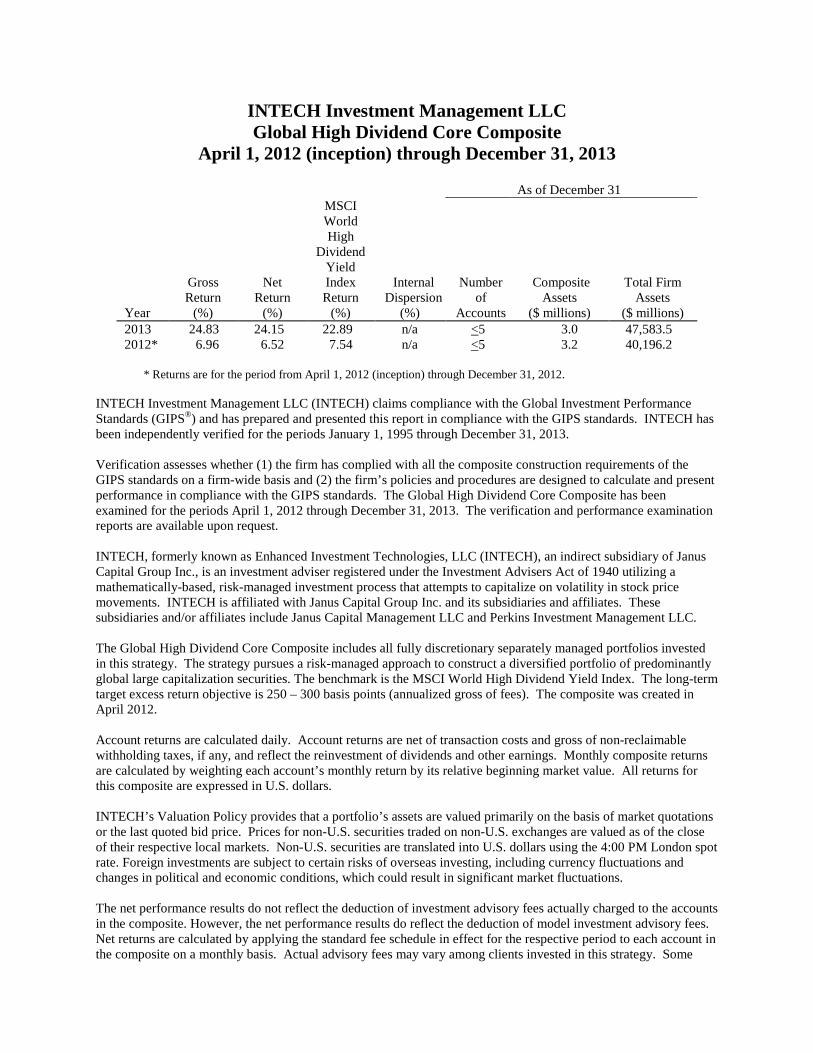
INTECH Investment Management LLC Global High Dividend Core Composite
April 1, 2012 (inception) through December 31, 2013
As of December 31
Year
Gross Return
(%)
Net Return
(%)
MSCI World High
DividendYield Index Return
(%)
Internal Dispersion
(%)
Number of
Accounts
Composite Assets
($ millions)
Total Firm Assets
($ millions) 2013 24.83 24.15 22.89 n/a <5 3.0 47,583.5 2012* 6.96 6.52 7.54 n/a <5 3.2 40,196.2
* Returns are for the period from April 1, 2012 (inception) through December 31, 2012. INTECH Investment Management LLC (INTECH) claims compliance with the Global Investment Performance Standards (GIPS®) and has prepared and presented this report in compliance with the GIPS standards. INTECH has been independently verified for the periods January 1, 1995 through December 31, 2013. Verification assesses whether (1) the firm has complied with all the composite construction requirements of the GIPS standards on a firm-wide basis and (2) the firm’s policies and procedures are designed to calculate and present performance in compliance with the GIPS standards. The Global High Dividend Core Composite has been examined for the periods April 1, 2012 through December 31, 2013. The verification and performance examination reports are available upon request. INTECH, formerly known as Enhanced Investment Technologies, LLC (INTECH), an indirect subsidiary of Janus Capital Group Inc., is an investment adviser registered under the Investment Advisers Act of 1940 utilizing a mathematically-based, risk-managed investment process that attempts to capitalize on volatility in stock price movements. INTECH is affiliated with Janus Capital Group Inc. and its subsidiaries and affiliates. These subsidiaries and/or affiliates include Janus Capital Management LLC and Perkins Investment Management LLC. The Global High Dividend Core Composite includes all fully discretionary separately managed portfolios invested in this strategy. The strategy pursues a risk-managed approach to construct a diversified portfolio of predominantly global large capitalization securities. The benchmark is the MSCI World High Dividend Yield Index. The long-term target excess return objective is 250 – 300 basis points (annualized gross of fees). The composite was created in April 2012. Account returns are calculated daily. Account returns are net of transaction costs and gross of non-reclaimable withholding taxes, if any, and reflect the reinvestment of dividends and other earnings. Monthly composite returns are calculated by weighting each account’s monthly return by its relative beginning market value. All returns for this composite are expressed in U.S. dollars. INTECH’s Valuation Policy provides that a portfolio’s assets are valued primarily on the basis of market quotations or the last quoted bid price. Prices for non-U.S. securities traded on non-U.S. exchanges are valued as of the close of their respective local markets. Non-U.S. securities are translated into U.S. dollars using the 4:00 PM London spot rate. Foreign investments are subject to certain risks of overseas investing, including currency fluctuations and changes in political and economic conditions, which could result in significant market fluctuations. The net performance results do not reflect the deduction of investment advisory fees actually charged to the accounts in the composite. However, the net performance results do reflect the deduction of model investment advisory fees. Net returns are calculated by applying the standard fee schedule in effect for the respective period to each account in the composite on a monthly basis. Actual advisory fees may vary among clients invested in this strategy. Some

clients may utilize a performance-based fee. Actual advisory fees paid may be higher or lower than model advisory fees. The current standard fee schedule is as follows: 0.55% on the first $100 million; 0.50% on the next $100 million; 0.45% on the next $100 million; 0.425% on the next $200 million; and 0.40% on amounts over $500 million. MSCI World High Dividend Yield Index is a free float-adjusted market capitalization-weighted index based on the MSCI World Index, its parent index, which includes large- and mid-cap stocks across 24 Developed Market Countries. The MSCI World High Dividend Yield Index is designed to reflect the performance of equities with higher-than-average dividend yields and pass dividend sustainability and persistence screens. The index returns are provided to represent the investment environment existing during the time periods shown and are not covered by the report of independent verifiers. For comparison purposes, the index is fully invested, which includes the reinvestment of dividends and capital gains. The returns for the index do not include any transaction costs, management fees or other costs. Composition of each separately managed account portfolio may differ from securities in the corresponding benchmark index. The index is used as a performance benchmark only, as INTECH does not attempt to replicate an index. Because INTECH’s sector weightings are a residual of portfolio construction, significant differences between sector weightings in client portfolios and the index are common. The internal dispersion of annual returns is measured by the asset weighted standard deviation of account gross returns represented within the composite for the full year. For those periods with five or fewer accounts included for the entire year, “n/a” is noted as the dispersion is not considered meaningful. At December 31, 2013, the three-year annualized ex-post standard deviation of the composite gross and the benchmark returns are not presented because 36 monthly composite returns are not available. A list of INTECH’s composite descriptions and policies for valuing portfolios, calculating performance, and preparing compliant presentations are available upon request. Performance figures are based upon historical information and do not guarantee future results.

INTECH Investment Management LLC Global Enhanced Index Composite For the periods from June 1, 2012 through December 31, 2013

Performance Examination Report
INTECH Investment Management LLC 525 Okeechobee Blvd. Suite 1800 West Palm Beach, FL 33401 We have verified whether INTECH Investment Management LLC (the Firm) (1) complied with all the composite construction requirements of the Global Investment Performance Standards (GIPS®) on a firm-wide basis for the periods from January 1, 2004 through December 31, 2013, and (2) designed its policies and procedures to calculate and present performance in compliance with the GIPS standards as of December 31, 2013. We have also examined the Firm’s Global Enhanced Index Composite for the periods from June 1, 2012 through December 31, 2013. The Firm’s management is responsible for compliance with the GIPS standards and the design of its policies and procedures and for the Global Enhanced Index Composite’s compliant presentation. Our responsibility is to express an opinion based on our verification and performance examination. We conducted this verification and performance examination in accordance with the required verification and performance examination procedures of the GIPS standards. We also conducted such other procedures as we considered necessary in the circumstances. In our opinion, the Firm has, in all material respects:
• Complied with all the composite construction requirements of the GIPS standards on a firm-wide basis for the periods from January 1, 2004 through December 31, 2013; and
• Designed its policies and procedures to calculate and present performance in compliance with the GIPS standards as of December 31, 2013.
Also, in our opinion, the Firm has, in all material respects:
• Constructed the Global Enhanced Index Composite and calculated the Global Enhanced Index Composite’s performance for the periods from June 1, 2012 through December 31, 2013 in compliance with the GIPS standards; and
• Prepared and presented the Global Enhanced Index Composite’s accompanying compliant presentation for the periods from June 1, 2012 through December 31, 2013 in compliance with the GIPS standards.
This report does not relate to or provide assurance on any composite compliant presentation of the Firm other than the Firm’s Global Enhanced Index Composite.
ACA Performance Services, LLC April 23, 2014

INTECH Investment Management LLC Global Enhanced Index Composite
June 1, 2012 (inception) through December 31, 2013
As of December 31
Year
Gross Return
(%)
Net Return
(%)
MSCI World Index Return
(%)
Internal Dispersion
(%)
Number of
Accounts
Composite Assets
($ millions)
Total Firm Assets
($ millions) 2013 28.80 28.36 27.36 n/a <5 162.7 47,583.5 2012* 15.74 15.51 15.28 n/a <5 12.0 40,196.2
* Returns are for the period from June 1, 2012 (inception) through December 31, 2012. INTECH Investment Management LLC (INTECH) claims compliance with the Global Investment Performance Standards (GIPS®) and has prepared and presented this report in compliance with the GIPS standards. INTECH has been independently verified for the periods January 1, 1995 through December 31, 2013. Verification assesses whether (1) the firm has complied with all the composite construction requirements of the GIPS standards on a firm-wide basis and (2) the firm’s policies and procedures are designed to calculate and present performance in compliance with the GIPS standards. The Global Enhanced Index has been examined for the periods June 1, 2012 through December 31, 2013. The verification and performance examination reports are available upon request. INTECH, formerly known as Enhanced Investment Technologies, LLC (INTECH), an indirect subsidiary of Janus Capital Group Inc., is an investment adviser registered under the Investment Advisers Act of 1940 utilizing a mathematically-based, risk-managed investment process that attempts to capitalize on volatility in stock price movements. INTECH is affiliated with Janus Capital Group Inc. and its subsidiaries and affiliates. These subsidiaries and/or affiliates include Janus Capital Management LLC and Perkins Investment Management LLC. The Global Enhanced Index Composite includes all fully discretionary separately managed portfolios invested in this strategy. The strategy pursues a risk-managed approach to construct a diversified portfolio of predominantly global large capitalization securities. The benchmark is the MSCI World Index. The long-term target excess return objective is 125 – 150 basis points (annualized gross of fees). The composite was created in June 2012. Account returns are calculated daily. Account returns are net of transaction costs and gross of non-reclaimable withholding taxes, if any, and reflect the reinvestment of dividends and other earnings. Monthly composite returns are calculated by weighting each account’s monthly return by its relative beginning market value. All returns for this composite are expressed in U.S. dollars. INTECH’s Valuation Policy provides that a portfolio’s assets are valued primarily on the basis of market quotations or the last quoted bid price. Prices for non-U.S. securities traded on non-U.S. exchanges are valued as of the close of their respective local markets. Non-U.S. securities are translated into U.S. dollars using the 4:00 PM London spot rate. Foreign investments are subject to certain risks of overseas investing, including currency fluctuations and changes in political and economic conditions, which could result in significant market fluctuations. The net performance results do not reflect the deduction of investment advisory fees actually charged to the accounts in the composite. However, the net performance results do reflect the deduction of model investment advisory fees. Net returns are calculated by applying the standard fee schedule in effect for the respective period to each account in the composite on a monthly basis. Actual advisory fees may vary among clients invested in this strategy. Some clients may utilize a performance-based fee. Actual advisory fees paid may be higher or lower than model advisory fees.

The current standard fee schedule is as follows: 0.35% on the first $100 million; 0.30% on the next $100 million; 0.25% on the next $100 million; 0.225% on the next $200 million; and 0.20% on amounts over $500 million. The MSCI World Index is a free float adjusted market capitalization weighted index that is designed to measure the equity market performance of 23 developed market country indices. The MSCI World Index returns are provided to represent the investment environment existing during the time periods shown and are not covered by the report of independent verifiers. For comparison purposes, the index is fully invested, which includes the reinvestment of dividends and capital gains. The returns for the index do not include any transaction costs, management fees or other costs. Composition of each separately managed account portfolio may differ from securities in the corresponding benchmark index. The index is used as a performance benchmark only, as INTECH does not attempt to replicate an index. Because INTECH’s sector weightings are a residual of portfolio construction, significant differences between sector weightings in client portfolios and the index are common. The internal dispersion of annual returns is measured by the asset weighted standard deviation of account gross returns represented within the composite for the full year. For those periods with five or fewer accounts included for the entire year, “n/a” is noted as the dispersion is not considered meaningful. At December 31, 2013, the three-year annualized ex-post standard deviation of the composite gross and the benchmark returns are not presented because 36 monthly composite returns are not available. A list of INTECH’s composite descriptions and policies for valuing portfolios, calculating performance, and preparing compliant presentations are available upon request. Performance figures are based upon historical information and do not guarantee future results.

INTECH Investment Management LLC Global All Country Enhanced Index Composite For the periods from November 1, 2011 through December 31, 2013

Performance Examination Report
INTECH Investment Management LLC 525 Okeechobee Blvd. Suite 1800 West Palm Beach, FL 33401 We have verified whether INTECH Investment Management LLC (the Firm) (1) complied with all the composite construction requirements of the Global Investment Performance Standards (GIPS®) on a firm-wide basis for the periods from January 1, 2004 through December 31, 2013, and (2) designed its policies and procedures to calculate and present performance in compliance with the GIPS standards as of December 31, 2013. We have also examined the Firm’s Global All Country Enhanced Index Composite for the periods from November 1, 2011 through December 31, 2013. The Firm’s management is responsible for compliance with the GIPS standards and the design of its policies and procedures and for the Global All Country Enhanced Index Composite’s compliant presentation. Our responsibility is to express an opinion based on our verification and performance examination. We conducted this verification and performance examination in accordance with the required verification and performance examination procedures of the GIPS standards. We also conducted such other procedures as we considered necessary in the circumstances. In our opinion, the Firm has, in all material respects:
• Complied with all the composite construction requirements of the GIPS standards on a firm-wide basis for the periods from January 1, 2004 through December 31, 2013; and
• Designed its policies and procedures to calculate and present performance in compliance with the GIPS standards as of December 31, 2013.
Also, in our opinion, the Firm has, in all material respects:
• Constructed the Global All Country Enhanced Index Composite and calculated the Global All Country Enhanced Index Composite’s performance for the periods from November 1, 2011 through December 31, 2013 in compliance with the GIPS standards; and
• Prepared and presented the Global All Country Enhanced Index Composite’s accompanying compliant presentation for the periods from November 1, 2011 through December 31, 2013 in compliance with the GIPS standards.
This report does not relate to or provide assurance on any composite compliant presentation of the Firm other than the Firm’s Global All Country Enhanced Index Composite.
ACA Performance Services, LLC April 23, 2014

INTECH Investment Management LLC Global All Country Enhanced Index Composite
November 1, 2011 (inception) through December 31, 2013
As of December 31
Year
Gross Return
(%)
Net Return
(%)
MSCI All
Country World Index Return
(%)
Internal Dispersion
(%)
Number of
Accounts
Composite Assets
($ millions)
Total Firm Assets
($ millions) 2013 24.54 24.10 23.44 n/a <5 13.0 47,583.5 2012 17.49 17.09 16.81 n/a <5 128.0 40,196.2 2011* -2.19 -2.24 -3.11 n/a <5 109.2 39,895.8
* Returns are for the period from November 1, 2011 (inception) through December 31, 2011. INTECH Investment Management LLC (INTECH) claims compliance with the Global Investment Performance Standards (GIPS®) and has prepared and presented this report in compliance with the GIPS standards. INTECH has been independently verified for the periods January 1, 1995 through December 31, 2013. Verification assesses whether (1) the firm has complied with all the composite construction requirements of the GIPS standards on a firm-wide basis and (2) the firm’s policies and procedures are designed to calculate and present performance in compliance with the GIPS standards. The Global All Country Enhanced Index Composite has been examined for the periods November 1, 2011 through December 31, 2013. The verification and performance examination reports are available upon request. INTECH, formerly known as Enhanced Investment Technologies, LLC (INTECH), an indirect subsidiary of Janus Capital Group Inc., is an investment adviser registered under the Investment Advisers Act of 1940 utilizing a mathematically-based, risk-managed investment process that attempts to capitalize on volatility in stock price movements. INTECH is affiliated with Janus Capital Group Inc. and its subsidiaries and affiliates. These subsidiaries and/or affiliates include Janus Capital Management LLC and Perkins Investment Management LLC. The Global All Country Enhanced Index Composite includes all fully discretionary separately managed portfolios invested in this strategy. The strategy pursues a risk-managed approach to construct a diversified portfolio of predominantly global large capitalization securities. The benchmark is the MSCI All Country World Index. The long-term target excess return objective over the benchmark is 125 – 150 basis points (annualized gross of fees). The composite was created in November 2011. Account returns are calculated daily. Account returns are net of transaction costs and gross of non-reclaimable withholding taxes, if any, and reflect the reinvestment of dividends and other earnings. Monthly composite returns are calculated by weighting each account’s monthly return by its relative beginning market value. All returns for this composite are expressed in U.S. dollars. INTECH’s Valuation Policy provides that a portfolio’s assets are valued primarily on the basis of market quotations or the last quoted bid price. Prices for non-U.S. securities traded on non-U.S. exchanges are valued as of the close of their respective local markets. Non-U.S. securities are translated into U.S. dollars using the 4:00 PM London spot rate. Foreign investments are subject to certain risks of overseas investing, including currency fluctuations and changes in political and economic conditions, which could result in significant market fluctuations. The net performance results do not reflect the deduction of investment advisory fees actually charged to the accounts in the composite. However, the net performance results do reflect the deduction of model investment advisory fees. Net returns are calculated by applying the standard fee schedule in effect for the respective period to each account in the composite on a monthly basis. Actual advisory fees may vary among clients invested in this strategy. Some

clients may utilize a performance-based fee. Actual advisory fees paid may be higher or lower than model advisory fees. The current standard fee schedule is as follows: 0.35% on the first $100 million; 0.30% on the next $100 million; 0.25% on the next $100 million; 0.225% on the next $200 million; and 0.20% on amounts over $500 million. The MSCI All Country World Index is a free float-adjusted market capitalization-weighted index that is designed to measure performance of global developed and emerging equity markets. The index returns are provided to represent the investment environment existing during the time periods shown and are not covered by the report of independent verifiers. For comparison purposes, the index is fully invested, which includes the reinvestment of dividends and capital gains. The returns for the index do not include any transaction costs, management fees or other costs. Composition of each separately managed account portfolio may differ from securities in the corresponding benchmark index. The index is used as a performance benchmark only, as INTECH does not attempt to replicate an index. Because INTECH’s sector weightings are a residual of portfolio construction, significant differences between sector weightings in client portfolios and the index are common. The internal dispersion of annual returns is measured by the asset weighted standard deviation of account gross returns represented within the composite for the full year. For those periods with five or fewer accounts included for the entire year, “n/a” is noted as the dispersion is not considered meaningful. At December 31, 2013, the three-year annualized ex-post standard deviation of the composite gross and the benchmark returns are not presented because 36 monthly composite returns are not available. A list of INTECH’s composite descriptions and policies for valuing portfolios, calculating performance, and preparing compliant presentations are available upon request. Performance figures are based upon historical information and do not guarantee future results.

INTECH Investment Management LLC Eurozone Low Volatility Composite For the periods from August 1, 2012 through December 31, 2013
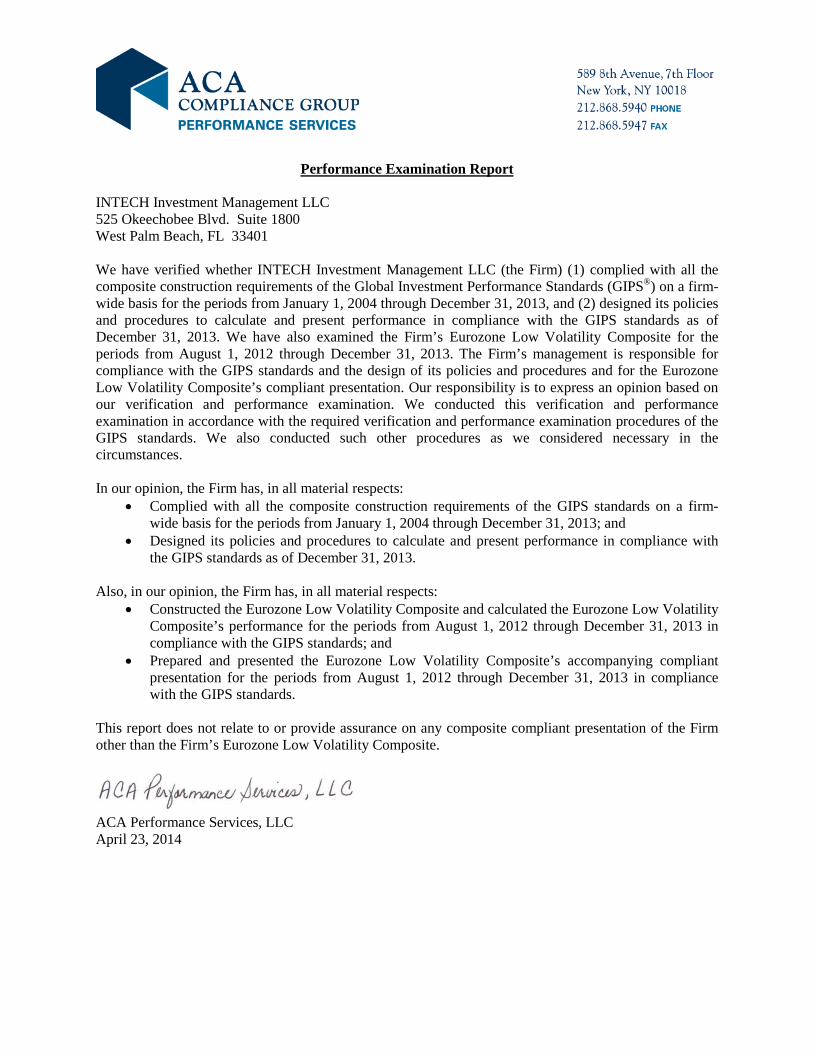
Performance Examination Report
INTECH Investment Management LLC 525 Okeechobee Blvd. Suite 1800 West Palm Beach, FL 33401 We have verified whether INTECH Investment Management LLC (the Firm) (1) complied with all the composite construction requirements of the Global Investment Performance Standards (GIPS®) on a firm-wide basis for the periods from January 1, 2004 through December 31, 2013, and (2) designed its policies and procedures to calculate and present performance in compliance with the GIPS standards as of December 31, 2013. We have also examined the Firm’s Eurozone Low Volatility Composite for the periods from August 1, 2012 through December 31, 2013. The Firm’s management is responsible for compliance with the GIPS standards and the design of its policies and procedures and for the Eurozone Low Volatility Composite’s compliant presentation. Our responsibility is to express an opinion based on our verification and performance examination. We conducted this verification and performance examination in accordance with the required verification and performance examination procedures of the GIPS standards. We also conducted such other procedures as we considered necessary in the circumstances. In our opinion, the Firm has, in all material respects:
• Complied with all the composite construction requirements of the GIPS standards on a firm-wide basis for the periods from January 1, 2004 through December 31, 2013; and
• Designed its policies and procedures to calculate and present performance in compliance with the GIPS standards as of December 31, 2013.
Also, in our opinion, the Firm has, in all material respects:
• Constructed the Eurozone Low Volatility Composite and calculated the Eurozone Low Volatility Composite’s performance for the periods from August 1, 2012 through December 31, 2013 in compliance with the GIPS standards; and
• Prepared and presented the Eurozone Low Volatility Composite’s accompanying compliant presentation for the periods from August 1, 2012 through December 31, 2013 in compliance with the GIPS standards.
This report does not relate to or provide assurance on any composite compliant presentation of the Firm other than the Firm’s Eurozone Low Volatility Composite.
ACA Performance Services, LLC April 23, 2014

INTECH Investment Management LLC Eurozone Low Volatility Composite
August 1, 2012 (inception) through December 31, 2013
As of December 31
Year
Gross Return
(%)
Net Return
(%)
MSCI EMU Index Return
(%)
Internal Dispersion
(%)
Number of
Accounts
Composite Assets
(€ millions)
Total Firm Assets
(€ millions) 2013 20.44 20.02 24.42 n/a <5 6.1 34,532.3 2012* 2.48 2.33 12.88 n/a <5 5.1 30,488.8
* Returns are for the period from August 1, 2012 (inception) through December 31, 2012. INTECH Investment Management LLC (INTECH) claims compliance with the Global Investment Performance Standards (GIPS®) and has prepared and presented this report in compliance with the GIPS standards. INTECH has been independently verified for the periods January 1, 1995 through December 31, 2013. Verification assesses whether (1) the firm has complied with all the composite construction requirements of the GIPS standards on a firm-wide basis and (2) the firm’s policies and procedures are designed to calculate and present performance in compliance with the GIPS standards. The Eurozone Low Volatility Composite has been examined for the periods August 1, 2012 through December 31, 2013. The verification and performance examination reports are available upon request. INTECH, formerly known as Enhanced Investment Technologies, LLC (INTECH), an indirect subsidiary of Janus Capital Group Inc., is an investment adviser registered under the Investment Advisers Act of 1940 utilizing a mathematically-based, risk-managed investment process that attempts to capitalize on volatility in stock price movements. INTECH is affiliated with Janus Capital Group Inc. and its subsidiaries and affiliates. These subsidiaries and/or affiliates include Janus Capital Management LLC and Perkins Investment Management LLC. The Eurozone Low Volatility Composite includes all fully discretionary separately managed portfolios invested in this strategy. The strategy pursues a risk-managed approach to construct a diversified portfolio of predominantly global large capitalization securities. The benchmark is the MSCI EMU Index. The strategy targets modest above-market returns, with significantly lower levels of volatility and a higher Sharpe Ratio than the index, over the long-term. The composite was created in August 2012. Account returns are calculated daily. Account returns are net of transaction costs and gross of non-reclaimable withholding taxes, if any, and reflect the reinvestment of dividends and other earnings. Monthly composite returns are calculated by weighting each account’s monthly return by its relative beginning market value. All returns for this composite are expressed in Euro currency. INTECH’s Valuation Policy provides that a portfolio’s assets are valued primarily on the basis of market quotations or the last quoted bid price. Prices for non-U.S. securities traded on non-U.S. exchanges are valued as of the close of their respective local markets. Foreign investments are subject to certain risks of overseas investing, including currency fluctuations and changes in political and economic conditions, which could result in significant market fluctuations. The net performance results do not reflect the deduction of investment advisory fees actually charged to the accounts in the composite. However, the net performance results do reflect the deduction of model investment advisory fees. Net returns are calculated by applying the standard fee schedule in effect for the respective period to each account in the composite on a monthly basis. Actual advisory fees may vary among clients invested in this strategy. Some clients may utilize a performance-based fee. Actual advisory fees paid may be higher or lower than model advisory fees.

The current standard fee schedule is as follows: 0.35% on the first $100 million; 0.30% on the next $100 million; 0.25% on the next $100 million; 0.225% on the next $200 million; and 0.20% on amounts over $500 million. The MSCI EMU (European Economic and Monetary Union) Index is a free float-adjusted market capitalization weighted index that is designed to measure the equity market performance of countries within EMU. The MSCI EMU Index returns are provided to represent the investment environment existing during the time periods shown and are not covered by the report of independent verifiers. For comparison purposes, the index is fully invested, which includes the reinvestment of dividends and capital gains. The returns for the index do not include any transaction costs, management fees or other costs. Composition of each separately managed account portfolio may differ from securities in the corresponding benchmark index. The index is used as a performance benchmark only, as INTECH does not attempt to replicate an index. Because INTECH’s sector weightings are a residual of portfolio construction, significant differences between sector weightings in client portfolios and the index are common. The internal dispersion of annual returns is measured by the asset weighted standard deviation of account gross returns represented within the composite for the full year. For those periods with five or fewer accounts included for the entire year, “n/a” is noted as the dispersion is not considered meaningful. At December 31, 2013, the three-year annualized ex-post standard deviation of the composite gross and the benchmark returns are not presented because 36 monthly composite returns are not available. A list of INTECH’s composite descriptions and policies for valuing portfolios, calculating performance, and preparing compliant presentations are available upon request. Performance figures are based upon historical information and do not guarantee future results.
INTECH Investment Management LLC European Large Cap Core Composite For the periods from January 1, 2010 through December 31, 2013

Performance Examination Report
INTECH Investment Management LLC 525 Okeechobee Blvd. Suite 1800 West Palm Beach, FL 33401 We have verified whether INTECH Investment Management LLC (the Firm) (1) complied with all the composite construction requirements of the Global Investment Performance Standards (GIPS®) on a firm-wide basis for the periods from January 1, 2004 through December 31, 2013, and (2) designed its policies and procedures to calculate and present performance in compliance with the GIPS standards as of December 31, 2013. We have also examined the Firm’s European Large Cap Core Composite for the periods from January 1, 2010 through December 31, 2013. The Firm’s management is responsible for compliance with the GIPS standards and the design of its policies and procedures and for the European Large Cap Core Composite’s compliant presentation. Our responsibility is to express an opinion based on our verification and performance examination. We conducted this verification and performance examination in accordance with the required verification and performance examination procedures of the GIPS standards. We also conducted such other procedures as we considered necessary in the circumstances. In our opinion, the Firm has, in all material respects:
• Complied with all the composite construction requirements of the GIPS standards on a firm-wide basis for the periods from January 1, 2004 through December 31, 2013; and
• Designed its policies and procedures to calculate and present performance in compliance with the GIPS standards as of December 31, 2013.
Also, in our opinion, the Firm has, in all material respects:
• Constructed the European Large Cap Core Composite and calculated the European Large Cap Core Composite’s performance for the periods from January 1, 2010 through December 31, 2013 in compliance with the GIPS standards; and
• Prepared and presented the European Large Cap Core Composite’s accompanying compliant presentation for the periods from January 1, 2010 through December 31, 2013 in compliance with the GIPS standards.
This report does not relate to or provide assurance on any composite compliant presentation of the Firm other than the Firm’s European Large Cap Core Composite.
ACA Performance Services, LLC April 23, 2014
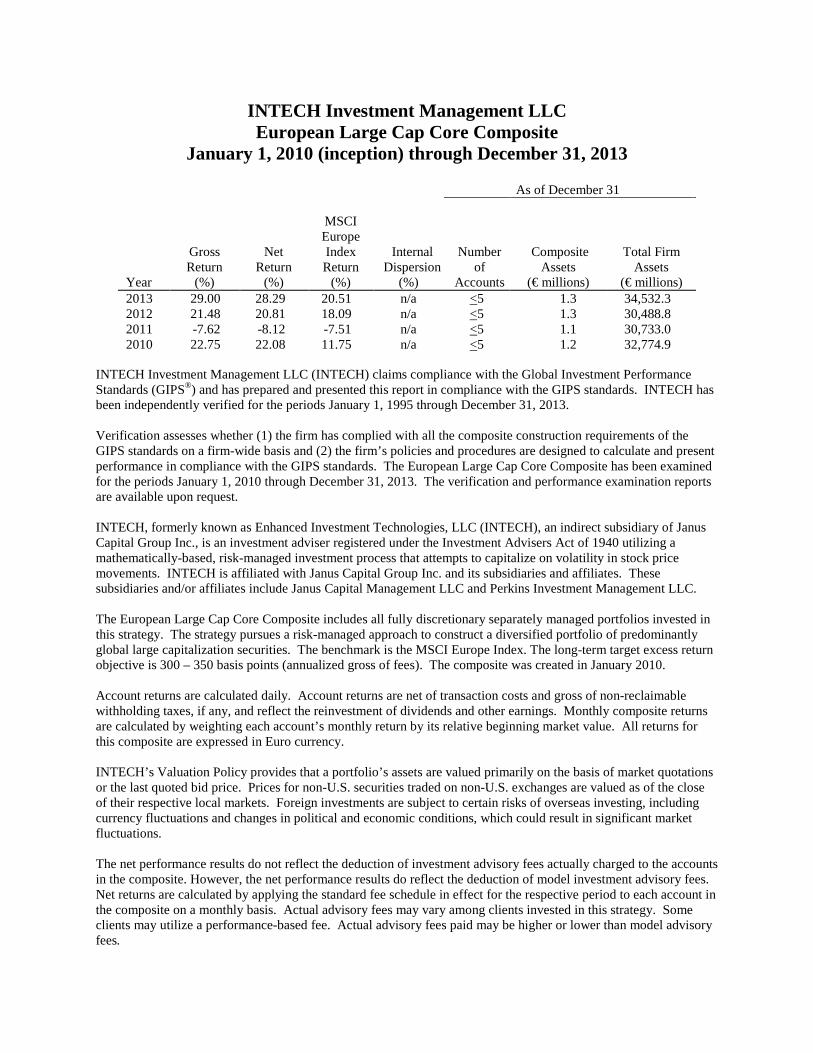
INTECH Investment Management LLC European Large Cap Core Composite
January 1, 2010 (inception) through December 31, 2013
As of December 31
Year
Gross Return
(%)
Net Return
(%)
MSCI Europe Index Return
(%)
Internal Dispersion
(%)
Number of
Accounts
Composite Assets
(€ millions)
Total Firm Assets
(€ millions) 2013 29.00 28.29 20.51 n/a <5 1.3 34,532.3 2012 21.48 20.81 18.09 n/a <5 1.3 30,488.8 2011 -7.62 -8.12 -7.51 n/a <5 1.1 30,733.0 2010 22.75 22.08 11.75 n/a <5 1.2 32,774.9
INTECH Investment Management LLC (INTECH) claims compliance with the Global Investment Performance Standards (GIPS®) and has prepared and presented this report in compliance with the GIPS standards. INTECH has been independently verified for the periods January 1, 1995 through December 31, 2013. Verification assesses whether (1) the firm has complied with all the composite construction requirements of the GIPS standards on a firm-wide basis and (2) the firm’s policies and procedures are designed to calculate and present performance in compliance with the GIPS standards. The European Large Cap Core Composite has been examined for the periods January 1, 2010 through December 31, 2013. The verification and performance examination reports are available upon request. INTECH, formerly known as Enhanced Investment Technologies, LLC (INTECH), an indirect subsidiary of Janus Capital Group Inc., is an investment adviser registered under the Investment Advisers Act of 1940 utilizing a mathematically-based, risk-managed investment process that attempts to capitalize on volatility in stock price movements. INTECH is affiliated with Janus Capital Group Inc. and its subsidiaries and affiliates. These subsidiaries and/or affiliates include Janus Capital Management LLC and Perkins Investment Management LLC. The European Large Cap Core Composite includes all fully discretionary separately managed portfolios invested in this strategy. The strategy pursues a risk-managed approach to construct a diversified portfolio of predominantly global large capitalization securities. The benchmark is the MSCI Europe Index. The long-term target excess return objective is 300 – 350 basis points (annualized gross of fees). The composite was created in January 2010. Account returns are calculated daily. Account returns are net of transaction costs and gross of non-reclaimable withholding taxes, if any, and reflect the reinvestment of dividends and other earnings. Monthly composite returns are calculated by weighting each account’s monthly return by its relative beginning market value. All returns for this composite are expressed in Euro currency. INTECH’s Valuation Policy provides that a portfolio’s assets are valued primarily on the basis of market quotations or the last quoted bid price. Prices for non-U.S. securities traded on non-U.S. exchanges are valued as of the close of their respective local markets. Foreign investments are subject to certain risks of overseas investing, including currency fluctuations and changes in political and economic conditions, which could result in significant market fluctuations. The net performance results do not reflect the deduction of investment advisory fees actually charged to the accounts in the composite. However, the net performance results do reflect the deduction of model investment advisory fees. Net returns are calculated by applying the standard fee schedule in effect for the respective period to each account in the composite on a monthly basis. Actual advisory fees may vary among clients invested in this strategy. Some clients may utilize a performance-based fee. Actual advisory fees paid may be higher or lower than model advisory fees.
Effective January 1, 2010, the current standard fee schedule is as follows: 0.55% on the first $100 million; 0.50% on the next $100 million; 0.45% on the next $100 million; 0.425% on the next $200 million; and 0.40% on amounts over $500 million. The MSCI Europe Index is a free float-adjusted market capitalization weighted index that is designed to measure the equity market performance of developed markets in Europe. The MSCI Europe Index returns are provided to represent the investment environment existing during the time periods shown and are not covered by the report of independent verifiers. For comparison purposes, the index is fully invested, which includes the reinvestment of dividends and capital gains. The returns for the index do not include any transaction costs, management fees or other costs. Composition of each separately managed account portfolio may differ from securities in the corresponding benchmark index. The index is used as a performance benchmark only, as INTECH does not attempt to replicate an index. Because INTECH’s sector weightings are a residual of portfolio construction, significant differences between sector weightings in client portfolios and the index are common. The internal dispersion of annual returns is measured by the asset weighted standard deviation of account gross returns represented within the composite for the full year. For those periods with five or fewer accounts included for the entire year, “n/a” is noted as the dispersion is not considered meaningful. The three-year annualized ex-post standard deviation of the composite gross and benchmark returns as of each year end is as follows:
Year
Composite 3-yr St Dev
(%)
Benchmark 3-Yr St. Dev
(%) 2013 12.70 12.37 2012 13.09 13.19 2011 < 3 years < 3 years
At December 31, 2011, the three-year annualized ex-post standard deviation of the composite and the benchmark are not presented because 36 monthly composite returns are not available. A list of INTECH’s composite descriptions and policies for valuing portfolios, calculating performance, and preparing compliant presentations are available upon request. Performance figures are based upon historical information and do not guarantee future results.

INTECH Investment Management LLC Enhanced Plus USA Composite For the periods from January 1, 2006 through December 31, 2013

Performance Examination Report
INTECH Investment Management LLC 525 Okeechobee Blvd. Suite 1800 West Palm Beach, FL 33401 We have verified whether INTECH Investment Management LLC (the Firm) (1) complied with all the composite construction requirements of the Global Investment Performance Standards (GIPS®) on a firm-wide basis for the periods from January 1, 2004 through December 31, 2013, and (2) designed its policies and procedures to calculate and present performance in compliance with the GIPS standards as of December 31, 2013. We have also examined the Firm’s Enhanced Plus USA Composite for the periods from January 1, 2006 through December 31, 2013. The Firm’s management is responsible for compliance with the GIPS standards and the design of its policies and procedures and for the Enhanced Plus USA Composite’s compliant presentation. Our responsibility is to express an opinion based on our verification and performance examination. We conducted this verification and performance examination in accordance with the required verification and performance examination procedures of the GIPS standards. We also conducted such other procedures as we considered necessary in the circumstances. In our opinion, the Firm has, in all material respects:
• Complied with all the composite construction requirements of the GIPS standards on a firm-wide basis for the periods from January 1, 2004 through December 31, 2013; and
• Designed its policies and procedures to calculate and present performance in compliance with the GIPS standards as of December 31, 2013.
Also, in our opinion, the Firm has, in all material respects:
• Constructed the Enhanced Plus USA Composite and calculated the Enhanced Plus USA Composite’s performance for the periods from January 1, 2006 through December 31, 2013 in compliance with the GIPS standards; and
• Prepared and presented the Enhanced Plus USA Composite’s accompanying compliant presentation for the periods from January 1, 2006 through December 31, 2013 in compliance with the GIPS standards.
This report does not relate to or provide assurance on any composite compliant presentation of the Firm other than the Firm’s Enhanced Plus USA Composite.
ACA Performance Services, LLC April 23, 2014

INTECH Investment Management LLC
Enhanced Plus USA Composite January 1, 2006 (inception) through December 31, 2013
As of December 31
Year
Gross Return
(%)
Net Return
(%)
MSCI USA Index Return
(%)
Internal Dispersion
(%)
Number of
Accounts
Composite Assets
($ millions)
Total Firm Assets
($ millions) 2013 32.85 32.44 32.61 n/a <5 356.7 47,583.5 2012 16.83 16.45 16.13 n/a <5 315.4 40,196.2 2011 4.73 4.39 1.99 n/a <5 268.6 39,895.8 2010 16.56 16.16 15.45 n/a <5 450.9 43,968.9 2009 23.91 23.49 27.14 n/a <5 498.1 47,962.0 2008 -36.84 -37.03 -37.14 n/a <5 752.4 42,383.9 2007 6.37 6.06 6.02 n/a <5 1,337.4 69,686.7 2006 14.90 14.52 15.31 n/a <5 1,177.6 62,336.4
INTECH Investment Management LLC (INTECH) claims compliance with the Global Investment Performance Standards (GIPS®) and has prepared and presented this report in compliance with the GIPS standards. INTECH has been independently verified for the periods January 1, 1995 through December 31, 2013. Verification assesses whether (1) the firm has complied with all the composite construction requirements of the GIPS standards on a firm-wide basis and (2) the firm’s policies and procedures are designed to calculate and present performance in compliance with the GIPS standards. The Enhanced Plus USA Composite has been examined for the periods January 1, 2006 through December 31, 2013. The verification and performance examination reports are available upon request. INTECH, formerly known as Enhanced Investment Technologies, LLC (INTECH), an indirect subsidiary of Janus Capital Group Inc., is an investment adviser registered under the Investment Advisers Act of 1940 utilizing a mathematically-based, risk-managed investment process that attempts to capitalize on volatility in stock price movements. INTECH is affiliated with Janus Capital Group Inc. and its subsidiaries and affiliates. These subsidiaries and/or affiliates include Janus Capital Management LLC and Perkins Investment Management LLC. The Enhanced Plus USA Composite includes all fully discretionary separately managed portfolios invested in the strategy. The strategy pursues a risk-managed approach to construct a diversified portfolio of predominantly domestic large capitalization securities. The benchmark is the MSCI USA Index. The long-term target excess return objective is 175 – 200 basis points (annualized gross of fees). The composite was created in January 2006. Account returns are calculated daily. Account returns are net of transaction costs and gross of non-reclaimable withholding taxes, if any, and reflect the reinvestment of dividends and other earnings. Monthly composite returns are calculated by weighting each account’s monthly return by its relative beginning market value. All returns for this composite are expressed in U.S. dollars. The net performance results do not reflect the deduction of investment advisory fees actually charged to the accounts in the composite. However, the net performance results do reflect the deduction of model investment advisory fees. Net returns are calculated by applying the standard fee schedule in effect for the respective period to each account in the composite on a monthly basis. Actual advisory fees may vary among clients invested in this strategy. Some clients may utilize a performance-based fee. Actual advisory fees paid may be higher or lower than model advisory fees.
Effective July 1, 2007, the current standard fee schedule is as follows: 0.39% on the first $100 million; 0.30% on the next $100 million; 0.28% on the next $100 million; 0.25% on the next $200 million; and 0.20% on amounts over $500 million. The MSCI USA Index is representative of 85% of the free float adjusted market capitalization, in each industry group, across the US equity market. The MSCI USA Index returns are provided to represent the investment environment existing during the time periods shown and are not covered by the report of independent verifiers. For comparison purposes, the index is fully invested, which includes the reinvestment of dividends and capital gains. The returns for the index do not include any transaction costs, management fees or other costs. Composition of each separately managed account portfolio may differ from securities in the corresponding benchmark index. The index is used as a performance benchmark only, as INTECH does not attempt to replicate an index. Because INTECH’s sector weightings are a residual of portfolio construction, significant differences between sector weightings in client portfolios and the index are common. The internal dispersion of annual returns is measured by the asset weighted standard deviation of account gross returns represented within the composite for the full year. For those periods with five or fewer accounts included for the entire year, “n/a” is noted as the dispersion is not considered meaningful. The three-year annualized ex-post standard deviation of the composite gross and benchmark returns as of each year end is as follows:
Year
Composite 3-yr St Dev
(%)
Benchmark 3-Yr St. Dev
(%) 2013 12.19 12.21 2012 15.16 15.42 2011 17.84 18.88 2010 21.50 22.19
A list of INTECH’s composite descriptions and policies for valuing portfolios, calculating performance, and preparing compliant presentations are available upon request.
Performance figures are based upon historical information and do not guarantee future results.