InTech-Fuzzy Modeling of Geospatial Patte
23
14 Fuzzy Modeling of Geospatial Patterns Alejandra A. López-Caloca and Carmen Reyes Centro de Investigación en Geografía y Geomática “Jorge L. Tamayo” A.C., CentroGeo, México 1. Introduction In computer science, the design of intelligent systems able to manage uncertain, indefinite or incomplete information is called Soft Computing (Zadeh 1994). Its aim is to illustrate real problems that are not manageable by conventional techniques. The main techniques that compose Soft Computing are fuzzy logic, neural networks, evolutionary computing and probabilistics. The works published by Prof. Zadeh on fuzzy sets, fuzzy logic, fuzzy systems, neural networks, soft computing and computing with words have had applications in a gr eat diver sity of areas—computati onal modeling, optimizing, pl anning, control, geospatial analysis, image classif ication, predict ion and image fusion. Geospatial modeling and retrieving geographical information has become an important part of different areas of knowledge, such as environmental scienc e, urban planning and criminal spatial patterns, among others. This work examines some of the fuzzy tools most commonly used in geospatial modeling for spatial analysis and image processing. We will present a family of models as an alternative to the fuzzy mathematical representation of spatial patterns. This chapter is primarily concerned with spatial pattern methodologies that attempt to describe the arrangement of phenomena in space. In most cases, these phenomena have either point or area features. Point and area analyses use randomness (or a lack of pattern) as a dividing point between two opposite pattern types—dispersed and clustered. This work also presents a general framework (fuzzy data fusion) to combine information from several individual classifications obtained from satellite images in order to recognize spatial patterns and improve spatial pattern extraction. 2. General framework The principal ideas and concepts of fuzzy logic (FL), as shown by Zadeh, are that FL is a precise logic of uncertainty and approximate reasoning (Zadeh 1975, 1976). Zadeh (2010) notes two ideas that FL takes from human capabilities. The first refers to an environment of imperfect information that includes uncertainty, incompleteness of information, conflicting information, partiality of truth and partiality of possibility. The second relates to the capability to perform a wide variety of physical and mental tasks without any measurements or computations. www.intechopen.com
-
Upload
nuwan-seneviratne -
Category
Documents
-
view
224 -
download
0
Transcript of InTech-Fuzzy Modeling of Geospatial Patte
7/28/2019 InTech-Fuzzy Modeling of Geospatial Patte
http://slidepdf.com/reader/full/intech-fuzzy-modeling-of-geospatial-patte 1/23
14
Fuzzy Modeling of Geospatial Patterns
Alejandra A. López-Caloca and Carmen ReyesCentro de Investigación en Geografía y Geomática
“Jorge L. Tamayo” A.C., CentroGeo, México
1. Introduction
In computer science, the design of intelligent systems able to manage uncertain, indefinite orincomplete information is called Soft Computing (Zadeh 1994). Its aim is to illustrate real
problems that are not manageable by conventional techniques. The main techniques that
compose Soft Computing are fuzzy logic, neural networks, evolutionary computing and
probabilistics. The works published by Prof. Zadeh on fuzzy sets, fuzzy logic, fuzzy
systems, neural networks, soft computing and computing with words have had applications
in a great diversity of areas—computational modeling, optimizing, planning, control,
geospatial analysis, image classification, prediction and image fusion.
Geospatial modeling and retrieving geographical information has become an important part
of different areas of knowledge, such as environmental science, urban planning and criminal
spatial patterns, among others. This work examines some of the fuzzy tools most commonly
used in geospatial modeling for spatial analysis and image processing. We will present a
family of models as an alternative to the fuzzy mathematical representation of spatial
patterns. This chapter is primarily concerned with spatial pattern methodologies that
attempt to describe the arrangement of phenomena in space. In most cases, these
phenomena have either point or area features. Point and area analyses use randomness (or a
lack of pattern) as a dividing point between two opposite pattern types—dispersed and
clustered. This work also presents a general framework (fuzzy data fusion) to combine
information from several individual classifications obtained from satellite images in order to
recognize spatial patterns and improve spatial pattern extraction.
2. General framework
The principal ideas and concepts of fuzzy logic (FL), as shown by Zadeh, are that FL is a
precise logic of uncertainty and approximate reasoning (Zadeh 1975, 1976). Zadeh (2010)
notes two ideas that FL takes from human capabilities. The first refers to an environment of
imperfect information that includes uncertainty, incompleteness of information, conflicting
information, partiality of truth and partiality of possibility. The second relates to the
capability to perform a wide variety of physical and mental tasks without any
measurements or computations.
www.intechopen.com
7/28/2019 InTech-Fuzzy Modeling of Geospatial Patte
http://slidepdf.com/reader/full/intech-fuzzy-modeling-of-geospatial-patte 2/23
Fuzzy Logic – Emerging Technologies and Applications288
For example, when considering fuzzy concepts, we talk about the lack of sharp classboundaries. Thus, the starting point for FL is the fuzzy set concept, where a fuzzy set is aclass with unsharp boundaries. FL deals with three basic concepts: graduation, granulation,and precisiation (Zadeh, 2010). The graduation concept is associated with scale- and
membership-degree functions. The granulation concept is useful with regard to imprecision,uncertainty and complexity. For precisiation, two approximations are defined—precisiationand imprecisiation, where the former is based on measurements and the latter onperceptions. In fact, the precisiation of meaning has always played an important role inscience. Therefore, graduation is related to precisiation and granulation to imprecisiation.
2.1 Geospatial modeling
The modeling of natural phenomena requires knowledge of the geographic landscapeentities that can be conceptualized in space (places, axiomatic geometry, point-set topology,discrete space, raster/vector), spatial attributes and relations (dimension, connectivity,
position, size, location, shape), thematic (natural and conventional objects, classifyingobjects, pattern recognition) and temporal forms (states, processes and dynamic events). Thedifferent fields—geography, biology, hydrology, geology, remote sensing, ecology, andothers—select the most important aspects of a phenomenon, i.e., representative variables, togenerate data (Jacquez et al., 2000) and perform modeling.
Natural objects that are characterized and define variables may be highly regular, in which alarge number of cases are shown as an individual, easy-to-identify elements. Others,however, tend to be highly irregular, fragmented, fuzzier, and have boundaries that aredifficult to describe (Galton, 2000). A natural pattern is generated by various processes atdifferent space and time scales depending on the phenomena being investigated; hence theinterest in fuzzy modeling for research to illustrate geographic problems (Altman, 1994;Usery 1996; Molenaar & Cheng, 2000, Croos & Firat, 2004, Guesgen, 2005).
Problems involving indeterminate boundaries—continuity, heterogeneity, dynamics, scale-dependence (Cheng, 2002; Burroughs, 1996) and contiguity—found in the very nature ofobjects are described below.
Continuity refers to continuous space, which is seamless, i.e., two regions are not separatedbut rather are distributed in a continuous way in space. In some cases, their distributiondoes not permit identifying a very precise border because neither the objects nor isolatedprocesses exist. The problem is to represent these objects in a discrete space (Kavoras, 1996).The nature of the object influences how we become aware of the boundaries and their
degree of sharpness (Erwig & Schneider, 1997).Contiguity measurements evaluate the characteristics of spatial features that are connected,i.e., the evaluation of features that touch one another, that are near one another. Contiguityis desirable to reduce the negative environmental impact on forests, where forest patchesaffect interior forest habitats.
Spatial heterogeneity is the existence of each object or entity in relation to others, as well asthe attributes and qualities of each one of them, and is determined at the moment of mutualinteraction. This explains two or various types of vegetation existing in a forest zone and,therefore, describes a heterogeneity problem. The similarity or difference between an entityand its surrounding is a measure of this variation (Reyes-Guerrero, 1986).
www.intechopen.com
7/28/2019 InTech-Fuzzy Modeling of Geospatial Patte
http://slidepdf.com/reader/full/intech-fuzzy-modeling-of-geospatial-patte 3/23
Fuzzy Modeling of Geospatial Patterns 289
Because dynamic geospatial processes and transformations occurring over long periods of
time are not uniform, it is necessary to consider changes in their spatial attributes with their
temporal dimensional. For example, geometric spatial changes are investigated with what is
known as fuzzy change detection (Molenaar & Cheng , 2000). Different classes of spatial
changes in frontier areas must be considered with respect to diverse observations atdifferent times (changes in dimension, connectivity, size, shape and non-geometrical spatial
attributes). These are often difficult to determine because of a lack of dimensions at the time
they occur.
Objects are defined according to a geospatial scale and context. The observation is related to
the scale at which the object is described (Couclelis, 1996). When having satellite images
with different levels of spatial resolution, the identification of more classes will increase by
having more detail on these images. The degree of uncertainty of many geographic objects,
with respect to the scale of observation, is proposed on the basis of a neural network
structure approach (Silván-Cardenas, 2008) and particular data representation models of
objects with scale-induced indeterminate boundaries. Using this approach, fuzzy points and
fuzzy lines are considered and the connection between the degree of fuzziness and the scale
of representation is discussed.
Spatial data are important to diverse studies; in fact, new technology continually enables
generating new data. A number of available methods are applied to spatial data, some of
which include spatial classification. Nevertheless, difficulties exist that can be
conceptualized and modeled with fuzzy concepts, for example, by eliminating strict ideas of
encountering boundaries on the geographic objects studied.
In geo-modeling, the utilization of fuzzy concepts with uncertainty problems (Cheng, 2002,
Cheng et al 2004) can be divided in four ways:
a. Spatial Incompleteness. Indetermination is related to objects that cannot be separated,or where there is a lack of information (incompleteness) and imprecision. This can bedue to the particular information not covering a specific region or the definition ofcategories that only makes sense in certain parts of the space (e.g meteorologicalmeasurements); in remote sensing, for example, the presence of clouds and shadows onsatellite images that do not obstruct observation of the zone.
b. Fuzziness. To construct better real-world models, it is necessary to understand the
concept of fuzziness as unsharpness of class boundaries, as well as the role of precisionin fuzzy borders. In regionalization studies, regions are defined so that every element in
the study universe is distinguishable regardless of whether or not it belongs to the
region. Geographical problems can undoubtedly benefit from the fuzzy definition. For
example, in the study of urban areas, a characteristic of the city is its lack of clear-cut
differences in residential areas as well as in land use, for which incorporating thedefinition of fuzzy regions is therefore more appropriate (Reyes-Guerrero, 1986).
c. Time Incoherence. Temporal uncertainty with respect to time is common when thephenomena observed occurs when precise knowledge is not available about the instant
of such information, and it only can be approximated with certain measurements. The
value of the information depends on time, since many observed phenomena have
temporal space relations, such as vegetation-season.
www.intechopen.com
7/28/2019 InTech-Fuzzy Modeling of Geospatial Patte
http://slidepdf.com/reader/full/intech-fuzzy-modeling-of-geospatial-patte 4/23
Fuzzy Logic – Emerging Technologies and Applications290
d. Other general problems to be considered regarding spatial data are the lack of data or ofdefinition of the object studied, inexact data, inconsistent data from multiple sources,data processing errors, inadequate generalization operations, limitations in the spatialrepresentation scheme and limitations in data acquisition technology (Burroughs, 1996).
3. Fuzzy spatial clustering
In general, cluster analysis involves a set of data in groups or clusters that is organized so
that items in the same group are similar to each other and different from those in other
groups. In spatial information in clustering, different types of clustering analyses have been
studied, including spatial clustering (clustering of spatial points), regionalization (clustering
with geographic contiguity constraints) and point pattern analysis (hot-spot detection with
spatial scan statistics). The use of many of these techniques for hot-spot detection is
relatively problematic for several reasons, including the relatively arbitrary definition of the
number of clusters to be included and the procedures applied to draw hot-spot boundaries.
These contour areas indicate high to low robbery occurrence and, therefore, respond to the
demand for public safety or provide alternatives to precisely locate schools in geographic
distribution plans.
Fuzzy clustering methods allow objects to belong to several clusters simultaneously withdifferent degrees of membership; in this work, we used Fuzzy C-Means clustering (FCM),(Bezdek, 1973). FCM is a data clustering technique that considers each data point belongingto a cluster to a certain degree, as specified by a membership degree. Two geospatial modelswith different applications are presented—hot-spot crime detection and educationalplanning.
3.1 Spatial analysis of crime
By definition, a hot-spot is a geographic area that presents a greater concentration of eventsas compared to its surroundings. It is an important tool for the analysis of point data todescribe criminal activities, their geospatial distribution, and especially trends—in order todetermine zones more likely to have higher concentrations of criminal events. Thealgorithms utilized to define a hot-spot may vary significantly when determining optimaland representative clusters—i.e., an adequate grouping must be determined. Generally,analysts must examine a series of possible solutions to spatially determine the optimalconfiguration; for example, cases using known methods such as hard clustering.
The strict assignment of parameters in the hard-clustering algorithm prevents identifyingthe optimal number of groups and, therefore, the result is not always realistic. Grubesic
(2006) focuses on fuzzy grouping in the case of delinquency.
In order to disclose spatial crime patterns, Lopez-Caloca et al. (2009) tested criminal spatialpatterns in the Mexican city of Hermosillo, as well as moving robberies (vehicle theft andpublic transportation robbery), fixed robberies (household or commercial establishmentrobberies) and violent robberies. Geo-referenced data from police records are available foreach of the events reported during 2005 and 2006. The advantage of fuzzy clusters is a closerestimation of the delimitation of boundaries based on the information, with which toanalyze processes in the region.
www.intechopen.com
7/28/2019 InTech-Fuzzy Modeling of Geospatial Patte
http://slidepdf.com/reader/full/intech-fuzzy-modeling-of-geospatial-patte 5/23
Fuzzy Modeling of Geospatial Patterns 291
The FCM algorithm utilized for this task is based on the minimization of the objective
function (eq. 1), which represents the distance from any given data point to a cluster center,
weighted by the membership grade of that data point. By iteration, the cluster centers and
the membership grade are updated, and the objective function is minimized to find the best
location of the clusters.
2
1 1
,C N
mm ij i j
j i
J u x c
(1)
where
dij =ǁ xi-c jǁ2, is the distances of the pattern xi to the cluster centroid c j,
ǁ ǁ is any norm expressing the similarity between any measured data and the center ,
uij is the degree of membership of xi in the cluster j,
xi is the i-th of d-dimensional measured data, c j is the centroid of the cluster,
N is the number of data points,
C is the number of clusters, the parameter m is the weighted exponent for uij and controls
the "fuzziness" of the resulting cluster,
m is any real number greater than 1 and is called the fuzzifier parameter, for which 2 is
usually chosen.
Fuzzy partitioning is carried out through an iterative optimization of the objective function
shown above, with the updating of membership uij and the cluster centers c j by:
2 1
1
1
/
ij C m
i j i uu
u
x c x c
(2)
where1
1
N mij i
i j N
mij
i
u x
c
u
The algorithm is comprised of the following steps:
a. Initialize U (membership matrix), called the fuzzy partition matrix, where uij denotesthe membership degree of a datum xi to cluster i,
0,ijU u matrix U ;
b. Compute the vectors of the center prototypes
k jC c with k
U ;
c. Compute the distances: 2ijAD
www.intechopen.com
7/28/2019 InTech-Fuzzy Modeling of Geospatial Patte
http://slidepdf.com/reader/full/intech-fuzzy-modeling-of-geospatial-patte 6/23
Fuzzy Logic – Emerging Technologies and Applications292
2 T
ijA i j i jD x c A x c , a squared inner-product norm.
Depending on the data and the application, different types of similarity measures may beused to identify classes, where the similarity measure controls how the clusters are formed.Some examples of values that can be used as similarity measures include distance,connectivity, and intensity;
d. Update the partition matrix kU , 1k
U
;
e. Iteration stop
if 1k k
U U
then STOP, otherwise return to step b.
This will stop when 1max
k kij ij iju u
, where is a criterion between 0 and 1
(fuzzy membership), whereas k are the iteration steps.
Cluster validity refers to the algorithm problem that attempts to find the best fit for the fixed
number of clusters and the parameterized cluster shapes. To perform validity measures,
different indexes are calculated that indicate the level of partition (Xie et al. 1991). The
indexes calculated are: Partition Coefficient (measures the amount of "overlapping" between
clusters), Partition Index (the ratio of the sum of compactness and separation of the clusters),
Classification entropy (basically a measurement of the fuzziness of the cluster partition
only), Separation Index (the inverse of the partition index measurement), Xie and Beni's
Index (aims to quantify the ratio of the total variation within clusters and the separation of
clusters) and Dunn's Index (identifies compact and well-separated clusters)( Abonyi et al.
2003 & Balasto B et al. 2003). Table 1 shows the formulas for calculating each index.
The cluster algorithm also attempts to find the best fit for a fixed cluster number and initial
conditions; nevertheless, this does not mean that the best fit is significant, since the cluster
number could be incorrect. In the case of our data, Figure 1 shows the validation indexes for
different fits for the cluster number. The strategy to follow to determine the appropriate
cluster number is to calculate a large cluster number and reduce the number based on the
data obtained from the validation indexes. It is worth mentioning that each index alone
would not be very representative, therfore a set of validations indexes is considered. We
take into account that the partitions with fewer groups are better, when the differences
between validation values are less. The cluster partition properties are evaluated using PC,CE, SC and the Xie-Beni Index. Cluster properties such as compactness (or variation) and
separation are evaluated using the Dunn Index.
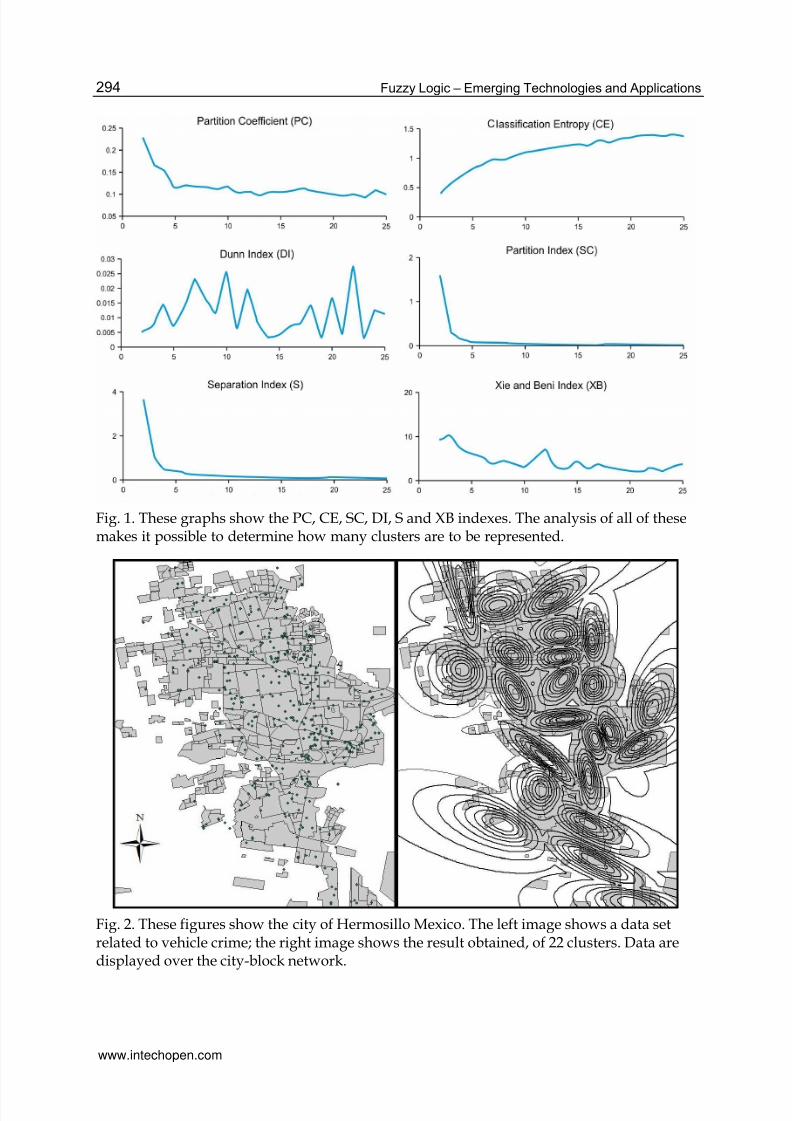
Using the data for vehicle crime from 2005-2006 for 437 cases, the PC has a decreasing
monotonic trend for C=4, 5 and CE has a monotonically increasing trend. For C=22, the S,
SC and XB indexes arrive at their minimum values of de 0.0001, 0.0203 and 0.0025,
respectively. The Dunn Index was 2.1038, the determination of the optimal number cluster
was primarily based on the SC, DI, S and XB indexes, which affirms that the
interpretation using different methods makes it possible to assign an optimal number to
clusters.
www.intechopen.com
7/28/2019 InTech-Fuzzy Modeling of Geospatial Patte
http://slidepdf.com/reader/full/intech-fuzzy-modeling-of-geospatial-patte 7/23
Fuzzy Modeling of Geospatial Patterns 293
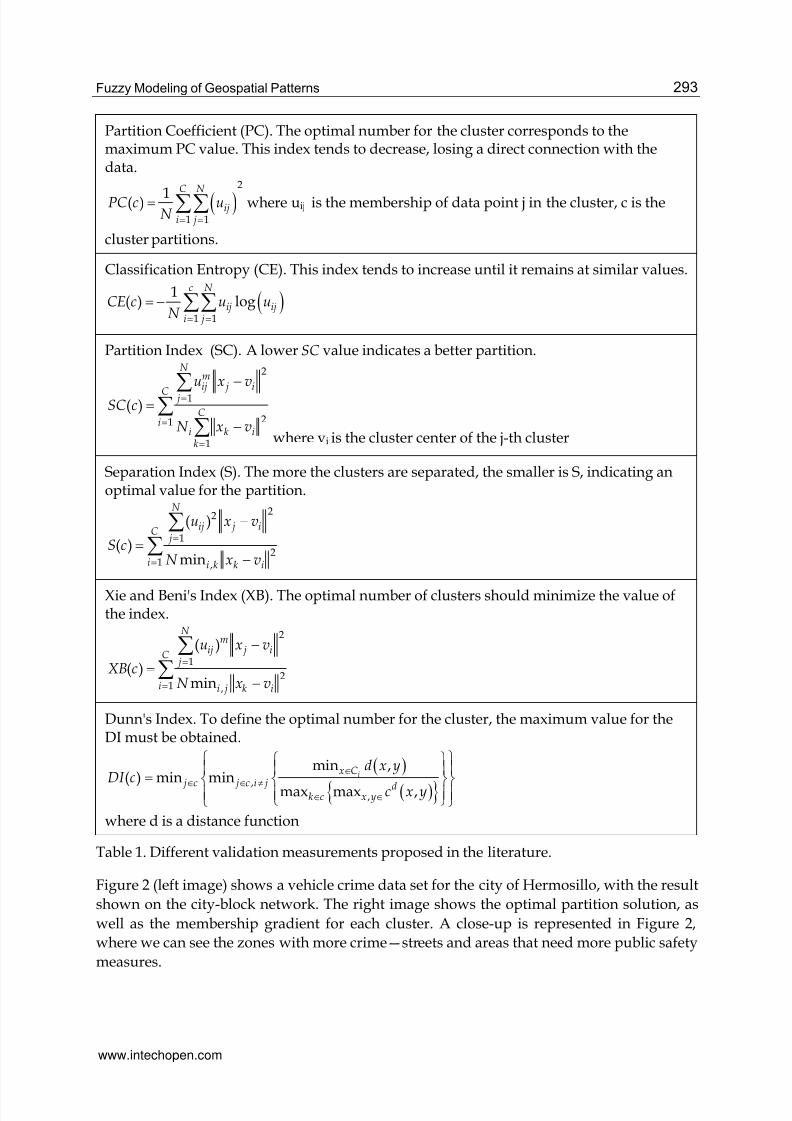
Partition Coefficient (PC). The optimal number for the cluster corresponds to themaximum PC value. This index tends to decrease, losing a direct connection with thedata.
2
1 1
1( )C N
iji j
PC c uN
where uij is the membership of data point j in the cluster, c is the
cluster partitions.
Classification Entropy (CE). This index tends to increase until it remains at similar values.
1 1
1( ) log
c N
ij iji j
CE c u uN
Partition Index (SC). A lower SC value indicates a better partition.
2
1
21
1
( )
N mij j i
C j
C i
i k ik
u x v
SC c
N x v
where vi is the cluster center of the j-th cluster
Separation Index (S). The more the clusters are separated, the smaller is S, indicating anoptimal value for the partition.
22
1
21 ,
( )
( )min
N
ij j iC j
i i k k i
u x v
S cN x v
Xie and Beni's Index (XB). The optimal number of clusters should minimize the value ofthe index.
2
1
21 ,
( )
( )min
N m
ij j iC j
i i j k i
u x v
XB cN x v
Dunn's Index. To define the optimal number for the cluster, the maximum value for theDI must be obtained.
,,
min ,
( ) min min max max ,
ix C
j c j c i j dk c x y
d x y
DI c c x y
where d is a distance function
Table 1. Different validation measurements proposed in the literature.
Figure 2 (left image) shows a vehicle crime data set for the city of Hermosillo, with the result
shown on the city-block network. The right image shows the optimal partition solution, as
well as the membership gradient for each cluster. A close-up is represented in Figure 2,
where we can see the zones with more crime—streets and areas that need more public safety
measures.
www.intechopen.com
7/28/2019 InTech-Fuzzy Modeling of Geospatial Patte
http://slidepdf.com/reader/full/intech-fuzzy-modeling-of-geospatial-patte 8/23
Fuzzy Logic – Emerging Technologies and Applications294
Fig. 1. These graphs show the PC, CE, SC, DI, S and XB indexes. The analysis of all of thesemakes it possible to determine how many clusters are to be represented.
Fig. 2. These figures show the city of Hermosillo Mexico. The left image shows a data setrelated to vehicle crime; the right image shows the result obtained, of 22 clusters. Data aredisplayed over the city-block network.
www.intechopen.com
7/28/2019 InTech-Fuzzy Modeling of Geospatial Patte
http://slidepdf.com/reader/full/intech-fuzzy-modeling-of-geospatial-patte 9/23
Fuzzy Modeling of Geospatial Patterns 295
The crime event is dynamic, thus a more detailed study is needed to consider the temporalportion of the data (months, weeks and days). The membership geovisualization methodused was a Sammon mapping (Sammon, 1969), which preserves inter-pattern distancesusing the Euclidian interpoint distance norm.
2
1 ij ij
sammonij iji j
i j
d DS
d d
where dij represents the proximity of point data i and j in the original data space and Dij
represents the Euclidian distance between mapped points i and j in the projected space. Theproject is nonlinear and the stress function is defined as:
2
ij ij
iji j
d D
d
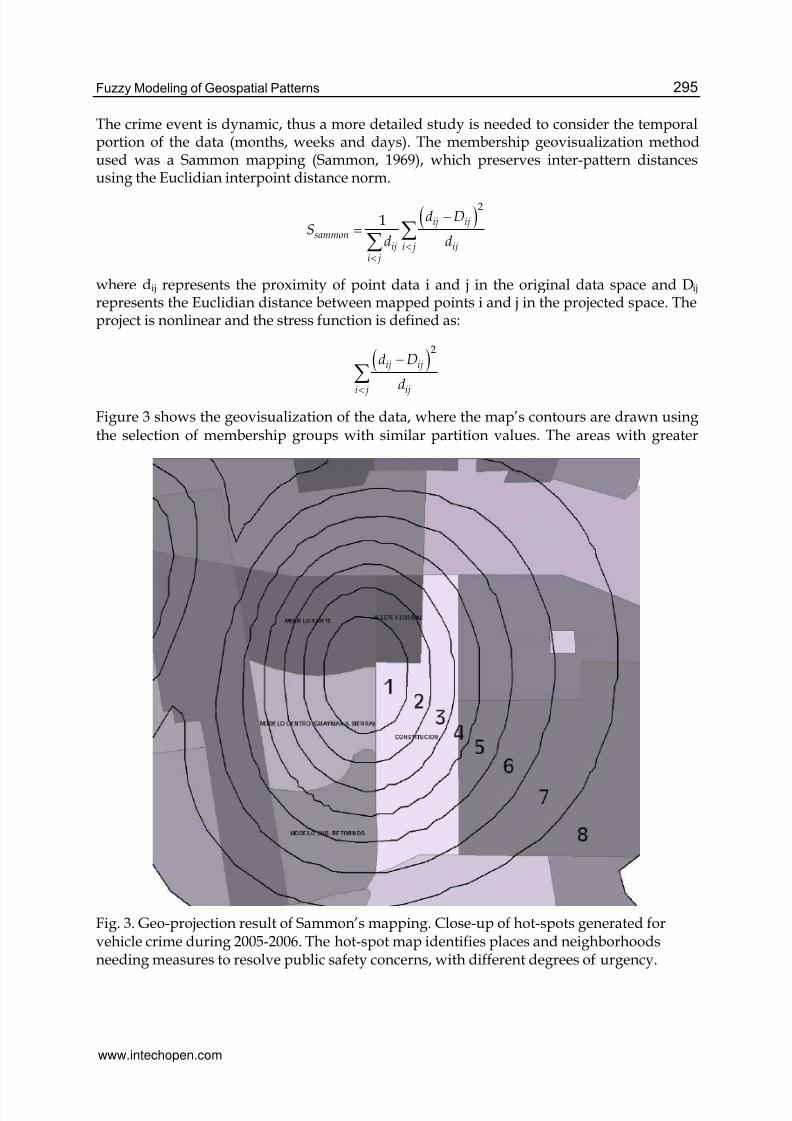
Figure 3 shows the geovisualization of the data, where the map’s contours are drawn usingthe selection of membership groups with similar partition values. The areas with greater
Fig. 3. Geo-projection result of Sammon’s mapping. Close-up of hot-spots generated forvehicle crime during 2005-2006. The hot-spot map identifies places and neighborhoodsneeding measures to resolve public safety concerns, with different degrees of urgency.
www.intechopen.com
7/28/2019 InTech-Fuzzy Modeling of Geospatial Patte
http://slidepdf.com/reader/full/intech-fuzzy-modeling-of-geospatial-patte 10/23
Fuzzy Logic – Emerging Technologies and Applications296
membership are assigned a value of 1. As the values move away from the ideal value or thecenter of the set, decreasing values are assigned on a continuous scale from 1 to 0. Thevalues found in the transition zone are shown as intermediate contours. It can be seen thatthere are up to four blocks in one cluster (representation of the urban region of the city of
Hermosillo). Considering the transition contours and regional representations related tostolen vehicles enables defining better strategies to address the problem. The figurenumerically shows the monitoring zones according to different degrees of urgency.
In practice, data for different criminal acts can occur at any time; the data are dynamic andchanging. Working with fuzzy hot-spot information makes it possible to consider a spatialdistribution with grades of membership, enabling administrators and professionals in crimeprevention to use the data as a detection strategy as well as to spatially identify differentpriority zones, taking into greater account urban geographic spaces.
3.2 School infrastructure analysis
One factor in the level of development of a society is the degree of education. The topic ofeducation has two spatial aspects: first, the identification of zones covered by elementaryschools (primary and secondary school categories) and second, the identification of thedeficit, based on the comparison of the number of allotments offered versus the populationdensity throughout the zone.
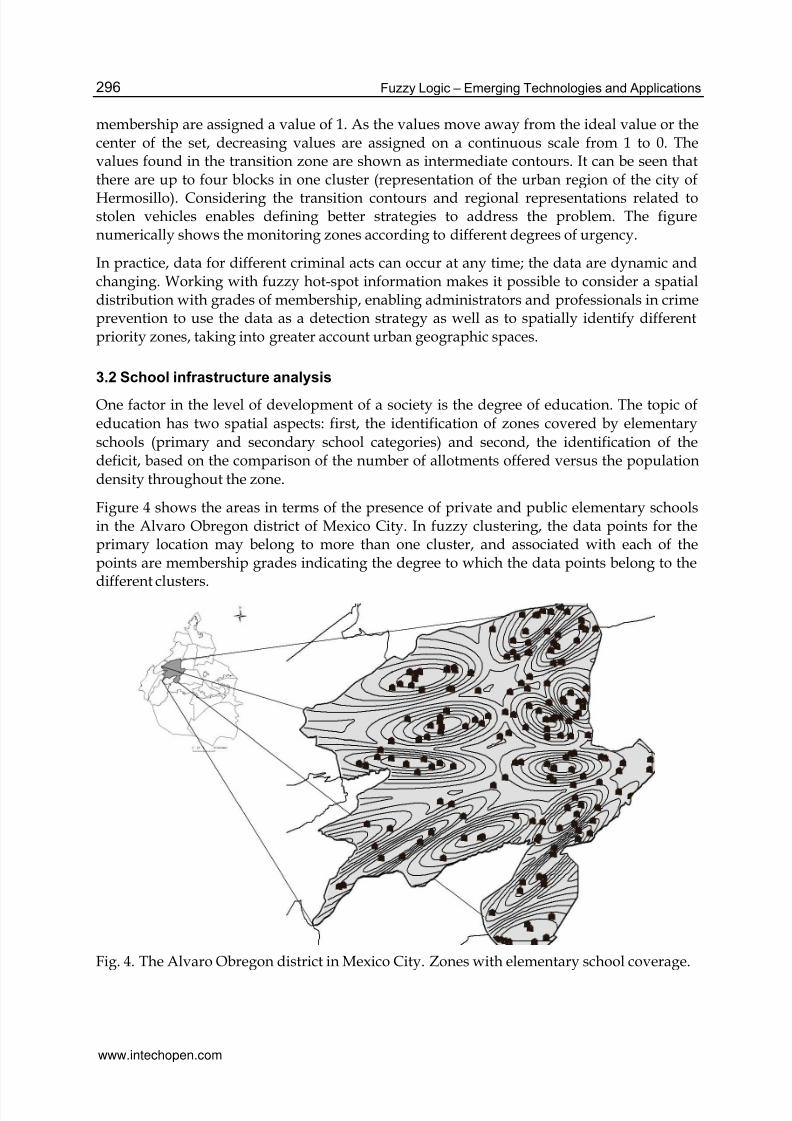
Figure 4 shows the areas in terms of the presence of private and public elementary schoolsin the Alvaro Obregon district of Mexico City. In fuzzy clustering, the data points for theprimary location may belong to more than one cluster, and associated with each of thepoints are membership grades indicating the degree to which the data points belong to the
different clusters.
Fig. 4. The Alvaro Obregon district in Mexico City. Zones with elementary school coverage.
www.intechopen.com
7/28/2019 InTech-Fuzzy Modeling of Geospatial Patte
http://slidepdf.com/reader/full/intech-fuzzy-modeling-of-geospatial-patte 11/23
Fuzzy Modeling of Geospatial Patterns 297
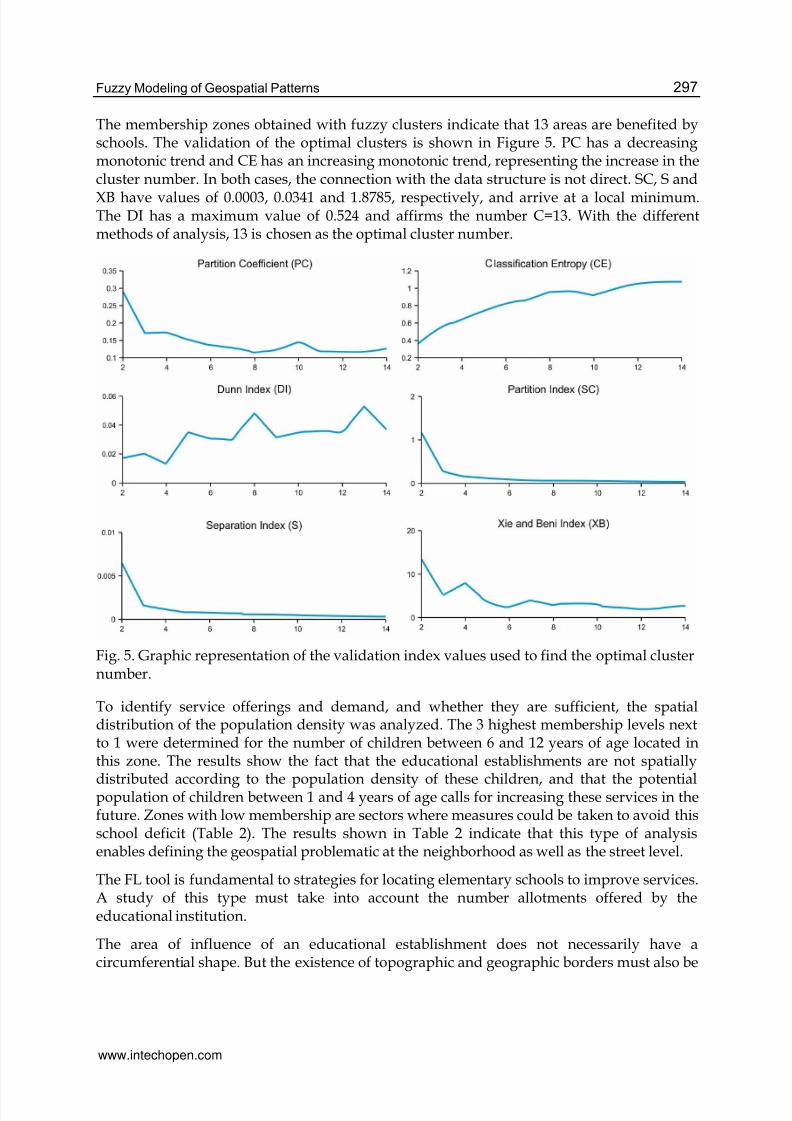
The membership zones obtained with fuzzy clusters indicate that 13 areas are benefited byschools. The validation of the optimal clusters is shown in Figure 5. PC has a decreasingmonotonic trend and CE has an increasing monotonic trend, representing the increase in thecluster number. In both cases, the connection with the data structure is not direct. SC, S and
XB have values of 0.0003, 0.0341 and 1.8785, respectively, and arrive at a local minimum.The DI has a maximum value of 0.524 and affirms the number C=13. With the differentmethods of analysis, 13 is chosen as the optimal cluster number.
Fig. 5. Graphic representation of the validation index values used to find the optimal clusternumber.
To identify service offerings and demand, and whether they are sufficient, the spatialdistribution of the population density was analyzed. The 3 highest membership levels nextto 1 were determined for the number of children between 6 and 12 years of age located inthis zone. The results show the fact that the educational establishments are not spatially
distributed according to the population density of these children, and that the potentialpopulation of children between 1 and 4 years of age calls for increasing these services in thefuture. Zones with low membership are sectors where measures could be taken to avoid thisschool deficit (Table 2). The results shown in Table 2 indicate that this type of analysisenables defining the geospatial problematic at the neighborhood as well as the street level.
The FL tool is fundamental to strategies for locating elementary schools to improve services.A study of this type must take into account the number allotments offered by theeducational institution.
The area of influence of an educational establishment does not necessarily have acircumferential shape. But the existence of topographic and geographic borders must also be
www.intechopen.com
7/28/2019 InTech-Fuzzy Modeling of Geospatial Patte
http://slidepdf.com/reader/full/intech-fuzzy-modeling-of-geospatial-patte 12/23
Fuzzy Logic – Emerging Technologies and Applications298
considered because they sometimes constitute significant limitations in identifying astudent’s route to his or her school. A diagnostic for the student’s travel distance network isshown by Reyes-Guerrero (1986), who defines the degree of membership in a class for eachone of the nodes on the graph (nodes represent the elements that belongs to each region),
making it possible to define neighborhood relationships.
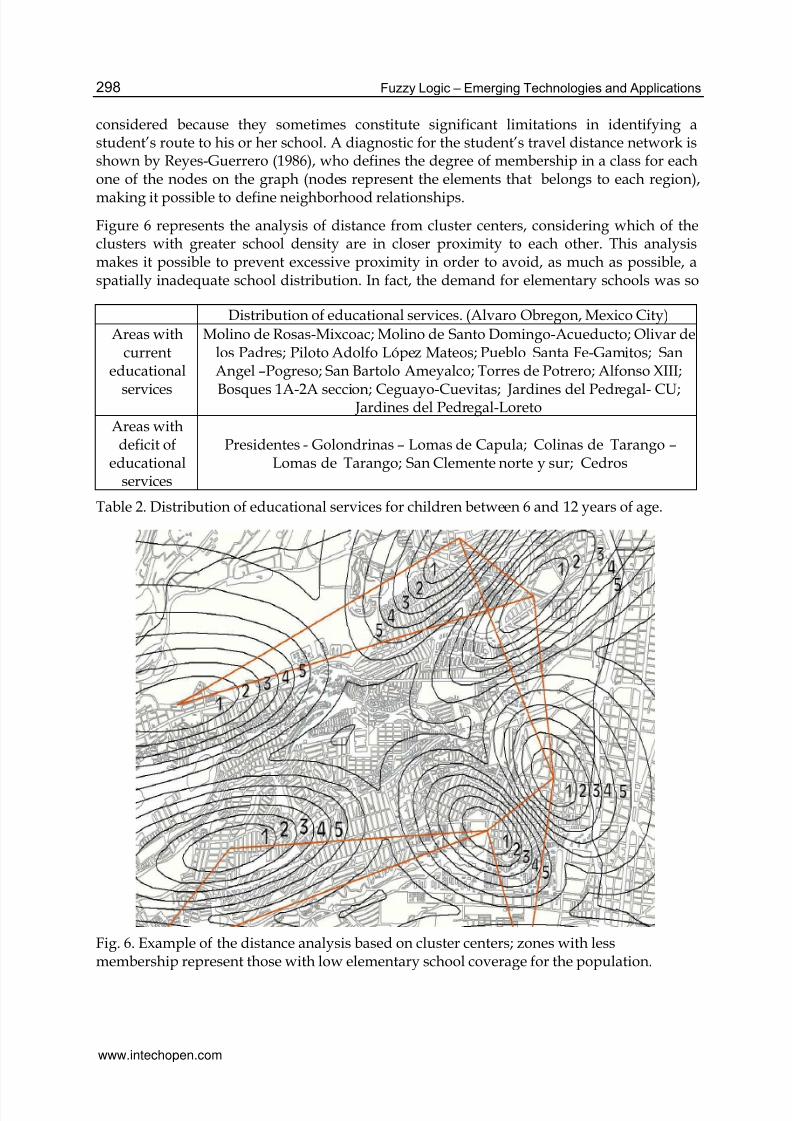
Figure 6 represents the analysis of distance from cluster centers, considering which of theclusters with greater school density are in closer proximity to each other. This analysismakes it possible to prevent excessive proximity in order to avoid, as much as possible, aspatially inadequate school distribution. In fact, the demand for elementary schools was so
Distribution of educational services. (Alvaro Obregon, Mexico City)
Areas withcurrent
educational
services
Molino de Rosas-Mixcoac; Molino de Santo Domingo-Acueducto; Olivar delos Padres; Piloto Adolfo López Mateos; Pueblo Santa Fe-Gamitos; SanAngel –Pogreso; San Bartolo Ameyalco; Torres de Potrero; Alfonso XIII;
Bosques 1A-2A seccion; Ceguayo-Cuevitas; Jardines del Pedregal- CU; Jardines del Pedregal-Loreto
Areas withdeficit of
educationalservices
Presidentes - Golondrinas – Lomas de Capula; Colinas de Tarango –Lomas de Tarango; San Clemente norte y sur; Cedros
Table 2. Distribution of educational services for children between 6 and 12 years of age.
Fig. 6. Example of the distance analysis based on cluster centers; zones with lessmembership represent those with low elementary school coverage for the population.
www.intechopen.com
7/28/2019 InTech-Fuzzy Modeling of Geospatial Patte
http://slidepdf.com/reader/full/intech-fuzzy-modeling-of-geospatial-patte 13/23
Fuzzy Modeling of Geospatial Patterns 299
great that establishing one was considered beneficial to the local community. Identifying theprecise location of the school is now important. Educational planning requires a geographicdistribution study of the current density of schools.
4. Fuzzy-based data fusion model
Though the concept of data fusion is easy to understand, it varies from study to another.Data fusion has also been referred to as merging, combination, synergy and integration. Interms of formal data fusion tasks, it is desirable to design an architecture that combinesinformation from different sources, thus obtaining high-quality information. Current fusionmethods utilize tools such as weighted average, neural networks (multi-sensory fusion),rules-based knowledge, wavelets (multiresolution fusion), graph pyramids, and morerecently, fuzzy logic. Data fusion is frequently described in literature as occurring on threelevels: pixel, attribute and decision (Pohl et al. 1998, Wald 2002, López-Caloca 2006). Ageneral idea about how different authors handle these fusion levels is described below.
a. Pixel level. Images come from different sources, which are combined from pixel topixel. The fusion process should preserve the relevant information from the enteredimages on the synthetic image (pattern preservation). Although the word “pixel” is notreally adequate, the pixel is the basis for the information and does not have semanticmeaning.
b. Attribute level. The figures (geometric, structural or spectral) are drawn from crudeimages and fused afterwards. Fusion at the figure level requires recognizable objectsextracted from diverse data sources using a segmentation process. The figurescorrespond to characteristics extracted from the initial images, such that they provideform; selection is based on the practical use of the application. The classified maps are
combined and the spacial information related to each pixel’s neighbor is taken intoaccount in order to improve the fit.
c. Decision level. Decision fusion can be defined as the process of fusing information fromseveral individual data sources after each data source has undergone a preliminaryclassification. The results of classification are combined by using their weightedsignificance.
For hard classifiers, image pixels are assigned to a given category, although errors in pixel
classifications exist (pixels that may belong to a different category). When assigning a pixel to a
class, there is a risk of it being assigned to a class to which it does not belong (misclassified) or
pixels may be over-classified. Fuzzy classification considers that one category admits a
property between 0 and 1. The idea is to permit simultaneous assignment to various categorieswith different degrees of property, and later reclassify the fuzzy boundaries.
The fuzzy classification problem has been extensively studied in remote sensing (Lizarazo &Elsner, 2011, Amici et al. ,2004). A fuzzy classifier is mainly applied when the data have ahigh degree of spectral mixture. Shackelford and Davis (2003) present a fuzzy logic classifierand object-based approach. The individual pixels in the image are first classified with afuzzy classifier, making use of both spectral and spatial information. The segmented imageis then used with additional object feature information to classify the image objects.Huntsherger (1985) described the application of the technique, called iterative fuzzyclustering, with the aim that the segmentation process not be affected by noise and
www.intechopen.com
7/28/2019 InTech-Fuzzy Modeling of Geospatial Patte
http://slidepdf.com/reader/full/intech-fuzzy-modeling-of-geospatial-patte 14/23
Fuzzy Logic – Emerging Technologies and Applications300
degradation from image acquisition. Likewise, combinations such as fuzzy-support vectormachine (F2-SVM) (Borasca, 2006) enable demodulating the relations between one patternand the proposed classes in the F2-SVM framework. Other classification approaches attemptto take advantage of the strengths of each algorithm. For example, in the combination of two
techniques—fuzzy topology and the Maximum Likelihood Classifier (MLC) (Liu et al.,2011), known as FTMLC—one membership function is created for each pixel using FTMLCand the pixels with greater membership are assigned a certain class, while those with lessmembership are left at the boundaries for a later process. Connectivity is sought for pixels atthe boundaries with respect to their 8 neighbors, in such a manner that the one with thehigher number of connected pixels belongs to that class. As a result, pixels on fuzzy bordersare re-classified and, therefore, are given a higher assignment.
In the search for better solutions to problems of imprecise information, data fusion emergesas an alternate tool which, for example, can use the strengths of different classifiers in orderto obtain a better approximation, with the resulting classification proportions resulting in
less redundancy and complementary information.
The aggregation of information from multiple sources using a fuzzy system requiresspecifying the value of the input variable, membership functions and production rules(Klein, 2004, Raol, 2011). Each data source furnishes one or various admissions. An expertdevelops the standards specifying the outlet actions in terms of fuzzy sets, combinations offuzzy input, and the definition of property functions that define the property of the fuzzysets for output.
Fusion tasks at the pixel level have applied FL and neural fuzzy algorithms (Zhao et al.,2005, Meitzler, 2002, Singh, 2004). Their implementation considers two or more admissionimages for the fuzzy method. The implementation is carried out by assigning the admissionvariables with the same image size, deciding the number and type of functions formembership to the admission images, applying the fuzzy action using the rules developedin the pixel values of each admission image—which provides a fuzzy set represented by amembership function—and, lastly, applying the defuzzification of the outlet image.
In the fusion framework at the decision level, fuzzy algorithms have also been successfullyused in various applications. Chanussot et al. (1999) propose a variety of strategies tocombine images based on fuzzy fusion techniques with the aim of drawing roads. As in thecase of fuzzy modeling, they combine the results from various detectors of boundaries. Theneural-fuzzy-fusion method (NFF) combines a set of fuzzy classifiers in a system called amultiple classifier system (MCS). The application of this method to remote sensing images
has demonstrated that the NFF-MCS produces good results (Shankar et al., 2006).
Support vector machines (SVM) have been applied to different classification problems(Mounrakis et al., 2010). The precision of these generally surpasses conventional algorithms.Fauvel et al. (2006, 2007) conducted fusion processes by combining spectral and spatialinformation. While the SVM enables working with the spectral information of an image, thespatial information is defined by means of morphological profiles, with the fusion processperformed using different voting schemes (for example, absolute maximum and majorityvoting). Mathieu Fauvel et al. (2007) discuss the optimization of classifications of urbanzones with high-resolution images, considering the use of various classifiers (conjugategradient neural network and a fuzzy classifier). The inputs for the fusion process were the
www.intechopen.com
7/28/2019 InTech-Fuzzy Modeling of Geospatial Patte
http://slidepdf.com/reader/full/intech-fuzzy-modeling-of-geospatial-patte 15/23
Fuzzy Modeling of Geospatial Patterns 301
posterior probabilities from the outputs of the neural network and the membership degreesfor the fuzzy classifier; i.e., the methodology consists of processing the data with eachclassifier alone and assigning to the algorithms each pixel’s grade of membership for theclasses considered. Then, the combination rule from the fuzzy decision is utilized to
combine the results furnished by the algorithms, in accordance with the capabilities of theclassifiers used. When modeling the output classifier, such as a fuzzy set, certainty ismeasured by the grade of uncertainty and the estimates of the global exactness of eachclassifier. The results can integrate a good deal of complementary information for the finalclassification process.
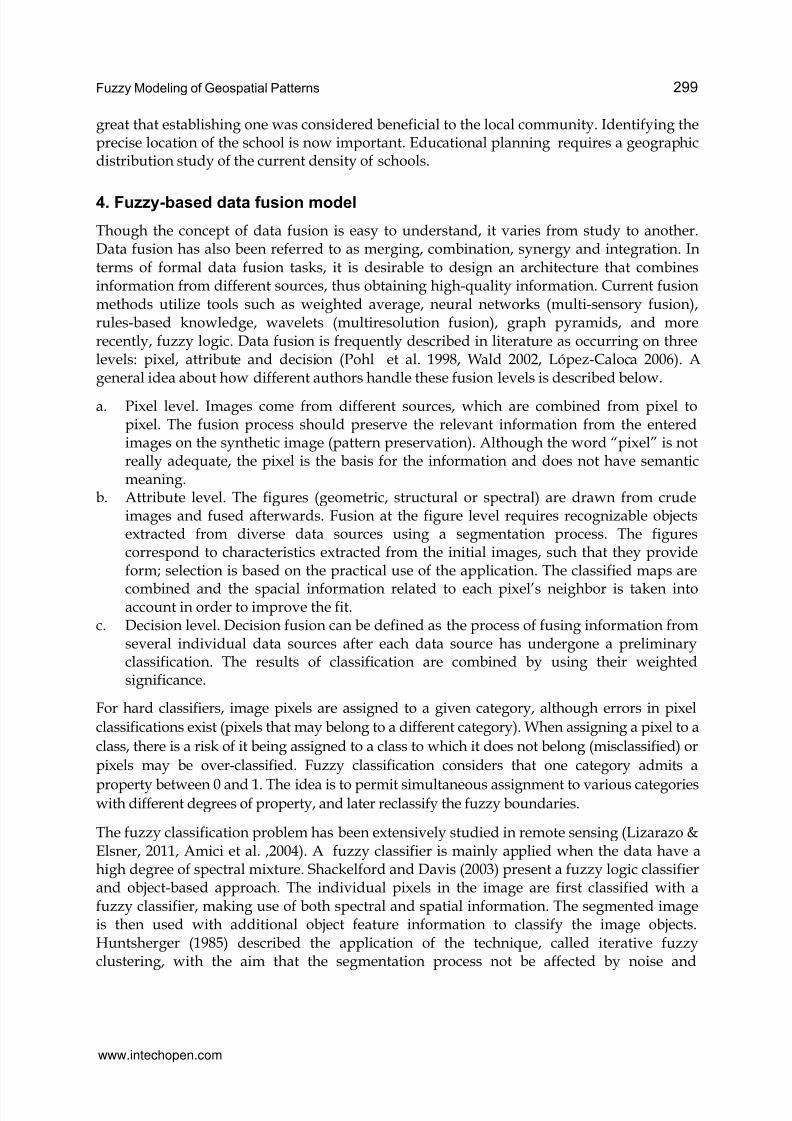
Fig. 7. Experimental fuzzy fusion scheme
Figure 7 shows a proposed fuzzy fusion technique. Images were classified with the Support
Vector Machine (SVM) algorithm. In SVM, a function set is analyzed with this classifier, in
such a manner that the function is approximated with less discrepancy between the a priori
knowledge and the training data. Classes are divided in feature space; SVM separates two
class sets by means of a hyper-plane (H) of linear or nonlinear functions. Available kernels
include linear, polynomial, radial basis function and sigmoid. The kernel transformation
allows for finding a new feature space in which linear hyper-planes are appropriate for class
separation. In order to avoid or minimize the former errors, at the moment of adjusting the
data it searches for the Structural Risk Minimization (SRM). In this work, two kernels were
utilized—sigmoid and polynomial. The literature reports that both segmentation resultspresent high precision. For the purposes of this task, the fusion of both segmentation results
and the application of our proposed fuzzy fusion techniques are proposed. The resulting
SVM classifications furnish redundant and complementary results. The methodology
consists of data processing with each classifier and assigning each pixel’s membership grade
to the algorithms for the classes being considered; these are the inputs in the fusion process.
The classified images were re-mapped into membership values ranging from 0 to 1, using a
specified fuzzy function; in this case, a linear transformation.
The fuzzy fusion technique is used to combine two or more fuzzy membership results usingfuzzy as a simple operator to create, in the case of suitability, the most suitable model. The
www.intechopen.com
7/28/2019 InTech-Fuzzy Modeling of Geospatial Patte
http://slidepdf.com/reader/full/intech-fuzzy-modeling-of-geospatial-patte 16/23
Fuzzy Logic – Emerging Technologies and Applications302
fuzzy sets A and B will return the minimum value of the sets of cells located at the standardintersection ( A ∩ B)(x) = min [ A(x), B(x)] . Finally, the defuzzification action is conducted byassigning the segmented regions to each class. Defuzzification is a process that converts afuzzy set or fuzzy number into a crisp value or number.
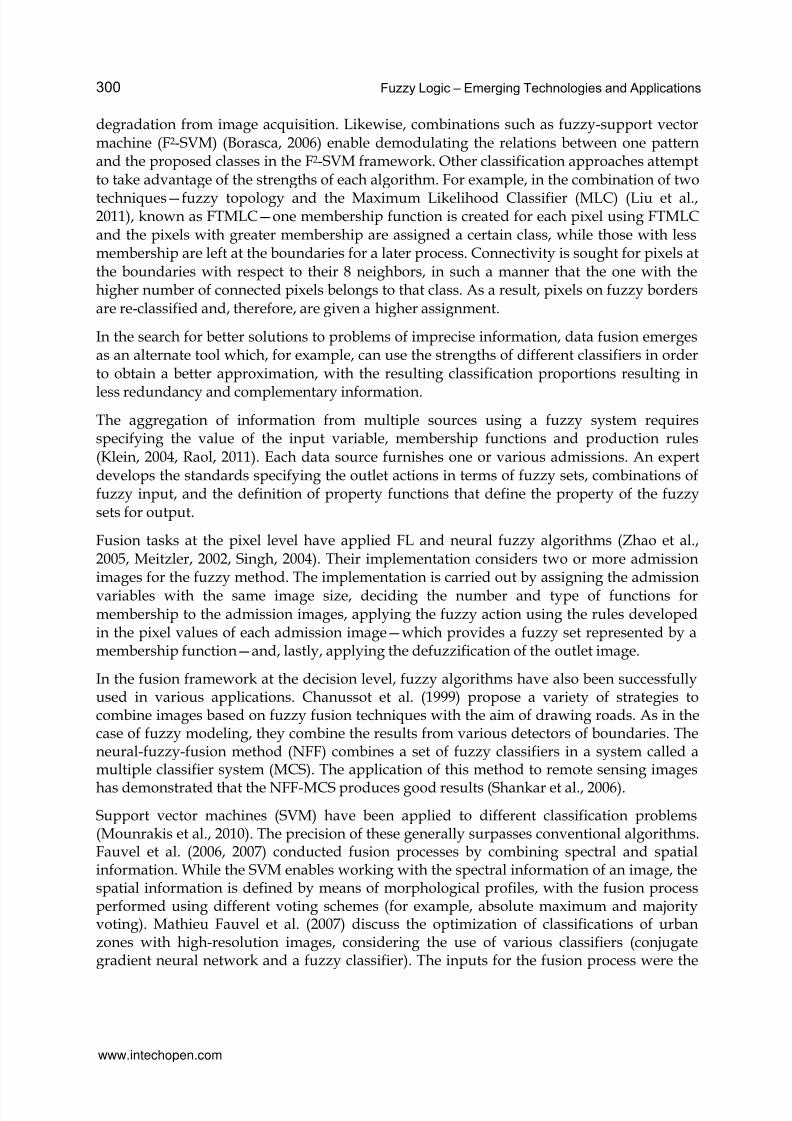
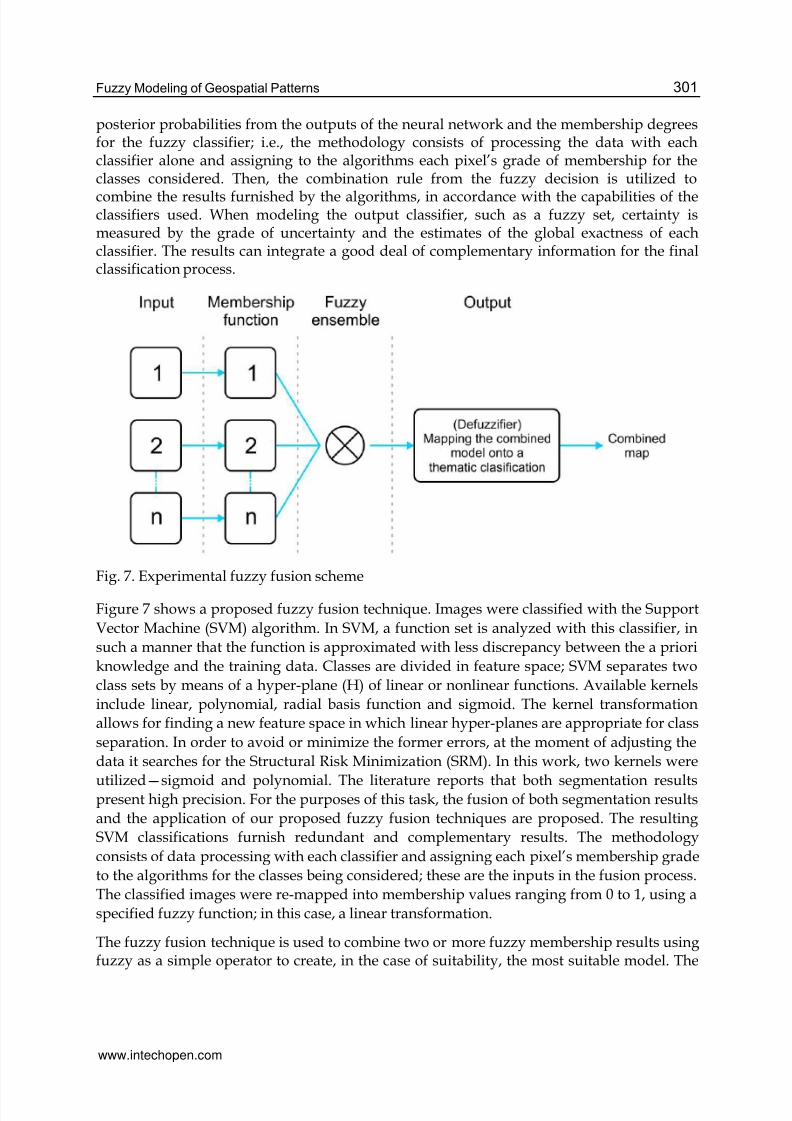
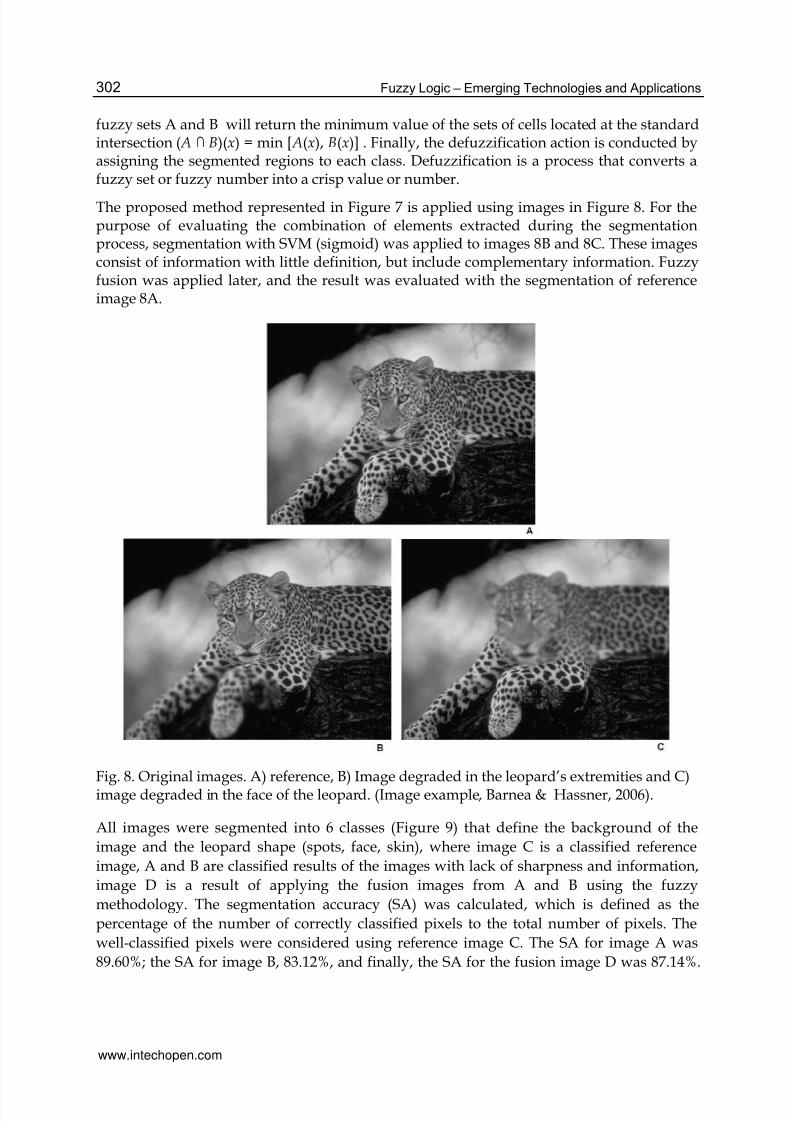
The proposed method represented in Figure 7 is applied using images in Figure 8. For thepurpose of evaluating the combination of elements extracted during the segmentationprocess, segmentation with SVM (sigmoid) was applied to images 8B and 8C. These imagesconsist of information with little definition, but include complementary information. Fuzzyfusion was applied later, and the result was evaluated with the segmentation of referenceimage 8A.
Fig. 8. Original images. A) reference, B) Image degraded in the leopard’s extremities and C)image degraded in the face of the leopard. (Image example, Barnea & Hassner, 2006).
All images were segmented into 6 classes (Figure 9) that define the background of the
image and the leopard shape (spots, face, skin), where image C is a classified reference
image, A and B are classified results of the images with lack of sharpness and information,
image D is a result of applying the fusion images from A and B using the fuzzy
methodology. The segmentation accuracy (SA) was calculated, which is defined as the
percentage of the number of correctly classified pixels to the total number of pixels. The
well-classified pixels were considered using reference image C. The SA for image A was
89.60%; the SA for image B, 83.12%, and finally, the SA for the fusion image D was 87.14%.
www.intechopen.com
7/28/2019 InTech-Fuzzy Modeling of Geospatial Patte
http://slidepdf.com/reader/full/intech-fuzzy-modeling-of-geospatial-patte 17/23
Fuzzy Modeling of Geospatial Patterns 303
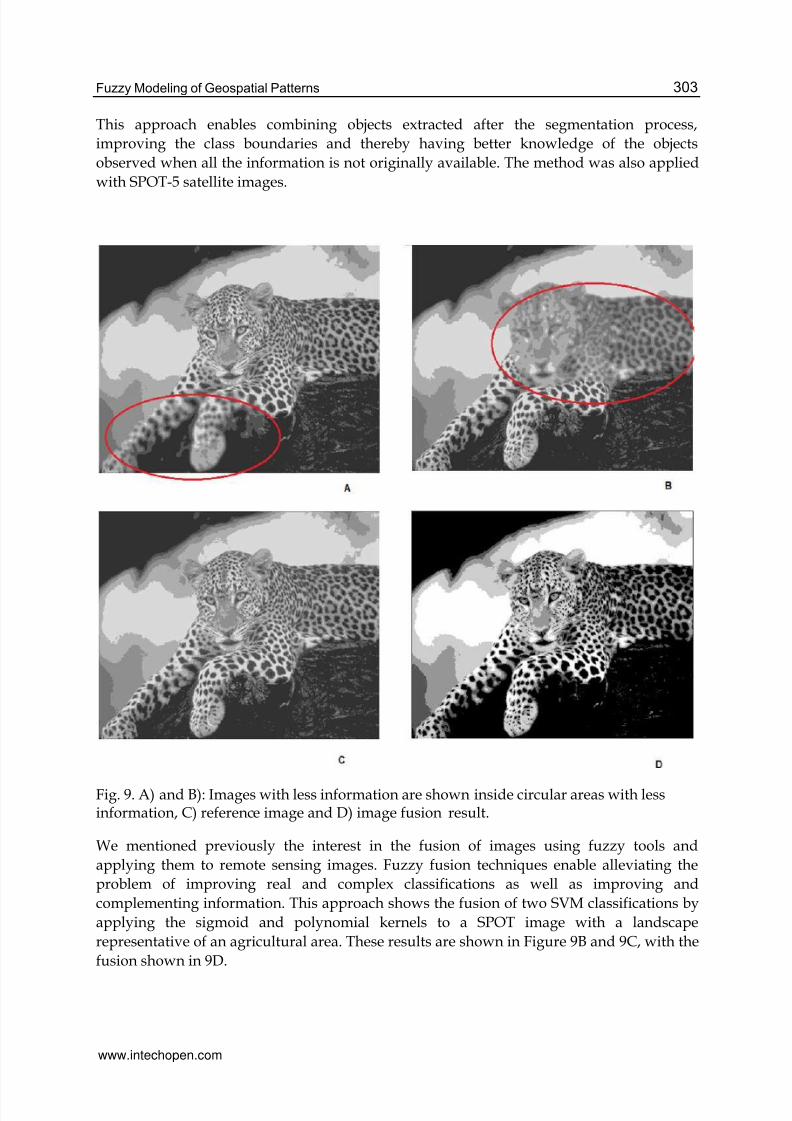
This approach enables combining objects extracted after the segmentation process,
improving the class boundaries and thereby having better knowledge of the objects
observed when all the information is not originally available. The method was also applied
with SPOT-5 satellite images.
Fig. 9. A) and B): Images with less information are shown inside circular areas with lessinformation, C) reference image and D) image fusion result.
We mentioned previously the interest in the fusion of images using fuzzy tools and
applying them to remote sensing images. Fuzzy fusion techniques enable alleviating the
problem of improving real and complex classifications as well as improving and
complementing information. This approach shows the fusion of two SVM classifications by
applying the sigmoid and polynomial kernels to a SPOT image with a landscape
representative of an agricultural area. These results are shown in Figure 9B and 9C, with the
fusion shown in 9D.
www.intechopen.com

7/28/2019 InTech-Fuzzy Modeling of Geospatial Patte
http://slidepdf.com/reader/full/intech-fuzzy-modeling-of-geospatial-patte 18/23
Fuzzy Logic – Emerging Technologies and Applications304
In order to conduct quantitative comparisons of the two algorithms, the concept ofuniformity (Levine & Nazif, 1985, Cheng-Chia et al. 1997) was applied. This method is
applied when a reference image or real data do not exist. Let I be the segmented image andSI the area of the entire image. Ri denotes the set of pixels in region i. The uniformity of a
segmentation result is defined by:
1U 1
S
ii
K
(3)
where S is the number of classes, σ2 denotes i within-class variance of the i-th class, K is anormalization factor that limits the maximum value of the measurement to 1. We find thatthe proposed fuzzy fusion method obtains a similar uniformity value (0.889) with respect to
Fig. 10. A) Original, B) SVM (sigmoid kernel ), C) SVM (polynomial kernel) and D) fuzzyfusion result
www.intechopen.com
7/28/2019 InTech-Fuzzy Modeling of Geospatial Patte
http://slidepdf.com/reader/full/intech-fuzzy-modeling-of-geospatial-patte 19/23
Fuzzy Modeling of Geospatial Patterns 305
the other SVM classifiers (sigmoid and polynomial kernel), which obtain uniformity valuesof (0.840). One last measurement that can be performed with the error of the results is theverification process, by calculating overall reliability. Photo interpretation was used, such asreal land—as well as the verification of maps classified based on the definition of proposed
thematic categories (agriculture fields, bare land, among others). The overall reliability was84.8% for SVM (sigmoid), 83.9% for SVM (polynomial), and lastly, 84.4% for the fuzzytechnique. The results indicate that fuzzy fusion has an acceptable thematic quality and maybe an alternative to integrate information, in this example, and to obtain well-definedimages.
This section illustrates a simple fusion model with the application of fuzzy concepts, showsits function in providing complementary information (Figure 9) and presents anotherexample applied to geospatial data (Figure 10), such as thematic classification mapsobtained from a single satellite image, which can be combined to reduce uncertainty. Withthis example, we demonstrate that fusion along with fuzzy techniques make it possible to
model spatial properties.
5. Conclusion
This work demonstrated the advantages of utilizing fuzzy methods for spatial analysis andimage processing applications. For crime analysis, we were able to identify patterns bylooking at the geography of the incidents and identifying hot-spots. Zones with a highspatial concentration of schools were also identified, as well as the existence of geographicareas needing this service. Finally, the application of fuzzy fusion enabled combininginformation within the framework of fuzzy modeling in order to improve and completeinformation, as is the case when using different classifiers.
It is therefore possible to conclude from these examples that the models designed andapplied in this work allowed us to identify different aspects of spatial patterns, where themain elements of the study were part of the geographical landscape.
For geospatial analysis, the challenge to explore more applications with fuzzy methodologiescontinues to evolve. In the next phase, other elements of geospatial structures could naturallybe explored, such as the causes of certain phenomena in the regions where crime occurs, ineducational planning or in the functioning of social urban processes. The generation of robustscientific knowledge is needed in order to address problems that in the past have not beenpossible to study with non-fuzzy computational algorithms.
Although several mathematical models have been designed for geospatial applications,topological concepts and geographic neighborhood models using fuzzy set tools havereceived little attention in the area of modeling. Future work will integrate the idea of fuzzytopology proposed by Reyes-Guerrero (1986) to include the topological space as a newmathematical structure, applying the design of fusion and classification algorithms totopology, contiguity and the degree of membership to a border or interior region.
6. Acknowledgment
The authors thank to Dr. Elvia Martínez, José Manuel Madrigal, Camilo Caudillo and JoséLuis López, Rafael García for their contributions to this work.
www.intechopen.com

7/28/2019 InTech-Fuzzy Modeling of Geospatial Patte
http://slidepdf.com/reader/full/intech-fuzzy-modeling-of-geospatial-patte 20/23
Fuzzy Logic – Emerging Technologies and Applications306
7. References
Abonyi J & Szeifert F.,(2003), Supervised fuzzy clustering for the identification of fuzzyclassifiers, Pattern Recognition Letters, Vol. 24, No.14, pp. 2195-2207.
Altman D.( 1994), Fuzzy set theoretic approches for handling imprecision in spatial analysis,Int. J. Geographical Information systems, Vol.8, No.3, pp.271-289.Amici G., Dell’Acqua F., Gamba P., and Pulina G., (2004), A comparison of fuzzy and neuro-
fuzzy data fusion for flooded area mapping using SAR images, International Journalof Remote Sensing, vol. 25, no. 20, pp. 4425–4430.
Barnea A. and Hassner T. ( 2004-2006) Image example Available from:http://www.wisdom.weizmann.ac.il/~vision/alumni/hassner/Fusion/#examples
Balasto B., Abonyi J., and Feil B., (2003), Fuzzy Clustering and Data Analysis toolbox, for usewith matlab, Veszprem University, Hungary , Available from:http://www.mathworks.com/matlabcentral/fileexchange/7473.
Bezdek J.C., (1973), Fuzzy mathematics in pattern classification, Ph.D. dissertation, Cornell
Univ., Itheca, NY.Borasca, B.; Bruzzone, L.; Carlin, L.; Zusi, M. (2006), A fuzzy-input fuzzy-output SVM
technique for classification of hyperspectral remote sensing images, In SignalProcessing Symposium, NORSIG 2006. Proceedings of the 7th Nordic, pp. 2-5,ISBN:1-4244-0412-6.
Burrough P.A. (1996), Natural Object with indeterminate Boundaries, In Geographic objectswith indeterminate boundaries. GISDATA2, Edited Burrough P.A. & Frank A.U.,Series Editors Masser I. and Salgé F. Taylor & Francis. Printed in Great Britain.ISBN 0-7484-0386-8, p. 3,71.
Chanussot J, Mauris G, Lambert P., (1999), Fuzzy fusion techniques for linear featuresdetection in multitemporal SAR images , IEEE Trans Geosci Remote Sens. Vol.37,
No.3, pp. 2287–2297.Cheng T., (2002), Fuzzy Objects: Their Changes and Uncertainties, Photogrammetric
Engineering & Remote Sensing,. Vol. 68, No. 1, pp. 41-49.Cheng T., Fisher P & Zhilin L.,(2004) Double vagueness: uncertainty in multi-scale fuzzy
assignment of duneness , Geo-Spatial Information Science ,volume 7, Number 1, 58-66, DOI: 10.1007/BF02826677.
Cheng-Chia Chang, Ling-Ling Wang, (1997), A fast multilevel thresholding method basedon lowpass and highpass filtering, Pattern Recognition Letters , Vol. 18, pp. 1469–1478
Couclelis H., (1996), Toward an operational typology of geographic entities with ill-definedboundaries. In:. Geographic objects with indeterminate boundaries, Burrough P.A. &Frank A.U. , (Eds), pp. 71–85, (London: Taylor & Francis). Cross V., Firat A., (2000),Fuzzy objects for geographical information systems, Fuzzy Sets and Systems , Vol.113,pp 19-36.
Erwig M., & Schneider M, (1997), Vague Regions, In: 5th Int. Symp. on Advances in SpatialDatabases (SSD’97), LNCS 1262, 298-320
Fauvel, M. Chanussot, J. Benediktsson, J.A. , (2006), Decision Fusion for the Classification ofUrban Remote Sensing Images, IEEE Transactions on Geoscience and Remote Sensing, Vol. 44 , No.10, pp. 2828 – 2838,
www.intechopen.com
7/28/2019 InTech-Fuzzy Modeling of Geospatial Patte
http://slidepdf.com/reader/full/intech-fuzzy-modeling-of-geospatial-patte 21/23
Fuzzy Modeling of Geospatial Patterns 307
Fauvel, M. Chanussot, J. Benediktsson, J.A. ,(2007), Decision fusion for hyperspectralclassification, In Hyperspectral data exploitation, theory and application, edited byChang C.I., , pp.315-351. John wiley & Sons,Inc, ISBN:978-0-471-74697-3
Galton A., (2000), In Qualitative Spatial Change pp.121,129. Oxford University press. ISBN
0-19-823397-3. New York.Grubesic T.H.,(2006),On the Aplication of Fuzzy Clustering for Crime Hot Spot Detection,
Journal of Quantitave Criminology, Vol. 22, No 1.,pp. 77-105.Guesgen H.W., Fuzzy Reasoning about Geographic Regions, (2005),In Fuzzy Modeling with
Spatial Informationfor Geographic Problems , Editors: Petry F.E., Robinson V.B., CobbM.A., pp.1-14, Springer Berlin Heidelberg, ISBN 3-540-23713-5 , New York.
Huntsherger T.L., Jacobs C.L., Cannon R.L.,(1985), Iterative fuzzy image segmentationPattern Recognition, Vol. 18, No. 2, pp. 131-138 .
Jacquez G.M., Maruca S.,Fortin M.J.,( 2000), From fields to objects: A review of geographicboundary analysis. J. Geograph Syst, Vol.2, pp.221-241.
Kavoras M.,(1996), Geoscience modeling: from Continuous fields to entities, In Geographic
objects with indeterminate boundaries. GISDATA2, Series Editors Ian Masser andFrancois Salgé. Taylor & Francis. V, ISBN 0-7484-0386-8, Great Britain.
Klein L.A.(2004), In Sensor and Data Fusion. A tool for information assessment and decisionMaking. SPIE Press, Bellingham, pp. 258-259, 296. ISBN 0-8194-5435-4, WashingtonUSA.
Levine, M.D., Nazif, A.M., 1985. Dynamic measurement of computer generated imagesegmentation, IEEE Trans. Pattern Anal. Machine Intell. Vol. 7, No.2,pp.155–164.
Liu K., Shi W., Zhang H.,(2011), A fuzzy topology-based maximum likelihood classification,ISPRS Journal of Photogrammetry and Remote Sensing, Vol.66, pp. 103–114.
Lizarazo I. & Elsner P., (2011), Segmentation of Remotely Sensed Imagery: Moving from
Sharp Objects to Fuzzy Regions, In Image Segmentation, Edited by: Pei-Gee Ho,Publisher: InTech, ISBN 978-953-307-228-9.López-Caloca A. A., Martínez-Vivero & Chapela-Castañares J.I. (2009), "Application of a
clustering-remote sensing method in analyzing security patterns", Proc. SPIE 7344,734407; doi:10.1117/12.818911.
López-Caloca A.A. (2006), Advanced Image Fusion Techniques for Remote sensing. Thesisdoctor of engineering, UNAM, Mexico.
Meitzler T., Bednarz D., Sohn E.J., Lane K., Bryk D., Kaur G., Singh H., Ebenstein S., SmithG.H., Rodin Y., Rankin J.S., (2002), "Fuzzy Logic based Image Fusion." Aerosense, Orlando April 2-5.
Molenaar M. & Cheng T., (2000), Fuzzy spatial objects and their dynamics, ISPRS Journal of
Photogrammetry & Remote Sensing, Vol. 55, pp. 164–175.Mountrakis G., Im J., Ogole C. (2011), Support vector machines in remote sensing: A review,
ISPRS Journal of Photorammetry and Remote Sensing , Vol.66,pp. 247-259Raol J. R. , (2011), In Multi-Sensor Data Fusion with MATLAB, CRC Press Taylor & Francis
Group, pp. 215-351.Reyes-Guerrero M. del C., (1986), Neighborhood models: an alternative for the modeling of
spatial structures, Thesis doctor of philosophy, Simon Fraser University. pp.65,109,123,156, Canada.
www.intechopen.com
7/28/2019 InTech-Fuzzy Modeling of Geospatial Patte
http://slidepdf.com/reader/full/intech-fuzzy-modeling-of-geospatial-patte 22/23
Fuzzy Logic – Emerging Technologies and Applications308
Pohl, C. and van Genderen, J.L. (1998), Multisensor image fusion in remote sensing :concepts, methods and applications, International journal of remote sensing, Vol.19,No. 5, pp. 823-854.
Sammon J.W Jr., (1969), A nonlinear mapping for data structure analysis, IEEE Transactions
on Computers, Vol. C-18, No.5, pp.401-409.Shackelford A.K., & Davis C.H., (2003), A Hierarchical Fuzzy Classification Approach for
High-Resolution Multispectral Data Over Urban Areas, IEEE Transactions onGeoscience and remote sensing, Vol. 41, No.9, pp.1920- 1932.
Shankar B. U, S.K., A. and Bruzzone L.,(2006), Remote Sensing Image Classification: ANeurofuzzy MCS Approach, Computer Vision, Graphics and Image Processing InLecture Notes in Computer Science, Vol.4338, pp. 128-139, DOI: 10.1007/11949619_12 .
Silván-Cárdenas J.L., Wang L., Zhan F.B.,(2008), Representing geographical objects withscale-induced indeterminate boundaries: A neural network-based data model,International Journal of Geographical Information Science,vol.1,p p. 1–24, ISSN 1365-8816.
Singh, H.; Raj, J.; Kaur, G.; Meitzler, T.; (2004), Image Fusion using Fuzzy Logic andapplications , Fuzzy Systems, On Proceedings. 2004 IEEE International Conference,Vol. 1, pp. 337 – 340, ISSN: 1098-7584.
Usery E.L., (1996), A conceptual framework and fuzzy set implementation for geographicfeatures. In: P.A. Burrough and A.U. Frank (Eds). In Geographic objects withindeterminate boundaries (London: Taylor & Francis), pp. 71–85.
Wald L., 2002. Data Fusion. Definitions and Architectures - Fusion of Images of DifferentSpatial Resolutions. Presses de l'Ecole, Ecole des Mines de Paris, Paris, France,ISBN 2-911762-38-X, 200 p.
Xie X.L., and G. A. Beni G.A., (1991), Validity measure for fuzzy clustering, IEEE Trans.
PAMI, Vol. 3, No. 8, pp. 841-846.Zadeh, L.A., (1975), Fuzzy logic and approximate reasoning,Synthese, Vol. 30, pp. 407–428.Zadeh, L.A., (1976), A fuzzy-algorithmic approach to the definition of complex or imprecise
concepts, International Journal of Man-Machine Studies , Vol.8, pp. 249–291.Zadeh L. A.(1994), Fuzzy logic, neural network and soft computing. Fuzzy systems,
communications of the ACM , Vol. 37, No. 2.Zadeh L.A., (2010), Toward a Logic of Everyday Reasoning, Logic Colloquium, UC Berkeley,
Available from http://www.cs.berkeley.edu/~zadeh/presentations.htmlZhao L., Xu B., Tang W. and Chen Z,(2005), A Pixel-Level Multisensor Image Fusion
Algorithm Based on Fuzzy Logic, Fuzzy Systems and Knowledge Discovery , LectureNotes in Computer Science, Vol. 3613, pp.476, DOI: 10.1007/11539506_89.
www.intechopen.com
7/28/2019 InTech-Fuzzy Modeling of Geospatial Patte
http://slidepdf.com/reader/full/intech-fuzzy-modeling-of-geospatial-patte 23/23
Fuzzy Logic - Emerging Technologies and Applications
Edited by Prof. Elmer Dadios
ISBN 978-953-51-0337-0
Hard cover, 348 pages
Publisher InTech
Published online 16, March, 2012
Published in print edition March, 2012
InTech Europe
University Campus STeP Ri
Slavka Krautzeka 83/A
51000 Rijeka, Croatia
Phone: +385 (51) 770 447Fax: +385 (51) 686 166
www.intechopen.com
InTech China
Unit 405, Office Block, Hotel Equatorial Shanghai
No.65, Yan An Road (West), Shanghai, 200040, China
Phone: +86-21-62489820Fax: +86-21-62489821
The capability of Fuzzy Logic in the development of emerging technologies is introduced in this book. The
book consists of sixteen chapters showing various applications in the field of Bioinformatics, Health, Security,
Communications, Transportations, Financial Management, Energy and Environment Systems. This book is a
major reference source for all those concerned with applied intelligent systems. The intended readers are
researchers, engineers, medical practitioners, and graduate students interested in fuzzy logic systems.
How to reference
In order to correctly reference this scholarly work, feel free to copy and paste the following:
Alejandra A. López-Caloca and Carmen Reyes (2012). Fuzzy Modeling of Geospatial Patterns, Fuzzy Logic -
Emerging Technologies and Applications, Prof. Elmer Dadios (Ed.), ISBN: 978-953-51-0337-0, InTech,
Available from: http://www.intechopen.com/books/fuzzy-logic-emerging-technologies-and-applications/fuzzy-
modeling-of-spatial-patterns-