insurance Risk Study - Health | Aon€¦ · 3 Foreword Since the first internal Aon Benfield...
28
Insurance Risk Study Fifth Edition 2010 reDEFINING Capital | Access | Advocacy | Innovation
Transcript of insurance Risk Study - Health | Aon€¦ · 3 Foreword Since the first internal Aon Benfield...

Insurance Risk StudyFifth Edition 2010
reDEFININGCapital | Access | Advocacy | Innovation

Portfolio Risk
SystemicMarket Risk Systemic
InsuranceRisk
Naïve Model
Insurance Portfolio RiskAsset Portfolio Risk
Contents
3 | Foreword
4 | Global Risk Parameters
6 | Evaluating Solvency II Factors
8 | U.S. Risk Parameters
10 | Best of Times, Worst of Times
12 | Correlation and the Pricing Cycle
16 | Modeling Dependence
17 | Size and Correlation
18 | Macroeconomic Correlation
19 | Managing Inflation Risk
21 | Global Market Review
25 | Afterword: The Greatest Risk
About the StudyRating agencies, regulators and investors today are demanding that insurers provide detailed assessments of their risk tolerance and quantify the adequacy of their economic capital. To complete such assessments requires a credible baseline for underwriting volatility. The Insurance Risk Study provides our clients with an objective and data-driven set of underwriting volatility benchmarks by line of business and country as well as correlations by line and country. These benchmarks are a valuable resource to CROs, actuaries and other economic capital modeling professionals who seek reliable parameters for their models.
Modern portfolio theory for assets teaches that increasing the number of stocks in a portfolio will diversify and reduce the portfolio’s risk, but will not eliminate risk completely; the systemic market risk remains. This is illustrated in the left chart below. In the same way, insurers can reduce underwriting volatility by increasing portfolio volume, but they cannot reduce their volatility to zero. A certain level of systemic insurance risk will always remain, due to factors such as the underwriting cycle, macroeconomic factors, legal changes and weather (right chart below). The Study calculates this systemic risk by line of business and country. The Naïve Model on the right chart shows the relationship between risk and volume using a Poisson assumption for claim count — a textbook actuarial approach. The Study clearly shows that this assumption does not fit with empirical data for any line of business in any country. It will underestimate underwriting risk if used in an ERM model.
Number of Stocks
Port
folio
Ris
k
Volume
Insu
ran
ce R
isk

3
ForewordSince the first internal Aon Benfield Insurance Risk Study in 2003, the insurance world has been shaken by mega-catastrophes and threatened by financial market turmoil. Industry best practice in enterprise risk management has evolved almost beyond recognition, and techniques for risk quantification and capital modeling have advanced from nascent specialties into mainstream core competencies.
Yet despite change and progress, much remains constant. Risk quantification still relies fundamentally on accurate parameterization and realistic stochastic models. An incorrectly specified model is often worse than no model at all. Bad models can lead the user astray, as was shown by numerous examples during the financial crisis. Aon Benfield has consistently focused on the need to provide our clients the robust data and fact-based parameters published in this Study to complement state-of-the-art financial modeling tools such as our ReMetrica® software.
The Study is a cornerstone of Aon Benfield Analytics’ integrated and comprehensive risk modeling and risk assessment capabilities.
> Our reinsurance optimization framework, linking reinsurance to capital, relies on the Study for a credible assessment of baseline frequency and severity volatility
> Our global risk and capital strategy practice, providing ERM and economic capital services, uses the Study to benchmark risk, quantify capital adequacy and allocate capital to risk drivers
> Our ReMetrica risk evaluation and capital modeling software provides easy access to the Study parameters and risk insights
2010’s Fifth Edition has again expanded in scope and coverage from previous editions. It includes:
> Results from 46 countries, comprising more than 90 percent of global premium
> A global market review showing premium, historical loss ratio and volatility parameters for the top 50 countries
> A new approach to loss ratio volatility that measures year-over-year changes illustrating the magnitude of historical planning misses
> A focus on the potential impact of inflation on P&C companies
The massive database underlying the Study is supported by more than 450 professionals within the global Analytics team who are available to work with you to customize the basic parameters reported here to answer your specific, pressing business questions.
Aon Benfield’s Insurance Risk Study, now in its fifth edition, continues to be the industry’s leading publicly available set of risk parameters for modeling and benchmarking underwriting risk. We are pleased to offer the Study for the advancement of risk management within our industry. For convenient reference, you can find earlier editions of the Study at aonbenfield.com. I welcome your thoughts and suggestions, which you can share with an e-mail to [email protected].
Stephen Mildenhall CEO, Aon Benfield Analytics

4
Insurance Risk Study
TaiwanMexico
PeruGreece
SingaporeHong Kong
NicaraguaIndonesiaHondurasColombiaRomania
BrazilArgentina
Dominican RepublicEcuador
U.S.Slovakia
NetherlandsPoland
South KoreaHungary
BoliviaVietnam
El SalvadorUruguay
VenezuelaFranceTurkey
IndiaJapan
MalaysiaChina
CanadaChile
DenmarkU.K.
PanamaSpain
AustriaGermany
SwitzerlandItaly
AustraliaSouth Africa
Israel
NicaraguaGreece
Hong KongPanama
IndonesiaSingapore
Dominican RepublicSlovakia
South AfricaDenmarkRomaniaEcuador
HondurasEl SalvadorVenezuela
CanadaVietnam
PeruU.S.
PolandColombiaMalaysiaUruguay
BrazilIndiaChile
NetherlandsChina
U.K.Bolivia
ItalySpain
ArgentinaFrance
MexicoGermany
SwitzerlandCzech Republic
AustriaAustralia
IsraelSouth Korea
TaiwanTurkeyJapan
Hungary 8%13%
16%17%18%18%18%19%21%22%22%
25%26%27%28%28%
31%31%32%
36%37%38%38%38%
40%42%42%43%44%45%46%
51%51%53%54%54%
58%58%
62%67%
71%73%
91%92%
98%
4%5%6%7%7%7%8%8%8%9%9%9%9%9%9%10%10%11%11%11%12%12%12%13%
15%15%15%16%16%
18%18%18%18%18%
21%23%24%25%25%25%
27%29%
35%43%
46%64%
Americas Asia Pacific Europe, Middle East & Africa
Motor Property
Global Risk Parameters
The 2010 Insurance Risk Study quantifies the systemic risk by line for 46 countries worldwide, up from 26 last year. Systemic risk in the Study is the coefficient of variation of loss ratio for a large book of business. Coefficient of variation (CV) is a commonly used normalized measure of risk defined as the standard deviation divided by the mean. Systemic risk typically comes from non-diversifiable risk sources such as changing market rate adequacy, unknown prospective frequency and severity trend, weather-related losses, legal reforms and court decisions, the level of economic
activity, and other macroeconomic factors. It also includes the risk to smaller and specialty lines of business caused by a lack of credible data. For many lines of business systemic risk is the major component of underwriting volatility.
The systemic risk factors for major lines by region appear on the next page. Detailed charts comparing motor and property risk by country appear below. The factors measure the volatility of gross loss ratios. If gross loss ratios are not available the net loss ratio is used.
Coefficient of Variation of Gross Loss Ratio by Country

5
Aon Benfield
Underwriting Volatility for Major Lines by Country, Coefficient of Variation of Loss Ratio for Each Line
Mot
or
Mot
or -
Pe
rson
al
Mot
or -
C
omm
erci
al
Prop
erty
Prop
erty
-
Pers
onal
Prop
erty
-
Com
mer
cial
Gen
eral
Li
abili
ty
Acc
iden
t
& H
ealt
h
Mar
ine,
A
viat
ion
&
Tra
nsi
t
Wor
kers
C
omp
ensa
tion
Cre
dit
Fid
elit
y
& S
uret
y
Americas
Argentina 9% 51% 61% 116% 164%Bolivia 10% 38% 18%Brazil 12% 53% 48% 60% 57% 45% 43% 58%Canada 18% 26% 18% 41% 37% 43% 72% 110% 116%Chile 12% 25% 51% 65%Colombia 15% 54% 55% 57% 71%Dominican Republic 25% 51% 120% 64%Ecuador 21% 46% 49% 178%El Salvador 18% 38% 21% 100%Honduras 18% 58% 5% 193%Mexico 9% 92% 65% 43%Nicaragua 64% 62% 91% 107%Panama 35% 21% 24% 103%Peru 16% 91% 60% 7% 21% 68% 77%Uruguay 13% 37% 124%U.S. 16% 14% 24% 45% 51% 34% 37% 52% 39% 28% 70%
Venezuela 18% 36% 23% 160%
Asia Pacific
Australia 8% 16% 23% 32% 54% 10% 30%China 11% 11% 27% 31% 19% 16% 113%Hong Kong 43% 44% 67% 82% 24% 60% 81%India 12% 12% 31% 14% 31%Indonesia 29% 29% 58% 124% 56% 72% 55% 92%Japan 5% 28% 10% 8% 17% 7%Malaysia 15% 28% 126% 30% 40% 88%Singapore 27% 71% 52% 57% 46%South Korea 7% 7% 42% 32% 55%Taiwan 7% 7% 98% 53% 33% 71% 44%Vietnam 18% 38% 41% 11% 38%
Europe, Middle East & Africa
Austria 8% 18% 12% 52% 21% 13% 21% 51%
Czech Republic 8%
Denmark 24% 22% 18% 33% 18% 16% 39% 23%
France 9% 32% 35% 26% 30% 25% 57%
Germany 9% 18% 20% 31% 29% 14% 22% 43%
Greece 46% 73% 81% 81%
Hungary 4% 40%
Israel 7% 8% 53%
Italy 10% 17% 25% 12% 46% 40% 72%
Netherlands 11% 43% 26% 49% 54% 41%
Poland 15% 42%
Romania 23% 54%
Slovakia 25% 44%
South Africa 25% 13% 61% 33% 46%
Spain 9% 19% 10% 23% 30% 13% 34% 48% 97%
Switzerland 9% 18% 21% 7% 50% 73%
Turkey 6% 10% 31% 44% 36% 15% 93% 52%
U.K. 11% 10% 18% 22% 21% 26% 30% 8% 67%
Reported CVs are of gross loss ratios, except for Argentina, Australia, Bolivia, Chile, Ecuador, India, Malaysia, Singapore, Uruguay, and Venezuela, which are of net loss ratios.
Accident & Health is defined differently in each country; it may include pure accident A&H coverage, credit A&H, and individual or group A&H. In the U.S., A&H comprises about 80 percent of the ”Other” line of business with the balance of the line being primarily credit insurance.

6
Insurance Risk Study
Solvency II is scheduled to take effect no later than January 1, 2013. The fifth quantitative impact study (QIS 5) is in progress with a deadline of October 2010 for individual insurers and mid-November 2010 for groups.
QIS 5 is likely the key test for most insurers across Europe. The Standard Formula factors were designed to be appropriate for the entire market — meaning a typical company of average size — so larger insurers with greater diversification will find the formula generates conservative capital requirements. Moreover, in QIS 5, the formula reflects added concerns that emerged from the 2008 financial crisis. Insurers now have heightened incentives to develop full or partial internal models as an alternative to the Solvency II Standard Formula.
At this stage, the most important aspect of preparing for Solvency II is correct parameterization, driven by access to data. Insurers may face serious challenges to their IT systems. They will need some reference point as they undertake the various Solvency II tests: evaluating the statistical quality of the data, calibrating and validating the models they are using.
The non-life Solvency Capital Requirement (SCR) is predominantly driven by premium risk, reserve risk and catastrophe risk. Since many companies with catastrophe exposure purchase excess of loss reinsurance, premium and reserve risk will be the key drivers of capital.
Solvency II vs. Insurance Risk StudyThere are four key differences between the Solvency II factors and those in the Insurance Risk Study.
Key Differences
Standard Deviations vs. Coefficients of Variation
In Solvency II, the premium risk factors are calculated as standard deviations of historical loss ratios. Within the Standard Formula, these standard deviations are applied on the total volume of premium rather than to the premium net of loadings for costs, commissions and profit.
Whether this overestimates the risk, and thus the capital requirement, depends on the company and the line of business. Certainly the Regulator has made some conservative assumptions: expenses are assumed to have the same volatility as the losses, and no profit is assumed over the cycle. If insurers disagree with these assumptions they must apply for a partial internal model.
One-Year Emergence vs. View of Ultimate
The Standard Formula premium risk factors and the corresponding Insurance Risk Study factors appear below. For ease of comparison, we have restated our factors as standard deviations rather than coefficients of variation.
Non-Life Premium Risk, Gross of Reinsurance
The factors proposed by CEIOPS and those used in the QIS 5 exercise can be made comparable with the factors in this Study through appropriate adjustments. If we use Motor TPL as an example, the CV in this Study corresponds to a standard deviation of 12.0 percent. The Study standard deviation is calculated from an ultimate perspective. We can use the same dataset that was used in our analysis to recalculate it from a one-year perspective, producing a standard deviation of 8.7 percent. Finally, the Study parameter reflects the non-diversifiable premium risk for a large insurance company whereas the QIS 5 parameters used in the Standard Formula represent an average-sized insurance company. As expected the QIS 5 parameter, 10.0 percent, is higher than systemic-only parameter of 8.7 percent for motor TPL.
Solvency II Insurance Risk Study
Standard deviations of gross loss ratios
Coefficients of variation of gross loss ratios
Based on loss ratios at end of first year
Based on ultimate loss ratios
Excludes catastrophe risk Includes catastrophe risk
Average-sized company, parameter and process risk
Large company, parameter risk only
QIS 5 CEIOPS Risk Study
Line StDev StDev # Obs StDev # Obs
Motor — TPL 10.0% 11.5% 209 12.0% 4,631
Motor — Other 7.0% 8.5% 107 n/a n/a
Marine, Aviation & Transit
17.0% 23.0% 37 29.6% 2,623
Fire 10.0% 15.0% 138 17.4% 4,751
General Liability 15.0% 17.5% 101 19.9% 3,443
Credit 21.5% 28.0% 58 27.6% 570
Evaluating Solvency II Factors

7
Aon Benfield
Solvency II Correlation CoefficientsNot surprisingly, correlation will be an important determinant of capital requirements.
Solvency II Correlation Coefficients
These coefficients are more conservative than we would derive from calculating linear correlation since they must consider nonlinear tail correlation. The factors applied were derived mainly from an analysis of German market data for the years 1998 through 2002. As an example, for the correlation between motor TPL and general liability, the average correlation was 28 percent using the data of 89 firms and 1,269 observations. The final coefficient selected was 50 percent, as seen above.
In this case, we find that the Solvency II correlations are significantly higher than many of the observed correlations for European insurers. The correlation matrix for Germany appears below, and corresponds to the larger matrix on page 13 of this Study.
Insurance Risk Study — Germany
S2Metrica: ReMetrica Modeling for Proposed Solvency IIDeveloping an internal model can be a significant investment of time and resources. To assist our clients, Aon Benfield has developed S2MetricaSM, a standalone tool built on ReMetrica® technology. S2Metrica builds a simplified internal model from QIS 5 inputs, supplemented with details about large losses, cat losses, reinsurance, and the asset portfolio. It also has a built-in economic scenario generator. Standard output reports include:
> Profit and loss accounts for different return periods
> Year-end balance sheets
> Comparisons between Standard Formula capital requirements and those generated by the S2Metrica internal model
Using S2Metrica, clients can quickly construct a competent baseline model, freeing them to focus on critical tasks such as parameterization and appropriate customization.
ReMetrica is Aon Benfield’s innovative financial modeling tool and the engine of S2Metrica. Insurers increasingly turn to financial modeling to help them achieve their corporate objectives. Each insurer has its own distinct objectives, risks, corporate structure, and reinsurance strategy.
Using the ReMetrica software platform, insurers can build adaptable and flexible models that capture their risks better than the Solvency II Standard Formula and fully recognize their risk mitigation strategies. In particular, ReMetrica allows insurers to:
> Create ”off-the-shelf” internal models that cover both assets and liabilities
> Use customizable templates to monitor internal metrics and Solvency II requirements such as Fair Value and SCR
> Model highly customized reinsurance structures
> Integrate partial models, such as non-life and health lines, in a full internal model covering all aspects of the balance sheet
The combination of the Insurance Risk Study with ReMetrica allows our clients to parameterize their models in an optimal way and to make informed decisions about risk transfer through reinsurance or the capital markets.
Mot
or -
TP
L
Mot
or -
O
ther
Mar
ine,
A
viat
ion
&
Tra
nsi
t
Fire
Gen
eral
Li
abili
ty
Cre
dit
Motor — TPL 50% 50% 25% 50% 25%
Motor — Other 50% 25% 25% 25% 25%
Marine, Aviation & Transit
50% 25% 25% 25% 25%
Fire 25% 25% 25% 25% 25%
General Liability 50% 25% 25% 25% 50%
Credit 25% 25% 25% 25% 50%
Mot
or
Mar
ine,
A
viat
ion
&
Tra
nsi
t
Prop
erty
Gen
eral
Li
abili
ty
Cre
dit
Motor 20% 7% 6% 26%
Marine, Aviation & Transit
20% 22% 10% 45%
Property 7% 22% 0% 31%
General Liability 6% 10% 0% -3%
Credit 26% 45% 31% -3%

8
Insurance Risk Study
Financial Guaranty
Special Property
Products Liability – Claims-Made
Reinsurance – Financial
Reinsurance – Property
Fidelity & Surety
International
Reinsurance – Liability
Other
Homeowners
Products Liability – Occurrence
Other Liability – Claims-Made
Medical PL – Claims-Made
Special Liability
Other Liability – Occurrence
Commercial Multi Peril
Medical PL – Occurrence
Warranty
Workers Compensation
Commercial Auto
Auto Physical Damage
Private Passenger Auto 14%
17%
24%
28%
31%
32%
34%
37%
39%
40%
43%
47%
51%
52%
67%
68%
70%
85%
91%
102%
104%
163%
13%
15%
17%
19%
31%
32%
27%
25%
29%
28%
29%
32%
43%
49%
45%
54%
54%
54%
59%
47%
62%
106%
Coefficient of Variation of Gross Loss Ratio | 1992-2009
Impact of the Pricing Cycle
Line Impact of the Pricing Cycle
Reinsurance — Liability 50%
Other Liability — Occurrence 47%
Other Liability — Claims-Made 47%
Workers Compensation 46%
Medical PL — Claims-Made 43%
Commercial Auto 42%
Special Liability 33%
Commercial Multi Peril 24%
Homeowners 21%
Private Passenger Auto 9%
All Risk No Underwriting Cycle Risk
U.S. Risk ParametersThe U.S. portion of the Insurance Risk Study uses data from nine years of NAIC annual statements for 2,265 individual groups and companies. The database covers all 22 Schedule P lines of business and contains 1.4 million records of individual company observations from accident years 1992-2009.
The charts below show the loss ratio volatility for each Schedule P line, with and without the effect of the underwriting cycle. The effect of the underwriting cycle is removed by normalizing loss ratios by accident year prior to computing volatility. This adjustment decomposes loss ratio volatility into its loss and premium components.
The U.S. Underwriting CycleVolatility for most lines of business is increased by the insurance underwriting and pricing cycle. The underwriting cycle acts simultaneously across many lines of business, driving correlation between the results of different lines and amplifying the effect of underwriting risk to primary insurers and reinsurers. Our analysis demonstrates that the cycle increases volatility substantially for all major commercial lines, as shown in the table. For example, the underwriting volatility of other liability increases by 47 percent, workers compensation by 46 percent, medical professional liability by 43 percent, and commercial auto liability by 42 percent.

9
Aon Benfield
U.S. Reserve Volatility by Line
Ultimate reserve CV calculated using the Mack method applied to industry paid triangles by line. One-year reserve CV uses the Merz Wuthrich method. Both methods adjusted to account for reserves more than 10 years old.
Line Reserve to Premium Ratio
% Reserves Over 10 Yrs Old
Ultimate Reserve CV
One Year Reserve CV
% CV Emerging in
One Year
One Year Combined
Ratio ImpactHomeowners 0.3 1.0% 5.1% 4.8% 94.0% 1.5%
Private Passenger Auto 0.9 4.0% 2.1% 1.7% 79.1% 1.5%
Commercial Auto 1.5 4.9% 2.5% 1.8% 69.4% 2.6%
Commercial Multi Peril 1.2 9.0% 4.6% 3.8% 81.4% 4.6%
Workers Compensation 3.4 26.0% 3.3% 2.2% 66.0% 7.5%
Medical PL - CM 2.5 2.7% 5.1% 4.0% 78.9% 10.0%
Other Liability - Occ 3.4 26.2% 5.2% 3.2% 62.1% 10.8%
Other Liability - CM 2.5 2.3% 6.3% 5.1% 79.7% 12.8%
Products Liability - Occ 7.0 47.4% 9.9% 5.0% 50.9% 35.1%
Industry Reserve Adequacy: How Long Can Favorable Development Continue?
U.S. P&C industry reserves continue to show redundancy at the end of 2009. Standard actuarial reserving methods applied to the industry Schedule P indicate that there is approximately $22 billion of excess reserves across all lines of business.
The market is unlikely to harden again as long as the industry has more than adequate reserves according
to these metrics. Calendar years 2007, 2008 and 2009 saw favorable reserve development, helping to prolong soft market conditions. We estimate that reserve redundancies will be depleted in two to three years if favorable development continues at the pace it has from 2007 to 2009.
A summary of adequacy by major market segments appears below.
U.S. Reserve Estimated Adequacy ($B)
Line Estimated Reserves
Booked Reserves
Favorable/(Adverse) Development Remaining Redundancy
Years at Run Rate2007 2008 2009 Average
Personal Lines 123.0 129.0 5.9 5.4 5.8 5.7 6.0 1.1
Commercial Property 37.9 41.7 1.7 2.6 2.4 2.2 3.8 1.7
Commercial Liability 223.1 237.3 1.0 5.2 3.8 3.3 14.2 4.3
Workers Compensation 114.8 114.0 1.0 1.1 (0.5) 0.6 (0.8) n/a
Total Excl. Financial Guaranty 498.7 522.0 9.5 14.4 11.5 11.8 23.2 2.0
Financial Guaranty 34.1 32.8 (1.2) (12.6) 7.0 (2.3) (1.4) n/a
Total 532.9 554.7 8.3 1.7 18.6 9.5 21.9 2.3
Reserve Risk and LeverageInsurers face two sources of risk from reserves. The first source is volatility of reserve values over time to settlement. The second source comes from leverage. The longer the average duration of the claim payout, the larger the reserve balance becomes relative to the premium base. As reserve leverage increases, the sensitivity of calendar year combined ratio results compared to changes in reserve balances magnifies.
The first source of volatility has traditionally been measured with methods such as the Mack method, which calculates the volatility of the link ratio estimate of ultimate losses coming from a loss triangle. More recently, Merz and Wuthrich have published a methodology that calculates the same estimate, but over a one-year time horizon to be consistent with Solvency II. Using these methods, we can estimate the total reserve volatility and how much of that volatility is
expected to emerge in the next 12 months. We can also estimate the potential impact of reserve volatility on next year’s combined ratio.
Using the U.S industry aggregate workers compensation paid triangle as an example, the total reserve volatility is estimated at 3.3 percent based on an adjusted Mack method. The one-year reserve volatility is 2.2 percent based on an adjusted Merz Wuthrich method, meaning that 66 percent of the triangle’s volatility emerges in one development year. The Mack and Merz Wuthrich methods were both adjusted to account for reserves more than 10 years old. With reserves levered at 3.4 times premium, the impact on combined ratio of a one standard deviation change is 7.5 points. For a normal distribution a one standard deviation move, up or down, is a one in three year event.
10
Insurance Risk Study
Oth
er
Fina
ncia
l G
uara
nty
Rein
sura
nce
- Pr
oper
ty
Inte
rnat
iona
l
Spec
ial P
rop
erty
Hom
eow
ners
Rein
sura
nce
- Fi
nanc
ial
Prod
ucts
Lia
bilit
y -
CM
Spec
ial L
iabi
lity
Prod
ucts
Lia
bilit
y -
Occ
Rein
sura
nce
- Li
abili
ty
Oth
er L
iabi
lity
- C
M
Fide
lity
& S
uret
y
Oth
er L
iabi
lity
- O
cc
Med
ical
PL
- O
cc
Com
mer
cial
M
ulti
Peril
Med
ical
PL
- C
M
Wor
kers
Com
p
Com
mer
cial
Aut
o
Priv
ate
Aut
o
Aut
o Ph
ys.
Dam
age
9% 14% 18% 23% 29% 36% 38% 39% 42% 44% 45% 48% 51% 56% 66% 67% 73% 78%
125%170% 499%
-12% -18% -25% -25%-41% -46% -52% -41% -32%
-72% -64% -67% -67%-93%
-123%
-79%
-262%
-81%
-185%
-87%
-41%
Biggest Increase (Deteriorating Results)
Biggest Decrease (Improving Results)
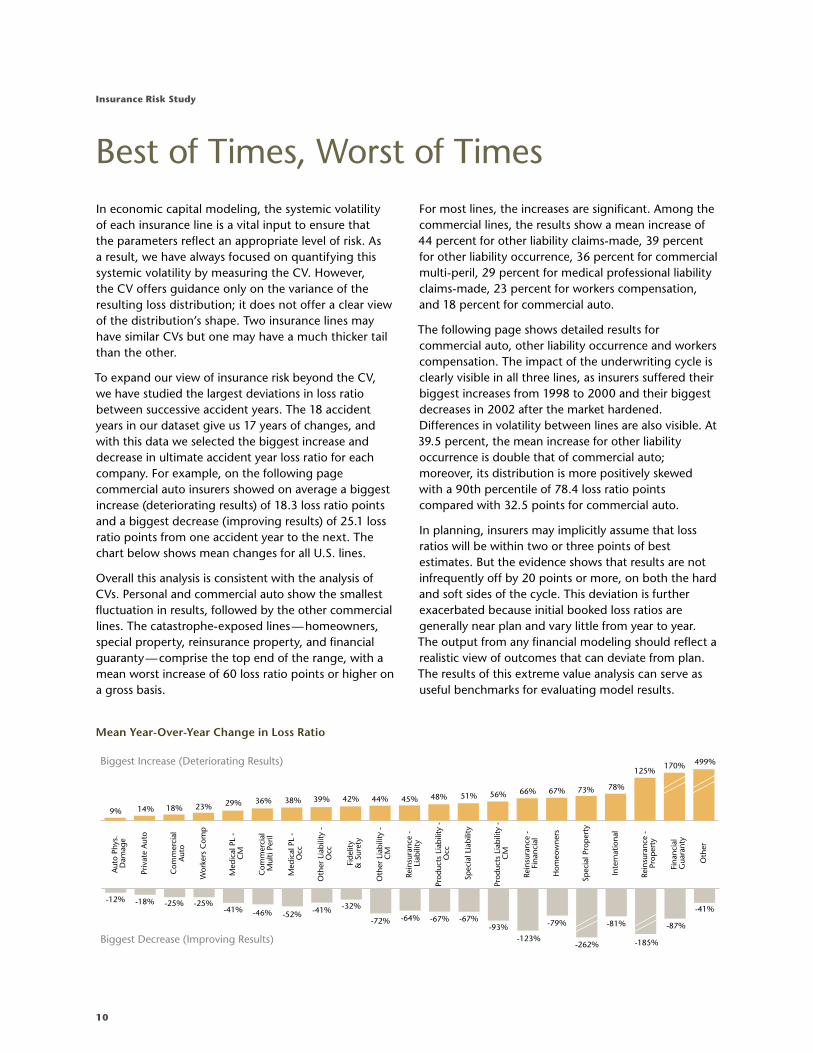
Mean Year-Over-Year Change in Loss Ratio
Best of Times, Worst of TimesIn economic capital modeling, the systemic volatility of each insurance line is a vital input to ensure that the parameters reflect an appropriate level of risk. As a result, we have always focused on quantifying this systemic volatility by measuring the CV. However, the CV offers guidance only on the variance of the resulting loss distribution; it does not offer a clear view of the distribution’s shape. Two insurance lines may have similar CVs but one may have a much thicker tail than the other.
To expand our view of insurance risk beyond the CV, we have studied the largest deviations in loss ratio between successive accident years. The 18 accident years in our dataset give us 17 years of changes, and with this data we selected the biggest increase and decrease in ultimate accident year loss ratio for each company. For example, on the following page commercial auto insurers showed on average a biggest increase (deteriorating results) of 18.3 loss ratio points and a biggest decrease (improving results) of 25.1 loss ratio points from one accident year to the next. The chart below shows mean changes for all U.S. lines.
Overall this analysis is consistent with the analysis of CVs. Personal and commercial auto show the smallest fluctuation in results, followed by the other commercial lines. The catastrophe-exposed lines — homeowners, special property, reinsurance property, and financial guaranty — comprise the top end of the range, with a mean worst increase of 60 loss ratio points or higher on a gross basis.
For most lines, the increases are significant. Among the commercial lines, the results show a mean increase of 44 percent for other liability claims-made, 39 percent for other liability occurrence, 36 percent for commercial multi-peril, 29 percent for medical professional liability claims-made, 23 percent for workers compensation, and 18 percent for commercial auto.
The following page shows detailed results for commercial auto, other liability occurrence and workers compensation. The impact of the underwriting cycle is clearly visible in all three lines, as insurers suffered their biggest increases from 1998 to 2000 and their biggest decreases in 2002 after the market hardened. Differences in volatility between lines are also visible. At 39.5 percent, the mean increase for other liability occurrence is double that of commercial auto; moreover, its distribution is more positively skewed with a 90th percentile of 78.4 loss ratio points compared with 32.5 points for commercial auto.
In planning, insurers may implicitly assume that loss ratios will be within two or three points of best estimates. But the evidence shows that results are not infrequently off by 20 points or more, on both the hard and soft sides of the cycle. This deviation is further exacerbated because initial booked loss ratios are generally near plan and vary little from year to year. The output from any financial modeling should reflect a realistic view of outcomes that can deviate from plan. The results of this extreme value analysis can serve as useful benchmarks for evaluating model results.

11
Aon Benfield
0
0.1
0.2
0.3
0.4
Biggest IncreaseBiggest Decrease
100%50% 150%-100%-150% -50% 0%
0
0.1
0.2
0.3
0.4
0.5
0.6
100%50% 150%-100%-150% -50% 0%
0
0.1
0.2
0.3
0.
100%50% 150%-100%-150% -50% 0%
2009
2008
2007
2006
2005
2004
2003
2002
2001
2000
1999
1998
1997
1996
1995
1994
1993
0.3
0.2
0.1
0.0
0.0
0.1
0.2
0.3
2009
2008
2007
2006
2005
2004
2003
2002
2001
2000
1999
1998
1997
1996
1995
1994
1993
0.3
0.2
0.1
0.0
0.0
0.1
0.2
0.3
2009
2008
2007
2006
2005
2004
2003
2002
2001
2000
1999
1998
1997
1996
1995
1994
1993
0.3
0.2
0.1
0.0
0.0
0.1
0.2
0.3
Commercial Auto
Other Liability - Occurrence
Workers Compensation
Frequency by Accident Year
Frequency by Accident Year
Frequency by Accident Year
Year-Over-Year Change in Gross Loss Ratio
Probability Density
Probability Density
Probability Density
Biggest Increase
Mean 18.3%Median 15.1%90th %ile 32.5%
Biggest Increase
Mean 39.5%Median 24.8%90th %ile 78.4%
Biggest Increase
Mean 23.1%Median 20.1%90th %ile 38.9%
Biggest Decrease
Mean -25.1%Median -20.1%90th %ile -45.2%
Biggest Decrease
Mean -40.8%Median -27.4%90th %ile -71.5%
Biggest Decrease
Mean -25.0%Median -20.5%90th %ile -46.0%

12
Insurance Risk Study
China
Acc
iden
t
& H
ealt
h
Ag
ricu
ltur
e
Cre
dit
Eng
inee
rin
g
Gen
eral
Li
abili
ty
Mar
ine,
A
viat
ion
&
Tra
nsi
t
Mot
or
Prop
erty
Accident & Health 24% 31% 39% 53% 38% 59% 56%
Agriculture 24% 53% n/a 29% 9% 16% -4%
Credit 31% 53% n/a 18% 18% 34% 25%
Engineering 39% n/a n/a 68% 38% 64% 28%
General Liability 53% 29% 18% 68% 29% 62% 54%
Marine, Aviation & Transit 38% 9% 18% 38% 29% 41% 24%
Motor 59% 16% 34% 64% 62% 41% 59%
Property 56% -4% 25% 28% 54% 24% 59%
Australia
Gen
eral
Li
abili
ty
Mar
ine,
A
viat
ion
&
Tra
nsi
t
Mot
or
Prop
erty
Wor
kers
C
omp
General Liability 19% 21% -24% 21%
Marine, Aviation & Transit 19% 31% -3% 21%
Motor 21% 31% 25% 14%
Property -24% -3% 25% -6%
Workers Comp 21% 21% 14% -6%
Correlation and the Pricing CycleCorrelation of Underwriting ResultsCorrelation between different lines of business is central to a realistic assessment of aggregate portfolio risk, and, in fact, becomes increasingly significant as companies grow in size. Modeling is invariably performed using an analysis-synthesis paradigm: analysis is carried out at the product or business unit level and then aggregated to the company level. In most applications, results are more significantly impacted by the correlation and dependency assumptions made during the synthesis step than by all the detailed assumptions made during the analysis step.
The Study determines correlations between lines within each country and also between countries. Although not shown here, we have also calculated confidence intervals for each correlation coefficient.
Correlation between LinesCorrelation between lines is computed by examining the results from larger companies that write pairs of lines in the same country. The following tables show a sampling of the results available for Australia, China, Germany, Japan, the U.K., and the U.S.
Correlation is a measure of association between two random quantities. It varies between -1 and +1, with +1 indicating a perfect increasing linear relationship and -1 a perfect decreasing relationship. The closer the coefficient is to either +1 or -1 the stronger the linear association between the two variables. A value of 0 indicates no linear relationship whatsoever.
All correlations in the Study are estimated using the Pearson sample correlation coefficient.
In each table the correlations shown in bold are statistically different from zero at the 90 percent confidence level.

13
Aon Benfield
U.S.
Com
mer
cial
A
uto
Com
mer
cial
M
ulti
Per
il
Hom
eow
ner
s
Med
ical
M
alp
ract
ice
CM
Oth
er L
iab
ility
C
M
Oth
er L
iab
ility
O
cc
Pers
onal
Aut
o Li
abili
ty
Prod
ucts
Li
abili
ty
Occ
Wor
kers
C
omp
Commercial Auto 53% 8% 73% 44% 67% 28% 72% 63%
Commercial Multi Peril 53% 21% 56% 41% 48% 28% 40% 42%
Homeowners 8% 21% 1% -2% -1% 8% 14% -7%
Medical Malpractice CM 73% 56% 1% 72% 78% 58% 76% 71%
Other Liability CM 44% 41% -2% 72% 57% 42% 29% 62%
Other Liability Occ 67% 48% -1% 78% 57% 33% 66% 63%
Personal Auto Liability 28% 28% 8% 58% 42% 33% 42% 33%
Products Liability Occ 72% 40% 14% 76% 29% 66% 42% 63%
Workers Comp 63% 42% -7% 71% 62% 63% 33% 63%
U.K.
Acc
iden
t
& H
ealt
h
Com
mer
cial
Li
nes
Lia
bili
ty
Com
mer
cial
M
otor
Com
mer
cial
Pr
oper
ty
Fin
anci
al L
oss
Hou
seh
old
&
Dom
esti
c
Priv
ate
Mot
or
Accident & Health 47% n/a 55% -49% 15% 55%
Commercial Lines Liability 47% 72% 40% 69% 49% 56%
Commercial Motor n/a 72% 51% -9% -14% 61%
Commercial Property 55% 40% 51% 33% 57% 39%
Financial Loss -49% 69% -9% 33% 16% -15%
Household & Domestic 15% 49% -14% 57% 16% 30%
Private Motor 55% 56% 61% 39% -15% 30%
Japan
Acc
iden
t
& H
ealt
h
Gen
eral
Li
abili
ty
Mar
ine,
A
viat
ion
&
Tra
nsi
t
Mot
or
Prop
erty
Wor
kers
C
omp
Accident & Health 27% 1% 50% 42% 53%
General Liability 27% 0% 3% 32% 28%
Marine, Aviation & Transit 1% 0% 16% 33% -4%
Motor 50% 3% 16% 61% 43%
Property 42% 32% 33% 61% 32%
Workers Comp 53% 28% -4% 43% 32%
Germany
Acc
iden
t
& H
ealt
h
Ass
ista
nce
Cre
dit
Gen
eral
Li
abili
ty
Leg
al
Prot
ecti
on
Mar
ine,
A
viat
ion
&
Tra
nsi
t
Mot
or
Prop
erty
Accident & Health 62% -37% 10% -13% -13% -12% -3%
Assistance 62% n/a -40% 39% 83% -6% -40%
Credit -37% n/a -3% -24% 45% 26% 31%
General Liability 10% -40% -3% -10% 10% 6% 0%
Legal Protection -13% 39% -24% -10% -48% 20% -21%
Marine, Aviation & Transit -13% 83% 45% 10% -48% 20% 22%
Motor -12% -6% 26% 6% 20% 20% 7%
Property -3% -40% 31% 0% -21% 22% 7%

14
Insurance Risk Study
Europe - Motor
Aus
tria
Belg
ium
Fran
ce
Ger
man
y
Ital
y
Net
her
lan
ds
Nor
way
Spai
n
Swit
zerl
and
Uni
ted
Kin
gd
om
Austria 52% 64% 65% 38% 87% 44% -12% 82% 12%
Belgium 52% 63% 79% 63% 45% 61% -41% 7% 34%
France 64% 63% 59% 41% 54% 45% -33% 49% 23%
Germany 65% 79% 59% 7% 54% 35% -29% 23% 10%
Italy 38% 63% 41% 7% -5% 71% -41% 17% 62%
Netherlands 87% 45% 54% 54% -5% 37% 1% 80% -19%
Norway 44% 61% 45% 35% 71% 37% -47% 41% 32%
Spain -12% -41% -33% -29% -41% 1% -47% 30% 7%
Switzerland 82% 7% 49% 23% 17% 80% 41% 30% -2%
United Kingdom 12% 34% 23% 10% 62% -19% 32% 7% -2%
Asia Pacific - Motor
Aus
tral
ia
Ch
ina
Hon
g Ko
ng
Ind
ia
Jap
an
Mal
aysi
a
Russ
ia
Sin
gap
ore
Sout
h Ko
rea
Taiw
an
Australia 63% 54% 44% -35% -49% 82% 8% -34% 21%
China 63% 24% -3% -7% 14% -30% -10% -20% 12%
Hong Kong 54% 24% 55% -46% -46% 5% 37% -67% -23%
India 44% -3% 55% -45% -32% 97% 13% -34% 33%
Japan -35% -7% -46% -45% 50% 85% -2% 68% -3%
Malaysia -49% 14% -46% -32% 50% 72% -8% 41% 33%
Russia 82% -30% 5% 97% 85% 72% 14% -35% -81%
Singapore 8% -10% 37% 13% -2% -8% 14% -35% -37%
South Korea -34% -20% -67% -34% 68% 41% -35% -35% 34%
Taiwan 21% 12% -23% 33% -3% 33% -81% -37% 34%
Americas - Motor
Arg
enti
na
Bra
zil
Can
ada
Ch
ile
Col
omb
ia
Mex
ico
Peru
Puer
to R
ico
Uni
ted
Stat
es
Ven
ezue
la
Argentina 49% -62% -71% -14% 23% 10% -13% -14% -28%
Brazil 49% -18% -5% -26% -3% -51% 34% 34% 32%
Canada -62% -18% 61% 22% -24% -27% 10% 85% 43%
Chile -71% -5% 61% 14% -13% -31% 14% 20% -4%
Colombia -14% -26% 22% 14% -28% 16% 37% 34% -5%
Mexico 23% -3% -24% -13% -28% 6% -47% -24% -58%
Peru 10% -51% -27% -31% 16% 6% -18% -21% -32%
Puerto Rico -13% 34% 10% 14% 37% -47% -18% 41% 7%
United States -14% 34% 85% 20% 34% -24% -21% 41% 41%
Venezuela -28% 32% 43% -4% -5% -58% -32% 7% 41%
Correlation between CountriesIn addition to correlation between lines of business, global insurers must also consider the correlation of business written in different countries. We estimated these correlation coefficients based on country-level loss ratios by line by year. The following tables show results by region for motor and liability lines.

15
Aon Benfield
Europe - Liability
Aus
tria
Belg
ium
Den
mar
k
Fran
ce
Ger
man
y
Ital
y
Nor
way
Spai
n
Swit
zerl
and
Uni
ted
Kin
gd
om
Austria -46% 55% 86% 88% 49% 19% -36% 29% 65%
Belgium -46% -29% -54% -35% -43% 21% -81% 13% -31%
Denmark 55% -29% 65% 60% 71% 16% 10% 29% 36%
France 86% -54% 65% 90% 61% 16% -26% 32% 59%
Germany 88% -35% 60% 90% 54% 5% -41% 27% 65%
Italy 49% -43% 71% 61% 54% 20% 15% 26% 5%
Norway 19% 21% 16% 16% 5% 20% -39% 3% 4%
Spain -36% -81% 10% -26% -41% 15% -39% -24% 12%
Switzerland 29% 13% 29% 32% 27% 26% 3% -24% 10%
United Kingdom 65% -31% 36% 59% 65% 5% 4% 12% 10%
Asia Pacific - Liability
Aus
tral
ia
Ch
ina
Hon
g Ko
ng
Jap
an
Mal
aysi
a
Russ
ia
Sin
gap
ore
Sout
h Ko
rea
Taiw
an
Australia 81% 46% -33% -11% -15% -30% 6% 32%
China 81% 36% -13% 22% 36% 91% -28% 17%
Hong Kong 46% 36% 1% -9% 2% -31% -15% -28%
Japan -33% -13% 1% 45% 7% 72% -3% 20%
Malaysia -11% 22% -9% 45% -57% 70% -35% 26%
Russia -15% 36% 2% 7% -57% -60% 65% 47%
Singapore -30% 91% -31% 72% 70% -60% -74% 10%
South Korea 6% -28% -15% -3% -35% 65% -74% 6%
Taiwan 32% 17% -28% 20% 26% 47% 10% 6%
Americas - Liability
Arg
enti
na
Bra
zil
Can
ada
Ch
ile
Col
omb
ia
Mex
ico
Peru
Puer
to R
ico
Uni
ted
Stat
es
Ven
ezue
la
Argentina 33% 18% -5% -67% 6% 3% 49% 30% 2%
Brazil 33% 33% 18% -59% 22% 15% 75% 72% -7%
Canada 18% 33% -17% -32% 25% 24% 26% 81% 5%
Chile -5% 18% -17% -28% 44% -12% 26% -1% 31%
Colombia -67% -59% -32% -28% -18% -26% -76% -67% -23%
Mexico 6% 22% 25% 44% -18% -3% 14% 23% -20%
Peru 3% 15% 24% -12% -26% -3% 0% 44% -18%
Puerto Rico 49% 75% 26% 26% -76% 14% 0% 69% 2%
United States 30% 72% 81% -1% -67% 23% 44% 69% 18%
Venezuela 2% -7% 5% 31% -23% -20% -18% 2% 18%

16
Insurance Risk Study
Dependence is a core component of economic capital modeling. Risk managers frequently discuss correlation, and this Study includes numerous correlation matrices. But correlation alone does not fully describe dependence. There are many ways to combine two variables to have the same linear correlation coefficient. For example, the familiar symmetric, elliptical contours of the normal copula can have the same linear correlation as a more pinched distribution, and pinching can occur either on the left, the right or both sides. The impact of dependence is most clearly seen in the distribution of the sum (or portfolio return) of the two variables, with extreme tail correlation producing an aggregate distribution with much fatter tails.
Variables in financial markets often exhibit such extreme tail correlation, as seen in the left chart below. In this plot, the outliers at the 10.0 percent and 1.0 percent significance levels assuming a multivariate normal distribution comprise 11.9 percent and 2.1 percent of the observations. This kind of behavior has led many analysts to reject the normal distribution as a model for dependence.
Academics and risk managers have introduced many different copulas as means of modeling dependence with flexible tail behavior. But the appropriateness of different copulas for insurance losses has been less well tested.
Our study of U.S. data shows that apart from correlation driven by property catastrophe events there is little evidence of multi-line extreme correlation. The right chart below compares results for other liability occurrence and workers compensation. In this case, the outliers at the 10.0 percent and 1.0 percent significance levels assuming multivariate normal distribution represent 10.9 percent and 1.0 percent of the observations — well within expectations. Analysis of other U.S. lines shows similar results.
There is still the possibility that events with long return periods are not shown in our 18-year data sample — for example, the impact of asbestos on other liability occurrence and products liability. We may yet observe extreme tail correlation in insurance results. But its absence during the past 18 years suggests that it is not nearly as commonplace as in financial markets.
We conclude that while the traditional approach to modeling dependence using the normal copula has known limitations, it is not rejected by the data as a model for correlation between non-catastrophe insurance lines. Catastrophe simulation models address this issue for catastrophe lines by including correlation as a model output.
Normal Transformed Data
-3.0
-2.0
-1.0
0
1.0
2.0
3.0
-3.0 -2.0 -1.0 0 1.0 2.0 3.0
Normal Transformed Data
-3.0
-2.0
-1.0
0
1.0
2.0
3.0
-3.0 -2.0 -1.0 0 1.0 2.0 3.0
Daily Stock Returns of Two Financial Stocks Through the Crisis
Products Liability Occurrence vs. Workers Compensation
Modeling Dependence

17
Aon Benfield
Size and Correlation
0
0.1
0.2
0.3
0.4
0.5
0.6
0.7
0.8
0.9
1.0
10 100 1,000 10,000
Size Threshold, $M
Cor
rela
tion
Abo
ve T
hres
hold
Correlation
Risk Study Coefficient
0
0.1
0.2
0.3
0.4
0.5
0.6
0.7
0.8
0.9
1.0
10 100 1,000 10,000
Size Threshold, $M
Cor
rela
tion
Abo
ve T
hres
hold
Correlation
Risk Study Coefficient
Workers Compensation vs. Other Liability — Occurrence Commercial Auto vs. Other Liability — Occurrence
The table below shows the measured correlation coefficients at different premium thresholds between U.S. Schedule P lines. In each case, both premium amounts exceed the threshold.
Line of Business Correlation by Premium Size Threshold
Line A Line B $25M $50M $100M $250M $500M $1,000M Homeowners Private Passenger Auto 10% 11% 8% 17% 33% 33%
Commercial Multi Peril Commercial Auto 33% 37% 53% 55% 73% 58%
Commercial Multi Peril Workers Compensation 27% 31% 42% 48% 48% 59%
Commercial Multi Peril Other Liability — Occ 22% 27% 48% 46% 53% 53%
Commercial Auto Workers Compensation 49% 60% 63% 71% 73% 85%
Commercial Auto Other Liability — Occ 51% 54% 67% 78% 82% 78%
Workers Compensation Other Liability — Occ 44% 51% 63% 67% 72% 80%
Other Liability — Occ Other Liability — CM 45% 50% 57% 55% 59% 65%
Medical PL — CM Other Liability — CM 65% 72% 72% 64% 68% n/a
Medical PL — CM Workers Compensation 47% 72% 71% 73% 77% n/a
The larger the company, the more important correlation becomes for the company. Regulators and rating agencies scrutinize correlation assumptions in their evaluations of capital adequacy. Aon Benfield Analytics can help companies understand the sensitivity of their model results to correlation assumptions and guide them during the rating agency review process.
Insurers of different sizes face different levels of correlation across their portfolios. For small insurers, the process risk in each line of business may keep the correlation observed between lines relatively low. In contrast, large insurers are exposed primarily to the systemic risk in each line, but correlation in systemic risk will drive observed correlations across the portfolio.
The U.S. correlation coefficients published earlier in the Study represent an average level of correlation for companies with premium volume above a threshold
of $100 million. We selected this threshold as representative of the size of a typical product division within a medium to large insurance company. The observed level of correlation varies within this threshold, as shown below for several pairs of lines. Companies with volume exceeding $100 million will observe an increasing level of correlation between lines. For example, between workers compensation and other liability occurrence, the correlation at $100 million is 63 percent, at $500 million it is 72 percent, and at $1 billion it is 80 percent.

18
Insurance Risk Study
Macroeconomic Correlations
Infla
tion
(C
PI-U
)
Infla
tion
(PP
I)
GD
P G
row
th
Une
mpl
oym
ent
Cha
nge
3-M
onth
T-
Bill
Rate
1-3
Year
T-
Bill
AA
A-A
A 3
-5
Year
Sp
read
BB
B 3
-5
Year
Sp
read
S&P
500
Retu
rns
VIX
Prop
erty
Re
turn
s
Inflation (CPI-U) 78% -3% -2% 32% 26% -11% -25% -12% -23% 13%
Inflation (PPI) 78% 4% -7% 30% 11% -4% -20% -7% -22% 14%
GDP Growth -3% 4% -70% -4% 25% -64% -69% 5% -44% 52%
Unemployment Change -2% -7% -70% -3% -27% 62% 77% -1% 57% -51%
3-Month T-Bill Rate 32% 30% -4% -3% 98% -34% -58% -6% -25% 13%
1-3 Year T-Bill 26% 11% 25% -27% 98% -39% -61% 19% -28% 10%
AAA-AA 3-5 Year Spread -11% -4% -64% 62% -34% -39% 85% -43% 62% -66%
BBB 3-5 Year Spread -25% -20% -69% 77% -58% -61% 85% -36% 67% -53%
S&P 500 Returns -12% -7% 5% -1% -6% 19% -43% -36% -51% 17%
Stock Volatility Index, VIX -23% -22% -44% 57% -25% -28% 62% 67% -51% -32%
Property Returns 13% 14% 52% -51% 13% 10% -66% -53% 17% -32%
Correlation among macroeconomic factors is a very important consideration in risk modeling. The interaction of inflation and GDP growth with loss ratios and investment returns has a profound effect on insurer financial health and stability.
The matrix below shows correlation coefficients for various macroeconomic variables that impact an insurer’s balance sheet.
The Consumer Price Index (CPI-U) and Producer Price Index (PPI) are highly correlated, but they do not show particularly strong correlation with other factors. This may be because inflation has been relatively tame for the last 25 years.
GDP growth shows strong negative correlation with changes in unemployment. When GDP drops — or unemployment increases — credit spreads tend to increase, property values fall and the VIX increases. We were surprised not to see stronger correlation between GDP and stock returns without a lag.
Treasury yields and corporate bond spreads are inversely correlated; financial market fears may push investors to flee corporates for the safety of treasuries, causing corporate yields to rise and treasury yields to fall.
Stock volatility measured by the VIX Index is sensitive to fear and directionally has the appropriate signs: positive correlation with spreads and unemployment, negative correlation with GDP and stock returns.
These coefficients represent only the beginning of an analysis of macroeconomic dependency. Lags may be appropriate among certain variables. For example, GDP and stock returns show the strongest correlation when stock returns lead GDP by two quarters, suggesting that stock prices adjust as soon as expectations for GDP change.
It is also important to consider values that shift over time. In successive eight-quarter periods, stock returns and property returns showed zero or negative correlations until the recent financial crisis when correlations turned strongly positive. This fact alone suggests that a simplistic view of correlation across the balance sheet will expose insurers to significant risks.
Model output is only as good as the assumptions used, and with the prevalence of DFA modeling and economic scenario generators there is potential for naïve assumptions to drive decision making. In the next section, we look more closely at the potential impact of inflation on insurer balance sheets.
Macroeconomic Correlation

19
Aon Benfield
Managing Inflation RiskRisk managers today recognize inflation as a potential threat in the years ahead, but struggle to quantify the risk and identify ways to mitigate it. The historical record reminds us that periods of high inflation have occurred repeatedly in virtually every economy. But during the last 25 years, inflation has been contained at low levels in the U.S. and other developed economies. As a result, the time series available to measure inflation’s impact on the current insurance industry will not serve us well in anticipating the next potential inflation shock.
Inflation 1914-2009
Impact on Insurers
Periods of high inflation, and high inflation volatility in particular, have generally preceded periods of rising accident year combined ratios.
Inflation and Combined Ratio
This lagged relationship between inflation and combined ratios is driven by three factors:
> Lags between the incidence of inflation rate changes and recognition in loss reserving systems and rate indications
> Lags between attempts to raise rates and actual rate changes due to regulatory and competitive limitations
> Immediate impact on balance sheets
Industry Balance Sheet Impact
In the table below we demonstrate the last of these three effects for U.S. insurers using the 2009 industry balance sheet and the sensitivity of bond holdings, equity holdings and nominal loss reserves to changes in inflation. We show that a 200 basis point increase in inflation could result in a $70.9 billion impact on surplus, a 13.7 percent decrease.
Impact of Inflation Increase on Industry Balance Sheet
The primary drivers of these changes are bonds, stocks and loss reserves.
Bonds — Changes in inflation affect bond yields differently for bonds of different maturities. Overall, a 200 basis point increase in inflation would be expected to decrease the value of the industry bond portfolio by 7.3 percent.
Stocks — Stock portfolios are often assumed to have a high sensitivity to changes in bond yields. However, since empirically 80 percent of changes in inflation expectations ultimately flow through the S&P 500 as higher nominal dividends, this significantly offsets the effect of discounting these dividends at higher yields. The overall affect is approximately a 6.0 percent decline in the value of a diversified equity portfolio for a 200 basis point change in inflation.
Loss Reserves — The impact of inflation, particularly when measured as changes in the broad CPI-U, varies by line of business. Many short-tailed lines are impacted directly, though modestly, as a result of their quick settlement. In contrast, long-tailed lines are impacted more significantly by components of the CPI-U, which results in a more muted relationship to general inflation. Overall, for the industry reserves, we estimate a 5.8 percent increase in undiscounted loss reserves for a 200 basis point increase in inflation.
-15%
-10%
-5%
0%
5%
10%
15%
20%
201019901970195019301910
0%
2%
4%
6%
8%
10%
12%
14%
90%
95%
100%
105%
110%
115%
120%
125%
20052000199519901985198019751970
Combined RatioInflation
Balance ($B)
Pre-tax Sensitivity
%
After-Tax Sensitivity
%
After- Tax Impact
($B)Assets
Bonds 866.3 -7.3% -4.7% -40.9
Stocks 227.0 -6.0% -3.9% -8.9
Other Assets 398.9 0.0% 0.0%
Total Assets 1,492.2 -5.1% -3.3% -49.7
Liabilities
Net Loss Reserves 564.0 5.8% 3.8% 21.2
Other Liabilities 411.4 0.0% 0.0%
Total Liabilitites 975.4 3.3% 2.2% 21.2
Surplus 516.8 -21.1% -13.7% -70.9

20
Insurance Risk Study
Managing Inflation RiskInsurers can seek to manage this risk in several ways.
Interest Rate Risk Management — An interest rate risk management process should distinguish between inflation duration and real interest rate duration, thus enhancing an asset-liability management framework. It is often assumed that asset and liability portfolios with equal present values and with the same duration will respond similarly on a discounted basis to changes in bond yields. However, this may not be the case if the changes are driven by changes in inflation rates. In the previous balance sheet example, a 200 basis point increase in inflation caused a $21.2 billion increase in the undiscounted loss reserves, and if interest rates rose as well, then there would also have been an increase in the amount of discounting leaving discounted reserves approximately unchanged.
On the asset side, a bond portfolio of comparable size and duration would have decreased by $17.9 billion as a result of the same change in interest rates. Despite being “matched”, the net effect would be a three percent decrease in surplus.
Asset Allocation — Several asset classes, including inflation-indexed bonds (TIPS), commodities and real estate, offer varying degrees of inflation hedging and can be considered as a natural part of insurers’ asset portfolios. However, careful consideration must be given to the impact on expected investment returns — in the case of TIPS especially — and to the additional volatility and portfolio management skills needed for these asset classes.
Equity Allocations — The conventional wisdom is that equities are a natural hedge against inflation, since companies can pass rising costs along to consumers. But over short horizons, equities have not always outperformed inflation. In the 1970s, inflation soared well above 10 percent even as real equity returns were negative. An investment in the S&P 500 made in 1973 would only have broken even in real dollar terms in 1986. When operating performance is measured over a five-year or ten-year period, these results suggest that insurers holding equities may face flat or even negative investment returns while their liabilities increase in value.
The experience of the 1970’s suggests that a broad index such as the S&P 500 may be less effective than a more carefully constructed equity portfolio. Sectors such as energy, medical services and defense offer a greater degree of inflation hedging than other sectors; value stocks also tend to perform better in inflationary environments than growth stocks. Equities do offer a degree of natural inflation hedging, but history suggests that risk managers should pay careful attention to sector and style allocations.
Reinsurance — Inflation is just one of many sources of volatility for liabilities. Rather than isolate and manage this risk separately, an alternative could be to incorporate aggregate stop loss or adverse development covers into reinsurance programs with coverage terms selected to respond appropriately to adverse inflation impacts on current or prior accident year claims.
0%
5%
10%
15%
20052000199519901985198019751970
-40%
-20%
0%
20%
40%
20052000199519901985198019751970
0%
1%
2%
3%
4%
20052000199519901985198019751970
Base Year = 1970
Inflation CPI-U, 1970-2009
S&P 500 Year 1-Year Change
S&P 500 Cumulative Real Index Value vs. CPI-U

21
Aon Benfield
Top 50 Markets by Gross Written Premium
Country P&C GWP ($B) GDP ($B) Premium/
GDP RatioGDP Per
Capita
U.S. 462.33 14,256.30 3.2% 45,954
Japan 76.12 5,067.53 1.5% 39,963
U.K. 71.93 2,174.53 3.3% 35,482
Germany 67.10 3,346.70 2.0% 40,673
France 62.66 2,649.39 2.4% 41,359
Italy 44.09 2,112.78 2.1% 36,370
China 42.10 4,909.28 0.9% 3,691
Spain 33.88 1,460.25 2.3% 36,012
S. Korea 32.55 929.12 3.5% 19,104
Canada 29.02 1,336.07 2.2% 39,576
Australia 21.40 924.84 2.3% 42,984
Brazil 17.02 1,571.98 1.1% 7,817
Netherlands 15.67 792.13 2.0% 47,198
Russia 12.48 1,230.73 1.0% 8,829
Switzerland 11.39 500.26 2.3% 65,621
Belgium 10.58 468.55 2.3% 44,952
Austria 9.13 384.91 2.4% 46,859
Norway 8.64 381.77 2.3% 81,638
Denmark 8.20 309.60 2.7% 56,131
Mexico 7.41 874.90 0.8% 7,779
Sweden 6.89 406.07 1.7% 44,751
Venezuela 6.34 314.15 2.0% 11,540
Poland 5.89 430.08 1.4% 11,181
Argentina 5.76 308.74 1.9% 7,468
Turkey 5.61 617.10 0.9% 7,931
India 5.01 1,296.09 0.4% 1,105
Ireland 4.80 227.19 2.1% 53,455
South Africa 4.66 285.98 1.6% 5,823
Portugal 4.49 227.68 2.0% 21,207
Czech Republic 4.24 190.27 2.2% 18,651
Finland 4.20 237.51 1.8% 45,197
U.A.E. 3.41 198.69 1.7% 39,933
Iran 3.38 286.06 1.2% 4,267
Greece 3.32 355.88 0.9% 33,105
Israel 3.28 194.79 1.7% 26,488
Malaysia 2.84 191.60 1.5% 7,324
Thailand 2.80 263.86 1.1% 3,973
Taiwan 2.77 355.47 0.8% 15,438
Luxembourg 2.73 52.45 5.2% 105,417
Colombia 2.54 230.84 1.1% 5,222
Ukraine 2.39 113.55 2.1% 2,500
Romania 2.29 161.11 1.4% 7,263
Indonesia 2.24 540.28 0.4% 2,224
New Zealand 2.05 125.16 1.6% 29,434
Hong Kong 1.98 215.36 0.9% 30,376
Chile 1.95 163.67 1.2% 9,773
Hungary 1.93 128.96 1.5% 13,053
Singapore 1.81 182.23 1.0% 38,764
Puerto Rico 1.74 67.90 2.6% 17,070
Saudi Arabia 1.68 369.18 0.5% 12,640
Grand Total 1,148.72 54,419.49 2.1% 11,416
U.S.
Middle East & Africa
Rest of EuropeRest of EUR Area
U.K.
Germany
France
Rest of APAC
South Korea
Japan
China
Rest of Americas
CanadaBrazil
U.S.
Middle East & Africa
Rest of Europe
Rest of EUR Area
U.K.
Germany
France
Rest of APAC
South KoreaJapan
China
Rest of AmericasCanadaBrazil
U.S.
Middle East & Africa
Rest of EuropeRest of EUR Area
U.K.
Germany
France
Rest of APAC
South Korea
Japan
ChinaRest of Americas
CanadaBrazil
Global Premium by Product Line
With rates continuing to soften and investment yields depressed, insurers are under intense pressure to find profitable areas to grow. The following pages present a summary of global insurance markets: the size of each market by premium, premium relative to GDP (insurance penetration ratio), loss ratios, and volatility of loss ratios. We have segmented premium into motor, property and liability lines for the top 50 markets.
Global Market Review
Motor: $513B
Property: $388B
Liability: $277B

22
Insurance Risk Study
Global Premium, Loss Ratio and Volatility: Motor
CountryGross Written Premium Average Loss Ratio Graph
Latest ($M) 5 Yr Annual Growth 1 Yr 3 Yr 5 Yr 10 Yr SD 10 Yr CV 5 Yr LR
Argentina 2,692 16.4% 66% 68% 67% 4% 6%
Australia 7,726 4.3% 98% 98% 92% 9% 9%
Austria 3,923 3.0% 71% 66% 65% 8% 11%
Belgium 4,425 4.3% 91% 79% 76% 10% 12%
Brazil 9,996 19.3% 65% 59% 59% 5% 9%
Canada 13,607 -3.3% 76% 74% 73% 6% 8%
Chile 523 14.0% 69% 66% 66% 4% 6%
China 49,055 49.7% 60% 55% 56% 4% 6%
Colombia 1,177 16.6% 56% 55% 54% 4% 7%
Czech Republic 2,120 9.2% 51% 51% 52% 4% 8%
Denmark 2,363 4.0% 65% 58% 62% 11% 16%
Finland 1,778 6.5% 78% 78% 78% 6% 7%
France 52,439 22.1% 82% 82% 81% 3% 4%
Germany 27,924 0.0% 96% 95% 92% 5% 5%
Hong Kong 342 -1.2% 60% 62% 58% 9% 15%
Hungary 1,045 1.2% 60% 59% 59% 2% 4%
India 2,755 10.2% 76% 70% 76% 17% 19%
Indonesia 1,367 29.1% 49% 50% 47% 5% 10%
Iran 4,957 45.9% 76% 83% 82% 6% 7%
Ireland 4,417 15.2% 87% 74% 69% 15% 18%
Israel 2,075 4.7% 107% 100% 98% 8% 8%
Italy 28,370 1.5% 79% 76% 75% 6% 8%
Japan 83,411 15.2% 69% 67% 66% 2% 3%
Luxembourg 1,012 27.2% 68% 67% 68% 5% 7%
Malaysia 1,490 7.9% 82% 77% 71% 8% 12%
Mexico 3,462 3.0% 73% 72% 72% 3% 4%
Netherlands 12,729 21.4% 72% 67% 68% 5% 7%
New Zealand 753 1.8% 67% 70% 69% 2% 4%
Norway 2,606 5.2% 70% 70% 68% 4% 6%
Poland 3,757 8.0% 78% 69% 67% 4% 6%
Portugal 2,365 -0.4% 71% 68% 69% 3% 4%
Puerto Rico 510 -9.2% 59% 59% 60% 4% 7%
Romania 1,835 29.0% 47% 59% 60% 6% 11%
Russia 2,718 -2.5% 58% 58% 54% 9% 18%
S. Korea 18,976 24.4% 70% 71% 72% 4% 6%
Saudi Arabia 1,356 46.1% 59% 54% 55% 6% 11%
Singapore 731 12.7% 75% 84% 77% 10% 13%
South Africa 4,857 29.1% 69% 70% 69% 4% 5%
Spain 16,205 3.4% 73% 70% 76% 9% 12%
Sweden 2,831 -0.5% 74% 78% 84% 11% 12%
Switzerland 10,283 23.3% 59% 59% 62% 5% 7%
Taiwan 1,521 -1.6% 59% 57% 58% 3% 4%
Thailand 1,908 9.0% 57% 57% 56% 3% 5%
Turkey 3,223 10.8% 76% 73% 70% 7% 11%
U.A.E. 2,381 45.3% 70% 68% 67% 8% 10%
U.K. 47,582 17.0% 81% 79% 79% 5% 6%
U.S. 186,586 -0.4% 63% 62% 60% 5% 8%
Ukraine 758 -20.5% 53% 44% 42% 8% 19%
Venezuela 8,015 64.0% 53% 52% 51% 9% 16%
Grand Total 648,939 22.0% 71% 69% 68% 5% 8%
0% 50% 100%

23
Aon Benfield
Global Premium, Loss Ratio and Volatility: Property
CountryGross Written Premium Average Loss Ratio Graph
Latest ($M) 5 Yr Annual Growth 1 Yr 3 Yr 5 Yr 10 Yr SD 10 Yr CV 5 Yr LR
Argentina 1,113 11.9% 50% 47% 43% 8% 18%
Australia 6,349 7.9% 75% 75% 66% 13% 20%
Austria 3,213 5.3% 83% 75% 71% 11% 15%
Belgium 3,172 7.6% 67% 57% 54% 7% 13%
Brazil 4,955 19.5% 46% 47% 46% 16% 30%
Canada 10,437 4.5% 66% 63% 62% 8% 13%
Chile 993 11.8% 21% 41% 50% 19% 40%
China 14,703 48.2% 59% 54% 53% 7% 14%
Colombia 855 8.4% 30% 35% 34% 8% 23%
Czech Republic 2,166 28.3% 51% 52% 49% 40% 62%
Denmark 3,338 2.7% 75% 73% 72% 23% 29%
Finland 1,264 5.0% 66% 70% 68% 8% 10%
France 4,724 -25.5% 79% 70% 69% 17% 22%
Germany 23,062 3.0% 70% 73% 70% 8% 11%
Hong Kong 635 1.0% 44% 46% 42% 7% 19%
Hungary 701 5.1% 18% 31% 32% 7% 21%
India 1,103 3.2% 52% 43% 38% 14% 34%
Indonesia 2,595 22.9% 39% 40% 47% 18% 33%
Iran 1,285 35.0% 31% 26% 29% 6% 24%
Ireland 2,958 16.8% 88% 65% 56% 16% 26%
Israel 786 4.1% 62% 62% 65% 14% 22%
Italy 6,984 1.6% 66% 61% 59% 5% 9%
Japan 31,062 18.4% 37% 38% 45% 12% 27%
Luxembourg 1,874 48.4% 74% 76% 61% 16% 27%
Malaysia 1,021 5.9% 34% 23% 20% 16% 64%
Mexico 2,911 7.9% 33% 52% 71% 33% 54%
Netherlands 10,942 26.4% 60% 58% 55% 5% 9%
New Zealand 1,031 2.8% 51% 57% 53% 7% 15%
Norway 3,961 6.2% 45% 41% 38% 7% 17%
Poland 1,251 8.8% 49% 46% 41% 6% 15%
Portugal 1,063 3.0% 49% 48% 43% 8% 17%
Puerto Rico 711 -2.1% 19% 21% 21% 9% 39%
Romania 362 18.7% 14% 20% 19% 4% 22%
Russia 9,420 21.9% 54% 40% 29% 15% 71%
S. Korea 4,453 23.1% 54% 47% 43% 16% 31%
Saudi Arabia 1,305 29.4% 27% 30% 26% 21% 69%
Singapore 567 6.6% 42% 34% 31% 8% 23%
South Africa 4,195 28.8% 59% 56% 56% 7% 12%
Spain 10,037 10.3% 58% 57% 67% 14% 21%
Sweden 3,768 2.3% 52% 53% 57% 5% 8%
Switzerland 7,421 20.6% 48% 52% 54% 5% 9%
Taiwan 977 -4.3% 47% 39% 40% 20% 48%
Thailand 628 5.9% 39% 42% 43% 8% 22%
Turkey 2,196 13.7% 34% 34% 35% 11% 25%
U.A.E. 1,934 41.7% 54% 53% 52% 16% 31%
U.K. 55,442 20.6% 57% 61% 59% 9% 14%
U.S. 160,396 3.9% 57% 56% 62% 13% 20%
Ukraine 907 -21.9% 5% 18% 10% 9% 106%
Venezuela 783 16.0% 19% 23% 22% 57% 114%
Grand Total 418,011 12.3% 56% 56% 58% 8% 13%
0% 50% 100%

24
Insurance Risk Study
Global Premium, Loss Ratio and Volatility: Liability
CountryGross Written Premium Average Loss Ratio Graph
Latest ($M) 5 Yr Annual Growth 1 Yr 3 Yr 5 Yr 10 Yr SD 10 Yr CV 5 Yr LR
Argentina 1,959 27.7% 62% 60% 61% 3% 5%
Australia 6,476 2.4% 72% 58% 52% 14% 31%
Austria 2,060 10.9% 66% 60% 57% 5% 8%
Belgium 4,111 9.7% 154% 105% 97% 22% 24%
Brazil 1,625 18.1% 33% 35% 38% 9% 23%
Canada 5,360 5.6% 53% 49% 50% 7% 12%
Chile 433 17.3% 77% 66% 57% 15% 26%
China 3,498 13.3% 56% 52% 47% 10% 21%
Colombia 509 19.1% 28% 27% 28% 4% 15%
Czech Republic 2,117 40.6% 36% 38% 43% 6% 13%
Denmark 1,250 7.1% 57% 68% 76% 12% 15%
Finland 1,160 2.9% 80% 82% 85% 8% 9%
France 11,253 5.5% 57% 56% 56% 8% 13%
Germany 16,116 3.8% 74% 69% 68% 6% 9%
Hong Kong 1,001 3.8% 47% 51% 50% 16% 27%
Hungary 187 3.1% 43% 40% 37% 6% 18%
India 1,154 3.2% 34% 33% 35% 10% 25%
Indonesia 515 30.2% 27% 27% 25% 9% 39%
Iran 527 30.6% 54% 51% 55% 11% 23%
Ireland 2,536 14.6% 62% 47% 55% 22% 31%
Israel 418 -5.0% 98% 94% 89% 8% 9%
Italy 8,739 10.6% 75% 73% 74% 6% 8%
Japan 27,029 11.4% 33% 29% 28% 6% 26%
Luxembourg 856 26.2% 96% 68% 54% 25% 50%
Malaysia 324 7.7% 40% 28% 27% 19% 54%
Mexico 1,040 5.6% 36% 30% 30% 8% 22%
Netherlands 7,775 28.6% 55% 53% 56% 5% 8%
New Zealand 245 9.9% 58% 48% 42% 9% 24%
Norway 983 -11.5% 69% 47% 42% 12% 31%
Poland 880 20.3% 30% 26% 27% 5% 18%
Portugal 1,059 -3.1% 77% 73% 69% 15% 25%
Puerto Rico 601 8.2% 43% 41% 43% 5% 10%
Romania 93 5.7% 41% 47% 50% 13% 30%
Russia 1,012 2.7% 28% 24% 21% 10% 80%
S. Korea 41,722 34.7% 80% 80% 81% 27% 28%
Saudi Arabia 283 39.6% 17% 25% 24% 13% 50%
Singapore 510 -0.2% 38% 37% 44% 9% 18%
South Africa 1,435 22.8% 50% 56% 58% 7% 11%
Spain 7,640 5.6% 63% 55% 65% 12% 19%
Sweden 287 7.3% 181% 236% 227% 66% 32%
Switzerland 5,066 22.3% 47% 45% 44% 8% 16%
Taiwan 271 -6.3% 57% 42% 46% 15% 29%
Thailand 264 3.3% 35% 30% 40% 16% 40%
Turkey 187 2.6% 19% 21% 20% 4% 23%
U.A.E. 2,507 46.5% 32% 30% 40% 18% 33%
U.K. 40,830 17.5% 58% 54% 55% 4% 8%
U.S. 120,533 -0.4% 67% 66% 61% 9% 14%
Ukraine 723 12.6% 44% 44% 28% 14% 65%
Venezuela 1,553 57.1% 8% 9% 11% 16% 70%
Grand Total 338,712 7.2% 64% 60% 59% 5% 9%
0% 50% 100%

25
Aon Benfield
Afterword: The Greatest Risk
In last year’s conclusion we highlighted the significance of reserve risk to an insurance company’s balance sheet. In 2010, U.S. industry reserve levels appear strong. Companies continue to release reserves from prior accident years and we expect releases to continue for the next two years or so. Reserve risk is, however, a retrospective manifestation of prospective pricing risk, and pricing risk truly is the greatest risk facing insurance companies globally. Surprisingly, despite its severity, pricing risk is often poorly modeled, inadequately monitored, and insufficiently scrutinized, especially when compared to catastrophe risk. The factors provided in this Study are specifically designed to help quantify pricing risk. Working with Aon Benfield brokers, our Analytics team can help structure risk transfer solutions to manage pricing risk to appropriate levels.
Pricing Risk: The Greatest RiskIn its annual study of insurance company impairments, A.M. Best identifies two symptoms of pricing risk, deficient loss reserves and excessive growth, as the primary cause in 52 percent of the 1,028 U.S. impairments it has tracked since 1969. By comparison, they identify only 7.6 percent of impairments as primarily caused by catastrophe losses. These statistics do not reflect the relative riskiness of pricing vs. catastrophe loss; instead they reflect the quality of models and the risk management practices underlying the two perils.
Catastrophe modeling technology, while not perfect, represents a very successful application of science to the question of risk quantification. It has revolutionized underwriting, pricing and risk management practice. Its general acceptance within the industry has also revolutionized the provision of risk capacity: the flow of capital to bear catastrophe risk, whether through insurance-linked securities or more traditional solutions, is predicated in large degree on the agreed and objective view of risk provided by scientifically-based catastrophe models. The lack of analogous models and agreement for non-catastrophe property and casualty lines has many important ramifications.
Risk Management, Regulatory and Rating Agency Treatment of Pricing Risk There is no more risky unit of premium than an under-priced unit. Paradoxically, the less volatile a line of business, the more true this statement becomes — to the extent that for many predictable lines of business pricing risk is the number one risk component.
Internal, regulatory, and rating agency risk and capital models often equate risk with tail risk and attempt to model risk from a loss-only perspective. For catastrophe perils this paradigm has been very successful. Outside property catastrophe lines the approach is far less successful. Frequency and severity models of loss incorporating pricing risk, while common for internal models, rarely underlie regulatory or rating agency models, which tend to use simple factor-based approaches, with default factors by line and geography applied to premiums.
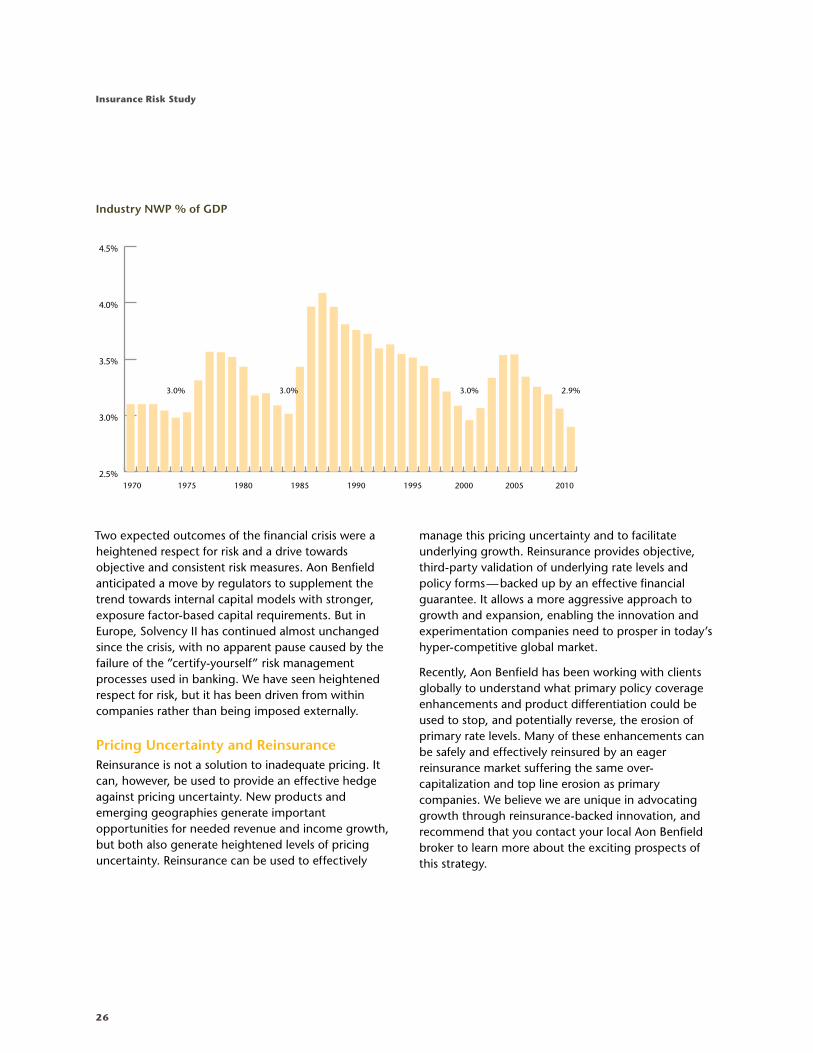
An obvious problem with a factor-based approach to underwriting risk is that it does not use an objective measure of exposure: an inadequate (lower) premium generates a smaller risk charge in a model which simply applies a factor to premium! One important pricing adequacy statistic tracked in this Study is the ratio of net written premium to gross domestic product for the U.S., both in nominal dollars. A time series for the ratio back to 1970 is shown in the next chart. It clearly shows three market cycles in the last forty years: with turns after 1974, 1984 and 2001. It also shows that, relative to GDP as an exposure measure, premium levels today are at historically low levels, being below 3.0 percent for the first time since 1970. In 2010, we reach a tipping point: will the industry repeat the excesses of the 1998-2000 soft market, or will it stabilize risk pricing, ushering in a period of barely adequate returns? Hoping for a severe catastrophe loss to solve the industry’s over-capacity is not a strategy.
26
Insurance Risk Study
Two expected outcomes of the financial crisis were a heightened respect for risk and a drive towards objective and consistent risk measures. Aon Benfield anticipated a move by regulators to supplement the trend towards internal capital models with stronger, exposure factor-based capital requirements. But in Europe, Solvency II has continued almost unchanged since the crisis, with no apparent pause caused by the failure of the ”certify-yourself” risk management processes used in banking. We have seen heightened respect for risk, but it has been driven from within companies rather than being imposed externally.
Pricing Uncertainty and Reinsurance Reinsurance is not a solution to inadequate pricing. It can, however, be used to provide an effective hedge against pricing uncertainty. New products and emerging geographies generate important opportunities for needed revenue and income growth, but both also generate heightened levels of pricing uncertainty. Reinsurance can be used to effectively
manage this pricing uncertainty and to facilitate underlying growth. Reinsurance provides objective, third-party validation of underlying rate levels and policy forms — backed up by an effective financial guarantee. It allows a more aggressive approach to growth and expansion, enabling the innovation and experimentation companies need to prosper in today’s hyper-competitive global market.
Recently, Aon Benfield has been working with clients globally to understand what primary policy coverage enhancements and product differentiation could be used to stop, and potentially reverse, the erosion of primary rate levels. Many of these enhancements can be safely and effectively reinsured by an eager reinsurance market suffering the same over-capitalization and top line erosion as primary companies. We believe we are unique in advocating growth through reinsurance-backed innovation, and recommend that you contact your local Aon Benfield broker to learn more about the exciting prospects of this strategy.
Industry NWP % of GDP
1970 1975 1980 1985 1990 1995 2000 2005 20102.5%
3.0%
3.5%
4.0%
4.5%
3.0% 3.0% 2.9%3.0%

27
Aon Benfield
Sources: A.M. Best, ANIA (Italy), Association of Vietnam Insurers, Axco Insurance Information Services, BaFin (Germany), Banco Central del Uruguay, Bank Negara Malaysia , Bloomberg, Bureau of Economic Analysis (U.S.), Bureau of Labor Statistics (U.S.), CADOAR (Dominican Republic), Cámara de Aseguradores de Venezuela, Comisión Nacional de Bancos y Seguros de Honduras, Comisión Nacional de Seguros y Fianzas (Mexico), Danish FSA, Dirección General de Seguros (Spain), DNB (Denmark), E&Y Annual Statements (Israel), Finma (Switzerland), FMA (Austria), FSA Returns (U.K.), “Handbook on Indian Insurance Statistics” (ed. IDRA), HKOCI (Hong Kong), http://www.bapepam.go.id/perasuransian/index.htm (Indonesia), ICA (Australia), Korea Financial Supervisory Service, Monetary Authority of Singapore, MSA Research Inc. (Canada), Quest Data Report (South Africa), Romanian Insurance Association, SNL (U.S.), “The Statistics of Japanese Non-Life Insurance Business” (ed. Insurance Research Institute), Superintendencia de Banca y Seguros (Peru), Superintendencia de Bancos y Otras Instituciones Financieras de Nicaragua, Superintendencia de Bancos y Seguros (Ecuador), Superintendencia de Pensiones de El Salvador, Superintendencia de Pensiones, Valores y Seguros (Bolivia), Superintendencia de Seguros de la Nación (Argentina), Superintendencia de Seguros Privados (Brazil), Superintendencia de Seguros y Reaseguros de Panama, Superintendencia de Valores y Seguros de Chile, Superintendencia Financiera de Colombia, Taiwan Insurance Institution, Turkish Insurance and Reinsurance Companies Association, Yahoo! Finance, Yearbooks of China’s Insurance, and annual financial statements.
Stephen MildenhallChief Executive Officer, Aon Benfield Analytics+1 312 381 [email protected]
Parr SchoolmanRisk & Capital Strategy+1 312 381 [email protected]
Michael McClaneReMetrica, U.S.+1 215 751 [email protected]
John MooreHead of Analytics, International+ 44 (0)20 7522 [email protected]
Paul MaitlandReMetrica, International +44 (0)20 7522 [email protected]
About Aon BenfieldAs the industry leader in treaty, facultative and capital markets, Aon Benfield is redefining the role of the reinsurance intermediary and capital advisor. Through our unmatched talent and industry-leading proprietary tools and products, we help our clients to redefine themselves and their success. Aon Benfield offers unbiased capital advice and customized access to more reinsurance and capital markets than anyone else. As a trusted advocate, we provide local reach to the world’s markets, an unparalleled investment in innovative analytics, including catastrophe management, actuarial, and rating agency advisory, and the right professionals to advise clients in making the optimal capital choice for their business. With an international network of more than 4,000 professionals in 50 countries, our worldwide client base is able to access the broadest portfolio of integrated capital solutions and services. Learn more at aonbenfield.com.
For more information on the Insurance Risk Study, ReMetrica®, S2MetricaSM Solvency II Model or our analytic capabilities, please contact your local Aon Benfield broker or:
Americas
Brian Alvers+1 312 381 [email protected]
EMEA & U.K.
Marc Beckers+44 (0)20 7086 [email protected]
Paul Kaye+44 (0)20 7522 [email protected]
Asia Pacific
Will Gardner+61 2 9650 [email protected]
David Maneval+61 2 9650 [email protected]
George Attard+65 6239 [email protected]

200 E. Randolph Street, Chicago, Illinois 60601 t: +1 312 381 5300 | f: +1 312 381 0160 | aonbenfield.com
Copyright Aon Benfield Inc. 2010 | #4561 - 08/2010