
Insurance: Leading Through Disruption - III · Insurance: Leading Through Disruption ... Man-Made...
39
Insurance: Leading Through Disruption Sean Kevelighan, Chief Executive Officer Insurance Information Institute 110 William Street New York, NY 10038 212.346.5520 [email protected] www.iii.org
Transcript of Insurance: Leading Through Disruption - III · Insurance: Leading Through Disruption ... Man-Made...
Insurance:Leading Through Disruption
Sean Kevelighan, Chief Executive Officer
Insurance Information Institute 110 William Street New York, NY 10038 212.346.5520 [email protected] www.iii.org
I.I.I. Mission Statement
Improving public understanding of insurance...
…what it does and how it works
2

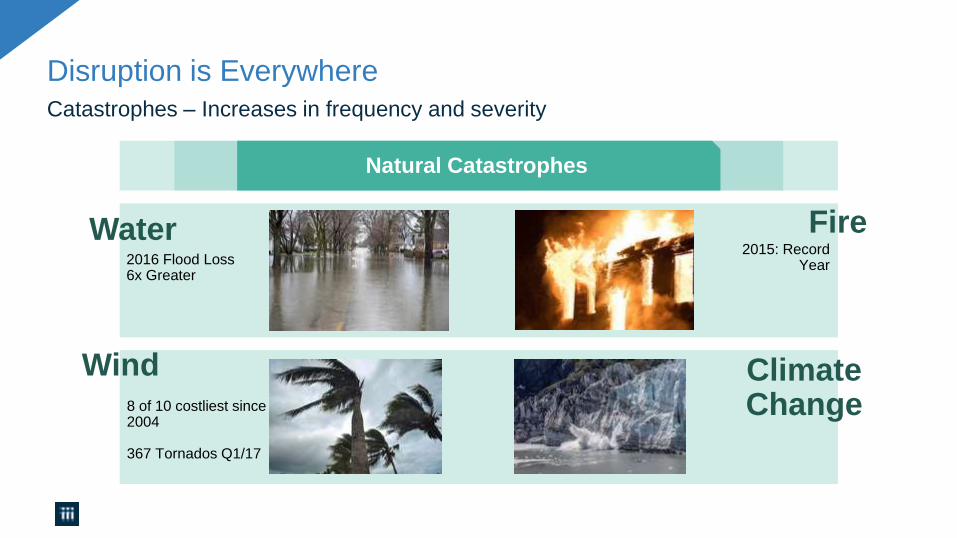
Disruption is Everywhere
Disruption is Everywhere
Catastrophes – Increases in frequency and severity
Natural Catastrophes
Wind
Water Fire
8 of 10 costliest since 2004
367 Tornados Q1/17
2015: Record Year2016 Flood Loss
6x Greater
Climate Change
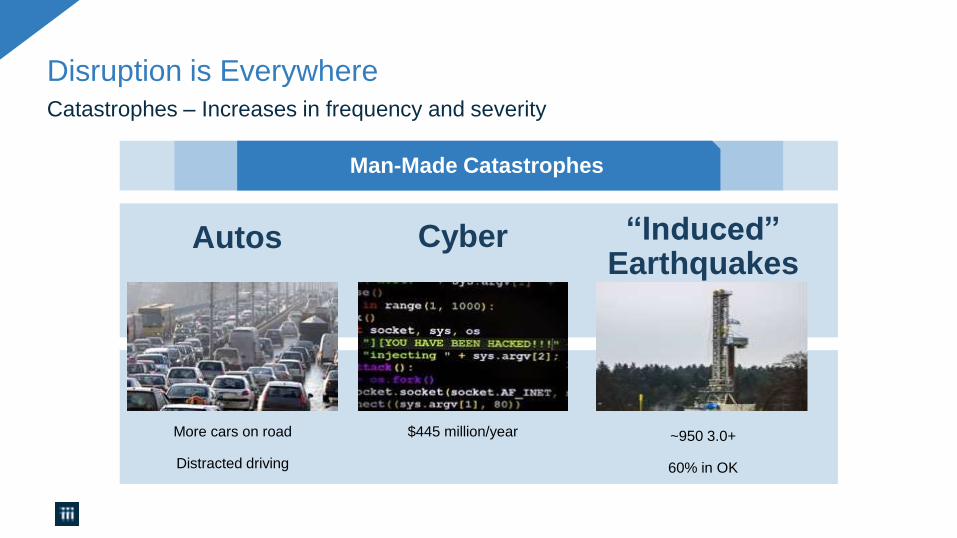
Man-Made Catastrophes
Autos
Disruption is Everywhere
Catastrophes – Increases in frequency and severity
“Induced”Earthquakes
Cyber
~950 3.0+
60% in OK
$445 million/year More cars on road
Distracted driving
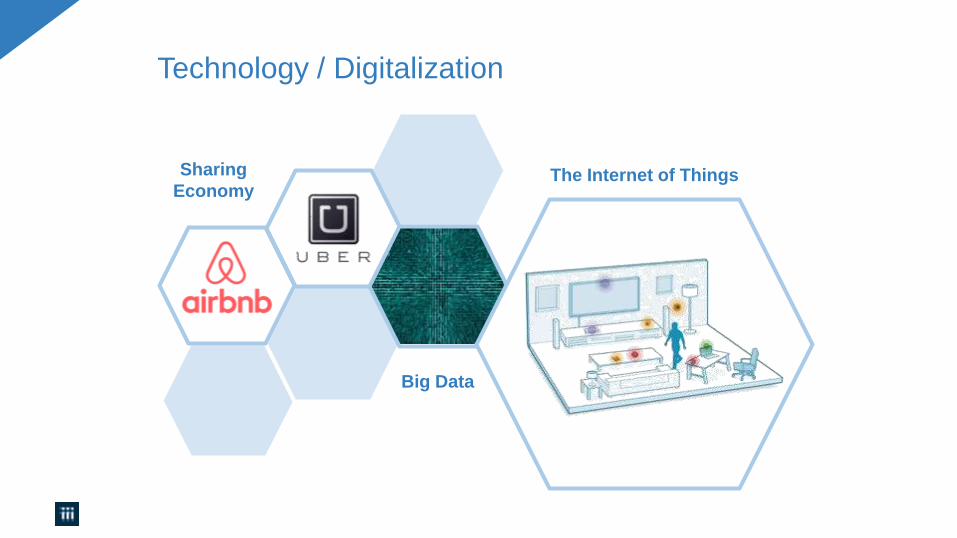
Technology / Digitalization
Big Data
Sharing
EconomyThe Internet of Things
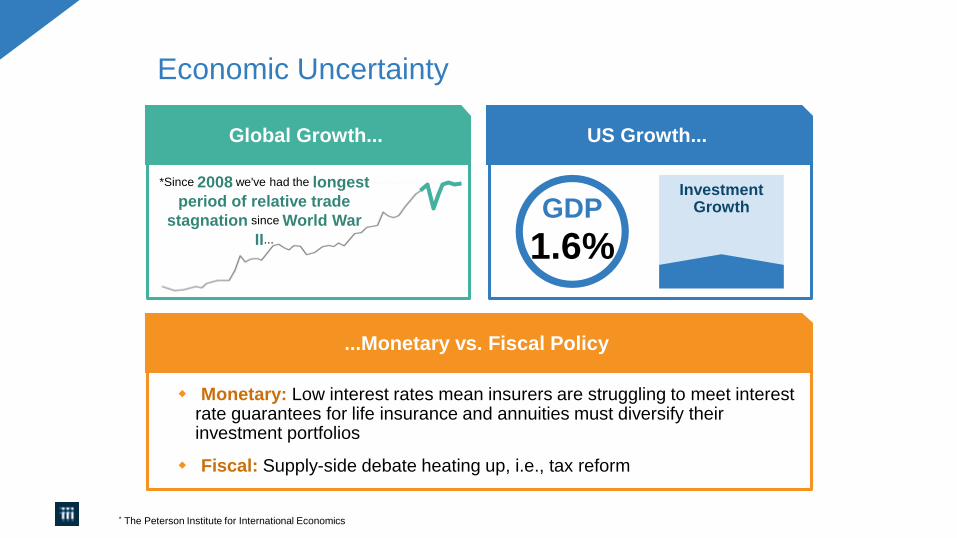
Economic Uncertainty
* The Peterson Institute for International Economics
Global Growth...
*Since 2008 we've had the longest
period of relative trade
stagnation since World War
II...
US Growth...
1.6%GDP
InvestmentGrowth
...Monetary vs. Fiscal Policy
Monetary: Low interest rates mean insurers are struggling to meet interest rate guarantees for life insurance and annuities must diversify their investment portfolios
Fiscal: Supply-side debate heating up, i.e., tax reform
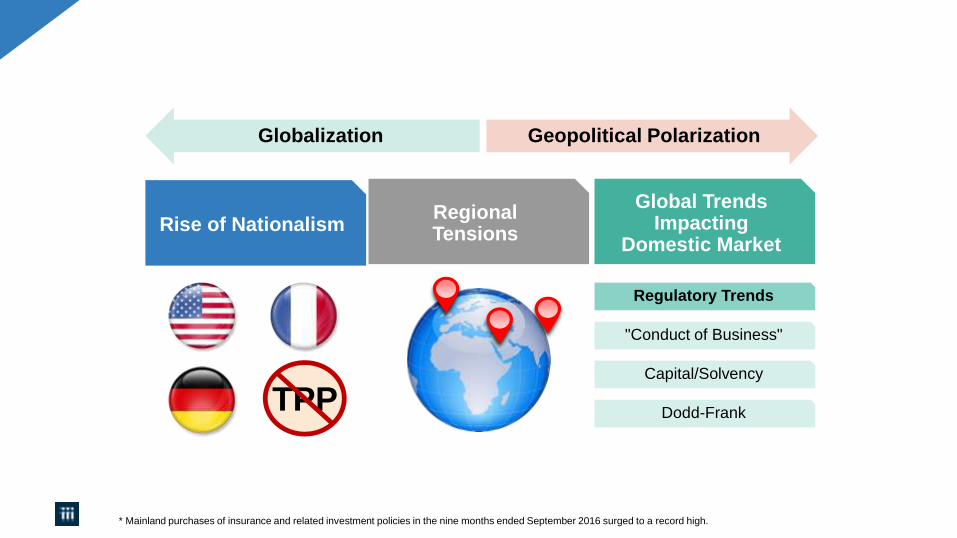
TPP
Globalization
Global Trends Impacting
Domestic Market
Geopolitical Polarization
RegionalTensions Rise of Nationalism
Regulatory Trends
"Conduct of Business"
Capital/Solvency
Dodd-Frank
* Mainland purchases of insurance and related investment policies in the nine months ended September 2016 surged to a record high.
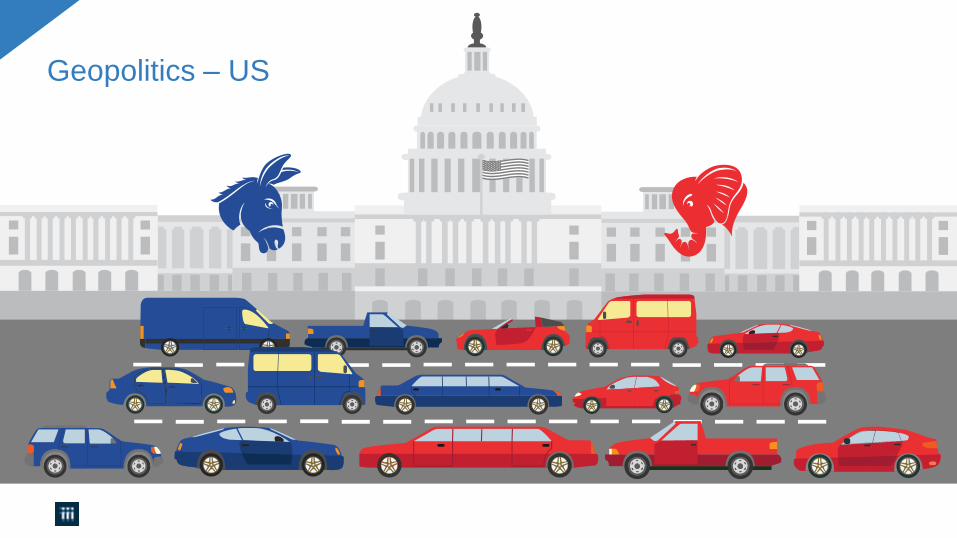
Geopolitics – US
-5%
0%
5%
10%
15%
20%
25%
50 52 54 56 58 60 62 64 66 68 70 72 74 76 78 80 82 84 86 88 90 93 95 97 99 01 03 05 07 09 11 13 15
RO
E
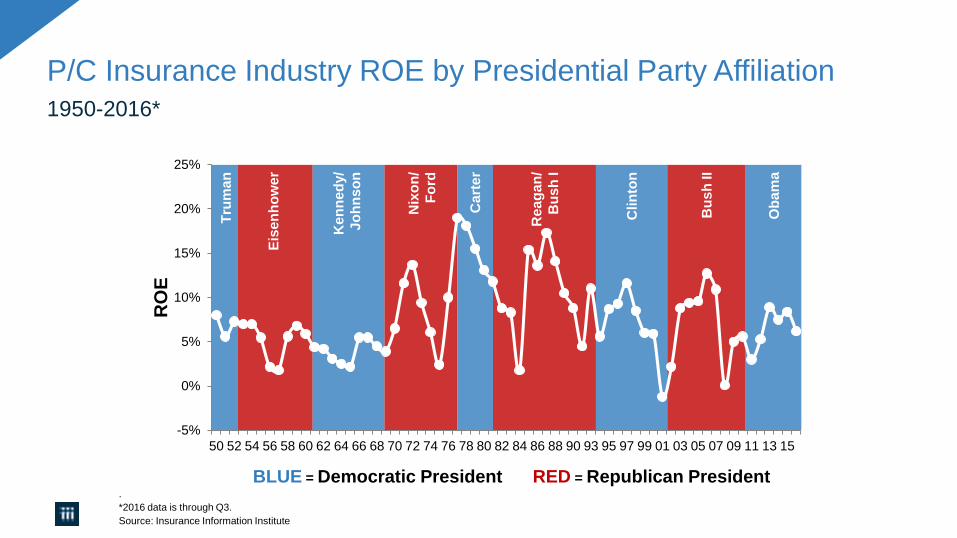
BLUE = Democratic President RED = Republican President
P/C Insurance Industry ROE by Presidential Party Affiliation
1950-2016*
.
*2016 data is through Q3.
Source: Insurance Information Institute
Tru
ma
n
Eis
en
ho
we
r
Ke
nn
ed
y/
Jo
hn
so
n
Nix
on
/
Fo
rd
Ca
rte
r
Re
ag
an
/
Bu
sh
I
Clin
ton
Bu
sh
II
Ob
am
a
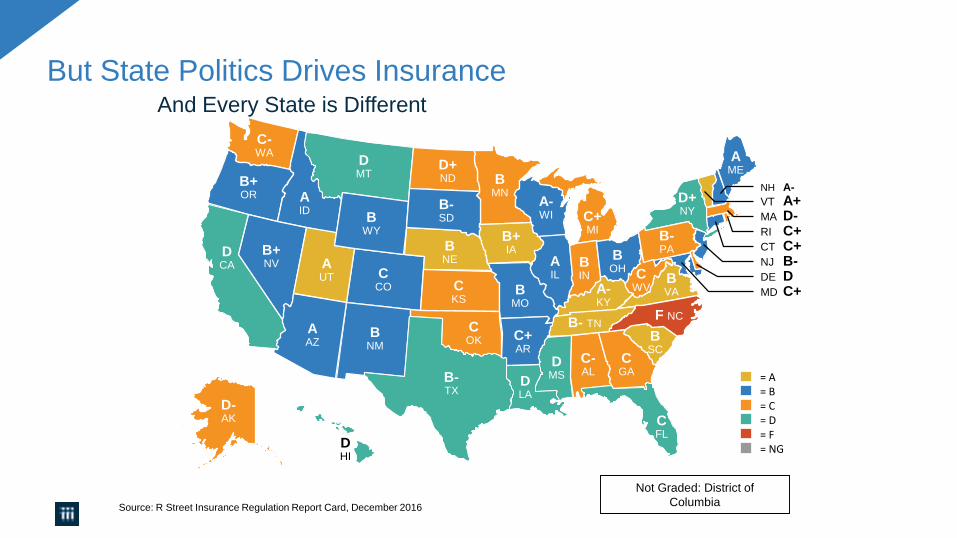
But State Politics Drives InsuranceAnd Every State is Different
Source: R Street Insurance Regulation Report Card, December 2016
= A= B= C= D= F= NG
C-WA
D-AK
B+OR
DCA
AID
B+NV
AAZ
BNM
CCO
BWY
AUT
DMT
B-TX
DLA
DMS
CFL
DHI
B-SD
D+ND B
MN
BNE
CKS
COK
B+IA
BMO
C+AR
AIL
A-WI C+
MI
BIN
BOH
A-KY
B- TN
BSC
C-AL
CGA
F NC
BVA
CWV
B-PA
D+NY
AME
NH A-
VT A+MA D-RI C+CT C+NJ B-DE DMD C+
Not Graded: District of
Columbia
Insurance Industry Snapshot
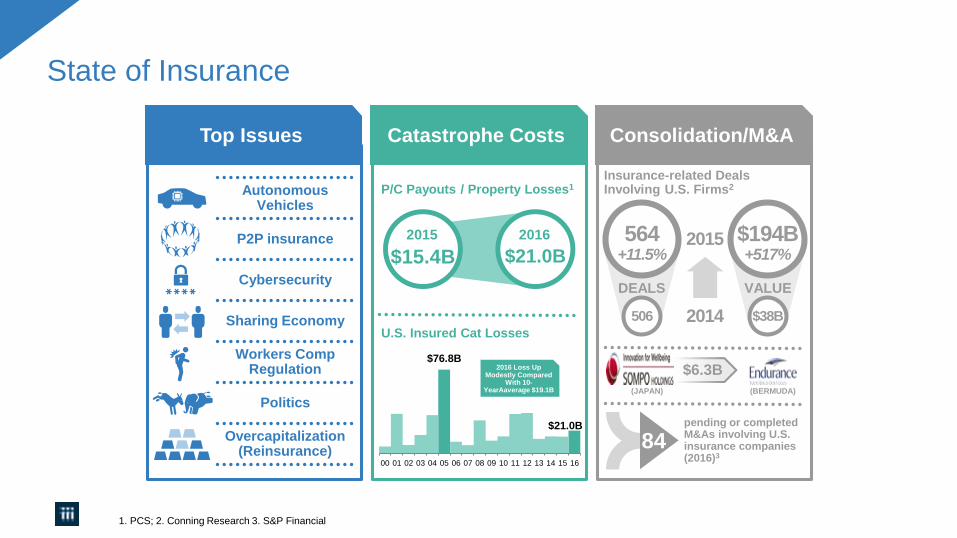
State of Insurance
1. PCS; 2. Conning Research 3. S&P Financial
2014
2015
506
564+11.5%
$38B
$194B+517%
DEALS VALUE
Insurance-related Deals Involving U.S. Firms2
$6.3B
(JAPAN) (BERMUDA)
84pending or completed M&As involving U.S. insurance companies (2016)3
Consolidation/M&A
$76.8B
$21.0B
00 01 02 03 04 05 06 07 08 09 10 11 12 13 14 15 16
2016 Loss Up Modestly Compared
With 10-YearAaverage $19.1B
U.S. Insured Cat Losses
P/C Payouts / Property Losses1
$15.4B
2015
$21.0B
2016
Catastrophe Costs
AutonomousVehicles
P2P insurance
Cybersecurity
Sharing Economy
Workers CompRegulation
Politics
Overcapitalization(Reinsurance)
Top Issues
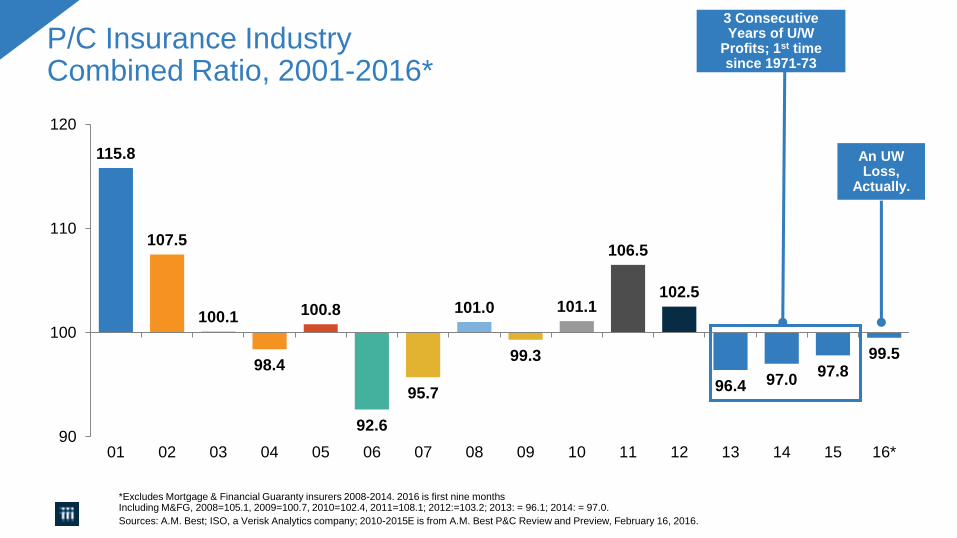
115.8
107.5
100.1
98.4
100.8
92.6
95.7
101.0
99.3
101.1
106.5
102.5
96.4 97.097.8
99.5
90
100
110
120
01 02 03 04 05 06 07 08 09 10 11 12 13 14 15 16*
P/C Insurance Industry Combined Ratio, 2001-2016*
*Excludes Mortgage & Financial Guaranty insurers 2008-2014. 2016 is first nine months Including M&FG, 2008=105.1, 2009=100.7, 2010=102.4, 2011=108.1; 2012:=103.2; 2013: = 96.1; 2014: = 97.0.
Sources: A.M. Best; ISO, a Verisk Analytics company; 2010-2015E is from A.M. Best P&C Review and Preview, February 16, 2016.
An UW Loss,
Actually.
3 Consecutive Years of U/W
Profits; 1st time since 1971-73
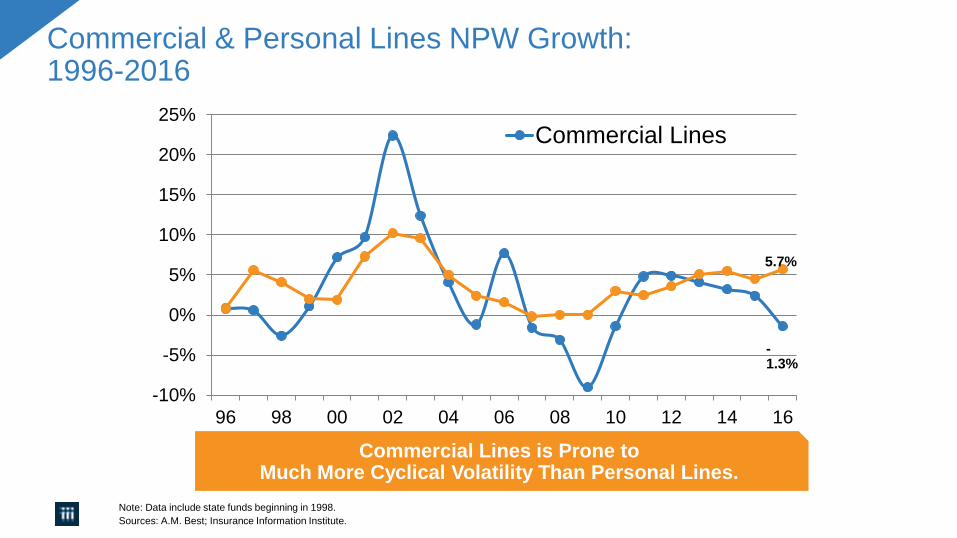
Commercial & Personal Lines NPW Growth:1996-2016
Note: Data include state funds beginning in 1998.
Sources: A.M. Best; Insurance Information Institute.
-10%
-5%
0%
5%
10%
15%
20%
25%
96 98 00 02 04 06 08 10 12 14 16
Commercial Lines
Commercial Lines is Prone toMuch More Cyclical Volatility Than Personal Lines.
-1.3%
5.7%
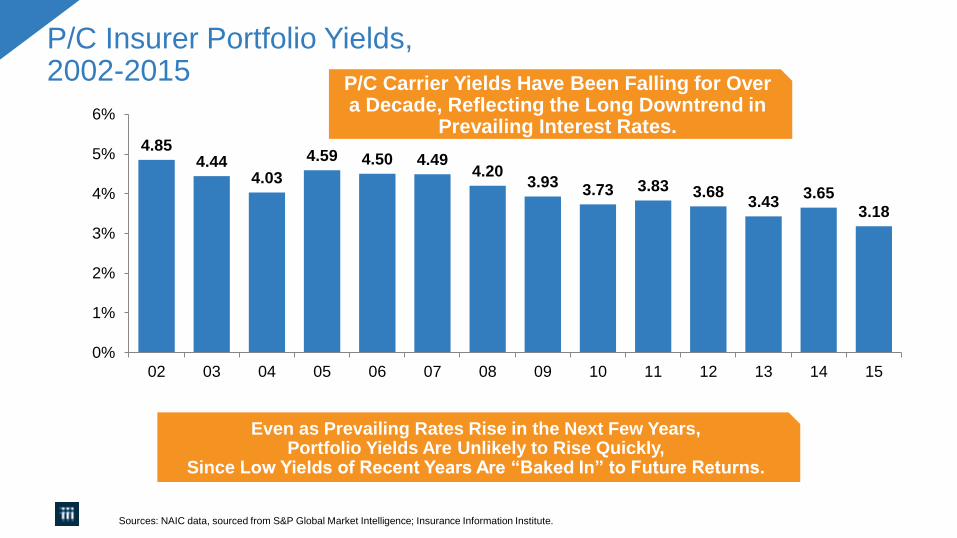
4.854.44
4.03
4.59 4.50 4.494.20
3.933.73 3.83 3.68
3.433.65
3.18
0%
1%
2%
3%
4%
5%
6%
02 03 04 05 06 07 08 09 10 11 12 13 14 15
P/C Insurer Portfolio Yields,2002-2015
Sources: NAIC data, sourced from S&P Global Market Intelligence; Insurance Information Institute.
Even as Prevailing Rates Rise in the Next Few Years, Portfolio Yields Are Unlikely to Rise Quickly,
Since Low Yields of Recent Years Are “Baked In” to Future Returns.
P/C Carrier Yields Have Been Falling for Over a Decade, Reflecting the Long Downtrend in
Prevailing Interest Rates.
Rising Auto Costs
A force to be reckoned with…
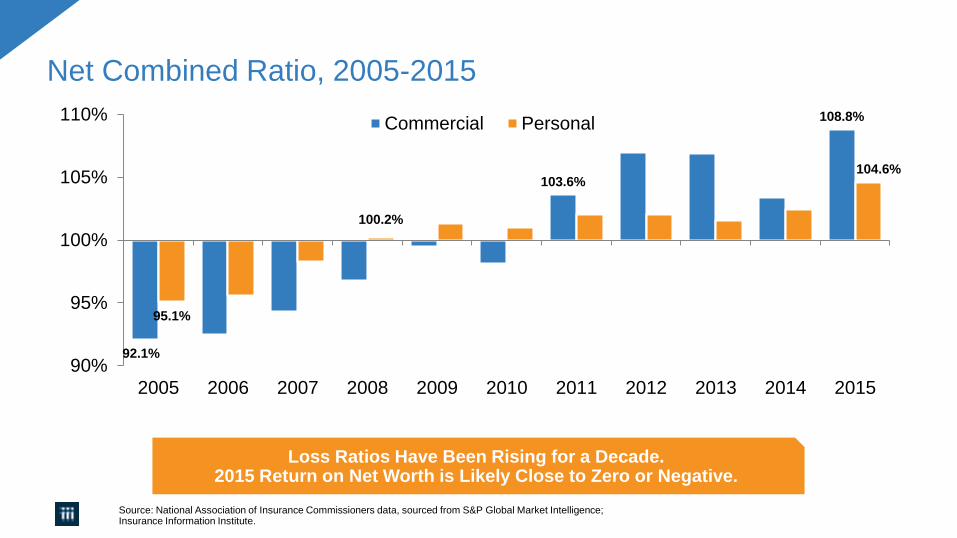
Net Combined Ratio, 2005-2015
Source: National Association of Insurance Commissioners data, sourced from S&P Global Market Intelligence;Insurance Information Institute.
Loss Ratios Have Been Rising for a Decade. 2015 Return on Net Worth is Likely Close to Zero or Negative.
92.1%
103.6%
108.8%
95.1%
100.2%
104.6%
90%
95%
100%
105%
110%
2005 2006 2007 2008 2009 2010 2011 2012 2013 2014 2015
Commercial Personal
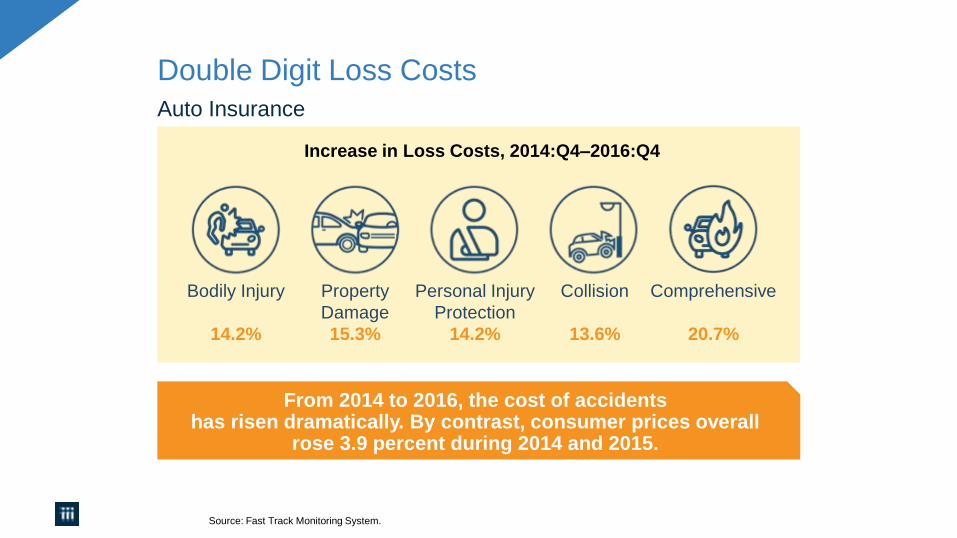
Double Digit Loss Costs
Source: Fast Track Monitoring System.
From 2014 to 2016, the cost of accidents has risen dramatically. By contrast, consumer prices overall
rose 3.9 percent during 2014 and 2015.
Bodily Injury
14.2%
Property
Damage
15.3%
Personal Injury
Protection
14.2%
Collision
13.6%
Comprehensive
20.7%
Auto Insurance
Increase in Loss Costs, 2014:Q4–2016:Q4
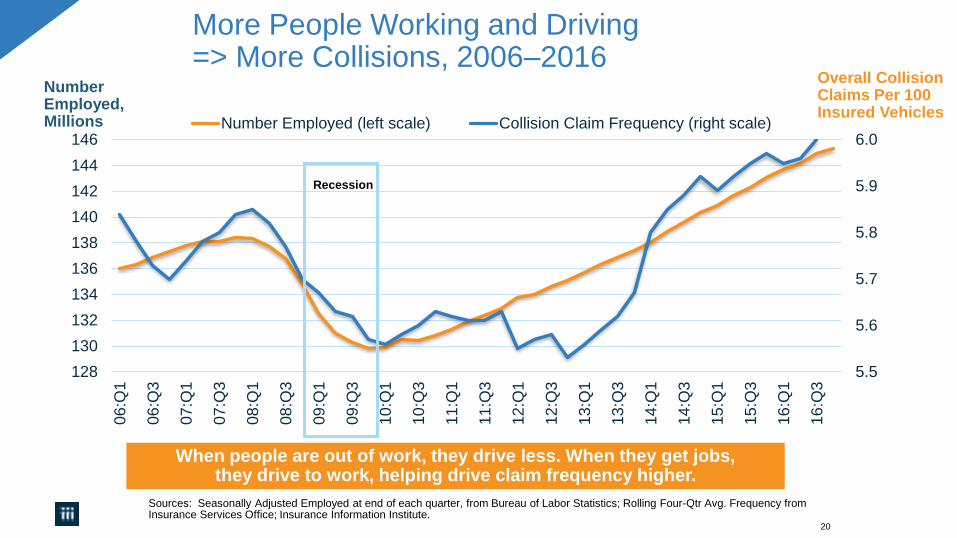
20
More People Working and Driving=> More Collisions, 2006–2016
Sources: Seasonally Adjusted Employed at end of each quarter, from Bureau of Labor Statistics; Rolling Four-Qtr Avg. Frequency from Insurance Services Office; Insurance Information Institute.
Number Employed,Millions
Overall Collision Claims Per 100 Insured Vehicles
When people are out of work, they drive less. When they get jobs,they drive to work, helping drive claim frequency higher.
Recession
5.5
5.6
5.7
5.8
5.9
6.0
128
130
132
134
136
138
140
142
144
146
06
:Q1
06
:Q3
07
:Q1
07
:Q3
08
:Q1
08
:Q3
09
:Q1
09
:Q3
10
:Q1
10
:Q3
11
:Q1
11
:Q3
12
:Q1
12
:Q3
13
:Q1
13
:Q3
14
:Q1
14
:Q3
15
:Q1
15
:Q3
16
:Q1
16
:Q3
Number Employed (left scale) Collision Claim Frequency (right scale)
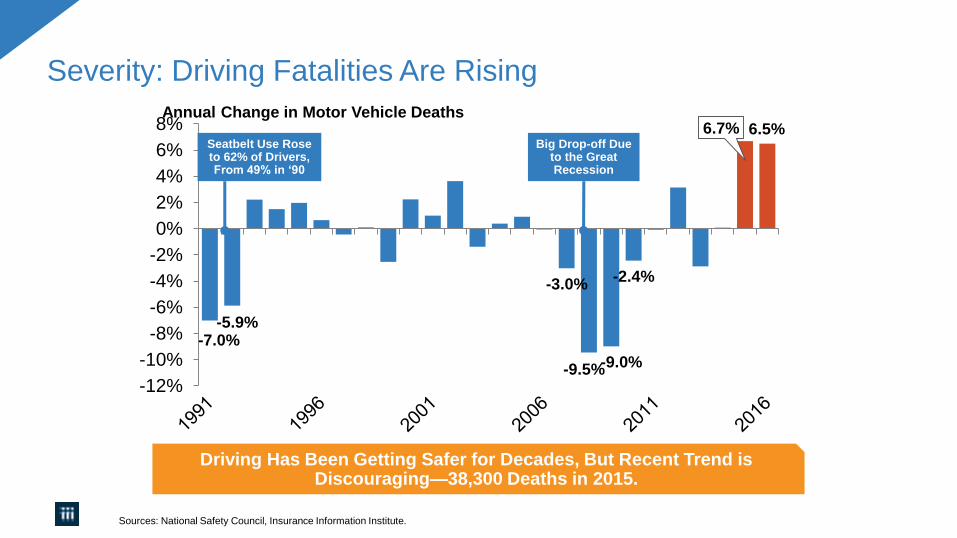
Severity: Driving Fatalities Are Rising
Annual Change in Motor Vehicle Deaths
Sources: National Safety Council, Insurance Information Institute.
-7.0%-5.9%
-3.0%
-9.5%-9.0%
-2.4%
6.7% 6.5%
-12%
-10%
-8%
-6%
-4%
-2%
0%
2%
4%
6%
8%
Driving Has Been Getting Safer for Decades, But Recent Trend is Discouraging—38,300 Deaths in 2015.
Seatbelt Use Rose to 62% of Drivers, From 49% in ‘90
Big Drop-off Due to the Great Recession
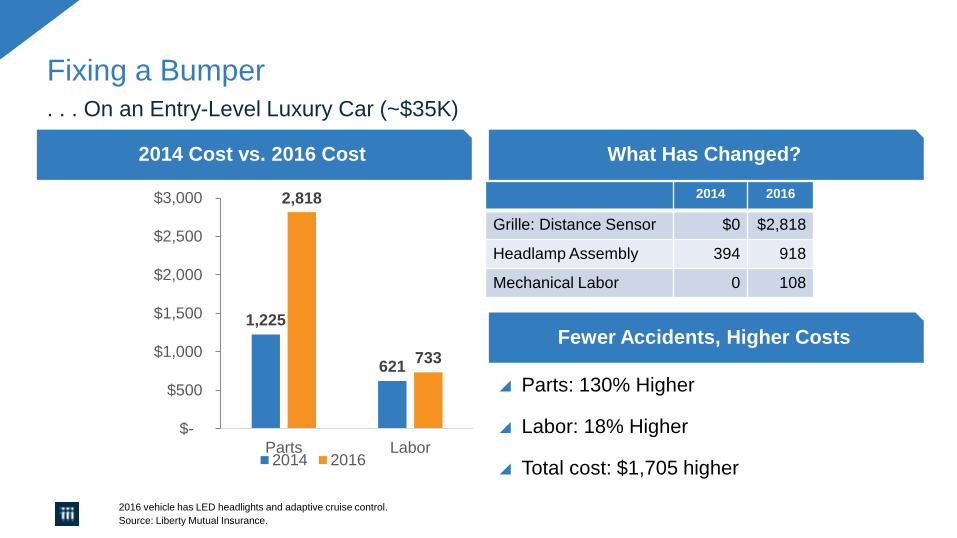
Fixing a Bumper
. . . On an Entry-Level Luxury Car (~$35K)
2016 vehicle has LED headlights and adaptive cruise control.
Source: Liberty Mutual Insurance.
What Has Changed?
Fewer Accidents, Higher Costs
2014 Cost vs. 2016 Cost
1,225
621
2,818
733
$-
$500
$1,000
$1,500
$2,000
$2,500
$3,000
Parts Labor2014 2016
2014 2016
Grille: Distance Sensor $0 $2,818
Headlamp Assembly 394 918
Mechanical Labor 0 108
Parts: 130% Higher
Labor: 18% Higher
Total cost: $1,705 higher
Insurance: Leading Through Disruption
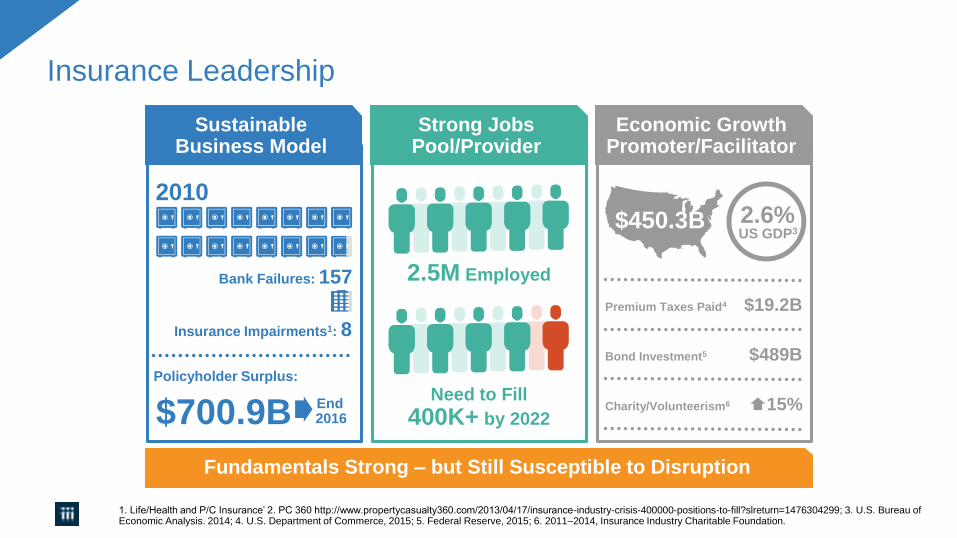
Insurance Leadership
1. Life/Health and P/C Insurance’ 2. PC 360 http://www.propertycasualty360.com/2013/04/17/insurance-industry-crisis-400000-positions-to-fill?slreturn=1476304299; 3. U.S. Bureau of Economic Analysis. 2014; 4. U.S. Department of Commerce, 2015; 5. Federal Reserve, 2015; 6. 2011–2014, Insurance Industry Charitable Foundation.
Fundamentals Strong – but Still Susceptible to Disruption
2010
Bank Failures: 157
Insurance Impairments1: 8
Policyholder Surplus:
$700.9B End 2016
2.5M Employed
Need to Fill
400K+ by 2022
$450.3B 2.6%US GDP3
Premium Taxes Paid4 $19.2B
Bond Investment5 $489B
Charity/Volunteerism6 15%
Economic Growth Promoter/Facilitator
Strong Jobs Pool/Provider
Sustainable Business Model
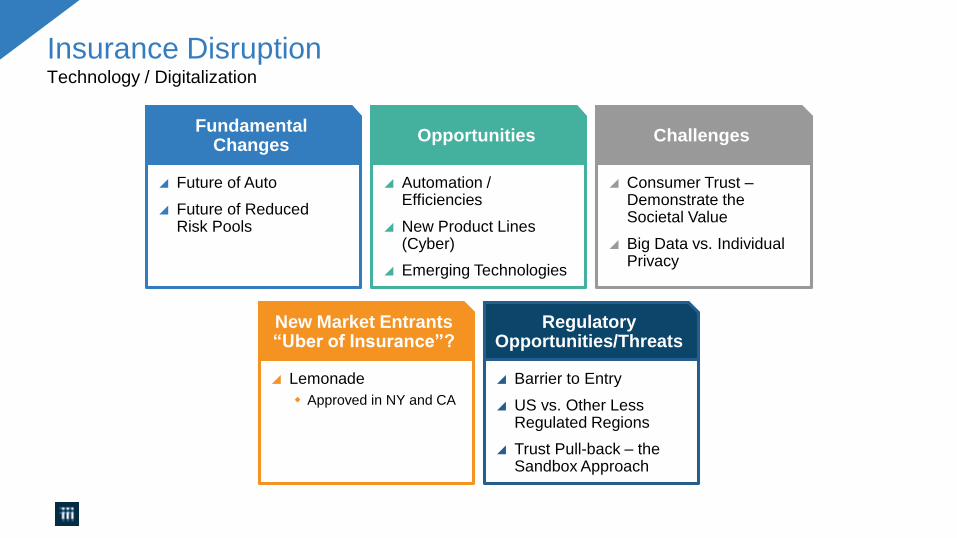
Insurance DisruptionTechnology / Digitalization
FundamentalChanges
Future of Auto
Future of Reduced Risk Pools
Opportunities
Automation / Efficiencies
New Product Lines (Cyber)
Emerging Technologies
Challenges
Consumer Trust –Demonstrate the Societal Value
Big Data vs. Individual Privacy
New Market Entrants “Uber of Insurance”?
Lemonade
Approved in NY and CA
Regulatory Opportunities/Threats
Barrier to Entry
US vs. Other Less Regulated Regions
Trust Pull-back – the Sandbox Approach
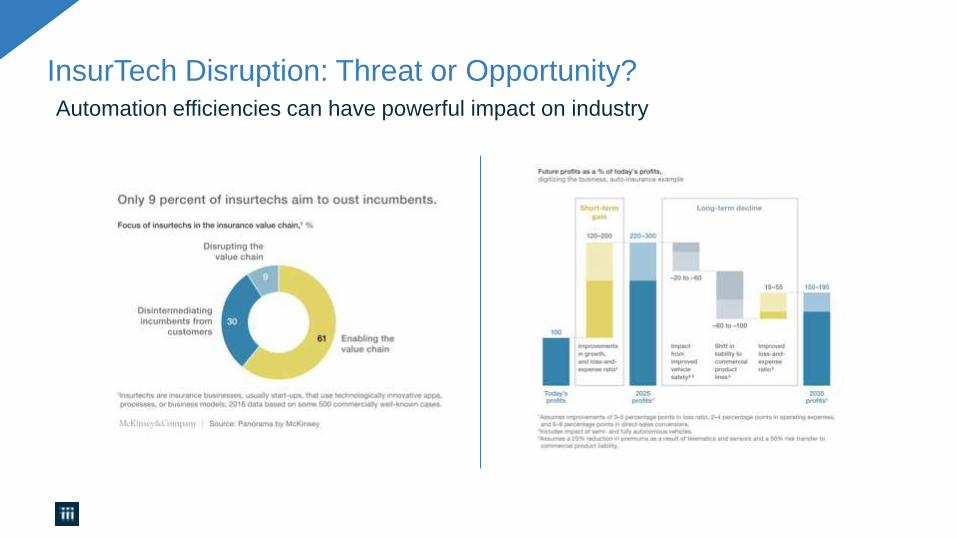
InsurTech Disruption: Threat or Opportunity? Automation efficiencies can have powerful impact on industry

InsurTech Startups Have Broad Range… BUT…Risk Health
Insurance Marketplace
Digital Brokers
Health Navigators
Micro-duration Coverage
Telematics
Peer to Peer
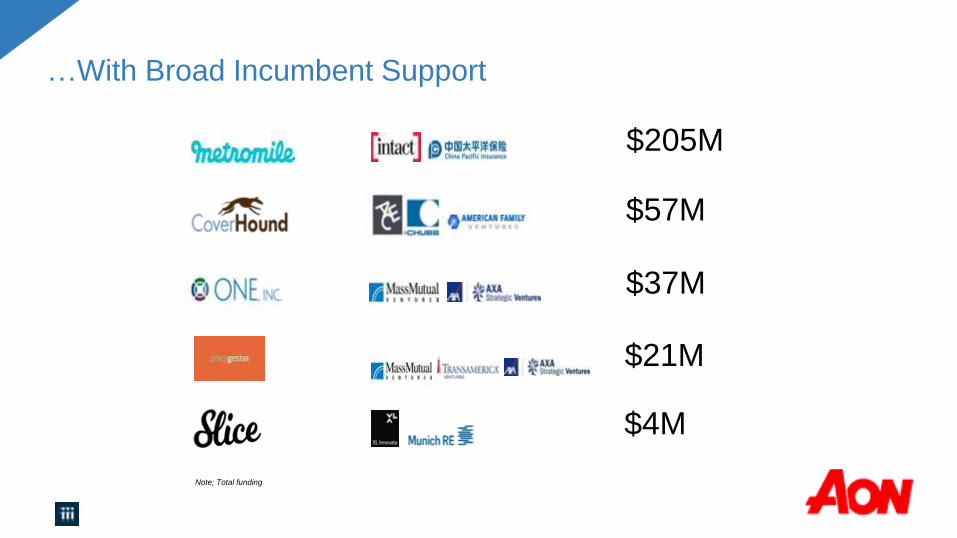
$205M
$57M
$37M
$21M
$4M
…With Broad Incumbent Support
Note; Total funding
Successful Digital Transformation Holistic Approach
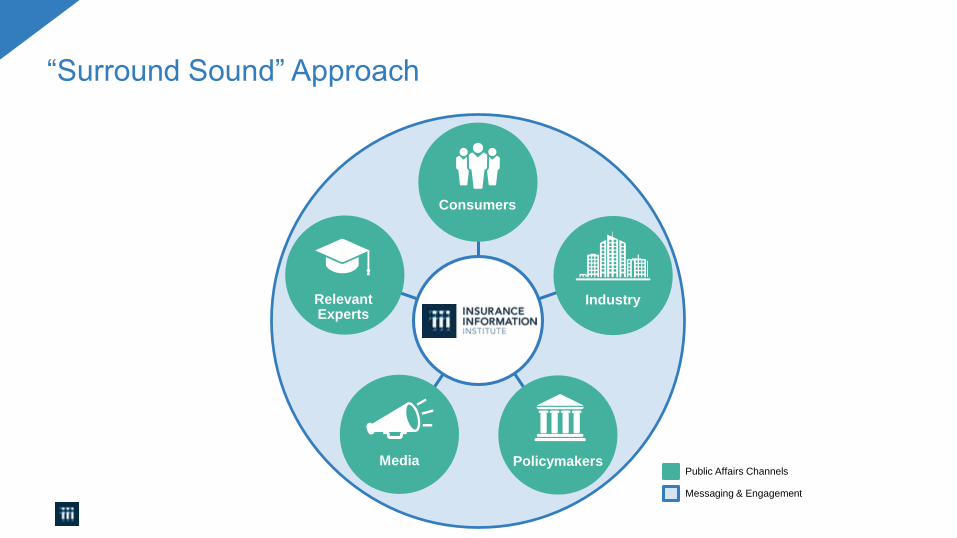
Consumers Industry Policymakers Media RelevantExperts
“Surround Sound” Approach
PolicymakersMedia
IndustryRelevantExperts
Consumers
Public Affairs Channels
Messaging & Engagement
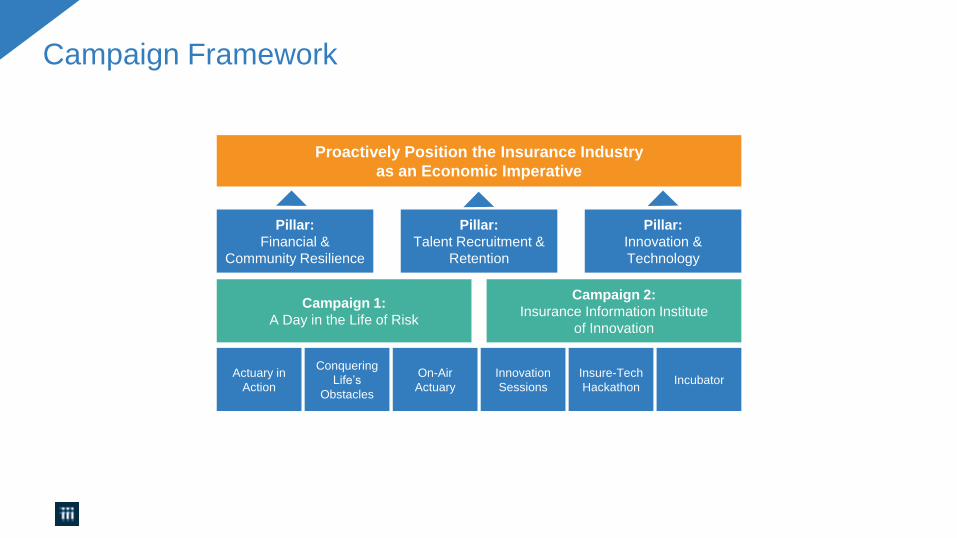
Campaign Framework
Proactively Position the Insurance Industry
as an Economic Imperative
Pillar:
Financial &
Community Resilience
Pillar:
Talent Recruitment &
Retention
Pillar:
Innovation &
Technology
Campaign 1:
A Day in the Life of Risk
Campaign 2:
Insurance Information Institute
of Innovation
Actuary in
ActionIncubator
Insure-Tech
Hackathon
Innovation
Sessions
On-Air
Actuary
Conquering
Life’s
Obstacles
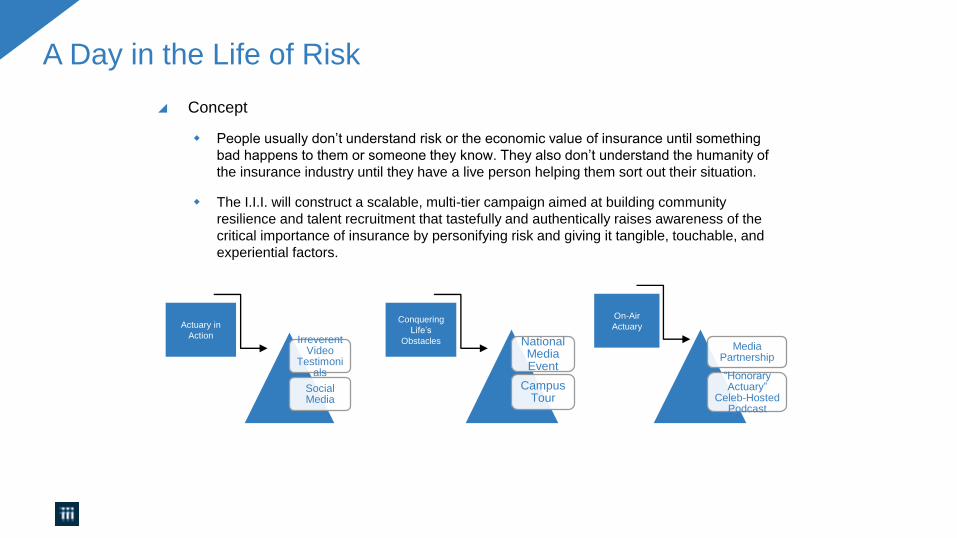
A Day in the Life of Risk
Irreverent Video
Testimonials
Social Media
Actuary in
Action
On-Air
Actuary
Media Partnership
“Honorary Actuary”
Celeb-Hosted Podcast
Conquering
Life’s
Obstacles National Media Event
Campus Tour
Concept
People usually don’t understand risk or the economic value of insurance until something
bad happens to them or someone they know. They also don’t understand the humanity of
the insurance industry until they have a live person helping them sort out their situation.
The I.I.I. will construct a scalable, multi-tier campaign aimed at building community
resilience and talent recruitment that tastefully and authentically raises awareness of the
critical importance of insurance by personifying risk and giving it tangible, touchable, and
experiential factors.
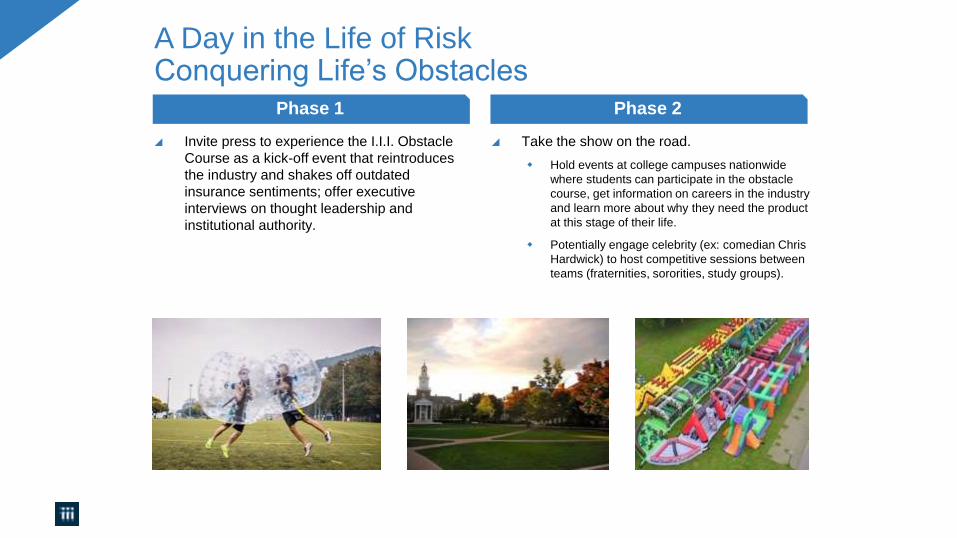
A Day in the Life of RiskConquering Life’s Obstacles
Phase 1 Phase 2
Invite press to experience the I.I.I. Obstacle
Course as a kick-off event that reintroduces
the industry and shakes off outdated
insurance sentiments; offer executive
interviews on thought leadership and
institutional authority.
Take the show on the road.
Hold events at college campuses nationwide
where students can participate in the obstacle
course, get information on careers in the industry
and learn more about why they need the product
at this stage of their life.
Potentially engage celebrity (ex: comedian Chris
Hardwick) to host competitive sessions between
teams (fraternities, sororities, study groups).
Insurance Information Institute of Innovation (I-4)
1:1 Editor
MeetingsSalon
Dinner Series
InsureTec
h Hacks Speaking &
Panel OppsI-4
Hackathon
I-4
Incubator Course-Based Challen
geIncubat
or
Innovatio
n
Sessions
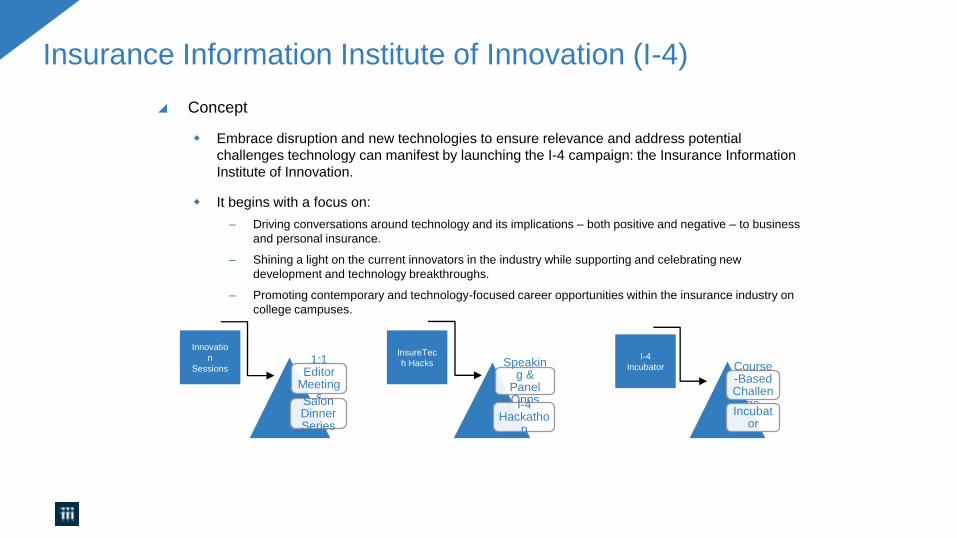
Concept
Embrace disruption and new technologies to ensure relevance and address potential
challenges technology can manifest by launching the I-4 campaign: the Insurance Information
Institute of Innovation.
It begins with a focus on:
– Driving conversations around technology and its implications – both positive and negative – to business
and personal insurance.
– Shining a light on the current innovators in the industry while supporting and celebrating new
development and technology breakthroughs.
– Promoting contemporary and technology-focused career opportunities within the insurance industry on
college campuses.
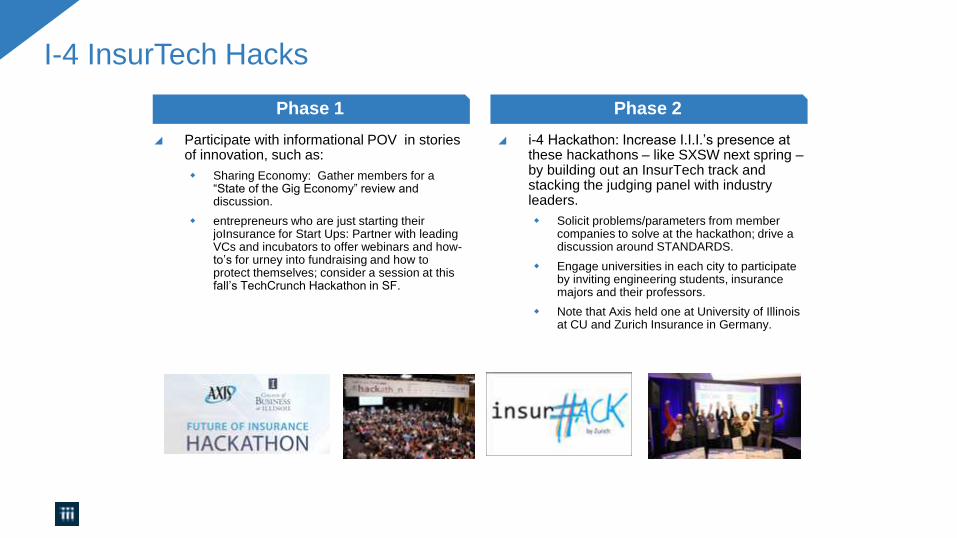
I-4 InsurTech Hacks
Phase 1 Phase 2
Participate with informational POV in stories of innovation, such as:
Sharing Economy: Gather members for a “State of the Gig Economy” review and discussion.
entrepreneurs who are just starting their joInsurance for Start Ups: Partner with leading VCs and incubators to offer webinars and how-to’s for urney into fundraising and how to protect themselves; consider a session at this fall’s TechCrunch Hackathon in SF.
i-4 Hackathon: Increase I.I.I.’s presence at these hackathons – like SXSW next spring –by building out an InsurTech track and stacking the judging panel with industry leaders.
Solicit problems/parameters from member companies to solve at the hackathon; drive a discussion around STANDARDS.
Engage universities in each city to participate by inviting engineering students, insurance majors and their professors.
Note that Axis held one at University of Illinois at CU and Zurich Insurance in Germany.
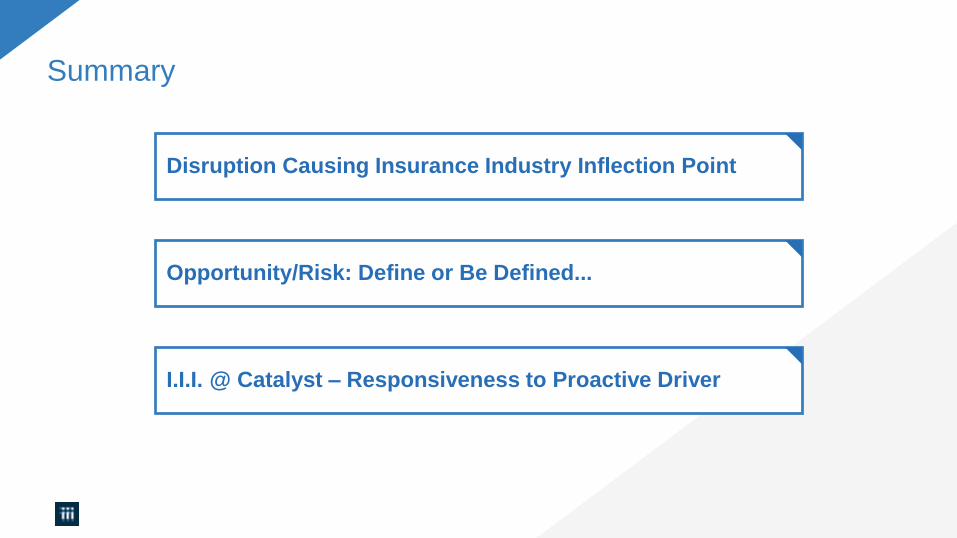
Summary
Disruption Causing Insurance Industry Inflection Point
Opportunity/Risk: Define or Be Defined...
I.I.I. @ Catalyst – Responsiveness to Proactive Driver

Thank You!
Insurance:Leading Through Disruption
Q&A


