Insurance and Rural Development
136
Published on 15 th August, 2019 VOLUME NO. VII ISSUE NO. I MUMBAI JULY - SEPTEMBER - 2019 Rural Development in India Insurance and
Transcript of Insurance and Rural Development

published on 15th August, 2019
VOLUME NO. VII ISSUE NO. I MUMbAI JULy - SEpTEMbER - 2019
Rural Developmentin India
Insurance and

G-Block, Plot No.C-46, Opp. American Consulate, Bandra Kurla Complex, Mumbai - 400 051.

CONTENTS
02 Editorial03 Insurance and Rural Development
in India Venkatesh Ganapathy11 Insurance and Rural Development
G. N. Bhaskar Rau17 Viability of Pradhan Mantri Fasal
Bima Yojana: Roadmap for Rural Development
Vishal Singh Solanki
24 Insurance and Rural Development - Challenges and Opportunities
Sunil Kumar Saxena
Non-Theme Articles
27 Enterprise Risk Management: A New Paradigm to Protect Corporate India and Ensure Sustainable Growth
Delzad D. Jivaasha
33 Applicability of Theory of Value to Life Insurance
Dr. Pothukuchi Purushotham Shastri
39 Note on ALOP / DSU Insurance
V. P. Sharma
49 Accident Analysis and Loss Prevention: Case of Ship Pollution Accidents in Marine Ports
Kambiz Mokhtari
70 A Solution to - Issues Prevailing to Identify Life-Stage Based Investment Solution With Respect to Various Investment Options (Especially Insurance) or Any Other Investment Options – A Study in the Indian Context
Satish Bhatt
74 Substantiation of the Impact of Innovative Human Resource Management Practices (IHRPs) on Employee Commitment and Turnover Intention in Indian Life Insurance Sector
Dr. Shikha N. Khera
Divya Sharma
94 Usage of Technology for Sustainable and Inclusive Growth in Insurance Industry of India
Dr. Pallavi Seth
Prof. Manoj Pandey
105 A Critical Study of Normality of Unit Linked Insurance Funds Managed by Insurance Companies in India
Dr. Hitesh Nasa
Dr. Poonam Talreja Nasa
Prof. P. K. Singh
114 Is Automobile Insurance Dealer Tie-up in India Giving Way to Frauds?
Nisheeth Kumar Maheshwari
118 Takaful Models Shaik Nazeerullah
122 Call for Papers123 Guidelines for Contributors125 Declaration by the authors126 Program Calendar
The Journalof Insurance Institute of India
Notice to Readers Publication of papers and other contribution in this Journal does not necessarily imply agreement with statements made or opinions expressed; for which the respective writers alone are responsible.
Established in 1974 Volume XXXVV
July-September 2019
Editorial TeamArindam MukherjeeShashidharan KuttyGeorge E. ThomasArchana VazeR. K. DuggalP.K. RaoMadhuri Sharma
Editorial AssociateSneha PednekarEmail: [email protected]
Printed and Published by P. VENUGOPAL on behalf of INSURANCE INSTITUTE OF INDIA, Printed at SAP PRINT SOLUTIONS PVT. LTD., 28, Laxmi Industrial Estate, S.N. Path, Lower Parel, Mumbai - 400 013 and Published from INSURANCE INSTITUTE OF INDIA, Plot No. C-46, G Block, Near American Consulate, Bandra-Kurla Complex, Bandra (East), Mumbai 400 051. Editor : Arindam Mukherjee
Editorial Support, Design and Printing by SAP PRINT SOLUTIONS PVT. LTD. Website: www.sapprints.com Email: [email protected]
Follow us on facebook www.facebook.com/#!/pages/Insurance-Institute-of-India/164203300299381
This journal is for distribution among members only and not for sale at any retail outlets or bookstores.
Published on 15th August, 2019
VOLUME NO. VII ISSUE NO. I MUMBAI JULY - SEPTEMBER - 2019
Rural Developmentin India
Insurance and
THE JOURNAL OF INSURANCE INSTITUTE OF INDIA

JULY - SEPT - 20192
RURAL INSURANCETHE JOURNAL OF INSURANCE INSTITUTE OF INDIA THE JOURNAL OF INSURANCE INSTITUTE OF INDIARURAL INSURANCE
edIT
or
Ial
he insurance industry has traditionally found its main clientele among members of the urban formal sector middle class. This is a segment which has regular income and savings, access to credit, and follows
some of financial planning to meet the various needs that arise in the life cycle. Historically, insurance markets have evolved in many countries with growth of industrialization and urbanization, leading to the emergence of this middle class. Not only insurance but other industries as well catered primarily to this segment in India and elsewhere.
India’s rural hinterland today covers about 650,000 villages which are inhabited by about 850 million consumers covering about 69% of the population and contributing half of the country’s GDP. Per capita GDP in rural areas has grown at a CAGR of 6.2% since 2000 and the FMCG sector in rural and semi-urban India is expected to cross USD 20 billion by 2018 and reach USD 100 billion by 2025.
Government interventions and the growth of nonfarm activities, alongwith boosts through income remittance from migrant rural populations have all contributed to rural markets accounting for a significant share of goods and services consumption. Clearly there is a ‘Fortune at the bottom of the pyramid’ here.
Insurance companies have a phenomenal potential that they can tap in rural markets if they know how to approach rural customers, win their hearts and deliver products and services that add value which rural people cherish.
Till date, much of the efforts the industry have been to develop infrastructure that would penetrate the country side and enable insurance distribution. The fact is, selling infrastructure is not the same as selling competence. Insurers would need to do a lot of work including transforming themselves and their role, if they are to win hearts and find a significant place in the rural consumers’ mind.
In the present issue of the journal, we have carried certain articles that delve into the subject of rural markets for insurance. The next issue of the journal would contain award winning articles of the essay writing competitions. The themes for the year 2020 issues of the journal are ‘Insurance and Well-being’ (Jan-Mar 2020) and ‘Insurance and Fraud Management’ (July-Sept) 2020. We invite articles on topics related to these themes.
2
T

3JULY - SEPT - 2019
RURAL INSURANCETHE JOURNAL OF INSURANCE INSTITUTE OF INDIA THE JOURNAL OF INSURANCE INSTITUTE OF INDIARURAL INSURANCE
Insurance and Rural Development in India
Abstract
The contribution of insurance to rural development in India cannot be underplayed. The insurance sector has made a significant contribution to rural development even though there have been issues related to penetration of insurance in rural areas and absence of covers to meet the specific needs of the villagers. A wide variety of covers are now available for the rural areas. Cattle insurance, crop insurance, tractor insurance, credit risk cover, cover for loss of profit due to untimely rain, drought or bush fire – these are some examples. Rural health insurance is also a priority area that the Government is strongly focusing on as part of Integrated Rural Development Programme (IRDP). This paper traces the contribution of insurance to rural development and chalks out the way
forward by which insurance sector can continue to contribute technology-enabled interventions that will support the government’s efforts to achieve rural development.
Keywords
Digital divide, micro insurance, integrated rural development programme, inclusive growth, sustainable development.
Introduction
The insurance sector in India is growing at the rate of 15-20% per annum. Despite this, the truth is that India currently accounts for less than 1.5% of the world’s total insurance premiums and 2% of world’s life insurance premiums. India is the fifteenth largest insurance market in the world in terms of premium volume (Kumari, 2016).
A Swiss Re report highlights the fact
Venkatesh Ganapathy
Presidency Business School,
33/2C & 33/2D, Kempapura, Hebbal,
Bangalore 560 024.
RURAL INSURANCETHE JOURNAL OF INSURANCE INSTITUTE OF INDIA

JULY - SEPT - 20194
RURAL INSURANCETHE JOURNAL OF INSURANCE INSTITUTE OF INDIA THE JOURNAL OF INSURANCE INSTITUTE OF INDIARURAL INSURANCE
that insurance is highly underestimated in emerging markets. The power of insurance to facilitate economic growth and provide economic stability has not been properly exploited. Public-private participation may be needed to enhance the prospects of insurance in rural areas.
As per a report, 82% of India’s 168 million rural households rely on agriculture as a means of livelihood. 117 million poorer households with small
landholdings find it difficult to cope with financial losses when faced with poor harvests or unseasonal rainfall or a fall in the market prices for their crops. This is where insurance can step in to assuage them.
Insurance has provided safety and security to rural populations. The premiums collected by LIC have been invested and returns have been used by Indian government for welfare schemes and subsidies. LIC has also provided employment opportunities to people living in the rural areas.
In the long run, customer lifecycles can be managed through insurance offerings by linking the products to needs that arise during the life of a customer, paired with branchless banking. The right product design and right pricing are essential to make offers meaningful to customers.
Rural development is the need of the hour. It constitutes development of rural regions so that quality of life of rural poor can be improved. Anthropological research is needed to understand the effectiveness of various government schemes aimed at promoting rural development.
Definition of Rural Sector
Villagers in India are primarily concerned about access to clean drinking water, the marriage of their children and having a roof over their head. Villagers are often blasé about benefits offered by insurance. This is the cause of low penetration rates. Villagers tend to think that money spent on insurance is a waste. To overcome this dilemma, there is an urgent need to establish trust before selling insurance. The rural population needs to understand the policies and trust the insurance provider. But it is also important that the latter understands what the needs of the rural population are.
As per National Sample Survey Organisation (NSSO), rural sector is defined as an area with a population of less than 5000. Further, the density of population in the area must be up to 400 per sq km only. At least 75% of the male working population should be involved in agriculture activities. RBI defines rural areas as those areas with a population of less than 49,000 (tier -3 to tier-6 cities).
Rural Development Initiatives in India
• 833 million people in rural area (only 3% insured)
• 19% of India’s total GDP comes from rural India
• Only 4.6% rural households pay income tax
• Number of rural households 195.60 million
• 26% livestock contribution to agricultural GDP
• Households owning cattle 104.52 million
• 75% of rural India survives on Rs 33 per day
• 512 million livestock according to 2012 census
Rural populations are characterized by mass poverty, low levels of literacy and income and high level of unemployment (Panda & Majumder, 2013). Absence of poor health care facilities has been a perennial problem in rural areas. The Government has launched rural development schemes to improve the quality of life of the rural population. Poverty alleviation programs have intended to reduce unemployment and motivate village youth to become entrepreneurs.
Rural development interventions are needed for up liftment of the rural population and achieving inclusive growth. Pro-people policies in India
The contribution of insurance to rural development in India cannot be underplayed. The insurance sector has made a significant contribution to rural development even though there have been issues related to penetration of insurance in rural areas and absence of covers to meet the specific needs of the villagers. A wide variety of covers are now available for the rural areas. Cattle insurance, crop insurance, tractor insurance, credit risk cover, cover for loss of profit due to untimely rain, drought or bush fire – these are some examples.

5JULY - SEPT - 2019
RURAL INSURANCETHE JOURNAL OF INSURANCE INSTITUTE OF INDIA THE JOURNAL OF INSURANCE INSTITUTE OF INDIARURAL INSURANCE
often falter due to poor implementation. Employment opportunities for rural people must be complemented through skill development initiatives. Successful rural development is often a result of transparent policies that are aimed at improving the quality of life of rural people (Pandey et al, 2014).
The Agricultural Insurance Company of India and the National Bank for Agriculture and Rural Development (NABARD) are two organisations that provide a channel through which the states can play a crucial role in the implementation of agricultural insurance. There are strategic collaborations between insurers, agri-businesses and agricultural producer organisations so that integrated risk management approaches can be developed.
In Gujarat, a network was established for sharing knowledge about sustainable agricultural practices as well as marketing of the produce. This led to new marketing channels through which small holder farmers were able to sell 2000 tonnes of mango directly to consumers. Bringing together farmer producer organisations and corporate buyers of agricultural produce is another good way of ensuring a ready market for farmers.
The Government of India has introduced a number of policies for the benefit of the rural population. Pradhan Mantri Fasal Bima Yojna (by Central Govt), Gram Santhosh Rural Postal Life Insurance Scheme by India Post, Rashtryia Swasthya Bima Yojna (by Central Govt), Rajrajeshwari Mahila Kalyan Bima Yojna, a Kissan package policy, and Package insurance for tribals are examples of the policies.
Mahatma Gandhi National Rural Employment Guarantee Act (MGNREGA), Rastriya Sama Vikas Yojana (RSVY), Indira Awas Yojana
(IAY), Sampoorna Grameen Rozgar Yojana (SGRY), Integrated Tribal Development Project (ITDP), Pradhan Mantri Gram Sadak Yojana (PMGSY), Integrated Child Development Services (ICDS), Development of Women and Children in Rural Areas (DWCRA), etc. All these schemes are intended to reduce the gap between rural and urban segments which in turn will expedite the process of rural development.
Rural development schemes (including insurance) have to be a support system for the poor. These schemes should enable, encourage and empower rural population to become more confident. Developmental programs or cash subsidies should not cripple the rural population by making them lazy – instead these programs must encourage the rural populace to face adversities with fortitude and gumption. It is important to highlight real life examples in audio-visual media where insurance has come to the aid of the rural poor.
Crop Insurance – A Reality Check
The vagaries of climate have made agriculture a risky proposition now. Most farmers cannot subsist on any savings because they do not have any. In case there is a crop failure or destruction of crops due to floods, the farmer risks losing his livelihood and more. Despite the existence of a variety of crop insurance schemes, farmer suicides in India have been increasing without showing any signs of abatement.
Micro Insurance in India – A Status Update
In the past, successive Indian governments have taken efforts to use insurance as one of the tools to promote socio-economic development in rural areas. In 2003, a consultative group set up by the Government examined
the status of existing insurance schemes for poor people. The group made the following recommendations (Srivastawa, 2011).
• The growth of micro insurance in India was sub optimal with poor penetration in rural areas and less awareness about micro insurance among the urban poor.
• The schemes were complex and there was an urgent need to make them simple.
• Promotion of micro insurance at grass root level requires the involvement of nongovernmental organisations.
• Tie ups between insurers and social organisations are needed to promote micro insurance.
Need For Innovations in Micro Insurance
Innovations to address constraints of developing economies have led to extension of micro insurance schemes to mature economies as well. Innovations in the form of new products, distribution channels and segments characterize micro insurance.
Micro insurance helps insurers to increase insurance adoption and drive growth. Innovations across the value chain can lead to social and economic impact. Innovations are needed to tackle tough development challenges and arrive at inclusive solutions that enhance service delivery to the poor. Index-based agricultural micro insurance is more cost-effective and can lead to trust between insurers and insured.
Sustainability is important for an insurer. The market at the bottom of the pyramid (a marketing philosophy that was made popular by C K Prahlad and Gary Hamel) is immense; the economies

JULY - SEPT - 20196
RURAL INSURANCETHE JOURNAL OF INSURANCE INSTITUTE OF INDIA THE JOURNAL OF INSURANCE INSTITUTE OF INDIARURAL INSURANCE
of scale can drive profits from huge volumes despite low margins. However, the mindset of the insurance company must change; in Indian villages, there is a myth that insurance is something that will benefit you only when you die; this highlights the need for consumer engagement and education to drive awareness among the low income households.
Designing innovative products is only part of the story; innovative distribution and a simple claims procedure is what it takes to grow the micro insurance portfolio. If we make the poor run from pillar to post to get payment of their claims then micro insurance cannot stake a claim to be a cover for the marginalized.
Low-income households may not understand what risk protection is all about. They may feel that unless the insured event happens, the money that they spend for premium may be a waste. A term life product that gives cash benefit on survival of the policy term becomes attractive.
Cultural factors must be considered while designing micro insurance products. The products have to be simple and communication must be in local language. People may be more willing to discuss a life plan rather than something called as funeral insurance. Promoting efficiency to cut down on administrative expenses is important. Efficiencies can be brought about by simple products, procedures, non-traditional delivery channels and deployment of technology. Use of hand held devices to manage claims along with innovative premium payment options are essential for achieving scale.
It needs to be remembered that unless micro insurance is sustainable, benefits cannot reach the poor. So, insurers
must attempt to strike a balance between social obligations towards the marginalized sections of society and business interests.
Why Do We Need Inclusive Reforms Today?
It is imperative that we understand the requirements of India’s villages, their daily lives, their peculiar needs and occupational structures. Rural market provides tremendous growth opportunities for insurers; the latter need to develop viable and cost effective distribution channels. Exclusive rural centric products are needed and so are a few satellite research centers. Sale of low ticket items must not be given lower preference.
While arguing for the need to drive inclusive growth, Bansal & Bansal (2015) highlight four elements that are vital for inclusive reforms. These are accelerating job creation, giving an impetus to manufacturing, raising farm productivity and increasing public spending on basic services. Increased investments in agricultural infrastructure and research are important to raise the average farm yield per hectare. Gains in agricultural productivity will lead to reduction in disguised unemployment. Excess farm labour can be deployed for nonfarm jobs.
Deen Dayal Upadhyaya Gram Jyoti Yojana for power supply to rural areas, encouraging rural youth to become local entrepreneurs and Neeranchal program to give emphasis to watershed development. Improved methods of irrigation are in vogue in many rural pockets now.
Unsustainable land management practices have led to degradation of soil. This is an area of concern. 5th December is celebrated as world soil day. Government should drive
awareness in this area. The motto for Rural development “Sab ka Saath Sab ka Vikas”has to be followed in letter and spirit.
In the last few years, rural India has experienced a higher growth trajectory. Increase in investments in rural infrastructure (transport, connectivity) and establishment of rural health centers have led to progress on this front. However, more needs to be done. Economic empowerment of women and rampant use of self help groups will lead to immense benefits that can contribute to rural development (Pandey et al, 2014).
Where There Is a Wheel – The “Pudukottai” Experience
Pudukottai is a district in Tamil Nadu that has many of its residents living below the poverty line – some of them work as laborers in stone quarries. Mobility was an issue for the women. They had to rely on their men folk or depend on public transport to travel. The then collector Smt. Sheela Rani Chunkath decided to involve the community in the literacy program; she combined this with a training drive to make rural women learn cycling; thus women who took part in the literacy program also learnt how to ride a cycle and then a two-wheeler. These women later on became volunteers for the literacy cum mobility drive inspiring other women to join the movement. Involvement of women from the community was the main reason for the success of this path-breaking initiative.
Lessons from this success story can be used to popularize growth of micro insurance; any micro insurance innovation that doesn’t involve the community will be sub-optimal. Women living in rural areas can be empowered to drive growth of micro insurance and

7JULY - SEPT - 2019
RURAL INSURANCETHE JOURNAL OF INSURANCE INSTITUTE OF INDIA THE JOURNAL OF INSURANCE INSTITUTE OF INDIARURAL INSURANCE
advocate innovative offers and financial literacy.
Assocham Report
In the paper – “Rural India and its new investors” Assocham (Associated chambers of commerce and industry) says that insurers can tap opportunities for growing business in agricultural, housing, education and auto loans. Only 8-10% rural households are covered under life insurance schemes and the remaining 90% can be targeted for new innovative insurance schemes.
In the last few years, rural India’s income has increased due to lesser reliance on agriculture and incomes resulting from non farm agricultural income like dairy, food processing and packaging. Insurers should interact with local government/ development agencies and panchayats.
Nearly 20% of all farmers own a Kissan Credit Card. The 25-30 million credit cards offer a huge database for
insurance companies. An extensive network of rural agents can be set up to ensure smooth distribution of insurance products. The rural agents can play a major role in creating awareness about rural insurance schemes.
Rural markets are virgin territories the potential of which can be tapped by the insurance sector through smart strategies. However, what is also needed is that the requirements of people have to be judged correctly. Insurance covers for the rural population must be affordable and relevant to their requirements.
Rajendra Singh - The Water Man of India
Since 1984, Rajendra Singh has been dedicating himself to rural development. He formed the Tarun Bharat Sangh and began rallying villagers for the repair and deepening of rainwater storage tanks.
When he first came to Alwar (in Rajasthan) in 1985, the forests had been
destroyed. The watershed was damaged by miners and loggers. This led to heavy floods during monsoons. Singh introduced Gram Sabhas, Mahila Banks and River Parliament in each village and initiated an awareness campaign for the empowerment of hundreds of villages. Water conservation efforts began in Gopalpura village in 1985. He built (with the support of villages) 8600 water tanks in 1058 villages spread over 6500 sq km in nine districts of Rajasthan.
Rajendra Singh and his organisation, the Tarun Bharat Sangh, have dedicated themselves to rural development since the last 22 years.
People like Rajendra Singh can be used as influencers to create awareness about rural insurance programmes and how these can support developmental efforts.
Way Forward: A Few Recommendations

JULY - SEPT - 20198
RURAL INSURANCETHE JOURNAL OF INSURANCE INSTITUTE OF INDIA THE JOURNAL OF INSURANCE INSTITUTE OF INDIARURAL INSURANCE
Insurers need to understand the specific needs of rural areas (safety of crops, livestock cover, asset dependency, agricultural vehicles etc). For example, there are different breeds of livestock holdings with varying susceptibility to diseases but no customised product offerings. This has resulted in lower penetration.
Besides the absence of need based products, inadequately qualified distribution channel has become another stumbling block. District co-operative banks, co-operative societies, NGOs and central service centres have been bestowed the wherewithal to distribute insurance in rural areas. Diverse customers spread through 638,635 villages across the states and union territories of India present a great untapped opportunity. Another encouraging trend is that purchasing power parity of the rural population is steadily growing.
Strategic tie-ups with Grameen Banks and postal services are needed to improve the penetration of rural insurance. Channels like E-Choupal are used by farmers for procurement of agricultural products and sale of their produce by eliminating the role of middle men.
No rural poverty alleviation programs can afford to exclude agricultural development. Sustainable development is the result of systematic risk mitigation. Penetration of insurance in rural areas will benefit a great deal from enhancement of educational system. Posters, local folk arts and street plays are tools that will create awareness about insurance among the rural population. Expansion of customer base through affordable, accessible and flexible insurance products is the need of the hour.
Insurers can learn from the popular bottom of pyramid model as well as the successful Grameen Bank model of Bangladesh. Doing market research using management students can provide rare insights about the needs of low income communities. Locally recruited and trained young graduates can work well as agents. Customers should understand the products sold to them. Plans have to contain simple descriptions and licensing requirements for micro insurance must be less stringent.
The conventional agency model needs replacement with an innovative mechanism where the agent (mostly from the community itself) is trained and manages customer relationships, premium collection and claims payment.
Product innovation in micro insurance cannot be seen in isolation from innovations in distribution; an innovative product that is not accessible to customers makes little sense. Promotions must be evangelistic – with the intention of turning customers into advocates for products sold. Trust and credibility play a vital role in micro insurance and only community involvement can drive this.
Micro insurance products must be well-integrated with other savings products. Claim rejections must be minimized; benefits of volumes and scaling up of the model must be adequately leveraged. Innovative distribution channels like retailers, mom and pop shops, schools, temples and churches must be used to distribute micro insurance.
Micro insurance should not be treated as a scaled down version of regular insurance. The product and processes must be reengineered to meet the preferences of the low income market.
When it comes to micro insurance, innovation is more than a response to customer demand for more convenient ways to interact – it is an operational imperative. Geographic isolation of rural communities, lack of infrastructure and illiteracy should drive insurers to develop new tools and combine them in novel ways with existing systems and devices. Financial inclusion must include micro insurance as an integral component.
Micro insurance is a tool to fight social exclusion. It is social protection coverage outside the formal economy.
While some experts say that there is a need for a market driven approach to provide services to low income households, the opinions are mixed. IAIS feels that there is a need to move away from market based approach. There are limits to extending the Bottom of Pyramid business model. Overselling is not going to help. Empathy-based selling is what is needed. Micro insurance is only one of the tools for risk protection.
Utility companies, cell phone manufacturers, micro finance institutions, retailers and consumer co-operatives can be used for distribution of micro insurance products. Regulation must encourage public-private participation to underwrite micro insurance on a profit-sharing basis. Private insurers can design new micro insurance products that can be sold through distribution channels of public insurers. Claims payment is the moment of truth for micro insurance, so design of new products must bear this in mind. Across the globe, a consortium of insurers underwrites micro insurance with an aim to broaden the scope and deepen the reach of micro insurance. Gandhian innovation focuses on decentralization, accessibility,

9JULY - SEPT - 2019
RURAL INSURANCETHE JOURNAL OF INSURANCE INSTITUTE OF INDIA THE JOURNAL OF INSURANCE INSTITUTE OF INDIARURAL INSURANCE
sustainability and affordability of new products and services. Here the main thrust is not on wealth but on people.
Micro insurance is a low price – high volume business; its success depends on keeping the transaction costs down.
Conclusion
Development of agriculture, village, cottage industries and crafts is a must for rural development. Community services and facilities along with better resource mobilization and utilization are vital. The development vision must include human, social, economic and environmental aspects. Rural development will get a fillip through proper infrastructure development. Success of rural developmental efforts will lead to increase in rural incomes and economic prosperity which will eventually pave the path for a better society.
IRDA should create provisions to protect interests of the rural poor. Spreading awareness about insurance through community development programs, NGOs and charitable trusts can be a good step. Postal agents, doctors, co-operative societies, NGOs, unemployed youth, rural banks can be used as channels for distributing insurance in rural areas.
Comprehensive solutions tailor made for the rural sector are very much needed. Policies can also include losses incurred in natural calamities apart from losses caused due to unpredictability of weather. But administration of the policies for rural India needs a completely different approach. This is something that IRDA needs to think about.
There is a need for both public and private insurers to join hands to improve penetration of rural insurance
in India. Crop insurance can be made compulsory. Some experts have suggested that Government can consider paying the premium for small farmers and hold officials accountable for successful implementation of crop insurance schemes.
Rural areas need insurance protection to protect human life and income generating rural assets. Since independence, a large number of rural districts have witnessed significant growth. The potential of rural agencies can be tapped. Rural banking system needs to be strengthened and provisions must be made to use them for distributing insurance.
Filing and settlement of claims has always been a grey area. The integrated rural development programs did not meet with much success. This gap needs to be addressed on a war footing. Educated unemployed youths can be trained so that they become valuable assets for insurance companies.
For too long, India has been complaining of low insurance penetration in rural areas. It is time to develop a strategic vision to increase insurance penetration. Formulation of policies is only one part of the story. Implementation of these policies at the grass root level is very much needed.
Since independence, the Indian government has introduced a slew of policies and developmental programmes for up liftment of rural areas, hinterlands and mofussil areas. Insurance schemes are one of them. However, we need to emphasize the fact that insurance per se is only a risk mitigating mechanism and not something that can generate income for livelihoods. The objective of insurance is to protect people and assets from risks. Insurance should help people when they need it the most.
Insurers should understand the specific needs of the rural segments and not supply them with standard covers that may or may not be relevant to them. Specific risk covers are essential to attract rural segment of the population to insurance.
Expansion of insurance in rural areas and growth of customer base can help in generating local employment opportunities which in turn can lead to rural development. But this alone is
Development of agriculture, village, cottage industries and crafts is a must for rural development. Community services and facilities along with better resource mobilization and utilization are vital. The development vision must include human, social, economic and environmental aspects. Rural development will get a fillip through proper infrastructure development. Success of rural developmental efforts will lead to increase in rural incomes and economic prosperity which will eventually pave the path for a better society.

JULY - SEPT - 201910
RURAL INSURANCETHE JOURNAL OF INSURANCE INSTITUTE OF INDIA THE JOURNAL OF INSURANCE INSTITUTE OF INDIARURAL INSURANCE
not enough. All the rural development programmes must complement each other so that rural development happens on a continuous basis and sustains in the long run.
It is not as if the developmental programmes have not had any impact at all. Micro insurance may not have been a huge success in India but it has definitely made an impact. The national rural employment guarantee scheme also has been successful with examples of many villagers having benefited from the scheme. The success of rural co-operative movement (Amul) in Gujarat is another example that we ought to be proud of. ITC, a private organisation used technology to educate farmers about crops and oilseeds (e-choupal). This ensured that the farmers got the right prices for their produce eliminating the need for middle men. NGOs have been doing pioneering work in some of the villages and they have contributed in no measure to rural development in India.
Introduction of scientific methods of farming like drip irrigation in certain rural pockets has resulted in exemplary benefits for farmers in terms of improved agricultural yield and increased farm productivity. It is rather unfortunate that crop insurance has not made significant inroads in rural areas. The failure of crop insurance needs a deeper analysis. Is the crop insurance cover sufficient for farmers? Do farmers trust crop insurance? Trust is important in rural areas. Mahindra & Mahindra used the buzz marketing technique to create awareness about benefits of tractors. The village headman was taken into confidence. Once he was convinced about the efficacy of
tractors, he lost no time in propagating a message directed at the community. Asian Paints also painted the house of the village sarpanch to drive home the benefits of paints in the villages. These success stories tell us only one thing – community involvement is important to popularize insurance in villages and rural development cannot happen without community involvement.
Mobile penetration is the largest in
India. Now it is time for the Indian
government to take steps to bridge
the digital divide and encourage both
public and private insurers to leverage
business opportunities in rural areas.
There is a lot that insurance companies
can do to promote rural development.
Their role need not be limited only to
collection of premiums, issuance of
policy and administration of claims.
Insurers have to overstep their
conventional roles to bring about
social awakening and transformation in
rural areas and engineer changes that
will lead to a society that is enriched,
empowered and exalted. Though we
cannot expect change overnight, a
gradual shift is certainly possible.
Private insurers and public insurers
must join hands under the overarching
framework provided by IRDA and work
towards the cause of rural development
in India.
Insurance as an essential component
of the Indian government’s financial
inclusion agenda must be given the
necessary visibility that it deserves
especially in the rural hinterlands.
The truth is that when it comes to
development efforts in an agrarian
country like India, the sky is the limit!
References
https://www.thebetterindia.com/132515/rajendra-singh-water-man-rajasthan-rainwater-storage-forest/
Srivastaw, S. K. (2011). Micro Insurance: A Spectacular View on Rural Development in India. Indian Journal of Applied Research, 3(8), 96-97. doi:10.15373/2249555x/aug2013/31
Bansal, B., & Bansal, A. (2015). Better Governance and inclusive reforms: A key towards Rural Development in India (Challenges to Inclusive Growth in the Emerging Economies). International Journal of Scientific and Research Publications, 5 (10).
Gupta, A. K. (2014). Life insurance market: the rural India connect. Management Insight, 10(1).
Kumari, J. (2016). Role of Insurance in Economic Development of India. Imperial Journal of Interdisciplinary Research, 2(12).
Panda, S., & Majumder, A. (2013). A Review of Rural Development Programmes in India. International Journal of Research in Sociology and Social Anthropology1, 2, 37-40.
https://www.giz.de/en/worldwide/29273.html
https://www.icicilombard.com/online-insurance-info/rural-insurance-sector-in-india.html
https://www.thehindubusinessline.com/2001/06/23/stories/042341ju.htm
http://www.banknetindia.com/banking/80714.htm
Pandey, A. C., Bahuguna, R., & Jamwal, M. (2014). A Critical Analysis of Rural Development Interventions for Inclusive Growth (A Case of Uttarakhand, India.
http://www.iosrjournals.org/iosr-jbm/papers/Conf.17037-2017/Volume-1/3.%2012-17.pdf

THE JOURNAL OF INSURANCE INSTITUTE OF INDIA
11JULY - SEPT - 2019
RURAL INSURANCETHE JOURNAL OF INSURANCE INSTITUTE OF INDIA THE JOURNAL OF INSURANCE INSTITUTE OF INDIARURAL INSURANCE RURAL DEVELOPMENT
Introduction
Development is, strictly considered, not a word but a process – a process in continuum.
In fact, ‘development’ does not render fuller meaning unless it is adjoined with an epithet – like, personal development, social development, economic development etc. This suggests that development may be defined as successive additions of improvements. Dudley Seers, in his article ‘The Meaning of Development’ writes that “’Development’ is inevitably treated as a normative concept, as almost a synonym for improvement”
Some development economists say that development is a process and not a goal.
Further, we have various types of indices to measure the levels of development of a given geographical area – including that of Nations:
1. Physical Quality of Life Index (PQLI)
Morris (1979) combined three main physical indicators; life expectancy at age 1, infant mortality and adult literacy to construct the PQLI and used it for a cross-country comparison. The index enables researchers to rank countries not by incomes but by the performance of country in meeting their people’s basic needs.
2. Human Development Index (HDI)
The HDR 1990 constructed a composite index, the Human Development Index (HDI) on the basis of three basic dimensions of human development- to lead a long and healthy life, to acquire knowledge and to have access to resources needed for a decent standard of living. The HDI contains four variables to represent the three dimensions- life expectancy at birth, to represent the dimension of a
Insurance and Rural Development
G. N. Bhaskar Rau Former Research associate and Faculty,National Insurance Academy, [email protected]

THE JOURNAL OF INSURANCE INSTITUTE OF INDIA
JULY - SEPT - 201912
RURAL DEVELOPMENT
long, healthy life, adult literacy rate and combined enrolment rate at the primary, secondary and tertiary levels, to represent the knowledge dimension, and real GDP per capita (at purchasing power parity (PPP$), to serve as a proxy for the resources needed for a decent standard of living. HDI is similar to PQLI in terms of the indicators but differs on the inclusion of income level in HDI and exclusion of the same from PQLI.
3. Gender-Related Development Index (GDI)
GDI takes into account gender inequality in its overall assessment of aggregate human development in a country. GDI measures in the same dimension as HDI, discounting them for gender inequality. This means GDI should be interpreted as HDI discounted for gender disparities in its three components and should not be interpreted independently of HDI.
4. Gender Empowerment Measure (GEM)
GEM consists of three indicators which are focusing on empowerment dimension. The selected indicators are male and female shares of parliamentary seats, male and female shares of administrative, professional, technical and managerial positions, and power over economic resources.
GDI and GEM are both known as rarely used indices which receive minimal attention and have not been highlighted in the international press. This is because of their limited information and empirical value added (Schuler, 2006).
5. Social Development Index (SDI)
Multiple indicators have been used to construct this index. These selected indicators represent urbanization and industrialization, health conditions, nutritional level, level of education and
social communication dimensions. However, although SDI includes a large number of social indicators to represent level of development, the economic condition of 102 countries are being ignored as no financial variable is included. This is one of the limitations of SDI in presenting a more holistic view of the development.
6. Human Poverty Index (HPI)
The HPI for developing countries incorporates three types of deprivation as important dimensions of poverty- in survival, in education and knowledge, and in economic provisioning (Krishnaji, 1997). Survival deprivation is measured by the percentage of people (in a given country) not expected to survive to age 40 years meanwhile deprivation in education and knowledge is measured by the adult literacy rate. Deprivation in economic provisioning is computed as the mean of three variables: percentage of population without access to safe water, population without access to health services and malnutrition among children less than 5. The HPI is then obtained as the cube root of the average of cubes of the three above components of deprivation.
The HPI can be used in at least three ways- as a tool of advocacy, as a planning tool for identifying areas of concentrated poverty within a country, and as a research tool. This composite index has several advantages in determining the social state of development in terms of poverty level for each country.
7. Multidimensional Poverty Index (MPI)
MPI constitutes a set of poverty measures which can be used to create a comprehensive picture of people living in poverty. The index offers a valuable complement to traditional income-
based poverty measures by considering multiple deprivations at the household level. The index identifies deprivations across the same three dimensions as the HDI with ten indicators; two represent health (malnutrition, and child mortality), two are educational achievements (years of schooling and school enrolment), and six aim to capture standard of living (access to electricity, drinking water, sanitation, flooring, cooking fuel and basic assets like a radio or bicycle). The three broad categories–health, education, and living standards–are weighted equally (one-third each) to form the composite index which shows the number of people who are multi-dimensionally poor (suffering deprivations in 33% of weighted indicators) and the number of deprivations with which poor households typically contend (Alkire & Santos, 2010). The MPI relies on three main databases that are publicly available and comparable for most developing countries.
All the above measures take into account three basic factors for evaluating the capital value of an individual.
It is an established theory with
sufficient empirical studies to prove
that an individual is ‘capitalised with
an economic value’ by imparting levels
of educational standards (schooling
years), and inputting skill sets (training)
and by ensuring certain status of health
conditions to the individual.
There is also plenty of research
literature to establish a definite link
between these three factors and their
combined resultant human capital
value with the economic growth in the

THE JOURNAL OF INSURANCE INSTITUTE OF INDIA
13JULY - SEPT - 2019
RURAL DEVELOPMENT
individual and also in his residential province.
A passage in the write up “The impact of human capital on economic growth: a review” by Rob A. Wilson, Geoff Briscoe, quotes a survey of Sienasi by John Van Reenen:
“After surveying the empirical results from a wide range of model specifications, Van Reenen (2000) concluded that an overall 1 % increase in school enrolment rates leads to an increase in GDP per capita growth of between 1 and 3 %. An additional year
PER CAPITA INCOME
LIFE EXPECTANCY
YEARS OF SCHOOLING
EDUCATION
HEALTH
STANDARD OF LIVING
HUMAN DEVELOPMENT INDEX
of secondary education which increases the stock of human capital, rather than just the flow into education, leads to more than a 1 % increase in economic growth each year.”
A nation’s investment in providing education, training and health to its citizens – which are the economic indicators in an individual – is an investment in the nation’s economic growth.
“The origins of the HDI are found in the annual Human Development Reports produced by the Human Development
Reports Office of the United Nations Development Programme (UNDP). These were devised and launched by Pakistani economist Mahabub ul Haq in 1990, and had the explicit purpose “to shift the focus of development economics from national income accounting to people-centered policies”. Haq believed that a simple composite measure of human development was needed to convince the public, academics, and politicians that they can and should evaluate development, not only by economic advances but also improvements in human well-being. (Wikipedia)
Generally, the higher the education the more awareness of the importance of health and hygiene, which would in turn likely increase the life span and the work span of an individual. Higher the education and longer the work span would tend to increase one’s per capita income.
Economic development of individuals and their living region – say the rural areas – together with the infrastructural development of these areas (rural regions) will ensure lesser migrations for want of opportunities, which will in turn ensure overall national development without any lopsided
growth features. Because, it is generally believed that lack of ‘opportunities’ (like proper schooling and better education, regular income jobs, facilities to live with minimum comforts, timely health care etc.) in rural areas “push” the rural population to seek such opportunities in near and far urban areas and while the availability of such ‘opportunities’ in the urban areas “pull” the rural population like magnets and they migrate in search of such greener pastures.
“As per the 2011 Census, 68.8 per cent of country’s population and 72.4 per cent of the workforce resided in rural areas. However, steady transition to
urbanization over the years is leading to the decline in the rural share in population, workforce and GDP of the country. Between 2001 and 2011, India’s urban population increased by 31.8 per cent as compared to 12.18 per cent increase in the rural population. Over fifty per cent of the increase in urban population during this period was attributed to the rural-urban migration and re-classification of rural settlements into urban.” (Ramesh Chand et al)
For the greater part, these migrations are mostly out of compulsion and not out of volition. This suggests that the rural population might not migrate if
The following diagram shows the linkages of the indicators with the indices of human development status.

THE JOURNAL OF INSURANCE INSTITUTE OF INDIA
JULY - SEPT - 201914
RURAL DEVELOPMENT
there were sufficient developmental activities in their own areas providing them enough of the said sought after ‘opportunities’.
Further, the human development index is a very well neigh proxy to human capital or asset value – with affordable income levels – which would create explicable market segments in the rural regions of India for both life and non-life insurers.
Indian Government, indeed, have in place, several developmental programmes for the uplift of the rural masses and their living conditions – some of them are implemented directly, and some indirectly, through local authorities like States and Panchayats.
Without going into the various reasons (which discussion is extraneous to this Paper), Rural India still craves for greater, wider and deeper attention in obtaining the minimum basic amenities, infra-structural facilities and decent opportunities for education, health and living conditions.
Succinctly said, real rural development can begin to happen only when there are sufficient:
Internal Roads in villages
Roads leading out to reach the nearest market places
Drainage canals for waste water
Closed toilets
Electricity
Schools for Primary to Secondary education
Vocational training centres
Well equipped Primary Health centres
Resident teachers and Medicos
The above minimal facilities will ensure to some extent the availability of the three basic ingredients – education, skills, and health – and also a certain
standard of living to the people which go to make them gain human capital values which will, in turn, help trigger local rural economic growth.
When there is an all round economic growth there could definitely be avenues for protection of such a growth and the acquired capital values through proper insurance covers.
We know that insurance companies – especially life insurance companies – are huge financial institutions with three important financial activities – collecting premiums into a fund, paying claims out of the fund and investing the balance of the fund.
It is the third financial function of an insurer which can link it up itself – directly – in the great task of rural development in India.
Insurance and Rural DevelopmentThe specific purport of this Paper is to consider whether insurance can be used as a tool for developing rural India – vis-à-vis the above discussions of the various indices to measure the development of any given area.
It is not proposed here to discuss at length the entire IRDA regulated investment portfolio of the insurers. And, by its own nature of business, life insurers do have a greater role to play in national developmental activities and especially in the rural areas.
We shall consider Life Insurance Corporation of India (LIC) – the longstanding premier life insurer – as an example for our further discussions on the topic of insurance vis -a- vis rural development.
LIC has eight avowed objectives and the relevant ones for our reference, with emphasis added by the author, are:
• Bear in mind, in the investment of funds, the primary obligation to its policyholders, whose
money it holds in trust, without losing sight of the interest of the community as a whole; the funds to be deployed to the best advantage of the investors as well as the community as a whole, keeping in view national priorities and obligations of attractive return.
• Meet the various life insurance needs of the community that would arise in the changing social and economic environment.
We can see that there has been a due concern of the Corporation in keeping in mind the interests of the community as a whole (not the policyholders alone) while investing its funds.
Even the Insurance Regulator (IRDA) has its concern in the development of the community as a whole and has stipulated the condition of investments in socially oriented programmes.
LIC has always been in the fore run in the matter of uplift of the poorer sections of the Indian population and the following excerpt from the LIC Annual Report 2017 – 2018 is cited in relevance to the topic in discussion in this Paper.
Investment in Social SectorThe total investments of the Corporation amounted to 27, 36, 762.36 crores as at 31 March, 2018. …….The Corporation subscribed an amount of 1, 09,633.70 crore (Book Value) and 1, 51,857.67 crore (Book Value) to the Securities of the Government of India and the new loan issues of the various State Governments (including other approved securities) respectively during 2017-18.
Social Responsibilities
It has been the constant endeavor of the Corporation to provide security to as many people as possible and to channelize the savings mobilized for the welfare of the people at large.

THE JOURNAL OF INSURANCE INSTITUTE OF INDIA
15JULY - SEPT - 2019
RURAL DEVELOPMENT
To meet this end, the Corporation has been promoting Social Welfare through investments in Infrastructure and Social Sector which includes:
* Projects/Schemes for generation and transmission of Power
* Housing Sector
* Water Supply and Sewerage Projects/Schemes
* Development of Roads, Bridges, Road Transport & Railways
The total Investment in these sectors during 2017-18 was 41,418.35 crore as indicated in Table 7. The investments as at 31.03.2018 by way of Central, State and Other Government Guaranteed Marketable securities, Loans, Debentures & Equity investments in Infrastructure and Social Sector amounts to `19, 55,273.67 crore.
LIC Golden Jubilee Foundation“LIC Golden Jubilee Foundation” was established in the year 2006 as a part of LIC’s Community Service initiatives. The objectives of the Foundation are Relief of poverty or distress, Advancement of Education, Medical Relief and Advancement of any other object of General Public Utility. As on 31.03.2018, LIC has provided a corpus of 180 Crore to the Foundation and the interest earned is utilised for funding various projects for charitable purposes. Since inception, the Foundation has supported NGOs dedicated to the above objectives through 444 projects which are located across the country. The Foundation has reached out to many deprived sections of society through the infrastructural support provided in the above areas.
The Foundation has supported cost of treatment for children afflicted with cancer and undergoing treatment at TATA Memorial Hospital, Mumbai. Till date, 110 beneficiaries have been benefitted from the scheme across the country. The Foundation has funded for purchase of bus for transporting cancer patients from Tata Memorial Hospital,
Mumbai to Tata Research Centre at Navi Mumbai.
LIC GJF has adopted the poorest village, Govindpur under Sonbhadra District of Uttar Pradesh for Community Development activities, related to Literacy Campaign and Medical relief.
LIC Golden Jubilee Scholarship Scheme is another initiative of the Foundation, which provides scholarships at the rate of 10,000/- p.a to children from economically weaker sections of the society to pursue higher education till they complete their graduation /professional course. As on 31.03.2018, 15,196 students have benefited from the scheme.”
Economic Development vs. Human DevelopmentWhile the financial efforts of the life insurer mentioned above – mostly “conventional factors of production” and inputs– in improving the economic development in the rural areas are great and quite laudable, it can be seen that they (the inputs) are not directly affecting human development in the rural population, “by the development of human resources” of the rural population. In other words, these investments by the insurer should be made directly – with the involvement of reputed NGO’s and other social organizations, as in the case of LIC GJF investments – in rural education, training and health programmes, which alone will improve the human index of the rural people.
“………. facts suggest that setting up of industries and improvement in infrastructure are not sufficient conditions for increasing employment in rural areas. Improvement in industrial infrastructure in rural areas must be accompanied by effective human resources development programmes to impart necessary skills and training to rural youth to match the job requirement in manufacturing sector.” (Ramesh Chand et al)
The stress as given in the above quote of Niti Ayog should be on human development along with the other infrastructural developments in the rural areas.
Mere rural economic developmental activities will not ensure the desired results of human development of the rural people, which is the real rural development.
The following quotes are relevant here.
“Evidence rapidly accumulated showing that only a portion of the growth of output over time can be statistically explained by changes in the quantity of conventional factors of production. The residual growth must be explained largely by changes in the quality of the labour force, that is, by the development of human resources.” (Highlighting is author’s)
“It has become clear that social problems that may accompany economic growth cannot be left aside until economic development has taken place because development is a never-ending process and cannot be sustained in the long run while social ills are increasing.”
“Human development involves a development strategy that is different from that of economic development in that it deals with the social and economic aspects of development in a balanced and simultaneous fashion”
“ … perhaps, the most important step towards the implementation of a human development approach is in the design of specific policies that lead to the empowerment of people and their participation in development, particularly those that are marginalized … “
(http://www.undp.org.lb/programme/governance/advocacy/nhdr/nhdr98/chptr1.pdf)

THE JOURNAL OF INSURANCE INSTITUTE OF INDIA
JULY - SEPT - 201916
RURAL DEVELOPMENT
ConclusionTo conclude, succinctly, the role of the Indian insurance industry should be in that they should execute programmes of their rural investment portfolio in such ways that their investments must directly influence simultaneously both the issues of the rural economic growth and the human development, especially by building the provisions for:
Schools for Primary to Secondary education and student enrolment plans
Vocational training centres and incentives for candidates enrolling
Well equipped Primary Health centres wit regular permanent paramedics
Resident teachers and Medicos – incentives for residing at rural places
Internal Roads in villages
Roads leading out to reach the nearest market places
Drainage canals for waste water
Closed toilets
Electricity
Sufficient potable drinking water sources
Sony Kapoor, Managing Director, Re-Define International Think Tank, has rightly described the need for the initiative of the Institutional Investors (like the LIC of India and the like) to invest in the hungry rural and undeveloped areas. He stresses the need for developing the infrastructural facilities in the rural areas as “Poor infrastructure holds back development, reduces growth potential and imposes additional costs, in particular for the poor who lack access to energy, water, sanitation and transport.”
“At the same time,” he opines that
“developing economies, where neither governments nor private domestic markets have the capacity and depth to fill the long-term funding gap, are hungry for such capital.”
Therefore, he suggests that long term institutional (like life insurance and pension companies) investments must be encouraged by Governments and Regulators for planned investments in underdeveloped regions – like rural areas in India – for an overall growth potential of economic growth and human development growth.
It is our experience that most of the governments show more interest in increasing the tangible physical infrastructural developmental activities, like road laying, extending electric lines etc., which are visible to people and will serve as signposts of ‘development’ in rural areas or otherwise too. They lay comparatively lesser stress on the human development activities like schooling and related campaigns, health standards etc, which basically have longer gestation periods to establish seeable development in the society. Thus, there is distinct difference and prioritization of governments and private investments in the regional or economic development and investments in people or human development.
This is why many developmental scientists and experts suggest that long term institutions should be encouraged to invest there – where governments do not prioritize.
We can see that the largest institutional investor – the LIC of India – has already raised high to the cause of the development of areas hitherto not so well served with, by establishing a special Fund called the LIC Golden Jubilee Foundation.
Since there is already an initiative in existence the said Foundation can expand its functions and schemes in
such ways to develop the human capital of the rural India, by ensuring schooling and health standards in the rural regions of the country and which alone will go a long way to create and build rural economic and human wealth.
Not just economic growth alone but human development too, both to be achieved simultaneously, is the need of the hour and advocated in this paper.
References
1. Dudley Seers, ‘The Meaning of Development’, IDS Communication 44, 1969 of the Institute of Development Studies, (www.ids.ac.uk/files/dmfile/themeaningofdevelopment.pdf)
2. Rob A. Wilson, Geoff Briscoe, quotes a survey of Sienasi by John Van Reenen, “The impact of human capital on economic growth: a review”
3. Ramesh Chand, S. K Srivastava and Jaspal Singh, National Institution for Transforming India NITI Aayog, Discussion Paper Changing Structure of Rural Economy of India Implications for Employment and Growth, NOVEMBER, 2017. (http://niti.gov.in/writereaddata/files/document_publication/Rural_Economy_DP_final.pdf)
4. Rob A. Wilson, Geoff Briscoe “The impact of human capital on economic growth: a review”
http://www.cedefop,europa.eu/files/BgR3_Wilson.pdf
5. LIC Annual Report 2017 – 2018
6. www.undp.org.lb/programme/governance/advocacy/nhdr/nhdr98/chptr1.pdf
7. http://shodhganga.inflibnet.ac.bitstream/10603/52932/13/13_chapter%205.pdf

17JULY - SEPT - 2019
THE JOURNAL OF INSURANCE INSTITUTE OF INDIA PMFBY
AbstractRural development is the backbone of Indian economy. India lives in villages and sustained rural development is key to achieve enormous and consistent growth in economy. Rural masses largely occupied in agriculture activities and since long following agrarian methods of farming. Farmers are exposed to vagaries of nature and their survival is hugely depends on agriculture produce and actual yield. It is of paramount importance that they are well protected with effective insurance schemes. Crop insurance is one such way to safeguard farmers interest. Government has launched Pradhan Mantri Fasal Bima Yojana (PMFBY) in early 2016 to contain the inherent risk of crop-failures, indebtedness, poor returns which Indian farmers are facing for long. A critical appraisal
for the policy features, shortcomings, its restructuring and revival has been attempted and emphasized.
Keywords
Farmers, Claims, Agrarian Methods, Yield, Harvest, Agricultural Produce, Horticulture, Kharif and Rabi, Coverage.
IntroductionRural India comprises of around 70% of total population. It means that around 85 crores Indians lives in rural areas like villages. For various reasons, the focus of insurance has largely remained targeted on urban areas. Off late, it is realized that for rural development, there is an urgent need to build a sustainable insurance model for rural geography of India. Although, last few decades witnessed a silent revolution or upsurge in economic development of rural segment but many factors like illiteracy or lower literacy rates,
Viability of Pradhan Mantri Fasal Bima Yojana: Roadmap for Rural Development
Vishal Singh Solanki Business Analyst-Insurance Domain (India & US),DXC Technology- Fellow Life (III), 5th Floor-BT530, Brilliant Titanium, Plot No 9, Scheme 78, Part II, Vijay Nagar,Indore – [email protected]

THE JOURNAL OF INSURANCE INSTITUTE OF INDIA
JULY - SEPT - 201918
PMFBY
unawareness, inadequate or poor
marketing mechanism and absence
of simplified insurance products has
posed challenges among the public
and private players to reap the benefit
of insurance. Inadequate reach of rural
Rural development is the backbone of Indian economy. India lives in villages and sustained rural development is key to achieve enormous and consistent growth in economy. Rural masses largely occupied in agriculture activities and since long following agrarian methods of farming. Farmers are exposed to vagaries of nature and their survival is hugely depends on agriculture produce and actual yield. It is of paramount importance that they are well protected with effective insurance schemes. Crop insurance is one such way to safeguard farmers interest.
dwellers for insurance products has
caused them major financial loss of
money and resources. Union and State
Government need to ensure that they
reach rural segment with their insurance
products more effectively which can
lay foundation for overall and sustained
rural development.
New crop insurance scheme
Government has launched new crop
insurance for farmers in 2016-17
named as Pradhan Mantri Fasal Bima
Yojana. Aim of this scheme is to provide
the insurance coverage and financial
assistance to the farmers against
specified events like failure of notified
crops and damage to the harvested
produce due to natural calamities,
iii) 1/4th or 25% of the likely claim will be settled directly within the farmers account
iv) There will only be one insurance company in every state.
v) Use of information technology to provide prompt and easy settlement
of claims with the use of GPS,
remote sensing, smart phones and
drones to assess the actual crop
losses.
vi) The coverage extended to post
harvest losses as well.
an attack of pests and rodents, crop
diseases which can destabilize farmer’s
income. PMFBY also aim’s encouraging
the use of modern agricultural practices
over conventional old methods.
Salient Features of Pradhan Mantri
Fasal Bima Yojana (PMFBY):
i) Insuring the income of the farmers
and not only the crop
ii) Low premium is charged in
comparison to other existing crop
insurance schemes. The farmers’
premium between 1.5 to 2 percent
for food grains and oilseeds crops
and up to 5 percent for cotton
crops and horticulture. A tabular
description below is explaining the
premium rates.
Premium Rates
SNo Season Crops Maximum Insurance charges payable by farmer (% of Sum
Insured)
1 Kharif Food & Oilseeds crops (all cereals, millets, & oilseeds, pulses)
2.0% of SI or Actuarial rate, whichever is less
2 Rabi Food & Oilseeds crops (all cereals, millets, & oilseeds, pulses)
1.5% of SI or Actuarial rate, whichever is less
3 Kharif & Rabi
Annual Commercial/Annual Horticultural crops
5% of SI or Actuarial rate, whichever is less
Fig 1.1 Source https://pmfby.gov.in/

19JULY - SEPT - 2019
THE JOURNAL OF INSURANCE INSTITUTE OF INDIA PMFBY
Government has launched new crop insurance for farmers in 2016-17 named as Pradhan Mantri Fasal Bima Yojana. Aim of this scheme is to provide the insurance coverage and financial assistance to the farmers against specified events like failure of notified crops and damage to the harvested produce due to natural calamities, an attack of pests and rodents, crop diseases which can destabilize farmer’s income.
PRADHAN MANTRI FASAL BIMA YOJANAWidespread losses Prevented sowing or
germinationMid-season losses Post-harvest losses Localised loss
Loss definition When end-of-season yield (based on crop cutting experiments) of a notified crop in a notified insurance unit area is less than its threshold yield
When sowing is not possible or germination fails of a notified crop on more than 75% of a notified insurance unit area
When expected yield of a notified crop in a insurance unit area is less than 50 % of its threshold yield
When harvested crop kept spread for drying or bundled on any individual farm is damaged
When standing Crop on any individual farm is damaged
Calamities covered
All Drought, dry spell, flood- inundation laridside, hailstorm, unseasonal rain (Within a month after sowing cut-off or 15 days after scheme enrolment cut-off)
Drought, dry spell, rood, inundation, pest, disease, landside. natural fire, lightning, hailstorm, unseasonal rain, storm and cyclone (Between a month after sowing cut-off and 15 days before harvesting period starts)
Hailstorm, cyclone, unseasonal rain (Within 14 days after harvesting cut-off)
Hailstorm, landslide, inundation, cloud burst and natural fire
Fig 1.2 Source https://pmfby.gov.in/
Coverage for farmers
i) All farmers growing and cultivating notified crops in notified area during the crop season are covered subject to they have insurable interest in the crop.
ii) All farmers in the notified area who possesses Kisan Credit Card account (KCC) or crop account who are called as loanee farmers whose credit limit is either sanctioned or renewed for the notified crop in the notified area.
iii) Other such farmers whom the Government may decide to include from time to time.
Coverage for risks
i) Produce loss or Yield loss: Risk for losses against non-preventable natural causes like-
a) Fire and Lightening
b) Hailstorms, Tempest, Hurricane, Typhoon, Tornado, Cyclone, Storm etc.
c) Dry spells and Droughts
d) Flood, Landslide, Inundation
e) Pest/Rodents attack and diseases
ii) Cover Sowing: In case where insured farmers have made all arrangement to plant the crop and show an intent/ready to sow the crop but can not do it because of adverse weather conditions shall be eligible for maximum of 25 percent of the coverage amount.
iii) Post-harvest/produce losses: Coverage is available up to maximum period of 2 weeks or 14 days from harvesting for those crops which are kept in cut and spread condition to dry in the field after harvest against specific peril of unseasonal rains in the country.
iv) Localized Risk’s: Loss and Damage resulting from occurrence of identifiable local risk from calamities like hailstorms, landslides, and inundation adversely affecting isolated farms within notified area.

THE JOURNAL OF INSURANCE INSTITUTE OF INDIA
JULY - SEPT - 201920
PMFBY
STATE WISE FARMERS DETAILS REPORT - KHARIF 2016
KHARIF 2016
Sr.No. States
Farmers Insured Area Insured Sum
InsuredFarmers Premium GOI State Gross
PremiumClaim Paid
Farmers Benefited
No. ha In Rs. Crore No.
1 Andhra Pradesh 1,618,537 1,387,438 7,682.47 181.12 249.84 249.84 680.80 647.15 793,662
2 Assam 51,749 36,692 205.47 4.11 1.40 1.40 6.91 5.02 23,370
3 Bihar 11485,432 1,312,217 6,531.06 130.62 495.94 495.94 1,122.50 291.54 151,365
4 Chhattisgarh 1,399,189 2,200,431 6,681.74 127.55 72.17 72.17 271.89 133.04 96,966
5 Goa 744 544 5.77 0.07 0.00 0.00 0.07 0.03 111
6 Gujarat 1,842,386 2,566,907 11,250.18 224.34 972.76 1,108.28 2,305.38 1,229.28 639,228
7 Haryana 738,856 1,188,005 7,020.65 126.86 46.91 83.20 256.97 235.21 152,908
8 Himachal Pradesh 134,616 39,501 296.66 4.72 0.84 0.84 6.40 5.83 27,183
9 Jharkhand 828,412 352,731 1,891.27 37.83 113.74 113.74 265.30 29.48 39,627
10 Karnataka 1,356,875 1,282,071 6,400.26 190.38 345.69 345.69 881.77 1,165.53 679,794
11 Kerala 31,531 21,378 109.55 3.12 2.72 2.72 8.57 17.92 24,895
12 Madhya Pradesh 4,071,974 6,445,838 18,439.61 420.90 1,125.94 1,125.94 2,672.79 1,846.30 1,110,181
13 Maharashtra 10,997,398 6,726,963 21,417.57 599.30 1,762.00 1,762.00 4,123.30 2,079.90 2,795,624
14 Manipur 8,366 9,121 36.94 0.74 1.43 1.43 3.59 1.96 8,358
15 Meghalaya 63 22 0.29 0.01 0.01 0.01 0.03 0.03 48
16 Odisha 1,766,541 1,258,011 6,891.22 137.83 197.45 197.45 532.72 429.35 166,436
17 Rajasthan 6,231,514 7,330,884 9,980.04 220.06 878.82 878.82 1,977.70 1,635.68 2,552,188
18 Tamil Nadu 15,873 33,306 206.98 5.54 2.21 2.21 9.96 10.59 1,920
19 Telangana 708,876 592,551 3,654.91 89.62 71.22 71.22 232.06 163.93 206,948
20 Tripura 1,881 846 3.59 0.05 0.00 0.00 0.05 0.08 502
21 Uttar Pradesh 3,739,273 3,295,815 14,175.30 267.11 203.33 203.33 673.78 449.95 949,945
22 Uttarakhand 175,243 101,082 699.41 14.66 5.45 5.45 25.56 16.68 50,498
23 West Bengal 3,053,408 1,500,254 7,806.63 132.53 63.58 63.58 259.68 101.87 253,754
Grand Total 40,258,737 37,682,608 131,387.57 2,919.07 6613.45 6,785.26 16,317.79 10,496.34 10,725,511
Table 1.1-Farmer detail report 2016 Kharif

21JULY - SEPT - 2019
THE JOURNAL OF INSURANCE INSTITUTE OF INDIA PMFBY
STATE WISE FARMERS DETAILS REPORT - KHARIF 2017
KHARIF 2017
SI.No. States
Farmers Insured Area Insured Sum
InsuredFarmers Premium GOI State Gross
Premium Claim Paid Farmers Benefitted
No. ha In Rs. Crore No.
1 Andhra Pradesh 1,597,435 1,850,633.71 9,662.84 228.97 465.59 465.59 1,160 494.63 597,978
2 Assam 51,550 38,410.42 229.49 4.59 3.12 3.12 11 0.54 1,465
3 Bihar 1,159,543 1,068,772.52 5,271,77 105.44 282.65 282.65 671 372.79 199,044
4 Chhattisgarh 1,303,808 1,986,917.11 6,546.77 128.18 89.30 89.30 307 1,303.80 573,093
5 Goa 537 396.11 4.46 0.05 0.00 0.00 0 0.00 226 Gujarat 1,490,610 2,333,354.21 11,110.89 368.26 1,393.16 1,393.16 3,155 1,042.26 494,610
7 Haryana 639,316 971,592.89 6,620.34 124.19 61.21 112.58 298 619.07 192,222
8 Himachal Pradesh 125,468 40,833.95 139.62 2.85 0.32 0.32 3 3.12 23,573
9 Jammu & Kashmir 85,619 85,215.90 249.58 5.46 8.42 8.42 22 5.95 14,129
13 Jharkhand 1,149,786 276,020.98 1,378.27 26.54 87.31 87.31 201 36.76 103,148
11 Karnataka 1,581,497 1,825,231.88 8,875.09 235.52 810.42 810.42 1,856 807.90 617,385
12 Kerala 28,364 22,913.19 148.17 3.76 4.38 4.38 13 7.95 18,956
13 Madhya Pradesh 3,584,684 6,520,763.32 24,542.31 508.06 1,718.87 1,718.87 3,946 5,428.31 1,868,844
14 Maharashtra 8,768,211 5,022,028.78 16,835.94 419.88 1,691.81 1,691.81 3,804 2,860.59 4,988,139
15 Meghalaya 2,945 3,398.62 26.77 1.01 0.21 0.21 1 0.02 10
16 Odisha 1,827,839 1,348,990.64 7,210.39 145.09 345.18 345.18 835 1,728.11 740,614
17 Rajasthan 5,417,614 6,181,435.51 10,286.50 241.38 795.49 795.49 1,832 1576.99 2,437,700
18 Sikkim 793 192.56 2.21 0.05 0.00 0.00 0 - -
19 Tamil Nadu 146,220 115,254.67 837.58 23.44 20.46 20.46 64 40.95 33,763
20 Telangana 819,390 770,366.32 4,059.36 158.98 216.53 216.53 592 440.28 342,455
21 Tripura 2,320 1,006.38 6.03 0.12 0.02 0.02 0 0.26 724
221 Uttar Pradesh 2,499,944 2,356,194.85 9,179.65 184.40 257.54 257.54 699 247.42 396,460
23 Uttarakhand 142,226 76,243.58 538.54 10.93 11.59 11.59 34 26.66 49,998
24 West Bengal 2,350,336 1,157,280.62 6,150.18 111.54 75.19 75.19 262 165.57 279,643
Grand Total 34,776,055 34,053,449 129,913 3,039 8,339 8,390 19,768 17,210 13,793,975
Table 1.1-Farmer detail report 2017 Kharif
STATE WISE FARMERS DETAILS REPORT – RABI 2016-2017
States Farmers Insured
Area Insured (ha)
Sum Insured
(in crore)
Farmers Premium
(in crore)
Slate (in crore)
GOI (in crore)
Gross Premium (in crore)
Claim Paid (in crore)
Farmers Benefited
A N Islands 3.24 253.20 0.47 0.00 0.01 0.00 0.02 0.15 295
Andhra Pradesh 156,875 193,396.12 1,068,20 18.15 73.28 73.28 164.70 246.94 84,756
Assam 8,516 4,312.95 30.12 0.86 0.43 0.43 1.73 0.14 76
Bihar 1,228,806 1,140,087.68 5,276.04 74.00 109.88 109.88 296.77 57.05 69,358

THE JOURNAL OF INSURANCE INSTITUTE OF INDIA
JULY - SEPT - 201922
PMFBY
STATE WISE FARMERS DETAILS REPORT – RABI 2016-2017
States Farmers Insured
Area Insured (ha)
Sum Insured
(in crore)
Farmers Premium
(in crore)
Slate (in crore)
GOI (in crore)
Gross Premium (in crore)
Claim Paid (in crore)
Farmers Benefited
Chhattisgarh 149,950 216,336.26 550.17 8.94 22.47 22.47 53.88 26.87 39,723
Goa 13 4.04 0.03 0.00 0.00 0.00 0.00 0 0
Gujarat 1,327.53 274,659.95 1,073.30 25.05 15.14 15.14 55.32 32.69 39,568
Haryana 597,172 896,571.27 4,761.49 69.67 18.88 18.88 107.42 60.76 65,915
Himachal Pradesh 245,309 89,930.68 602.29 26.37 19.43 19.43 65.23 38.92 85,119
Jharkhand 50,927 21,440.79 110.95 1.91 2.35 2.35 6.50 1.53 4,417
Karnataka 1,380,792 1,664,636.83 4,378.62 69.10 306.37 306.37 681.84 697.32 810,016
Kerala 45,874 31,726.83 222.93 4.10 10.24 10.24 24.59 26.63 31,718
Madhya Pradesh 3,109,268 5,574,998.87 18,374.47 312.22 483.61 483.61 1179.45 154.19 208,005
Maharashtra 1,008,532 711,670.53 3,079.89 93.02 261.67 261.67 616.37 235.62 111,518
Meghalaya 26 16.00 0.18 0.00 0.00 0.00 0.01 0 0
Odisha 53,695 60,700.43 317.12 4.80 0.76 0.76 6.32 1.99 2,054
Puducherry 8,537 7,978.62 33.99 0.26 1.54 1.29 3.10 7.57 4,299
Rajasthan 29,382.46 3,058,398.88 7,699.46 146.16 207.83 207.83 561.81 232.08 349,430
Sikkim 5.74 130.50 0.46 0.01 0.00 0.00 0.01 0.11 225
Tamil Nadu 1,395,353 1,263703.14 6,547.67 107.00 555.21 555.21 1,217.41 3,413.20 1,182,669
Telangana 2,644.67 236,958.20 1,530.71 23.89 17.97 17.97 59.84 14.52 13,586
Tripura 10,879 4,095.28 26.27 0.24 0.05 0.05 0.35 0.46 351
Uttar Pradesh 3,103,829 2,623,269.62 11,829.63 208.85 118.05 118.05 444.95 104.34 202,367
Uttarakhand 86,328 31,279.85 221.99 4.89 5.56 5.56 16.02 10.78 11,205
West Bengal 1,079,871 495,246.28 4,264.78 97.57 192.42 177.09 467.08 317.51 264,578
Grand Total 170,569.16 18,601,802.81 72,054.20 1,296.97 2,373.17 2,357.58 6,027.72 5,681.38 3,581,247
Table 1.3-Farmer detail report 2016-17 Rabi
Assessment of PMFBY scheme
i) As the private players will be missing for this scheme and there is only one insurance player in the state. In absence of competition, there is no improvement in service metrics. It is left to government to decide as what to do and what not to. Settlement of claims will largely in the hands of government.
ii) The entire rural infrastructure used for insurance belongs to the public sector units from rural banking branch offering insurance and collecting premiums and only state machinery deciding determining crop yields and measuring crop losses and thus grievance redressal would
be a far cry for poor farmers.
iii) Coverage shrink has been notified in 2017-18, the coverage which is showing increasing trends before the launch of PMFBY and in the beginning of the launch of the PMFBY has shown sharp fall in numbers.
iv) Farmers are unhappy with the PMFBY because of delay in claim settlement and lack of avenues for redress. There is decline in non-loanee enrolment in Madhya Pradesh, West Bengal and Maharashtra.
v) It is important for farmers that their claims of crop loss for any
season are settled before the start of the next season and the PMFBY guidelines strongly recognize this. Still, the government has yet to provide the provisional claims data for Rabi 2017-18.
vi) PMFBY remains a popular scheme for loanee farmers where farmers who take loans from banks need to mandatory take the insurance coverage. The non loanee segment remains a low participant in the insurance scheme as low as less than 5 percent in kharif 2016 season.
vii) Delivery failure is one of the reasons for farmer grievances as no such insurance policy document of

23JULY - SEPT - 2019
THE JOURNAL OF INSURANCE INSTITUTE OF INDIA PMFBY
premium receipts reaching farmers. Insurance companies lacks viable infrastructure set up to implement PMFBY.
Restructuring of PMFB
i) As national crop insurance portal www.agri-insurance.gov.in has long been launched to enable integration among all involve stakeholders for smooth flow of information and services both ways to ensure that the ultimate aim of direct benefit transfer of claims settlement of Aadhar seeded accounts of affected farmers. It is made compulsory from Kharif 2017 season that notifications of crops and area for the seasons should be made on the national portal so that the banks and insurance companies can feed coverage data directly on the portal for real time data flow and transparency.
ii) To increase the coverage of non-loanee farmers under these schemes, Government of India has signed memorandum of understanding to seamless coverage of non-loanee farmers wherein addition to banks, services of Common Service Centre (CSC) have been initiated. The whole business is to be carried out by
banks and CSCs through national crop insurance portal.
iii) Now, as portal is designed to collect real time data, it is important that all entries pertain to coverage should be feed in portal. Therefore, it is mandatory for the banks to enter all coverage data details on portal from Kharif 2017 onwards and no other way of computing farmer details shall be used.
iv) Though the commercial banks and cooperative banks are entering the coverage details on the portal but not with the required pace. To facilitate the cooperatives and area where online connectivity is hampering due to no internet connection, an offline utility service is also available on the portal. Through the use of this offline utility real time coverage details can be entered on the portal.
v) So, the bank can enter coverage details of farmers on the aforesaid portal on daily basis through offline/online utility for proper coverage, release of premium subsidy, better implementation and proper monitoring of the scheme.
ConclusionVarious crop insurance schemes have been launched in last few decades with an objective of reducing the impact of agrarian distress among the rural population of India specially farmers engaged in farming, cultivation and horticulture. Flagship scheme Pradhan Mantri Fasal Bima Yojana is a latest endeavor by Central Government in this regard and looks promising scheme at its inception. Low premium and quick claim settlement are the prominent feature of the scheme. It has proved much better scheme than what we had in the name of crop insurance before the launch of PMFBY. Though, its performance on key elements like sum assured amount and number of farmers covered show positive trend but there are structural and financial issues which needs to be corrected for achieving the very objective of the PMFBY scheme. We have to see how restructuring of the PMFBY shall help eradicating the drawbacks and how it flourishes in 2019 after formation of NDA government who has started this scheme.
References
1. https://pmfby.gov.in/
2. https://www.irdai.gov.in/ADMINCMS/cms/frmGeneral_List.aspx?DF=JRNL&mid=15
3. https://scroll.in/article/910611/heres-how-modis-crop-insurance-scheme-profits-private-insurers-far-more-than-it-does-farmers
4. https://agri-insurance.gov.in/Pmfby.aspx
5. https://www.orfonline.org/research/pradhan-mantri-fasal-bima-yojana-an-assessment-of-indias-crop-insurance-scheme-51370/
6. https://www.newsclick.in/pradhan-mantri-fasal-bima-yojana-assessment-report-shows-super-normal-profits-insurance-firms

THE JOURNAL OF INSURANCE INSTITUTE OF INDIA
JULY - SEPT - 201924
CHALLENGES
I wish to begin with my experience as Surveyor for Rural Surveys. Please remember that Crop Surveys done by me were post-harvest relating to damage by Fire or Storm after the crop had been thrashed and had not been shifted to storage locations/silos. I also attended losses under Fire Policy/Shopkeepers Policy.
It is time to consider role of insurance in right perspective as a tool of Rural Development.
We discuss some relevant issues as under:
Need for Insurance Awareness
What was appalling is lack of awareness about Insurance in Rural/semi-urban areas. All the claims I surveyed originated form Banks. Whether they
were farmers or Businessmen, all had Bank Finance in some say – Be it IRDP or other Schemes or simple Cash Credit Limit. In all cases the insurance was arranged by the Bank keeping in mind their stake. Usually, the Insurance was for loan amount plus safety margin ranging between 25-30%. The Bankers did not consider own investment by the borrower not, in case of businessmen, the quantum of trade credit.
It is necessary that an intensive and extensive awareness programme is launched with lead taken by IRDA and active involvement of Insurers on the lines similar to other Government awareness programmes like eradication of malaria, Polio, health and drinking water, cleanliness, Investor Education, updating Aadhar, etc. It is equally
Sunil Kumar Saxena110, Basant Vihar, Naubasta,Kanpur 208021 (UP)[email protected]
Insurance and Rural Development - Challenges and Opportunities

25JULY - SEPT - 2019
CHALLENGESTHE JOURNAL OF INSURANCE INSTITUTE OF INDIA
important that programmes for awakening interest in subscribing insurance are conducted. The initiative should also be shared by IRDA and Industrial Establishments special agro-industries – both downstream and upstream that is suppliers of agricultural inputs and users of agricultural produce.
Role of Insurance Agents
The presence of Insurance Agents was conspicuous by their absence. Now a days fancy designations are uses such as Insurance Advisor/Consultant, etc.
What was appalling is lack of awareness about Insurance in Rural/semi-urban areas. All the claims I surveyed originated form Banks. Whether they were farmers or Businessmen, all had Bank Finance in some say – Be it IRDP or other Schemes or simple Cash Credit Limit. In all cases the insurance was arranged by the Bank keeping in mind their stake. Usually, the Insurance was for loan amount plus safety margin ranging between 25-30%. The Bankers did not consider own investment by the borrower not, in case of businessmen, the quantum of trade credit.
In my opinion their primary function is to guide the Insured in selection of proper policy and various add on covers as well as discounts and loading if certain actions are taken/not taken. In my opinion it is also the job of such Advisor to help the Insured Client in case of a loss and guide him what to do and what not to do in respect of his claim. However, apathy of Agents is understandable. The work is onerous and rewards are low. They will have to apprise potential clients about insurance and need of a Policy and if one agreed, the sum insured will be small and so will be their commission which may not even be enough to meet the expenses of visiting villagers. Here the role of awareness programme manifests itself. I will discuss this section later in this article.
Challenges in Rural Insurance
1. The basic problem in arranging insurance is of sum insured. In rural areas almost all the transaction are small and done in cash so they have no documentary evidence to support the value of their property. Whether it is cattle or plough or the goods purchased for trading. The persons availing Bank Finance of some kind can show the value as determined by the Bank but in such a case the Insurance is arranged by the Bank itself whether as banc assurance or by normal channel of calling or retaining an agent of nearest office of the Insurance Companies.
2. In case of farmers, it should be kept in mind about 50% of cultivators do not own any land but they till the land of others, normally without a formal agreement and in pure good faith so obtaining bank finance is not possible for them as they do not have any land to pledge. They
had to borrow money from private lender which is not only costly but also has no legal sanctity to arrange insurance. If any loss should occur to their crop, they have no recourse but to suffer. Similarly, the traders might have some bills of their purchases but they have no such records of sale or any stock register. And assuming, one maintains stock register, how can he prove the total purchases and total sale?
Suggestions
I have a few suggestions in this respect
1. Penetration of Insurance – I discussed earlier about Insurance awareness programmes and role of Insurance Agents. In this regard, the Government should support insurance industry in appointing Agents in every village having a population of say 2000 houses or a cluster of villages where it can be expected that enough business can be generated to justify these expenses. Such agents should be given help by way of subsidy to maintain an office and meet travelling expense. Insurance Companies may also be subsidized by way of tax rebate or direct grant to create Agents network for a period of say 3 years on the pattern similar to tax rebates for new industrial units in selected areas. As for deposit of premium income, an account should be opened by Insurance Company in local branch of the Bank in that area. The Bank should also be authorized to pay the agents their expenses as well as their commission on regular monthly basis on the pattern advised by the Insures. I believe the banks will respond favourably to this option

THE JOURNAL OF INSURANCE INSTITUTE OF INDIA
JULY - SEPT - 201926
CHALLENGES
as this will enhance their credit balances and their overall business.
2. Government Initiative - The Government has to take initiative to cover those farmers who till the land of others. A possible formula to arrive at the sum insured could be land area over which a land less farmer is cultivating and the crop sown with its average yield determined by the Agricultural Department valuing the same at support price if any declared by the Government or the rates determined by Agricultural Department for concerned area like average yield in case of various crops for which MSP is not declared.
The Government is operating various rural schemes for insurance of several other items like cattle (milch animals), honey bee, shrimp, poultry and pig farming, plantation crops, etc. The scheme with necessary modifications can be applied to landless formers who have no recourse to Bank Finance.
In case of small traders, especially in rural/semi urban areas similar methodology may be adopted. Such methodology will include assessment of area where the Shop is located and the kind and variety of goods being traded by the incumbent. This will provide a reasonable estimate of the value of goods stored at the shop which should be used for fixing sum insured for an Insurance Policy and in case of a claim the settlement may be finalized on its basis considering it a non-standard claim.
Further, the Banks may be told to obtain monthly stock statement
from all borrowers. For this purpose, some commercial agents may be employed who will go to borrower and prepare such statement. There remuneration may be on job basis having dual criteria, that is, amount of loan and number of items in the Shop. This may be on a graded scale. This arrangement will also create employment opportunities for educated unemployed.
Rural Development
Considering the above scenario, Insurance can play an effective and supplemental role in rural development like National Guaranteed Employment scheme for rural poor where annual 100 days employment is guaranteed to rural unemployed and other similar schemes to help rural poor like old age/widow pension, etc.
As we have discussed in earlier paragraphs, one of the problems of rural areas is help at the time of distress whether due to natural causes like rain and storms or due to other disastrous events like Fire, Theft, etc. When the insurance coverage will expand it will help the rural deprived to get some relief by way of Insurance Claim settlement to enable them to start afresh or return to their normal working in due course instead of total loss after an unfortunate event has destroyed their property and possibly their livelihood also.
Opportunities
1. Proliferation of Rural Insurance will provide opportunities in multiple sectors. First of all it is employment creation. India has over 60000 villages. Assuming about 20000 clusters will be able to cater to
requirement of rural population there will be need of about 70-80000 Insurance agents on the assumption 3-4 companies will make their presence felt in each cluster. To handle such a large force of Insurance Agents the companies will need more Development Officers, Branches and Divisional Offices. This, in turn will create potential for employment at Regional and Zonal level as well as at their Head Offices.
2. Apart from employment in Insurance Sector, the Banks will also need more staff to handle increased business. Besides, when they will have additional Funds at their disposal lending activities will also increase and surely, a small, if not large, share will also go to villagers. The Government may impose condition that a specified share will be utilized for rural development only.
3. Increase in credit availability will create and enhance opportunities in trade and commerce as well as agricultural activities which will impact overall economy of the Country which will certainly go up. In addition, there will be opportunities for both upstream and downstream industries.
I am of the view that in this manner multiple problems can be tackled such as Insurance, resulting in rural prosperity, employment, business opportunities for industrial sector while I agree that such a scenario cannot be created overnight but nevertheless a beginning has to be made and a sincere effort should be made in this direction and I am sure that the results will be available in few months ranging up to few, say, 2-3 years.

27JULY - SEPT - 2019
ERMTHE JOURNAL OF INSURANCE INSTITUTE OF INDIA
I. Broad Overview
Enterprise Risk Management (ERM) is an approach to look at all risks holistically and evaluate the same at an organizational level, with the perspective of identifying and assessing material risks and putting in place robust strategies and mitigation plans to counter the risks.
The fundamental of ERM is to add value to all stakeholder functions in the company through identifying existing and potential risks and thereby ensuring that the identified risks are controlled resulting into successful attainment of defined business objectives and strategic plans.
One critical aspect that needs to be appreciated at all points in time is that ERM is neither a compliance nor an audit activity. It is a business partner in the growth story of an organization and focuses on ensuring that the business navigates smoothly even during challenging times.
Influencing stakeholders at all levels is critical to ensure that ERM succeeds in a dynamic environment.
One thing is evident – in the world of Volatility, Uncertainty, Complexity and Ambiguity (VUCA), the organization’s balance sheet can be protected and the entity can continue to maintain its leadership position built over years of perseverance, innovation and commitment only
Enterprise Risk Management: A New Paradigm to Protect Corporate India and Ensure Sustainable Growth
Delzad D. JivaashaB.Com., ACA, ACS, ACMA, LL.B., FIII, DISA (ICAI)Associate Vice President - Risk Management and FinanceICICI Lombard General Insurance Co. [email protected]

THE JOURNAL OF INSURANCE INSTITUTE OF INDIA
JULY - SEPT - 201928
ERM
through Enterprise Risk Management.
Integrating ERM into the organizational strategy, performance and day-to-day workflow is of utmost importance for the long term viability and sustainability of an organization.
If there is one function which can stake a strong claim (and win the claim as well) in being regarded as the eyes, ears & heart of business – it is surely the ERM function. The Pillar of Successful Corporate Governance is effective Enterprise Risk Management.
II. The Risk Management ProcessThe Enterprise Risk Management process is built on four pillars:
The four pillars are as elucidated below:
i. RISK IDENTIFICATION
RISK IDENTIFICATION RISK ASSESSMENT
RISK EVALUATION RISK TREATMENT
ERM PROCESS
Risk identification is aimed at identifying existing and prospective risks for an organization. Broad strategies for risk identification would include conducting risk identification workshops, brainstorming sessions with all functions, studying economy as well as industry related reports, using past risk, audit & incident reports & a slew of other measures.
ii. RISK ASSESSMENT
Risk assessment is focused on assessing risks based on the following:-
a) Frequency: Frequency refers to the likelihood or the probability of a risk event or incident hitting an organization.
This involves asking one basic fundamental question, ‘How often do you believe the concerned risk event/incident can hit the entity?’
b) Severity: Severity refers to the overall impact an organization would face or suffer if the risk event was to end up materializing.
This again involves asking one basic fundamental question, ‘If the risk event actually materializes, how would it impact the company as a whole?’
Whilst the acceptance of velocity as a concept for risk assessment is increasingly on the rise and understandably so, majority of the
organizations continue to assess risks basis the abovementioned two parameters.
iii. RISK EVALUATION
All risks which have been assessed in the aforementioned manner, would not be at a uniform level.
Basis the assessed frequency and severity, a risk levelling or evaluation is undertaken into various pre-defined grades of risk as decided by each organization e.g. Severe (Very High) Risks, High Risks, Medium Risks, Low Risks, etc.
Gradation of risks is one of the biggest factors affecting risk prioritization and
thereby determining the order of risk treatment.
iv. RISK TREATMENT
Risk Treatment is focused on devising and implementing a suitable plan to mitigate the evaluated risk and bring it down to acceptable levels for an organization.
III. The Governance StructureThe governance mechanism and the placement of the ERM function in the organizational structure plays a pivotal part in determining the overall success of risk management.
i. Risk Management Committee
From governance mechanism
Risk Management Committee
Chief Risk Officer
Enterprise Risk Management
Team
perspective, an organization should have a Board Level Risk Management Committee, comprising of a majority (preferably two third majority) of non-executive independent directors, with the Chairman of the Risk Management Committee also being a non-executive independent director.

29JULY - SEPT - 2019
ERMTHE JOURNAL OF INSURANCE INSTITUTE OF INDIA
The Risk Management Committee, being a Committee reporting into the Board would be responsible for reviewing & approving the enterprise risk management frameworks, policies and other critical risk management related decisions taken by the organization.
Every critical decision pertaining to the risk management strategies adopted by an organization would have to be reviewed first by The Risk Management Committee, prior to being approved by the Board of Directors.
ii. Chief Risk Officer
At an organizational level, the ERM function should be headed by a Chief Risk Officer (CRO). From a hierarchy perspective, the CRO should either report into the CEO or directly to the Risk Management Committee of the organization.
Broad Responsibilities & Roles of the Chief Risk Officer would include:-
Identification of top key and critical risks affecting an organization
Ensuring integration of risk management and organizational strategy
Cultivating a risk based decision making culture in the organization
Keeping a close watch on timely implementation of pivotal risk mitigation plans
Ensuring that the organization is resilient to risks and most importantly is stable at all times – more so during adversity
iii. ERM Team
The CRO would be assisted in his duties by the ERM team. The ERM team should be made up of individuals having the right set of educational background, experience and exposure to the management of risks.
The ERM function is expected to closely interact with all stakeholder functions, from the perspective of building up a robust risk management culture in the organization wherein proactive management of existing and potential risks is undertaken continually as a part of day-to-day work flow management.
The function would be expected to conduct company wide training sessions and create a strong awareness, on key risk management issues confronting the organization.
The function would be expected to take the lead in terms of working closely with all functions for identification, assessment, evaluation and treatment of risks and thereby drive the creation of a resilient organization through robust risk management practices.
IV. The Three Lines of Defence Model
The three lines of defence model is a structure an organization builds up to ensure effective corporate governance and protect the organization against internal and external risks which can affect its strategies, growth, achievement of objectives and overall performance.
From governance mechanism perspective, an organization should have a Board Level Risk Management Committee, comprising of a majority (preferably two third majority) of non-executive independent directors, with the Chairman of the Risk Management Committee also being a non-executive independent director.
The Risk Management Committee, being a Committee reporting into the Board would be responsible for reviewing & approving the enterprise risk management frameworks, policies and other critical risk management related decisions taken by the organization.
Internal Audit
Enterprise Risk
Management Function
Business Unit/
Functional Unit
As the name would suggest logically, there are three functions who protect and defend the Company against risks.
a. First Line of Defence:- The Business/Functional Unit
It is not wrong to believe that every unit which does a particular job 24*7 is in the best position to understand its risks including effectively structure and monitor its controls mechanism towards risk.

THE JOURNAL OF INSURANCE INSTITUTE OF INDIA
JULY - SEPT - 201930
ERM
Therefore, each function/unit in an organization, should focus on building up strong risk management practices and integrate their strategies and decision making with the overall enterprise risk management framework of the organization.
The above goes a long way in building a strong risk management culture in an organization.
b. Second Line of Defence:- The Enterprise Risk Management Function
The second line of defence is the ERM function who would look at focusing on reduction of material risks confronting an entity, along with monitoring the formulation and timely implementation of the risk mitigation plans.
The ERM function is expected to work closely with business units and proactively assist them in mitigation of risks, including educating them on pivotal risk management aspects.
The ERM function has to be a business partner with a defined plan to protect the entity against adversities which could impact achievement of its objectives.
c. Third Line of Defence:- The Internal Audit Function
The third line of defence is the Internal Audit Function which would look to independently assess the risks and controls of each function in accordance with their Risk Based Internal Audit Plan. The Internal Audit Function would have an accountability to the Audit Committee of the organization.
V. Broad Risk Categorization
In ERM, the different types of risk can again be classified into four broad categories:-
o Operational Risk
o Market Risk
o Strategic Risk
o Credit Risk
a) Operational Risk
Operational Risk, as commonly defined, is basically the risk of loss on account of inadequate or failed
Operati-onal Risk
Market Risk
Credit Risk
Strategic Risk
people, process, system or event.
Operational Risk, has the potential to result into several leakages and losses for an organization and hence must be controlled through robust internal control mechanisms.
Organizations can have an Operational Risk Management Committee (ORMC) comprising The Heads of all Functions to ensure that operational risk issues are discussed and deliberated upon along with decisions being made on pertinent aspects related to operational risk.
Key Elements of Operational Risk
Operational risk requires the following elements to succeed:-
1. An Operational Risk Management Policy duly approved by the Board
2. Operational Risk Management related Standard Operating Procedures
3. An effective organization wide Risk & Control Self-Assessment (R & CSA) Framework
4. Lead and lag KRI’s i.e. Key Risk Indicators to proactively track movement of key factors which drive the movement of risk levels
5. Stress Testing the likely outcome of key operational risks
6. Culture building and awareness creation on operational risk management
Business Functions can look to have an Operational Risk Manager (ORM) nominated from every single business unit for effective accountability & related management of the risks.
b) Market Risk
Market Risk is the risk faced by an organization on account of market fluctuations and movements.
An organization is exposed to the risks of liquidity, drop in prices of equity shares, foreign exchange movements, risk of interest rate fluctations including reinvestment risk, ALM (Asset Liability Management) Risks and similar other risks, arising as a result of the interplay of various market forces.
Key Elements of Market Risk
Organizations look to manage these risks through the following broad methodologies:-
Dedicated teams to continually monitor market movements,
Strong policies and procedures for investment risk management,

31JULY - SEPT - 2019
ERMTHE JOURNAL OF INSURANCE INSTITUTE OF INDIA
Controlling concentration/exposure in specific asset classes including building capping limits for investments in various asset classes,
Hedging Strategies,
Putting in place well-defined Stop Loss Limits,
Effectively monitoring Value at Risk (VAR) & other similar steps and measures.
c) Strategic Risk
Strategic Risk refer to material and critical risks which can affect and impact the laid down strategic plans of the organization.
Key Elements of Strategic Risk
Broad categories of these risks could be:-
Risks which would affect the market share of The Company,
Risks pertaining to non-attainment of bottom line,
Organizational Rating downgrade,
Regulator fines and warnings;
and similar risks which have a core linking to organizational strategy.
Management of these risks is crucial and requires the close involvement of all stakeholders including the MANCOM of an organization.
d) Credit Risk
Credit Risk refers to the risk of a counter-party not honouring their obligations on timely payments. The same can in turn affect the stability of a company and the potential of a company to honour its obligations on a timely basis.
Key Elements of Credit Risk
The same would include:-
Risks pertaining to the overall solvency position of a company,
Downgrades in rating of counter-parties,
Concentration risk with counter-parties, etc.
Management of credit risks is achieved through:-
• Benchmarking the quantum of concentration limits with key counter-parties,
• Monitoring, on a continuous basis, the downgrades in ratings of counter-parties,
• Appropriate investment diversification strategies to avoid excessive exposure to counter parties;
and similar mechanisms.
VI. KEY RISK MANAGEMENT TERMINOLOGIES
a) Risk Appetite
Risk Appetite refers to the level of risk an entity is willing to accept, whilst formalizing plans for achievement of its objectives.
CRO’s always prioritize one thing – having in place clearly defined risk appetites so as to ensure that everybody in the organization understands the nature of decisions to be made.
Risk appetite goes a long way in channelizing the apt resources in the right direction as the decision makers have a clear road map in terms of understanding what is acceptable & what should be rejected/avoided.
Whenever a new business opportunity is present, accepting or rejecting the same can be decided keeping in mind the overall risk appetite of the organization.
b) Risk Tolerance
Risk Tolerance refers to maximum downside an organization can withstand, on account of a risk materializing.
Risk Tolerance is a crucial risk management concept and a tolerance has to be crystallized for all major risk areas in the organization for proactively monitoring and controlling the level of each risk.
Tolerances are often expressed in terms of high, medium and low risks, with the traffic light status of red, amber and green being used to denote the high, medium and low risks.
Operational Risk, as commonly defined, is basically the risk of loss on account of inadequate or failed people, process, system or event.
Operational Risk, has the potential to result into several leakages and losses for an organization and hence must be controlled through robust internal control mechanisms.
Organizations can have an Operational Risk Management Committee (ORMC) comprising The Heads of all Functions to ensure that operational risk issues are discussed and deliberated upon along with decisions being made on pertinent aspects related to operational risk.

THE JOURNAL OF INSURANCE INSTITUTE OF INDIA
JULY - SEPT - 201932
ERM
c) Risk Universe
Risk Universe is the complete gamut of risks an organization is exposed to, covering therein the industry the organization is operating in, the internal organizational mechanisms and controls and the external ecosystem.
VII. PITFALLS TO AVOID
It is essential to avoid the following pitfalls for effective risk management in an organization:-
a) As mentioned earlier - ERM is not a Compliance or Audit Function. It is not to be perceived as a tick-the-box activity. The fundamental aspect to note here is that it is by no dint of imagination: Business/ Function v/s Risk Management. Business Units and Risk Management will always
be part of one team, focused on
protecting the organization against
a common foe, which is – Any risk
which can affect the Company.
b) ERM should be not be termed as
the exclusive responsibility of
the company Risk Management
function. Every employee should
always perceive himself or
herself to be a risk manager for
the company. Successful ERM
requires a continual and prioritized
engagement and alignment of senior
management, middle and lower
management.
c) ERM can only be achieved when we
move out of silos. Hence it is crucial
to ensure that a holistic perspective
of risks is undertaken at all times
with a conscious focus on risk
assessment from an organizational
perspective in place of a unit/
departmental level.
d) ERM stands for being proactive.
Hence it is extremely important
to continually review existing
ERM practices, evolve and also
keep examining changes in
business conditions, the economic
environment, systems, processes
and procedures to ensure that risks
are identified and treated before
they affect an entity. ERM is a 24x7
activity.
VIII. CONCLUSION
An organization which goes on to adopt
and implement ERM in its true spirit
is certain to withstand the test of time
and is very likely to evolve into a global
market leader.
ERM is extremely imperative in today’s
challenging environment and the
organizations which have ERM as their
foundation stone will continue to enjoy
the dual benefits of healthy growth
along with strong protection of their
balance sheet.
RISK MANAGEMENT = LONG TERM
ORGANIZATIONAL SUSTAINABILITY
AND VIABILITY
References
1. Enterprise Risk Management – A
Strategy to Build a Resilient Organization
& be a Business Partner – By Delzad
D. Jivaasha – Legal Era Magazine -
October 2017 issue

33JULY - SEPT - 2019
THE JOURNAL OF INSURANCE INSTITUTE OF INDIA THEORY OF VALUE
Introduction
A typical individual’s economic activity comprises three ingredients, viz., income earning, expenditure and savings. After earning income and spending a portion of it for the basic necessities (expenditure to meet
needs like food, shelter and clothing),
some surplus is likely to remain from
the income earned. Such surplus
gets channelised to either high value
consumption goods or investment in
physical or financial assets.
Investment in various financial assets
is determined by return on investment,
safety and security of capital invested,
and preference schedule drawn by an
individual for investment in relation to the perceived value of different asset classes. In financial planning, it is preference schedule that determines the ratio of investment in various financial products.
Life insurance products by its very nature are not high yield providers. They offer moderate returns on investment, which is compensated by life insurance cover. Rather, they are a catalytic agent to fill the void of loss of a regular income earner. It is to derive a lump sum amount in the event of death of a bread winner. Occurrence of death, though a certainty, its exact time of happening is unpredictable. It is for meeting this unpredictable event, the concept of insurance has emerged.
Applicability of Theory of Value to Life Insurance
Dr. Pothukuchi Purushotham Shastri Director (Retd.), UTI Institute of Capital Markets. [email protected]

THE JOURNAL OF INSURANCE INSTITUTE OF INDIA
JULY - SEPT - 201934
THEORY OF VALUE
Mainly, the value attached to an insurance product arises due to the risk cover it provides.
Risk as a driving force to value life insurance
Concept of insurance emanates from the awareness and acceptance of the risk of untimely death. It is, therefore, essential to understand risk (Shastri and Shastri, 2014) and its relationship to life insurance, and also the element of value that is perceivably embedded in the decision making process of investment in a life insurance product.
Risk arises out of uncertainty. Rejda (2002, P-3) defined risk as “uncertainty concerning the occurrence of a loss”. It is, therefore, implicit that there is an element of chance. Chance of loss is described by Rejda (2002, P-4) as “the probability that an event will occur”.
Major risks are classified by Rejda (2002, P-6) as (i) pure (“a situation in which there are only the possibilities of loss or no loss.”) and speculative (“a situation in which either profit or
loss is possible.”); and (ii) fundamental and particular (“A risk that affects the entire economy or large number of persons or groups within the economy.”). Pure risk examples are premature death, huge medical expenses, and damage to property from earthquake, flood, fire, etc. Speculative risk examples are investment in equity shares, betting in horse race, investing in real estate, etc. Instances of second category (fundamental and particular) of risks are; war, hyper inflation, etc.
Risk management is identification of exposure to loss, and selecting an appropriate strategy to tackle such an exposure. The value to a life insurance product, thus arises due to recognition of uncertainty (risk) to life and having a desire to tackle it. Here, the element of subjectivity arises. Subjective risk is defined by Rejda (2002, P-4) as “uncertainty based on a person’s mental condition or state of mind”. No two individuals can have same perception of risk, despite they are placed in an identical situation.
Insurance and theory of value
A. Value in general parlance
Theory of value is not an alien element to insurance. Various factors operate in determining value of a product. It is over simplification of a complex phenomenon of choices, when one advocates a single factor is responsible for any investment choice.
Value has different connotations. Its application and meaning varies from economics, sociology, psychology, philosophy, etc. value in economics is financial security, productiveness, yield, etc. while in sociology it is freedom, justice. etc., in philosophy, it is honesty, ethics, morality, fairness, etc., and, in psychology, it is satisfaction derived from one’s own mental set-up etc. To simplify, value may be defined as that which people would like to possess or retain.
In the table given below (Table – 1), an attempt is made to outline the general values impacting investment in life insurance products through a spectrum of human values.
Table – 1
Perceived values (general) for investment in life insurance products
Value category Perceived values1. Economic (A) Economic security (insurance cover)
(B) Moderate yield with life cover(C) Deriving lump sum amount in the event of death(D) Value of the product
2. Sentimental (A) Taking care of the loved in the event of death(B) Acceptance of the occurrence of unpredictable event of death
3. Social (A) Ensuring dependents not a burden on society(B) Assuring status quo of social status in the event of death
4. Moral (A) Conscious of a duty in providing risk coverage(B) Dependents should not be left to bear additional stress in the eventuality of
death which is a primary stress5. Intellectual (A) Perception of insurance as a necessity, and or a comfort, but not as a luxury
(B) Unpredictable death perceived as risk(C) Providing risk cover (monetary) to the loved
6. Physical and material (A) Physical security through risk cover(B) Material security(C) Avoiding greater discomfort in the event of death

35JULY - SEPT - 2019
THE JOURNAL OF INSURANCE INSTITUTE OF INDIA THEORY OF VALUE
B. Value in particular parlance (economics)
According to Smith (1961), value has two different aspects, viz., (i) the utility of a particular object (value in use) and the purchasing power of other goods which the possession of that object conveys (value in exchange). Smith (1961) further elaborated by stating that certain things which have greatest value in use often have little or no value in exchange (e.g., water which has no exchange value, but has use value), and, as opposed to this certain other things which have huge value in exchange, but
little or no value in use (e.g., diamond hardly has any use value, but has greatest value in exchange).
Tom (1985, P-92) observes that realizable values are measures of current sacrifices which have alternative choices. The realizable values are notional and its actualization can happen in the occurrence of an event.
In Table – 2, values in particular parlance (economics) by using Adam Smith’s concepts of value in use and value in exchange, along with Tom’s idea of realizable value two life insurance products are presented.
A typical individual’s economic activity comprises three ingredients, viz., income earning, expenditure and savings. After earning income and spending a portion of it for the basic necessities (expenditure to meet needs like food, shelter and clothing), some surplus is likely to remain from the income earned. Such surplus gets channelised to either high value consumption goods or investment in physical or financial assets. Investment in various financial assets is determined by return on investment, safety and security of capital invested, and preference schedule drawn by an individual for investment in relation to the perceived value of different asset classes.
Table – 2Life insurance products by values (economics)
Type of life insurance product
Value in use * Value in exchange **
Has realizable value (Yes/No)
Term assurance Low High Yes
Whole life Moderate High Yes
Endowment High High Yes
Unit linked Very high High Yes
Pension Very high High Yes
Note: Value in use / exchange can be classified as, low, moderate, high, and very high.
* Policy holder derives benefit when he is alive, and hence it is labeled as value in use.
** Policy holder’s nominees derive financial security. It is an exchange in terms of providing lump sum amount in the event of the death of policy holder.
Anatomy of life insurance in India and emerging scenario
A) Life insurance business was the monopoly of Life Insurance Corporation of India till recently. With the opening of insurance sector to private participation,
Table – 3 Financial savings of the household sector(% of gross national disposable income)
Item 2011-12 2012-13 2013-14 2014-15 2015-16 2016-17 2017-18 *
A. Gross financial savings of which
10.4 10.5 10.4 9.9 10.8 9.1 11.1
1. Currency 1.2 1.1 0.9 1.0 1.4 -2.0 2.8
2. Deposits 6.0 6.0 5.8 4.8 4.6 6.3 2.9
there are now many players including LIC. Despite the entry of new players, the proportion of insurance funds in gross financial savings of house hold sector has not been more than 1/4th over the years (Table – 3).

THE JOURNAL OF INSURANCE INSTITUTE OF INDIA
JULY - SEPT - 201936
THEORY OF VALUE
Item 2011-12 2012-13 2013-14 2014-15 2015-16 2016-17 2017-18 *
3. Shares & debentures 0.2 0.2 0.2 0.2 0.3 0.2 0.9
4. Claims on government -0.2 -0.1 0.2 0.0 0.5 0.4 0.0
5. Insurance funds 2.2 1.8 1.8 2.4 1.9 2.3 1.9
6. Provident & pension funds 1.1 1.5 1.5 1.5 2.1 2.0 2.1
B. Financial liabilities 3.2 3.2 3.1 3.0 2.8 2.4 4.0
C. Net financial savings
(A – B)7.2 7.2 7.1 6.9 8.1 6.7 7.1
Source : RBI Annual Report. * Preliminary estimates of the RBI for 2017-18.Note: Figures may not add up to total due to rounding off.
B) Life insurance being the only product designed to mitigate the risk against the unpredictable certainty of death, there is greater scope for its rapid inroads in the savings market in the scenario of increasing income levels (Table – 4).
Table – 4Trends in per capita income (gross domestic product) in India :
Year Per capita income (Rs.)
At current prices At constant (2011-12) prices
2011-12 71,609 71,609
2012-13 80,518 74,599
2013-14 89,796 78,348
2014-15 98,405 83,091
2015-16 1,07,280 88,746
2016-17 1,17,427 93,888Source : National Accounts Statistics, 2018, Ministry of Statistics and Programme Implementation.
With the ever increasing spread of electronic and other media disseminating information, coupled with the increasing awareness about the value of life insurance product in the basket of financial savings, there is every reason to believe that life insurance business will witness an accelerated growth pattern.
C) Ancillary factors like rise in literacy levels (particularly female literacy, Table-5) coupled with prevalence of higher maternal mortality rate (Table-6) are the propelling variables to understand well by the women folk to subscribe to life insurance products.
Table – 5
Literacy rates in India : Census 2001 & 2011
Census year Literacy Rate (%)
Male Female Total
2001 75.3 53.0 64.8
2011 80.9 64.6 73.2
% increase in literacy rate in 2011 over 2001 5.6 11.6 8.2
Source : Health and Family Welfare Statistics in India, 2017.With the increase in total literacy rate to 8.2% and in particular female literacy rate to 11.6% (male literacy rate increased by 5.6%), understanding and appreciating the need and necessity of investing in life insurance products is an evolving phenomenon.

37JULY - SEPT - 2019
THE JOURNAL OF INSURANCE INSTITUTE OF INDIA THEORY OF VALUE
Table – 6Maternal mortality ratio (per 1,00,000 live births)
India & selected States YEAR
2001-03 2004-06 2007-09 2011-13
India 301 254 212 167
Selected States*
1. Assam 490 480 390 300
2. Bihar/Jharkhand 371 312 261 208
3. Madhya Pradesh / Chhatisgarh 379 335 269 221
4. Odisha 358 303 258 222
5. Rajasthan 445 388 318 244
6. Uttar Pradesh / Uttarakhand 517 440 359 285 *States having maternal mortality ratio over and above all-India level are presented here.
Source : Health and Family Welfare Statistics in India, 2017.
Maternal mortality ratio (Table-6) per 1,00,000 live births though witnessed declining trend over the years, it is still a matter of concern. Six of the states in India are having maternal mortality rates higher than Indian average level. A higher maternal mortality rate coupled with the rise in general literacy rate to 8.2% from 2001 to 2011 and female literacy rate in particular to 11.6% during the same period, with the added ingredient of rising per capita income, are the enabling factors in understanding and appreciating the need and necessity of life insurance products by the general population and the women in particular. A combination of all the aforesaid factors is bound to result in offering a plethora of well differentiated value based life insurance products, ultimately leading to garnering more funds to the life insurance sector.
D) In such an emerging scenario, it is suitably designed products to different segments and target oriented marketing that makes all the difference. In the rapidly
and positively evolving favourable scenario, a small differentiation in products can make a greater difference for getting it off the shelf sooner than later.
Summary and conclusion
Life insurance is part and parcel of an individual’s wealth. Malthus (1989, P-33) defined wealth by two characteristics, viz., necessity and useful or agreeable to mankind. Life insurance product distinctly qualifies the Malthusian definition of wealth.
In the economic theory based classification of goods and services giving utility into necessities, comforts and luxuries; life insurance satisfies both the qualities of necessity and comfort. Rather, a life insurance product is not at all a luxury item.
In choosing one avenue of investment in preference to other, an investor is not only wading through a complex matrix within which he has to operate, but, highlighting his emphasis upon certain preferences Maternal mortality
ratio (Table-6) per 1,00,000 live births though and factors at the cost of excluding others.
To achieve an undimensional goal of building wealth, an investor needless to say has to resort to a multi-dimensional task of distribution of his investible resources in various savings slots. It involves in reconciliation of choices and arriving at a compromising decision in a conflicting scenario. The decision bearing variables of a life insurance product are; savings, yield, perceived risk, security of investment, wealth creation, etc.
Even keeping aside individual investment choices in different asset classes (physical assets and financial assets like mutual funds, bank fixed deposits, equity shares, debentures, etc.), an individual investment choice even in one asset class of life insurance has numerous decision impacting variables. The probable decision bearing variables to invest in one life insurance product as compared to other life insurance products can

THE JOURNAL OF INSURANCE INSTITUTE OF INDIA
JULY - SEPT - 201938
THEORY OF VALUE
be magnitude of savings, returns, perceived risk, security of investment, wealth creation, etc. To fit it in a statistical model, we may need to put it as :
Y = S + R + PR + SE + W……….n
where;
Y (Dependent variable) = Investment in an insurance product
And
Independent variables
S = Savings
R = Returns
PR = Perceived risk
SE = Security of investment
W = Wealth creation
References
1. Shastri, P. P. and Shastri, J. P. (2014): “Risk Management in Human Resource Management”. The Journal of Insurance Institute of India, Vol No.II, Issue No.II, October – December 2014, Pp.124-128.
2. Rejda, George, 3. (2002, First Indian Reprint): Principles of Risk Management and Insurance, Pearson Education Pte. Ltd., Singapore, printed in India by Saurabh Print O Pack.
3. Smith Adam (1961): An inquiry into the Nature and Causes of the Wealth of Nations, Ed. with an introduction by Bruce Mazlish, Associate Professor of History, Massachusetts Institution of Technology (originally published in 1776), The Bobbs, Merrill Company, INC, Third Printing.
4. Tom Lee (1985): Income and Value Measurement: Theory and Practice, 3rd edition, Van Nostrand Reinhold (UK) Co. Ltd.
5. Malthus, T.R. (1986) : Principles of Political Economy, Reprinted 1986 by Augustus M. Kelley, Fairfield, NJ 07006 (1820 first edition)

39JULY - SEPT - 2019
THE JOURNAL OF INSURANCE INSTITUTE OF INDIA ALOP
Policy Coverage
This policy pays for the Loss of anticipated Gross Profit arising out a delay in scheduled start of project caused by one or more indemnifiable accidents occurring during the project period covered under EAR / CAR policy.
Loss of Gross Profit is defined as the amount by which the Actual GP
earned during the IP after delayed start of project, falls short of Anticipated GP insured would have earned, had the delay not taken place due to indemnifiable accident(s) during the construction period.
This shall be arrived by applying the trends / Adjustment / other circumstances clause on actual GP earnings.
Note on ALOP / DSU Insurance
V. P. Sharma Former Vice President and Head of Property and Engineering Underwriting Bajaj Allianz General Insurance Company Limited, Pune.Currently Mentor with Go Digit General Insurance Company, [email protected]
Understanding Different Stages of Project

THE JOURNAL OF INSURANCE INSTITUTE OF INDIA
JULY - SEPT - 201940
ALOP
Who can take this insurance?
Normally, this insurance is taken by Principal (Owners) of the project but in some cases, Financers / Lenders can also take this insurance.
Information Required for ALOP Insurance
Details of Second hand equipment, if any.
Bar chart showing construction and testing period for major items.
Details of any prototype or experimental features to the contract or any departure from standard design specifications.
History of any terrorism incident against the principal / contractor or any sub contractors.
Security arrangement on site.
Firefighting facilities on site during the construction period.
Details of elevation of site
List of key items with their technical specifications.
List of main spares available for each key item.
Percentage of relative importance (shortfall in case of outage) for each key item/sub-unit in relation to overall gross profit.
Replacement time for key items. (including transportation time, customs, clearance and erection
Detailed process description.
Detailed flow sheet
Annual gross profit
Time excess required
Limit of indemnity period required
Marine /transit risk of key items.
Local exposure to force majeure (flood, storm, earthquake).
Erection risk of key items.
Testing risk of total plant.
Relative importance of critical machineries.
Availability of spare parts.
Implementation of loss control.
Sum Insured
This may be defined as Anticipated Annual Gross Profit arrived at by adding net profit to standing charges.
If the IP is more than 12 months, the sum insured is to be adjusted proportionately.
This may be adjusted with business results after actual commencement.
This can be taken from the Project report submitted to Financers showing the anticipated profits the Enterprise is likely to generate once the project is finally tested, commissioned & becomes operational.
The scheduled start of commercial production can be obtained from contract entered into between the Contractor & Principals.
Deductible / Time excess
In India, the deductible is stated in time. The appropriate deductible is dependent on the construction period, complexity of the risk, location, possible extension to cover and the technology used.
Currently, effective from 1st November 18, following deductible is being used by Indian Insurers as per the treaty requirements imposed by GIC.
“for Normal projects - 30 days for the first 12 months & 1 day for each erection month in addition to 12 months subject to max. of 60 days.”
“For specialized projects, (like All water works, Canals, Dams, Hydro power, Tunnels, Irrigation systems etc) - 45
days for the first 12 months & 1 day for each erection month in addition to 12 months subject to max. of 75 days.”
For all Gas based & Combined cycle Power plant - 45 days for the first 12 months & 1 day for each erection month in addition to 12 months subject to max. of 75 days.”
Calculation of Deductible / Time excess
Ex 1. For a steel plant of 35 months the TE shall be
for first 12 months – 30 days
for remaining period – 23 days
Total – 58 days
Ex 2. For a Gas based Power project of 36 months the TE shall be
for first 12 months – 45 days
for remaining period – 24 days
Total – 69 days
Ex 3. For Construction of Dam project of 44 months the TE shall be
for first 12 months – 45 days
for remaining period – 32 days
Total – 77 days
Final TE – 75 days
Fundamentals of ALOP Insurance
The ALOP policy is normally given to PRINCIPAL. Sometimes, Lenders may take this insurance to protect loss of Interest in the event of delayed start of project.
Period of insurance for MD & ALOP must be Concurrent
Same insurer(s) for ALOP and MD
Insurance period identical to MD erection period
Accidents not immediately followed by indemnity period

41JULY - SEPT - 2019
THE JOURNAL OF INSURANCE INSTITUTE OF INDIA ALOP
Only one claim per policy irrespective of no. of accidents.
Only one Time Excess is applicable irrespective of No. of claims.
Any anticipated change in scheduled date of commencement of project must be informed and shall be considered effective only if agreed by Insurer in writing.
• Extension of policy : Extension of basic CAR / EAR policy does not automatically extend the period of ALOP unless specifically agreed and recorded in policy document. IP & TE can be renegotiated if deemed necessary, before agreeing for policy extension.
• Application of TE : The insurer shall not be liable for the amount obtained by multiplying the average daily value of the loss of GP sustained during the indemnity period by the number of days specified in the schedule as the time excess.
Who is interested in ALOP Insurances
The Principal:
In order to safeguard his future financial commitments.
The Financers / Lenders:
To safeguard their interest earnings.
Indemnity under the policy?
Loss of Gross Profit
Loss of Gross Earnings
Payment of Continued Fixed expenses
Increased Cost of Working
Penalties and Fines due to Delay, if covered
Debt Service Charges, if covered
Basis of Policy Agreement
The decision to insure the “full gross profit” or not, rests with the insured.
3. options are available:
A Insured decides to insure 100 % of Gross Profit -- Normal cases
OR
B Standing Charges only
Example: Standing Charges = 60% of G.P.
Limit of Indemnity = 60% of G.P.
OR
C Interests only
Example : Limit of Indemnity = 40%of G.P.
Specifications
1) Advanced Loss of Gross Profit – Manufacturing risks – The amount by which the Actual GP during the IP fall short of Anticipated GP after applying the trends / Adjustment / other circumstances clause.
2) Advanced Loss of Gross Revenue – Hotel or Amusement park
The amount by which the Actual Gross Revenue during the IP fall short of Anticipated Gross Revenue after applying the trends / Adjustment / other circumstances clause.
3) Advanced Loss of Gross Rent –
Residential society, Retail Shopping
Mall. – It is amount of by which the
Actual Gross Rent during the IP in
consequence of an interruption, fall
short of Anticipated Gross Rent less
savings in respect of Std Charges.
These figures are adjusted applying
the trends / Adjustment / other
circumstances clause.
4) Loss of Bank Interest – It pays for Bank Interest during the legitimate delay period in scheduled start of commercial operation of project.
Policy Exclusions
Policy does not pay for loss of GP due to Delay in completion of erection work or testing due to:
Loss / Damage due to Inventory Losses
Loss / Damage to Surrounding Property, Contractors Plant & Equipment
In India, the deductible is stated in time. The appropriate deductible is dependent on the construction period, complexity of the risk, location, possible extension to cover and the technology used.
Currently, effective from 1st November 18, following deductible is being used by Indian Insurers as per the treaty requirements imposed by GIC.
“for Normal projects - 30 days for the first 12 months & 1 day for each erection month in addition to 12 months subject to max. of 60 days.”

THE JOURNAL OF INSURANCE INSTITUTE OF INDIA
JULY - SEPT - 201942
ALOP
Restrictions imposed by Public Authority
Non Availability of funds for Repairs / Replacement to damaged items
Delay in shipments of supplies
Normal Project schedule slippage
Cancellation of licence or Govt. restrictions
Stoppage of work/Strike interference.
Guarantee or Performance warranty by Manufacturer or suppliers of project
Machinery & Equipment.
Policy Extensions – Add on covers
Denial of access
Supplier’s premises extension – cover restricted losses caused due to to Fire & Allied perils only and for Named & Inland suppliers only.
Off site storage
Failure of Outgoing / Incoming Supplies
Definitions
Period of Insurance:
It defines the period during which an insured event has to occur in order to qualify for ALOP claim. It must be identical to the period of CAR/EAR Insurance.
Indemnity Period:
The period beginning with the scheduled date of commencement of the operation upon which but for the incident, turnover would have commenced and ending not later than the maximum indemnity period thereafter, during
which the results of the business are affected.
Turnover:
The turnover which but for the incident would have been earned during the maximum indemnity period immediately following the scheduled date of commencement.
Anticipated Gross Profit
This the Gross profit Insured would have earned during the IP, had the loss not taken place during the project period causing delay in scheduled start of project. This shall be arrived by applying the trends / Adjustment / other circumstances clause on actual GP earnings during the IP on delayed start of project.
Anticipated Commencement Date of Business:
Date on which the business could have commenced, had no insured event occurred which ultimately resulted in a delay of commencement of the
business, but not earlier than the date stated in the schedule.
Delay Period
It is the length of time between the anticipated date of commencement and the actual date of commencement of business.
Various causes for Delay in Project Commissioning date
Design related delays
Construction related delays
Finance related delays
Management/administrative related delays
Lack of Supplies
Authority Restrictions
Land acquisition problems
Weather
Unforeseen event, Accidents
Catastrophe
Actual delay can be seen
Lack of Supplies
Authority Restrictions
Land acquisition problems
Weather
Unforeseen event, Accidents
Catastrophe
Actual delay can be seen
These can be found out from ‘S’ curve as given below
ALOP Loss mitigation
Replacement vs. Repair – If insured insists on replacement instead of repairs which might increase delay, must try to convince for temporary repairs till replacement arrives at project site
Add additional shifts - Add Sunday and night shift on additional cost
– Recoverable under ICOW (Increased Cost of Working)
Alternative ways of sourcing equipment – Different supplier, Alternate equipment
Alternative ways of shipping equipment – Air lift instead of normal transport – Land / Sea Costs recoverable under ICOW
Incentive (Bonus) to Contractor for accelerating the project - Recoverable under ICOW
These can be found out from ‘S’ curve as given below

43JULY - SEPT - 2019
THE JOURNAL OF INSURANCE INSTITUTE OF INDIA ALOP
ALOP Loss Mitigation
Replacement vs. Repair – If insured insists on replacement instead of repairs which might increase delay, must try to convince for temporary repairs till replacement arrives at project site
Understanding Delay:
Understanding ALOP Insurance
Add additional shifts
– Add Sunday and night shift on additional cost
– Recoverable under ICOW (Increased Cost of Working)
Alternative ways of sourcing equipment
– Different supplier, Alternate equipment
Advanced Loss of Gross Profit – Manufacturing risks – The amount by which the Actual GP during the IP fall short of Anticipated GP after applying the trends / Adjustment / other circumstances clause.
Advanced Loss of Gross Revenue – Hotel or Amusement park
The amount by which the Actual Gross Revenue during the IP fall short of Anticipated Gross Revenue after applying the trends / Adjustment / other circumstances clause.
Advanced Loss of Gross Rent – Residential society, Retail Shopping Mall. – It is amount of by which the Actual Gross Rent during the IP in consequence of an interruption, fall short of Anticipated Gross Rent less savings in respect of Std Charges.
Alternative ways of shipping equipment
– Air lift instead of normal transport
– Land / Sea Costs recoverable under
ICOW
Incentive (Bonus) to Contractor for
accelerating the project - Recoverable
under ICOW
Understanding - One Claim per Policy
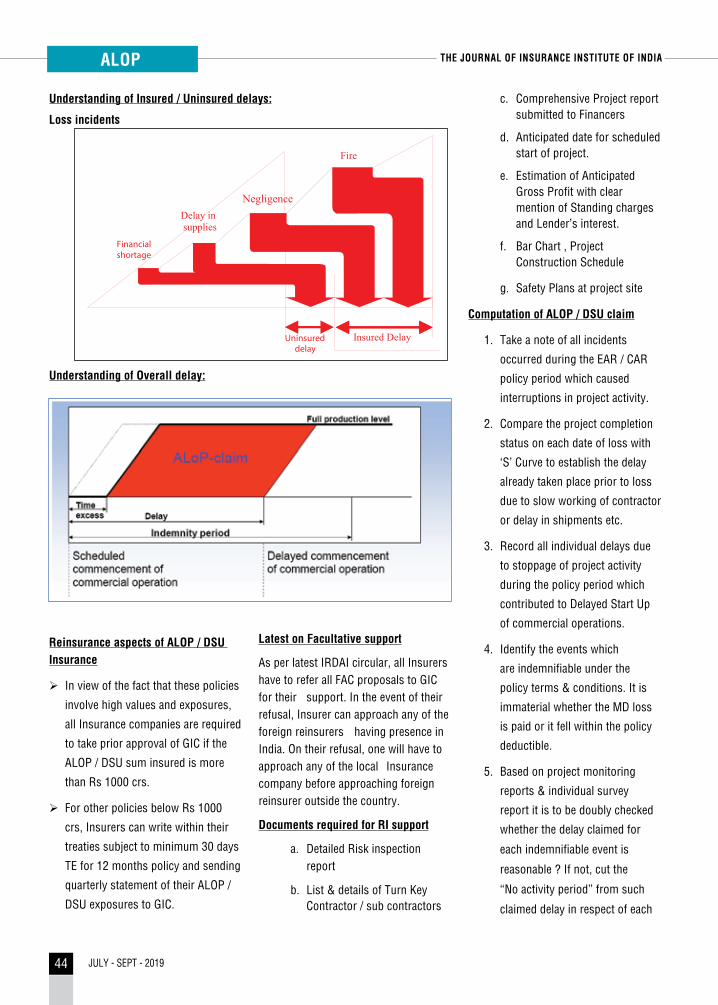
THE JOURNAL OF INSURANCE INSTITUTE OF INDIA
JULY - SEPT - 201944
ALOP
Understanding of Insured / Uninsured delays:
Loss incidents
Understanding of Overall delay:
Reinsurance aspects of ALOP / DSU Insurance
In view of the fact that these policies
involve high values and exposures,
all Insurance companies are required
to take prior approval of GIC if the
ALOP / DSU sum insured is more
than Rs 1000 crs.
For other policies below Rs 1000
crs, Insurers can write within their
treaties subject to minimum 30 days
TE for 12 months policy and sending
quarterly statement of their ALOP /
DSU exposures to GIC.
Latest on Facultative support
As per latest IRDAI circular, all Insurers have to refer all FAC proposals to GIC for their support. In the event of their refusal, Insurer can approach any of the foreign reinsurers having presence in India. On their refusal, one will have to approach any of the local Insurance company before approaching foreign reinsurer outside the country.
Documents required for RI support
a. Detailed Risk inspection report
b. List & details of Turn Key Contractor / sub contractors
c. Comprehensive Project report submitted to Financers
d. Anticipated date for scheduled start of project.
e. Estimation of Anticipated Gross Profit with clear mention of Standing charges and Lender’s interest.
f. Bar Chart , Project Construction Schedule
g. Safety Plans at project site
Computation of ALOP / DSU claim
1. Take a note of all incidents
occurred during the EAR / CAR
policy period which caused
interruptions in project activity.
2. Compare the project completion
status on each date of loss with
‘S’ Curve to establish the delay
already taken place prior to loss
due to slow working of contractor
or delay in shipments etc.
3. Record all individual delays due
to stoppage of project activity
during the policy period which
contributed to Delayed Start Up
of commercial operations.
4. Identify the events which
are indemnifiable under the
policy terms & conditions. It is
immaterial whether the MD loss
is paid or it fell within the policy
deductible.
5. Based on project monitoring
reports & individual survey
report it is to be doubly checked
whether the delay claimed for
each indemnifiable event is
reasonable ? If not, cut the
“No activity period” from such
claimed delay in respect of each
Financial
shortage
Delay in
supplies
Negligence
Fire
Uninsured
Insured Delay
delay

45JULY - SEPT - 2019
THE JOURNAL OF INSURANCE INSTITUTE OF INDIA ALOP
& every event applying the “Due
Diligence clause”.
6. Add all justified & indemnifiable
delays to arrive at single “Payable
delay”.
7. Find out the actual GP earned
during the max. IP after the
delayed start of project.
8. This is to be adjusted ( upward
or downward) by applying the
Trends, Adjustment & other
circumstances clause.
9. It will not be out of place to pay
‘On Account payment’ & wait for
completion of maximum IP to
arrive at the most realistic figures
of “Actual GP earned.
10. In case of downward trend of
Market demand or Imposition
of Gov’t restrictions as on date
of actual start of project, which
were not present as on scheduled
start up date of plant, necessary
upward adjustments of GP
earned shall have to be done
by surveyors to compute Net
payable loss.
11. Work out the actual GP loss by
proportionate computation of
GP for actual period of delay if
there are no teething issues & full
production capacity is achieved
right from day one.
12. On the contrary, if there are
teething issues & the nature of
plant is such that it takes few
months to achieve full production
capacity, actual GP earned during
the initial period equivalent to the
net payable delay is worked out
by applying ROGP to the actual
TO (Turn over) achieved. It is to
be suitably adjusted by applying
Trends & Adjustment clause to
arrive at the payable loss.
13. Add for ICOW if any, subject to
Economy limits.
14. Adjust for Time Excess as agreed
and shown on policy.
Computation of DSU claim if Interest
alone is covered
If Financier’s / Lender’s Interest alone is
covered, following steps to be followed.
Find out the net payable delay as per steps discussed earlier.
1. Find out the Interest that the insured is liable to pay to Bank for the net adjusted period of delay in scheduled start of project.
2. Adjust the payable amount if any grace period is allowed by Financiers in repayment schedule.
Computation of DSU claim if Standing charges are covered
1) If Standing charges alone are covered, we will work out the actual Standing charges incurred on delayed start of project during the period equivalent to the net payable delay.
2) This has to be duly adjusted applying the trends & adjustment clause to account for the changed circumstances due to delayed start of project.
Case Study 1 – ALOP / DSU claim
• A project Insurance policy (EAR)
for erection of steel plant was
taken by XYZ for a sum of Rs
2500 crs for a period of 2 years
including 2 months Testing. The
scheduled completion date of
the project was 15th Dec. 2015.
Insure has taken ALOP Insurance
for a sum of Rs 100 crs
(Anticipated Gross Profit) with
an IP of 18 months for the period
concurrent to MD (Material
damage) policy. Time excess in
policy is 42 days of GP (Gross
Profit)
• Insured suffered a flood loss
of Rs 20 crs with a complete
stoppage of project activity for a
period of 60 days.
• Insured suffered Inventory loss of
Rs 5 crs on 10th July 2015 which
hampered the erection activity for
15 days.
• There was a loss during erection
of plant for 12 crs on 20th Sept
2016 due to breakage of crane
damaging the Hot rolling mill
with surrounding equipment.
This caused stoppage of erection
activity for 30 days. Insured
incurred a sum of Rs 75 lacs for
expeditious delivery of damaged
parts of Hot rolling mill in order
to facilitate speedy repairs
which saved 7 days of precious
time. The project was finally
commissioned on 30th March
2016.
• Calculate Loss under ALOP
policy after applying the Trend &
Adjustment clause.

THE JOURNAL OF INSURANCE INSTITUTE OF INDIA
JULY - SEPT - 201946
ALOP
Solution
1) Period of interruption due to
1st incident of floods = 60 days
2) Period of interruption
due to 2nd incident of
inventory loss = 15 days
3) Period of interruption
due to 3rd incident of
crane failure = 30 days
4) Total delay = 105 days
5) Insured delay = 60 + 30 = 90 days
6) Sum insured
(anticipated Annual GP)
with 18 months IP = Rs 100 crs
7) Actual GP earned during
12 months period after
delayed start = 82 crs
8) Adjusted GP earnings
after applying Trends
& Adjustment Clause
during 12 months period
after delayed start = 85 crs
9) Loss of GP during the
delay period of 90 days
= 85/365x 90 = 20.95 crs
ICOW = 75 lacs
Loss of GP avoided
(Economy limit) = 7 *85/365 = 1.63 crs
Hence, ICOW is payable in full.
Time excess = 42 x 85/365 = 9.78 crs
Check Adequacy of sum insured
Sum insured (Anticipated Annual GP)
= 100 crs with IP of 18 months
GP for 18 month = 85 x 1.5 = 127.5 crs
Hence UI (Under Insurance - Average
clause) = 100/127.5
Payable loss net of UI = (20.95 + 0.75) x
100/127.5 = 17.02 crs
Final loss payable net of
TE = 17.02 – 9.78 = 7.24 crs
It is always in order to pay On Account
payment of claim (say 50%) to insured
to save him from financial crunch.

67october-december 2017
The Journal of Insurance InsTITuTe of IndIa
Complete all the details in Capital letters and return to the address below.
Insurance InstItute of IndIaYeejleerÙe yeercee mebmLeeveG-Block, Plot No. C-46, Bandra Kurla Complex,
Mumbai – 400 051.www.insuranceinstituteofindia.com
request for ‘The Journal’
Do you work in the Insurance Industry? If yes, please state the name of the Company
Yes No
Your Details
Email _________________________________________________________________________
Mr/Mrs./Ms./Miss/Other First Name _____________________ Surname ____________________
Designation ____________________________________________________________________
Correspondence Address
Address 1 _____________________________________________________________________
Address 2 _____________________________________________________________________
Address 3 _____________________________________________________________________
City ______________ State _________________ Country ________________ Pin ____________
""
orYou can subscribe ‘The Journal’ through our website www.insuranceinstituteofindia.com or can send a mail to [email protected].
return the duly filled form at the below address.Knowledge Management Center, Insurance Institute of IndiaG-Block, Plot No. C-46, Bandra-Kurla Complex, Mumbai – 400 051.


49JULY - SEPT - 2019
LOSS PREVENTIONTHE JOURNAL OF INSURANCE INSTITUTE OF INDIA
Accident Analysis and Loss Prevention: Case of Ship Pollution Accidents in Marine Ports
Kambiz Mokhtari ECO College of Insurance, Allameh Tabataba’i University, Tehran, [email protected]
AbstractNowadays in marine industry there
are emerging hazards with acts of
terrorism, unforeseen natural disasters
e.g. tsunami and accidents having
unpredicted disastrous environmental
impacts etc. Therefore industry
professionals like safety engineers in
order to make appropriate priority risk
assessment of the potential hazards
where there is no data available; need to
use an appropriate and suitable method.
To overcome this, Fuzzy Set Theory
(FST) can be applied where all or part
of the data are unknown and vague.
Thus besides using of the FST and
combination of known and unknown
data via using the both probability and
possibility approaches the pre-combined
result will be determined under a fuzzy
environment. This has been fulfilled by
integration of Fuzzy Analytic Hierarchy
Process (FAHP) method using experts’
judgements. Furthermore due to
availability of historical data, traditional
Fault Tree Analysis (FTA) and Event Tree
Analysis (ETA) will be used to analyse
one of the significant identified hazards.
In the risk mitigation phase of the Risk
Management (RM) framework Fuzzy
TOPSIS method will be used to select
the best loss prevention strategies.
The practicability of the addressed RM
framework is verified with the use of a
suitable case study.
Keywords
Accident Analysis, Expert Judgement
Framework, Fuzzy Set Theory, Fuzzy
TOPSIS Method, Marine Ports and
Terminals,Risk Management.

THE JOURNAL OF INSURANCE INSTITUTE OF INDIA
JULY - SEPT - 201950
LOSS PREVENTION
1. Introduction
There has been growing concern in public and private sectors regarding the threats of the hazards associated within marine ports and terminals to people, assets, environment and reputations resulting from the marine ports’ and terminals’ operations and management. Investigations show that almost all the major accidents and losses in terms of delays and costs could be avoided with effective RM programmes Wang (2004); Tarila and Edward (2017). This paper is focuses on marine ports and terminals, discusses recently emergent RM-related issues while taking into consideration externally and internally driven elements e.g. pure risks (i.e. uncertainty of damage to property by fire, flood or the prospect of premature death caused by accidents) and speculative risks (i.e. risks which are linked directly to the business function, decision making processes and management). This view has been steadily increasing, for example, a number of studies have reported such trend in the United Nations Conferences on Trade and Development from 1996 to 2006 UNCTAD (2006), developed a security risk assessment and management framework that is capable of reflecting the logistics scope of transport networks.
The focus was mostly on the development, management, commercial, operational and organisational issues of the marine ports and terminals. On the marine related RM area, GAO (2019) has stressed for “further refinements needed to assess risks and prioritise protective measures at related critical infrastructure”. In UK, DETR (2000) and required all marine ports and terminals to carry out risk assessment of marine operations in order to implement the safety management system. Additionally
UK, HSE (2018) has urged marine and offshore contactors and operators to conduct safety cases and safety reports on different stages of their operations e.g. design, commissioning, operation, transportation, decommissioning as well as reviewing them periodically.
In logistics industry such as marine ports and terminals a high quality RM is absolutely necessary for their sustainable development. In this regard risk is defined as “a measure of human injury, environmental damage or economic loss in terms of both the incident likelihood and the magnitude of the injury, damage or loss” CCPS (2000) and Mokhtari (2012). Risk analysis involves the development of an overall estimation of risk by gathering and integrating information about scenarios, frequencies and consequences. It is one of the major components of the whole RM process of any particular enterprise.
The main aim of this paper is to use a proposed RM framework to evaluate, prioritise and furthermore to investigate hazards through an appropriate integrated risk analysis method in marine ports and terminals. The proposed framework for the purpose of marine ports and terminals consists of the following three main phases:
• Hazard Identification
• Risk Assessment (i.e. including risk priority assessment and Accident Analysis Model)
• Risk Mitigation (i.e. Loss and Accident Prevention)
Overall the developed Accident Analysis Model (See Figure 1) can facilitate on achieving the objectives of the RM framework within the marine ports and terminals.
This paper is organised as follows: Section 2 reviews the existing literatures
on some of the major accidents and their prevention methods. Section 3 with help of a case study proposes and investigates a RM framework that presents and discusses about hazard identification, risk assessment (including risk priority assessment and accident analysis model) and risk mitigation phases in marine ports and terminals. Conclusions and further works are discussed in Section 4.
2. Literature review
Along with the rapid progress of industrialisation, the risk of incidents is increasing and it has become increasingly recognised that there is a worldwide trend for losses due to accidents to rise even more rapidly than gross national product Lees (1996). As a result in order to analyse the potential risk factors appropriately there is a need to utilise risk analysis model for accidents. Moreover no course in a RM cycle would be complete without the inclusion of a major component on risk analysis. Risk analysis acts as a kind of hub, around which many other practical aspects of RM rotate Dickson (2003). Dickson discuss that every risk is caused by some factor or factors and results in some effect or effects. It can be viewed rather like a chain. The cause is linked to the nature of the risk and the risk itself is linked to the effect.
For example accident in the Gulf of Mexico which was the explosion on 20th April of 2010 on board the Deepwater Horizon, an offshore drilling platform working on a well one mile below the surface of the Gulf of Mexico, has led to a major oil spill. Lack of compliance with safety practice and mistakes in proper inspections has been found as main root causes for the case of this accident Sharp (2009). From shipping industry also as an example it can be referred to the oil Tanker Sanchi

51JULY - SEPT - 2019
LOSS PREVENTIONTHE JOURNAL OF INSURANCE INSTITUTE OF INDIA
collision accident case in 6th January of 2018, as the addressed vessel was carrying natural gas concentrate cargo of 136,000 metric tonnes, caught fire immediately after the collision with other bulk carrier vessel and following continuous burning, multiple explosions and drifting for eight days, it was sank at the end due to structural failure (CNN, 2018). This accident also resulted multiple claims (i.e. several deaths, actual total loss of the ship and its cargo, catastrophic environmental pollution, salvage, damage to other ship, wreckage, and third party liabilities etc) from its single source of collision and human errors has been found as main root causes for the case of oil Tanker Sanchi collision case (MSA, 2018).
As a result in this respect and for the purpose of accident analysis, based on
Krishna et al. (2003) both qualitative and quantitative techniques can be used. Nowadays variety of techniques are used for accident analysis including Physical Inspections, Organisational Charts, Flow Charts, Safety Review, Checklist Analysis, Relative Ranking, “What-if” Analysis, Preliminary Hazard Analysis (PHA), Hazard and Operability Study (HAZOP), Failure Modes and Effects Analysis (FMEA), Fault Tree Analysis (FTA), Event Tree Analysis (ETA), Cause-Consequence Analysis (CCA), Human Reliability Analysis (HRA) (Lees, 1996; Dickson, 2003; CIS, 1992; Krishna et al. 2003; ABS, 2003; Chiara and Giuseppe, 2014; Jichuan et al. 2018; Mareike and Athanasios 2018). These techniques have all been developed in the industrial setting, normally in response to some practical business problems. It is, however, unlikely that one technique will solve all problems for different industry types and still no one has argued for lack of complying with a generic or any specific RM framework.
Hazard Identification Risk AssessmentRisk Mitigation
via FTOPSIS Method
Risk Priority Assessment
Risk Prioritization via FAHP Method
Ranked Risk Factors
Under Fuzzy Environment
Accident Analysis Model
FTA ETA
Cause Evaluation
Consequence Evaluation
Bow-Tie Method
3. A proposed RM framework
This section illustrates the key features of the practical analysis of marine ports and terminals and the valuation of risk management system. Figure 1, after identification of the risk factors (i.e. hazards) illustrates the quantitative assessment and mitigation schemes in the risk management process. The objectives of the below shown RM framework is to detect, assess, analyse and mitigate the potential risk factors in all processes and operations of marine ports and terminals that compose the core business with having the main aim of accident analysis and loss prevention. Among the available techniques for the illustrated RM framework in Figure 1 are FAHP; bow-tie method; FTA; ETA and FTOPSIS (i.e. Fuzzy Technique for Order of Preference by Similarity to Ideal Solution) method are used in this paper to model the addressed RM framework for the purpose of marine ports’ and terminals’ operations and management.
There has been growing concern in public and private sectors regarding the threats of the hazards associated within marine ports and terminals to people, assets, environment and reputations resulting from the marine ports’ and terminals’ operations and management. Investigations show that almost all the major accidents and losses in terms of delays and costs could be avoided with effective RM programmes Wang (2004); Tarila and Edward (2017).
Figure 1: A generic accident analysis model integrated into a RM Framework of Marine Ports and Terminals

THE JOURNAL OF INSURANCE INSTITUTE OF INDIA
JULY - SEPT - 201952
LOSS PREVENTION
Therefore as is shown in Figure 1 after detecting the potential risk factors in marine ports and terminals through carrying out an intensive literature review with the aim of hazard identification, then these identified risk factors will be assessed and ranked via using fuzzy AHP method. The required risk-based data with having qualitative and quantitative natures will be gathered and combined through expert judgements’ and AHP method to produce quantitative data at the end. In order to deal with the vagueness of the data they will be treated under fuzzy environment using FST. Once the identified risk factors are assessed
and ranked, each risk factor can be dealt with independently regardless of their global risk-based calculated weights (See Table 1). In this situation it depends to the decision makers, risk managers, insurance experts and claim handlers in the addressed industry when to deal and/or to choose which one of the risk factor(s) into their considerations first. Ideally it is expected to choose the most significant risk factor first into their account in order to take care of it more rapidly to mitigate it for the loss prevention purposes. Therefore as it can be seen from Figure 1 in order to analyse each one of the selected risk factors in a quantitative manner bow-tie method will be used to investigate the potential causes and consequences of the addressed selected risk factor(s) (See Accident Analysis Model in Figure 1). In this part FTA will show and quantify the potential faults causing the addressed risk factor and subsequently ETA will be used to show and calculate the probability of the potential events. This offered quantitative risk analysis process for each individual risk factor will ensure that there is an adequate treatment practice and procedure in place for the purpose of implementing and completing the risk assessment phase. In the last part FTOPSIS method will be used to select the best strategies and/or solutions from among of the multiple choices of introduced strategies via a quantitative evaluation process to mitigate previously assessed risk factors in earlier phase to complete the addressed RM framework.
As it can be seen from Figure 1 due to unavailability and lack of data for priority assessment of the identified risk factors and also due to selecting the best strategies from among multiple choices for loss prevention purposes
through a decision making process it has been decided to carry out the both processes under fuzzy environment in order to deal with vagueness and lack of data in this paper. For this reason FAHP is used to deal with priority assessment of the identified hazards and FTOPSIS is used to carry out the mitigation phase of the RM framework.
Moreover for the purpose of dealing with accident analysis model as there are enough available data (i.e. historical data) to handle this section therefore bow-tie method including traditional FTA and ETA will be employed.
3.1. Hazard identification
Primarily and first phase in any RM framework is hazard identification (World Bank 2007 and GAO 2006 and Chartres et al. 2019). “Hazard identification should be approached in a methodical way to ensure that all significant activities within the organisation have been identified and all the risk factors flowing from these activities are defined” (IRM 2002). In this respect although in general terms many companies, organisations and government bodies are using the phrase of “risk identification” for the first phase in their RM procedures but more principally in engineering and industrial sectors such as in offshore and marine systems as it is argued by (Paltrinieri et al. 2015; Ren et al. 2009; Pillay and Wang 2003) the phrase of “HAZID” (i.e. HAZard IDentification) is used rather than the first one. HAZID is a general term used to express an exercise whose objective is to identify hazards (i.e. risk factors) and the related events that have the potential to result in a significant consequence. For example, a HAZID of an offshore terminal or offshore installation may be conducted to identify potential hazards which could result in consequences to personnel e.g. injuries
This section illustrates the key features of the practical analysis of marine ports and terminals and the valuation of risk management system. Figure 1, after identification of the risk factors (i.e. hazards) illustrates the quantitative assessment and mitigation schemes in the risk management process. The objectives of the below shown RM framework is to detect, assess, analysis and mitigate the potential risk factors in all processes and operations of marine ports and terminals that compose the core business with having the main aim of accident analysis and loss prevention.

53JULY - SEPT - 2019
LOSS PREVENTIONTHE JOURNAL OF INSURANCE INSTITUTE OF INDIA
and fatalities, environmental oil spills and pollution and property damages or lead for example to production losses and delays. The HAZID process can be applied to all or part of a marine port, an offshore terminal, a tanker vessel or it can be implemented to examine operational procedures of organisations. Depending upon the system being evaluated and the resources accessible, the process used to conduct a HAZID can differ (ABS, 2003). As an example in sea ports and offshore terminals especially in crude oil, LNG and LPG import and export terminals HAZOP (i.e. Hazard Operability) is the best solution for hazard identification purposes. In this respect HAZOP is a structured way of examining the planned or existing process operation. The main aim of a HAZOP study is to identify problems that may expose hazard to personnel or equipment, or prevent efficient operation (Lassen, 2008). Based on Mokhtari (2012), literature search is one of the HAZID techniques used to express an exercise whose goal is to identify hazards and associated events that have the potential to result in a major effect. As Saunders et al. (2007) have explained the benefit of literature search is to save time as the required risk-based data is previously searched and available, and also it is less costly than other techniques. It is also likely to be of higher-quality, and the data can be used in conjunction with the other qualitative and quantitative methods, tools and techniques.
3.2. Risk assessment
The key phase of any RM framework or cycle is the quantitative risk assessment phase to assess and analysis the identified hazards or risk factors (Aneziris et al. 2014; Martins et al. 2016 and Jeong et al. 2018). In this regard ABS (2003) explains that the
competence to make sensible decisions is crucial to a successful business scheme. Furthermore in today’s complex world, business decisions are rarely straightforward or easy. For this purpose risk assessment is typically applied as an aid to the decision-making process. There are a variety of qualitative and quantitative risk assessment methods which are used for different situations and in various industries. However before carrying out a quantitative risk assessment phase first there is a need to effectively make a generic model for the purpose of assessing the risk factors (i.e. hazards) identified. In this regard Haimes (2002) argues if the adage, “To manage risk, one must measure it with appropriate metrics,” constitutes the compass for RM, then modelling constitutes the road map that guides the analyst throughout the journey of risk assessment. However quantitative risk assessment in the marine and offshore industry for example in some sectors such as in sea ports and offshore terminals is a new and challenging task as much of the available data is highly uncertain and vague, and many of the mechanisms may not be fully understood. As a result, a methodical approach is needed to
handle quantitative and qualitative data when new knowledge and data become available. For this purpose in order to deal with vague, unavailable and insufficient data; techniques such as experts’ judgements via using a FAHP method can be used for assessing and prioritization of the identified hazards or risk factors from the previous phase. Literatures, methodologies, equations and procedures regarding FST and FAHP method which are based on Chang’s extent analysis (1996) are completely mentioned and can be found from the author’s previous works such as Mokhtari et al. (2011) and Mokhtari (2012) which are outside the scope of this paper.
3.2.1 Accident analysis model
This paper through the addressed accident analysis model will examine the failure causes (basic events) and consequences (outcomes) resulting from the top event of “Ships’ related pollution” accidents with the use of bow-tie method (See Figure 2) accompanying the traditional FTA and ETA techniques while using historical data.
Furthermore risk analysis techniques such as bow-tie method, FTA and
Top Event(Risk Factor)
Consequences
Consequences
Fault tree analysis Event tree analysis
Caus
es
Causes
Figure 2: A Bow-tie diagramSource: Modified from GEXCON (2019)

THE JOURNAL OF INSURANCE INSTITUTE OF INDIA
JULY - SEPT - 201954
LOSS PREVENTION
2004). Procedures and all steps to carry out FTA and ETA based on Ferdous et al. (2009) are all explained in the author’s previous works such as Mokhtari et al. (2011) and Mokhtari (2012) which are outside the scope of this paper.
3.3. Risk mitigation phase
Risk mitigation is a decision making process whereby actions are taken in view of the outcomes of risk assessment. Standard risk prevention strategies aim either at reducing the probability of an incident (i.e. pre-accident intervention) or at minimising the degree of losses if the accident occurs (i.e. post-accident intervention). This process is generally combined
with Cost-Benefit Analysis (CBA) for optimal decision-making (UNCTAD, 2006). Therefore in order to complete the addressed QRM methodology it is necessary to accomplish it via a risk mitigation phase. In this respect for mitigating the identified and assessed risk factors first it is essential to distinguish the different mitigation strategies or sources and then by utilising an appropriate quantitative and methodical technique to prioritise them for their proper application purposes.
For the purpose of this paper in marine and offshore industry there exist many hazards that all are already identified, analysed and assessed for their associated risks but now they must be properly mitigated via using QRM expert method in order to identify the most significant strategies to take care of the risk factors. Therefore the mitigation phase of a QRM methodology plays a vital role to complete the addressed cycle. There are complementary literatures about risk mitigation (Rimsaite, 2019) and other subcategories of risk mitigation process such as risk avoidance (King, 2016); risk reduction (Morettia et al. 2018) risk sharing (Mirakhor et al. 2017) and risk retention (Guo and Wu, 2014) practices that can be referred to.
3.3.1. Ideal strategies for the purpose
of risk mitigation
Nevertheless in order to manage the
identified and assessed risk factors it
is necessary to classify the most ideal
strategies for their mitigation purposes.
In this respect the most significant risk
mitigation factors for the purpose of
offshore terminals and marine seaports
are identified as follows:
3.3.1.1. Privatisation and Deregulation
To meet challenges of globalisation, ports have to increase both capacity and efficiency while reducing costs. Traditionally, ports were not only publicly owned but also politically controlled and regulated. This replaces the possibility of market failure (because the port is a monopoly and not subject to competitive disciplines) with state failure: inefficient ports, choking trade and development. To overcome these sorts of problems there are two possible remedies, deregulation or privatisation (UNCTAD, 1995; ICS, 2015; Lia et al, 2019 and Chen et al. 2017). Deregulation is the reduction of the role of the government in an enterprise, with market forces replacing government regulation as the regulator of acceptable industry performance (ICS, 2015 and Mou et al. 2019).When valuable competition can be maintained in the related markets and activities, privatisation has been demonstrated to have huge prospects for reducing costs and getting better service quality. Without competition, privatisation can still bring some improvements, but the gains are quite restricted (World Bank, 2007). A review of the top 100 container ports in the world carried out in 1997 showed that 88 of these ports have been privatised to some degree (Juhel, 2001). The extensive carrying out of port privatisation policies in Asia, North America, Europe and Latin America is explained, respectively in (ICS, 2015).
3.3.1.2. Quality standards: IMS (ISO: 9000, 14000, 18000) and ISO 20000
Economic uncertainty has forced companies to find ways to become more efficient in order to maintain their profitability and integrity. Formal
ETA can be used for investigating of the potential failure causes and consequences, as a result of the other risk factors identified and assessed from first and second phases of the addressed RM framework.
In normal cases where there are sufficient data and considering the fact that the probability of the events are only relative frequencies of their occurrences (Andrew and Moss, 2002; Henley and Kumamoto, 1981) for an AND gate event, its probability can be obtained by Equation 1.
6
methodologies, equations and procedures regarding FST and FAHP method which are based on Chang’s extent analysis (1996) are completely mentioned and can be found from the author’s previous works such as Mokhtari et al. (2011) and Mokhtari (2012) which are outside the scope of this paper.
3.2.1 Accident analysis model
This paper through the addressed accident analysis model will examine the failure causes (basic events) and consequences (outcomes) resulting from the top event of “Ships’ related pollution” accidents with the use of bow-tie method (See Figure 2) accompanying the traditional FTA and ETA techniques while using historical data.
Figure 2: A Bow-tie diagram
Source: Modified from GEXCON (2019)
Furthermore risk analysis techniques such as bow-tie method, FTA and ETA can be used for investigating of the potential failure causes and consequences, as a result of the other risk factors identified and assessed from first and second phases of the addressed RM framework.
In normal cases where there are sufficient data and considering the fact that the probability of the events are only relative frequencies of their occurrences (Andrew and Moss, 2002; Henley and Kumamoto, 1981) for an AND gate event, its probability can be obtained by Equation 1.
n
i 1 (1)
where P is the probability of top event; denotes the failure probability of the basic event i and n is the number of basic events associated with the AND gate. For an OR gate event, its probability is determined by Equation 2.
n
i 1 ) (2)
Furthermore there is also a gate called NEG gate in which its probability is equivalent to 1-
(Cheng and Lan, 2004). Procedures and all steps to carry out FTA and ETA based on Ferdous et
(1)
where P is the probability of top event; Pi_idenotes the failure probability of the basic event i and n is the number of basic events associated with the AND gate. For an OR gate event, its probability is determined by Equation 2.
6
methodologies, equations and procedures regarding FST and FAHP method which are based on Chang’s extent analysis (1996) are completely mentioned and can be found from the author’s previous works such as Mokhtari et al. (2011) and Mokhtari (2012) which are outside the scope of this paper.
3.2.1 Accident analysis model
This paper through the addressed accident analysis model will examine the failure causes (basic events) and consequences (outcomes) resulting from the top event of “Ships’ related pollution” accidents with the use of bow-tie method (See Figure 2) accompanying the traditional FTA and ETA techniques while using historical data.
Figure 2: A Bow-tie diagram
Source: Modified from GEXCON (2019)
Furthermore risk analysis techniques such as bow-tie method, FTA and ETA can be used for investigating of the potential failure causes and consequences, as a result of the other risk factors identified and assessed from first and second phases of the addressed RM framework.
In normal cases where there are sufficient data and considering the fact that the probability of the events are only relative frequencies of their occurrences (Andrew and Moss, 2002; Henley and Kumamoto, 1981) for an AND gate event, its probability can be obtained by Equation 1.
n
i 1 (1)
where P is the probability of top event; denotes the failure probability of the basic event i and n is the number of basic events associated with the AND gate. For an OR gate event, its probability is determined by Equation 2.
n
i 1 ) (2)
Furthermore there is also a gate called NEG gate in which its probability is equivalent to 1-
(Cheng and Lan, 2004). Procedures and all steps to carry out FTA and ETA based on Ferdous et
(2)
Furthermore there is also a gate called NEG gate in which its probability is equivalent to 1-Pi (Cheng and Lan,

55JULY - SEPT - 2019
LOSS PREVENTIONTHE JOURNAL OF INSURANCE INSTITUTE OF INDIA
performance improvement programmes such as ISO series of 9000, 14000, 18000 which as a whole are called Integrated Management Systems (IMS), and ISO 20000 helps companies to improve their quality and operational efficiency, granting companies a competitive edge (ICS, 2015; Baraforta, 2018 and Sui et al. 2018). One of the earlier examples of Quality Management Systems is the case of the Port of Nantes in France which is available in UNCTAD (1998) monographs on port management. In the monograph the following features of the Quality Management Systems used within the mentioned port are detailed:
• The development of quality schemes:
- Beginning of the projects.
- Design of the schemes.
- Choice of activities.
- The question of certification.
• Quality management at the agricultural-food terminal:
- Treatment of incoming vessels – quality charter.
- The quality of the agricultural-food terminal technical facilities.
- Cargo handling.
• Another aspect of quality – safety at the oil terminal:
- Use of industrial hazard analysis.
- Production of safety recommendations.
- Recommendations for vessels calling at the oil terminal.
- Evaluating the benefits.
Additionally one of the latest examples for IMS implementation is the case of the Port of Felixstowe in February
2011. Based on BPM (2019) and others the following are brief descriptions for ISO series that can be used as risk mitigation options (alternatives) during ports and offshore terminals operations and managements.
3.3.1.2.1. ISO 9000
Quality Management ISO 9000 is rapidly becoming the most essential international standard since it ensures quality, saves money and helps ports and offshore terminals to convince customer expectations UNCTAD (1998). ISO 9000 provides a quality management system for recovering and controlling the quality of services and products. It also decreases the costs linked with lesser quality management processes, making ports and terminals more competitive (ISO, 2018) and BPM, 2019).
OCIMF (2004) explains that marine terminals should have a management system in place which is able to demonstrate and document proof of compliance with regulatory requirements and company policy and procedures. Terminal management should designate a person to be responsible for ensuring compliance with the regulations and company policy and procedures. Furthermore terminals should seek assurance that vessels visiting their berths comply with applicable international, national and local marine regulations.
3.3.1.2.2. ISO 14000
Environmental Management ISO 14000 ensures that offshore terminals and marine ports reduce the consequence of their activities on the environment by executing specific controls at the process stage. ISO 14000 enables ports and terminals to decrease the penalties
and fines imposed when environmental laws are violated. Furthermore, the
acceptance of ISO 14000 reduces waste,
cutting down overhead, and ensuring
the efficient use of materials
(BPM, 2019).
In this respect as OCIMF (2004)
explains, marine terminals should have
procedures in place for the handling or
control of waste and harmful emissions
generated as a result of its operations.
For this purpose terminals should have
terminal oil/chemical spill response or
contingency plans and should at regular
intervals carry out oil spill response
drills. For this purpose by implementing
ISO 14000, it will help to meet all the
required criteria.
3.3.1.2.3. ISO 18000
Occupational Health and Safety
Management System (OHSMS) ISO
18000 can be applied by sea ports and
offshore terminals as a part of their RM
scheme to address changing legislation
and look after their labour force. An
OHSMS promotes a safe and healthy
working environment by providing
a framework that permits ports and
terminals to constantly discover and
manage their health and safety risks,
reduce the probability of accidents, help
legislative fulfilment and improve overall
performance (BPM, 2019).
As per OCIMF (2004) marine terminals
should have dynamic and broad safety
programmes intended to deliver a
high level of safety performance in
respect of fire protection, access to
the terminal, notices (warning/safety/
pollution/security), lifesaving , first
aid, occupational health and hazardous

THE JOURNAL OF INSURANCE INSTITUTE OF INDIA
JULY - SEPT - 201956
LOSS PREVENTION
substances. In this respect ISO 18000
can meet all these challenges.
3.3.1.2.4. ISO 20000
Technology Management ISO 20000 is
an IT governance scheme planned to
regulate IT policy by adopting standard
best practice procedures in IT service.
ISO 20000 is rapidly becoming essential
to modern business, while IT and
business become more dependent on
each other. By attaining fulfilment under
ISO 20000, offshore terminals and
marine ports can boost the efficiency
for delivery of IT services by providing
an expertise framework (BPM, 2019 and
ISO, 2018).
3.3.1.3. Safety cases and safety reports
Based on Wilson et al. (1995) “the
purpose of a safety case is to present
a clear, comprehensive and defensible
argument supported by calculation and
procedure that a system or installation
will be acceptably safe throughout its
life (and decommissioning)”.
In seaports, especially petrochemical
ones and in offshore terminals whether
in the form of floating structures such
as LNG FPSOs etc or in the form of
fixed structures e.g. fixed offshore
terminals for loading and unloading of
LNG tanker ships, the safety case and
safety reports play an important role
in meeting standards, certifications,
for insurance purposes etc. Without
conducting an appropriate safety case
and safety report, if an offshore terminal
continues to operate, it will be difficult
for the operators to defend any claim
raised against them after a potential
accident or incident occurs (Mokhtari,
2012; Acheamponga and Akumperigyab,
2018).
3.3.1.4. Health, Safety and Environment
Management Systems (HSE-MS)
As per WG (2018) and BP (2016)
in most countries an inclusive legal
structure exists that necessitates
companies to handle their own HSE
matters in such a way to anticipate,
avoid and restrict occupational injuries,
ill health and harm to the environment.
Availability of an appropriate HSE
Management System (HSE-MS) with
the intention of fulfilment with these
requirements is necessary. It is based
on the widely recognised management
systems discussed earlier i.e. IMS.
Based on Mokhtari (2012) HSE-MS can
be integrated with the management of
other aspects of the business e.g. in
offshore terminals and marine ports in
order to:
• Minimise risk to individuals and the
environment.
• Improve business performance.
• Assist ports and offshore terminals
to establish a responsible image
within the marketplace and on behalf
of stakeholders.
3.3.1.5. Internal audits and inspections
As per OCIMF (2004); Chang (2019) and Makofske (2019) the internal control system includes the control environment and control procedures. It contains all the policies and procedures (internal controls) adopted by the directors and management of an entity to help in attaining their objective of
ensuring, so far as possible, the tidy and competent manner of its businpolicies, the protection of assets, the avoidance and identification of fraud and error, the
precision and unity of the accounting
records and appropriate preparation
of consistent financial information.
For instance inspections of the foreign
entering vessels by Port State Control
(PSC) under IMO and ILO regulations
are examples of internal audits/controls/
inspections in sea ports and offshore
terminals. This process internationally is
known as ships’ vetting.
3.3.1.6. Vessel Traffic Management
Systems (VTMS)
Successful VTMS is essential to the
safety of sea ports, offshore terminals
and waterways. The United States and
other maritime countries have had
complexity in establishing reasonable
criteria for selecting ports requiring
vessel traffic systems and for knowing
the level of complexity of the VTMS
required. The importance of the VTM
becomes such that the US congress
directed the USCG to reconsider
the Vessel Traffic Service (VTS)
acquirement with focus on meeting user
requirements (Harrald and Merrick,
2000; Mou et al. 2019).
3.3.1.7. ISPS Code
In recent times offshore terminals and
marine ports have turned into parts of
critical infrastructure within the trading
system. Some places categorize them
as “hub Ports” that due to their size
and capacity have become vital to the
global supply chain (APEC, 2003 and
IMO, 2019). Current post September

57JULY - SEPT - 2019
LOSS PREVENTIONTHE JOURNAL OF INSURANCE INSTITUTE OF INDIA
11, 2001 concerns about maritime
commerce relate to the impact of a
terrorist incident in such a location and
the disorderly result on seaborne trade.
However an efficient ISPS Code regime
during maritime trade will require
more than just the carrying out of
these systems but the recognition and
response to organisational complexity
at two levels: (1) at sea ports and port-
related infrastructures e.g. offshore
terminals or petrochemical ports and
(2) within the interrelated “system of
systems” that is the world maritime
trading network (Barnes, 2004).
3.3.1.8. Port Risk Manager (PRM)
The role of the PRM is like the
discussions about the role of port
planners in port strategic planning.
However both of these tasks should
be kept firmly within management.
Instead, risk managers can contribute
to RM development by acting as
“finders of strategies”, as “analysts”,
and as “catalysts”, in much the same
way as Mintzberg (1994) planners can
contribute to strategy development.
The AIRMIC propose that the corporate
risk manager (the same is applicable
for port risk manager) should take
action as a coordinator and advisor with
responsibilities such as to (Butterworth
et al. 1996):
• Design an integrated RM strategy,
philosophy, and policy statement
for communication all through the
organisation.
• Launch and preserve a detailed
RM methodology suitable to the
company’s requirements; to contain
formalised hazard identification
techniques, quantitative and
qualitative risk assessment and cost
effective methods for risk reduction
and transfer.
• Monitor the application and
efficiency of RM.
3.3.2. Ideal quantitative risk mitigation
methodical tool
In this paper it was intended to
use FTOPSIS as an ideal decision
making technique to complete the
risk mitigation phase. There are many
FTOPSIS literatures proposed by various
researchers. The latest contributions are
described as follows:
Chen (2000) has used the extensions of the TOPSIS for group decision-making under a fuzzy environment. As per the theory of the TOPSIS, he has defined a closeness coefficient to conclude the ranking order of all alternatives by calculating the distances to both the fuzzy positive-ideal solution and fuzzy negative-ideal solution at the same time. Yurdakul and Ic (2005) by using the FAHP and FTOPSIS methods have developed a performance measurement model that could be used to get an overall performance score by measuring the success of a manufacturing company in its operational activities. In another instance Zarghaami et al. (2007) have used the TOPSIS technique as a fuzzy multiple attribute decision
making on their water resources
projects case study for ranking water
transfers to Zayanderud basin in Iran.
Buyukozkan et al. (2008) for selection of
the strategic alliance partner in logistics
value chain after creating the evaluation
criteria hierarchy and computation of
the criteria weights by applying the
FAHP method, have used the fuzzy
TOPSIS to get the final partner ranking
results. Ebrahimnejad et al. (2009) have
used the TOPSIS in a fuzzy decision-
making model for risk ranking with an
application to an onshore gas refinery.
Torfi et al. (2010) have used a FAHP to
compute the relative weights of their
evaluation criteria and FTOPSIS to rank
their alternatives. Prakash and Barua
(2016) have used AHP and TOPSIS
methods to analyse of integrated robust
hybrid model for third-party reverse
logistics partner selection under fuzzy
environment. In the last work Ligus
and Peternek (2018) have used the
integrated fuzzy AHP-TOPSIS method
for determination of the most suitable
low emission energy technologies
development in Poland.
As it was explained before in this paper
a FAHP method has been used for
calculating the relative weights of the
risk factors (i.e. criteria) and here in this
part by extending the FAHP; FTOPSIS
can be utilised for selecting the most
suitable strategies i.e. mitigation factors.
As per risk assessment phase while
using FAHP, relative weights of the risk
factors in offshore terminals and marine
ports were calculated. Therefore in this
phase FTOPSIS is based on the existing
literatures will be utilised hereafter.

THE JOURNAL OF INSURANCE INSTITUTE OF INDIA
JULY - SEPT - 201958
LOSS PREVENTION
12
3.3.2.1. The FTOPSIS Methodology The principle of a TOPSIS technique (See Figure 10) is based on selecting the best alternative, which has the shortest distance from the positive-ideal solution and the longest distance from the negative-ideal solution (Hwang and Yoon, 1981). It is often difficult for a decision maker to allocate an accurate performance rating to an alternative for the criteria under investigation. The good point of using a fuzzy approach is to allocate the relative importance of the criteria using fuzzy numbers instead of precise numbers. This research expands the TOPSIS to the fuzzy environment. The Fuzzy MCDM (i.e. Multiple-Criteria Decision-Making) can be briefly illustrated in a matrix format as shown in Equation (3) and Equation (4).
CCCC nj 21
A
A
AA
m
i
2
1
xxx
x
xxxxxx
mnmm
ij
n
n
~~~
~
~~~~~~
21
22221
11211
= (3)
= [ , ,..., , ..., (4)
where i = 1; 2; . . . ,m; j = 1, 2, . . ., n and , j = 1, 2, . . ., n are linguistic TFNs (i.e. Triangular Fuzzy Numbers), and . Note that is the performance rating of the ith alternative, , with respect to the jth criterion, represents the weight of the jth criterion, . The normalised fuzzy decision matrix denoted by is shown in Equation (5):
(5)
The weighted fuzzy normalised decision matrix is depicted in Equation (6):
=
vvv
vvvvvv
mnnm
n
n
~~~
~~~~~~
21
22221
11211
=
rwrwrw
rwrwrwrwrwrw
n
n
n
mnmm
n
n
~~~~~~
~~~~~~~~~~~~
21
21
21
21
22221
11211
(6)
The advantage of using a fuzzy approach is to allocate the relative importance of the risk factors using fuzzy numbers rather than exact numbers. This study utilises the TOPSIS under fuzzy environments. This technique is particularly appropriate for solving the group decision making problems under fuzzy environments. Using the mentioned fuzzy approach, the designed FTOPSIS process is then defined as follows (Torfi et al. 2010):
12
3.3.2.1. The FTOPSIS Methodology The principle of a TOPSIS technique (See Figure 10) is based on selecting the best alternative, which has the shortest distance from the positive-ideal solution and the longest distance from the negative-ideal solution (Hwang and Yoon, 1981). It is often difficult for a decision maker to allocate an accurate performance rating to an alternative for the criteria under investigation. The good point of using a fuzzy approach is to allocate the relative importance of the criteria using fuzzy numbers instead of precise numbers. This research expands the TOPSIS to the fuzzy environment. The Fuzzy MCDM (i.e. Multiple-Criteria Decision-Making) can be briefly illustrated in a matrix format as shown in Equation (3) and Equation (4).
CCCC nj 21
A
A
AA
m
i
2
1
xxx
x
xxxxxx
mnmm
ij
n
n
~~~
~
~~~~~~
21
22221
11211
= (3)
= [ , ,..., , ..., (4)
where i = 1; 2; . . . ,m; j = 1, 2, . . ., n and , j = 1, 2, . . ., n are linguistic TFNs (i.e. Triangular Fuzzy Numbers), and . Note that is the performance rating of the ith alternative, , with respect to the jth criterion, represents the weight of the jth criterion, . The normalised fuzzy decision matrix denoted by is shown in Equation (5):
(5)
The weighted fuzzy normalised decision matrix is depicted in Equation (6):
=
vvv
vvvvvv
mnnm
n
n
~~~
~~~~~~
21
22221
11211
=
rwrwrw
rwrwrwrwrwrw
n
n
n
mnmm
n
n
~~~~~~
~~~~~~~~~~~~
21
21
21
21
22221
11211
(6)
The advantage of using a fuzzy approach is to allocate the relative importance of the risk factors using fuzzy numbers rather than exact numbers. This study utilises the TOPSIS under fuzzy environments. This technique is particularly appropriate for solving the group decision making problems under fuzzy environments. Using the mentioned fuzzy approach, the designed FTOPSIS process is then defined as follows (Torfi et al. 2010): 12
3.3.2.1. The FTOPSIS Methodology The principle of a TOPSIS technique (See Figure 10) is based on selecting the best alternative, which has the shortest distance from the positive-ideal solution and the longest distance from the negative-ideal solution (Hwang and Yoon, 1981). It is often difficult for a decision maker to allocate an accurate performance rating to an alternative for the criteria under investigation. The good point of using a fuzzy approach is to allocate the relative importance of the criteria using fuzzy numbers instead of precise numbers. This research expands the TOPSIS to the fuzzy environment. The Fuzzy MCDM (i.e. Multiple-Criteria Decision-Making) can be briefly illustrated in a matrix format as shown in Equation (3) and Equation (4).
CCCC nj 21
A
A
AA
m
i
2
1
xxx
x
xxxxxx
mnmm
ij
n
n
~~~
~
~~~~~~
21
22221
11211
= (3)
= [ , ,..., , ..., (4)
where i = 1; 2; . . . ,m; j = 1, 2, . . ., n and , j = 1, 2, . . ., n are linguistic TFNs (i.e. Triangular Fuzzy Numbers), and . Note that is the performance rating of the ith alternative, , with respect to the jth criterion, represents the weight of the jth criterion, . The normalised fuzzy decision matrix denoted by is shown in Equation (5):
(5)
The weighted fuzzy normalised decision matrix is depicted in Equation (6):
=
vvv
vvvvvv
mnnm
n
n
~~~
~~~~~~
21
22221
11211
=
rwrwrw
rwrwrwrwrwrw
n
n
n
mnmm
n
n
~~~~~~
~~~~~~~~~~~~
21
21
21
21
22221
11211
(6)
The advantage of using a fuzzy approach is to allocate the relative importance of the risk factors using fuzzy numbers rather than exact numbers. This study utilises the TOPSIS under fuzzy environments. This technique is particularly appropriate for solving the group decision making problems under fuzzy environments. Using the mentioned fuzzy approach, the designed FTOPSIS process is then defined as follows (Torfi et al. 2010):
12
3.3.2.1. The FTOPSIS Methodology The principle of a TOPSIS technique (See Figure 10) is based on selecting the best alternative, which has the shortest distance from the positive-ideal solution and the longest distance from the negative-ideal solution (Hwang and Yoon, 1981). It is often difficult for a decision maker to allocate an accurate performance rating to an alternative for the criteria under investigation. The good point of using a fuzzy approach is to allocate the relative importance of the criteria using fuzzy numbers instead of precise numbers. This research expands the TOPSIS to the fuzzy environment. The Fuzzy MCDM (i.e. Multiple-Criteria Decision-Making) can be briefly illustrated in a matrix format as shown in Equation (3) and Equation (4).
CCCC nj 21
A
A
AA
m
i
2
1
xxx
x
xxxxxx
mnmm
ij
n
n
~~~
~
~~~~~~
21
22221
11211
= (3)
= [ , ,..., , ..., (4)
where i = 1; 2; . . . ,m; j = 1, 2, . . ., n and , j = 1, 2, . . ., n are linguistic TFNs (i.e. Triangular Fuzzy Numbers), and . Note that is the performance rating of the ith alternative, , with respect to the jth criterion, represents the weight of the jth criterion, . The normalised fuzzy decision matrix denoted by is shown in Equation (5):
(5)
The weighted fuzzy normalised decision matrix is depicted in Equation (6):
=
vvv
vvvvvv
mnnm
n
n
~~~
~~~~~~
21
22221
11211
=
rwrwrw
rwrwrwrwrwrw
n
n
n
mnmm
n
n
~~~~~~
~~~~~~~~~~~~
21
21
21
21
22221
11211
(6)
The advantage of using a fuzzy approach is to allocate the relative importance of the risk factors using fuzzy numbers rather than exact numbers. This study utilises the TOPSIS under fuzzy environments. This technique is particularly appropriate for solving the group decision making problems under fuzzy environments. Using the mentioned fuzzy approach, the designed FTOPSIS process is then defined as follows (Torfi et al. 2010):

59JULY - SEPT - 2019
LOSS PREVENTIONTHE JOURNAL OF INSURANCE INSTITUTE OF INDIA
13
Step 1: Select the linguistic variable i = 1, 2, . . ., m; j = 1, 2, . . ., n for mitigation options with respect to risk factors and the appropriate linguistic variables ( j = 1, 2, . . ., n) for the weights of the risk factors. The fuzzy linguistic variable preserves the property that the ranges of normalised TFNs belong to [0, 1]; thus, there is no need for a normalisation procedure. For example, the defined by Equation (3) is equivalent to the defined by Equation (5).
Step 2: Create the weighted normalised fuzzy decision matrix. The weighted normalised value is determined by Equation (6).
Step 3: Select the positive ideal ( ) and negative ideal ( ) solutions. The fuzzy positive ideal solution (FPIS, ) and the fuzzy negative ideal solution (FNIS, ) are shown in Equation (7) and Equation (8):
, } = {( | i = 1,…, m), j=1, 2,…, n} (7)
, } = {( | i = 1,…, m), j=1, 2,…, n} (8)
Maximum and minimum operations do not give TFN but it is likely to state the approximated values of minimum and maximum as TFNs (Kwang, 2005). It is known that the elements i,j are normalised positive TFNs and their ranges belong to the closed interval [0,1]. Thus, it can define the fuzzy positive ideal solution and the negative ideal solution as = (1, 1, 1) and = (0, 0, 0), j=1, 2, …, n (Isiklar and Buyukozkan, 2006).
Step 4: Determine the separation measures. The distance of any mitigation option from and can be estimated using Equation (9) and Equation (10):
=
n
jd
1 , i =1, 2,..., m (9)
=
n
jd
1 , i =1, 2,..., m (10)
Step 5: Determine the similarities to ideal solution. This step resolves the similarities to an ideal solution by Equation (11):
=
(11)
Step 6: Ranking the mitigation options. Select a mitigation option with maximum or rank mitigation options according to in downward order (Yang and Hung, 2007).

THE JOURNAL OF INSURANCE INSTITUTE OF INDIA
JULY - SEPT - 201960
LOSS PREVENTION
O pera tiona lR isk F actorsin O ffshoreTermina ls
andMarine Ports
Sa fe ty R iskF actors
R1
Technica lR isk F actors
R6
Lega lR isk F actors
R4
C omposition of C a lling F lee t R11
Tra ffic C onditions R12
Weather C onditions R13
Waterway C onfigura tion R14
Potentia l C onsequences of DG transporta tion R15
Potentia l Impacts of not having VTM R16
Port/te rmina l Asse t R22
C argo Re la ted Pollutions (Handling, S torage) R32
De lays in contracts R42
Security R iskF actors
R2
Pollution RiskF actors
R3
Regula tory C hanges R41
Lack of E quipment Ma intenance R61
Lack of IT Technology R62
Lack of Dredging and Nava ids Ma intenance R63
Port/Termina l (Industria lisa tion, Deve lopment and Maintenance) R33
Human E rrorR isk F actors
R5
Pilots Re la ted errors R51
Port/Termina l Personne l Re la ted errors R52
Ships Personne l Re la ted errors R53
Stevedores Re la ted errors R54
Ship’s Re la ted Pollutions R31
Ci ty Re la ted Pollutions (Port- City Interface) R34
Port/te rmina l Profit R23
People ’s Sa fe ty in a rea R21
4. Case study
This case study is only an illustrative example of marine ports and terminals which can be explained as follows:
Figure 3: Hierarchy of Operational Risk Factors in Marine Ports and Terminals

61JULY - SEPT - 2019
LOSS PREVENTIONTHE JOURNAL OF INSURANCE INSTITUTE OF INDIA
In order to carry out the first phase (i.e. Hazard Identification) of the addressed RM framework shown in Figure 1, operational risk factors associated with marine ports and terminals are depicted in Figure 3 where such risk factors were identified through the hazard identification process in the author’s
Table 1: Operational Risk Factors in Marine Ports – Global weights and Rankings
Main Risk Factor Level 1 Risk Factors Local Weights Level 2 Risk Factors Local
WeightsGlobal
Weights Rankings
Operational Risk
Safety Risk Factors
(0.171) Composition of Calling Fleet (0.040) (0.007) 21
Traffic Conditions (0.340) (0.058) 7
Weather Conditions (0.102) (0.017) 19
Waterway Configuration (0.398) (0.068) 5
Potential Consequences of DG Trans. (0.035) (0.006) 22
Potential Impacts of not having VTM (0.085) (0.014) 20
Security Risk Factors
(0.185) People’s Safety in area (0.650) (0.120) 1
Port/terminal Asset (0.251) (0.047) 10
Port/terminal Profit (0.099) (0.018) 18
Pollution Risk Factors
(0.167) Ship Related Pollutions (0.505) (0.085) 3
Cargo Related Pollutions (0.174) (0.029) 13
Port/terminal Related Pollutions (0.215) (0.036) 12
City Related Pollutions (0.106) (0.019) 17
Legal Risk Factors (0.142) Regulatory Changes (0.545) (0.077) 4
Delays in Contracts (0.465) (0.066) 6
Human Error Factors
(0.177) Pilots Related Errors (0.554) (0.098) 2
Ships Personnel Related Errors (0.150) (0.026) 15
Port/terminal Personnel Related Errors
(0.161) (0.028) 14
Stevedores Related Errors (0.135) (0.024) 16
Technical Risk Factors
(0.158) Lack of Equipment Maintenance (0.351) (0.055) 9
Lack of IT Technology (0.293) (0.048) 11
Lack of Dredging and Navaids Maint. (0.356) (0.056) 8
previous works such as Mokhtari (2012). In the second phase (i.e. risk assessment) of the RM framework (See Figure 1) through experts’ judgements via using a FAHP method, the mentioned risk factors were assessed, prioritised and ranked as shown in Table 1. As a result one of the most significant
risk factors identified was found to be R31 i.e. Ship’s Related Pollutions in areas of marine ports and terminals. This risk factor will be investigated by the use of a case study in this paper more in detail via Accident Analysis Model illustrated in Figure 1 as a continuation part of the second phase following risk priority assessment.
In this case study causes (basic events) and consequences as a result of the addressed accident i.e. R31 (Ship’s related pollutions) in marine ports and terminals will be analysed and investigated by the use of available historical data.
“Of the 5000 million tonnes of seaborne cargo, 1590 million tonnes are crude
oil, 430 are other oil products and significant parts of the rest are other hazardous substances”. A trade like this involves the danger of serious accidents, to which shores and especially port areas and their vicinities such as waterways, canals and terminals are highly exposed. Furthermore as Ronaz et al (2003) explains that a
“port area” is characterised by a broad range of activities: while some of these activities are ordinary to the majority of industrial areas (e.g. big oil terminals, presence of rail and road traffic, chemical/petrochemical plants, general manufacturing and industry), there are numerous activities or operations that are to be encountered completely only

THE JOURNAL OF INSURANCE INSTITUTE OF INDIA
JULY - SEPT - 201962
LOSS PREVENTION
within harbour or terminal’s locations. They involve all aspects of navigation and ships: loading and unloading of goods, oil jetties in petrochemical sea ports and terminals, shipyards, the presence of fishing fleets, marinas, dredging, the building of port/offshore infrastructures, etc. Several of these aspects have been analysed previously by Romer et al (1993), Romer et al (1995); Rao and Raghavan (1996); Christou (1999); Thevik etet al (2001); Rigas and Sklavounos (2002); Ronaz et al (2003); Darbra and Casal (2004); Ronaz et al (2006); NE P&I Club (2010)
and ICS (2017).
The MHIDAS (i.e. Major Hazard Incident Data Service) database, which has been used to carry out the present case study, is developed and managed by the Safety and Reliability Directorate (SRD) that belongs to the UK’s Health and Safety Executive (HSE). It includes accidents that have occurred in 95 countries since the beginning of the 20th century. The first version appeared in 1980, although the present case study refers to the January 2003 version, which contains 13,018 records on 11,353 accidents (Ronaz, 2003).
Table 2: Main reasons of Ships’ Pollution Accidents in terms of the type of operations in Marine Ports and Terminals
Type of Operations Number of Pollution Accidents Percentage (%)Loading/unloading 280 34Manoeuvre 224 27Approach 108 13Storage 101 12Transport 56 7Maintenance 40 5Process 19 2Total 828 100
Source: Ronza et al (2003) based on MHIDASAs per Table 2 considering the only operations (i.e. Loading/unloading, manoeuvre and approach) which are the main reasons of ships’ pollution accidents in marine ports’ and terminals’ areas, following consequences shown
There are other databases that could be used in this kind of study, such as the one developed by Lloyd’s of London and MAIB (i.e. Marine Accident Investigation Branch in UK). Nevertheless, MHIDAS has been chosen because the fields of each record are categorised, which facilitates the automatic processing of information. As per MHIDAS the “operation” field includes seven different categories, according to the activity that was being carried out when the pollution accidents occurred in port areas. Table 2 illustrates main reasons of the ships’ pollution accidents in terms of the type of operations.
in Table 3 will uncover and classify the main outcomes that have occurred as a result of ships’ pollution accidents as per the MHIDAS data base. In Table 3 probabilities of the addressed
consequences have been calculated and are shown respectively. These data will be used during the ETA in order to calculate the frequency of the each consequence.
Table 3: Consequences and probabilities classified according to the operations.
Consequences Approach + Manoeuvre Loading/ Unloading Total Probability
Release 152 149 301 0.846
Release-fire 9 15 24 0.067
Release-fire-explosion 3 0 3 0.008
Release-gas cloud 2 13 15 0.042
Release-gas cloud-explosion 0 1 1 0.003
Release-explosion 5 7 12 0.034
Total 171 185 356 1.000Source: Ronza et al (2003) based on MHIDAS

63JULY - SEPT - 2019
LOSS PREVENTIONTHE JOURNAL OF INSURANCE INSTITUTE OF INDIA
However, except MHIDAS several other references such as FEL, 1993; BTC, 2002; DNV, 2002 and Lees, 2005) have provided data describing the frequency of port accidents. Among their provided
data those related to the risk factor R31 (Ship’s related pollutions) which are the main failure causes (basic events) for occurrence of this risk factor are listed in Table 4. These failure causes along
Table 4: Failure Causes (basic events) which can cause the top event or risk factor of R31.
Basic Events Basic Event (BE) No Source Frequency
Ship-to-ship collision in port waters BE 1 Lees, 2005 1.00×10⁻⁵
Collision of ship with a moored vessel BE 2 FEL, 1993 1.48×10⁻⁷
Berthing contact with release BE 3 Lees, 2005 1.50×10⁻⁵
Grounding in port with release BE 4 Lees, 2005 6.00×10⁻⁶
Collision while approaching port BE 5 Lees, 2005 4.60×10⁻⁶
Ship’s structural failure BE 6 BTC, 2002 3.00×10⁻⁴
Release from ship’s loading arm BE 7 BTC, 2002 1.94×10⁻⁴
Impact with jetty while loading BE 8 FEL, 1993 8.16×10⁻⁵
Source: Ronza et al and MHIDAS (2003)
Figure 4 is fault tree diagram of the risk factor R31 made by using fault tree software.
with their frequencies will be used to calculate the probability of the top event i.e. R31. In Table 4 unit for all of the frequencies are in [Harbour movement
-1]
i.e. per harbour movement.
17
Total 171 185 356 1.000
Source: Ronza et al (2003) based on MHIDAS However, except MHIDAS several other references such as FEL, 1993; BTC, 2002; DNV, 2002 and Lees, 2005) have provided data describing the frequency of port accidents. Among their provided data those related to the risk factor R31 (Ship’s related pollutions) which are the main failure causes (basic events) for occurrence of this risk factor are listed in Table 4. These failure causes along with their frequencies will be used to calculate the probability of the top event i.e. R31. In Table 4 unit for all of the frequencies are in [ i.e. per harbour movement. Table 4: Failure Causes (basic events) which can cause the top event or risk factor of R31. Basic Events Basic Event (BE) No Source Frequency Ship-to-ship collision in port waters BE 1 Lees, 2005 1.00× Collision of ship with a moored vessel BE 2 FEL, 1993 1.48× Berthing contact with release BE 3 Lees, 2005 1.50× Grounding in port with release BE 4 Lees, 2005 6.00× Collision while approaching port BE 5 Lees, 2005 4.60× Ship’s structural failure BE 6 BTC, 2002 3.00× Release from ship’s loading arm BE 7 BTC, 2002 1.94× Impact with jetty while loading BE 8 FEL, 1993 8.16×
Source: Ronza et al and MHIDAS (2003) Figure 4 is fault tree diagram of the risk factor R31 made by using fault tree software.
Figure 4: Fault tree diagram for risks factor R31
Now failure probability of the top event R31 i.e. ship’s related pollutions in marine ports and terminals will be calculated by the use of the traditional FTA using historical data via Equation 2 as follows:
n
i 1 )
1 [ ) × ) ) × ) ) × ) × ) × )] = 6.12
Figure 4: Fault tree diagram for risks factor R31
Now failure probability of the top event R31 i.e. ship’s related pollutions in marine ports and terminals will be calculated by the use of the traditional FTA using historical data via Equation 2 as follows:
Now by elimination of each basic event the new rate of failure probability will be obtained respectively as shown in Table 5. Subsequently the amount of each deviation i.e. (PTE(R31)
_)PTEi) have been recorded under the deviation index column in Table 5.
The greater number means having higher importance on the failure probability of the top event. It means if the event with higher importance is eliminated the failure probability of the top event will be reduced more than others. As it can be seen from the Table
5, basic event number six (BE6) has the higher importance on the failure probability of top event. It means if this event is eliminated the failure probability of the top event will be reduced more in compare to others.
Ships Related Pollutions i.e.
R31 (TE)
Ships-to-ship collision in port waters
Collision of a ship with a
moored vessel
Berthing contact with
release
Grounding in port with
release
Collisions while approaching
ports/terminals
Ship’s structral failures
Release from ship’s loading
arm
Impact with jetty while
loading
BE 1 BE 2 BE 3 BE 5 BE 6 BE 7 BE 8BE 4
OR Gate

THE JOURNAL OF INSURANCE INSTITUTE OF INDIA
JULY - SEPT - 201964
LOSS PREVENTION
Table 5: Importance of elimination of each basic event in failure probability of the top event.
Elimination Failure probability Deviation index Rankings
BE 1 6.01×10⁻⁴ 0.11×10⁻⁴ 5
BE 2 6.11×10⁻⁴ 0.01×10⁻⁴ 8
BE 3 5.96×10⁻⁴ 0.16×10⁻⁴ 4
BE 4 6.05×10⁻⁴ 0.07×10⁻⁴ 6
BE 5 6.07×10⁻⁴ 0.05×10⁻⁴ 7
BE 6 3.11×10⁻⁴ 3.01×10⁻⁴ 1
BE 7 4.17×10⁻⁴ 1.95×10⁻⁴ 2
BE 8 5.30×10⁻⁴ 0.82×10⁻⁴ 3
0
1
2
3
4
5
6
7
BE 6 BE 7 BE 8 BE 3 BE 1 BE 4 BE 5 BE 2
R31 (TOP EVENT)
New Top Events a�er elimina�on of the related Basic Events (BEn)
Figure 5: Sensitivity analysis of the top event or risk factor of R31
Ships’ pollutions
No Consequences
With Consequences
301(8.46 x 10⁻¹)(8.46 x 10⁻¹)
(7.7 x 10⁻⁴)
(9.2 x 10⁻⁵)
(4.5 x 10⁻⁵)
(3.2 x 10⁻⁶)
(5.2 x 10⁻³)
1(3 x 10⁻³)
16(4.5 x 10⁻²)
15(4.2 x 10⁻²)
12(3.4 x10⁻²)Explosion
Gas CloudGas Cloud
Explosion
Explosion
FireFire
3563(8 x 10⁻³)
27(7.5 x 10⁻²)
55(1.54 x 10⁻¹)
24(6.7 x 10⁻²)
Figure 6 illustrates the calculation of the frequencies of outcomes (consequences) deriving as a result of the ship’s related pollutions.
Figure 6: ETA for risk factor R31
Source: Consequences are based on Ronza et al and MHIDAS (2003)

65JULY - SEPT - 2019
LOSS PREVENTIONTHE JOURNAL OF INSURANCE INSTITUTE OF INDIA
Table 6 illustrates results of the ETA based on Figure 6 for R31 (Ship’s related pollutions) along with their frequencies and rankings:
Table 6: Results of the ETA
Consequences Frequencies Rankings
Release with no consequences 8.46×10⁻¹ 1
Release-fire 7.7×10⁻⁴ 3
Release-fire-explosion 9.2×10⁻⁵ 4
Release-gas cloud 4.5×10⁻⁵ 5
Release-gas cloud-explosion 3.2×10⁻⁶ 6
Release-explosion 5.2×10⁻³ 2
As it can be seen frequency of the first consequence i.e. ‘release with no consequences’ as a result of ship’s related pollutions is more than other frequencies.
Goal
Criteria (Risk Factors)
...........
Alternatives (Mitigation Factors)
Selecting the optimal solutions for mitigating risk factors
R1 R2 R3 R4
A1 A 2 A3 A4 A5 A6 A7 A8 A9 A10
Figure 7: Decision making via using 10 alternatives for mitigating risk factors in offshore terminals and marine ports
All formulas and methodologies used for Bow-tie method (See Figure 4), FTA and ETA can be found in the work of Ferdous (2006) and Ferdous et al. (2009). All methodologies for experts’ judgements, FST, AHP method and calculations for the Fuzzy AHP method are based on Chang (1996) extent analysis. In this
regard also see the author’s previous works such as Mokhtari et al. (2011) and Mokhtari (2012).
To accomplish the third and last phase (i.e. risk mitigation) of the RM framework and in order to mitigate the operational risk factors shown in Figure 3 for the purpose of this paper it is
decided to use a Fuzzy TOPSIS method. With reference to Figure 7, TOPSIS method is one of the best decision making tools used in many applications as explained earlier.
Based on available literatures and referred references in Table 7 there are different strategies and alternatives

THE JOURNAL OF INSURANCE INSTITUTE OF INDIA
JULY - SEPT - 201966
LOSS PREVENTION
to mitigate and control the addressed operational risk factors for the purpose of offshore terminals and marine ports. Ultimately the best alternatives after using experts’ judgements and the TOPSIS method under fuzzy
Alternatives Names of mitigation factors CC i Rankings
A1 Internal Audits and Inspections 0.0185 9
A2 Privatisation 0.0324 8
A3 ISPS Code 0.0874 6
A4 ISO 20000 0.0724 7
A5 Port Risk Manager 0.1021 4
A6 Safety Cases and Safety Reports 0.1362 3
A7 IMS (ISO: 9000,14000,18000) 0.1536 1
A8 VTMS 0.1521 2
A9 Deregulation 0.0879 5
A10 HSE-MS 0.1536 1
Sources for Mitigation Factors: Chang et al. (2019); Makofske (2019); Chen et al. (2017); IMO (2019); Baraforta et al. (2018); Sui et al. (2018); Mokhtari (2012); Acheamponga and Akumperigyab (2018); Mou et al. (2019) and Lia et al. (2019).
environment are ranked as per their priorities shown in Table 7.
5. Conclusion and further suggestions
This paper analysed one of the most
Table 7: Fuzzy TOPSIS results for mitigating operational risk factors.
significant risk factors (i.e. ship’s related pollution) in marine ports and terminals by using of an accident analysis model in order to complete the risk assessment phase of the proposed RM framework. Due to unavailibilty and lack of data and in order to deal with vague properties, FST, experts’ judgements and FAHP methods were used in risk assessment pahse of the RM cycle to quantify and prioritise the identified hazards. In the next stage of the risk assessment phase after priority assessment of the identified hazards as there were historial data available about failure rate probabilities and frequencies for the purpose of the causes and consequences of the addressed significant risk factor; therefore in this paper traditional FTA and ETA were used under the structure of a designated accident analysis model to investigate
the addressed significant risk factor more in details for the purpose of examining the potential basic events and outcomes. In the last phase of the RM framework by introducing FTOPSIS method the ideal solutions were selected for preventing reoccurrences of the addressed accident and/or loss. The selected ideal solutions in this paper eventually can be used as preventive or corrective actions which will lead to implimentation of either a proactive or a reactive RM strategy toward a successful marine ports’ and terminals’ operations and management. One of the main advantages that the proposed RM framework in this paper depicted is the style for handeling of the known and unkown data beside each other. As the addressed RM framework in this paper has been segregated into different phases capable of handeling of the data with different natures such as unknown
and lack of data availability with having vague properties and/or known and available (i.e. historical) data therefore different industry experts can use the same RM framework for the other needed applications’ purposes. In this case different novel and/or traditional methods, tools and techniques can be used to handle the data with having vague nature and/or historical available data along with each other. Consequently the addressed study results and the proposed RM framework can help marine professionals such as port risk managers to decide whether to take preventive actions or corrective actions during execution of the risk mitigation phase of the RM framework. This will lead to proceed toward a proactive or a reactive RM processes in future works.
References
ABS, American Bureau Shipping (2003), A guide for risk evaluations for the classification of marine-related facilities. Current database of abs rules and guides. Available At: https://ww2.eagle.org/en/rules-and-resources/rules-and-guides.html.Accessed on: 15.11.2018.
Acheamponga,T. and Akumperigyab, R. (2018), Offshore risk regulation: A comparative analysis of regulatory framework in Ghana, the United Kingdom and Norway. Energy Policy. 113: 701–710.
Andrews, J.D. and Moss, R.T. (2002), Reliability and Risk Assessment, 2nd Ed, Professional EngineeringPublishing, UK.
Aneziris, O.N.; Papazoglou, I.A.; Konstantinidou, M. and Nivolianitou, Z. (2014), Integrated risk assessment for LNG terminals. Journal of Loss Prevention in the Process Industries.28: 23-35.

67JULY - SEPT - 2019
LOSS PREVENTIONTHE JOURNAL OF INSURANCE INSTITUTE OF INDIA
APEC, Asia-Pacific Economic Corporation (2003) Strengthening international cooperation and technical assistance in preventing and combating terrorism, intervention by APEC secretariat at the 12th session of the commission on crime prevention and criminal justice, 16-19 May, Vienna, Austria.
Baraforta, B.; Mesquidab, A.L. and MasbIntegrated, A. (2018), Risk management process assessment model for IT organizations based on ISO 31000 in an ISO multi-standards context. Computer Standards and Interfaces.60: 57–66.
Barnes, P. (2004), Security risk management issues in maritime trade: an analysis. Academy of International Business (AIB) Southeast Asia Regional Conference.
BP, British Petroleum (2016), BP ANZ health and safety Policy. Available at:https://www.bp.com/content/dam/bp-country/en_nz/Documents/Procurement/health-safety-policy.pdf. Accessed on: 10.03.2018.
BPM, Business Process Management (2019), Available At: https://www.interfacing.com/port-management# Accessed on 31.01.2019.
BTC, Baku-Tbilisi-Ceyhan (2002), BTC project EIA. Turkey, draft for disclosure. Chapter 14: Marine Terminal-Accidental Events and Incidents. Butterworth Heinemann. www.caspiandevelopmentandexport.com/BTC/eng/esia3/VolIII/chp14.pdf.
Butterworth, M.; Reddaway, R, and Benson, T. (1996), Corporate governance - a guide for insurance and risk managers. London: Association of Insurance and Risk Management.
CCPS, Centre for Chemical Process Safety (2000), Guideline for Chemical Process Quantitative Risk Analysis, New York: Centre for Chemical Process Safety, American Institute of Chemical Engineers (AIChE).
Chang, Y.T.; Chen, H.; K. Cheng, K.R. and Chi, W. (2019), The impact of internal audit attributes on the effectiveness of internal control over operations and compliance. Journal of Contemporary Accounting and Economics. 15:1–19.
Chang D.Y. (1996), Applications of the extent analysis method on fuzzy AHP. European Journal of Operational Research. 95:649–655.
Chartres, N.; Lisa A. Bero, L.S. and Norris, S.L. (2019), A review of methods used for hazard identification and risk assessment of environmental hazards. Environment International. 123: 231–239.
Chen, P.S.L.; Pateman, H. and Sakalayen, Q. (2017), The latest trend in Australian port privatisation: Drivers, processes and impacts. Research in Transportation Business and Management. 22: 201–213.
Cheng, C.W. and Lan, A.L.H. (2004), Web Access Failure Analysis fuzzy Reliability approach. International journal of the Computer, the Internet and Management. 12(1):65-73.
Chiara, V. and Giuseppe, M. (2014), Risk Analysis of LNG Terminal: Case Study. Chemical Engineering Transactions. A publication of The Italian Association of Chemical Engineering. 36: 277-282.
Christou, M.D. (1999), Analysis and Control of Major Accidents from the Intermediate Temporary Storage of Dangerous Substances in Marshalling Yards and Port Areas. Journal of Loss Prevention in the Process Industries, 12(1), pp: 109-119. doi:10.1016/S0950-4230(98)00059-X
CIS, Chemical Industries Association. A guide to Hazard and Operability Studies, 1992.
CNN (2018), CNN Accident Report for Tanker Sanchi in East China Sea. Available At: https://edition.cnn.com/2018/01/10/asia/china-oil-tanker-
sanchi-explosion-intl/index.html. Accessed on: 24.01.2019.
Darbra, R.M. and, Casal, J. (2004), Historical analysis of accidents in seaports. Safety Science. 42: 85–98.
DETR (2000), Department of Transport, Port Marine Safety Code. ISBN 1 85112 365 2.
Dickson, G.C.A. (2003), Risk Analysis. The Institution of Risk Management. IRM, Witherby Publishing.
DNV, Det Norske Veritas (2002), Frequency analysis of accidental oil releases for FPSO operations in the Gulf of Mexico. Final Report, Houston: Det Norske Veritas.
FEL, Four Elements Limited (1993), Quantitative risk assessment of risk reduction associated with a reduction in fuel oil tanker movements at the Isab refinery, Siracusa. Four Elements Limited: Technical report prepared for T.E.A.M.S., TECSA (C2456).
Ferdous, R.; Khan, F.; Sadiq, R.; Amyotte, P. and Veitch, B. (2009), Handling data uncertainties in event tree analysis. Process Safety and Environmental Protection.87: 283–292.
GAO, United States Government Accountability Office (2006), Port risk management: Further Refinements Needed to Assess Risks and Prioritize Protective Measures at Ports and Other Critical Infrastructure. Report to Congressional Committees.
GEXCON (2019), World leading Company in the fields of safety and risk management. Available at: https://www.gexcon.com.Accessed on: 07.01.2019.
Guo, G. and Wu, H.M. (2014), A study on risk retention regulation in asset securitization process. Journal of Banking and Finance. 45: 61–71.
Haimes, Y.Y. (2002), Roadmap for modelling risks of terrorism to the homeland. Journal of Infrastructure Systems. 8(2): 35-41.
Harrald, J. R. and Merrick, J. (2000),

THE JOURNAL OF INSURANCE INSTITUTE OF INDIA
JULY - SEPT - 201968
LOSS PREVENTION
Development of a decision support tool for assessing Vessel Traffic Management requirements for U.S. ports. Proceedings, 7th annual conference of the international emergency management society. pp: 165-174 May 16-19, 2000 Orlando, FL 165.
Henley, J. (1981), Kumamoto H. Reliability engineering and risk assessment, Prentice Hall, Englewood Clift, N. J.
Hwang, C. L. and Yoon, K. (1981), Multiple Attribute decision making-methods and applications, Springer-Verlag, Heidelberg.
ICS (2015), The Institute of Chartered Shipbrokers. Port and Terminal Operations and Management. ISBN: 978.185.6093422.
ICS (2017), The institute of chartered Shipbrokers. Marine Insurance. ISBN: 978.190.8833624.
IMO, International Maritime Organization (2019), International Ship and Port Security Code and SOLAS Amendments adopted on 12 December 2002 London. Available at: http://www.imo.org/en/About/Conventions/Pages/Home.aspx. Accessed on: 12.01.2019.
IRM (2002), The Institute of Risk Management. A standard for risk management. www.theirm.org.
Irukwu, J. O. (1991), Risk management: in developing countries. IBSN 1 58609 021 3.
ISO, International Organization for Standardization (2018), ISO 20000. Available at: https://www.iso.org/standard/51986.html. Accessed on 15.11.2018.
Jeong, B.; Lee, B.S.; Zhou, P. and Ha, S. (2018), Quantitative risk assessment of medium-sized floating re-gasification units using system hierarchical modeling. Ocean Engineering. 151: 390–408.
Jichuan, K.; Liping, S. and C. Guedes,
S. (2018), Fault Tree Analysis of floating offshore wind turbines. An international Journal of Renewable Energy. 1-13.
Juhel, M. H. (2001), Globalization, Privatization and Restructuring of Ports. International Journal of Maritime Economics. .3(2), pp: 139-174.
King, S.K. (2016), Risk Avoidance: For Whom? By the American college of cardiology foundation. JACC: Cardiovascular Interventions, Volume 9, Issue 1,11 January 2016,Pages 110-111, published by Elsevier.
Krishna, K.; Wang, Y.; Saraf, S.R.; Rogers, W.J.; Baldwin, J.T.; Gupta, J.P. and Mannan. M.S. (2003), Hydroxylamine production: Will a QRA help you decide? Reliability Engineering & System Safety.81:215-224.
Lassen, C.A. (2008), Layer of protection analysis (LOPA) for determination of safety integrity level (SIL). Norwegian University of Science and Technology. M.Sc Thesis.
Lees, F.P. (1996), Loss Prevention in the Process Industries. 2nd edition, Boston, 1996.
Lees, F.P. (2005), Loss prevention in the process industries. Butterworths, London. Third edition. pp: 9/05-9/122.
Lia, Sh.; Caib, J.; Fengc, Zh.;Xua, Y. and Caib, H. (2019), Government contracting with monopoly in infrastructure provision: Regulation or deregulation? Transportation Research Part E. 122: 506–523.
Makofske, M.Ph. (2019), Inspection regimes and regulatory compliance: How important is the element of surprise? Economics Letters. 177: 30–34.
Martins, M.R.; Pestana, M.A.; Souza, G.F.M. and Schleder, A.M. (2016), Quantitative risk analysis of loading and offloading liquefied natural gas (LNG) on a floating storage and re-gasification unit (FSRU). Journal of Loss Prevention in the Process Industries. 43: 629-653.
Mareike, L. and Athanasios, K. (2018), A review of reliability-based methods for risk analysis and their application in the offshore wind industry. Renewable and Sustainable Energy Reviews.91: 1065-1076.
Mintzberg, H. (1994), The rise and fall of strategic planning. Hemel Hempstead, Herts: Prentice Hall International (UK) Ltd.
Mirakhor, A.; Ng, A.; Dewandarua, G. and Abdulhamid, B. (2017), Is the regime of risk transfer sustainable? Impossible contract and inequality. Research in International Business and Finance. 41: 16–19.
Mokhtari, K. (2012), RISK MANAGEMENT - A Guideline for QHSES and Risk Managers in Offshore and Marine Industries. LAMBERT Academic Publishing in Germany, April, 2012. ISBN: 978.384.8410286.
Mokhtari, K.; Ren, J.; Roberts, Ch. and Wang, J. (2011), Application of a generic bow-tie based risk analysis framework on risk management of sea. Journal of Hazardous Materials. 192: 465-475.
Morettia, L.; Mascioa, P.D.; Nichelea, S. and Cokorilob, O. (2018), Runway veer-off accidents: Quantitative risk assessment and risk reduction measures. Safety Science. 104: 157–163.
Mou, J.M.; Chena, P.F.; Hea, Y.X.; Yip, L.T.; Li W.H.; Tang, J. and Zhang, H.Z. (2019), Vessel traffic safety in busy waterways: A case study of accidents in western Shenzhen port. Accident Analysis and Prevention. 123: 461–468.
MSA (2018), Maritime Safety Administration of P.R. China. Sanchi Tanker accident Report. Available at: https://www.mardep.gov.hk/en/msnote/pdf/msin1817anx1.pdf Accessed on: 02.01.2019.
NE P&I Club (2010), North of England Protection and Indemnity Club. An introduction to P&I insurance and loss

69JULY - SEPT - 2019
LOSS PREVENTIONTHE JOURNAL OF INSURANCE INSTITUTE OF INDIA
prevention. Loss prevention guide.
OCIMF (2004), Oil companies international marine forum. Marine terminal baseline criteria and assessment questionnaire. First Edition. Steamship international. Witherby publishing.
Paltrinieri, N.; Tugnoli, A. and Cozzani, V. (2015), Hazard identification for innovative LNG re-gasification technologies. Reliability Engineering and System Safety. Reliability Engineering and System Safety. 137: 18–28.
Pillay, A, and Wang, J. (2003), Technology and safety of marine system. Elsevier ocean engineering book series, 2003. ISBN: 0 08 0441483.
Rao, P.G.; Raghavan, K.V. (1996). Hazard and Risk Potential of Chemical Handling at Ports. Journal of Loss Prevention in the Process Industries, 9(3), pp. 199-204. doi:10.1016/0950-4230(96)00017-4.
Ren, J., Jenkinson, I., Wang, J., Xu, D.L. and Yang, J.B. (2009), “An offshore risk analysis method using fuzzy Bayesian network”, J. Offshore Mech. Arct., 13(1), 041101-1-12.
Rigas, F.; Sklavounos, S (2002), Risk and Consequence Analyses of Hazardous Chemicals in Marshalling Yards and Warehouses at Ikonio/Piraeus Harbour, Greece. Journal of Loss Prevention in the Process Industries, 15(6), pp. 531-544. doi:10.1016/S0950-4230(02)00030-X.
Rimsaite, L. (2019), Corruption risk mitigation in energy sector: Issues and challenges. Energy Policy. 125: 260–266.
Romer, H.; Styhr Petersen, H.J.S.; Haastrup, P. (1995-2), Marine Accident Frequencies – Review and Recent Empirical Results. Journal of Navigation, 48(3), pp. 410-424.
Romer, H; Brockhoff, L.; Haastrup, P.; Petersen, H.J.S. (1993), Marine
Transport of Dangerous Goods. Risk Assessment Based on Historical Accident Data. Journal of Loss Prevention in the Process Industries, 6(4), pp. 219-225. doi:10.1016/0950-4230(93)80003-5.
Ronza, A.; Felez, S.; Darbra, R.M.; Carol, S.; Vílchez, J.A.; Casal, J. (2003), Predicting the Frequency of Accidents in Port Areas by Developing Event Trees from Historical Analysis. Journal of Loss Prevention in the Process Industries, 16(6), pp. 551-560. doi:10.1016/j.jlp.2003.08.010.
Ronza, A.; Carol, S.; Espejo, V.; Vílchez, J.A.; Arnaldos, J. (2006-1). A Quantitative Risk Analysis Approach to Port Hydrocarbon Logistics. Journal of Hazardous Materials, 128(1), pp. 10-24. doi:10.1016/j.jhazmat.2005.07.032.
Ronza, A. (2007), Contributions to the risk assessment of major accidents in port areas. University of Politecnica in Catalunya. PhD Thesis.
Saunders, M.; Lewis, P. and Thorhill, A. (2007), Research Methods for Business Students, 4th Edition Prentice Hall, England.
Sharp, D. (2009), Upstream and offshore energy insurance. Witherbys insurance. ISBN: 978.185.6093514.
Sui, Y.; Ding, R. and Wang, H. (2018), An integrated management system for occupational health and safety and environment in an operating nuclear power plant in East China and its management information system. Journal of Cleaner Production. 183: 261-271.
Tarila, Z. and Edward, G.O. (2017), Senior managers and safety leadership role in offshore oil and gas construction projects. Procedia Engineering. 196: 1011-1017.
Thevik, H.J.; Sorgard, E.; Fowler, T.A (2001), Method for Assessing the Risk of Sea Transportation: Numerical
Examples for the Oslofjord. In: Zio, E.; Demichela, M.; Piccinini, N. (eds.). Safety and Reliability. ESREL 2001. Towards a Safer World. Torino: Politecnico di Torino, vol. 2, pp. 911-918.
UKHSE, United Kingdom Health and Safety Executive (2018), Available at: http://www.hse.gov.uk/. Accessed on: 17.10.2018.
UNCTAD (1995), Comparative analysis of deregulation, commercialization and privatization of ports. UNCTAD/SDD/PORT/3.
UNCTAD (1998), Quality management: The port of Nantes/Saint-Nazaire experience.
UNCTAD (2006), Marine security: elements of an analytical framework for compliance measurement and risk assessment. New York and Geneva, 2006. UNCTAD/SDTE/TLB/2005/4.
Wang, Y. (2004), Development of a computer-aided fault tree synthesis methodology for quantitative risk analysis in the chemical process industry. PhD thesis.
WG, Wood Groups (2018), Health, Safety and Environmental Management System Available at: http://www.woodgroup.co.uk. Accessed on: 27.03.2018.
Wilson, S.; Mcdermid, J.; Fenelon, P. and Kirkham, P. (1995), No more spineless safety cases: a structured method and comprehensive tool support for the production of safety cases. Institution of Nuclear Engineers Conference ‘95 2nd International Conference on Control and Instrumentation in Nuclear Installations, 19th-21st.
World Bank (2007), The International Bank for Reconstruction and Development. Port Reform Toolkit. Second Edition.

THE JOURNAL OF INSURANCE INSTITUTE OF INDIA
JULY - SEPT - 201970
NOTE ON ALOP/ DSUINVESTMENT SOLUTIONS
A Solution to - Issues Prevailing to Identify Life-Stage Based Investment Solution With Respect to Various Investment Options (Especially Insurance) or Any Other Investment Options – A Study in the Indian Context
AbstractThe present study is an attempt to research in the area which is less researched but significant from the view point of investors (with reference to Insurance). Nowadays amongst various life insurance investment solutions being offered by many life Insurers, the first and foremost issue involved is how to arrive at decision of investing which is apt in fulfilling investors life Goal’s. There is a dearth of financial planning process. An ideal financial planning process is to define Investor’s life goals such as create
sufficient corpus to meet financial or medical emergency, wealth creation, child’s education, marriage, planning, leading a comfortable retirement life.
Financial planning is the process of meeting customer’s life goals through proper management of his finances. It helps a customer to make advance provisions for future financial needs. The objective of financial planning is to ensure that the right amount of money is available in the right hands at the right point in the future to achieve an individual’s life goals.
Satish BhattAssistant Professor–Management & FinanceFaculty of Business StudiesSampoorna Group of InstitutionsFBS Business School,[email protected]

71JULY - SEPT - 2019
THE JOURNAL OF INSURANCE INSTITUTE OF INDIA INVESTMENT SOLUTIONS
Issues Related to Financial PlanningOnce specific and quantifiable goals are established and prioritized, a financial plan can then be developed to cater the current circumstances, bearing in mind that the plan will require certain trade-offs to be made.
This trade-offs include:
The need for contingency planning to cover unexpected circumstances Risk, return, taxation and social security needs, and Current lifestyle versus future lifestyle needs.
While planning the finances following questions arise and need to be answered:
How can I plan for tomorrow when I can hardly pay for today?
Create a Budget - Determine what you actually spend each month. There are fixed expenses like rent, loan repayments, etc. every month about which we can do little. The variable items such as food, clothing and entertainment are often what get away from us. Use your discretion to contain these variable expenses to start saving.
How much should I be saving?
It is hard to apply a rule of thumb toward savings because it varies with age and income level. Ten percent is a good start. If you find that it is too high for you, do not let that deter you. You can start by putting a little aside each month and then slowly increasing it.
What if I don’t achieve my goals?
Financial planning is a common sense approach to managing your finances to reach your life’s goals. It cannot change your situation overnight; it is a lifelong process. Remember that events beyond your control, such as inflation, changes in the stock market or changes in interest rates will affect
your financial planning results.
What should a financial plan include?
A financial plan should include a review of your net worth, goals and objectives, investment portfolio, cash flow, investments, retirement planning, tax planning and insurance needs, as well as a plan for implementing your goals.
What about taxes?
It is important that financial plans are tax efficient. The financial plan should help you in minimizing your tax liability and also maximizing your after-tax returns from your investments. Some financial planners help their clients in preparing and filing their tax returns.
How often should I update the plan?
It is good to review the plan when there is a lifestyle change such as marriage, birth, death or divorce. Any change in financial position should be evaluated as well. Most people have an annual update that reviews how the plan is being implemented. The review also considers changing goals and circumstances.
Steps to Plan the Financial Process
There are different ideas of what financial planning involves. The financial planning process includes the following six steps:
Data gathering,
Goal setting,
Identification of financial problems,
Preparation of written alternatives and recommendations,
Implementation of written alternatives and
Review and revision of plan
Financial planners have a different approach to that of other investment
providers. Bankers, stockbrokers, real estate agents, insurance agents and finance brokers all have one thing in common; they start their process at the investment product point. For example, a real estate agent will only recommend real estate, so he hopes that all his prospects will buy real estate.
Process involved in Factors to be
The Present study is an attempt to research in the area which is less researched but significant from the view point of investors (with reference to Insurance). Nowadays amongst various life insurance investment solutions being offered by many life Insurers. The first and foremost issue involved is how to arrive at decision of investing which is apt in fulfilling investors life Goal’s ,there is a dearth of financial planning process. An ideal financial planning process is to define Investor’s life goals such as create sufficient corpus to meet financial or medical emergency, Wealth Creation ,Child’s Education Marriage planning, leading a comfortable retirement life.

THE JOURNAL OF INSURANCE INSTITUTE OF INDIA
JULY - SEPT - 201972
NOTE ON ALOP/ DSUINVESTMENT SOLUTIONS
considered for deciding on an Ideal Investment Plan
Following factors to be considered
TO ASSIMILATE INFO ON -IDEAL
INVESTMENT SOLUTTIONS
FINANCIAL % INVESTMENT STRATEGIES
RISK AND RETURN ANALYSIS
ASSET ALLOCATION
INVESTMENT SELECTION -WITH
TRADE OFF EVALUATION
REVIEW/SELECT
before you invest in any Life Insurance product -To some extent these factors also help in planning investment in any other investment product too.
Your present income.
Expected growth in income or any additional earning – may be regular or intermittent.
Requirement to meet temporary contingencies & emergencies.
Saving to provide adequate “Family Financial Protection through Insurance Cover, including disability and critical illness coverage.
Inflation factor – Cost of living goes parallel with it, hence, in view of Indian economy in past 7 years its rate can be easily taken to be anywhere between 5 and 7 per cent.
Savings for payment of health insurance (Medi-claim) including those for aged dependent parents and children.
Financial Planning is required to meet
following basic needs:
Stage I: Family
Protection of the family in case of death of the breadwinner
Stage II: Children
Providing for children’s education, marriage and start-up in life
Stage III: Old Age
Providing oneself a comfortable and independent retirement
Stage IV: Special Needs
Providing for disability, medical conditions, ailments etc.
Stage V: Appreciation of Wealth
Long-term savings for building a house, combating inflation etc.
What is life cycle stage to financial planning?
Life cycle Stages Features Priority / Investment
Childhood stage Period of dependency which lasts till the full time education.
Long term investment of money received in the form of gifts.
Unmarried stage Still dependent & relatively lower income. More risk taking ability.
Main need is to protect themselves against any disability. Investment for long term plans.
Young married stage Both partners earn
Sufficient surplus to save. Housing, insurance & consumer finance need.
To secure income loss of any partner with medium to long term investments.
Young married stage- one partner earn
Less potential to save .Two or more dependence. Life assurance of earning member is must.
Medium to long term investments. Pension provision needed.
Young married with children
Expenditure rises with faster rate. Children’s education, holidays & consumer finance.
Consumer finance needs are high.Portfolio for growth & long term.
Married with older children
Individuals are in mid career. Improved finances.
Loan repayment needs.Equity,debt & pension/Health insurance
Post family/ Pre retirement stage
Independent children. Last chance to ensure adequate income after retirement.
Contribution to health insurance and pension products.
Retirement stage 1) Low pension.2) Relatively low pension.3) Sufficient pension.
1) Continue to work.2) Produce additional income.3) Preserve savings.

73JULY - SEPT - 2019
THE JOURNAL OF INSURANCE INSTITUTE OF INDIA INVESTMENT SOLUTIONS
Various Types of Investment
As an investor you have a wide array of investment alternatives available that are classified as:
a. Non-Marketable Financial Assets - A good portion of financial assets is represented by non-marketable financial assets. These can be classified into the following broad categories:
I. Bank deposits
II. Post office deposits
III. Company deposits
IV. Provident fund deposits
b. Equity Shares
c. Bonds
d. Money Market Instruments
e. Mutual Fund Schemes
f. Life Insurance Policies
g. Real Estate
h. Precious Objects
i. Financial Derivatives
Portfolio recommended for investors according to their Life Cycle Stages
Young unmarried professional:
- Aggregate Equity funds 50%
- High yield bond, growth & income funds 25%
- Life Insurance 25%
Young Couple: Double income, 2 Children:
- Money Market Funds 10%
- Aggressive Equity Funds 30%
- High Yield Bond & Long Term Growth Funds 25%
- Life Insurance 35%
Older couple single income:
- Short term municipal funds 30%
- Life Insurance 40%
- Moderately aggressive funds 20%
- Emerging growth equity 10%
Recently retired couple:
- Conservative equity funds 35%
- Moderately aggressive equity funds 25%
- Conservative Instruments (Life Ins/PPF/etc) 40%
Fixed Asset Allocation Strategy
- Maintain fixed ratio between chosen asset classes
- Disciplined approach that ensures profit booking and purchases at lower prices
Example
- 50% Equity and 50% Debt (Including life Ins;Ulips)
- Equity markets rise ensuring profit booking
- 50:50 Ratio maintained
- No portfolio re-balancing
- Ensures riding bull wave if markets are rallying
- Ratio changes as per market changes
- Other Useful Strategies
- Harness the power of compounding
- Rupee Cost Averaging
- Invest regularly a pre-determined amount
- Thus, purchase of more units at lower market levels and less units at higher levels.
- Thereby, reducing the average cost of purchase.
- Value Averaging
- Invest regularly to achieve a pre-determined value.
- Buy & Hold Strategy
Research methodology-
Applied & Problem Solving Research method used for this research
Online survey through whatsapp group /Google Forms & in person with some customers (Questions framed around - Amongst various investment plans which workout to be the best for investor considering life stages.)
Conclusion
Proper Financial Planning motivates, supports Customer at every twist and turns of life, and strikes the right balance between the present and the future also make sure to maintain standard of living which is the need of every investor.
References:
• Financial Management - Prasanna Chandra, 9/e, TMH.
• International College Of Financial Planning (ICFP) Modules
• Investment Analysis and Portfolio Management by Prasanna Chandra
• Financial Management,Khan M. Y.& Jain P. K, 7/e, TMH
• The Investment Biker by Jim Rogers

THE JOURNAL OF INSURANCE INSTITUTE OF INDIA
JULY - SEPT - 201974
IHRPs
AbstractPurpose
The purpose of this study is to find the effect of Innovative HR practices (IHRPs) on the organizational commitment and turnover intention of employees working in Life Insurance sector in India.
Design/Methodology/Approach
A survey-using questionnaire was conducted among 181 employees from 8 of the largest life insurance companies in India located in New Delhi region. Statistical analysis, specifically multivariate regression was conducted
in order to determine the prominent Innovative Human Resource Practices (IHRP).
Findings
Some IHRP strategies pertaining to employee development and training as well as retention were found to be positively influencing the Organizational Commitment and Turnover Intention. The results of the survey revealed that IHRPs strategies such as Employee acquisition strategies, Management development, Succession planning, and adopting responsibility for socially relevant issues are highly significant
Substantiation of the Impact of Innovative Human Resource Management Practices (IHRPs) on Employee Commitment and Turnover Intention in Indian Life Insurance Sector
Dr. Shikha N KheraAssistant Professor,Delhi School of Management, Delhi Technological University. [email protected]
Divya SharmaAssociate Professor, Department of Management Studies,Central University of Haryana. [email protected]

75JULY - SEPT - 2019
THE JOURNAL OF INSURANCE INSTITUTE OF INDIA IHRPs
in the context of India’s Life Insurance sector.
Practical implications
The findings of this study can be adopted by the India’s Life Insurance Sector so that they can design and apply the effective and prominent Innovative HR approaches for attracting and retaining their talented employees and can enhance the commitment in the employees.
Managerial Implications
The paper will provide the Life Insurance companies that how they can design their innovative human resource practices so that employee’s turnover Intention graphs goes down and
Commitment towards the organization can be enhanced. The research paper is a substantiation of the 8 life insurance companies employees which will help the strategy formulators of the Indian companies to redesign their effective human resource practices.
Originality
The paper adds to the body of knowledge in the life Insurance sector by identifying the major and prominent IHRPs, which leads to the organizational commitment and Turnover intention.
Keywords
IHRPs, Organizational Commitment, Continuance commitment, Normative, commitment, Affective commitment, Turnover Intentions.
1. Introduction
The local environment of a firm influences the innovation abilities of the employees, which could be accentuated by proper investment in training and development. Such learning opportunities encourage the formation of trusting relationships between employees and their organizations(Sung & Choi, 2014). Also, rapid advancement in information and communication technology has compelled the organizations to integrate newer, more effective manpower management solutions so as to enhance employee engagement. Human Resources Management (HRM) and its practices are wholly responsible for the development of innovative ideas and attributes in the employees, making them an indispensable part of an organization (Rao, 2014). Therefore, in line with rising dependence on HR personnel in leading to organizational innovation, this study has been framed to understand the role of development opportunities provided to the employees from human resources management and the resultant change in the former’s
commitment towards the organization, and consequently, the turnover intention.
1.1 Traditional HRM and its shortcomings
HRM plays a key role in managing and carrying out various activities that aim to boost the morale of employees so as to retain the best talent in the organization (Purohit, 2013; C. A. Yang, Lin, L, Lin, & Huang, 2010).However, over a period of time strategies have evolved, moving away from the conventional patterns. Under its innovative approach HRM focuses on going beyond to stay competitive in the market, while traditional approach of HRM primarily emphasized on personnel management. In order to solve the problems persisting within organizational functioning and to deal with the complexity in day to day situations such as rising attrition rate owing to demotivation among employees, an organization requires an agile management which can work according to the changing market needs. In addressing such a dynamic business environment laden with challenges, traditional HR practices are seldom found to be effective (Karlsson, 2013). This is because traditional HR managers have so far focused on the personnel administration and relationship management of employees instead of analyzing the attitudes and goals of the workforce influenced by their personal and professional needs(Aslam, Aslam, Ali, & Habib, 2013). Also, factors which affect employees of an organization such as career development opportunities and training needs are insufficiently addressed by traditional HR practices such as detailed selection, individual work strategy, designation based compensation, and money based motivation (Mellam, Rao, & Mellam, 2015). Moreover, the traditional
Some IHRP strategies pertaining to employee development and training as well as retention were found to be positively influencing the Organizational Commitment and Turnover Intention. The results of the survey revealed that IHRPs strategies such as Employee acquisition strategies, Management development, Succession planning, and adopting responsibility for socially relevant issues are highly significant in the context of India’s Life Insurance sector.

THE JOURNAL OF INSURANCE INSTITUTE OF INDIA
JULY - SEPT - 201976
IHRPs
approach of HRM also lacks innovation in terms of leadership style, ownership and organizational structures, digital technological development as managers adopting traditional HR practices act as followers of certain pre-developed formats, seldom regularly updating them and rarely agree with the ideas of employees(Dalota& Perju, 2006; Loo-See Beh & Leap-Han Loo, 2013). Simply put, traditional HR practices lack the pragmatic approach necessary to handle the dynamism of contemporary business environments. Moreover while tending to the policy of an organization in terms of rules and regulations, the traditional HR managers follow a bureaucratic approach where the management sets specific guidelines to bind the employees, offering little flexibility and exercising very strict control over the employees(Abdullah, 2009; Das; Narendra; Mishra, 2014). The management which follows traditional HR practices therefore, emphasizes the productivity and profitability of the organization as the top priority largely ignoring employee satisfaction, which in turn affects their overall commitment towards work, hence raising the attrition rate(Medina, 2012).This has also been found essential especially in scenarios wherein the organization undergoes developmental stages. The shift from the entrepreneurial stage to professional one also demands a shift from traditional HRM practices to strategic innovative practices(Wang & Wei, 2012).
1.2 Emergence of Innovative Human Resource Management Practices (IHRPs)
Indian firms started facing intense competition from foreign companies in the 1990s when trade barriers were lifted by the Central Government (Gracy Vas, 2014; Nirmala, 2015). The sudden influx of large scale foreign
organizations forced Indian companies to change their traditional approaches towards business operations. Due to the emergence of such a high competitive environment Indian firms embarked on a change process in existing human practices led by a need for new skills. In order to cope up with the challenges stemming from structural changes and also to discourage workers from seeking better opportunities in bigger foreign firms, management felt need for innovative human resource practices (IHRPs) which could cater to the demand of the organization as well as employees ( Vas, 2014).
The purpose was to encourage positive behavior, enhance commitment, and reward innovative ideas from employees. Simply put, IHRPs can be defined as approaches which involve out-of-the-box thinking for surviving downturn and holding workforces together. Such innovative approaches would motivate the workforces in the organizations utilize their skills and knowledge through discretionary effort by realizing and aligning with the firm’s business strategies (Joseph, 2012; Suifan, 2015). The innovative human practices include emphasizing people’s value, scheduling flexibility, training programs with a people focus, fair and supportive policies for performance management and compensation, and creative measures for staffing (Hinkin & Tracey, 2010).
This study aims to evaluate the impact of innovative HR Practices on employee commitment and turnover intention in the life insurance sector of India.
2. Literature Review
2.1 Impact of IHRP practices on employees
Dalota & Perju(2006) suggests that effectiveness of IHRPs can be measured in terms of satisfaction and commitment of the employees towards
the organization, and thereby reduced turnover intention in the organization. Some innovative ways of building employee commitment are technical and vocational training programs, cross functional trainings, recreational activities and rejuvenation programs, mandated time-offs, investment plans for employee & their family health, workplace flexibility, linking MD with individual need, behavioral and development education programs, and succession planning(Shamsudin, Subramaniam and Alshuaibi, 2012; Mutembei and Tirimba, 2014; Durani, Trivedi and Durani, 2015; Tabvuma, Georgellis and Lange, 2015).
Mokaya(2012) established the importance of conducting recreational activities in an organization for enhancing the commitment and satisfaction of the employees. This is because recreational activities such as adventurous trip, outdoor trips, parties, organizing indoor games and activities and several such activities are considered as a form of intrinsic award and benefit scheme for the employees, enhancing their performance by providing satisfaction and consequently ensuring their commitment. Also, recreational activities in the form of adventurous training, and leadership and attitudinal trainings increase team building among employees, along with increasing their physical and mental wellbeing, aligning them with the organization’s aim and growth.
2.2 IHRP relationship with Organisational Commitment
According to Grunsky (1966, p. 1), commitment in organizations represents the “strength of a person’s attachment to an organization”. The commitment arises from various policies and practices the organizations have such that their benefit is directed towards the organization’s employees. This process creates a process of employee’s

77JULY - SEPT - 2019
THE JOURNAL OF INSURANCE INSTITUTE OF INDIA IHRPs
commitment in the form of employees providing something positive to the organization in the way of staying loyal to it, by molding their attitude and behavior in a way that benefits the organization (Coyle-Shapiro, Kessler and Purcell, 2004). Cafferkey et al.(2018) notes that commitment of employees towards an organization is also influenced by the perception of the employees towards these IHRP practices as well as the relation these employees have with their direct managers. IHRP practices such as developmental exercises in training schedules, adding health and insurance benefits for employees and their family members apart from compensation, rewarding work through recognition, promotion and incentives etc. have shown to have a positive effect on retention ratios, leading to reduced turnover as well as have improved other aspects of employees activities such as reduced absenteeism, better work in terms of quality, along with better financial performance (Vakula Kumari and Dubey, 2018).
Another aspect through which commitment is developed in the employees is through the perception that the IHRPs imply that the organization is personally committed towards their development and well-being (B. Joseph, 2012). Through this, it obligates employees to ‘give back’ by remaining committed and by having positive attitude and behavior towards the said organization (Kooij et al., 2010).Thus, IHR practices and the satisfaction of employees through these practices lead to the development of a strong bond between the individual and their work and in turn work to positively develop their perception, behavior and attitude towards the organization.
2.3 IHRP with Affective commitment
Affective commitment is defined as
“the employee’s positive emotional attachment to the organization”(Meyer and Allen, 1991, pp. 62).Meyer, Bobocel and Allen (1991, pp. 718) are of the opinion that affective commitment reflects the “desire component of organizational commitment”. This means that employees, when affectively committed, strongly identify themselves as per the organizational goals and aims and work to remain in that organization to fulfill those goals and aims. An important result of IHRP towards attitude of employees for the firm is seen through affective commitment, which has been mentioned in social exchange theory(Cook, 2013). The IHRP practices lead employees to experience a Perceived Organizational Support (POS) in their work and life, which leads them to reciprocating through better retention and attendance (Macey and Schneider, 2008). Ang et al.(2013)have also assessed that through IHRP, employees work in a positive aspect for the organization and this leads to a high-performance work systems. The high performance, in turn, has a very significant impact on affective commitment on a positive note(Agarwala, 2003). Additionally, results of IHRP such as engagement of employees and their satisfaction with the organization leads to a better relationship between the organization and the said employees, further mediating affective commitment (Sahinidis and Bouris, 2008).
Alternatively, Su, Baird and Blair(2013)were of the opinion that normal HR practices such as conventional training and payment for performance did not have a very positive effect on the relationship of organization with employees on the affective level. On these notes, Wright and Gardner(2005) found that IHR practices- performance evaluations, bonuses on work performance, increased opportunities
for promotion, increasing pay based on merit performance instead of waiting for appraisal cycle, increased cross-department communication, and an effective system for complaints, were antecedents of a better relationship of employee and organization, significantly strengthening affective commitment. Yang, Wan and Fu(2012) have established through an empirical research that there are five basic constructs of innovative HR practices that lead to the development of affective commitment, and those include employee recognition, development of competence, rewarding fairly, effective communication, and greater empowerment in work,. Another way of increasing affective commitment is through promotion of innovative and new practices related to human resource management, which provides a signal to the employees of that organization that they are valued Gilley, Dean and Bierema(2001), which in turn leads to their increased affective commitment. Thus, innovative HR practices are very significant in creating the process of developing affective employee commitment.
2.4 IHRP with normative commitment
There are many researchers who have shown how IHRP can help develop affective commitment and how affective commitment is very valuable aspect of organizational commitment, there is comparatively less research done on how IHRP may impact normative commitment and its value in total organizational commitment (Mowday, Steers and Porter, 1979; Yousef, 2000; Rajapaksha, 2015). Nevertheless, normative commitment is also important in assessing how employees relate to their organization and how normative commitment develops the working behavior of employees towards the aims and objectives of the organization. Normative commitment

THE JOURNAL OF INSURANCE INSTITUTE OF INDIA
JULY - SEPT - 201978
IHRPs
is defined as “the commitment employees have through the employees’ feelings of obligation to remain at the organization”(Meyer and Allen, 1991, pp. 64). The researchers suggest that the feelings an employee gets in normative commitment may have many sources. For instance, an employee may feel that the individual’s organization has invested resources, time and interest in developing the said employee, and thus, the employee in turn would have a moral obligation to work more dedicatedly, stay in the organization for a longer period of time than intended and find ways to work more to repay the debt of that investment. Another instance is noted when organizations work to implement innovative HR practices and help the employees in their career development
goals, then the employees work more
effectively in turn for organizational
goals to increase the success of the
organization and to showcase their
own performance abilities (Macey
and Schneider, 2008). Normative
commitment also develops through
small gestures organization does to
the employees, such as celebrating
occasions, working to provide for the
health of an employee and family,
creating a positive working environment
etc. which makes the employee feel
that the individual is being appreciated
and valued(Smither, London and Reilly,
2005). HR practices that involve taking
care of the employees, in work front
or in personal front, develops feeling
of being in debt or being more related
to the organization, creating a bond
of normative commitment (Meyer and
Allen, 1991).
2.5 IHRP with Continuance commitment
Continuance commitment is defined as “an awareness of the costs associated with leaving the organization”(Yousef, 2000, pp. 17). This type of commitment arises in employees who have the primary goal of being comfortable if the environment of the organization favors their growth. Some employees choose to stay in an organization because they are comfortable with the work, are being provided the opportunities which other organizations would provide, and are not willing to take the opportunity cost of switching from one organization to another(Rajapaksha, 2015) Thus, continuance commitment is also defined as “the strength of a person’s tendency or need to continue working for an organisation because he or she cannot afford to do otherwise”(Meyer and Allen, 1991, pp. 69).Continuance commitment may also arise through affective commitment, when the work becomes obligated through social pressures, and employees do not have the option of looking for another job due to some restraints(Camelo-Ordaz et al., 2011). Both continuance and affective commitment creates organizational commitment, which in turn is very strongly related to IHR practices. There are researchers who have conducted studies to demonstrate that commitment towards an organization is a result of how the employees are oriented towards the organization(Kooij et al., 2010). It has also been noted that affective commitment becomes continuance commitment if the employee becomes very comfortable in the work provided, and does not intentionally want to undertake the cost
of changing the organization(Tremblay et al., 2010). Moreover, in terms of continuance commitment, innovative HR practices make it more difficult for employees to risk taking the opportunity cost of changing the organization as it is likely to enhance the belief that the present organization is also committed towards them (Ceylan, 2013). Thus, the management of an organization can apply innovative human resource practices to improve all three types of commitment (affective, normative, and continuance) of the employees.
2.6 IHRP with Turnover Intention
Organizational commitment plays a mediating role between HR practices and turnover intention of the employees (Juhdi, Pa’wan & Hansaram, 2013). Higher the effect of HR practices on the organizational commitment of the employee, lesser the turnover intention rate. Innovative practices strongly affect the affective, continuance, and normative commitment of the employees and thereby reduce turnover intention rate of the employees (Suifan, 2015)
According to Taplin & Winterton (2007), employee retention is the skill of the managers to sustain their employees for a longer term. Effective employee retention can only be practiced by favorable IHRPs so that key talent remains committed to the company. By improving the retention of the employees, innovative strategies also favor organisations financially in the form of retained knowledge and crucial industry talent and technical know-how.
Some of the key strategies or aspects of IHRPs that play a role in retaining modern day workforce are presented

79JULY - SEPT - 2019
THE JOURNAL OF INSURANCE INSTITUTE OF INDIA IHRPs
subsequently. First of them is career advancement opportunities. Given the modern complex and competitive workforce, employees are looking for advancement and growth opportunities coupled with confirmed upward mobility (Shaw et al., 1998; Walsh and Taylor, 2007; Cho et al., 2016). Moreover, Joy & Sidhique (2016) find that flexible work hours and good recognition at the workplace promotes employee satisfaction and thus, retention.
On the other hand, IHRPs also influence the level of commitment shown by employees towards organizations. For instance, promoting socialization and early work experiences increases the loyalty of the employees at every level. According to Agarwala (2003) some IHRPs that promote employee commitment are maintaining employee relations with a human face (despite technological advancement), employee exit and separation management, and assuming responsibility for social issues. Apart from that, IHRPs which are rewarding with fair means like unbiased promotions, unprejudiced appreciation, etc. also obligates the employees to reciprocate to the company’s loyalty. Additionally, Xiu, Liang, Chen, & Xu, (2017) identify ‘strategic flexibility’ as core outcome of IHRPs, which leads to enhanced firm performance through employee commitment.
Employees of all the levels and of every age can be retained by acknowledging individual job accomplishments. It not only helps in retention but also boosts confidence and improves the performance of the employees. Relationship management strategies, rewards and development of
competencies are key factors affecting employee retention (Sinha and Sinha, 2012). Provision of flexibility in job in terms of scheduling variations to adjust to individual’s work timings (Sinha and Sinha, 2012), workload (Abbas et al., 2013), job location (O’Leary and Dean, 1998), and family responsibilities (Settles, 2011) have proven to be very effective in retention.
3. Research Methodology
3.1 Participants
The structured questionnaire was circulated and out of 200 employees in the Life Insurance sector surveyed, a total of 181 respondents completed the questionnaire. 45% of these respondents were female, so that equal participation can be there of the Males and females as shown in (Figure 1-A). Moreover, a majority (38%) of these respondents belonged to the 25-34 years age group (Figure 1-B), while another 30% belonged to the 35-44 years age group. A small section of the respondents (11%) were above 55 years of age. With respect to position held by the respondents (Figure 1-C) within the Life Insurance companies, Middle Management (23%), Administration-Middle (18%) and Administration-Junior (18%) were the most common departments the respondents belonged to. Further, as seen in Figure 1-D, 41% of the respondents were receiving average 5–10 LPA remuneration, followed by those who were receiving less than 5 LPA (31%). From education qualification point, 37% of the respondents possessed a graduate degree and 22% of people had a diploma degree. With respect to the duration of current position held, 39% of people were found to have
been working in the current position for 4-7 years followed by 17% who have been working for 0-3 years (figure not shown). Lastly, with respect to duration of experience in the present company, 25% of respondents have been with same company for 0-5 years followed by 24% of respondents who have been working in the of people are for 6-10 years.
Organizational commitment plays a mediating role between HR practices and turnover intention of the employees (Juhdi, Pa’wan & Hansaram, 2013). Higher the effect of HR practices on the organizational commitment of the employee, lesser the turnover intention rate. Innovative practices strongly affect the affective, continuance, and normative commitment of the employees and thereby reduce turnover intention rate of the employees (Suifan, 2015) According to Taplin & Winterton (2007), employee retention is the skill of the managers to sustain their employees for a longer term.

THE JOURNAL OF INSURANCE INSTITUTE OF INDIA
JULY - SEPT - 201980
IHRPs
1.B
55%
45%
Gender
Male Female
38%
30%
21%
11%
Age
25-34 years 35-44 years
45-54 years above 55 years
1.A
1.C
1.D
12%
18%
18% 17%
23%
1% 9% 2%
Position held
Clerical
Administration (Middle Level)
Administration (Senior Level)
Junior Management Level
Middle Management Level
Senior Management Level
Subject Specialist
sales
31%
41%
17%
11%
Yearly Remuneration
< 5 lakhs INR
5-10 lakhs INR
5-10 lakhs INR
10-15 lakhs INR
Figure 1: Demographic Profile of survey respondents
3.2 Constructs Measurement
The scale is adapted from the previous studies discussed in the literature review. A close ended and structured questionnaire containing 4 sections, was distributed to the respondents, including 10 variables clubbed from 47 items of Innovative HR practices identified from literature. The impact of these Innovative HR practices was studied with respect to Organizational commitment (Affective, Continuance and Normative) as well as Turnover Intention of the employees within the Life Insurance sector of India.
The reliability to measure the internal consistency of the research instrument has been established by obtaining Cronbach’s Alpha value of 0.82.
3.3 Research Instrument
This methodology applied in this study is explanatory in nature owing to the aim of the study being to investigate the causality of IHRPs on employees’ organization commitment and turnover intention (Baskerville & Pries-Heje, 2010; Kowalczyk, 2015)Although explanatory method, as noted by (Muhammad, 2016), does not
help researcher to achieve a concrete conclusion but it essentially helps at arriving the cause and effect relationship between variables. Therefore, the method is justified in applying in the study as it helped in assessing the impact of specific changes in the existing IHRPs and their strategies on the employees of selected insurance companies (Gray, 2009; Yin, 2013). Based on the application of the explanatory method, statistical tool of multiple regression has been used to derive the causality of IHRPs on employee commitment and turnover

81JULY - SEPT - 2019
THE JOURNAL OF INSURANCE INSTITUTE OF INDIA IHRPs
intention, since it helps in prediction of the value of a variable (dependent) based on the value of two or more variables (independent) (Cohen, Cohen, West, & Aiken, 2013; Ko, 2009) In the present section, the impact of IHRPs in Insurance sector on the organizational commitment and turnover intentions of the employees was analyzed by employing multiple regression analysis.
3.4 Sampling and Data Collection
In the present study, 8 life insurance companies based in Delhi- NCR, India were chosen for the study. A total of 200 employees from different levels of the Administrative, Assistant Administrative, and Development departments (N=20*8=200), were approached for the survey, out of which 181 fully complied with the survey. Stratified random sampling plan was applied to select the respondents based on their job profile, gender, remuneration and their work experience.
3.5 Research gap
Given the large number of innovative HR strategies in practice today across the world, it remains to be seen which ones play the most important role in increasing employee commitment and decreasing employee turnover intention. In this context, the insurance industry of India has been chosen due to the chronic issues of the high attrition rate and low work satisfaction that have plagued the industry since several decades.
3.6 Objectives and Hypothesis
The major objective is to find the Impact of Innovative HR practices (IHRPs)
on the organizational commitment and turnover intention of employees working in Life Insurance sector in India. To achieve the major objective the following sub objectives are as follows:
1. To measure the impact of IHRPs followed in Life Insurance on the organizational commitment of the employees.
2. To measure the impact of IHRPs followed in Life Insurance on the Turnover intention of employees.
On the basis of the above objective the hypothesis were formulated. Statistical analysis has been conducted by examining two proposed null hypotheses:
H01: IHRPs followed in Life Insurance sector do not have any significant impact on the organizational commitment of the employees.
H01A: IHRPs followed in Life Insurance sector do not have any significant impact on the Affective organizational commitment of the employees.
H01B: IHRPs followed in Life Insurance sector do not have any significant impact on the Continuance organizational commitment of the employees.
H01C: IHRPs followed in Life Insurance sector do not have any significant impact on the Normative organizational commitment of the employees.
H02: IHRPs followed in Life Insurance sector do not significantly
decrease the Turnover Intention of the employees.
4. Data Analysis
A multivariate regression was conducted
in order to determine the prominent
Innovative Human Resource Practices.
(IHRP) in the following manner:
A. Impact of IHRPs on Organizational
Commitment
H01: IHRPs followed in insurance sector do not have any significant impact on the organizational commitment of the employees.
This hypothesis was tested by
individually analyzing the impact of
IHRP strategies within Life Insurance
sector against 3 types of organizational
commitment, Affective, Normative
and Continuance commitment among
employees of the industry.
1. IHRPs and Affective Organizational
Commitment
H01A: IHRPs followed in insurance
sector do not have any significant
impact on the Affective
organizational commitment of the
employees.
Correlation analysis was conducted
to test the association between IHRPs
practices within the Life Insurance
sector with the Affective organizational
commitment as experienced by the
employees.
Study Variables Affective Commitment
Pearson Correlation Sig. (2-tailed)
Affective Commitment 1
Employee acquisition strategies .670** .000Employee retention strategies .716** .000
Technical training .257** .000
Management development (MD) .161* .030

THE JOURNAL OF INSURANCE INSTITUTE OF INDIA
JULY - SEPT - 201982
IHRPs
Potential development: a company-wide MD Programme .665** .000
Career planning and development practices .255** .000
Performance appraisals .634** .000
Succession planning .256** .001
Employee relations with a human face: treating employees with concern
.636** .000
Adopting responsibility for socially relevant issues .664** .000
[**. Correlation is significant at the 0.01 level (2-tailed) and *. Correlation is significant at the 0.05 level (2-tailed)]Table 1: Correlation analysis between IHRPs and Affective commitment of employees in India’s Life Insurance sector
From Table1, it is clear that several IHRPs were significantly correlated with Affective Organizational commitment among the employees surveyed. More specifically, innovations in the Employee retention strategies, followed
Model Summary
Hypothesis R R Square Adjusted R Square Std. Error of the Estimate F Sig.
H01A .867 .752 .738 .676 51.655 .000
Coefficients
Hypothesis H01A Standardized Coefficients (Beta)
t Sig.
(Constant) -1.636 .104
Employee acquisition strategies .282 5.766 .000
Employee retention strategies .346 6.902 .000
Technical training .250 .500 .618
Management Development -.052 -1.259 .210
Potential Development .736 1.122 .263
Career planning and development practices .071 1.738 .084
Performance appraisals .167 3.100 .002
Succession planning -.240 -.481 .631
Employee relations -.134 -.738 .461
Adopting responsibility for socially relevant issues -.311 -.562 .575
Table 2: Multiple Linear Regression analysis of IHRPs on Affective Commitment among employees in India’s Life Insurance sector
by Employee acquisition strategies, Company-wide Potential Development programmes, Adoption of socially responsible issues, Employee relations and Performance Appraisal practices were highly correlated with a sense of
Affective organizational commitment among the employees. This suggests that unique HR strategies with respect to acquisition, retention and effective management of employees are related to employees’ emotional attachment to their organization in this sector.
Further Regression studies (Table 2)showed thatall the IHRPs considered in the study explained 75.2% of variance in the Affective Organizational Commitment (F = 51.655, p < 0.05). Among the 10 IHRPs studied, only 3 such practices were found to
significantly and positively contribute to Affective Organizational Commitment. These included Employee retention strategies (β = 0.346, p = .000) which had the strongest influence on Affective Commitment, followed by Employee acquisition strategies (β
= .282, p = .000) and Performance appraisal practices (β = .167, p = .002), all of which contributed to Affective Organizational Commitment. The remaining factors did not show significant relationship with the dependent variable.

83JULY - SEPT - 2019
THE JOURNAL OF INSURANCE INSTITUTE OF INDIA IHRPs
Study Variables
Continuance
Commitment
Pearson Correlation Sig. (2-tailed)
ContinuanceCommitment
1
Employee acquisition strategies .579** .000
Employee retention strategies .265** .000
Technical training .544** .000
Management Development (MD) .420** .000
Potential development: a company-wide MDprogramme .382** .000
Career planning and development practices .018 .805
Performance appraisals .648** .000
Succession planning .446** .000
Employee relations with a human face: treating employees with concern
.397** .000
Adopting responsibility for socially relevant issues .475** .000
[**. Correlation is significant at the 0.01 level (2-tailed) and *. Correlation is significant at the 0.05 level (2-tailed)]
Table 3: Correlation analysis between IHRPs and Continuance commitment of employees in insurance sector
In order to test the hypothesis for the effect of IHRPs on Continuance Organizational commitment, multiple linear Regression analysis was conducted.
Affective commitment, which refers to employees’ emotional attachment to their job and the organization, has been shown to be influenced by HR strategies concerned with their recognition, empowerment, competence development, information sharing as well as fair rewards practices, as determined by (Yang, 2012). Moreover, employee trust in their organization was found to influence the impact of perceived procedural justice as well as organizational support on their affective commitment (Tremblay, Cloutier, Simard, Chênevert, & Vandenberghe, 2010). Thus, affective commitment among employees can be strongly influenced by those HR practices that are based on developing a sense of emotional support and personal
development.
Since certain IHRP strategies (Employee retention and acquisition strategies and Performance appraisal practices)were found to influence Affective commitment, the null was rejected and the alternate hypothesis,
IHRPs followed in Life Insurance sector have significant impact on the Affective organizational commitment of the employees was accepted.
B. IHRPs and Continuance Organizational Commitment
H01B: IHRPs followed in insurance sector do not have any significant impact on the Continuance organizational commitment of the employees.
Correlation analysis between the IHRPs and Continuance Organizational commitment of the employees within the Insurance sector showed that almost all the practices were significantly associated with the dependent variable, except for Career Planning (β = .018, p = .805). More specifically, Performance appraisals, Employee acquisition and Technical training strategies were highly correlated to a feeling of Continuance Organizational Commitment among the employees surveyed. This suggests that for the Life Insurance sector, innovative HR strategies with respect to performance appraisal systems and acquiring talent within organizations is associated with employees intending to continue in their current job.
Model Summary
Hypothesis R R Square Adjusted R Square Std. Error of the Estimate F Sig.
H01B .826 .682 .659 .781 29.969 .000

THE JOURNAL OF INSURANCE INSTITUTE OF INDIA
JULY - SEPT - 201984
IHRPs
Regression analysis (Table 4) showed
that the IHRPs studied contributed to
68.2% of the variance (F = 29.969, p
= .000) in Continuance Organizational
Commitment, suggesting that they
are important in developing a sense
of continuance as a result of costs
associated with leaving their jobs
among the employees in the Life
Insurance sector. Furthermore, co-
efficient analysis showed that only four
IHRPs were significantly and positively
contributing towards Continuance
Commitment. This includes, Employee
relations (β = .318, p = .000),
Technical Training (β = .257, p = .000),
Performance Appraisals (β = .190, p
= .000) and Potential Development (β
= .181, p = .001).The model therefore
suggest that for the employees in
India’s Life Insurance sector, those
IHRPs that focus on improving the skills
and overall development of employees,
along with maintaining optimal relations
with them are important for employees
to recognize the costs of leaving their current jobs.
Although HR practices related to affective commitment have been extensively studied, their relationship with continuance commitment (staying back in the organization out of self-interest) has been studied with respect to mainly employee development. While (Newman, Thanacoody, & Hui, 2011) established the significance of training on developing a sense of continuance commitment among employees of the Chinese service sector multinationals, (Obeidat & Abdallah, 2014) found that fair rewards and information sharing were significantly related to continuance commitment. This study reinforces the
importance of HR practices that help
employees grow and develop in their job
as an important factor in their perceived
superior costs of their jobs.
Since certain IHRP strategies
(Employee relations, Technical training,
Performance appraisals and Potential
Development) were found to influence Continuance commitment, the null was rejected and the alternate hypothesis IHRPs followed in Life Insurance sector have significant impact on the Continuance organizational commitment of the employees was accepted.
C. IHRPs and Normative Organizational
commitment of employees
H01C: IHRPs followed in insurance
sector do not have any significant
impact on the normative organizational
commitment of the employees.
Correlation analysis between the 10 IHRPs followed in the Life Insurance sector and the perceived Normative Commitment revealed that innovation in Succession planning, Career planning and development practices, Employee acquisition strategies and Technical training practices of HR were significantly and positively associated with Normative commitment among the employees.
Coefficients
Hypothesis Standardized Coefficients (Beta)
t Sig.
(Constant) -1.614 .108
Employee acquisition strategies -.073 -1.295 .197
Employee retention strategies .097 1.745 .083
Technical training .257 4.447 .000
Management development -.068 -1.274 .205
Potential development .181 3.402 .001
Career planning and development practices .081 1.546 .124
Performance appraisals .190 3.939 .000
Succession planning -.060 -1.352 .178
Employee relations .318 5.564 .000
Adopting responsibility for socially relevant issues .062 1.101 .272
Table 4: Multiple Linear Regression analysis of IHRPs on Continuance Commitment among employees in India’s Life Insurance sector

85JULY - SEPT - 2019
THE JOURNAL OF INSURANCE INSTITUTE OF INDIA IHRPs
Study Variables
Normative
Commitment
Pearson Correlation Sig. (2-tailed)
Normative commitment
1
Employee acquisition strategies .558** .000
Employee retention strategies .164* .027
Technical training .520** .000
Management development .145 .051
Potential development: a company-wide md programme .333** .000
Career planning and development practices .590** . .000
Performance appraisals .501** .000
Succession planning .610** .000
Employee relations with a human face: treating employees with concern .472** .000
Adopting responsibility for socially relevant issues .168* .024
[**. Correlation is significant at the 0.01 level (2-tailed) and *. Correlation is significant at the 0.05 level (2-tailed)]
Table 5: Correlation analysis between IHRP strategies and Normative commitment of employees in Insurance sector of India
Model Summary
Hypothesis R R Square Adjusted R Square Std. Error of the Estimate F Sig.
H01C .713 .508 .479 .883 17.540 .000
Coefficients
Hypothesis H01C Standardized Coefficients (Beta) t Sig.
(Constant) 2.908 .004
Employee acquisition strategies .181 2.406 .017
Employee retention strategies -.085 -1.239 .217
Technical training .169 2.359 .019
Management development .041 .740 .460
Potential development .018 .280 .780
Career planning and development practices .207 2.687 .008
Performance appraisals .111 1.166 .245
Succession planning .217 1.998 .047
Employee relations .033 .445 .657
Adopting responsibility for socially relevant issues -.025 -.427 .670
Table 6: Multiple Linear Regression analysis of IHRPs on Normative Commitment among employees in India’s Life Insurance sector

THE JOURNAL OF INSURANCE INSTITUTE OF INDIA
JULY - SEPT - 201986
IHRPs
Further, Hypothesis testing through Regression analysis (Table 6) showed that the 10 IHRPs studied contributed to 50.8% (F = 17.4, p = .000) of the variance in the perceived Normative Commitment of the employees in India’s Life Insurance sector. Co-efficient analysis to determine individual contribution of these factors towards Normative Organizational Commitment revealed that except for four IHRPs, the others did not significantly contribute to the dependent variable. Career planning and Development practices (β = .207, p = .008), Employee acquisition strategies (β = .181, p = .017), Technical training (β = .169, p = .019) and Succession planning (β = .217, p = .047) were significantly and positively contributing towards employees staying back in their organizations out of sense of obligation. This suggests that for India’s Life Insurance sector, innovative HR practices that focus on employee acquisition and development as well as those that help plan efficient change in leadership within organizations arouses
a sense of obligation for employees to commit to their organization.
Positive perception of organizational inducements has been shown to positively influence normative commitment and mediated by a positive state of mind and social exchange of employees with their organization(Shin, Taylor, & Seo, 2012). Moreover, HR practices involved in engaging the employees in an organization positively and significantly influence their normative commitment, since socialization among employees lead to higher empathy and interact better with other organizational members (Ortiz, Lau, Scholar, Kwan, & Lau, 2011)
Hence, with certain discussion of IHRPs practices (Career planning and Development practices, Employee acquisition strategies, Technical training and Succession planning) impact on Normative Commitment, the null hypothesis was rejected, and its/alternative hypothesis IHRPs followed in insurance sector have
significant impact on the Normative organizational commitment of the employees was accepted.
D. IHRPs and Turnover Intention of employees
H02: IHRPs followed in insurance sector do not significantly decrease the turnover intention of the employees.
Correlation analysis between IHRPs and Turnover intentions of employees (Table 7)in Life Insurance sector of India showed that all were positively significantly associated with turnover intentions of employees, but only 4 IHRPs were highly associated. Technical training, Employee acquisition strategies, Management Development and Adopting socially responsible issues were highly correlated with turnover intentions of employees. This suggest that HR strategies pertaining to employee development and growth as well as involving in socially important events is associated with employees intention to leave the organization.
Study VariablesTurnover intentions
Pearson Correlation Sig. (2-tailed)
Turnover intentions 1
Employee acquisition strategies .665** .000
Employee retention strategies .247** .001
Technical training .698** .000
Management Development .640** .000
Potential development: a company-wide MD programme .212** .004
Career planning and development practices .302** .000
Performance appraisals .351** .000
Succession planning .366** .000
Employee relations with a human face: Treating employees with concern .390** .000
Adopting responsibility for socially relevant issues .612** .000
[**. Correlation is significant at the 0.01 level (2-tailed) and *. Correlation is significant at the 0.05 level (2-tailed)]
Table 7: Correlation analysis between IHRPs and Turnover Intentions of employees in India’s Life Insurance sector
As seen in Table 8,Regression analysis revealed that all the 10 IHRPs considered in this study contributed to 73.2% variation (F = 46.66, p = .000) in the Turnover Intention of employees in India’s Life Insurance sector.

87JULY - SEPT - 2019
THE JOURNAL OF INSURANCE INSTITUTE OF INDIA IHRPs
Model Summary
Hypothesis R R Square Adjusted R Square Std. Error of the Estimate F Sig.
H02 .855a .732 .716 .657 46.366 .000
Coefficients
Hypothesis H02 Standardized Coefficients (Beta) t Sig.
(Constant) -2.089 .038
Employee acquisition strategies .247 4.535 .000
Employee retention strategies .127 2.843 .005
Technical training .296 5.132 .000
Management development .226 4.332 .000
Potential development .035 .855 .394
Career planning and development practices -.016 -.339 .735
Performance appraisals .062 1.423 .157
Succession planning -.035 -.747 .456
Employee relations .024 .511 .610
Adopting responsibility for socially relevant issues .268 5.456 .000
Table 8: Multiple Linear Regression analysis for IHRPs with Turnover Intentions among employees in India’s Life Insurance sector
Further coefficient analysis showed that 5 IHRPs significantly and positively contributed towards turnover intentions of the employees. These included Adopting socially responsible issues (β = .268, p = .000), Technical training (β = .296, p = .000), Management development (β = .226, p = .000), Employee acquisition strategies (β = .247, p = .000), an Employee retention strategies (β = .127, p = .005). As a result, it can be said that IHRPs pertaining to employee personality development and management have a negative impact on Turnover intentions of employees in India’s Life Insurance sector.
HR management practices with respect to high-performance of employees has been known to mediate the relationships between HR strategies and intention to remain in the organization since it improves their affective commitment towards their organization (Kehoe & Wright, 2013). Moreover, appropriate employee hiring
and training practices along with optimal compensation strategies were shown to directly have an impact on turnover intentions of employees, while breach of psychological contract can increase such turnover intentions of the employees (Santhanam, Dyaram, & Ziegler, 2017).
Considering that several IHRPs had a significant impact on Turnover With certain discussion of factors of Turnover Intention on IHRPs factors in Insurance sector, it is justified to state that null hypothesis is rejected and alternative hypothesis, IHRPs followed in insurance sector has significant impact on the turnover intentions of the employees was accepted.
5. Conclusion
Following detailed statistical analysis of survey data, it is observed that Innovative HR practices have strong influence on the organizational commitment and turnover intentions of employees in India’s Life Insurance
Sector. Based on the model by Allen & Meyer, (1990), three major forms of Organizational commitments, Affective, Continuance and Normative commitment were studied. Turnover intentions also taken as an individual way in which only employee quit factors has been discussed which actually does not affect insurance sector so much, directly. There is more impact of the affective and normative commitment on the IHRPs practices. IHRPs practices like employee retention strategies, technical training and management developmenthas strong impact on commitment of the employees in insurance sector. According to Fernandez-Lores et al., (2016), it is very important to maintain balance between the employee working condition and personal life. Therefore, there should be significant relationship between commitments of employee and innovative HR practices in high pace of degree to enhance the stability of the organization in insurance sector.

THE JOURNAL OF INSURANCE INSTITUTE OF INDIA
JULY - SEPT - 201988
IHRPs
Further, it has been found that technical training and performance appraisal strategies leave the highest degree of impact on all three types of commitment of the employees. It has been found that, India is lacking in the quality in the training and technical findings in Insurance sector which leads to less job opportunities in India(Kavitha & Anuradha, 2016).
To conclude, results of this research support that an engaged work force which can help to increase the workers’ levels of commitment, which directly reduce the turnover level and other withdrawal factors and to get more attention towards insurance sector, government or any private company should give focus towards maternity leave, as well as flexible work timings as well as company policies. Moreover, providing travel allowances as part of performance appraisal and re-appointment of women ex-employees who went for career break in between gives importance in enhancement of insurance sector to grab opportunities in job findings. Therefore, recommendation can be made to include these policies so as to motivate the employees, especially women, so that they gain an opportunity to rejoin the workforce, contributing their experience and knowledge, hence saving the HR personnel from investments in training of fresher.
In this study, it has been shown that potential development in form of a company-wide managing development programme has high degree impact on the commitment factors of the employee in the insurance sector. It gives a chance to provide technical training to fresher’s to increase their job as well as overall career opportunities. Insurance companies can also provide qualitative and quantitative appraisal for the employee for ensuring the company’s
low attrition as well as employee’s high job satisfaction. The study by Long, Perumal, & Ajagbe, (2012) signify that career development in an organization should be priority of an organization that should be mitigate to meet the needs of managers, subordinates and the organization encouraging employees to take responsibility for their own careers in form of employee feedback, qualitative encouragement.
6. Limitations
The limitation of the study was mainly that limited insurance companies were surveyed. Since only 8 organizations from the entire Life Insurance industry were surveyed, a significant section of the industry, especially small scale organizations were left out from the study. Moreover, the scale of turnover intention used in this study only shows the employee’s intention to quit an organization, but does not reveal their subsequent actual turnover.
Future studies in this area needs to focus on conducting surveys among more organizations, along with in-depth study of the managers’ perspectives on IHRPs within the industry. Studies need also be done to understand the difference in IHRPs adoption and impact between Government and Private Life Insurance companies in India. This could help understand what job and organizational factors, along with organizational culture can influence This can be done with respect to employee retentions, leaves, appraisal and strategies of allowance in company and after retirement as compared to
private sector.
References
Abbas, S. G., Qureshi, M. I., Iftikhar, M., Hassan, U., Khan, K., & Zaman, K. (2013). Relationship Between Job Stress, Workload, Environment and Employees Turnover Intentions: What
We Know, What Should We Know. World Applied Sciences Journal, 23(6), 764–770.
Abdullah, H. (2009). Major challenges to the effective management of human resource training and development activities. The Journal of International Social Research, 2, 11–21.
Agarwala, T. (2003). Innovative human resource practices and organizational commitment: An empirical investigation. International Journal of Human Resource Management, 14(2), 175–197. https://doi.org/10.1080/0958519021000029072
Ahmed, M., & Nawaz, N. (2015). Impact of Organizational Commitment on Employee Turnover : A Case Study of Pakistan International Airlines ( PIA ). Industrial Engineering Letters, 5(8), 57–70.
Allen, D. G., Shore, L. M., & Griffeth, R. W. (2003). Allen 2003 JofMgt models re POS org commitment etc, 29(1), 99–118.
Allen, N. J., & Meyer, J. P. (1990). The measurement and antecedents of affective, continuance and normative commitment to the organization. Journal of Occupational and Organizational Psychology, 63(1), 1–18.
Ang, S. H., Bartram, T., McNeil, N., Leggat, S. G., & Stanton, P. (2013). The effects of high-performance work systems on hospital employees’ work attitudes and intention to leave: a multi-level and occupational group analysis. The International Journal of Human Resource Management, 24(16), 3086–3114. https://doi.org/10.1080/09585192.2013.775029
Aslam, H. D., Aslam, M., Ali, N., & Habib, B. (2013). Importance of Human Resource Management in 21st Century: A Theoretical Perspective. International Journal of Human Resource Studies, 3(3).

89JULY - SEPT - 2019
THE JOURNAL OF INSURANCE INSTITUTE OF INDIA IHRPs
Baskerville, R., & Pries-Heje, J. (2010). Explanatory Design Theory. Business and Information Systems Engineering, 2(5), 271–282. https://doi.org/10.1007/s12599-010-0118-4
Begum, F. W. (2016). THE ROLE OF HRM PRACTICES IN GAINING EMPLOYEE AFFECTIVE COMMITMENT IN MANUFACTURING INDUSTRIES , TIRUCHIRAPPALLI, 7(6), 15–22.
Cafferkey, K., Heffernan, M., Harney, B., Dundon, T., & Townsend, K. (2018). Perceptions of HRM system strength and affective commitment: the role of human relations and internal process climate. The International Journal of Human Resource Management, 1–23. https://doi.org/10.1080/09585192.2018.1448295
Camelo-Ordaz, C., García-Cruz, J., Sousa-Ginel, E., & Valle-Cabrera, R. (2011). The influence of human resource management on knowledge sharing and innovation in Spain: the mediating role of affective commitment. The International Journal of Human Resource Management, 22(7), 1442–1463. https://doi.org/10.1080/09585192.2011.561960
Chew, J., Girardi, A., & Entrekin, L. (1998). Journal of comparative international management. Journal of Comparative International Management (Vol. 8). Management Futures. Retrieved from https://journals.lib.unb.ca/index.php/jcim/article/view/643/1000
Cho, S., Woods, R., Jang, S., & Erdem, M. (2016). Measuring the impact of human resource management practices on hospitality firms'' performances. International Journal of Hospitality Management, 25(2), 262–277.
Cohen, J., Cohen, P., West, S. G., & Aiken, L. S. (2013). Applied Multiple Regression/Correlation Analysis for the Behavioral Sciences. Routledge.
Coyle-Shapiro, J. A.-M., Kessler,
I., & Purcell, J. (2004). Exploring Organizationally Directed Citizenship Behaviour: Reciprocity or “It’s my Job”?*. Journal of Management Studies, 41(1), 85–106. https://doi.org/10.1111/j.1467-6486.2004.00422.x
Dalota, M.-D., & Perju, A. (2006). Human Resources Management and the Company’s Innovation. Romanian Economic and Business Review, 5(4), 122–131.
Das, S; Narendra, P; Mishra, P. (2014). Hr Issues in Small & Medium Enterprises. International Journal of Research in Humanities, Arts and Literature, 2(5), 183–194.
Durani, H. A., Trivedi, K. U., & Durani, A. A. (2015). Innovative HR Strategic Practices of Indian and Foreign MNCs. Original Research Journal of Management Research and Analysis, 2(3), 173–176.
Fernandez-Lores, S., Gavilan, D., Avello, M., & Blasco, F. (2016). Affective commitment to the employer brand: Development and validation of a scale. BRQ Business Research Quarterly, 19(1), 40–54. https://doi.org/10.1016/J.BRQ.2015.06.001
Ghiselli, R., La Lopa, J., & Bai, B. (2001). Job satisfaction, Life Satisfaction and Turnover Intention. Hotel and Restuarant Administration Quaterly, 28–37. https://doi.org/10.1016/S0010-8804(01)80036-7
Gracy Vas, E. (2014). Innovative HR Practices: For revival and survival during economic slowdown. IOSR Journal of Business and Management, 2, 50–56.
Gray, D. E. (2009). Principles and Planning for Research. Doing Research in the Real World, 11–38.
Hinkin, T. R., & Tracey, J. B. (2010). What makes it so great?: An analysis of human resources practices among Fortune’s best companies to work for.
Cornell Hospitality Quarterly, 51(2), 158–170.
Jaros, S. (2007). Measurement issues in the Meyer & Allen model of organizational commitment. The ICFAI Journal of Organizational Behavior, 6, 7–26. https://doi.org/10.1348/096317906X118685
Joseph, B. (2012). Innovative human resource practices and employee outcomes in software firms in india. In 16th World Congress of the International Labour and Employment Relations Association. ILERA.
Joseph, D. B. (2012). Innovative Human Respource Practices and Employee Outcomes in Software Firms in India. Kochi, Kerala.
Joy, M. M., & Sidhique, F. (2016). A Study on the Impact of Innovative Human Resource Practices on Job Satisfaction of Employees Working in Information Technology Sector. International Journal of Engineering Technology Science and Research, 3(12), 26–29.
Karlsson, J. (2013). The role of HRM in innovation processes. University of Gothenburg.
Kavitha, D. N. V., & Anuradha, T. (2016). Corporate Social Responsibility in Insurance Sector in India. INTERNATIONAL JOURNAL OF INNOVATIVE RESEARCH & DEVELOPMENT, 5(2), 137–143.
Kehoe, R. R., & Wright, P. M. (2013). The impact of high performance HR Practices on Employees’ Attitudes and Behaviors. Journal of Management, 39(2), 366–391.
Khan, M. S., Khan, I., Kundi, D. G. M., Khan, D. S., Nawaz, D. A., Khan, F., & Yar, N. B. (2014). The Impact of Job Satisfaction and Organizational commitment on the Intention to leave among the Academicians. International

THE JOURNAL OF INSURANCE INSTITUTE OF INDIA
JULY - SEPT - 201990
IHRPs
Journal of Academic Research in Business and Social Sciences, 4(2). https://doi.org/10.6007/IJARBSS/v4-i2/610
Khan, R., Naseem, A., & Masood, S. A. (2016). Effect of continuance commitment and organizational cynicism on employee satisfaction in engineering organizations. International Journal of Innovation, Management and Technology, 7(4), 141–146. https://doi.org/10.18178/ijimt.2016.7.4.661
Ko, K. (2009). Multiple Regression Model For Market Capitalization. Journal of Global Business Issues, 3(2), 167–172.
Kooij, D. T. A. M., Jansen, P. G. W., Dikkers, J. S. E., & De Lange, A. H. (2010). The influence of age on the associations between HR practices and both affective commitment and job satisfaction: A meta-analysis. Journal of Organizational Behavior, 31(8), 1111–1136. https://doi.org/10.1002/job.666
Kowalczyk, D. (2015). Purposes of Research: Exploratory, Descriptive & Explanatory - Video & Lesson Transcript | Study.com.
Kumar, M. S., & Archana, P. (2017). Innovative Human Resource Practices : Literature Review And Related Issues, 5(07), 6417–6430. https://doi.org/10.18535/ijsrm/v5i7.77
Kumari, N., & Afroz, N. (2013). The Impact of Affective Commitment in Employees Life Satisfaction. Global Journal of Management and Business Research Interdisciplinary, 13(7), 25–30. Retrieved from https://globaljournals.org/GJMBR_Volume13/4-The-Impact-of-Affective-Commitment.pdf
Long, C., Perumal, P., & Ajagbe, M. (2012). The impact of human resource management practices on employees’ turnover intention: A conceptual
model. Interdisciplinary Journal of Contemporary Research in Business, 4(2), 629–641.
Loo-See Beh, & Leap-Han Loo. (2013). Human resource management best practices and firm performance: a universalistic perspective approach. Serbian Journal of Management , 8(2), 155–167. https://doi.org/10.5937/sjm8-4573
Macey, W., & Schneider, B. (2008). The meaning of employee engagement. Industrial and Organizational Psychology, 1(1), 3–30.
Madi, M., Abu-Jarad, I., & Alqahtani, A. H. M. (2012). Employees’ Perception and Organizational Commitment: A Study on the Banking Sector in Gaza, Palestine. International Journal of Business and Social Science, 3(16), 299–312.
Medina, E. (2012). Job Satisfaction and Employee Turnover Intention: What does Organizational Culture Have To Do With It?
Mellam, A. C., Rao, P. S., & Mellam, B. T. (2015). The Effects of Traditional and Modern Human Resource Management Practices on Employee Performance in Business Organisations in Papua New Guinea. Universal Journal of Management, 3(10), 389–394. https://doi.org/10.13189/ujm.2015.031002
Meyer, J., & Allen, N. (1991). A three-component conceptualization of organizational commitment. Human Resource Management Review, 1(1), 61–89.
Meyer, J. P., Bobocel, D. R., & Allen, N. J. (1991). Development of Organizational Commitment During the First Year of Employment: A Longitudinal Study of Pre- and Post-Entry Influences. Journal of Management, 17(4), 717–733. https://doi.org/10.1177/014920639101700406
Mokaya, S. O. (2012). Effects of Workplace Recreation on Employee Performance. International Journal of Humanities and Social Science, 2(3), 176–183.
Mowday, R., Steers, R., & Porter, L. (1979). The measurement of organizational commitment. Journal of Vocational Behavior.
Muhammad, W. (2016). Explanatory Research: Definition, Types, Comparison, Advantages, Disadvantages.
Mutembei, G. C., & Tirimba, O. I. (2014). Role of Human Resource Management Strategy in Organizational Performance in Kenya. International Journal of Scientific and Research Publications, 4(1), 2250–3153.
Newman, A., Thanacoody, R., & Hui, W. (2011). The impact of employee perceptions of training on organizational commitment and turnover intentions: a study of multinationals in the Chinese service sector. The International Journal of Human Resource Management, 22(8), 1765–1787.
Nirmala, S. S. (2015). Innovative Human Resource Practices - A Study in Indian Context. International Journal of Management Research and Social Science (IJMRSS), 2(4), 100–104.
O’Leary, P., & Dean, D. (1998). International Research Project on Job Retention and Return to Work Strategies for Disabled Workers: Study Report USA.
Obeidat, B. Y., & Abdallah, A. B. (2014). The Relationships among Human Resource Management practices, Organizational Commitment, and Knowledge Management Processes: A Structural Equation Modeling approach. International Journal of Business and Management, 9(3), 9–26.
Ortiz, D. C., Lau, W. K., Scholar,

91JULY - SEPT - 2019
THE JOURNAL OF INSURANCE INSTITUTE OF INDIA IHRPs
M. D., Kwan, W., & Lau, E. (2011). The Effect of Employee Engagement on Continuance and Normative Commitment to the Organization. Management Faculty Research, 3(1), 1–20. https://doi.org/10.9790/487X-17531723
Purohit, S. (2013). A Study of the Changes in Human Resource Management Practices in LIC Due to the Impact of Private Insurance Players. Indian Journal of Management.
Rajapaksha, U. G. (2015). The Impact of Cross Culture on Employee Performance in Multinational Companies in Sri Lanka.
Santhanam, N., Dyaram, L., & Ziegler, H. (2017). Impact of human resource management practices on employee turnover intentions: Moderating role of psychological contract breach. Journal of Indian Business Research, 9(3), 212–228.
Saygan, F. N. (2011). Relationship Between Affective Commitment and. International Journal of Social Science and Humanity Studies, 3(2), 219–227.
Settles, J. L. (2011). The effects of family structure, family responsibilities, and family closeness on the college decisions of Hispanic high school students. Iowa.
Shamsudin, F. M., Subramaniam, C., & Alshuaibi, A. S. (2012). The Effect of HR Practices, Leadership Style on Cyberdeviance: The Mediating Role of Organizational Commitment. Journal of Marketing and Management, 3(1), 22-48.
Shaw, J., Delery, J., Jenkins, G. J., & Gupta, N. (1998). An organization-level analysis of voluntary and involuntary turnover. Academy of Management Journal, 41(5), 511–526.
Shin, J., Taylor, M., & Seo, M. (2012). Resources for change: The relationships of organizational inducements and
psychological resilience to employees’ attitudes and behaviors toward organizational change. Academy of Management Journal, 55(3), 727–748.
Sinha, C., & Sinha, R. (2012). Factors Affecting Employee Retention: A Comparative Analysis of two Organizations from Heavy Engineering Industry. European Journal of Business and Management, 4(3), 145–162.
Som, A. (2008). Innovative human resource management and corporate performance in the context of economic liberalization in India. The International Journal of Human Resource Management, 19(7), 1278–1297. https://doi.org/10.1080/09585190802110075
Sreeja. (2018). HRM and organizational innovation- A literature review, (2), 28–31.
Su, S., Baird, K., & Blair, B. (2013). Employee organizational commitment in the Australian public sector. The International Journal of Human Resource Management, 24(2), 243–264. https://doi.org/10.1080/09585192.2012.731775
Suifan, T. S. (2015). The Effect of Human Resources Practices on Organizational Commitment: A Jordanian Study. Journal of Management Research, 7(4), 222–232. https://doi.org/10.5296/jmr.v7i4.7972
Sung, S. Y., & Choi, J. N. (2014). Do organizations spend wisely on employees? Effects of training and development investments on learning and innovation in organizations. Journal of Organizational Behavior, 35(3), 393–412.
Tabvuma, V., Georgellis, Y., & Lange, T. (2015). Orientation Training and Job Satisfaction: A Sector and Gender Analysis. Human Resource Management.
Taplin, & Winterton. (2007). The importance of management style in labourretention. International Journal of Sociology and Social Policy, 5(15).
Tremblay, M., Cloutier, J., Simard, G., Chênevert, D., & Vandenberghe, C. (2010). The role of HRM practices, procedural justice, organizational support and trust in organizational commitment and in-role and extra-role performance. The International Journal of Human Resource Management, 21(3), 405–433.
Tremblay, M., Cloutier, J., Simard, G., Chênevert, D., & Vandenberghe, C. (2010). The role of HRM practices, procedural justice, organizational support and trust in organizational commitment and in-role and extra-role performance. The International Journal of Human Resource Management, 21(3), 405-433. https://doi.org/10.1080/09585190903549056
Umoh, G. I., Amah, E., & Wokocha, I. H. (2014). Employee Benefits and Continuance Commitment in the Nigerian Manufacturing Industry. IOSR Journal of Business and Management Ver. II, 16(2), 69–74. Retrieved from www.iosrjournals.org
Vakula Kumari, M. P., & Dubey, P. (2018). Employee Performance and Their Organizational Commitment In Relation To HRM Practices: A Literature Review. IOSR Journal of Business and Management, 20(4), 58–63. https://doi.org/10.9790/487X-2004075863
Vandenberghe, C., Bentein, K., & Stinglhamber, F. (2004). Affective commitment to the organization, supervisor, and work group: Antecedents and outcomes. Journal of Vocational Behavior, 64(1), 47–71. https://doi.org/10.1016/S0001-8791(03)00029-0
Venkateswara Rao, T. (2014). HRD audit : evaluating the human resource

THE JOURNAL OF INSURANCE INSTITUTE OF INDIA
JULY - SEPT - 201992
IHRPs
function for business improvement (Second). Ahmedabad: SAGE Publications.
Walsh, K., & Taylor, M. (2007). Developing in-house careers and retaining management talen. Cornell Hotel and Restaurant Administration Quarterly, 48(2), 163–182.
Wang, Y., & Wei, B. (2012). The need of a HRM change from traditional to strategic with organizational transition: -- A case study of a Swedish high-speed-growth company. Halmstad University.
White, M., & Bryson, A. (2013). Positive employee attitudes: How much human resource management do you need? Human Relations (Vol. 66). https://doi.org/10.1177/0018726712465096
Xiu, L., Liang, X., Chen, Z., & Xu, W. (2017). Strategic flexibility, innovative HR practices, and firm performance: A moderated mediation model. Personnel Review, 46(7), 1335–1357.
Yang, C. A., Lin, L, S., Lin, Y. C., & Huang, I. C. (2010). How human resource practices facilitate knowledge transfer, knowledge retention and innovation - comparison of two case studies. Taiwan.
Yang, Y. C. (2012). High-involvement Human Resource practices, Affective commitment, and Organizational citizenship behaviors. The Service Industries Journal, 32(8), 1209–1227.
Yin, R. K. (2013). Case Study Research: Design and Methods. Applied Social Research Methods Series, 5, 1–53. https://doi.org/10.1016/j.jada.2010.09.005
Yousef, D. (2000). Organizational commitment: A mediator of the relationships of leadership behavior with job satisfaction and performance in a non-western country. Journal of Managerial Psychology, 15(1), 16–24.
Zweben, J. E., & Payte, T. J. (1991). Editors’ introduction: Opioid dependence and methadone maintenance treatment. Journal of Psychoactive Drugs, 23(2), 99–101. https://doi.org/10.1080/02791072.1991.10472225
Abbas, S. G., Qureshi, M. I., Iftikhar, M., Hassan, U., Khan, K., & Zaman, K. (2013). Relationship Between Job Stress, Workload, Environment and Employees Turnover Intentions: What We Know, What Should We Know. World Applied Sciences Journal, 23(6), 764–770.
Abdullah, H. (2009). Major challenges to the effective management of human resource training and development activities. The Journal of International Social Research, 2, 11–21.
Agarwala, T. (2003). Innovative human resource practices and organizational commitment: An empirical investigation. International Journal of Human Resource Management, 14(2), 175–197. https://doi.org/10.1080/0958519021000029072
Ahmed, M., & Nawaz, N. (2015). Impact of Organizational Commitment on Employee Turnover : A Case Study of Pakistan International Airlines ( PIA ). Industrial Engineering Letters, 5(8), 57–70.
Allen, D. G., Shore, L. M., & Griffeth, R. W. (2003). Allen 2003 JofMgt models re POS org commitment etc, 29(1), 99–118.
Allen, N. J., & Meyer, J. P. (1990). The measurement and antecedents of affective, continuance and normative commitment to the organization. Journal of Occupational and Organizational Psychology, 63(1), 1–18.
Ang, S. H., Bartram, T., McNeil, N., Leggat, S. G., & Stanton, P. (2013). The effects of high-performance work systems on hospital employees’ work attitudes and intention to leave: a
multi-level and occupational group analysis. The International Journal of Human Resource Management, 24(16), 3086–3114. https://doi.org/10.1080/09585192.2013.775029
Aslam, H. D., Aslam, M., Ali, N., & Habib, B. (2013). Importance of Human Resource Management in 21st Century: A Theoretical Perspective. International Journal of Human Resource Studies, 3(3).
Baskerville, R., & Pries-Heje, J. (2010). Explanatory Design Theory. Business and Information Systems Engineering, 2(5), 271–282. https://doi.org/10.1007/s12599-010-0118-4
Begum, f. W. (2016). The role of hrm practices in gaining employee affective commitment in manufacturing industries , tiruchirappalli, 7(6), 15–22.
Cafferkey, K., Heffernan, M., Harney, B., Dundon, T., & Townsend, K. (2018). Perceptions of HRM system strength and affective commitment: the role of human relations and internal process climate. The International Journal of Human Resource Management, 1–23. https://doi.org/10.1080/09585192.2018.1448295
Camelo-Ordaz, C., García-Cruz, J., Sousa-Ginel, E., & Valle-Cabrera, R. (2011). The influence of human resource management on knowledge sharing and innovation in Spain: the mediating role of affective commitment. The International Journal of Human Resource Management, 22(7), 1442–1463. https://doi.org/10.1080/09585192.2011.561960
Chew, J., Girardi, A., & Entrekin, L. (1998). Journal of comparative international management. Journal of Comparative International Management (Vol. 8). Management Futures. Retrieved from https://journals.lib.unb.ca/index.php/jcim/article/view/643/1000

93JULY - SEPT - 2019
THE JOURNAL OF INSURANCE INSTITUTE OF INDIA IHRPs
Cho, S., Woods, R., Jang, S., & Erdem, M. (2016). Measuring the impact of human resource management practices on hospitality firms’ performances. International Journal of Hospitality Management, 25(2), 262–277.
Cohen, J., Cohen, P., West, S. G., & Aiken, L. S. (2013). Applied Multiple Regression/Correlation Analysis for the Behavioral Sciences. Routledge.
Coyle-Shapiro, J. A.-M., Kessler, I., & Purcell, J. (2004). Exploring Organizationally Directed Citizenship Behaviour: Reciprocity or “It’s my Job”?*. Journal of Management Studies, 41(1), 85–106. https://doi.org/10.1111/j.1467-6486.2004.00422.x
Dalota, M.-D., & Perju, A. (2006). Human Resources Management and the Company’s Innovation. Romanian Economic and Business Review, 5(4), 122–131.
Das, S; Narendra, P; Mishra, P. (2014). HR Issues in Small & Medium Enterprises. International Journal of Research in Humanities, Arts and Literature, 2(5), 183–194.
Durani, H. A., Trivedi, K. U., & Durani, A. A. (2015). Innovative HR Strategic Practices of Indian and Foreign MNCs. Original Research Journal of Management Research and Analysis, 2(3), 173-176.
Fernandez-Lores, S., Gavilan, D., Avello, M., & Blasco, F. (2016). Affective commitment to the employer brand: Development and validation of a scale. BRQ Business Research Quarterly, 19(1), 40-54. https://doi.org/10.1016/J.BRQ.2015.06.001
Ghiselli, R., La Lopa, J., & Bai, B. (2001). Job satisfaction, Life Satisfaction and Turnover Intention. Hotel and Restuarant Administration Quaterly, 28–37. https://doi.org/10.1016/S0010-8804(01)80036-7
Gracy Vas, E. (2014). Innovative HR Practices: For revival and survival during economic slowdown. IOSR Journal of Business and Management, 2, 50–56.
Gray, D. E. (2009). Principles and Planning for Research. Doing Research in the Real World, 11–38.
Hinkin, T. R., & Tracey, J. B. (2010). What makes it so great?: An analysis of human resources practices among Fortune’s best companies to work for. Cornell Hospitality Quarterly, 51(2), 158–170.
Jaros, S. (2007). Measurement issues in the Meyer & Allen model of organizational commitment. The ICFAI Journal of Organizational Behavior, 6, 7–26. https://doi.org/10.1348/096317906X118685
Joseph, B. (2012). Innovative human resource practices and employee outcomes in software firms in india. In 16th World Congress of the International Labour and Employment Relations Association. ILERA.
Joseph, D. B. (2012). Innovative Human Respource Practices and Employee Outcomes in Software Firms in India. Kochi, Kerala.
Joy, M. M., & Sidhique, F. (2016). A Study on the Impact of Innovative Human Resource Practices on Job Satisfaction of Employees Working in Information Technology Sector. International Journal of Engineering Technology Science and Research, 3(12), 26–29.
Karlsson, J. (2013). The role of HRM in innovation processes. University of Gothenburg.
Kavitha, D. N. V., & Anuradha, T. (2016). Corporate Social responsibility in insurance sector in india. International journal of innovative research & development, 5(2), 137–143.
Kehoe, R. R., & Wright, P. M. (2013). The impact of high performance HR Practices on Employees’ Attitudes and Behaviors. Journal of Management, 39(2), 366–391.
Khan, M. S., Khan, I., Kundi, D. G. M., Khan, D. S., Nawaz, D. A., Khan, F., & Yar, N. B. (2014). The Impact of Job Satisfaction and Organizational commitment on the Intention to leave among the Academicians. International Journal of Academic Research in Business and Social Sciences, 4(2). https://doi.org/10.6007/IJARBSS/v4-i2/610
Khan, R., Naseem, A., & Masood, S. A. (2016). Effect of continuance commitment and organizational cynicism on employee satisfaction in engineering organizations. International Journal of Innovation, Management and Technology, 7(4), 141–146. https://doi.org/10.18178/ijimt.2016.7.4.661
Ko, K. (2009). Multiple Regression Model For Market Capitalization. Journal of Global Business Issues, 3(2), 167–172.
Kooij, D. T. A. M., Jansen, P. G. W., Dikkers, J. S. E., & De Lange, A. H. (2010). The influence of age on the associations between HR practices and both affective commitment and job satisfaction: A meta-analysis. Journal of Organizational Behavior, 31(8), 1111–1136. https://doi.org/10.1002/job.666
Kowalczyk, D. (2015). Purposes of Research: Exploratory, Descriptive & Explanatory - Video & Lesson Transcript | Study.com.
Kumar, M. S., & Archana, P. (2017). Innovative Human Resource Practices : Literature Review And Related Issues, 5(07), 6417–6430. https://doi.org/10.18535/ijsrm/v5i7.77

THE JOURNAL OF INSURANCE INSTITUTE OF INDIA
JULY - SEPT - 201994
SUSTAINABLE GROWTH
Abstract
Though the Indian insurance industry
has a history of more than 150 years,
the benefit of the same is yet to reach
the masses. Things started moving
fast post privatization of the sector in
2000.
The bringing (arrival) of new
regulatory set-up, licensing of new
private companies, the addition
of new distribution channels and
innovative products did their best in
filling-up the gap. However, making
it accessible to the masses that are
spread over the length and the width
of the country and the cost associated thereon are the two challenging issues which continue to challenge the sustainability and inclusive growth of the business. Insurance penetration in India is 3.4% which is much below the global average of 6.5%. It reflects the existence of a huge untapped potential. The rapid growth of ecommerce and the technological innovations have given hope to fill the gap. This study is an effort to understand and showcase how the use of technology can help in increasing insurance penetration thereby ensuring a sustainability and inclusive growth to the sector.
Usage of Technology for Sustainable and Inclusive Growth in Insurance Industry of India
Dr. Pallavi SethAssistant Professor,Amity School of Insurance, Banking and Actuarial ScienceAmity University, Sector -125 Noida. [email protected]
Prof. Manoj PandeyAssociate ProfessorBirla Institute of Management TechnologyPlot No. 5, Knowledge Park-II, Greater [email protected]

95JULY - SEPT - 2019
THE JOURNAL OF INSURANCE INSTITUTE OF INDIA SUSTAINABLE GROWTH
Keywords
Insurance industry, insurance penetration, technological innovation, insuretech, sustainability, inclusive growth.
Introduction
Innovation through new technologies is a key driver of change in the financial sector and this has led to immeasurable efficiency gains even though these changes can initially be accompanied by uncertainty and doubt. In recent years, such innovation has happened as a result of new technological developments with the phenomenon often being described as “FinTech” in general and “InsureTech” in insurance domain. As financial services deal in intangible products, lowering of servicing and transaction cost adds value to the customer and there comes the role of technology. Although this has, in fact, been happening over the history of finance, the recent proliferation of internet connections, home computing, use of smart phones and the applications development, the possibility of entering a market has become easier which has increased the competition in the financial industry.
The insurance sector is not an exception to this. The developments in technology leading to possibilities of reaching to the untapped potential, greater opportunity for data collection leading to better risk identification and product development can help in inclusive and sustainable growth of the insurance sector.
The insurance industry is also trying to tap this space. The online sale of insurance policies is on rise. There has been a good traction in term life, travel
Innovation through new technologies is a key driver of change in the financial sector and this has led to immeasurable efficiency gains even though these changes can initially be accompanied by uncertainty and doubt. In recent years, such innovation has happened as a result of new technological developments with the phenomenon often being described as “FinTech” in general and “InsureTech” in insurance domain. As financial services deal in intangible products, lowering of servicing and transaction cost adds value to the customer and there comes the role of technology.
insurance, motor insurance and even health insurance off late.
Many insurance services which were available only offline earlier are now technology-based such as premiums payment, filing a claim and other tablet-based sales processes where the agents fill in the key and relevant information in the tablet and the system recommends the suitable plans. This also leads to more and better information for the customer and the possibility of improvement persistency.
The use of internet based technology has made it possible for the insurance companies to reach the rural belt of the country to make the simple product available thereby bringing inclusiveness.
This study analyses the usage of technology by the insurance companies in India, various initiatives taken by the insurance companies and the challenges faced by them for the same.
Background of the Insurance Industry of India
Post liberalization, the insurance industry of India has grown a lot. The Indian insurance industry is expected to grow to US$ 280 billion by FY2020. The major reasons for this growth are solid economic growth and higher personal disposable incomes in the country. Premium income of the life insurance segment has increased from 14.04 per cent in FY17 to Rs 4.18 trillion (US$ 64.92 billion). The total insurance market expanded from US$ 23 billion in FY05 to US$ 84.72 billion in FY17. The domestic life insurance industry registered 17.65 per cent y-o-y growth for new business
premium in 2017-18, generating a revenue of Rs 1.65 trillion (US$ 25.44 billion).
The privatization of the industry in year 2000 has added many new dimensions of growth to the industry. As of now, there are 24 life insurance and 33 non-life insurance companies in the Indian market which compete with each other on the basis of product

THE JOURNAL OF INSURANCE INSTITUTE OF INDIA
JULY - SEPT - 201996
SUSTAINABLE GROWTH
differentiation, pricing and servicing parameters to attract customers. Many of them are from a single distribution channel of tied agency. The industry has got a range of distribution and majority of them are now on third party mode. The monopoly of the govt. owned companies has become a matter of past and the new age private sector companies hold 48.01 per cent market share in the general insurance segment and 28.93 per cent market share in the life insurance segment. The ceiling ofForeign Direct Investment (FDI) which was at 26 per cent at the time of opening up of the industry has raised up to 49 per cent in the year 2016, attracting further investments in the sector.
The Insurance Regulatory and Development Authority of India (IRDAI) recently allowed the insurance companies which have completed 10 years of operations to raise capital through Initial Public Offerings (IPOs). At least five private/Govt. owned insurance companies have been listed leading to a new standard of public disclosure and corporate governance. Government continues to be a motivator by allowing a host of income tax related benefits for retail customer and also bringing a series of low cost insurance coverage plan targeted mainly for lower strata of society. In 2015, Government introduced Pradhan Mantri Suraksha Bima Yojna (PMSBY) and Pradhan Mantri Jeevan Jyoti Bima Yojana (PMJBY) to bring more people under the insurance cover. Enrolments under the Pradhan Mantri Suraksha Bima Yojana (PMSBY) reached 130.41 million in 2017-18. A universal health insurance scheme for targeting 100 million poor families for a cover of Rs 500,000 (US$ 7,723) by the name
National Health Protection Scheme (NHPS) has been announced under the Budget 2018-19. This scheme, if implemented successfully in the next few years, has the potential of changing the face of the industry. (A universal health insurance scheme named National Health Protection Scheme (NHPS) has been announced under the budget 2018-19 targeting 100 million poor families for a cover of Rs 500,000 (US$ 7,723).
In addition, some other factors such as increasing life expectancy, favorable savings and greater employment in the private sector are expected to fuel the demand for pension plans.
Technology for Sustainable and Inclusive Growth
Delivering his keynote address on the occasion of National Technology Day celebration on May 11, 2017, the former President Pranab Mukherjee said the following (Mukherjee, 2017):
Sustainable Insurance and Inclusive Growth
The word “sustainable insurance” got wide attention and recognition in 2012 when the United Nations Environment Program–Finance Initiative launched the four Principles for Sustainable Insurance (PSIs) at the UN Conference on Sustainable Development (Rio+20). This initiative was the result of a research by the UN body where they identified ecological, social and governance (ESG) as a new age emerging challenge at the global stage and they expected the insurance fraternity to work for it. The emphasis is on inculcating a culture of having a long term view of the emerging risks so as to help people, business and the then community at large.
The four proposed principles of sustainable insurance expect insurance companies to (Principles for Sustainable Insurance, 2015):
1. Embed in the decision-making environmental, social and governance issues relevant to the insurance business.
2. Work together with clients and business partners to raise awareness of environmental, social and governance issues, manage risk and develop solutions.
3. Work together with governments, regulators and other key stakeholders to promote widespread action across society on environmental, social and governance issues.
4. Demonstrate accountability and transparency in regularly disclosing publicly the progress in implementing the principles.
Sustainable insurance is a strategic approach where all activities in the insurance value chain, including interactions with stakeholders, are done in a responsible and forward-looking way by identifying, assessing and managing as well as monitoring risks and opportunities associated with environmental, social and governance issues. Sustainable insurance aims to reduce risk, develop innovative solutions, improve business performance and contribute to environmental, social and economic sustainability.
Breaking it down to the work station level, it simply means that insurance companies should put their best in spreading awareness about the need of insurance, offering genuine / needed

97JULY - SEPT - 2019
THE JOURNAL OF INSURANCE INSTITUTE OF INDIA SUSTAINABLE GROWTH
product the best possible price, extend customer service for the continuity / persistency and pay the claim in time.
1. Spreading Awareness
One of the known reasons for the under penetration of insurance (low insurance penetration) in India has been the poor financial literacy prevailing among the potential customers. The intent had never been in question in the past, but the platforms were available. Reaching the customer base settled in remote part was a costly affair. The availability of digital / social media has made the life easy and insurance companies are using such platform to spread awareness these days.In a distinct initiative to make different stakeholders, mainly the customers and young students, Bajaj Allianz General Insurance Company has been arranging a series of Google Plus Hangout sessions (Demystifying Insurance)since 2014(Singhel T., Demystify insurance through Google + Hangout. , 2014). These talk shows/panel discussions are being hosted by the CEO of the company on regular intervals. The questions and queries were invited in advance and the panel deliberated on it. The very objective of such sessions was to engage and educate the respondents online.
Insurance companies are now using different social media platforms to get connected with their customer base. They are running specific campaign to get traction and the message reach the targeted audience. The compilation of the data from the website / social media platforms of different insurance companies gives an indication of the growing use of social media which is indeed a technological intervention not available earlier.
Table I: Usage of Social Media by different Insurance Companies
Name Facebook Likes
Twitter Followers
Linkedin Followers
Youtube Subscribers
1. LIC India 6.5 million 33.5k 44,539 1631
2. ICICI Lombard 623k 13.8k 21,956 4598
3. HDFC Life 6.8 million 426k 87452 34,777
4. BAJAJ Allianz 2.3 million 13.9k 210,446 4567
5. Max Life 750K 27.6k 60,787 17,682
6. Reliance Gen. 72,283 9742 15,773 2439
7. IFFCO –Tokio 147k 2916 6273 280
8. PNB Met Life 1million 78.8k 10,362 2831
343k
9. Royal Sundaram 76K 1369 5426 -
10. TATA AIG 100k 241 18,872 -
1110
11. Star Health 3078 6870
( Source : Data compiled looking at the actual figure on 31/01/2018)
A leading private life insurance company
Max Life created on social media two
communities one named “iGenius_ - A
parenting community and the other
‘khushiyonki planning’ (Planning
for the happiness) community. Max
Life, a leading private life insurance
company, created two communities on
social media, one named “iGenius_ - A
parenting community and the other
‘khushiyonki planning’ (Planning for
the happiness) community. The latter
community was about conversation and
engagement for planning of important
life milestones including marriage and
retired life. The users are also facilitated
to have dialogue with the financial
experts on this social medium.
The other leading life insurance
company named Bajaj Allianz Life
(@bajajallianzLIC) has been running a
campaign on twitter with the #tag Life
Goals to promote the concept / sale of
saving oriented Unit Linked policies.
The insurance companies have been
using different kind of campaign even
to address the serious industry issue of
mis-selling.
“Protection gap in India being highest
in Asia, we want to create awareness
about the need for protection and
engage with customers through digital
platforms. Our focus is to create better
service platforms and cater to customer
needs seamlessly, in a way they want
to be served across all channels,”
added Mr. Gopalakrishnan, MD &CEO
of Aegon Life Insurance Company Ltd
– a company known to be a pioneer in
promoting online sales of Term Life
policies in India.
2. On Boarding/Online Sales
The impact of the technology is being
felt positively at the sales / on boarding
process. The predominant mode of

THE JOURNAL OF INSURANCE INSTITUTE OF INDIA
JULY - SEPT - 201998
SUSTAINABLE GROWTH
the sale of insurance policies through
intermediaries is getting challenged by
the direct online sales. Now with digital
disruption, the companies are preferring
to deal with the customer directly.
This necessitates the companies to be
more customer centric in all the levels
of dealing. The B2B2C model which is
there in place may get disrupted soon to
become D2C model.
The companies are gearing up to
provide a seamless platform to the
valued prospective customers to
experience a trouble free / easy way
of getting policies. The documentary
requirements are being kept at minimal
particularly in general insurance
products & the transmission of the
same is being done through mail &
other digital route.
As per Martijn de Jong, Chief Digital
Officer, Aegon Life Insurance Company
“Currently, only two percent of the
population in India buys life insurance
online. But the numbers will definitely
improve in the subsequent years. The
population in India is young. Over 65
percent of the population is under 35.
Also, the national income is growing at
a rate of 7.2 percent in real terms. Apart
from this, there is an extreme hunger
for data. The average data consumption
in India is 1 gigabyte a person a day.
This is extremely high compared to
international standards. And last,
the data is now faster, reliable and
affordable. So the Indian market is ready
for a data- driven online revolution. This
will have a far-reaching impact on the
way insurance services are accessed
and consumed”
China’s first online-only insurer
ZhongAn has completely disrupted the
market. Within a period of three years,
it has acquired 400 million customers
by selling 6 billion policies. The same
is bound to happen in India too. The
market will get disrupted because
people will see that booking insurance
online is as easy as booking a trip.
The technology made it possible for the
train travellers to get personal accident
cover on the online ticketing platform
managed by the Indian Railways. This
short duration policy linked with the
train travel time was absolutely our off
imagination earlier. The entire process
of taking policy, delivery of the policy
document and nomination is digitally
driven and gets completed in a minute.
Acko General Insurance, a Mumbai-
based digital insurance start-up, has
partnered with Ola, a ride-sharing
app, to offer a first-of-its-kind in-taxi
insurance in India. The trip insurance
programme will be first rolled out
for customers in major metropolitan
cities in India and scaled up to all
other cities in the coming weeks.
Customers can purchase an insurance
policy worth INR 500,000 ($7.665)
for INR 1 ($0.015), covering loss of
baggage or laptops, missed flights,
accidental medical expenses, emergency
hotel requirements and ambulance
transportation cover among others.
ICICI Lombard General Insurance Co.
Ltd has ‘IL Insure’, through which
customers are buying and renewing
products in motor, health and travel
categories. It is all digitally driven.
Bajaj Allianz Life Insurance Co. Ltd. has
developed an app called ‘Life Assist’ and
it helps the users view policy details,
claim status, net asset value updates
and fund value.
Aviva India launched a new heart care
product by changing its business model
with a focus on being ‘digital first’. This
product known as Aviva Heart Care was
launched across Aviva’s digital channels
including social media, the company’s
online policy selling website “Instalife”,
its customer portal and mobile app.
In this product, the new business
process is automated by integrating
the online platform with an artificial
intelligence (AI) and machine learning
based auto underwriting system. It is
the first implementation of its kind in
India’s life insurance sector.
This product helped the company to
enrich the customer experience with
its online platform where the customer
receives the acknowledgment on a real
time basis with the delivery of a physical
policy kit within near to real time. With
the help of this product, Aviva is able to
reach the digital savvy customers.
Aviva was able to increase 10 per cent
volume in the new business within the
first six months of the launch of this
product. Moreover, the operational
efficiency of the company has also
improved because of the adoption of
AI-based underwriting process.
“Aviva Heart Care is a niche
opportunity to reach out to acquire a
whole new set of customers and we
are truly adopting the ‘Digital First’
mantra to enhance our customer

99JULY - SEPT - 2019
THE JOURNAL OF INSURANCE INSTITUTE OF INDIA SUSTAINABLE GROWTH
experience,” claimed Mr. Manish
Mimani (Vice President & Head IT of
Aviva Life).
Most insurance companies have
developed mobile apps to help their
sales force conduct a smooth sales
process and have insisted them to adopt
a digital sales process which takes
the prospective consumers through a
series of steps that will help them to
select a product based on the financial
need thereby minimizing the mis-selling
possibilities. Recently, the country’s
largest life insurer, Life Insurance
Corporation of India, launched a mobile
application for agents and customers.
The application will enable them to
calculate and compare premium of
life insurance plans and pay premium
online. The app will also help the
agents to store sales figures, maintain
a premium calendar and customer
directory and provide notifications for
premium due dates and lapsed policies
along with alerts for customer birthdays
and circulars.
Subrat Mohanty, EVP, Strategy and
Customer Relations, HDFC Life,
claimed: “Most of agents have moved
to selling through digital means (laptop
or tablet) and only 20 per cent of
agents are selling through pure offline
modes” .According to Mr. Mohanty,
the turnaround time for conversion of a
sale through the online mode is just one
day as the entire process is streamlined
while in the offline mode, it typically
takes around 7 days.
ICICI Prudential too is encouraging
most of its distributors to use digital
means to sell insurance. Sandeep
Bakshi, MD and CEO of ICICI Prudential
said “With the adoption of technology,
the insurer has seen a new set of agents
emerging. It has disrupted the whole
league table where we have seen some
agents who were not featuring suddenly
go up the curve,” he said. According
to Bakshi, digitisation has helped the
insurer in improving overall productivity
of their agents by 10-15 per cent.
Reduction in Mis-selling
Insurers feel that the main advantage of
digital sales is that the consumer can
view the product literature and make
quick decisions. It also ensures that
there is no room for ‘false’ promises by
the agent. With the help of technology,
the overall connect with the customer
has improved because he / she is an
active participant in the entire buying
process. In this process, they actually
buy a solution of their agenda / goal
rather than buying a product from the
company.
Aegon Life Insurance Company Ltd is
eyeing over 100 per cent growth in the
number of policies sold and premium
income earned through the online
channel this year, a top official said.
This private life insurer, who is now
focused only on the online channel,
wants to be a leading player in digital
insurance, mainly focused on term
covers. It may be recalled that Aegon
Life had done away with both the
agency and bancassurance channels
and decided to focus only on the digital
channel.
Cost advantage
A digital avenue helps insurers save on
various operational costs. This saving
is being passed on to customers in the
form of discount in premium.
“Usually, commission for term plans
is around 30% of premium while for
unit-linked insurance plans (Ulips),
it is 5-10%. The premium difference
between offline and online is 35-40%.
Even in auto insurance, the difference is
15-20%,” said Mahavir Chopra, head–
health, accident and life insurance,
Coverfox.com, a policy comparison site.
3. Customer Service
As insurance means protection against
the uncertainties and the uncertainty
The impact of the technology is being felt positively at the sales / on boarding process. The predominant mode of the sale of insurance policies through intermediaries is getting challenged by the direct online sales. Now with digital disruption, the companies are preferring to deal with the customer directly. This necessitates the companies to be more customer centric in all the levels of dealing. The B2B2C model which is there in place may get disrupted soon to become D2C model.

THE JOURNAL OF INSURANCE INSTITUTE OF INDIA
JULY - SEPT - 2019100
SUSTAINABLE GROWTH
can happen anytime, so the insurer
should also be available 24 x 7. The
digital technology has made it possible
for the insurance companies to be at the
service of the customer 24X7. Insurance
companies have launched the customer
service mobile applications that allowed
a customer to conduct all insurance
related transactions on the go. These
applications provide a number of
services that one could avail, and these
include the following:
• Getting premium quotes on various
products;
• Getting instant information about
branch and network hospital
locations;
• Getting a status update about a claim
or policy;
• Knowing claims procedure details;
• Getting policy soft copy; and
• Purchasing insurance online.
Reduction in Turn Around Time
The use of appropriate technology has
reduced the TAT for majority of the
customer service related tasks. As per
Mr. Manik Nangia, director of Marketing
and chief digital officer of Max Life in
“Max Life’s digital endeavour begins
to pay rich dividends” , the digital
initiatives have increased productivity
for the company, and three-fourth of
the policies are issued in two days. Max
Life is also sharing educational videos
through messaging platforms like
Whatsapp groups. He also mentioned
that digital platform has helped in
reducing the friction with the customers
that used to exist earlier. Now, with the
help of Permanent Account Number
(PAN), the insurance company doesn’t
require salary slips.
A major complaint against insurers is
that once a policy is sold, the customer
is forgotten. Social media has changed
that to an extent. Most insurers have
Facebook and Twitter accounts which
are a platform to receive complaints and
to promote new products or features.
Many of the insurance companies have
introduced “Chatbot” in their customer
service area and the same is giving
great response. For example Bajaj
Allianz General has a chatbot named
“Boing” which helps the customer in
their time of need. They even have
a tweeter enabled platform with the
name #tweetinsurance to interact with
customers“ As a practice, we ensure
that customer queries received on
business days are responded to within
30 minutes across Facebook, Twitter or
other online platforms,” said Sanjeev S.,
head, marketing and e-channel, ICICI
Lombard General Insurance Co. Ltd.
Fair pricing
Motor insurance continues to be the
biggest line of business for the general
insurers of India. The pricing of these
policies has all along been done on
the basis of the “model and year of
make”. Earlier, the insurance companies
were using only “one for all” kind of
pricing approach instead of giving due
recognition and reward to those who
have better risk profile in terms of good
driving skill. The digital technology has
made it possible to do an in-depth risk
analysis & charge differential premium
using telematics in motor policy
pricing. Bajaj Allainz General is one
such company which has offered this
option to its customer. A policyholder
having got categorized as “safe driver”
by the app based on his /her driving
skills / habits can be extended a better
premium rate. .With this mobile app, the
customer too can monitor his driving
patterns and improve driving skill.
Along with the telematics platform, the
app also facilitates customer self-service
ability like 24 x 7 roadside assistance,
battery and engine health, etc. This app
empowers the customers and helps
them to take precautionary measures
and also provides easy assistance in the
event of an accident.
Similar kind of reward system is in place
of the retail health insurance policy
offered by Aditya Birla Health Insurance
Company. Aditya Birla Health Insurance
Company has also offered similar kind
of reward system in its retail health
insurance policy. Here, they encourage
the policy holders to use “wearable”
devices so as to monitor the life style
of the customer & offer discount on
renewal.
ICIC Lombard, a leading general
insurance company, has deployed
telematics solution for some of its
corporate clients to minimize marine
cargo losses. The system is in place to
monitor the movement of trucks on real
time basis using embedded technology.
4. Claims Settlement
The very basic foundation of the
insurance business is trust. It sells a
promise which is to be delivered at the

101JULY - SEPT - 2019
THE JOURNAL OF INSURANCE INSTITUTE OF INDIA SUSTAINABLE GROWTH
time of loss with utmost transparency.
Unfortunately, the perception has
always been a bit negative for insurance
companies on this front. One of the
reasons had been the late settlement
of the claim. However, the technology
has made it possible to make an
improvement on this front.
On the spot (OTS) is a technology
based initiative of Bajaj Allianz General
Insurance for involving the customers
in the process of settlement of their
motor claim to the limit allowed by the
insurance regulator IRDAI. All that a
customer has to do in case of, say, a
car accident (motor insurance) is to
download the company’s self-service
app and click photographs of the car as
directed by the app.
IFFCO Tokio General Insurance
Company has a similar app, Quick Claim
Settlement (QCS), a hassle free scheme
for motor claims.
The customer has to register the
claim with the QCS team through the
Company’s Call Centre. The documents,
photographs and video of the damaged
car would also be uploaded by the
customer through a mobile app. Once
the claim is approved, the claim amount
would be digitally transferred to the
customer’s bank account within 30
minutes.
Quick Claim Settlement has been built
on a hybrid mobile application which
can work on both ios and Android
platform, along with video upload.
“There is also a provision for obtaining
customer consent on mobile app
along with customer signature on the
device” R Kannan, Executive Director,
IFFCO Tokio said.
Faster processing
Artificial Intelligence & Block chain
technology have started making inroad
in Indian insurance sector too. Bajaj
Allianz brought in a latest solution
based on these two technologies by
the name #TravelEzee. Travel Ezee is a
travel insurance app which facilitates
the customer in buying travel insurance
policies and help in settlements of the
claim arising on account of delay in
international flights. The customer just
needs to scan his boarding pass and
passport using the app, then select the
plan and make the payment. The policy
copy is sent to the registered email
instantly. “We have built a Block chain
platform for this app and have tied up
with a third-party travel flight aggregator
that provides all the information and
data related to flights, airports and
destinations globally. This allows us
to act proactively with travel claims
even before the user makes the claim
request” shared Mr. Sourabh Chatterjee,
BAGICs Head–IT, Web Sales and Digital
Marketing at the time of its launch.
Digital innovations are also affecting
the way claims are settled in health
insurance industry. Remedinet
Technologies Pvt. Ltd provides a
system through which health insurance
claims are processed on cloud-based
platforms. This helps in reducing the
errors and also makes the system more
transparent as one can see the data
on the platform with timestamps and
history. “With such technology in place,
cashless claims get passed in 3-4 hours
while reimbursement claims take up to
4-6 weeks,” said Kapil Mehta, executive
director, SecureNow Insurance Broker
Pvt. Ltd.
Without a cloud based platform,
cashless claims are generally sent
through e-mails, and can take 6-8
hours, or more, to get passed,
depending on the insurer’s response
time.

THE JOURNAL OF INSURANCE INSTITUTE OF INDIA
JULY - SEPT - 2019102
SUSTAINABLE GROWTH
Inclusiveness in Insurance
Although inclusive growth can
often times be interchangeable with
definitions of pro-poor growth, it is
actually a broader concept. Inclusive
growth allows opportunities for
everyone to participate in the growth
process while making sure that
benefits are shared. Given that the
poor face challenges that impair their
conditions and limit their opportunities
to be inclusive, growth should
benefit everyone while reducing the
disadvantages faced by the poor,
both in terms of benefits enjoyed
and, especially, in terms of access to
opportunities for participation.
The inclusiveness in insurance simply
means providing appropriate insurance
solution to those who have been left till
date. The reason for exclusion could be
many such as awareness, availability,
trust factor, distribution/servicing cost and even non-affordability in some of the cases. According to the India General Insurance–Vision 2025 report of FICCI released in October 2013, the penetration of insurance in retail segment was still in the single digit percentage in home insurance, cattle insurance and farm insurance. Cattle and farm insurance relates directly to the rural belt which has remained neglected due to high distribution cost & also because of the distance.
Penetrating to low tier cities and rural areas
(Insurance Penetration in low tier cities and rural areas)
Insurance companies are using the government promoted e-governance
based common service center (CSC)
network for the sale of pre-underwritten
simple/small ticket size in rural belt. The
entire platform is built on leveraging
e-channel and works under the public
private model. This arrangement has
made it possible for rural people to get
policies and services at their village/
panchayat level. It also provides a
remunerative earning potential to
educated rural youth in the form of a
rural authorized person (insurance sales
person).
The higher distribution cost because
of the dispersed geography coupled
with the low volume of business has
made the rural part of India an unviable
business proposition for the insurance
companies. Many insurance companies
are now adopting tech based mobile
solution to take care of the requirement.
Bajaj Allianz General Insurance Co
had been a leader in this initiative. It
launched the concept of virtual Office
in August 2014. It can even be termed
as a mobile tablet office or tablet office
on move. The tablet enables the sales
office to access relevant information
pertaining to a policy, its features, policy
issuance, payment, etc. at the click of
a button at the customers’ doorstep.
The tablet also has the feature to upload
documents which can directly be sent
to the offices via image mailing for
decision-making. The detachable dongle
also provides multiple online payment
options. This entire model is transparent
and handled by company employee.
It helps not only in the reduction of
the cost, but eliminates the possibility
of fraud also.In 2016, this business
initiative sold over 6 lac policies with a
premium income of more than INR243
crore (million US$ 37.4) from 833 new
locations across India.
Fulfilling inclusive agenda
Inclusive growth allows opportunities
for everyone to participate in the
growth process while making sure that
benefits are shared. In its endeavor
to reach the people at the bottom of
the pyramid, insurance companies
have partnered in Government
of India sponsored schemes like
PradhanMantriSurakshaBimaYojana
(Prime Minister Safety Insurance
Scheme)–a part of the ambitious
financial inclusion agenda of the present
ruling government, thereby providing
INR 2 lac (approximately US$ 3,000)
worth personal accident policy to all
eligible bank account holders. The
entire scheme is technology driven on
bancassurance platform.
Insurance companies are also a major
stakeholder for the crop insurance
scheme- Pradhan Mantri Fasal Bima
Yojana (Prime Minister Crop Insurance)
which has proved to be another game
changer in the industry. The entire
service process is digital driven with
the inclusion of the use of remote
sensing and drones for pricing & claim
settlement.
Way Forward
With rising disposable income,
technological advances & vast untapped
potential, India has been identified
as a bright spot in global business
landscape. With around 17 % of global
population and a contribution of mere

103JULY - SEPT - 2019
THE JOURNAL OF INSURANCE INSTITUTE OF INDIA SUSTAINABLE GROWTH
1.5 % of global insurance premium
– Indian insurance market looks even
brighter. The strong pitch from the
government for digital based financial
inclusion has given a strong fillip to the
agenda of providing insurance benefit
to the masses who have remained
uninsured.
The distribution, customer centric
product & prompt claim settlement
are the three crucial areas which
have the key to the sustainable &
inclusive business growth in insurance.
Distribution outside large & tier 1 cities
is poor. Having a full fledged office set
up has not been found financial viable
by insurance companies. The developing
e-infrastructure & the growing use /
acceptability of third party based sales
/ servicing set-up is coming to its age.
They are working as the extension
offices of reputed companies. The
technology has made it possible for two
of the new age companies incorporated
recently not to think of offices in real
sense. They intend to manage their
business through smart phone mode
only. The concept of “virtual office” is
also gaining ground.
Technological breakthrough and data
driven insights are bound to transform
the way industry works on product
development. Now people are having
a personal accident cover even on a
5km ride on Ola, a product almost
unthinkable a year back. As of now,
majority of the technology which we
hear about including AI / Drone / IoT /
Wearable / Remote sensing e.t.c. are
about to explode & that would bring a
sea change the way claims are settled in
the coming days to bring the trust factor
to the industry.
Reference
5 advantages of insurance going
digital. Retrieved (July 5,2017)..
https://www.livemint.com/Money/
rmXdavs1xczmrxh00DRryK/5-
advantages-of-insurance- going-digital.
html
Aegon Life keeps its faith in digital
channel. Retrieved (Feburary 05, 2018).
https://www.thehindubusinessline.
com/money-and-banking/aegon-life-
keeps- its-faith-in-digital-channel/
article9741232.ece
Aegon Life moving towards a digitally-
enabled omni-channel distribution
model.https://www.aegonlife.com/
company/media-center/press-releases/
aegon-life-moving- towards-digitally-
enabled-omni-channel
https://techcrunch.com/2017/05/24/
acko-is-an-ambitious-digital-play-to-
disrupt-indias-10b- insurance-industry/
Bajaj Allianz General Insurance
Company. (2016). retrieved (May 15,
2017)https://www.bajajallianz.com/
Corp/content/Annual_Report_2015-16.
Bajaj Allianz General Insurance
Company Ltd. (May 23, 2016). retrieved
(May 29, 2017) https://www.bajajallianz.
com/Corp/content/aboutus/press-
release/Tweetinsurance-Press- Release.
Bajaj Allianz General
Insurance Company Ltd. Technology
and telecommunications professional
indemnity insurance. Retrieved (May
23, 2017) https://general.bajajallianz.
com/Corp/content/commercial-
insurance/financial-lines/policy-
wordings/technology-telecomm.pdf
Bajaj Allianz General launches
‘TweetInsurance (May 23, 2016).
retrieved (May 27, 2017) http://
www.business-standard.com/
article/companies/bajaj-allianz-
general-launches-tweetinsurance-
116052300635_1.html
Bajaj Allianz initiates rural welfare move.
(August 5, 2013). retrieved (April 22,
2017) http://www.dailypioneer.com/
state-editions/ranchi/bajaj-allianz-
initiates-rural-welfare- move.html
Claims Awards Asia: An inspirational
win for Bajaj Allianz. (September
8, 2016). retrieved (April 5, 2017)
http://www.postonline.co.uk/post/
news/2459954/claims-awards-asia-an-
inspirational-win-for-bajaj-allianz
Demystify insurance through Google +
Hangout. (July 3, 2014). retrieved (May
23, 2017) http://lighthouseinsights.
in/bajaj-allianz-ceo-tapan-singel-
demystifyinsurance-google- hangout.
html
For life insurance agents, digital is the
new policy.(retrieved Feburary 02,2018).
https://www.thehindubusinessline.com/
news/For-life-insurance-agents-digital-
is-the- new-policy/article20767131.ece
Going digital is the fourth industrial
revolution. (January 17, 2017). retrieved
(April 5, 2017) http://www.forbesindia.
com/printcontent/45395
Jain M.(2016).retrieved
(March 11, 2017)

THE JOURNAL OF INSURANCE INSTITUTE OF INDIA
JULY - SEPT - 2019104
SUSTAINABLE GROWTH
http://www.cioreviewindia.com/
magazine/Demystifying--Rural-
Insurance-with-Digital- Technology-
RYSS162625359.html
How Aviva Life Insurance gained
new business with a heart care app.
Retrieved (January 5, 2018). http://
www.cio.in/case-study/how-aviva-life-
insurance-gained-new-business- heart-
care-app
IFFCO Tokio General Insurance launches
30 minutes Claim Settlement Service.
Retrieved (February02, 2018).https://
cio.economictimes.indiatimes.com/
news/mobility/iffco-tokio-general-
insurance-launches-30-minutes-claim-
settlement-service/60778861
Indian Insurance Industry Overview &
Market Development Analysis.Retieved
(Feburary 2018).https://www.ibef.org/
industry/insurance-sector-india.aspx
Now, settle insurance claims on
your own via Bajaj Allianz app.
retrieved (June 2017) http://www.
thehindubusinessline.com/money-and-
banking/bajaj-allianz-general-insurance-
sharpens-customer-focus-with-tech-
solution/article7864533.ece
https://www.oecd.org/finance/
Technology-and-innovation-in-the-
insurance-sector.pdf Address by
the President of India, ShriPranab
Mukherjee on the occasion of National
Technology Day VigyanBhavan:
May 11, 2017 .retrieved (May
29, 2017) http://pib.nic.in/newsite/
PrintRelease.aspx?relid=161713
Remedinet partners with Bajaj Allianz
for cashless health insurance. retrieved
(April 20, 2017) http://ehealth.
eletsonline.com/2015/09/remedinet-
partners-with-bajaj-allianz-for-cashless-
health- insurance/
Singhel T.(2016).Future of general
insurance industry. retrieved(May 20,
2017) http://support.bajajallianz.com/
mytake/index.php/articles/future-of-
general-insurance- industry/.[Accessed
on 20th May 2017]
Singhel T.(2016).Industry. Industry’s
growing obsession towards
transformation. retrieved(April 2017)
http://support.bajajallianz.com/mytake/
index.php/articles/industrys-growing-
obsession- towards-transformation/
Singhel T. (2015).Industry today
needs simple de-jargonized products:
TapanSinghel.retrieved(April 11, 2017)
http://economictimes.indiatimes.com/
industry- today-needs-simple-de-
jargonized-products-tapan-singhel-
bajaj-allianz-general- insurance/
tomorrowmakersshow/48710930.cms
Singhel T. Women safety and security initiatives by Bajaj Allianz General Insurance Company. (video file). retrieved (April 23, 2017)
https://www.youtube.com/watch?v=h4r9oY-hjus
Max Life’s digital endeavour begins to pay rich dividends.retrieved (August 10,2017).
https://www.livemint.com/Technology/
O1rINf7Jt1X3MfnXKp60oM/Max-Lifes-
digital- endeavour-begins-to-pay-rich-
dividends.html retrieved(April 12,2017)
http://www.gadgetsnow.com/tech-news/
Ola-partners-with-Bajaj-
Allianz-to-offer-motor-insurance-to-
drivers/articleshow/51589572.cms
retrieved(April 3, 2017)http://www.
voicendata.com/bajaj-allianz-wireless-
technology-pos- services-policy-
issuance-claim-settlement-key-drivers/
Technology is Changing Marketing:
AnishaMotwani, Max Life Insurance.
Retrieved (January,2, 2018).http://www.
cio.in/feature/technology-changing-
marketing-anisha-motwani-max-life-
insurance
Telematics can reduce car
insurance premium.(November
14,2014).retrieved(May 8, 2017)
http://www.livemint.com/Money/
U7IFBXbtkf28C0usCJWPjJ/Telematics-
can-reduce- car-insurance-premium.
html
The Enterprise for Health Care.
(September 24, 2015). Health Insurance
976
Technology’s benefits for crop
insurance.(February 22, 2017).
retrieved(April 15, 2017)http://
www.livemint.com/Opinion/
SHgZSBSddlGfw6UfmaIzoN/
Technologys-benefits-for-crop-
insurance.html

105JULY - SEPT - 2019
THE JOURNAL OF INSURANCE INSTITUTE OF INDIA ULIP
Abstract
Purpose: The present study attempts to assess the assumption of Normality which is said to be present in any stock market related data by default.
Methodology: The present paper covers top five private Insurance companies of India, namely, Aditya Birla Sun Life Insurance, Future Generali Life Insurance, HDFC Standard Life Insurance, PNB Met Life Insurance & SBI Life Insurance. Of the stated companies, 35 funds were selected, keeping in mind the portfolio composition of selected funds that they consist of more than 80 percent of equity. The research period is being taken as 1st April 2010 to 31st March 2018. The data were collected from the
Websites and the disclosed statistics of NAV of the companies.
Findings: An ironical finding of the paper is that the normality is mere an assumption, it’s a myth. Our study successfully concludes that in case of Unit Linked Insurance funds with more than 80 percent equity portfolio composition do not have a normal distribution.
Limitations/Future Research: This study is restricted only to the ULIPs and no other insurance plans nor any kind of mutual fund is considered for the study, moreover, it takes only those funds that have an equity composition of more than 80 percent. The study paves a way to future researches by giving this area a foundation research platform in the field of normality of data.
A Critical Study of Normality of Unit Linked Insurance Funds Managed by Insurance Companies in India
Dr. Hitesh NasaGuest faculty, Department of Accountancy and Statistics, MLSU, Udaipur (Rajasthan)[email protected]
Dr. Poonam Talreja NasaPost- Doctoral Fellow, ICSSR Department of Banking & Business Economics, MLSU, Udaipur (Rajasthan)[email protected]
Prof. P. K. SinghHead, Department of Banking & Business Economics, MLSU, Udaipur (Rajasthan)[email protected]

THE JOURNAL OF INSURANCE INSTITUTE OF INDIA
JULY - SEPT - 2019106
ULIP
Contribution/Value Addition: The study makes a significant contribution to the literature on the subject. Its findings are expected to be useful to marketing scholars, practitioners, researchers and policy holders.
Keywords
ULIPs, NAV, Portfolio, Normality.
Introduction
The present research paper aims at critically analyzing the normality of data with reference to the data of ULIP for NAV. Unit Linked Insurance Plans are a perfect blend of insurance and investment feature thus cannot be parted with the key components of the stock market. How an investor invests in the market is largely influenced by stock indices of BSE. The present research work is of immense importance as few of the previous researches did not bother to discover the normality parameter in their studies and this phenomenon was taken as a dormant factor but the fact is that data which is relevant to stock market can never have normal distribution. As the scope of the study being ULIP, NAV are directly related of stock market. Normality is a parameter to define the credibility and origin of data. In statistics, normality tests are used to determine which data set is well modeled by normal distribution and to compute how likely it is for a random variable underlying the data set to be normally distributed. To reach proper conclusions this fact must be primarily kept in mind.
Review of Literature
(Lahmiri, Bekiros, Stavroyiannis, & Babalos, 2018)1 Researcheres in their research work evaluated the fractional persistence parameter of the temporal dynamics for the volatility series of Islamic, socially responsible and
common investment indices related to the world major international stock markets. Long-range memory in volatility is measured under different types of market randomness, namely distributional specifications wherein the stochastic error components follow normal and non-normal patterns.
(Raval, 2013)2 in his study, stated that for an individual or an institution, it is not possible to keep watch on the movement of the stock market because of time and skill constraints. To remove these constraints, the professional financial intermediaries have emerged. Recently a new product has come into the mutual fund market to get the advantage of market movement. It is known as ETF(Exchange Traded Fund). The researcher has compared performance of Kotak-Sensex ETF and ICICI Pru-Sensex ETF for the period of 12 months i.e. from April 2011 to March 2012 using analysis of monthly return and concluded that there is no significant difference in return of both the funds.
(Nagarajan, Ali, & Sathyanarayana, 2013)3 Indian insurance industry recorded several milestones in the past hundred years. Currently, it has grown tremendously, with stringent regulatory framework protecting the interests of the investors. Life Insurance Corporation of India is a public sector undertaking, which is the market leader, in life insurance sector. A descriptive study was conducted on Unit-Linked Insurance Plans (ULIP) by selecting top five private insurance companies in India.The performance of all the products were tested for their dependency on the performance of stock market using the hypothesis. ROR and Annualized ROR were used as tools for data analysis and correlation with t-test was used for testing the
hypothesis. From the study, it can be concluded that Reliance Life has good returns for the investors, and can be further improved. At the same time, the company has to understand the product of its competitor (PNB Met Smart), which is performing better.From the study, it was made clear
The present research paper aims at critically analyzing the normality of data with reference to the data of ULIP for NAV. Unit Linked Insurance Plans are a perfect blend of insurance and investment feature thus cannot be parted with the key components of the stock market. How an investor invests in the market is largely influenced by stock indices of BSE. The present research work is of immense importance as few of the previous researches did not bother to discover the normality parameter in their studies and this phenomenon was taken as a dormant factor but the fact is that data which is relevant to stock market can never have normal distribution. As the scope of the study being ULIP, NAV are directly related of stock market.

107JULY - SEPT - 2019
THE JOURNAL OF INSURANCE INSTITUTE OF INDIA ULIP
that Reliance Health + Wealth Plan is performing better than SBI, ICICI, and Bajaj Allianz, but below the performance of PNB Met Smart One. It is notable that, the products offered by PNB MetLife and Reliance Life Insurance are not affected by the market conditions, and are performing consistently. This shows the research efforts put on by both the organizations in developing new products for its customers have significant positive results, hence good investment option for the Investors looking for better returns.
(Samajpati, 2013)4 in his research paper “Performance appraisal of unit-linked insurance plans (ULIPS) in India: a case study” has analysed the performance evaluation of ULIPs through risk-return analysis, Treynor’s Ratio, Sharpe’s Ratio and Jensen’s Measures. The schemes selected for study were ICICI Life Stage RP-Maxi miser (Growth) Fund, Bajaj Allianz. New Family Gain-Equity Index Fund II and ING High Life Plus-Growth Fund. The results of performance measures suggested that all the three ULIPs schemes have outperformed the market. Among the three schemes, ING Vysya ULIP was the best performer.
(Arora, 2012)5 studied, for evaluating the performance of mutual funds include many parameters such as measuring fund performance, measuring return, measuring risk,risk-adjusted return, comparing fund performance with a reference and various another standardized performance system. Comparison of some top equity diversified open-ended mutual funds with BSE Sensex. It showed that there was the insignificant difference between mutual funds return and Sensex. Though these equity diversified mutual funds are said to actively
manage portfolios, but they failed to outperform the market instead of their active management by experienced fund managers.
(Gupta, 2012)6 the investigation was done by researcher whether current ULIP products were insurance products or investment products after guidelines of September 2010. The analysis was done on ULIP plans of top ten life insurance companies using the discounted cash flow model, that gave the unadjusted rate of return and mortality adjusted rate of return for a policy. The ULIP plans were categorized as Type 1 and 2. In Type 1 plans the benefit payable on death is the higher of sum assured or the fund value, whereas, in case of Type 2, it is the total of the sum assured and the fund value. He found that Type 2 ULIP plans had more insurance content as compared to Type 1 plans but still there is a long way to go for increasing the insurance content after implementation of new guidelines.
(Lakhani, 2012)7 had conducted a research study to identify the relation between returns and Sensex, investors’ preference for ULIP and Equity, growth and penetration of ICICI Prudential and the performance of some of its ULIP schemes. The major finding of this study was that the NAV for equity-based fund options moves in tandem with Sensex while for debt based fund options it is not much affected by the movement of Sensex.
(Prajapati & Patel, 2012)8 worked out that some selected mutual fund companies have positive return during 2007 to 2011. HDFC and Reliance mutual fund has performed well as compared to the Sensex return. ICICI Prudential and UTI mutual fund have a lower level of risk compared to HDFC
and Reliance mutual fund. Beta is less than one of all selected mutual fund companies which means the funds are less volatile than the Index. Funds with a beta close to one means the fund’s performance closely match the benchmark index. Sharpe’s Index of HDFC Mutual fund is higher than the other, so it shows good performance compared to other funds. Treynor’s Index result revealed that the HDFC and Reliance mutual funds offer a better return in comparison to ICICI Prudential, UTI, and Birla mutual funds for the same level of risk exposure.
(Karuna, 2009)9 observed that traditional life insurance plans offered by LIC took care of only the insurance needs of people. However, with the ever-changing demands of customers, a new product called ULIP was launched which combines the benefits of insurance, investment, and tax benefits. The key findings of this article were: The ULIP expenses are categorized as annual expenses and fund management charges out of which a major share goes towards agents’ commission. On account of this, the agents push ahead the sale of ULIPs. To curb such malpractices, IRDA has made it mandatory for a policyholder to sign a document stating that they have fully understood the terms of the policy and the costs associated with it. ULIPs are better suited to investors, who have 15-20 years, as their time horizon. This helps to spread the expenses over the longer period and reap the benefits. When the stock markets tumbled below 10000 mark, many people who had directly invested in the stock market and also the ULIPs faced a fall in the value of their holding. This led to falling in demand for ULIPs. However, she pointed out that this was the right

THE JOURNAL OF INSURANCE INSTITUTE OF INDIA
JULY - SEPT - 2019108
ULIP
time to purchase the ULIP as low NAV will help to acquire a high number of units. Hence ULIP is a good investment vehicle for those people, who try to understand its features and are ready to wait patiently to take advantage of the market situation by opting for switch option.
(Jeevananthan & Sivakumar, 2006)10 Mutual funds are money managing institutions, set up to professionally invest the money pooled from the public. These schemes are managed by Asset Management Companies (AMC), which are sponsored by different financial institutions or companies. Looking into the Indian economy the GDP is growing at the rate of 7–9 percent in last few years. These indications show that there is a growth in Indian stock market. Taking into the picture from 2001–2010, the Indian stock market has risen by almost by 6 times. The Indian mutual fund industry is dominated by the Unit Trust of India, which has a total corpus of Rs. 700 billion collected from more than 20 million investors. This growth has attracted investors to invest in the Indian stock market through FIIs and DIIs. The Stock Market is influenced by many factors like production, monsoon, climate, forex, political situation, demand, supply, GDP, etc.. It is very much important for the traders and the investors to identify the trend of the market before taking any investment decisions, even though fundamental and technical analysis are the major tools for any investors and the traders to make decision before investing money in the stock market. The researcher has tried to identify the major market trend by analyzing the net buying and net selling activities of the mutual funds in India. The researcher used the historical data of mutual funds activities of Indian stock market, which was collected
from January 2006 to March 2011. With this data, the researcher tries to analyze, whether one can find any prior indication of trend for short, middle and long-term or whether one can get any trend reversal indication.
(Muthappan & Damodharan, 2006)11 in his research paper “Risk-Adjusted Performance of Indian Mutual Funds Schemes” evaluated 40 schemes for the period April 1995 to March 2000. The study identified that majority of the schemes earned returns higher than the market but lower than 91 days treasury bill rate.
(Chander, 2002)12 in his research paper “An Evaluation of Portfolio Performance Components Across Fund Characteristics” examined 34 mutual fund schemes with reference to the three fund characteristics with 91-days treasury bills rated as risk-free investment from January 1994 to December 1997. Returns based on NAV of many sample schemes were superior and highly volatile compared to BSE Sensex.
Objectives
1. The key objective of the research paper is to identify the presence of normality element in data pertaining to ULIP plans.
2. To identify the pattern of NAV of ULIP Funds
3. To study the nature of equity plans with regard to normality.
Hypothesis
The following Hypothesis was formulated for testing:
H01: Equity linked Indices and NAV of ULIP funds have symmetrical distribution in practice.
H01a: The BSE Indices have symmetrical distribution in practice.
H01b: The NAV of ULIP funds has symmetrical distribution in practice.
Research Methodology
The research paper is based on secondary data collected from the 5 leading insurance sellers which dominate the Indian market namely,
1. Aditya Birla Sunlife Insurance
2. Future Generali Life Insurance Co. Ltd
3. HDFC Life Insurance Co. Ltd
4. PNB MetLife Insurance Company Limited
5. SBI Life Insurance Co. Ltd.
A set of 35 funds with equity composition of more that 80 percent is taken for study. Statistical tools such as correlation, Lillifer’s test, Doornik test, Shapiro-Wilk W and Jarque Bera tests were applied to check the normality of the data, which conclude that normality cannot be a significant characteristic of any kind of stock market data.
For the purpose of analysis of data, MS-Excel & Gretl softwares are used researchers processed the data into log, antilog, and inverse using MS Excel and checked the normality of data using Gretl software but no satisfactory results could be obtained, therefore finally data was converted into log to eliminate the effect of time and, with assumption that it is close to normality.
Data Analysis and Results
The fluctuations in the stock market are very high & unpredictable. Though investors use these indices and their movement to predict market movement but these predictions are reversely correlated. Such a high volatality has been experienced by Indian stock market many a times. For example “The

109JULY - SEPT - 2019
THE JOURNAL OF INSURANCE INSTITUTE OF INDIA ULIP
BSE Sensex, which shot up to 21000
points came crushing downward to
8335 on 12 March 2009. This greatly
affected the NAV, across all theproducts
and plans of various financial
institutions”. For this reason, common
investor has great fear in funds and this gives an opportunity to mutual funds to act on behalf of the investors.
Net Asset Value (NAV) of unit linked
insurance plans are declared by the
Birla FGI HDFC PNB SBI
ULIP Fund Count 7 5 14 5 4
0
2
4
6
8
10
12
14
16
Sele
cted
ULI
P Fu
nds
Equity -ULIP Funds
Figure1.1 Selected ULIP Funds from 5 Life Insurance Companies
Table 1.1Selected ULIP Funds from 5 Life Insurance Companies
Life Insurer ULIP Fund Count
Aditya Birla Sunlife Insurance 7
Future Generali Life Insurance 5
HDFC Life 14
PNB Metlife 5
SBI Life 4
Grand Total 35
insurance companies on daily basis
for different policies. ULIP fund is the
combination of debt and equity, for the
purpose of analysis, daily NAV of 35
selected ULIP funds from 5 selected
insurance companies having more
than 80 percent equity in portfolio is
considered for a period of 9 years. To
check normality of the data associated
with the market. The analytical design of
the paper is developed by giving proper
consideration to all available facts &
figures.
Annual reports of insurance companies
have been source for secondary data
collection. As stated earlier, the focus of
the study was centered at 35 ULIP funds
of the selected insurance companies,
the tabular & graphical representation of
the same with bifurcation is as under:

THE JOURNAL OF INSURANCE INSTITUTE OF INDIA
JULY - SEPT - 2019110
ULIP
The fluctuations in the stock market are very high & unpredictable. Though investors use these indices and their movement to predict market movement but these predictions are reversely correlated. Such a high volatality has been experienced by Indian stock market many a times. For example “The BSE Sensex, which shot up to 21000 points came crushing downward to 8335 on 12 March 2009. This greatly affected the NAV, across all theproducts and plans of various financial institutions”.
The above graph and table depict the researchers classification of funds from the sample of 5 insurance companies. The distribution of 35 equity funds was done throughconvinience sampling and the resultant distribution matrix was 7 equity funds from Aditya Birla Sunlife Insurance, 5 from Future Generali Life Insurance, 14 from HDFC Life, 5 from
PNB Metlife and 4 from SBI Life, this classifcation formed the very basis of the analytical work.
H01a: The BSE Indices have symmetrical distribution in practice.
To statistically conclude the hypothesis, a set of tests were applied and p-value were calcluated for different BSE indices which was as follows
Table 1.2 Test for normality of BSE Indices
Test for normality of
Doornik-Hansen
p value Shapiro-Wilk W
p value
Lilliefors p value
Jarque-Bera
p value
Sensex 516.04 0.00 0.89 0.00 0.14 0.00 162.03 0.00
BSE All Cap 604.24 0.00 0.88 0.00 0.19 0.00 203.43 0.00
BSE 500 603.06 0.00 0.88 0.00 0.19 0.00 203.56 0.00Source: Calculated data on the basis of analysis
Analysis and Interpretation: The above table tests the normality of BSE Indices namely Sensex, BSE All Cap and BSE 500. Four tests were applied namely, Doornik Hansen test, Shapiro Wilk W test, Lilliefors and Jarque Bera Test. The outcome of application of tests gave p-value as 0.00, which is less than 0.05, thus we can reject the null hypothsis. This reveals that normality does not form a basic characterstic of all the three indices namely, Sensex, BSE All
cap and BSE 500. Thus we can conclude that data of BSE Indices can never be normal or symmetrical and the origin of which cannot be known or ascertained.
H01b: The NAV of ULIP funds has symmetrical distribution in practice.
To statistically conclude the hypothesis, a set of tests were applied and p-value were calcluated for different ULIP funds managed by insurance companies in India which was as follows
Table 1.3 Test for normality of selected ULIP funds
Test for normality of Selected ULIP Funds
Life Insurer
Doornik-Hansen
p value Shapiro-Wilk W
p value Lilliefors p value Jarque-Bera
p value
FGI -Maximize Fund FGI 543.28 0.00 0.89 0.00 0.17 0.00 181.80 0.00
FGI -Apex Fund FGI 624.82 0.00 0.88 0.00 0.16 0.00 195.77 0.00
FGI -Opportunity Fund FGI 345.63 0.00 0.90 0.00 0.18 0.00 120.15 0.00
FGI -Pension Active FGI 506.91 0.00 0.89 0.00 0.16 0.00 168.97 0.00
FGI -Dynamic Growth FGI 520.89 0.00 0.89 0.00 0.15 0.00 172.59 0.00
SBI-Equity Pension Fund SBI 583.90 0.00 0.88 0.00 0.15 0.00 171.21 0.00
SBI-Top 300 Pension Fund
SBI 614.54 0.00 0.88 0.00 0.14 0.00 173.76 0.00
SBI-Top 300 Fund SBI 590.88 0.00 0.88 0.00 0.14 0.00 166.83 0.00
SBI-Index Fund SBI 511.10 0.00 0.89 0.00 0.15 0.00 162.70 0.00

111JULY - SEPT - 2019
THE JOURNAL OF INSURANCE INSTITUTE OF INDIA ULIP
Test for normality of Selected ULIP Funds
Life Insurer
Doornik-Hansen
p value Shapiro-Wilk W
p value Lilliefors p value Jarque-Bera
p value
Birla-Multiplier Fund Birla 955.54 0.00 0.84 0.00 0.21 0.00 292.56 0.00
Birla-Magnifier Fund Birla 479.90 0.00 0.89 0.00 0.17 0.00 170.18 0.00
Birla-Super 20 Fund Birla 492.85 0.00 0.90 0.00 0.15 0.00 151.48 0.00
Birla-Pure Equity Fund Birla 297.10 0.00 0.88 0.00 0.19 0.00 80.06 0.00
Birla-Maximiser Fund Birla 422.28 0.00 0.90 0.00 0.18 0.00 166.18 0.00
Birla-Group - Growth Fund
Birla 542.29 0.00 0.89 0.00 0.13 0.00 168.16 0.00
Birla-Group - Growth Advantage Fund
Birla 588.21 0.00 0.88 0.00 0.14 0.00 179.67 0.00
PNB-Flexi Cap Fund PNB 827.17 0.00 0.85 0.00 0.20 0.00 251.55 0.00
PNB-Multiplier PNB 501.86 0.00 0.89 0.00 0.17 0.00 172.80 0.00
PNB-Multiplier Fund II PNB 590.61 0.00 0.88 0.00 0.17 0.00 184.56 0.00
PNB-Virtue Fund PNB 919.12 0.00 0.84 0.00 0.18 0.00 311.44 0.00
PNB-Virtue Fund II PNB 1003.20 0.00 0.84 0.00 0.18 0.00 318.41 0.00
HDFC-Growth Fund HDFC 761.84 0.00 0.85 0.00 0.19 0.00 228.22 0.00
HDFC-Equity Managed Fund
HDFC 1018.87 0.00 0.83 0.00 0.23 0.00 303.41 0.00
HDFC-Growth Fund Pension
HDFC 757.16 0.00 0.85 0.00 0.19 0.00 227.22 0.00
HDFC-Equity Managed Fund Pension
HDFC 980.71 0.00 0.83 0.00 0.22 0.00 291.94 0.00
HDFC-Equity Managed Fund II
HDFC 1038.42 0.00 0.83 0.00 0.23 0.00 314.43 0.00
HDFC-Growth Fund II HDFC 756.35 0.00 0.85 0.00 0.19 0.00 228.78 0.00
HDFC-Large-Cap Fund HDFC 593.72 0.00 0.88 0.00 0.18 0.00 197.73 0.00
HDFC-Mid-Cap Fund HDFC 796.13 0.00 0.85 0.00 0.19 0.00 285.65 0.00
HDFC-Growth Fund II. Pension Super
HDFC 748.05 0.00 0.86 0.00 0.20 0.00 226.92 0.00
HDFC-Equity Managed Fund II. Pension Super
HDFC 1090.28 0.00 0.82 0.00 0.24 0.00 323.45 0.00
HDFC-Growth Fund II_Pension Maximiser II
HDFC 748.05 0.00 0.86 0.00 0.20 0.00 226.92 0.00
HDFC-Equity Managed Fund II_Pension Maximiser II
HDFC 1090.28 0.00 0.82 0.00 0.24 0.00 323.45 0.00
HDFC-Blue Chip Fund. HDFC 831.37 0.00 0.85 0.00 0.20 0.00 255.11 0.00
HDFC-Opportunities Fund HDFC 728.40 0.00 0.86 0.00 0.19 0.00 251.03 0.00
Source: Calculated data on the basis of analysis

THE JOURNAL OF INSURANCE INSTITUTE OF INDIA
JULY - SEPT - 2019112
ULIP
Analysis and Interpretation: An attempt is made to check the normality of variables of 35 selected ULIP funds of selected insurance companies and the null hypothesis was rejected on the ground that the p-value is found to be less than 0.05.
Four test of normality namely Doornik-Hansen test, Shapiro-Wilk W test, Lilliefors test, Jarque-Bera test were applied to the data through Gretl Software and table depicted variables are taken for the selected period the study from 01 April 2010 to 31 March 2018 does not have a normal distribution. Surprisingly, none of the funds of any company could satisfy the tests of normality which on itself prooves that investment protion of ULIPs follows a unique pattern which is common for all the participants with equity component in their portfolio.
Normality of data is hidden assumption that if normality exists data can be studied to greater depth and result are more precise. Ironically all the 4 statistical tools relevant to our study gave similar results and hence it is proved that normality of data is a mere assumption & cannot be treated as a fact to the concept of ULIP funds playing vigourously in the stock market.
Findings & Conclusion
1. The distribution of 35 selected ULIP funds with equity monopoly, of 5 life insurers from the period of 01 April 2010 to 31 March 2018 does not have normal distribution, four test of normality namely Doornik-Hansen test, Shapiro-Wilk W testclearly prove this fact.
2. The statistical tests thatconsist of the basic assumption that the data
pertaining to stock market ULIP funds are normally distributed are not applicable here.
Policy Implications
The present research is of immense importance as it brings out a scientific conclusion that volatility and normality cannot reside together. That what is typically volatile (investment segment of the stock market) can never assume it’s being of a normal distribution. The study satisfactorily concludes that the tests, which can be applicable to stock market, data must be free from the impact of normality to arrive at authentic results. The past studies conducted in this area have wrongfully admitted that assumption of normality is truthful. This paper is an eye-opener to many of those involved in the field of insurance in ULIPs and those in stock market. It will bring a revolutionary transformation in the style of statistical analysis of further researches in this area.
Research Limitations/Future Research
The major limitation of the research paper is that we have taken only 5 leading Insurance Companies as sample, though there are 24 companies dealing in insurance in all. It would have been more elaborative if categories of companies on the basis of their turnover were included. Another major limitation was to select and take only 35 funds with equity monopoly. There are several categories of funds viz, debt funds, conservative funds, moderately allocated funds, aggressively allocated funds but only those with equity composition of 80-100 percent formed our part of study.
With regard to future researches, we
strongly suggest that the aforesaid limitations and the areas identified must be chosen and be worked on. This will definitely bring a new and better dimension to the dynamic industry of insurance & stock market, which will help these industries to grow further and make India prosper.
References
1. Lahmiri, S., Bekiros, S., Stavroyiannis, S., & Babalos, V. (2018). Modelling volatility persistence under stochasticity assumptions: evidence from common and alternative investments. Chaos, Solitons & Fractals, 114, 158-163.
2. Raval, M. B. (2013). A comparative study of performance of kotak-sensex etf and icici pru-sensex etf. Eduvantage, 1(1), 5-7.
3. Nagarajan, G., Ali, A. A., & Sathyanarayana, N. (2013). A study on performance of unit-linked insurance plans (ulip) offered by indian private insurance companies International Journal of Advanced Research in Management and Social Sciences, 2(8), 114-127. Retrieved from http://www.garph.co.uk/IJARMSS/Aug2013/10.pdf.
4. Samajpati, U. (2013). Performance appraisal of unit linked insurance plans (ulips) in india: A case study. Management Insight, 8(2). Retrieved from http://www.inflibnet.ac.in/ojs/index.php/MI/article/view/1491
5. Arora, H. (2012). Are mutual funds out-performing market? ZENITH International Journal of Business Economics & Management Research, 2(6), 153-160.Retrieved from http://

113JULY - SEPT - 2019
THE JOURNAL OF INSURANCE INSTITUTE OF INDIA ULIP
zenithresearch.org.in/images/stories/pdf /2012/JUNE/ZIJBEMR/14_ZIJBEMR_VOL2_ISSUE6_2012.pdf.
6. Gupta, A. (2012). Unit linked insurance products (ulips)-insurance or investment? Procedia-Social and Behavioral Sciences, 37, 67-85. Retrieved from http://ac.els-cdn.com/S1877042812007550/1-s2.0-S1877042812007550-main.pdf?_tid=1167d736-5375-11e6-aac5-00000aacb35d&acdnat=1469567475_75a41915eb7b2709d655f6970d068df0.
7. Lakhani, D. Y. (2012). A study of unit linked insurance plans of icici prudential life insurance. International Journal of Business, Management And Social Sciences, 1(11), 56-66. Retrieved from http://www.academia. edu/1616652/A_Study_of_Unit_Linked_Insurance_Plans_of_ICICI_Prudential_Life_Insurance
8. Prajapati, K. P., & Patel, M. K. (2012). Comparative study on performance evaluation of mutual fund schemes of indian companies. Researchers World, 3(3), 47-59. Retrieved from http://s1.downloadmienphi.net/file/downloadfile2 /161/1400850.pdf.
9. Karuna, K. (2009). Relevance of ulip as a good investment tool. Insurance Chronicle, IX(V), 43-46. Retrieved from http://www.iupindia.in/509/IC_ Relevance_of_ULIPs_43.html.
10. Jeevananthan, M., & Sivakumar, D. (2006). Analysing the trading activities of mutual funds to identify the trend of the indian stock market. Chief Patron, 1(2), 69.
11. Muthappan, P., & Damodharan, E. (2006). Risk-adjusted performance of indian mutual funds schemes. Finance India, 20(3), 965-983. Retrieved fromhttps://www.
econbiz.de/Record/risk-adjusted-performance-evaluation-of-indian-mutual-funds-schemes-muthappan/10003418409.
12. Chander, R. (2002). An evaluation of portfolio performance components across fund characteristics. Finance India, 16(4), 1377-1391.
Websites Accessed:
1. http://www.bseindia.com
2. http://www.hdfclife.com
3. http://www.irda.org/
4. https://insurance.birlasunlife.com
5. https://life.futuregenerali.in
6. https://nav.sbilife.co.in
7. https://ssrn.com
8. https://www.pnbmetlife.com
9. www.actuariesindia.org
10. www.insuranceinstituteofindia.com
11. www.sebi.gov.in

THE JOURNAL OF INSURANCE INSTITUTE OF INDIA
JULY - SEPT - 2019114
AUTOMOBILE INSURANCE
Abstract
Dealer tie-ups in Automobile Insurance have gained popularity in recent years in India. The main reason behind the same is that customers are getting cashless facility on a pan India basis through dealership chains of manufacturers in case of accident claims.
The article tries to throw light on the automobile insurance dealer tie-up system, its impact on insurance industry and insurance frauds. It points out some practical aspects of the system and suggests measures for the prevention of frauds arising due to systemic inefficiencies of the automobile insurance dealer tie-up.
Insurance is a contract between the Insured and Insurer for coverage of risk, for which the premium is being paid by one party i.e. by Insured, while
the promise for indemnifying the loss if occurs due to the perils covered in policy, is given by other party i.e. by the Insurer.
As Automobile Insurance is mandatory for all vehicles running on road, it is the main source for generating regular premium income and business, for insurers throughout the country since decades.
The birth of the Automobile Insurance Dealer tie-up system was when major auto manufacturers in India having a pan India dealership network started providing insurance for new vehicles, with cashless facility for repairs on a pan India basis, from their tie-up insurers’ list.
An attempt had been made to discuss on the possible areas of motor insurance frauds which are on increase
Is Automobile Insurance Dealer Tie-up in India Giving Way to Frauds?
Nisheeth Kumar Maheshwari
Shree Badrinath Marg, Near Jhanda Chowk,
Kotdwara – 246149, Dist. – Pauri Garhwal (Uttrakhand).

115JULY - SEPT - 2019
AUTOMOBILE INSURANCETHE JOURNAL OF INSURANCE INSTITUTE OF INDIA
as result of auto insurance dealer tie-ups and also some measures and remedies to minimize such frauds have been suggested.
Keywords
Automobile Insurance Dealer Tie-up, Automobile Insurance Frauds, Special Investigation Units (SIU), Insurance Surveyors and Loss Assessors, Remedies and Preventive Measures.
Introduction
In today’s Auto insurance market, Tie-up Insurance had gained wide popularity among insured and insurers. Both are having their own reasons to smile in auto tie-up insurance. However, the main
thing to consider today is whether all is going on as smoothly as it appears to common man, whether it is a win-win situation for all stakeholders or, whether the auto insurance dealer tie-up system in India is giving easy way to frauds?
A. Main Reasons for Auto Tie-Up Insurance Gaining Popularity
Insured View Point
Nationwide Cashless Accident repair facility across a chain of pan India authorized dealerships was the one of most important reasons which made auto tie-up insurance popular among insured customers. Secondly, various Insurance schemes with new vehicles given by manufactures through dealerships from time to time had also played major role in increasing the popularity of tie-up insurance among the customers. Customers are sometimes being given certain privileges and extra added benefits from the dealerships if they buy their insurance or renew their policy from them.
Thirdly, now Customers do not have to directly contact insurers or run to their offices for their claim related matters. This, most of them feel as saving of time and unnecessary botheration. One cause for this feeling could be the instances of indifferent attitude of claims department personnel of some insurers towards insured during claims. Another reason could be the support and guidance given by dealers’ body-shops to customers during claims, like lodging of claim, filling of claim form and help during the survey process till final billing is done.
Insurers View Point
The most important and foremost reason is the increased competition among insurers after the regulator
de-tariffed the motor portfolio. Due to increased competition among insurers, the market had become very volatile and difficult to predict. It had given rise to unethical business practices to grab the premium anyhow. Higher discounts, incentives and even foreign trips were being offered to woo the big clients. This had led insurers to think on Manufacturer/ Dealer Tie-Up Insurance so as to grab big amounts of premiums on a regular basis.
Cashless facility had also resulted in less paper work for claims and accounts departments. As customers are receiving cashless facility they remain loyal to insurance company for long period of time. Higher rate of customer satisfaction means less complaints, which every insurer and service provider company yearns for.
B. Insurance Frauds
Insurance Fraud occurs when someone knowingly lies or cheats insurance company to obtain a benefit or advantage to which he or they are not otherwise entitled. It includes knowingly taking or trying to take false claim by misrepresentation, cheating, forgery or any wrong means. It is understood that Insurance Fraud Rings are nowadays operating in organized ways to take advantage from insurance claims and many people are working as teams to execute frauds and earn from same.
a) Frauds during inception of insurance
Frauds can occur at the time of taking of insurance as stated below:
By filling up or giving false information in proposal forms. In most cases, this is the starting point of future fraud. The proposer does not declare the truth in the proposal form and hides details like old
Insurance is a contract between the Insured and Insurer for coverage of risk, for which the premium is being paid by one party i.e. by Insured, while the promise for indemnifying the loss if occurs due to the perils covered in policy, is given by other party i.e. by the Insurer.
As Automobile Insurance is mandatory for all vehicles running on road, it is the main source for generating regular premium income and business, for insurers throughout the country since decades.

THE JOURNAL OF INSURANCE INSTITUTE OF INDIA
JULY - SEPT - 2019116
AUTOMOBILE INSURANCE
damages to the vehicle, past claims
of the vehicle or other negative facts
about the vehicle; for instance, that
the private vehicle is being used
for carrying passengers or carrying
goods.
Another grey area is intentionally
increasing the IDV of obsolete
or old vehicles by the insured to
take future claims. These is being
done by arranging over-valued
valuation reports or by giving wrong
information about market value of
the captioned vehicle.
Pre-insurance inspections after a
break in insurance is another area
where fraud can go undetected for
long if due care is not taken; and
cross checking/ verification by
concerned underwriter is not done.
Examples are, taking photographs
of vehicles of the same model and
color with replaced number plates
and morphing chassis number
images. All these can occur with or
without involvement of the insurer’s
representatives/agents.
b) Frauds during Occurrence of Claims
Soft Frauds - Exaggeration of losses is
a common type of fraud in which the
insured tries to get old damages to be
paid, get additional work done, alter
depreciation of spare parts etc. in case
of an insurance claim to his vehicle.
Staged Accidents - Fake accident
claims, fake injuries and third party
damages are another area in which
fake claims are being reported in a
well-organized manner to insurers.
These are mostly done with the mutual
understanding of repairer, workshops
and insured working jointly as Fraud
Rings. For example, replacing of
already damaged parts with good parts.
Making scratches and dents on vehicles
knowingly, etc. In case of injury and
third party losses, in many cases, white
collar persons like doctors, advocates
etc. may also be part of the Fraud Rings.
c) Documentary frauds
In documentary frauds, the insured
or a third person knowingly provides
replaced documents or forged
documents required during time of
claim. Examples are changing details
regarding date, time, place and cause
of accident. Changing of name of the
driver at time of the accident, changing
of driving license, providing fake bills,
cash memos, receipts, filling up of and
signing of claim forms and other claim
documents on behalf of third person
who is not insured etc.
Some Reasons for Frauds
The main reason at present is the
competitive and volatile auto insurance
market conditions where manufacturers
and dealerships are enjoying a
dominating position of over insurers.
They have a choice among many
insurers due to which manufactures
and dealers are using the same for their
maximum benefits.
As result of increased cut throat
competition among insurers in auto
insurance market, most insurers avoid
to get into any controversy with dealers
and lose their bulk premium income.
For them frauds matters less as long as
their overall incurred claims ratios (ICR)
are maintained.
The absence of Special Investigative
Units (SIU) and qualified trained
professionals to tackle frauds in
insurance companies is also a big
reason which gives way to many
insurance frauds getting away without
being detected.
FRAUDS and DEALER Tieups
As we can understand from business
point of view that dealers are having
good reasons to indulge in frauds and
also have facilities for same.
We all know that dealers overall profit
percent and income is more dependent
on insurance claims and body-shop
activities then selling of new vehicles
i.e. they earn more from workshop then
from new vehicles.
In today’s Auto insurance market, Tie-up Insurance had gained wide popularity among insured and insurers. Both are having their own reasons to smile in auto tie-up insurance. However, the main thing to consider today is whether all is going on as smoothly as it appears to common man, whether it is a win-win situation for all stakeholders or, whether the auto insurance dealer tie-up system in India is giving easy way to frauds?

117JULY - SEPT - 2019
AUTOMOBILE INSURANCETHE JOURNAL OF INSURANCE INSTITUTE OF INDIA
Now insurers have become more
dependent on dealerships for their bulk
premium incomes due to prevailing
insurance market conditions in country.
Insurers have delegated more powers
to dealerships and their body shops
to handle insurance claims under their
MOU’s.
e.g. Survey of claims being done by
Dealer Apps , Customer Apps in name of
saving TAT and Surveyor Fees.
Cost of auto insurance frauds
Impact of auto insurance frauds is
foremost on all insureds as insurers
increase premium rates to cover up
for fraud claims and maintain their
profitability. Thus increasing insurance
frauds are indirectly main reason behind
year on year premium rate hike.
If frauds goes on undetected for long
and fraudsters keeps on escaping
easily without being detected their
greed increases more and it became
a repeated habit to earn easy money.
Such people walking freely after giving
rise to fraud sends a wrong message
in society and some other like-minded
people in society are also attracted to
commit insurance frauds as an easy
way to earn money fast, thereby frauds
are great loss to society and common
man. And in long run gives rise and
boost to formation of new fraud rings.
Directly such fraud claims when paid by
insurers affect their profitability their by
increasing their losses.
Some Remedies And Preventive Measures
Regulator – should take initiative
and make zero tolerance policy for all
against insurance frauds. Nationwide
toll free helpline number with
commitment to keep identity of informer
safe should be framed.
Government – should frame and make
strict laws and easy litigation procedure
against insurance fraudsters.
Insurers – should try to be more
selective rather than thirsting for
premium only. Dealerships and their
body shops should be given limited
powers, that to under time to time
inspections by competent authority
/ persons. SIU departments should
be made as soon as possible and
competent professionals should be
hired to curb fraud practices.
Services of IRDAI Approved Surveyors
and Loss Assessors should be taken
during Claims, in spite of utilizing
services from Dealers’ Body shop or
Customers through Apps. As we all
know what will happen if we give key
of lock to a thief (fraudster). Saving
of small amount of Surveyor Fees by
Insurers using Dealer App or Customer
App for claims settlement can result
in large amount of small claims frauds
being passed undetected. Insurers
should not act like penny wise and
pound foolish.
Conclusion
Indian Auto Insurance Industry Market
have boomed up manifold in past years,
so have Premium rates increased claim
costs due to undetected frauds being
one of reasons. With advent of auto tie-
up dealer insurance Indian market has
seen drastic changes and insurers are
facing stiff competitions.
As dealerships know about their
supremacy over insurers, they can
become part of auto Insurance frauds
knowingly to make more customer
base and increase their overall profit,
incentives. Insurers seems to be
themselves responsible for present day
situation and are now feeling helpless
as being struck in no were situation.
Customers seems to be happy to get
cashless claims pan India through tie up
workshops.
If Indian auto insurance industry is
serious about frauds they should
start up uniting and taking preventive
measures to curb auto insurance frauds
as a whole – chances of which are
more in case of dealer tie-ups. Public
Awareness programs on impact of
frauds, should be run through electronic
and print media by Insurers and
Regulator. Proper Trainings programs
on Fraud Detection and Prevention,
should be organized for employees and
Surveyors handling claims.
International Market Analysis and
preventive measures adopted by them
should be studied and implemented
in Indian perspective. Frauds can only
be prevented by collective efforts of all
stakeholders.
There are many more measures which
can be taken Consumer Awareness
and Role of Insurance Loss Adjusters,
Special Investigation Units can play vital
role in prevention of such frauds
to prevent automobile insurance dealer
tie-up frauds in India and we need to
learn lot from developed insurance
markets of World.

THE JOURNAL OF INSURANCE INSTITUTE OF INDIA
JULY - SEPT - 2019118
TAKAFUL
AimIt’s not intentional to promote a particular religion, but it’s a sublime effort to put forth an alternative prerogative model to sustain incredible business. Takaful products are not ment for particular religion. Consequently a vivid picture of “Takaful Models ” has been depicted in this article to sensitise the people.
Takaful is a growing and fast developing industry. Takaful is an Islamic Insurance model based on the principles of Sharia (Islamic Law).
Takaful is an Arabic word meaning, joint responsibility, comes from the root word, kafala (indemnity) comes from Aqilah, meaning to support or to guarantee.
Defination of TakafulAccording to section-II of Malaysian Takaful Act, 1984, Takaful is a scheme based on brotherhood, solidarity and mutual assistance which provides for mutual financial aid assistance to the
participants, in case of need whereby, the participants mutually agree to contribute for the purpose.
In order to substitute the conventional insurance contract with a contract of donation is termed as Tabarru (Donation), in Arabic. Hence the fundamental difference between conventional insurance and Islamic insurance (Takaful) is the donation (Tabarru) feature.
The following are the fundamental principles of Takaful:
Policy holders cooperate among themselves for their common good.
Every policy holder pays his subscription (donation) to help those that need assistance.
Lossess or divided and liabilities spread according to the community pooling system.
Uncertanity is eliminated in respect of subscription and compensation.
Advantages are not derived at the cost of others.
Takaful Models
Shaik Nazeerullah AAOLIC of India,Satellite Office,[email protected]

119JULY - SEPT - 2019
THE JOURNAL OF INSURANCE INSTITUTE OF INDIA TAKAFUL
DON ATION
MANAGE
TAKAFUL PARTICIPANTS
TAKAFUL FUNDS
TAKAFUL OPERATOR
contracts
WAKALA
MUDARABA
Investment Payclaims
Participants’ Contribution:
Patricipants contributions divided into two accounts:
Patricipants’ Account (PA) and Paricipants’ Special Account (PSA). PSA is risk portion account and PA is the Participants’ Account.
Sharia Supervision Committee
The committee formed within the company to provide opinion on the transactions of the company and their conformity with the lslamic law principles.
Takaful Models
Takaful Model is the basis of the company operational activities. It povides conceptual framework for the operations of Takaful company and sets a path for the flow of funds in the organisation.
Takaful products are based on various business models. The most widely used models are
1) Cooperative model (Public foundations)
2) Mudaraba (Profit sharing)
3) Wakala (Agency)
Cooperative Model
Under a cooperative model contributions are collected and pooled into participants fund (Takaful fund), whilst claims and management expenses are met from Takaful fund. Any surplus in the Takaful fund belongs to the participants. However, should there be a short fall in the fund, participant will have to makeup the deficit themselves.
The Mudaraba Model
The Mudaraba Model has been in operational in Malaysia since 20 years
in Syarikat , Largest Insurer in Malaysia and Brunei (Waheed,2010)
Mudaraba (Trustee profit-sharing) may be defined as a contractual agreement between the provider of capital and the entrepreneur for the purpose of a business venture whereby both parties agree on a pre-determined profit-sharing ratio, whereas lossess of venture will be the sole responsibility of the capital provider except for losses due to the negligence, misconduct, violation of conditions by the entrepreneur (Usmani, 2007).
The principle of Mudaraba when applied to Takaful contract defines Takaful operator as the entrepreneur who undertakes the Takaful business activities and the participants who entrust funds to the Takaful operator by means of Takaful contributions. The Takaful contract may specify (In some model) in proportion of profit (surplus) to be shared between the participants and the Takaful operator (Aznan Hassan, 2011).
The following example shows, Mudaraba model has been practiced in a Syarikat Takaful Malaysia (Source: Pushpa, Ismail, Mustafa, Waa 2013).
Participants account [personal]
Participants special account [common]
CO-OPERATIVE MODEL
Underwriting surplus
Policy benifitsInvestment profit
operatorActual management expences
Investment profit
Participant
100%100%

THE JOURNAL OF INSURANCE INSTITUTE OF INDIA
JULY - SEPT - 2019120
TAKAFUL
A person (A) wants to buy a house from a person (B) at a price of Rs.100,000.00 but he does not have the money to pay the money entire Rs.100,000.00. So the person (A), goes out to the Bank and explains his situation. The bank will buy the house from the person (B) at the price of Rs.100,000.00 and then sell the house to the person (A) at a fixed selling price of Rs. 271,277.00, to be paid in instalment for 25 years. The price will be divided into 300 equal instalments of Rs. 904.59 every month for the 25 years period.
Participants special account
Payment to participantnt
Takaful expenses
Family takaful fund
Participants account
Eg: 30%
Eg: 70%
Participants account
Profits from investment
Investment by company
Payment to participate
PARTICIPANT
TAKAFUL CONTRACT BASED
ON PRINCIPLE OF AL-MUDHARABAH
Companys administration & management expexpences
Profits to shareholdersFamily takaful-Mudharabah model, operation flowchart
Takaful contrbti on
WORKING EXAMPLE ON MUDARABAH:
(Source : Takaful Models and Global Practices by Waheed Akthar)
TOTAL CONTRIBUTION : Rs. 1,00,000-00 Return on Investment : 10%
1. Allocation to PA(80%): Rs.80,000.00 Profit 10% : Rs. 8,000.00 Accumulation in PA : Rs. 88000.00
2. Allocation of PSA (20%): Rs.20,000.00
Profit 10%: Rs. 2000.00
Total fund : Rs. 22000.00
Less : Claims Paid : Rs. 10000.00
Underwriting costs : Rs. 5000.00
= Rs.15000.00
Surplus : Rs. 22000 Rs.15000 = 7000.00
Paricipant’s share(80%) : Rs. 5600.00
Total Accumulations of participant
(PA+PSA) Rs. 88000 + Rs. 5600 =
Rs. 93600.00
The Wakala Model
Wakala Model has been practiced by Bank A-Jazira, Saudi Arabia, Takaful Berhad Company and Takaful Ikhlas Sdn. Berhad in Malaysia(Waheed, 2010).
Under the Wakala (Agency) Model, the participants in the Takaful arranegement
will appoint the Takaful operator as their agent or Manager to handle all the activities of the Takaful fund in accordance with Sharia Advisory and established guidelines. A predetermined fee compensates the agent or manager, and the participants, as principals, share
all profits and risks (Hania Masud, 2011).
The following example shows the Wakala Model as the practice in Takaful Etiqa, Maa Takaful and Ikhlas Takaful (Source : Pushpa, Ismail, Mustafa, Waa 2013).

121JULY - SEPT - 2019
THE JOURNAL OF INSURANCE INSTITUTE OF INDIA TAKAFUL
According to section-II of Malaysian Takaful Act, 1984, Takaful is a scheme based on brotherhood, solidarity and mutual assistance which provides for mutual financial aid assistance to the participants, in case of need whereby, the participants mutually agree to contribute for the purpose. In order to substitute the conventional insurance contract with a contract of donation is termed as Tabarru (Donation), in Arabic.
A person (A) wants to buy a house from
a peron (B) at a price of Rs.100,000.00,
but he does not have the cash to pay
entire Rs.100,000.00. The person (A)
does not have time to go to the Bank,
so he explains the situation to the
bank’s agent. The agent will buy the
house from the person (B) at the price
of Rs.100,000.00 and then sell it to the
person (A) at a fixed selling price of
Rs.271,277.00 to be instalment over
25 years. However the person (A) has
to pay a management fee to the bank’s
agent at the amount of 1% of the
selling price for his service. The selling
price will be divided into 300 equal
instalments of Rs.904.59 over the 25
year period.
WORKING EXAMPLE ON WAKALA:
(Takaful Models and Global Practices by
Waheed Akthar)
Total Contributions:Rs.1,00,000
Less:Agents’ commission : Rs.
35000.00
Amount available for Risk Fund :
Rs.65000.00 (Rs. 1,00,000-Rs.35000)
Profit(10%):Rs. 6500.00
Total : Rs. 71,500.00
Less : Claims Paid/Expenses
direct(40%) : Rs. Rs.40,00.00
Underwriting Surplus : Rs.31,500
(Rs. 71,500-Rs. 40,000)
Less:Wakala Fee (10%) : Rs. 3150.00
Less:Contingency Reserve(10%) :
Rs.3150.00
Participant Share : Rs. 25,200.00
(Rs.31500-Rs.6300)
According to World Bank, the global
Takaful sector shown remarkable
growth with a nominal growth rate of approximately 30% per annum in the recent years. Managing Takaful operation involves re-thinking norms of insurance. Takaful is not a simply another name for insurance. In order to Takaful succeed, there is a need to understand how risks in Takaful are distributed and how they should be managed so as to align the interest of various stake holders as closely as
possible.
References
1. Islamic Insurance: An alternative
to conventional insurance by
Dr.Muammar & Dr.Basil Alqud wa
2. Amanah-Risk Solutions-www.
amanah.co.za-seven misconceptions
about Takaful.
3. Takaful (Islamic Insurance) :
Historical, Shariah and Operational
perspectives by Shiela Nu Nu Htay,
Mustapha Hemat, Wan Zamri Wan
Ismail & Syed Ahmed Salman.
4. Mathematical modeling in Family
Takaful-Puspa Liza Binti Ghozali,
Ismail Bin Mohd, Mustafa Bin Mamat
and Wan Muhammad Amir wan
Ahmed.
5. Takaful - An innovative approach to
Insurance and Islamic Finance by
Hania Masud.
6. Risks and Risks mitigation-TRC-
Chapter.4 - Fundamentals of Takaful
Contracts.
7. Wold Bank - Takaful - www.
worldbank.org.
8. Capital market for practice – the
world bank – Takaful development
programme – An effective tool
for access to insurance (www.
worldbank.ord/fpd/insurance).
9. Takaful Models and Global Practices
by Waheed Akthar
10. Business Takaful Models : A Review,
A Comparision by Ahmed Tisman
Pasha and Mher Mushtaq Hussain

111OCTOBER-DECEM BER 2017
THE JOURNAL OF INSURANCE INSTITUTE OF INDIA
CALL FOR PAPERS
We invite articles/papers for the issues of ‘The Journal’ of Insurance Institute of India for the year 2020.
January – March 2020
Theme for January-March 2020 issue of ‘The Journal’ is ‘Insurance and Wellbeing’.
Last Date of submission of papers/articles will be 30th November, 2019.
April – June 2020
Any topic on insurance or allied areas.
Last Date of submission of papers/articles will be 29th February, 2020.
July – September 2020
Theme for July-September 2020 issue of ‘The Journal’ is ‘Insurance and Fraud Management’.
Last Date of submission of papers/articles will be 31st May, 2020
October – December 2020
Award Winning Articles of Essay Writing Competition 2020.
We request you to send your articles/papers to [email protected] on or before the due dates.
Insurance Institute of India
Knowledge Management Center
Insurance Institute of India
Plot No. C-46, G Block,
Bandra-Kurla Complex,
Bandra (East),
Mumbai - 400051.
www.insuranceinstituteofindia.com

THE JOURNAL OF INSURANCE INSTITUTE OF INDIA
123APRIL - JUNE - 2019
111OCTOBER-DECEM BER 2017
THE JOURNAL OF INSURANCE INSTITUTE OF INDIA
CALL FOR PAPERS
112 october-december 2017
The Journal of Insurance InsTITuTe of IndIa
note to the contributors:
“The Journal” is quarterly publication of Insurance Institute of India, Mumbai. It is published in the month of Jan/April/July/Oct every year. “The Journal” covers wide range of issues related to insurance and allied areas. The Journal welcomes original contributions from both academicians and practitioners in the form of articles, research papers, case studies, special commentary and book reviews. Authors whose papers are published will be given honorarium and two copies of the Journal.
Guidelines to the contributors:
1. Manuscript submitted to the Editor must be typed in MS-Word. The Length of the articles and case studies should not exceed 5000 words. Research papers length can be upto 10,000 words. For book reviews and commentaries the word limit may be upto 1500-2000 words.
2. General rules for formatting text:
i. Page size : A4 (8.27” X 11.69”)
ii. Font: Times New Roman – Normal, black
iii. Line spacing: Double
iv. Font size: Title-14, Sub-titles– 12, Body- 11 Normal, Diagrams/Tables/Charts– 11 or 10.
3. The first page of the Manuscript should contain the following information: (i) Title of the paper; (ii) The name(s) and institutional affiliation(s) of the Author(s); (iii) email address for correspondence. Other details for correspondence
Guidelines for contributors of the Journal
such as full postal address, telephone and fax number of the corresponding author must be clearly indicated. The category of submission should be specified either as a research paper, article, review, case study etc.
Point no. 4, 5, 6 and 7 are applicable only for articles, case studies and research papers.
4. abstract: A concise abstract of maximum 150 words is required. The abstract should adequately highlight the key aspects or state the objectives, methodology and the results/major conclusions of analysis. The abstract should include only text.
5. Keywords: Immediately after the abstract, provide around 3-6 keywords or phrases.
6. Tables and figures: Diagrams, Tables and Charts cited in the text must be serially numbered and source of the same should be mentioned clearly wherever necessary. All such tables and figures should be titled accurately and all titles should be placed on the top after the number. Example: Table 1: Growth Rate of Insurance Premium in India (1997-2010).
7. references: all the referred material (including those from authors own publication) in the text must be appropriately cited. All references must be listed in alphabetical order and sorted chronologically and must be placed at the end of the manuscript. The authors are advised
to follow American Psychological Association (APA) style in referencing.
reference to a Book: Author. (Year). Title of book. Location: Publisher.
Example: Rogers, C. R. (1961). On becoming a person. Boston: Houghton Mifflin.
reference to a Journal Publication: Author(s). (Year). Title of the article/paper. Journal name, volume (issue), page number(s).
Example: Smith, L. V. (2000). Referencing articles in APA format. APA Format Weekly, 34(1), 4-10.
reference to a Web source: Author. (Date published if available; n.d.--no date-- if not). Title of article. Title of web site. Retrieved date. From URL.
Example: Landsberger, J. (n.d.). Citing Websites. In Study Guides and Strategies. Retrieved May 13, 2005, from http://www.studygs.net/citation.htm.
8. Usage of abbreviations in the text should be avoided as far as possible and if used should be appropriately expanded.
9. The papers and articles submitted must be original work and it should not have been published or submitted for publication elsewhere. The author(s) are required to submit a declaration to this extent in the format specified in Appendix 1, while submitting their articles.

THE JOURNAL OF INSURANCE INSTITUTE OF INDIA
APRIL - JUNE - 2019124 113october-december 2017
The Journal of Insurance InsTITuTe of IndIa
10. All the submissions would be first evaluated by the editor and then by the editorial Committee. Editorial committee may require the author to revise the manuscript as per the guidelines and policy of the Journal. The final draft is subject to editorial changes to suit the journals requirements. Editorial Committee also reserves its right to refer the article for review/ delete objectionable content/ edit without changing the main idea/ make language corrections/ not to publish/ publish with caveats as per its discretion. The Author would be duly communicated with such decisions.
11. Contribution(s) should reach the designated email address at III on or before 30th November (January issue), 28th February (April issue), 31st May (July issue) and 31st August (October issue).
12. Please send your manuscripts to
The Editor, The Journal of Insurance Institute of India, Insurance Institute of India Plot no. C-46, G-Block, Near Dhirubhai Ambani International school, Bandra-Kurla Complex, Bandra (East), Mumbai-400051.
or
Electronically Mail to <[email protected]> with subject line as “Contribution for “The Journal” – January/April/July/October (Mention Year) issue.
13. In case the author has submitted only the hard copy, an electronic version of the manuscript would be required once the paper is accepted for publication.
14. All enquiries related to the submissions should be addressed only to the Editor.
15. Copyright of the published articles and papers would rest with “The Journal of Insurance Institute of India” and any further reproduction would require prior and written permission of the Editor.
specific Guidelines for Book reviews:1. The book review should be of a
book published in recent years (current year or previous year).
2. The review should not be more than 2000 words; word limit can be more/less depending on the scope of the book.
3. The reviewer should clearly mention the details of the book reviewed such as Title, Author(s) name, publishers detail, year of publication, place of publication, number of pages and listed price as mentioned on the cover page of the book. If the ISBN number is provided, it should be specified. Beside the above, the components of the book review should be brief summary of the intended objective/purpose, description of the approach, logical and objective evaluation.
4. The references should be kept to the minimum or completely avoided in a book review.
5. Avoid replicating tables and figures from the book, or directly quoting from the book.
6. The review should not be just a summary of the book, but it should bring out the essence of the book and focus on the objective, theme, scope of coverage, etc. The book review should put forward an objective and fair opinion about the significance, strengths and
weaknesses. The review should be about the books contribution to the subject rather than what the reviewer feels about the book.
7. The reviewer should try to make the review insightful and informative.
specific Guidelines for case studies:1. Cases usually describe complex
issues and readers are forced to take optimum decisions/action in a dilemmatic situation. Cases are meant to create challenges of decision making in the mind of readers regarding conflicting situations, insufficient information, dynamic environment and the like.
2. The authors of the case studies can take organization specific or industry specific issues and present the facts of the case in a logical way.
3. The case study should be well documented and well researched and must be realistic in its context and relevance.
4. Sufficient data (primary or secondary) should be incorporated within a case study for discussion and generating alternative solutions and identifying the best possible alternative. Prior approval for disclosure of information (company specific) must be taken by the author wherever applicable.
5. The issues that are raised in the case should be focused and must be effectively presented without any ambiguity or contradictions.
6. All the referenced material should be adequately and accurately cited at the end of the case.
7. Discussion questions can be provided at the end of case (optional).

THE JOURNAL OF INSURANCE INSTITUTE OF INDIA
125APRIL - JUNE - 2019114 october-december 2017
The Journal of Insurance InsTITuTe of IndIa
appendix I
declaration by the authors
I/We (full name of the author(s))..................................................................................
…………………...…….....…....……, hereby declare that I/We are the author(s) of the paper titled
“……..........………………...………………………………………………………………………..”
(Title of the paper), which is our original work and not the intellectual property of any one else. I/we
further declare that this paper has been submitted only to the Journal of the Insurance Institute of India
and that it has not been previously published nor submitted for publication elsewhere. I/we have duly
acknowledged and referenced all the sources used for this paper. I/we further authorize the editors to
make necessary changes in this paper to make it suitable for publication.
I/we undertake to accept full responsibility for any misstatement regarding ownership of this article.
……………………… ………………………..
(signature author I) (signature author II)
name: name:
date:
Place:

THE JOURNAL OF INSURANCE INSTITUTE OF INDIA
APRIL - JUNE - 2019126
SR NO CODE SUB CODE
PROGRAM DATE FROM-TO FEES FOR RESIDENTS
FEES FOR NON-RESIDENTS
DESIGNED FOR
Training Programs at MumbaiSeptember 20191 CP G16 Management of
Fire Insurance16-17 Sep, 2019 ` 8600 + G.S.T. ` 6200 + G.S.T. Executives from the
Underwriting Department of Insurance Companies.
2 CP S1 One Day Technical Workshop on Renewable Energy
20-Sep-19 ` 4300+ G.S.T. ` 3100+ G.S.T. Participants dealing with / keen to learn about Renewable Energy.
3 CP G17 ERM of Insurance Companies
23-24 Sep, 2019 ` 8600 + G.S.T. ` 6200 + G.S.T. Risk Managers and Risk Analysts handling Risk Assessment functions in the Insurance Industry.
4 CP G18 Comprehensive Marine Hull Insurance
23-25 Sep, 2019 ` 12900 + G.S.T. ` 9300 + G.S.T. Executives working in the Marine Hull departments of Insurance companies / Brokers / Loss Adjusters / Customers.
October 20195 CP G19 Comprehensive
Port Package Policies
14-15 Oct, 2019 ` 8600 + G.S.T. ` 6200 + G.S.T. Officials handling Port Policies in Insurance Companies and various Port Authorities in India and abroad.
6 CP S2 Data Analytics - Appreciation Program
14-15 Oct, 2019 ` 8600 + G.S.T. ` 6200 + G.S.T. Participants working or interested to learn about the impact of digitization on Insurance and data analytics.

THE JOURNAL OF INSURANCE INSTITUTE OF INDIA
127APRIL - JUNE - 2019
SR NO CODE SUB CODE
PROGRAM DATE FROM-TO FEES FOR RESIDENTS
FEES FOR NON-RESIDENTS
DESIGNED FOR
7 IP L6 International Program - Life Insurance
14-19 Oct, 2019 $ 600 USD International Participants - Senior/ Middle level Executives working in Life Insurance Companies and Brokers.
8 CP G20 Reinsurance Treaty issues and Challenges (Focus - Reinsurance treaty designing)
21-23 Oct, 2019 ` 12900 + G.S.T. ` 9300 + G.S.T. Participants presently working in designing or placing treaties with Reinsurance Companies or RI Brokers.
November 20199 CP G21 Comprehensive
Motor Insurance Workshop
4-6 Nov, 2019 ` 12900 + G.S.T. ` 9300 + G.S.T. Executives from Insurance Companies, Broking firms and Surveyors dealing with Motor OD and TP Insurance.
10 CP C4 Compliance Governance and Risk Management in Insurance
4-6 Nov, 2019 ` 12900 + G.S.T. ` 9300 + G.S.T. Exclusive Program for those registered for the Compliance Governance and Risk Management Course.
11 CP G22 Comprehensive Program on Management of Engineering Projects
18-20 Nov, 2019 ` 12900 + G.S.T. ` 9300 + G.S.T. Middle Level Executives from the Underwriting Department of Insurance Companies Brokers / Customers.
12 CP L7 Appreciation of Insurance Regulations - Life
25-26 Nov, 2019 ` 8600 + G.S.T. ` 6200 + G.S.T. Officers in Senior Level and Middle Management in Life Insurance Companies.
December 201913 CP G23 Liability Insurance
Focus - Financial Lines
2-3 Dec, 2019 ` 8600 + G.S.T. ` 6200 + G.S.T. Executives of Insurance Companies, Brokers, Surveyors, Customers.
14 CP B3 Appreciation programme for Principal Officers
5-6 Dec, 2019 ` 8600 + G.S.T. ` 6200 + G.S.T. Principal officers of Corporate Agents including Banks.

THE JOURNAL OF INSURANCE INSTITUTE OF INDIA
APRIL - JUNE - 2019128
SR NO CODE SUB CODE
PROGRAM DATE FROM-TO FEES FOR RESIDENTS
FEES FOR NON-RESIDENTS
DESIGNED FOR
15 CP G24 Advanced Program for Young Leaders (Life and General)
9 -11 Dec, 2019 ` 12900 + G.S.T. ` 9300 + G.S.T. Young Managers / Executives keen to acquire leadership qualities from both General and Life Insurance Companies.
16 CP G25 One day Technical Workshop on Nuclear Civil Liability
13 Dec, 2019 ` 4300+ G.S.T. ` 3100+ G.S.T. Participants dealing with / keen to learn about the impact of Nuclear Liability.
17 CP G26 Comprehensive Health Insurance
16-18 Dec, 2019 ` 12900 + G.S.T. ` 9300 + G.S.T. Middle Level Executives of Third Party Administrators, Insurance Companies, Broking Firms and Hospitals.
18 CP C5 Certified Insurance Anti Fraud Professionals
18-20 Dec, 2019 ` 12900 + G.S.T. ` 9300 + G.S.T. Exclusive Program for those registered for the Certified Insurance Anti-Fraud Professionals Course.
January 202019 CP G27 Comprehensive
Marine Cargo Insurance
13-15 Jan, 2020 ` 12900 + G.S.T. ` 9300 + G.S.T. Junior /Middle level Executives dealing with Marine Cargo in Insurance Companies, Brokers and Surveyors and Insureds.
20 IP G28 International Program -Excellence in Insurance Technical - Non Life
13-24 Jan, 2020 $ 1200 USD International Participants - Mid/ Junior level Executives working in General Insurance Companies and Brokers.
21 CP L8 Finance and Accounts for Non Finance Executives of Life Insurance Companies
20-21 Jan 2020 ` 8600 + G.S.T. ` 6200 + G.S.T. Executives working at Senior and Middle Management levels in Non Finance departments of Life Insurance Companies.
22 CP G29 Claims Management of Fire Insurance
20-21 Jan, 2020 ` 8600 + G.S.T. ` 6200 + G.S.T. Middle Level Executives of General Insurance Companies, Brokers, Surveyors, Customers.

THE JOURNAL OF INSURANCE INSTITUTE OF INDIA
129APRIL - JUNE - 2019
SR NO CODE SUB CODE
PROGRAM DATE FROM-TO FEES FOR RESIDENTS
FEES FOR NON-RESIDENTS
DESIGNED FOR
February 202023 IP L9 International
Program -Excellence in Insurance - Technical - Life
3-14 Feb, 2020 $ 1200 USD Senior and Middle level Executives of the International Life Insurance Industry.
Training Programs at KolkataSeptember 20191 CP G6 Managing
Grievance, Handling Consumer and Ombudsman Cases
02-03 Sept, 2019 ` 8600 + G.S.T. ` 6200 + G.S.T. Executives who deal with Consumer and Ombudsman Cases.
2 CP G7 Management of Distribution Channel-Non-Life (within Frame work of IRDAI guidelines)
23-24 Sept, 2019 ` 8600 + G.S.T. ` 6200 + G.S.T. Executives who are involved in Managing Distribution Channels in Operating offices.
November 20193 CP G8 Handling Motor
Third Party Claims and Controlling Fraud
04-06 Nov, 2019 ` 12900 + G.S.T. ` 9300 + G.S.T. Executives dealing with Motor TP claims.
4 CP G9 Managing Project Insurance
25-26 Nov, 2019 ` 8600 + G.S.T. ` 6200 + G.S.T. Executives dealing with Project Insurance and claims.
December 20195 CP G10 Motor OD Claims
Workshop09-10 Dec, 2019 ` 8600 + G.S.T. ` 6200 + G.S.T. Executives who dealing
with Motor OD claims.January 20206 CP G11 Aviation Insurance 20-21 Jan, 2020 ` 8600 + G.S.T. ` 6200 + G.S.T. Executives working with
the Aviation Department.February 20207 CP G12 Management
of Marine Hull Underwriting and Claims
10-11 Feb, 2020 ` 8600 + G.S.T. ` 6200 + G.S.T. Executives working in the Marine Hull department.

130
NOTES

131
NOTES

132
NOTES

e-learning e-learning
How to use?After successful completion of online transaction for e-Learning, Candidate will receive the login credentials on email address provided at the time of registration to access the e-learning module. The email contains the URL along with user id and password to access the e-Learning program. The e-Learning program is web based, internet connection is required to access the e-Learning module online.
How to apply?1. Visit website www.insuranceinstituteofindia.com
2. Go to menu “Study Material” --> “Apply for eLearning”.
3. Fill the details, select subjects and pay required fees.
For queries please mail at [email protected]
INSURANCE INSTITUTE OF INDIA
On
line
Len
din
g L
ibra
ry
GROUP CORPORATEMEMBERSHIP
Insurance Institute of India has introduced a new segment in Online Lending Library named Group CorporateMembership (GCM) especially for corporates. In GCM, various branches/depts. of a Company can enjoy libraryfacility. Corporates can enjoy a rich collection of books on Insurance, Risk, Reinsurance, Liability insurance,Finance, Tax, Law, Management & many more.
GCM MEMBERSHIPPARTICULARS PLAN 1 PLAN 2 PLAN 3
NO. OF BRANCHES/DEPT. 5 10 15
REFUNDABLE SECURITY DEPOSIT
100000 200000 300000
ANNUAL FEE 75000 125000 175000
GST 18% GST ON ANNUAL FEE
18% GST ON ANNUAL FEE
18% GST ON ANNUAL FEE
NO. OF LOGIN 5 10 15
NO. OF BOOKS PER LOGIN 5 5 5
ISSUE PERIOD 1 MONTH 1 MONTH 1 MONTH
RENEW PERIOD 1 MONTH 1 MONTH 1 MONTH
GCM SERVICES
More than 8000 books to choose from
Delivery within 48 hours from order
Multiple logins for each Company
Back issues of last 6 months of National/InternationalJournals on Insurance/Finance/Management will be issued
Maximum 20 books in total will be issued to Cos.against GCM
CONTACT DETAILSLibrary, Knowledge Management Center, Insurance Institute of India, Plot No. C-46, G Block,
Bandra-Kurla Complex, Bandra (E), Mumbai – 400 051. Phone: 022-26544290Email: [email protected] l Website: www.insuranceinstituteo com
The emblem of III speaks about “Achievement through application of knowledge”. III as a pioneer educational institute in Insurance Domain is always endeavor to use the latest technology in order to impart, promote systematic insurance education and training as well as spread insurance awareness in our country.
e-Learning stands for electronic learning system which allows candidates to learn a particular subject directly from the internet enabled computer on web based platform.
This mode of learning been developed & started by III to enable the candidates to take the advantage of such facility and to get success in the professional examination conducted by III at various centres all over the country. The modules of e-Learning provides much beyond the course material in terms of web-links, selflearning questions, mock tests, blogs to communicate within the circle of tutors and candidates etc.

G-Block, Plot No.C-46, Opp. American Consulate, Bandra Kurla Complex, Mumbai - 400 051.