Insulation Resistance Degradation in Ni–BaTiO3 Multilayer ... · PDF fileDeliverable to...
22
Deliverable to NASA Electronic Parts and Packaging (NEPP) Program to be published on nepp.nasa.gov, paper published in the IEEE Transactions on Components, Packaging and Manufacturing Technology, Vol. 5, No. 1, January 2015. Insulation Resistance Degradation in Ni-BaTiO3 Multilayer Ceramic Capacitors Donhang (David) Liu ASRC Federal Space and Defense Work performed for NASA Goddard Space Flight Center Insulation resistance (IR) degradation in Ni-BaTiO3 multilayer ceramic capacitors has been characterized by the measurement of both time to failure and direct-current (DC) leakage current as a function of stress time under highly accelerated life test conditions. The measured leakage current-time dependence data fit well to an exponential form, and a characteristic growth time SD can be determined. A greater value of SD represents a slower IR degradation process. Oxygen vacancy migration and localization at the grain boundary region results in the reduction of the Schottky barrier height and has been found to be the main reason for IR degradation in Ni-BaTiO3 capacitors. The reduction of barrier height as a function of time follows an exponential relation of () = (0)e −2Κt , where the degradation rate constant = 0 − is inversely proportional to the mean time to failure (MTTF) and can be determined using an Arrhenius plot. For oxygen vacancy electromigration, a lower barrier height (0) will favor a slow IR degradation process, but a lower (0) will also promote electronic carrier conduction across the barrier and decrease the insulation resistance. As a result, a moderate barrier height (0) (and therefore a moderate IR value) with a longer MTTF (smaller degradation rate constant ) will result in a minimized IR degradation process and the most improved reliability in Ni- BaTiO3 multilayer ceramic capacitors. Dielectric degradation; ceramic capacitors; reliability; insulation resistance; barium titanate. I. INTRODUCTION Insulation resistance (IR) degradation related to oxygen vacancy migration has been considered to be the primary cause of reliability degradation of multilayer ceramic capacitors (MLCCs) with base-metal electrodes (BMEs). The behavior is characterized by a slow increase in the leakage current under an applied direct-current (DC) field stress. In order to reveal IR degradation in a timely manner, MLCCs are often degraded under highly accelerated life test (HALT) conditions with different temperatures and applied voltages. Previous studies have shown that there are three possible factors related to the IR degradation of BaTiO3-based BME MLCCs: the dielectric layer, the BaTiO3 grain boundaries, and the Ni-BaTiO3 internal electrode interfaces. 1-4
Transcript of Insulation Resistance Degradation in Ni–BaTiO3 Multilayer ... · PDF fileDeliverable to...

Deliverable to NASA Electronic Parts and Packaging (NEPP) Program to be published on nepp.nasa.gov, paper published in the IEEE Transactions on Components, Packaging and Manufacturing Technology, Vol. 5, No. 1, January 2015.
Insulation Resistance Degradation in Ni-BaTiO3 Multilayer Ceramic
Capacitors
Donhang (David) Liu
ASRC Federal Space and Defense
Work performed for NASA Goddard Space Flight Center
Insulation resistance (IR) degradation in Ni-BaTiO3 multilayer ceramic capacitors has been
characterized by the measurement of both time to failure and direct-current (DC) leakage
current as a function of stress time under highly accelerated life test conditions. The
measured leakage current-time dependence data fit well to an exponential form, and a
characteristic growth time SD can be determined. A greater value of SD represents a
slower IR degradation process. Oxygen vacancy migration and localization at the grain
boundary region results in the reduction of the Schottky barrier height and has been found
to be the main reason for IR degradation in Ni-BaTiO3 capacitors. The reduction of barrier
height as a function of time follows an exponential relation of 𝜙(𝑡) = 𝜙(0)e−2Κt, where
the degradation rate constant 𝐾 = 𝐾0𝑒−𝐸𝑘𝑘𝑇 is inversely proportional to the mean time to
failure (MTTF) and can be determined using an Arrhenius plot. For oxygen vacancy
electromigration, a lower barrier height 𝜙(0) will favor a slow IR degradation process, but
a lower 𝜙(0) will also promote electronic carrier conduction across the barrier and
decrease the insulation resistance. As a result, a moderate barrier height 𝜙(0) (and
therefore a moderate IR value) with a longer MTTF (smaller degradation rate constant 𝐾)
will result in a minimized IR degradation process and the most improved reliability in Ni-
BaTiO3 multilayer ceramic capacitors. Dielectric degradation; ceramic capacitors;
reliability; insulation resistance; barium titanate.
I. INTRODUCTION
Insulation resistance (IR) degradation related to oxygen vacancy migration has been considered to
be the primary cause of reliability degradation of multilayer ceramic capacitors (MLCCs) with
base-metal electrodes (BMEs). The behavior is characterized by a slow increase in the leakage
current under an applied direct-current (DC) field stress. In order to reveal IR degradation in a
timely manner, MLCCs are often degraded under highly accelerated life test (HALT) conditions
with different temperatures and applied voltages. Previous studies have shown that there are three
possible factors related to the IR degradation of BaTiO3-based BME MLCCs: the dielectric layer,
the BaTiO3 grain boundaries, and the Ni-BaTiO3 internal electrode interfaces.1-4

Deliverable to NASA Electronic Parts and Packaging (NEPP) Program to be published on nepp.nasa.gov, paper published in the IEEE Transactions on Components, Packaging and Manufacturing Technology, Vol. 5, No. 1, January 2015.
Unlike traditional BaTiO3-based MLCCs with precious-metal electrodes (PMEs), BME MLCCs
are co-fired in a reducing atmosphere to avoid oxidation of the electrodes. Despite the re-oxidation
process, there is still a significant amount of oxygen vacancies that are accommodated in the
BaTiO3 dielectric layers. The failure mechanism of BME MLCCs is thought to be dominated by
the electromigration of oxygen vacancies through the grain boundaries in the dielectric layers.5–8
Waser et al.9-12 studied the IR degradation in ambient-fired SrTiO3 ceramic and acceptor-doped
single-crystal SrTiO3. The results showed that IR degradation begins with oxygen vacancy
electromigration toward the cathode with respect to time, field, and temperature. Segregation of
defects and dopants is found at the grain boundaries during the sintering process and results in the
formation of space-charge layers at the grain boundaries.
The formation of double Schottky depletion layers at the grain boundaries of ceramic BaTiO3 and
their impact on the properties of BaTiO3 ceramics was first proposed by Heywang13 in order to
explain the unique positive temperature coefficient of resistance (PTCR) behavior around the
Curie temperature, which only existed in donor-doped semiconducting BaTiO3 ceramics. This
model indicates that the depletion barriers are formed because of the electron trapping by acceptor
states at grain boundaries. Jonker14-15 later extended the Heywang model, considering the
influence of ferroelectric polarization on resistivity below the Curie temperature.
In BaTiO3-based MLCCs, the depletion layers are believed not only to be depleted of electron
carriers and therefore to be highly resistive, but also to act as electrical barriers against oxygen
vacancy electromigration and thus to slow down the degradation process.2, 10, 16 Although high-
resistance depletion layers both at grain boundaries and at electrode interfaces limit electronic
conduction and the transport of oxygen vacancies across dielectric layers, oxygen vacancy
migration is either trapped near the grain boundary depletion layers or blocked by electrode
interfaces, and these charged oxygen vacancies are neutralized by the reduction of Ti4+ near the
cathode and the rare-earth doping in the BaTiO3 dielectric. This agrees with a number of recently
published works about first-principles calculations of rare-earth element doping, the local atomic
configuration, and the solution energy of oxygen vacancies.17-19
In this paper, the IR degradation in Ni-BaTiO3 MLCCs was investigated for three commercial
BME capacitors qualified to the same reliability level but made by different manufacturers. The
paper provides insight into the time-dependent correlations among oxygen vacancy migration,
Deliverable to NASA Electronic Parts and Packaging (NEPP) Program to be published on nepp.nasa.gov, paper published in the IEEE Transactions on Components, Packaging and Manufacturing Technology, Vol. 5, No. 1, January 2015.
vacancy trapping, and the depletion layer height. A theoretical model based on the oxygen vacancy
migration and entrapment at grain boundary is proposed to show the relationship between the
reliability, characterized by MTTF, and the depletion layer height reduction during the IR
degradation in the BaTiO3 dielectric materials of BME capacitors.
II. EXPERIMENTAL PROCEDURE
Three automotive-grade commercial BME capacitors, AA47450, AB47450, and AC47450, with
the same chip size, capacitance, and rated voltage, but made by different manufacturers, were
selected for this study. These BME capacitors were qualified per AEC-Q200, a specification
document developed by the Automotive Electronics Council of United States for ceramic
capacitors and passive components used in harsh automotive environments. The microstructures
of the three BME capacitor lots were investigated by cross-section processing of five (5) units per
capacitor type and were examined using a scanning electron microscope (SEM) to reveal the
number of dielectric layers, average grain size, and average dielectric layer thickness.
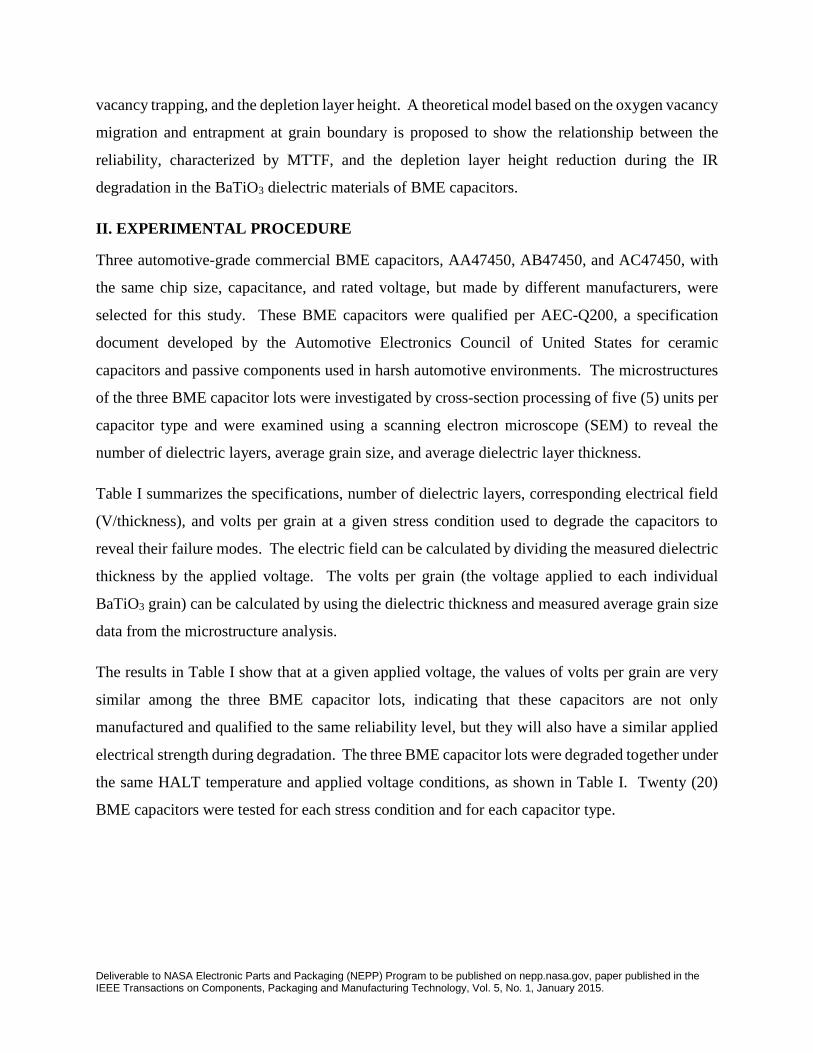
Table I summarizes the specifications, number of dielectric layers, corresponding electrical field
(V/thickness), and volts per grain at a given stress condition used to degrade the capacitors to
reveal their failure modes. The electric field can be calculated by dividing the measured dielectric
thickness by the applied voltage. The volts per grain (the voltage applied to each individual
BaTiO3 grain) can be calculated by using the dielectric thickness and measured average grain size
data from the microstructure analysis.
The results in Table I show that at a given applied voltage, the values of volts per grain are very
similar among the three BME capacitor lots, indicating that these capacitors are not only
manufactured and qualified to the same reliability level, but they will also have a similar applied
electrical strength during degradation. The three BME capacitor lots were degraded together under
the same HALT temperature and applied voltage conditions, as shown in Table I. Twenty (20)
BME capacitors were tested for each stress condition and for each capacitor type.

Deliverable to NASA Electronic Parts and Packaging (NEPP) Program to be published on nepp.nasa.gov, paper published in the IEEE Transactions on Components, Packaging and Manufacturing Technology, Vol. 5, No. 1, January 2015.
Table I. Specifications and Calculated E (kV/mm), and Volts per Grain (V/Grain)
Part ID Stress Level E (kV/mm) V/Grain
AA46450
0.47µF, 50V, 0805
Manufacturer A
98 layers
BaTiO3 thickness= 6.39m
Ave. grain size= 0.38 m
250V 175C 39.1236 14.75
225V 165C 35.2113 13.27
250V 165C 39.1236 14.75
250V 155C 39.1236 14.75
315V 155C 49.2958 18.59
AB47450
0.47µF, 50V, 0805
Manufacturer B
100 layers
BaTiO3 thickness= 5.80m
Ave. grain size= 0.33 m
250V 175C 43.0886 14.13
225V 165C 38.7797 12.72
250V 165C 43.0886 14.13
250V 155C 43.0886 14.13
315V 155C 54.2916 17.81
AC47450
0.47µF, 50V, 0805
Manufacturer C
103 layers
BaTiO3 thickness= 8.10m
Ave. grain size= 0.40 m
250V 175C 30.8642 12.45
225V 165C 27.7778 11.20
250V 165C 30.8642 12.45
250V 155C 30.8642 12.45
315V 155C 38.8889 15.68
The traditional HALT measures only the time-to-failure (TTF) data of each capacitor at a given
stress condition and then uses a statistical model to determine the mean-time-to-failure (MTTF)
data at this stress condition.19-22 This approach is based on a single failure mode assumption and
is adequate for most ceramic capacitors with precious-metal electrodes (PMEs). However, as has
been previously shown, 26-29 many BME capacitors, when degraded under HALT conditions,
reveal a more complicated failure mechanism with two distinct failure modes. A recently
performed failure analysis of these degraded BME capacitors also confirms the existence of two
distinct failure modes. 37 For this reason, the measurement of TTF data alone will not result in an
accurate prediction of the reliability life of these BME capacitors. In order to characterize the
multiple failure modes in BME capacitors, the leakage current was also monitored in-situ and was
measured every 1-3 seconds for each capacitor unit. The reliability life of a capacitor is thus not
only determined by the TTF data, but also by the measured leakage current data used to distinguish
the failure modes. To differentiate this new approach from the traditional single-failure mode
HALT that measures TTF data only, this modified method that has been used with multiple failure
modes has been dubbed HALST, which stands for “highly accelerated life stress testing.” 29 The
term “HALST” is used through the remainder of this paper as appropriate.

Deliverable to NASA Electronic Parts and Packaging (NEPP) Program to be published on nepp.nasa.gov, paper published in the IEEE Transactions on Components, Packaging and Manufacturing Technology, Vol. 5, No. 1, January 2015.
When IR degradation is accelerated under HALST conditions, a certain value of IR or of leakage
current must be used as the failure criterion at which the TTF can be determined. Per MIL-PRF-
123, BaTiO3-based MLCCs built for high-reliability applications were constructed with a
minimum dielectric thickness of 25m for rated voltages greater than 50V. In this case, the
leakage current level was very low, even under HALST conditions. The MLCC was considered a
failure when IR at a given stress condition was degraded three to four orders below its initial
value.20-21 Waser et al. have also defined characteristic lifetime tch at which the leakage current
has risen one decade above its minimum value to evaluate the degradation rate.10 With the progress
in Ni-BaTiO3 MLCC development, dielectric thicknesses have been significantly reduced, even
below two microns.22 As a result, leakage current has increased significantly, and Ni-BaTiO3
MLCCs are considered to have failed at a fairly low IR value. Some reports define the TTF as the
time at which IR is degraded to a value of 500k,22-23 1,000k,24 or 10% of its initial value,4 while
others set a constant leakage current limit at 100A for all of the stress conditions being used.25-29
After a review of most of the failure criteria that have been reported for determining the TTF of
MLCCs with BaTiO3 dielectrics, the author of this study decided to use a single current limit of
100A to determine the TTF for all stress levels and for all MLCC samples, based on the following
considerations:
During HALST, each MLCC unit was connected in series to a current-limiting resistor with a DC
power supply. The voltage drop across the series resistor was measured and used to calculate the
leakage current of the capacitor. Since the voltage drop on the current-limiting resistor is
dependent on the current value, a leakage current higher than 100A can result in a voltage drop
on the current-limiting resistor of more than 5% of the overall applied voltage. This is true for a
number of BME capacitors with thin dielectric layers that can be degraded under fairly low applied
voltages. Although this voltage drop can be reduced if a smaller-value resistor is used, the voltage
value reading on a small resistor may be too low to ensure the accuracy of the IR measurement.
For example, when an MLCC with a 100k resistor is accelerated at 150V, the voltage drop will
be 100k∙100A = 10V, which is 6.7% of the total applied voltage. For a 1k resistor, the voltage
drop is only 0.1V across the resistor, which may be too low to show the details of the leakage
current changing with the stress time. In this study, the values of the resistor were chosen such

Deliverable to NASA Electronic Parts and Packaging (NEPP) Program to be published on nepp.nasa.gov, paper published in the IEEE Transactions on Components, Packaging and Manufacturing Technology, Vol. 5, No. 1, January 2015.
that the maximum voltage drop at the current-limiting resistor will be no more than 3% of the
applied voltage under all HALST conditions.
III. RESULTS AND DISCUSSION
A. Characterization of time-dependent leakage current and MTTF data
(1) Leakage current and MTTF data
FIG. 1 shows the leakage current against stress time for the three BME capacitor lots at a given
stress condition: 155°C, 250V (5X rated voltage). The plots in FIG. 1 have the same scale on the
x-axis. It can be seen that these capacitor lots, when degraded at the same stress condition, revealed
significantly different TTF data. Further details about the characterization of the failure patterns
and about the method to determine the acceleration factors have been discussed in a previous
work.29
FIG. 1. Leakage current as a function of stress time for the three BME capacitor lots, degraded at 155°C,
250V. The plots were made with the same x-axis scale to reveal the difference in time-to-failure data.
A 2-parameter Weibull plot can be made when TTF data at a given stress level are available. The
MTTF, a statistical parameter that measures reliability, can be determined as:
𝑀𝑇𝑇𝐹 = 𝜂𝛤(1 + 𝛽−1), (1)
where slope β is the dimensionless shape parameter whose value is often characteristic of the
particular failure mode, η is the scale parameter that represents the time at which 63.2% of the
population has failed, and Γ(x) is the gamma function of x.
Table II summarizes the calculated MTTF data using Eq. (1) when all TTF data at a given stress
level were used to make a 2-parameter Weibull plot. The reliability life, as characterized by
MTTF, was more than one magnitude of difference among the capacitor lots under the same stress
condition.

Deliverable to NASA Electronic Parts and Packaging (NEPP) Program to be published on nepp.nasa.gov, paper published in the IEEE Transactions on Components, Packaging and Manufacturing Technology, Vol. 5, No. 1, January 2015.
Table II. Mean-Time-to-Failure Data of the Three BME Capacitor Lots
at Various Stress Conditions
MTTF (Minutes) of BME Capacitors
Test Conditions AA47450 AB47450 AC47450
250V 175C 1466 450 319
250V 165C 9869 1140 626
225V 165C 15423 2066 1046
250V 155C 31602 3659 1479
250V, 145C 86400 8895 2458
315V 155C 17721 1102 648
(2) Characterization of leakage current data for a slow degradation failure mode
As shown in Table I, all three BME capacitor lots that were made for the same reliability level
revealed almost identical construction and microstructure parameters and were also degraded
under very similar stress conditions. However, the MTTF data contained in Table II show
significant differences in reliability life for these BME capacitors. In order to understand the
mechanism that determines the reliability life, the leakage current data shown in FIG. 1 were re-
plotted with a different scale in the x-axis to reveal details of the differences in their failure modes.
As shown in FIG. 2, the TTF data appear to be highly dependent on the failure mode exhibited
during the HALST regimen.
FIG. 2. Leakage data are re-plotted from FIG. 1 with a different scale in the x-axis to reveal details in the
failure modes among the three BME capacitor lots.
As discussed in previous works,27-29 two failure modes can be identified in these BME capacitor
lots: catastrophic and slow degradation. A catastrophic failure is characterized by a time-
accelerating increase in leakage current that is mainly due to existing processing defects (voids,
cracks, delaminations, etc.) or to extrinsic defects. A slow degradation failure is characterized by
a near-linear increase in leakage current against stress time; this is caused by the electromigration

Deliverable to NASA Electronic Parts and Packaging (NEPP) Program to be published on nepp.nasa.gov, paper published in the IEEE Transactions on Components, Packaging and Manufacturing Technology, Vol. 5, No. 1, January 2015.
of oxygen vacancies (intrinsic defects). The TTF data shown in FIG. 2 clearly indicate that BME
capacitors with slow degradation failures exhibit the largest MTTF values (AA47450), and those
with the most catastrophic failures showed the smallest MTTF values (AC47450). Capacitor lot
AB47450 shows failures with both failure modes and with MTTF values in between those of the
other two capacitor lots.
As shown in FIG. 2, for a certain period of stress time, the leakage current follows a slow
degradation failure mode, i.e., a gradual increase in leakage current against stress time. With a
further increase of stress time, some capacitors will fail catastrophically, while some will retain
the slow degradation failure mode until the failure criterion is reached.
The leakage data shown in FIG. 2 have been curved-fitted with a number of different mathematical
functions (power law, exponential, linear, logarithmic, etc.). Although the leakage data shown in
FIG. 2 appear to be linear against most of the stress time measured, the curve-fitting results have
shown that the exponential form of
𝐼 = 𝐼(𝑡0)𝑒(
𝑡−𝑡0𝜏𝑆𝐷
) (2)
fits the leakage data better than a linear form. In Eq. (2), I is the measured leakage current, I (t0)
is the leakage value at t=t0, and SD is a characteristic exponential growth time.
FIG. 3 shows an example of curve fitting using Eq. (2) for two capacitor samples with different
failure modes. C13, with a near-linear increase in leakage, fits very well to Eq. (2) when all of the
measured leakage data points and a method of least squares were used. Although C7 fails with a
catastrophic failure characterized by a rapid leakage current increase at the end, the majority of the
leakage data follow a slow degradation failure mode and still fit well to Eq. (2). A similar value
of SD to that of C13 could be obtained. For some of the leakage data that finished with a strong
catastrophic failure, in order to obtain a proper value of SD, some of the leakage data points at the
catastrophic failure side have to be gradually removed until a value of R2 ≥ 0.99 is reached.
The meaning of 𝜏𝑆𝐷 can be illustrated by the following example: Let I1 and I2 be the leakages at
t1 and t2, respectively, for a slow degradation failure. If one assumes 𝐼2
𝐼1= 2, then Eq. (2) can be
rewritten as:

Deliverable to NASA Electronic Parts and Packaging (NEPP) Program to be published on nepp.nasa.gov, paper published in the IEEE Transactions on Components, Packaging and Manufacturing Technology, Vol. 5, No. 1, January 2015.
FIG. 3. Examples of curve fitting using Eq. (2) for two BME capacitor samples with different failure
patterns. Both appear to fit well to the exponential form of Eq. (2) for most of the stress time.
𝐼2
𝐼1= 𝑒
(𝑡2−𝑡1
𝜏𝑆𝐷)
= 𝑒(
∆𝑡𝜏𝑆𝐷
)= 2
and
𝜏𝑆𝐷 =∆𝑡
𝑙𝑛 (2)≈ 1.4427 ∙ ∆𝑡, (3)
where ∆t is the time at which the leakage current doubles in value. The greater the value of 𝜏𝑆𝐷,
the longer the timespan of a degradation failure, indicating a slower IR degradation process.
At a given stress condition, when the 𝜏𝑆𝐷 of all 20 BME capacitors being tested was obtained
using the curve-fitting method described above, a 2-parameter Weibull plot could be made, and
an average value of 𝜏𝑆𝐷, <SD>, was defined as the scale parameter η of the Weibull plot.
Table III summarizes the values of <SD> determined for various stress conditions. The table
can be used to compare the corresponding MTTF data. In most cases, the value of <SD> was
greater than that of MTTF, but it was smaller in a few lower-stress levels where the catastrophic
failure mode is dominant. Certainly the relationship between TTF and SD depends upon the
failure criterion, and if a fixed absolute value of leakage current is selected as the failure criterion,
then the relationship depends on the value chosen and on the initial leakage current value for the
capacitors.

Deliverable to NASA Electronic Parts and Packaging (NEPP) Program to be published on nepp.nasa.gov, paper published in the IEEE Transactions on Components, Packaging and Manufacturing Technology, Vol. 5, No. 1, January 2015.
Table III. Calculated MTTF Data from Weibull Plots of TTF Data and Calculated <SD> from
the Curve-fitting of the Three BME Capacitor Lots at Three Degradation Conditions
MTTF (Minutes) <SD> (Minutes)
Test Conditions AA47450
250V, 175°C 1466 3333
250V, 165°C 9869 11111
250V, 155°C 31602 34925
Test Conditions AB47450
250V, 175°C 450 667
250V, 165°C 1140 1714
250V, 155°C 3659 3333
Test Conditions AC47450
250V, 175°C 319 357
250V, 165°C 626 769
250V, 155°C 1479 1667
B. An IR degradation model for BME capacitors
(1) Time-dependent depletion layer height 𝝓(𝒕)
Although the formation of a double Schottky barrier layer at a grain boundary as shown in FIG. 4
was initially proposed to explain the PTCR effect in donor-doped semiconducting BaTiO3
ceramics,13-15 the same barrier depletion layer model has also been suggested to explain the IR
degradation in Ni-BaTiO3 MLCCs.2, 4, 9-11 The typical barrier height can be expressed as
𝜙 =𝑒2𝑁𝑑𝑑2
2𝜀0𝜀𝑟,
where Nd is the donor concentration, d is the depletion layer thickness, e is the electron charge,
and 𝜀0𝜀𝑟 is the dielectric constant. The electro-neutrality condition in the depletion layer satisfies
the following requirement:13
𝑑 =𝑛𝑠
2𝑁𝑑, (4)
where 𝑛𝑠 is the concentration of trapped electrons at grain boundary surface acceptor states (the
number is Ns) (cm-2). The barrier height 𝜙 can be rewritten as
𝜙 =𝑒2𝑛𝑠
2
8𝜀0𝜀𝑟𝑁𝑑. (5)

Deliverable to NASA Electronic Parts and Packaging (NEPP) Program to be published on nepp.nasa.gov, paper published in the IEEE Transactions on Components, Packaging and Manufacturing Technology, Vol. 5, No. 1, January 2015.
Eq. (5) has often been used to estimate the grain boundary barrier height in semiconducting BaTiO3
ceramics.34, 38 In Ni-BaTiO3 MLCCs, Nd is mainly determined by the bulk concentration of ionized
oxygen vacancies. Although oxygen vacancies migrate under an applied DC field and the weakly
bonded electrons can be trapped by the surface acceptor states, the value of depletion layer
thickness d in Eq. (4) is always in the submicron range, indicating that Nd >> ns. Therefore, one
can assume that Nd (t)≈Nd (0), and one can also assume time independence. Therefore, the time-
dependent barrier height 𝜙 can be expressed as
𝑑𝜙(𝑡)
𝑑𝑡=
𝑑
𝑑𝑡(
𝑒2𝑛𝑠2
8𝜀0𝜀𝑟𝑁𝑑) =
𝑒2
4𝜀0𝜀𝑟𝑁𝑑
𝑑𝑛𝑠(𝑡)
𝑑𝑡.
FIG. 4. Schematic illustration of the formation of a double Schottky barrier around the grain boundary of
a BaTiO3 ceramic capacitor, where 𝜙 is the depletion barrier height; 𝑛𝑠 is the concentration of trapped
electrons at the grain boundary surface acceptor states whose number is Ns (cm-2); and Es is the energy
level of the surface states from the conduction level of the bulk.
In order to determine 𝑑𝑛𝑠(𝑡)
𝑑𝑡, the following facts were considered: 1) 𝑛𝑠(𝑡) is trapped electrons at
surface acceptor states in the grain boundary regions. The negative space charge due to trapped
electrons is compensated for by the formation of a positive space charge region near the grain
boundary, which behaves like a depletion barrier layer to electron conduction. 2) The
computational analysis on the trapping of oxygen vacancies at grain boundaries with respect to
local atomic configuration and energy shows that grain boundaries attract oxygen vacancies and
trap them at specific sites at which local cation density is lower than that in the grain interior.17 3)
Since oxygen vacancies behave like donors, they possess positive space charges when ionized.

Deliverable to NASA Electronic Parts and Packaging (NEPP) Program to be published on nepp.nasa.gov, paper published in the IEEE Transactions on Components, Packaging and Manufacturing Technology, Vol. 5, No. 1, January 2015.
The same positive space charge in a barrier layer at a grain boundary will thus act as a resistance
for positively charged oxygen vacancy diffusion in a polycrystalline BaTiO3 dielectric. As a result,
when an ionized oxygen vacancy migrates under a DC field and reaches the barrier layer, it has a
tendency to become trapped there. The electro-neutrality condition requires that the weakly
bonded two electrons that are moving in a conduction band now have to be localized in order to
make the trapped oxygen vacancy neutralize and to become part of the crystalline structure. When
Kroger and Vink symbols are used,31 the process can be described by
𝑉𝑂 = 𝑉𝑂•• + 2𝑒′. (6)
As previously reported,4 the localized electrons that compensate the 𝑉𝑂•• localization can be
trapped with the reduction of Ti ions surrounding the 𝑉𝑂•• as 𝑇𝑖4+ + 𝑒′ → 𝑇𝑖3+, and 𝑇𝑖3+ + 𝑒′ →
𝑇𝑖2+.4 The reduction of Ti4+ will now reduce the positive space charge in the positively charged
depletion layer and reduce the barrier height. Since the barrier height is balanced by the trapped
electrons in surface acceptor states 𝑛𝑠(𝑡), the reduction in barrier height will lower the Fermi level
at grain boundary and then will reduce the 𝑛𝑠(𝑡) . If we assume that ∆𝑛𝑂 is the electron
concentration that has been localized to make the trapped 𝑉𝑂•• neutral, ∆𝑛𝑂 should meet the
following conditions: at t = 0, ∆𝑛𝑂(0) = 0, and at t→ ∞, ∆𝑛𝑂 = 𝑛𝑠(0), i.e., all trapped electrons
at t = 0 in the surface acceptor states 𝑛𝑠(0) will eventually be fully compensated for by the
localized electrons that neutralize the trapped 𝑉𝑂••. However, with a further increase of ∆𝑛𝑂 as
more 𝑉𝑂•• are trapped and neutralized, the electrically negative feature of 𝑛𝑠(𝑡) will further retard
the localization of electrons and reduce the localization rate of ∆𝑛𝑂. Therefore, the change of ∆𝑛𝑂
as a function of t can be expressed by a first-order reaction according to the reaction rate theory30
𝑑∆𝑛𝑂(𝑡)
𝑑𝑡= 𝐾(𝑡)[𝑛𝑠(0) − ∆𝑛𝑂(𝑡)],
and
∫𝑑∆𝑛𝑂(𝑡)
∆𝑛𝑂(𝑡)−𝑛𝑠(0)
∆𝑛𝑂(𝑡)
∆𝑛𝑂(0)
= ∫ −𝐾(𝑡)𝑑𝑡 (7)𝑡
0
where K(t) is the degradation rate constant and 𝑛𝑠(0) − ∆𝑛𝑂(𝑡) = 𝑛𝑠(𝑡) is the trapped electron
concentration at surface acceptor states at time t. If ∆𝑛𝑂(𝑡) is only balanced by 𝑛𝑠(𝑡) near the

Deliverable to NASA Electronic Parts and Packaging (NEPP) Program to be published on nepp.nasa.gov, paper published in the IEEE Transactions on Components, Packaging and Manufacturing Technology, Vol. 5, No. 1, January 2015.
Fermi level, 𝐾(𝑡) = 𝐾 = 𝐾0𝑒−𝐸𝑘𝑘𝑇 can be simplified as a time-independent constant in which 𝐸𝑘 is
the activation energy that is required for 𝑉𝑂•• in electromigration to be neutralized at a grain
boundary region per Eq. (6) and k is the Boltzmann constant. Since ∆𝑛𝑂(0) = 0, Eq. (7) finally
yields
𝑛𝑠(0)−∆𝑛𝑂(𝑡)
𝑛𝑠(0)= 𝑒−K𝑡,
and
∆𝑛𝑂(𝑡) = 𝑛𝑠(0)(1 − 𝑒−K𝑡), (8)
the remaining trapped electrons in acceptor states can be simply expressed according to Eq. (8) as
𝑛𝑠(0) − ∆𝑛𝑂(𝑡) = 𝑛𝑠(0) − 𝑛𝑠(0)(1 − 𝑒−K𝑡) = 𝑛𝑠(0)𝑒−K𝑡.
Combining Eqs. (5) and (8) yields a time-dependent barrier height
𝜙(𝑡) =𝑒2[𝑛𝑠(0) − ∆𝑛𝑂(𝑡)]2
8𝜀0𝜀𝑟𝑁𝑑= 𝜙(0)e−2Κt. (9)
This relationship indicates that the barrier height will exponentially decrease with time due to the
oxygen vacancy entrapment at grain boundaries.
(2) Determination of degradation rate constant K
The measurement of I-V characteristics of ceramic BaTiO3 inside the grain interior and at the grain
boundary has shown that under an applied field of 100kV/cm, the current density inside the grain
and at the grain boundary can differ by several orders of magnitude. The difference increases
significantly as temperature increases. 33 It is the grain boundary that holds the high resistivity of
the ceramic BaTiO3. If all grain boundaries inside a dielectric layer are assumed to have a uniform
barrier height 𝜙(𝑡), the time-dependent resistivity 𝜌(𝑡) of an MLCC can be written as13
𝜌(𝑡) = 𝜌0𝑒(
𝜙(𝑡)𝑘𝑇
), (10)

Deliverable to NASA Electronic Parts and Packaging (NEPP) Program to be published on nepp.nasa.gov, paper published in the IEEE Transactions on Components, Packaging and Manufacturing Technology, Vol. 5, No. 1, January 2015.
where 𝜌0 is the resistivity of the grain interier. According to Eq. (2), the time-dependent current
density of an MLCC 𝑗(𝑡) for a slow degradation failure mode can be expressed as
𝑗(𝑡) = 𝑗(𝑡0)𝑒(
𝑡−𝑡0𝜏𝑆𝐷
)=
𝐸
𝜌(𝑡),
or
𝜌(𝑡) = 𝐸
𝑗(𝑡0)𝑒
−(𝑡−𝑡0𝜏𝑆𝐷
), (11)
where 𝑗(𝑡0) is the current density at t = 𝑡0 and E is the applied field. Combining Eqs. (10) and
(11) results in
𝜌(𝑡) = 𝜌0𝑒𝑥𝑝 (𝜙(𝑡)
𝑘𝑇) = 𝜌0𝑒𝑥𝑝 (
𝜙(0)e−2Κt
𝑘𝑇) =
𝐸
𝑗(0)𝑒𝑥𝑝 (−
𝑡 − 𝑡0
𝜏𝑆𝐷).
At a given stress level, E is a constant, so
𝑡 − 𝑡0
𝜏𝑆𝐷≈ −
𝜙(0)
𝑘𝑇e−2Κt. (12)
Using ⟨𝜏𝑆𝐷⟩, the average of 𝜏𝑆𝐷, to replace 𝜏𝑆𝐷 , and 𝑒−𝑥 ≈ 1 − 𝑥 when x is small, the integration
of Eq. (12) results in
∫𝑡 − 𝑡0
⟨𝜏𝑆𝐷⟩
𝑀𝑇𝑇𝐹
0
𝑑𝑡 = − ∫𝜙(0)
𝑘𝑇· e−2Κt𝑑𝑡 ≈ − ∫
𝜙(0)
𝑘𝑇(1 − 2𝐾𝑡)𝑑𝑡,
𝑀𝑇𝑇𝐹
0
𝑀𝑇𝑇𝐹
0
and
1
2⟨𝜏𝑆𝐷⟩≈
𝜙(0)
𝑘𝑇(𝐾 −
1
𝑀𝑇𝑇𝐹).
This gives rise to
1
𝑀𝑇𝑇𝐹= 𝐾 −
𝑘𝑇
2𝜙(0)⟨𝜏𝑆𝐷⟩≈ 𝐾0𝑒−
𝐸𝑘𝑘𝑇. (13)
Eq. (13) is the well-known Prokopowicz-Vaskas equation for MLCCs, when applied voltage is a
constant.35 The degradation rate constant K can now be determined by an Arrhenius plot using the
MTTF data obtained at various temperatures and at a constant voltage.

Deliverable to NASA Electronic Parts and Packaging (NEPP) Program to be published on nepp.nasa.gov, paper published in the IEEE Transactions on Components, Packaging and Manufacturing Technology, Vol. 5, No. 1, January 2015.
Using the MTTF data at different temperatures and at a given voltage (250V) for the three BME
capacitor lots, a corresponding Arrhenius plot according to Eq. (13) can be plotted, as shown in
FIG. 5. Both activation energy 𝐸𝑘 and degradation rate constant 𝐾0 can now be determined.
FIG. 5. Arrhenius plots using Eq. (13) and measured MTTF data in Table II for the three BME capacitor
lots.
Table IV lists the activation energy 𝐸𝑘 and constant 𝐾0 at three different temperatures for the three
BME capacitor lots. The calculated K values shown in Table IV were used to estimate the MTTF
data per Eq. (13). A comparison between the measured MTTF data and the calculated data shows
fairly good agreement. All calculated MTTF values are smaller than the measured ones. For lot
AA47450, the MTTF data measured at 175°C were excluded for the estimation of the degradation
rate constant K because its value is much smaller when combined with other MTTF data points to
give rise to a good linear fitting. Since the BME capacitor lot under degradation was so leaky at
this temperature, the results of self-heating due to the leakage current could result in a significant
amount of temperature increase and thus an acceleration in the failure of the BME capacitors.
Table IV. Calculated Degradation Constant K and MTTF Data
per the Curve-Fitting Results in FIG. 5 and Eq. (13)
𝐾0𝑒
−𝐸𝑘𝑘𝑇 (ℎ𝑜𝑢𝑟−1) MTTF (minutes) at 155oC, 250V
Capacitor ID Ek (eV) at 398K (125oC) at 428K (155oC) Measured Calculated
AA47450 1.65 7.38x10⁻⁵ 2.10x10⁻³ 31602 28640
AB47450 1.63 6.76x10⁻⁴ 1.86x10⁻² 3459 3218
AC47450 1.11 4.94x10⁻³ 4.73x10⁻² 1479 1268

Deliverable to NASA Electronic Parts and Packaging (NEPP) Program to be published on nepp.nasa.gov, paper published in the IEEE Transactions on Components, Packaging and Manufacturing Technology, Vol. 5, No. 1, January 2015.
C. IR degradation mechanism due to oxygen vacancy electromigration
(1) Reliability and oxygen vacancy migration
According to Eq. (9),
𝜙(𝑡) = 𝜙(0)e−2Κt = 𝜙(0)e− 2t
𝑀𝑇𝑇𝐹,
and
1
𝑀𝑇𝑇𝐹=≈ 𝐾0𝑒−
𝐸𝑘𝑘𝑇 ,
where 𝐾 = 𝐾0𝑒−𝐸𝑘𝑘𝑇 is the degradation rate constant for oxygen vacancy entrapment at grain
boundaries. Although K and MTTF can be related to each other per the Prokopowicz-Vaskas
equation, the physical meaning of K was clearly defined in the proposed model. To make Ni-
BaTiO3 BME capacitors with improved reliability, the value of K must be minimized. This
requires a smaller value of the degradation constant K0, which is the total number of oxygen
vacancies that are migrate-able; and a large value of 𝐸𝑘, which is the activation energy required
for 𝑉𝑂•• to be neutralized and trapped near the depletion layer at grain boundaries. This has been
proven from the calculated K values shown in Table IV, where AA47450 and AB47450 are shown
to have similar values of 𝐸𝑘 but a much smaller value for K0, which gives rise to a significantly
improved reliability life (larger MTTF) for capacitor AA47450.
On the other hand, since a typical barrier height value of 𝜙(0) ≈1.30eV has been reported
previously,4 a large value of 𝐸𝑘 > 𝜙(0) is necessary to slow down the 𝑉𝑂•• entrapment, because a
large value of 𝐸𝑘 also means that the entrapment of 𝑉𝑂•• at grain boundaries may not be an
energetically favorable process unless the barrier height 𝜙(𝑡) is high enough to be comparable
to 𝐸𝑘. This is the case for AC47450, where 𝐸𝑘=1.11eV is smaller than that of 𝜙(0). Therefore,
the oxygen vacancies are more energetically favorable for local entrapment than for migrating
across the depletion barrier, and they result in a very small reliability life when compared to the
other two BME capacitor lots.
Finally, since 𝑁𝑑 ≫ 𝑛𝑠 per Eq. (4), only a tiny fraction of oxygen vacancies can be trapped at the
grain boundaries during the electromigration across the dielectric layer to cause IR degradation.

Deliverable to NASA Electronic Parts and Packaging (NEPP) Program to be published on nepp.nasa.gov, paper published in the IEEE Transactions on Components, Packaging and Manufacturing Technology, Vol. 5, No. 1, January 2015.
This indicates that the effort to simply reduce the level of 𝑉𝑂•• in the dielectric material would not
significantly slow down the IR degradation. Indeed, a small value of K0 indicates that the number
of electromigrate-able 𝑉𝑂•• must be minimized. The recent first-principles calculations based on
the density function theory have shown that some kinds of dopants in BaTiO3 dielectrics, such as
rare-earth (RE) and alkaline-earth (AE) elements, were effective in improving the reliability life
of Ni-BaTiO3 capacitors.17-19 According to the IR degradation model proposed here, both RE and
AE doping would benefit from the “frozen” migrate-able 𝑉𝑂•• and thus reduce the value of K0. On
the other hand, some RE doping elements, such as Dy and Er, due to their “amphoteric”
characteristics, will also benefit from the formation of deep surface acceptable states NS to result
in a large value of Ek. The correlations between the formulation and the value of the degradation
rate constant for oxygen vacancy entrapment K as defined in this work needs to be further
investigated.
(2) Insulation resistance and reliability life
According to Eq. (12),
𝑒𝑡−𝑡0𝜏𝑆𝐷 ≈ 𝑒−
𝜙(0)𝑘𝑇
e−2Κt
,
which indicates that a slower IR degradation process, characterized by a larger value of SD, would
give rise to a smaller value of 𝜙(0). This makes sense since a smaller 𝜙(0) will energetically be
favorable to the continuous electromigration of 𝑉𝑂•• without being trapped at a grain boundary to
cause an IR degradation. However, this is only one part of the equation; 𝜙(0) also presents the
barrier height for the conduction band electronic carriers. A lower 𝜙(0) will facilitate electronic
conduction and will also deteriorate the IR. As a result, when electron conduction and oxygen
vacancy electromigration are both taken into account, a moderate initial barrier height 𝜙(0) and a
smaller K are the keys for slowing the IR degradation in Ni-BaTiO3-based ceramic capacitors and
thus improving their reliability life.
As an important conclusion of this model development, higher IR values may not always result in
a larger MTTF, but a slower IR degradation rate (smaller K) will always have this effect. This
conclusion can be verified from the measured leakage data shown in FIG. 3, where sample

Deliverable to NASA Electronic Parts and Packaging (NEPP) Program to be published on nepp.nasa.gov, paper published in the IEEE Transactions on Components, Packaging and Manufacturing Technology, Vol. 5, No. 1, January 2015.
AC47450 was shown to have the highest initial IR values and smallest MTTF and AA47450 had
the lowest initial IR values but the largest MTTF among the group.
A higher 𝜙(0) generally means a higher resistance and therefore a higher electrical strength when
a DC voltage is applied. A higher DC electrical strength makes it more likely that a “thermal-
related electrical breakdown” will be experienced due to the localization of the electrical strength.9-
11
(3) Oxygen vacancy migration and compensation
Since only a very small portion of 𝑉𝑂•• may be trapped at the grain boundaries, the majority of 𝑉𝑂
••
will continually migrate and will eventually reach the dielectric layer and internal Ni electrode
interface, as has been shown by previously reported electron energy loss spectroscopy (EELS) and
high-resolution transmission electron microscope (HRTEM) observations.4
Since there is no evidence to show that 𝑉𝑂•• can be transferred across the cathode electrode
layer,4,10 most 𝑉𝑂•• capable of migration will now pile up along the Ni-electrode dielectric interface.
To neutralize these vacancies, a significant number of electrons is required, which can only be
obtained from the cathode electron injection. The energy required for cathode electron injection
at the dielectric-electrode interface is ~1.25eV.36 If Ek is less than this, most of the oxygen
vacancies will be energetically favorable for localization, and a quick IR degradation will occur.
This is exactly the case for lot AC47450.
The high concentration of localized electrons due to the compensation of the pile-up of oxygen
vacancies will not only dramatically change the local stoichiometry of the BaTiO3 dielectric, but
it will also lead to a leakage current increase during IR degradation. This will cause a local
temperature increase and will eventually lead to the breakdown at the Ni-BaTiO3 interface. The
initial failure site of the dielectric-electrode interface was clearly revealed in a previously
published failure analysis work regarding Ni-BaTiO3 ceramic capacitors.37
IV. SUMMARY AND CONCLUSIONS
Three BME capacitor lots with the same specification (chip size, capacitance, and rated voltage)
and reliability level, made by three different manufacturers, were selected for reliability
performance evaluation. The microstructure analysis of these capacitors showed that the three

Deliverable to NASA Electronic Parts and Packaging (NEPP) Program to be published on nepp.nasa.gov, paper published in the IEEE Transactions on Components, Packaging and Manufacturing Technology, Vol. 5, No. 1, January 2015.
BME products had a similar number of dielectric layers and a similar number of grains per
dielectric layer. When an external voltage was applied, the volts per grain was almost identical
for these capacitors, indicating that the dielectrics will experience the same voltage stress when
electrically tested under the same externally applied voltages.
These BME capacitors were then degraded using HALST under the same temperature and applied
voltage conditions. The reliability life, as characterized by MTTF, differed by more than one order
of magnitude among the capacitor lots.
A model based on the existence of depletion layers at grain boundaries and on the entrapment of
electromigrate-able oxygen vacancies was proposed to explain the MTTF difference among these
BME capacitors. The MTTF has been found to be directly related to the degradation rate constant
K of oxygen vacancy entrapment at grain boundaries. The MTTF and K were found to follow the
traditional Prokopowicz-Vaskas equation at a constant applied voltage.
A lower depletion layer height 𝜙(0) is energetically favorable for a slower degradation rate and a
longer reliability life. However, when both oxygen vacancy migration and electronic conduction
are taken into account, a 𝜙(0) with a moderate height would give rise to the best reliability
performance.
It is the conclusion of this study that reliability will not be improved simply by increasing the
insulation resistance. Indeed, Ni-BaTiO3 BME capacitors with a smaller IR degradation rate
constant K, or a smaller amount of entrapped 𝑉𝑂••at grain boundaries, will always give rise to a
longer reliability life.
Both RE and AE doping may have profound impacts on the values of degradation rate constant K,
and the impacts needs to be further investigated.
Acknowledgements
The author appreciates the NASA Electronic Parts and Packaging (NEPP) program’s support for
this study. The author would like to thank the NASA Goddard Space Flight Center Code 562 Parts
Analysis Laboratory for assistance with electrical testing.

Deliverable to NASA Electronic Parts and Packaging (NEPP) Program to be published on nepp.nasa.gov, paper published in the IEEE Transactions on Components, Packaging and Manufacturing Technology, Vol. 5, No. 1, January 2015.
References:
1 H. Kishi, Y. Mizuno, and H. Chazono, “Base-Metal Electrode-Multilayer Ceramic Capacitors: Past, Present and
Future Perspectives.” Jpn. J. Appl. Phys., Part 1, vol. 42 no. 3, pp. 1-15, January 2003.
2 H. Chazono and H. Kishi, “dc-Electrical Degradation of the BT-Based Material for Multilayer Ceramic
Capacitor with Ni internal Electrode: Impedance Analysis and Microstructure.” Jpn. J. Appl. Phys., Part 1, vol.
40, no. 9B, pp. 5624–5629, September 2001.
3 G. Y. Yang, G. D. Lian, E. C. Dickey, C. A. Randall, D. E. Barber, P. Pinceloup, M. A. Henderson, R. A. Hill,
J. J. Beeson, and D. J. Skamser, “Oxygen Nonstoichiometry and Dielectric Evolution of BaTiO3. Part I—
Improvement of Insulation Resistance with Reoxidation.” J. Appl. Phys., Vol. 96, no. 12, pp. 2492-2499,
December 2004.
4 G. Y. Yang, G. D. Lian, E. C. Dickey, C. A. Randall, D. E. Barber, P. Pinceloup, M. A. Henderson, R. A. Hill,
J. J. Beeson, and D. J. Skamser, “Oxygen Nonstoichiometry and Dielectric Evolution of BaTiO3. Part II—
Insulation Resistance Degradation Under Applied DC Bias.” J. Appl. Phys., Vol. 96, no. 12, pp. 7500-7508,
December 2004.
5 K. Morita, Y. Mizuno, H. Chazono, and H. Kishi, “Effect of Mn Addition on dc-Electrical Degradation of
Multilayer Ceramic Capacitor with Ni Internal Electrode.” Jpn. J. Appl. Phys., Part 1, vol. 41, no. 11, pp. 6957-
6961, November 2002.
6 H. Chazono and H. Kishi, “Effect of Ho Amount on Microstructure and Electrical Properties for Ni-MLCC.”
Key Eng. Mater., Vol. 2, no. 48, pp.183-186, August 2003.
7 D. F. K. Hennings, “Dielectric Materials for Sintering in Reducing Atmospheres.” J. Eur. Ceram. Soc., Vol. 21,
no. 10-11, pp. 1637-1642, November 2001.
8 Albertsen, K., Hennings, D. and D. Steigelmann, “Donor-Acceptor Charge Complex Formation in Barium
Titanate Ceramics: Role of Firing Atmosphere.” J. Electroceram., Vol. 2, no. 3, pp. 193-198, November 1998.
9 R. Waser, “Electrochemical Boundary Conditions for Resistance Degradation of Doped Alkaline‐Earth
Titanates.” J. Am. Ceram. Soc., Vol. 72, no. 12, pp. 2234-2240, December 1989.
10 R. Waser, T. Baitu, and K.H. Härdtl, “dc Electrical Degradation of Perovskite-Type Titanates: I. Ceramics.” J.
Am. Ceram. Soc., Vol. 73, no. 6, pp. 1645-1653, June 1990.
11 R. Waser, T. Baiatu, and K. H. Härdtl, “dc Electrical Degradation of Perovskite-Type Titanates: II. Single
Crystals.” J. Am. Ceram. Soc., Vol.73, no. 6, pp. 1654-1662, June 1990.
12 T. Baiatu, R. Waser, and K. H. Härdtl, “dc Electrical Degradation of Perovskite-Type Titanates: III. A Model of
the Mechanism.” J. Am. Ceram. Soc., Vol. 73, no. 6, pp. 1663-1673, June 1990.
13 W. Heywang, “Resistivity Anomaly in Doped Barium Titanate.” J. Am. Ceram. Soc., Vol. 47, no. 10, pp. 484-
490, October 1964.
14 G. Jonker, “Some Aspects on Semiconducting Barium Titanate.” Solid-State Electron., Vol. 7, pp. 895-903,
July 1964.
15 G. Jonker, “Halogen Treatment of Barium Titanate Semiconductors.” Mat. Res. Bull., Vol. 2, no. 4, pp. 401–
407, April 1967.

Deliverable to NASA Electronic Parts and Packaging (NEPP) Program to be published on nepp.nasa.gov, paper published in the IEEE Transactions on Components, Packaging and Manufacturing Technology, Vol. 5, No. 1, January 2015.
16 M. Vollman and R. Waser, “Grain Boundary Defect Chemistry of Acceptor-Doped Titanates: Space Charge
Layer Width.” J. Am. Ceram. Soc., Vol. 77, no. 1, pp. 235-243, January 1994.
17 T. Oyama, N. Wada, H. Takagi, and M. Yoshida, “Trapping of Oxygen Vacancy at Grain Boundary and its
Correlation with Local Atomic Configuration and Resultant Excess Energy in Barium Titanate: A Systematic
Computational Analysis.” Phys. Rev. B, Vol. 82, no. 13, pp. 134107-134116, July 2010.
18 A. Honda, S. Higai, Y. Motoyoshi, N. Wada, and H. Takagi, “Theoretical Study on Interactions Between
Oxygen Vacancy and Doped Rare-Earth Elements in Barium Titanate.” J. Appl. Phys., Vol. 50, no. 10, pp.
1143-1146, October 2011.
19 H. Moriwake, C. A. J. Fisher, and A. Kuwabara, “First-Principles Calculations of Rare-Earth Dopants in
BaTiO3.” J. Appl. Phys., Vol. 48, no. 9, pp. KC031-KC036, September 2009.
20 W. Minford, “Accelerated Life Testing and Reliability of High K Multilayer Ceramic Capacitors.” IEEE
Transactions on Components, Hybrids, and Manufacturing Tech., Vol. 5, no. 3, pp. 297–300, September 1982.
21 H. Pak and B. Rawal, “Reliability Prediction of Multilayer Ceramic Capacitors Using an Improved Accelerated
Life Test and Weibull Analysis Technique.” Proc. SPIE, Vol. 3235, pp. 362-367, October 1997.
22 M. Randall, A. Gurav, D. Skamser, and J. Beeson, “Lifetime Modeling of Sub 2 Micron Dielectric Thickness
BME MLCC.” CARTS Proceedings, Scottsdale, AZ, pp. 134-141, March 2003.
23 J. Yoon, K. Lee, and S. Lee, “Analysis of the Reliability of Multilayer Ceramic Capacitors with Inner Ni
Electrodes Under Highly Accelerated Life Test Conditions.” Tran. on Electrical and Electronic Mater., Vol. 10,
no. 1, pp. 1229-1234, February 2009.
24 M. Cozzolino, “A Comparison of BME and Traditional Technology Ceramic Capacitors.” CARTS Proceedings,
Orlando, FL, pp. 385-394, April 2006.
25 T. Ashburn and D. Skamser, “Highly Accelerated Testing of Capacitors for Medical Applications.” Proceedings
of the 5th SMTA Medical Electronics Symposium, Anaheim, CA, pp.124-131, January 2008.
26 J. Paulsen and E. Reed, “Highly Accelerated Lifetesting of Base-Metal-Electrode Ceramic Chip Capacitors.”
Microelectronics Reliability, Vol.42, no. 6, pp. 815-820, June 2002.
27 D. Liu and M. Sampson, “Reliability Evaluation of Base-Metal-Electrode Multilayer Ceramic Capacitors for
Potential Space Applications.” CARTS Proceedings, Jacksonville, FL, pp. 45-63, March 2011.
28 D. Liu and M. Sampson, “Some Aspects of the Failure Mechanisms in BaTiO3-Based Multilayer Ceramic
Capacitors.” CARTS Proceedings, Las Vegas, NV, pp. 59-71, March 2012.
29 D. Liu, “Highly Accelerated Life Stress Testing (HALST) of Base-Metal Electrode Multilayer Ceramic
Capacitors.” CARTS Proceedings, Houston, TX, pp. 235-248, March 2013.
30 D. Viehland, S. Jang, L. E. Cross, and M. Wuttig, “Deviation from Curie-Weiss behavior in Relaxor
Ferroelectrics.” Phys. Rev. B, Vol. 46, no. 13, pp. 8003-8006, October 1992.
31 F. Kröger and H. J. Vink, “Relations Between the Concentrations of Imperfections in Crystalline Solids.” Solid-
State Phys., Vol. 3, pp. 307–435, March 1956.
32 K. Connors, Chemical Kinetics, the Study of Reaction Rates in Solution, VCH Publishers, New York, 1991.
Deliverable to NASA Electronic Parts and Packaging (NEPP) Program to be published on nepp.nasa.gov, paper published in the IEEE Transactions on Components, Packaging and Manufacturing Technology, Vol. 5, No. 1, January 2015.
33 T. Nakamura, T. Yao, J. Ikeda, N. Kubodera, and H. Takagi. “Improvement of the Reliability of Dielectrics for
MLCC.” IOP Conference Series: Materials Science and Engineering, Vol. 18, no. 9, pp. 092007-092012, IOP
Publishing, 2011.
34 E. Brzozowski and M. Castro, “Influence of Nb5+ and Sb3+ Dopants on the Defect Profile, PTCR Effect and
GBBL Characteristics of BaTiO3 Ceramics.” J. European Cer. Soc., Vol. 24, no. 8, pp. 2499–2507, July 2004.
35 T. I. Prokopowicz and A. R. Vaskas, “Research and Development, Intrinsic Reliability, Subminiature Ceramic
Capacitors.” Final Report ECOM-90705-F, NTIS AD-864068, October 1969.
36 A. Polotai, I. Fujii, D. Shay, G. Yang, E. Dickey, and C. Randall, “Effect of Heating Rates During Sintering on
the Electrical Properties of Ultra-Thin Ni–BaTiO3 Multilayer Ceramic Capacitors.” J. Am. Ceram. Soc., Vol.
91, no. 8, pp. 2540-2544, August 2008.
37 R. Weachock and D. Liu, “Failure Analysis of Dielectric Breakdowns in Base-Metal Electrode Multilayer
Ceramic Capacitors.” CARTS Proceedings, Houston, TX, pp. 151-165, March 2013.
38 J. Illingsworth, H. AI-Allak, and A. Brinkman, “Dependence of the Grain Boundary Potential Barrier Height of
BaTiO3 Ceramics on Donor Dopant Concentration.” J. Phys. D: Appl. Phys., Vol. 23, no. 7, pp. 971-975, July
1990.