Instruments of the Money Market - Richmond Fed/media/richmondfedorg/... · Money market mutual...
17
Page 156 The information in this chapter was last updated in 1993. Since the money market evolves very rapidly, recent developments may have superseded some of the content of this chapter. Federal Reserve Bank of Richmond Richmond, Virginia 1998 Chapter 12 MONEY MARKET MUTUAL FUNDS AND OTHER SHORT-TERM INVESTMENT POOLS Timothy Q. Cook and Jeremy G. Duffield Short-term investment pools (STIPs) are financial intermediaries that purchase large pools of short-term financial instruments and sell shares in these pools to investors. Because it typically takes at least $100,000 to purchase most money market instruments, STIPs allow investors to gain access indirectly to money market yields with much smaller amounts of money than is possible through direct investment. STIPs also provide many investors greater liquidity, diversification, and a higher yield net of expenses than could be obtained by direct investment. The three major types of STIPs are money market mutual funds, short-term investment funds, and local government investment pools. Money market mutual funds are operated primarily by brokerage companies and mutual funds groups which sell shares in these funds to a wide variety of individual, corporate, and institutional investors. Short-term investment funds are operated by bank trust departments for their different accounts. Local government investment pools are typically established by individual state governments for their local governments. At the end of 1992, STIPs held over $700 billion in assets and played a significant role in the nation's money market. MONEY MARKET MUTUAL FUNDS Money market mutual funds (MMFs) can be divided into two categories: (1) taxable funds, which invest in securities such as Treasury bills and commercial paper that pay interest income subject to federal taxation, and (2) tax-exempt funds, which invest exclusively in securities that are exempt from federal taxation issued by state and local governments. Because of their unique investment strategy, tax-exempt funds appeal to a different group of investors than taxable MMFs and have experienced a different pattern of growth. For this reason, taxable and tax-exempt funds are discussed separately below.
Transcript of Instruments of the Money Market - Richmond Fed/media/richmondfedorg/... · Money market mutual...
Page 156
The information in this chapter was last updated in 1993. Since the money market evolves very rapidly, recent developments may have superseded some of the content of this chapter.
Federal Reserve Bank of Richmond Richmond, Virginia
1998
Chapter 12 MONEY MARKET MUTUAL FUNDS AND OTHER SHORT-TERM INVESTMENT POOLS Timothy Q. Cook and Jeremy G. Duffield
Short-term investment pools (STIPs) are financial intermediaries that purchase large pools of short-term
financial instruments and sell shares in these pools to investors. Because it typically takes at least $100,000
to purchase most money market instruments, STIPs allow investors to gain access indirectly to money
market yields with much smaller amounts of money than is possible through direct investment. STIPs also
provide many investors greater liquidity, diversification, and a higher yield net of expenses than could be
obtained by direct investment.
The three major types of STIPs are money market mutual funds, short-term investment funds, and local
government investment pools. Money market mutual funds are operated primarily by brokerage companies
and mutual funds groups which sell shares in these funds to a wide variety of individual, corporate, and
institutional investors. Short-term investment funds are operated by bank trust departments for their different
accounts. Local government investment pools are typically established by individual state governments for
their local governments. At the end of 1992, STIPs held over $700 billion in assets and played a significant
role in the nation's money market.
MONEY MARKET MUTUAL FUNDS
Money market mutual funds (MMFs) can be divided into two categories: (1) taxable funds, which invest in
securities such as Treasury bills and commercial paper that pay interest income subject to federal taxation,
and (2) tax-exempt funds, which invest exclusively in securities that are exempt from federal taxation issued
by state and local governments. Because of their unique investment strategy, tax-exempt funds appeal to a
different group of investors than taxable MMFs and have experienced a different pattern of growth. For this
reason, taxable and tax-exempt funds are discussed separately below.
Page 157
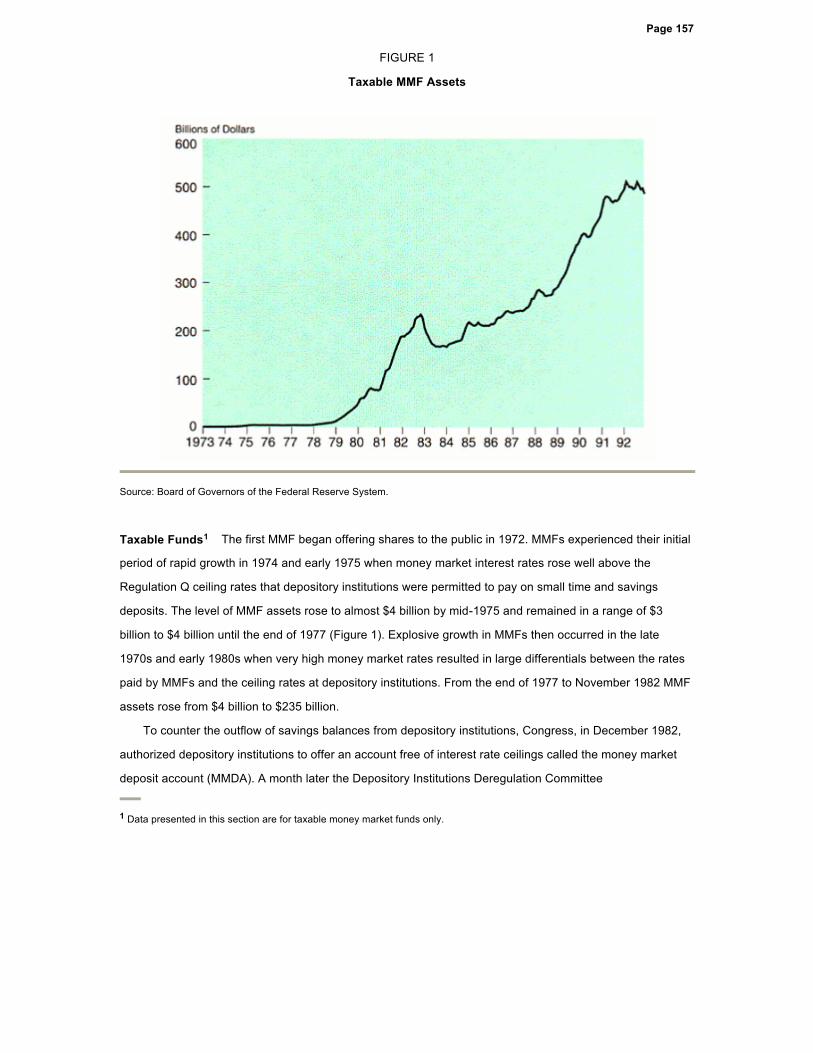
FIGURE 1
Taxable MMF Assets
Source: Board of Governors of the Federal Reserve System.
Taxable Funds1 The first MMF began offering shares to the public in 1972. MMFs experienced their initial
period of rapid growth in 1974 and early 1975 when money market interest rates rose well above the
Regulation Q ceiling rates that depository institutions were permitted to pay on small time and savings
deposits. The level of MMF assets rose to almost $4 billion by mid-1975 and remained in a range of $3
billion to $4 billion until the end of 1977 (Figure 1). Explosive growth in MMFs then occurred in the late
1970s and early 1980s when very high money market rates resulted in large differentials between the rates
paid by MMFs and the ceiling rates at depository institutions. From the end of 1977 to November 1982 MMF
assets rose from $4 billion to $235 billion.
To counter the outflow of savings balances from depository institutions, Congress, in December 1982,
authorized depository institutions to offer an account free of interest rate ceilings called the money market
deposit account (MMDA). A month later the Depository Institutions Deregulation Committee
1 Data presented in this section are for taxable money market funds only.
Page 158
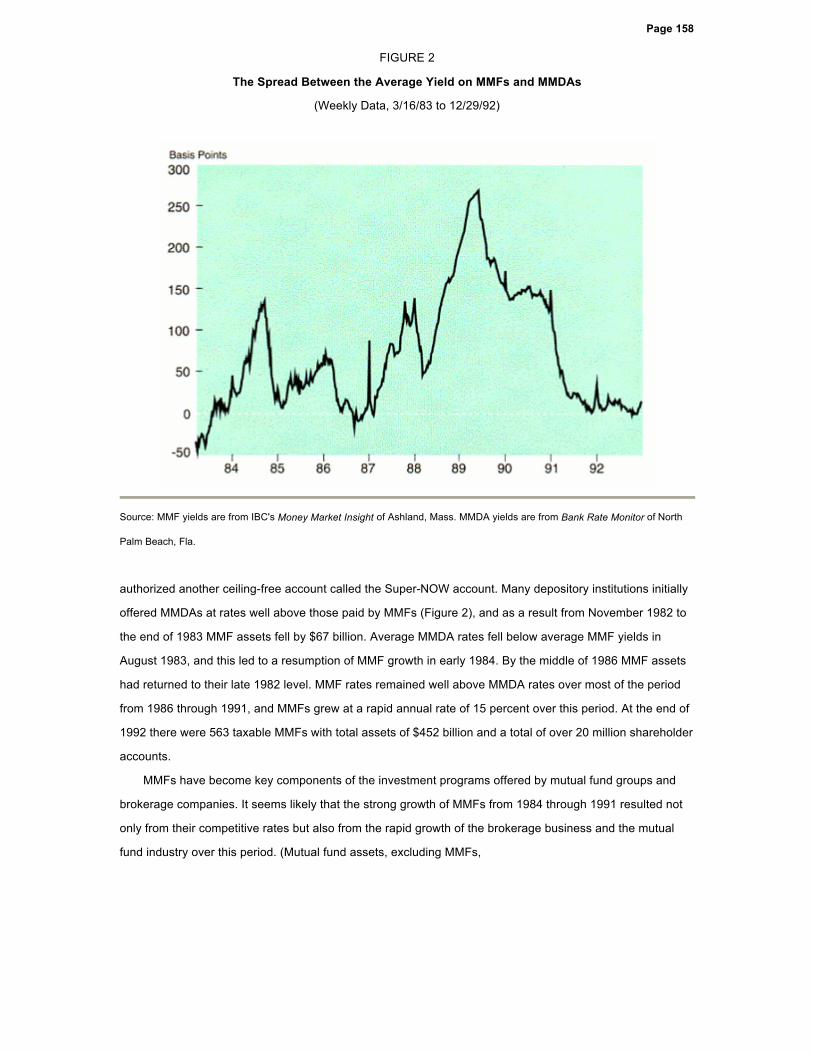
FIGURE 2
The Spread Between the Average Yield on MMFs and MMDAs
(Weekly Data, 3/16/83 to 12/29/92)
Source: MMF yields are from IBC's Money Market Insight of Ashland, Mass. MMDA yields are from Bank Rate Monitor of North
Palm Beach, Fla.
authorized another ceiling-free account called the Super-NOW account. Many depository institutions initially
offered MMDAs at rates well above those paid by MMFs (Figure 2), and as a result from November 1982 to
the end of 1983 MMF assets fell by $67 billion. Average MMDA rates fell below average MMF yields in
August 1983, and this led to a resumption of MMF growth in early 1984. By the middle of 1986 MMF assets
had returned to their late 1982 level. MMF rates remained well above MMDA rates over most of the period
from 1986 through 1991, and MMFs grew at a rapid annual rate of 15 percent over this period. At the end of
1992 there were 563 taxable MMFs with total assets of $452 billion and a total of over 20 million shareholder
accounts.
MMFs have become key components of the investment programs offered by mutual fund groups and
brokerage companies. It seems likely that the strong growth of MMFs from 1984 through 1991 resulted not
only from their competitive rates but also from the rapid growth of the brokerage business and the mutual
fund industry over this period. (Mutual fund assets, excluding MMFs,
Page 159
grew from $113 billion at the end of 1983 to $1,056 billion at the end of 1992.) Investors often use MMFs as
a parking place for cash reserves awaiting investment in longer-term financial assets such as stocks and
bonds. They also frequently exchange MMF shares for the shares of other funds in their mutual funds group.
Further, MMFs are generally the core vehicle in the popular cash management accounts offered by large
brokerage firms.
Individuals are the largest investors in MMFs. They generally purchase MMF shares through brokerage
firms or directly from mutual fund groups by mail, telephone, bank wire, or occasionally at offices maintained
by the fund organizations.
A variety of institutional investors, including bank trust departments, corporations, and retirement plans,
also use MMFs. The largest institutional investors are small and medium-sized bank trust departments
which use MMFs as a means of earning a market rate on the short-term reserves of their personal and
employee benefit trust accounts. (Large trust departments often set up their own internal pooling
arrangements called short-term investment funds, which are described below.) Small, midsize, and even
some larger corporations also use MMFs for cash management purposes. A special category of MMFs,
generally labeled "institutions-only," has evolved to deal solely with institutional investors. These funds offer
an array of services specially designed to meet the needs of institutions, such as electronic hookups
between the institution and the fund and subaccounting services to facilitate recordkeeping of a bank's trust
accounts. There were 144 taxable institutions-only MMFs at the end of 1992 with total assets of $145 billion.
Brokerage firms and mutual fund groups were traditionally the sole suppliers of money market fund
services. However, banks have become increasingly involved in the industry in recent years. The Glass-
Steagall Act of 1933 prevents banks from underwriting or distributing mutual fund shares. Legal decisions in
the late 1980s, however, established the right of a bank to serve as a fund's investment advisor and the right
to advise its customers to invest in funds managed by the bank. As a result, numerous banks have started
their own proprietary MMFs. To conform to the requirements of the Glass-Steagall Act, these banks hire an
outside firm to act as distributor of the fund's shares. Under this arrangement the bank earns the investment
advisory fee, which is typically the largest expense in operating an MMF, and may also earn other fees
related to various aspects of the fund's operations. By the end of 1992 bank proprietary money market funds
had assets totaling over $90 billion.
The general operating characteristics of MMFs are fairly standard. Minimum initial investments usually
range from $500 to $5,000, although a small number of funds require no minimum and institutions-only
MMFs typically require minimums of $50,000 or more. Most funds have a checking option that enables
shareholders to write checks against their account, usually with a minimum of $500 per check. Shares can
also be redeemed at most MMFs by telephone or
Page 160
wire request, in which case payment by the MMF is either mailed to the investor or remitted by wire to the
investor's bank account.
MMFs follow varying investment policies. One group of funds limit their assets to U.S. Treasury
securities, including in some cases repurchase agreements collateralized by Treasury securities. A second
group invests in securities of both the U.S. government and various government-sponsored enterprises. The
third and largest group of funds also invests in a variety of privately issued money market securities that
have received the highest credit rating by the national rating agencies—i.e., A1 by Standard & Poor's and P1
by Moody's. Prior to June 1991, many funds invested in privately issued securities with ratings below A1-P1,
but the number of funds doing so dropped sharply following restrictions (discussed below) placed on these
investments by the Securities and Exchange Commission.
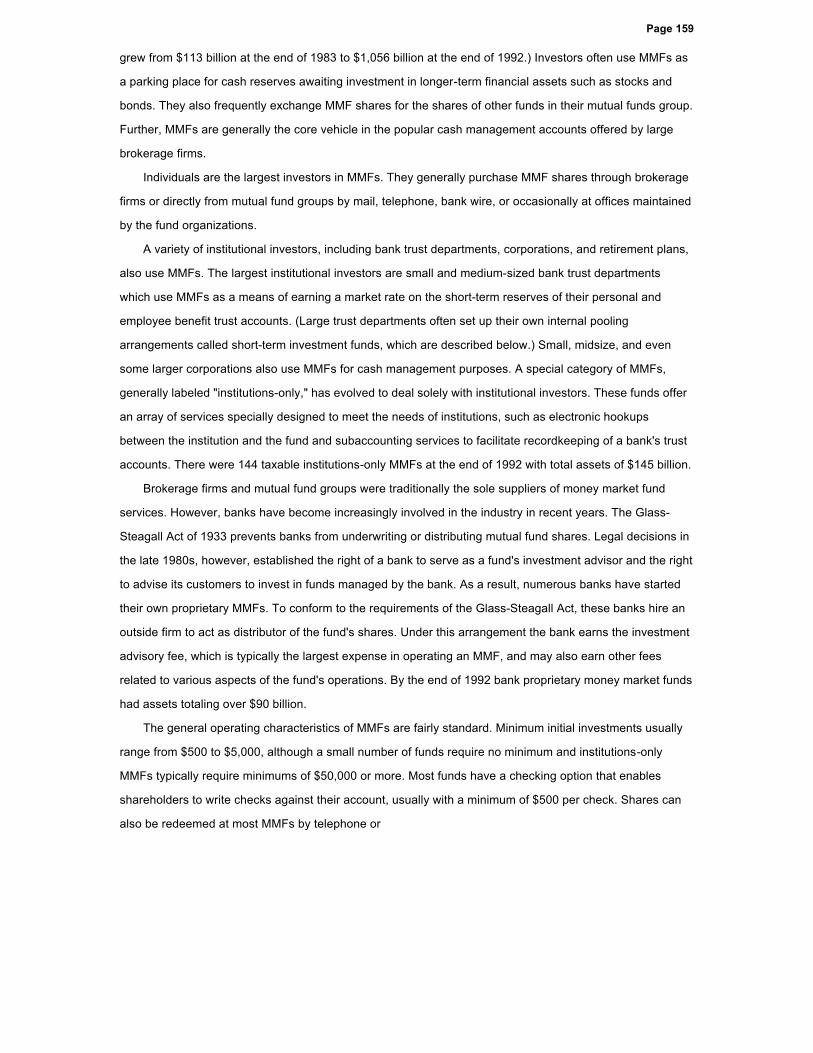
Table 1 shows the aggregate composition of MMF assets in December 1992. At that time 37.5 percent
of total MMF assets was held in commercial paper, 17.8 percent in U.S. Treasury securities, 11.9 percent in
securities of other federal agencies or government-sponsored enterprises, 15.2 percent in repurchase
agreements, 7.4 percent in domestic CDs, 4.1 percent in Eurodollar CDs, and 1.4 percent in bankers
acceptances.
TABLE 1
Composition of Taxable MMF Assets
(December 1992, in billions of dollars)
AmountPercent of
Total
U.S. Treasury bills 47.4 10.5
Other Treasury securities 33.2 7.3
Other U.S. securities 53.9 11.9
Repurchase agreements 68.8 15.2
Commercial bank CDs* 5.1 1.1
Other domestic CDs† 28.3 6.3
Eurodollar CDs** 18.6 4.1
Commercial paper 169.5 37.5
Bankers acceptances 6.4 1.4
Other 21.3 4.7
TOTAL 452.5 100.0
*Commercial bank CDs are those issued by American banks located in the
United States. † Other domestic CDs include those issued by S&Ls and American branches of
foreign banks. ** Eurodollar CDs are those issued by foreign branches of domestic banks and
some issued by Canadian banks.
Source: Investment Company Institute.

Page 161
The percentage of MMF assets invested in Treasury securities rose sharply in the latter half of the
1980s. One factor that may have contributed to the greater investment in Treasury securities was the
passage by most states of legislation that, in effect, raised the after-tax return earned by MMF shareholders
on their funds' holdings of Treasury securities. Federal law prohibits states from taxing the interest income
earned on securities issued by the U.S. government and by some government-sponsored enterprises such
as the Farm Credit System. (This prohibition does not extend, however, to other government-sponsored
enterprises such as the Federal National Mortgage Association and the Federal Home Loan Credit Bank.) In
recent years, almost all states have passed legislation permitting the pass-through of this tax-free status
from an MMF to its shareholders. The pass-through typically means that all interest income earned by a fund
from eligible securities can be passed through to shareholders as income exempt from state taxes. (A few
states require that a certain percentage of a fund's assets—usually 50 percent—be invested in eligible
securities for the pass-through to apply.)
The weighted-average maturity of taxable MMF assets ranged from 28 to 55 days over the six-year
period ending December 1992 and reached its highest levels in the last two years of that period (Investment
Company Institute). The major influence on maturity appears to be the interest rate expectations of MMF
investment advisors, some of whom extend their fund's maturity when they expect interest rates to fall.
Tax-Exempt Funds Tax-exempt money market funds invest in securities issued by state and local
government entities that pay interest income that is exempt from federal income taxes. Otherwise, they
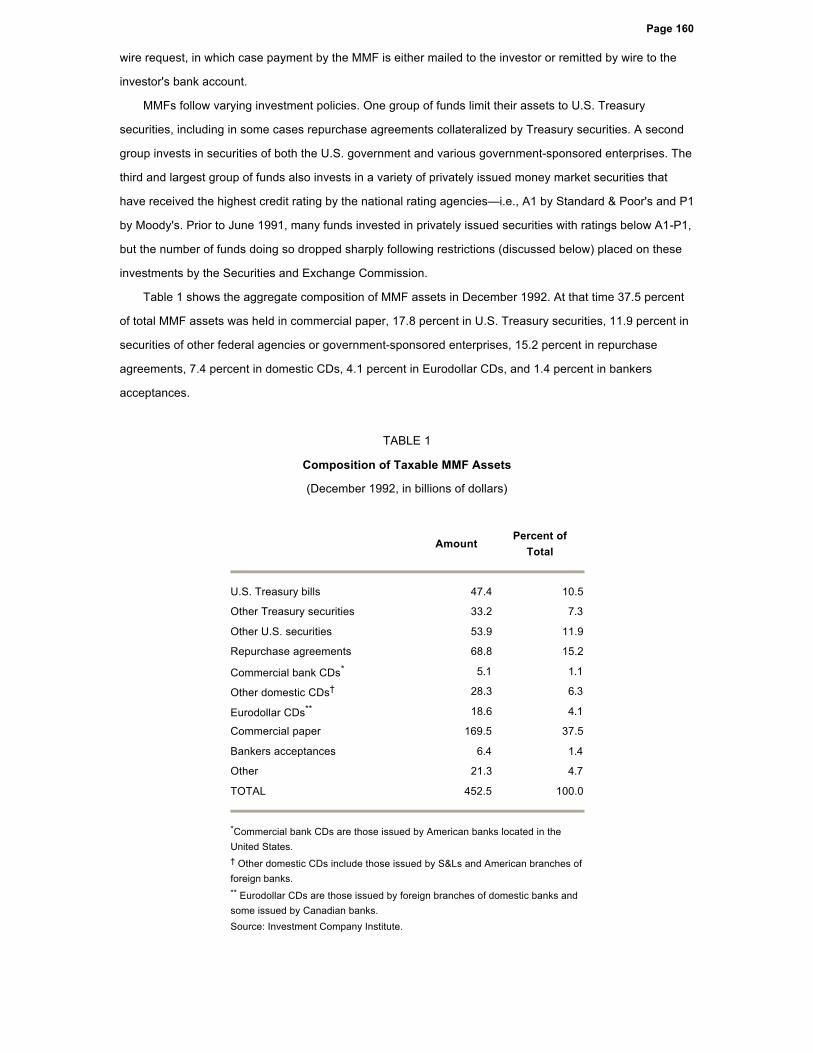
generally have the same features and operating characteristics as other MMFs. The first tax-exempt fund
offered shares to the public in 1977, but tax-exempt funds did not begin to experience rapid growth until the
early 1980s (Figure 3). At the end of 1992 there were 307 tax-exempt MMFs with total assets of $96 billion
and 1.5 million shareholder accounts. This included 45 institutions-only funds with total assets of $17 billion.
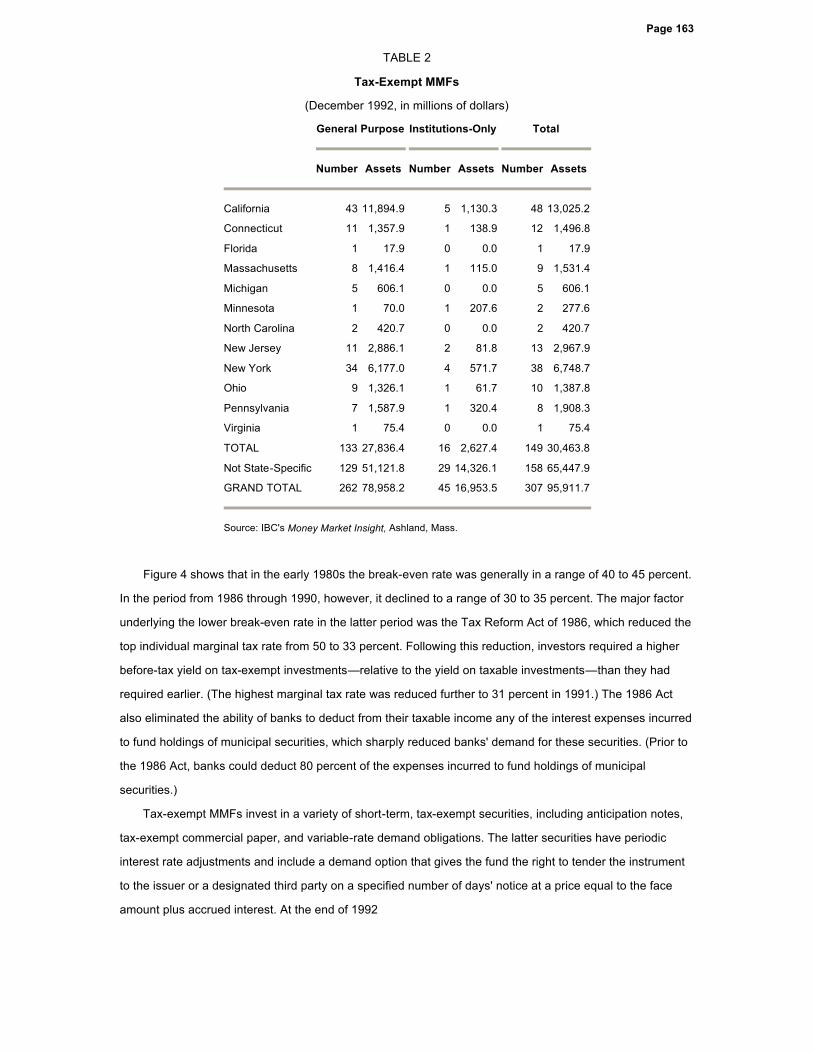
An important trend in recent years has been the proliferation of tax-exempt money market funds that
buy only securities issued by governments within a particular state. Such funds offer investors from those
states interest income exempt from federal, state, and, sometimes, local income taxes.2 State-specific tax-
exempt funds have proliferated mainly in states with high tax rates and large populations. The high tax rate
stimulates the demand for the state's securities by in-state residents, while the large population provides a
market big enough for the MMF sponsor. As shown in Table 2, by far the most tax-exempt MMFs are found
in California and New York, two states with high tax rates and large populations.
2 Investors in these funds, however, sacrifice the diversification available by investing in non-state-specific funds.
Page 162
FIGURE 3
Tax-Exempt MMF Assets
Source: Board of Governors of the Federal Reserve System.
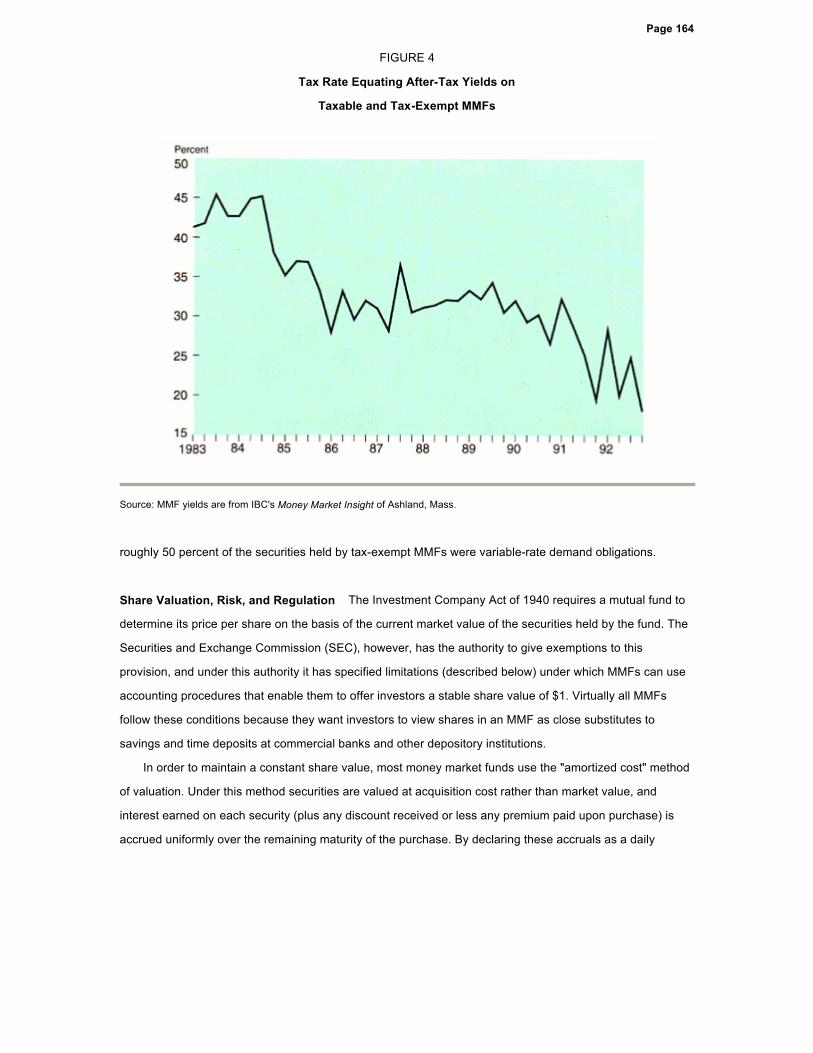
At the end of 1992, state-specific tax-exempt MMFs held about one-third of total tax-exempt MMF assets.
Because tax-exempt money market funds invest in tax-exempt securities, they appeal to investors in the
highest federal income tax brackets. To consider the decision faced by such investors, suppose the yield
earned by taxable MMFs is YT and the yield earned by tax-exempt MMFs is YTE. Then an investor with a
marginal income tax rate of t will earn an after-tax yield of YT(1 - t) by investing in the taxable MMF and YTE
by investing in the tax-exempt MMF. The break-even tax rate, t*, at which an investor would earn the same
after-tax rate in a taxable and tax-exempt MMF is:
t* = 1 - (YTE/YT).
An investor with a marginal tax rate greater than the break-even rate would earn a higher after-tax yield in a
tax-exempt money fund than in a taxable money fund.3
3 The actual value of the break-even tax rate also depends on differences in the credit quality and maturity of the assets held by
taxable versus tax-exempt funds.
Page 163
TABLE 2
Tax-Exempt MMFs
(December 1992, in millions of dollars)
Figure 4 shows that in the early 1980s the break-even rate was generally in a range of 40 to 45 percent.
In the period from 1986 through 1990, however, it declined to a range of 30 to 35 percent. The major factor
underlying the lower break-even rate in the latter period was the Tax Reform Act of 1986, which reduced the
top individual marginal tax rate from 50 to 33 percent. Following this reduction, investors required a higher
before-tax yield on tax-exempt investments—relative to the yield on taxable investments—than they had
required earlier. (The highest marginal tax rate was reduced further to 31 percent in 1991.) The 1986 Act
also eliminated the ability of banks to deduct from their taxable income any of the interest expenses incurred
to fund holdings of municipal securities, which sharply reduced banks' demand for these securities. (Prior to
the 1986 Act, banks could deduct 80 percent of the expenses incurred to fund holdings of municipal
securities.)
Tax-exempt MMFs invest in a variety of short-term, tax-exempt securities, including anticipation notes,
tax-exempt commercial paper, and variable-rate demand obligations. The latter securities have periodic
interest rate adjustments and include a demand option that gives the fund the right to tender the instrument
to the issuer or a designated third party on a specified number of days' notice at a price equal to the face
amount plus accrued interest. At the end of 1992
General Purpose Institutions-Only Total
Number Assets Number Assets Number Assets
California 43 11,894.9 5 1,130.3 48 13,025.2
Connecticut 11 1,357.9 1 138.9 12 1,496.8
Florida 1 17.9 0 0.0 1 17.9
Massachusetts 8 1,416.4 1 115.0 9 1,531.4
Michigan 5 606.1 0 0.0 5 606.1
Minnesota 1 70.0 1 207.6 2 277.6
North Carolina 2 420.7 0 0.0 2 420.7
New Jersey 11 2,886.1 2 81.8 13 2,967.9
New York 34 6,177.0 4 571.7 38 6,748.7
Ohio 9 1,326.1 1 61.7 10 1,387.8
Pennsylvania 7 1,587.9 1 320.4 8 1,908.3
Virginia 1 75.4 0 0.0 1 75.4
TOTAL 133 27,836.4 16 2,627.4 149 30,463.8
Not State-Specific 129 51,121.8 29 14,326.1 158 65,447.9
GRAND TOTAL 262 78,958.2 45 16,953.5 307 95,911.7
Source: IBC's Money Market Insight, Ashland, Mass.
Page 164
FIGURE 4
Tax Rate Equating After-Tax Yields on
Taxable and Tax-Exempt MMFs
Source: MMF yields are from IBC's Money Market Insight of Ashland, Mass.
roughly 50 percent of the securities held by tax-exempt MMFs were variable-rate demand obligations.
Share Valuation, Risk, and Regulation The Investment Company Act of 1940 requires a mutual fund to
determine its price per share on the basis of the current market value of the securities held by the fund. The
Securities and Exchange Commission (SEC), however, has the authority to give exemptions to this
provision, and under this authority it has specified limitations (described below) under which MMFs can use
accounting procedures that enable them to offer investors a stable share value of $1. Virtually all MMFs
follow these conditions because they want investors to view shares in an MMF as close substitutes to
savings and time deposits at commercial banks and other depository institutions.
In order to maintain a constant share value, most money market funds use the "amortized cost" method
of valuation. Under this method securities are valued at acquisition cost rather than market value, and
interest earned on each security (plus any discount received or less any premium paid upon purchase) is
accrued uniformly over the remaining maturity of the purchase. By declaring these accruals as a daily
Page 165
dividend to its shareholders, the fund is able to maintain a stable price of $1 per share.
Other money funds use a second procedure called "penny rounding" to maintain a stable share value.
Under this procedure the share value is calculated by rounding the per share market value of the fund to the
nearest cent on a share value of a dollar. If the market value of a share is kept within one-half cent of a
dollar, this accounting procedure allows the funds to offer a stable $1 share value.4
The potential problem with these procedures is that under certain conditions a gap may develop
between the true market value of a fund's share and the $1 stated value. For example, if interest rates rise,
the market value of the MMF's assets will fall below the value used by amortized cost valuations. The longer
the average maturity of a money market fund's portfolio, the greater the possible fluctuation in the true
market value around the stated $1 value. Similarly, the market value of a fund may fall below the stated
value because of credit problems on some of the commercial paper or other assets held by the fund. Lastly,
the greater the investment by a fund in a particular company's securities, the greater the possibility that the
credit problems of one company could lead to a significant divergence between the stated share value of a
fund and its underlying market value.
A significant divergence between the stated $1 value and the market value of a fund's share would
create an incentive for investors to redeem their shares quickly. Investors who redeemed their shares at $1
would receive more than their fair share of the funds assets, and the interests of the remaining shareholders
would be unfairly diluted. Eventually, a fund in this situation would be forced to devalue its shares below $1,
or "break the dollar" in the jargon of the money fund industry.
To minimize the likelihood of a divergence between a fund's stated $1 share value and the true market
value, the SEC as early as 1977 began to regulate the conditions under which MMFs were allowed to use
various accounting procedures.5 In 1983 the SEC issued Rule 2a-7 which codified the conditions required to
be met by all money market funds that wished to use the amortized cost or penny-rounding methods of
valuation. These conditions, sometimes called the risk-limiting rules, specify guidelines governing the
maturity, credit quality, and diversification of the assets of a fund that wishes to use the amortized cost or
penny-rounding methods of valuation.
4 The SEC in 1977 interpreted the Investment Company Act to mean that on a share value of a dollar a fund had to round its
share price within 1/10 of a cent of the per share market value (Release 9786, May 31, 1977). In other words, a fund with a per
share market value of 99.90 cents could round up to a dollar but a fund with a per share market value of 99.85 cents could not.
Penny rounding allows a fund with a per share value as low as 99.50 cents to round up to a dollar.
5 Cook and Duffield (1979a, pp. 16-17) relate the early history of the SEC's rulings governing share valuation.
Page 166
Rule 2a-7 required that funds using the amortized cost or penny-rounding methods of valuation maintain
an average dollar-weighted maturity of no more than 120 days and not acquire any security with a maturity
greater than a year. The rule also required that such MMFs purchase only securities rated "high quality" by a
major rating service or, if unrated, judged by the fund's board of directors to be of comparable quality. This
ruling, in effect, required that MMFs using the amortized cost or penny-rounding methods of valuation
purchase securities rated A1 or A2 by Moody's or P1 or P2 by Standard & Poor's.
In 1986 the SEC amended Rule 2a-7 to specify conditions under which funds relying on the rule could
acquire securities with demand features and to indicate how the maturity of variable-rate or floating-rate
securities with demand features would be determined for the purposes of meeting the maturity requirements
of the rule. Most importantly, the maturity of a variable-rate security with a demand feature (required by the
rule to be exercisable on no more than 30 days' notice) was deemed to be equal to the longer of the period
remaining until the next readjustment of the interest rate or the period remaining until the principal can be
recovered through demand. This amendment was particularly important to tax-exempt money market funds
because it enhanced their ability to acquire long-term variable-rate securities with demand features while still
maintaining a constant $1 share value.
Events in the commercial paper market in 1989 and 1990 led the SEC in 1991 to reevaluate the risk-
limiting provisions of Rule 2a-7. Prior to 1989, there had been only two major commercial paper defaults in
the postwar period. In 1989, however, a major commercial paper issuer defaulted on $213 million of
outstanding paper, and two funds held enough of the issuer's paper to jeopardize their ability to maintain a
$1 share value. The funds' advisors averted the possibility of a decline in the $1 share value by purchasing
the paper in question from the funds. In 1990 two additional issuers defaulted on their commercial paper,
which was held by a number of money funds. Once again, the funds' advisors came to the rescue by
purchasing the paper in question from the funds.
In reaction to these events, the SEC in 1991 tightened the risk-limiting rules governing the credit quality,
diversification, and maturity of taxable MMFs that wished to use the amortized cost or penny-rounding
accounting methods. Most importantly, the SEC decided that a firm following these procedures had to invest
95 percent of its assets in "First Tier" securities, which generally speaking was defined to include Treasury
securities or privately issued securities rated A1-P1, and had to invest the remainder in "Second Tier"
securities rated A2-P2.6 The SEC also required that a fund invest no more than 1 percent of its assets in
6 Crabbe and Post (1992) document the decline in MMFs' holding of A2-rated paper following the imposition of this regulation
and conclude that the regulation raised the interest rate on A2 paper relative to the rate on A1 paper.
Page 167
any particular Second Tier company or 5 percent of its assets in any First Tier company.7 Finally, the SEC
lowered the average maturity requirement from 120 to 90 days.
All MMFs wishing to use the amortized cost or penny-rounding accounting methods were required to
follow the SEC's new rules on maturity. Tax-exempt funds, however, were exempted from the restrictions on
Second Tier investment and from the 5 percent diversification test. The exemption was based on the view
that some of these funds often would have difficulties meeting the tests because of the limited number of
tax-exempt issuers available to them (for example, state-specific funds).
In addition to revising the risk-limiting rules, the SEC in 1991 made it unlawful for any mutual fund to use
the term "money market" or any similar term as part of its name or to hold itself out to investors as a money
market fund unless it met the risk-limiting conditions of Rule 2a-7. This provision effectively defined a money
market fund as a mutual fund that follows the risk-limiting provisions of Rule 2a-7. Finally, in order to
increase investor awareness that investing in a money market fund is not without risk, the SEC required that
the cover page of a money market fund prospectus prominently disclose that the MMF's shares are neither
insured nor guaranteed by the U.S. government and that there is no assurance that the funds will be able to
maintain a stable value of $1 per share.
Expenses and Waivers Virtually all MMFs are no-load mutual funds in which investors purchase and
redeem shares without paying a sales charge. Expenses of the funds are instead deducted daily from gross
income before shareholder dividends are declared. The difference between the yield earned on an MMF's
assets and the yield earned by shareholders is the MMF's expense ratio (defined as the ratio of total
expenses on an annual basis to average assets). Institutional funds typically have lower expense ratios than
other funds because of their much higher average balances. In the fourth quarter of 1992 the average
expense ratio was 0.36 percent for institutional taxable funds and 0.74 percent for other taxable MMFs.8 The
expense ratios for tax-exempt funds were 0.40 percent for institutional funds and 0.64 percent for other
funds. These averages mask a wide variation in individual fund expense ratios, which range from as little as
0.2 percent to 1.0 percent or more.
Typically, the largest MMF expense is the management fee charged by the fund's advisor, which is
usually also the sponsor of the fund. This fee compensates the fund's advisor for administering the fund and
managing its portfolio.
7 The Investment Company Act of 1940 has a 5 percent diversification requirement with respect to 75 percent of a mutual fund's
assets, but no diversification requirement with respect to 25 percent of its assets. The effect of this provision of the 1991
amendment to Rule 2a-7 was to expand the 5 percent diversification requirement to the entire portfolio of taxable MMFs.
8Lipper Directors' Analytical Data, Lipper Analytical Securities, December 1992.
Page 168
Another fee charged by many MMF advisors is the so-called "12b-1" fee (named after an SEC rule) that
reimburses the fund's sponsor for the advertising and marketing costs associated with distributing shares.
Other MMF operating expenses cover the custody of securities and transactions and communications with
shareholders.9 In addition to operating expenses, MMFs pay various registration fees and taxes and incur
other expenses resulting from government regulations and requirements, such as auditing expenses and
directors' fees.
The sponsors of many MMFs waive part of the fund's expenses to keep the expense ratio charged to
the funds' shareholders to an acceptable level. In some cases the expense waiver is part of an explicit
commitment by the MMF's sponsor to place a limit on the expenses of the funds absorbed by shareholders.
In other cases the waiver is an informal management arrangement that may be terminated by the sponsor at
any time. In reports to shareholders the waiver is often couched in terms of the sponsor "foregoing" part of
its management fee. In some instances, the sponsor not only foregoes all of the management fee but also
absorbs other expenses of the funds.
Most small MMFs waive part of their funds' expenses in order to compete more effectively with larger
funds. Economies of scale are present in the MMF industry which means that average costs of small funds
are higher than average costs of large funds.10 By waiving some expenses, fund sponsors can offer
shareholders yields that are more competitive with those offered by the larger funds. To the extent that this
approach attracts new shareholders, a small MMF can grow to an asset level where its costs can be fully
passed on to shareholders.
Some fund sponsors waive a significant portion of their fund's expenses even after the fund has
reached a large size, although eventually they eliminate most, if not all, of the waiver. By providing the
waiver for an extended period of time in the early years of a fund's life, the fund is able to offer unusually
high yields and attract shareholders who it believes are likely to stay with the funds even after the waiver is
eliminated. Some advisors may also view their MMF as a "loss leader" to attract investors to other funds in
their fund group.
SHORT-TERM INVESTMENT FUNDS
Short-term investment funds (STIFs) are collective investment funds operated by bank trust departments. A
collective investment fund is an arrangement whereby the monies of different accounts in the trust
department are pooled to purchase a certain type of security, such as common stocks, corporate bonds, tax-
exempt
9 Cook and Duffield (1979a) provide a detailed breakdown and discussion of MMF expenses.
10 In a study of MMF costs using data from 1977 and 1978, Cook and Duffield (1979a) find that average costs of MMFs decline
as assets increase, at least up to asset levels of $50 million. (This would be roughly equal to $100 million in 1992 dollars.)
Page 169
bonds, or, in the case of STIFs, short-term securities. STIFs function exactly like MMFs and offer the same
advantages to holders of trust department accounts. In particular, the minimum investment is usually a
negligible amount and funds can be invested and withdrawn without transactions fees.
The first STIF appears to have been started in 1968. By the end of 1974 there were over 70 STIFs with
total assets of almost $3 billion. STIFs began to grow rapidly when interest rates rose in the late 1970s, and
by the end of 1979 there were 250 STIFs with over $32 billion in assets. STIFs continued to grow in the
1980s, and at the end of 1991 there were 318 STIFs with total assets of $144 billion.
Most bank trust departments without STIFs use MMFs for their trust accounts. The decision to set up a
STIF or to use an MMF is largely dependent on the size of the trust department. The larger the trust
department the more likely it is to have a STIF.11
Regulations on the portfolio of STIFs set by the Comptroller of the Currency require that (1) at least 80
percent of investments be payable on demand or have a maturity not exceeding 91 days and (2) not less
than 20 percent of the value of the fund's assets be composed of cash, demand obligations, and other
assets that mature on the fund's next business day. As a result of these regulations, STIFs hold a
substantial amount of variable-amount notes (also called master notes), which are a type of open-ended
commercial paper that allows the investment and withdrawal of funds on a daily basis and pays a daily
interest rate tied to the current commercial paper rate. In addition, STIFs hold a large amount of standard
commercial paper.
Most STIFs fall into two broad categories. The first is for the accounts of personal trusts and estates.
These STIFs receive tax-exempt status under the condition that income earned by the fund is distributed to
participating account holders. The second type of STIF is for the accounts of employee benefit plans that are
exempt from taxation under the Internal Revenue Code. Under IRS regulations monies of these tax-exempt
employee benefit accounts cannot be mixed with monies of personal trust and estate accounts. Hence, if a
bank trust department wishes to provide STIF services to both types of accounts, it must establish two
separate STIFs.
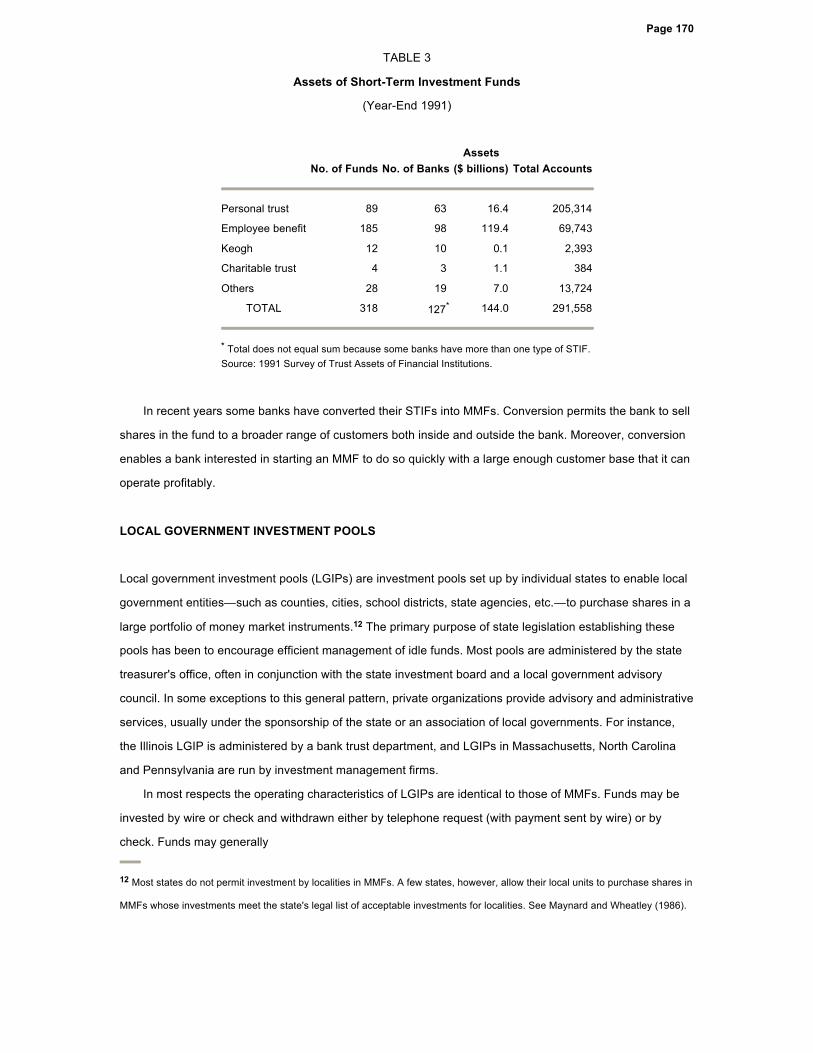
Table 3 shows the aggregate numbers and total assets of each type of STIF as of year-end 1991. At
that time 205,314 personal trust accounts had a total of $16.4 billion invested in STIFs, while 69,743
employee benefit accounts had a total of $119.4 billion invested in STIFs. There was also a small amount of
funds invested in STIFs for charitable and other accounts.
11 American Bankers Association (1979, pp. 16 and 22) and Cook and Duffield (1979b, p. 22) present survey data from two
different sources that document this relationship.
Page 170
TABLE 3
Assets of Short-Term Investment Funds
(Year-End 1991)
In recent years some banks have converted their STIFs into MMFs. Conversion permits the bank to sell
shares in the fund to a broader range of customers both inside and outside the bank. Moreover, conversion
enables a bank interested in starting an MMF to do so quickly with a large enough customer base that it can
operate profitably.
LOCAL GOVERNMENT INVESTMENT POOLS
Local government investment pools (LGIPs) are investment pools set up by individual states to enable local
government entities—such as counties, cities, school districts, state agencies, etc.—to purchase shares in a
large portfolio of money market instruments.12 The primary purpose of state legislation establishing these
pools has been to encourage efficient management of idle funds. Most pools are administered by the state
treasurer's office, often in conjunction with the state investment board and a local government advisory
council. In some exceptions to this general pattern, private organizations provide advisory and administrative
services, usually under the sponsorship of the state or an association of local governments. For instance,
the Illinois LGIP is administered by a bank trust department, and LGIPs in Massachusetts, North Carolina
and Pennsylvania are run by investment management firms.
In most respects the operating characteristics of LGIPs are identical to those of MMFs. Funds may be
invested by wire or check and withdrawn either by telephone request (with payment sent by wire) or by
check. Funds may generally
12 Most states do not permit investment by localities in MMFs. A few states, however, allow their local units to purchase shares in
MMFs whose investments meet the state's legal list of acceptable investments for localities. See Maynard and Wheatley (1986).
No. of Funds No. of BanksAssets
($ billions) Total Accounts
Personal trust 89 63 16.4 205,314
Employee benefit 185 98 119.4 69,743
Keogh 12 10 0.1 2,393
Charitable trust 4 3 1.1 384
Others 28 19 7.0 13,724
TOTAL 318 127* 144.0 291,558
* Total does not equal sum because some banks have more than one type of STIF.
Source: 1991 Survey of Trust Assets of Financial Institutions.
Page 171
be invested and withdrawn on a daily basis. Interest is earned daily net of the pool's expenses.
The first LGIPs were established in the early 1970s by Connecticut, Illinois, Montana, and Utah. By
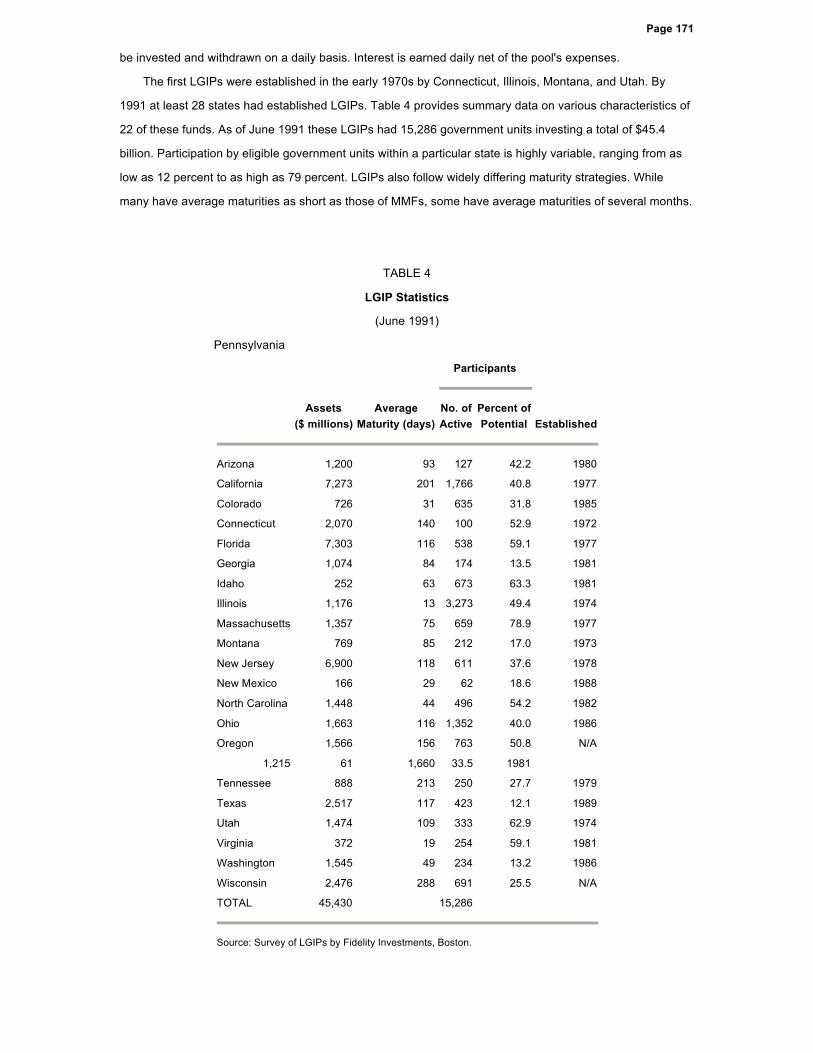
1991 at least 28 states had established LGIPs. Table 4 provides summary data on various characteristics of
22 of these funds. As of June 1991 these LGIPs had 15,286 government units investing a total of $45.4
billion. Participation by eligible government units within a particular state is highly variable, ranging from as
low as 12 percent to as high as 79 percent. LGIPs also follow widely differing maturity strategies. While
many have average maturities as short as those of MMFs, some have average maturities of several months.
TABLE 4
LGIP Statistics
(June 1991)
Pennsylvania
Participants
Assets
($ millions)Average
Maturity (days)No. of Active
Percent of Potential Established
Arizona 1,200 93 127 42.2 1980
California 7,273 201 1,766 40.8 1977
Colorado 726 31 635 31.8 1985
Connecticut 2,070 140 100 52.9 1972
Florida 7,303 116 538 59.1 1977
Georgia 1,074 84 174 13.5 1981
Idaho 252 63 673 63.3 1981
Illinois 1,176 13 3,273 49.4 1974
Massachusetts 1,357 75 659 78.9 1977
Montana 769 85 212 17.0 1973
New Jersey 6,900 118 611 37.6 1978
New Mexico 166 29 62 18.6 1988
North Carolina 1,448 44 496 54.2 1982
Ohio 1,663 116 1,352 40.0 1986
Oregon 1,566 156 763 50.8 N/A
1,215 61 1,660 33.5 1981
Tennessee 888 213 250 27.7 1979
Texas 2,517 117 423 12.1 1989
Utah 1,474 109 333 62.9 1974
Virginia 372 19 254 59.1 1981
Washington 1,545 49 234 13.2 1986
Wisconsin 2,476 288 691 25.5 N/A
TOTAL 45,430 15,286
Source: Survey of LGIPs by Fidelity Investments, Boston.
Page 172
CONCLUSION
Short-term investment pools revolutionized the money market by providing virtually all investors access to
money market investments. When MMFs and other STIPs first emerged in the mid-1970s, a widespread
view was that they were solely a reaction to interest rate ceilings at depository institutions and that they
would disappear after these ceilings were removed. Time has proved this view incorrect, as STIPs have
continued to grow rapidly even in the absence of these ceilings. This growth reflects the ability of STIPs to
offer competitive money market yields and their widespread use in conjunction with other products offered
by mutual fund groups, brokerage companies, and bank trust departments.
REFERENCES
American Bankers Association. Collective Investment Funds Survey Report, 1979. Washington, D.C.
Cook, Timothy Q., and Jeremy G. Duffield. "Short-Term Investment Pools," Federal Reserve Bank of Richmond
Economic Review, vol. 66 (September/October 1980), pp. 3-23.
________. "Average Costs of Money Market Mutual Funds," Federal Reserve Bank of Richmond Economic Review,
vol. 65 (July/August 1979), pp. 32-39.
________. "Money Market Mutual Funds: A Reaction to Government Regulations or a Lasting Financial Innovation?"
Federal Reserve Bank of Richmond Economic Review, vol. 65 (July/August 1979), pp. 15-31.
Crabbe, Leland, and Mitchell A. Post. "The Effect of SEC Amendments to Rule 2a-7 on the Commercial Paper
Market," Finance and Economics Discussion Series #199. Washington: Board of Governors of the Federal
Reserve System, May 1992.
Maynard, David E., and Priscilla M. Wheatley. "At the Crossroads: Private Sector Perspectives on Public Sector
Investing," Government Finance Review, February 1986, pp. 15-21.