
Instruments and Methods for Biology and Medicine 2019
98
Instruments and Methods for Biology and Medicine 2019 Sítná Sq. 3105 272 01 Kladno May 23, 2019 Conference proceedings Tomáš Parkman Taťána Jarošíková (Editors)
Transcript of Instruments and Methods for Biology and Medicine 2019

Instruments and Methods for Biology and Medicine
2019
Sítná Sq. 3105
272 01 Kladno
May 23, 2019
Conference proceedings
Tomáš Parkman
Taťána Jarošíková
(Editors)

INSTRUMENTS AND METHODS FOR BIOLOGY AND MEDICINE 2019
Conference proceedings
Edited by
Tomáš Parkman, Taťána Jarošíková
Published by Czech Technical University in Prague
Compiled by Faculty of Biomedical Engineering
Sítná sq. 3105, 272 01 Kladno
Tel.: +420 224 359 967
Printed by Powerprint s.r.o.
Brandejsovo nám. 1219/1, Praha - Suchdol, 16500
98 pages
First Edition
ISBN 978-80-01-06643-0

Proc. of IMBM 2019 iii
Preface
The ninth student´s conference Instruments and Methods for Biology and Medicine 2019 (IMBM 2019) took
place at the Faculty of Biomedical Engineering of the Czech Technical University in Prague on 23rd May 2019.
The target group of the IMBM conference was traditionally students of the follow-up Masters studies
Instruments and methods for biomedicine who had a unique opportunity to present the results of their research
project or diploma project. In addition to the opportunity to test their presentation skills during an oral
presentation under the supervision of the Department's teachers and invited experts from other CTU faculties
and employees of the Institute of the Academy of Sciences of the Czech Republic, they also present the results
of their research in these proceedings.
The conference was attended by 19 students, and their presentations were thematically divided into three
sections: Advanced Method for Biomedicine, Biophysical Methods and Imaging, and Development and
Application of Nanomaterials. The best talk in each session was selected by an evaluation committee and its
author awarded. The evaluation committee consists of 5 members, and the section evaluators were traditionally
teachers working at our department and quests of the conference:
Prof. Ing. Vrbová Miroslava, CSc.
Prof. RNDr. Evžen Amler, CSc.
Doc. Ing. Pospíšilová Marie, CSc.
Ing. Otáhal Martin, Ph.D.
Mgr. Široká Romana, Ph.D.
Ing. Kalábová Hana
In the morning section, Prof. Evžen Amler from UCEEB CTU and 2nd LF UK, who is a leading expert
in the field of functionalized nanofibers in regenerative medicine and tissue engineering, presented his invited
lecture. The afternoon section was presented by Ing. Jan Kudláček from the Institute of Physiology of the
Academy of Sciences, which deals with the animal model for the study of epilepsy. I would like to thank them
heartily for their contributions.
My great thanks go to Prof. Vrbová, who for the ninth year has been a professional guarantor and soul not
only of the organization of our conferences but also of the entire study program Instruments and Methods for
Biomedicine, whose students are targeted by the conference.
Besides, I would like to thank all members of the organizing team who participated in the preparation of
the conference, the management of the sections, the evaluation of the student contributions, and the preparation
of this proceeding.
Spatial thanks to Tomáš Parkman, who suggested the program and Book of Abstracts, created conference
website and prepared the Proceedings.
Furthermore, I would like to give a great compliment and thank all students – members of the IMBM
conference for their active participating and preparing of this proceeding.
I would also like to thank the Czech Technical University in Prague for the generous financial support of
the conference – CTU grant No. SVK 45/19/F7.
In Kladno, October 10th, 2019
RNDr. Taťána Jarošíková, CSc.
Conference coordinator

iv Proc. of IMBM 2019

Proc. of IMBM 2019 v
Table of Contents
Invited Lectures ............................................................................................................................................... 7
Functionalized nanofibers in regenerative medicine and tissue engineering ............................................... 9
Long-term dynamics of seizures in an animal model of epilepsy ................................................................ 10
Advanced Methods for Biomedicine ............................................................................................................ 11
Properties of mesenchymal stem cells during 3D culture in ECM-based scaffolds .................................... 13
Growth and metabolic activity of mesenchymal stem cells derived from different sources ........................ 16
Automatic segmentation of basal ganglia and thalamus and comparison of susceptibility values in patients
with Parkinson's disease .............................................................................................................................. 20
Influence of pH environment on fluorescence spectra of samples of healthy and carcinoma cell cultures 23
Biophysical characterisation of non-motor actin translocations ................................................................ 28
Consequence of the decrease of dopaminergic neurons and movement parameters in the presymptomatic
and manifest phase of Parkinson's disease .................................................................................................. 32
Neuromelanin quantification in the substantia nigra in neuromelanin-sensitive MRI scans ...................... 37
Biophysical Methods and Imaging ............................................................................................................... 43
Microwave monitoring of ischemia by newborns ........................................................................................ 45
Pulse length optimization of a picosecond CPA-based disc laser with power of > 100 W ........................ 49
Reconstruction and properties of T2* maps based on the number of iterations and their correlation with
QSM in Parkinson's disease patients ........................................................................................................... 53
4D embryogenesis study using X-Ray micro-CT ......................................................................................... 57
Applicator for regional hyperthermia based on metamaterial theory ......................................................... 62
Proposal and realization of hybrid antenna suitable for microwave hyperthermia and microwave imaging
based on radar method ................................................................................................................................ 66
Accuracy of energy expenditure measurement by wearable electronics ..................................................... 70
Development and Application of Nanomaterials ........................................................................................ 75
Using a fluorescent nanodiamond for targeted knock-down of microRNA ................................................. 77
Calcium doped carbon based biocompatible coating ................................................................................. 81
Improvement of DLC implant coating using hybrid laser technology and germanium dopation ............... 85
DLC nanolayers doped by titanium for surgical implants .......................................................................... 91
Effect of nanodiamond particles on neuronal tissue ................................................................................... 95

vi Proc. of IMBM 2019

Proc. of IMBM 2019 7
Invited Lectures

8 Proc. of IMBM 2019

Proc. of IMBM 2019 9
Functionalized nanofibers in regenerative medicine and tissue
engineering
Evžen Amler
University Centre for Energy Efficient Buildings of Czech Technical University in Prague, Buštěhrad, Czech Republic
Second Faculty of Medicine (2. LF UK,), Charles University, Prague 5, Czech Republic
Regenerative medicine focuses on the repair of damaged or lost tissues and on the recovery of their function.
Tissue engineering is an interdisciplinary approach that involves development of artificial scaffolds, cell
isolation, culture, characterization, seeding on the scaffolds, their testing in vitro and subsequent preclinical
testing.
The artificial scaffolds should fulfil many requirements. Firstly, the good biocompatibility of the material,
allowing good cell adhesion, and proliferation along with the cell differentiation into desired tissue are
expected. The most expected biodegradability should fulfil the demands of the materials for the healing of
different tissues, such as faster degradation in days or weeks for soft tissues or slow degradation in several
months for bone regeneration. The proper material porosity should allow good nutrition and waste products
diffusion, good cell migration into the scaffold, cell spreading, differentiation and extracellular matrix
synthesis.
Different materials are used in tissue engineering including gels, foams, 3D-printed materials, and
nanofibers. The composite materials are often used as they combine materials with different physico-chemical
characteristics, different nano/micro structure and different biomechanical properties.
Nanofibers are fibers with the diameter from tens of nanometers up to 100 nm in one dimension. However,
quite often, sub-microfibers are prepared with the diameter of hundreds of nanometers. Nanofibers have
structure similar to extracellular matrix and are reported to support cell adhesion and proliferation.
Nanofibers are prepared by electrospinning, which uses high voltage to form nanofibers from the solution
or melt. Other technics include needleless electrospinning, and coaxial electrospinning. Nanofibers can be
prepared from one material or from mixtures or even from 2 immiscible solutions, e.g. organic and water
solution. The last system allows mixing of water soluble compounds into water phase and thus preservation of
their bioactivity during coaxial electrospinning with other organic solvent.
The functionalization of nanofibers means the addition of bioactive molecules either inside the nanofibers
or on their surface. The surface functionalization includes simple adhesion of proteins, platelets, growth
factors, liposomes, or covalently binding of proteins, enzymes, and antibodies. Their effect is fast with higher
concentrations of either released or available bioactive molecules allowing high cell response in a short time.
For example, thrombocytes adhered on the surface of nanofibers release growth factors upon their activation
and influence the proliferation and metabolic activity of different cells differently. In addition, binding specific
molecules, e.g. aminoacids, lectins or antibodies targets binding to specific cell receptors and cause specific
cell response.
Oppositely, functionalization of nanofibers inside the nanofiber enables slower release of molecules. The
velocity of release can be tailored by the change in composition of the core material, and the shell material, it
viscosity, molecular weight, the degradation rate of the nanofibers. The presence of liposomes increases the
amount and bioactivity of drugs or growth factors in nanofibers and allows their sustained release during
10-20 days. This enables decreasing of the dose of growth factors or drug which decreases their toxicity but
maintain their effect for longer time.
Thus nanofibers can serve as a drug delivery system that can be widely tailored according to the needs of
specific tissues. Moreover, they can be easily combined with other materials which provide them with
improved biomechanical properties which are necessary for some tissues and can be used for the regeneration
of different tissues.

10 Proc. of IMBM 2019
Long-term dynamics of seizures in an animal model of epilepsy
Jan Kudlacek1,2,3,*, Jan Chvojka1,2,3, Antonin Posusta1, Jakub Otahal1,2, Premysl Jiruska1,2,3
1Department of Developmental Epileptology, Institute of Physiology of the Czech Academy of Sciences, Prague, Czech
Republic 2Department of Circuit Theory, Faculty of Electrical Engineering, Czech Technical University in Prague, Prague,
Czech Republic 3Department of Physiology, Second Faculty of Medicine, Charles University and Motol University Hospital, Prague,
Czech Republic
Introduction
The long-term fluctuations in seizure probability and seizure clustering were multiple times reported in both
patients and animal models of epilepsy including the tetanus toxin model in rats. The aim of this study was to
explore the mechanisms which govern cluster progression and cluster onset.
Methods
Epilepsy was induced in adult rats (n=6) by injection of 10 ng of tetanus toxin into the right dorsal
hippocampus. Electrodes were implanted bilaterally into dorsal hippocampus and motor cortex. Animals were
continuously video-EEG monitored for >2 weeks. Seizures were identified and classified as convulsive or non-
convulsive. Signal power during seizures was analyzed in each studied brain area. Apart from that, we analyzed
long-term evolution of epileptic bursts – few second long series of EEG spikes. We analyzed their rate,
duration, power and channel cross-correlation.
Results
We analyzed one seizure cluster in each animal. Clusters lasted 2.3±0.2 days and contained 90±15 seizures.
All clusters were characterized by progressive increase of ISI. The percentage of convulsive seizures
progressively increased in all clusters (p=0.008) and so did the signal power in the motor cortices (p=0.008)
whereas in the hippocampi a non-significant decrease of power was observed (p=0.74). Between the clusters,
we observed increasing rate, power and spread of epileptic bursts whereas the duration produced a U-shape.
Conclusion
We have shown that during the course of a single cluster, the brain undergoes complex changes. We
hypothesize that early non-convulsive seizures facilitate spreading of later seizures. In contrast, later
generalized seizures have inhibitory effect which leads to reduction of seizure rate and finally to the cluster
termination. Between the clusters, changes of the epileptic burst can be interpreted as increase of excitability
and delayed recovery from internal perturbations which may serve as an early warning signal of impending
transition to the next seizure cluster.
Acknowledgements Supported by grants AZV 17-28427A, 15-33115A and GACR 18-07908S.

Proc. of IMBM 2019 11
Advanced Methods
for Biomedicine

12 Proc. of IMBM 2019
Proc. of IMBM 2019 13
Properties of mesenchymal stem cells during 3D culture in ECM-based
scaffolds
Eliška Vavřinová1*, Taťána Jarošíková1, Yuriy Petrenko2
1Czech Technical University in Prague, Faculty of Biomedical Engineering, Kladno, Czech Republic. 2Institute of Experimental Medicine AS CR, Prague, Czech Republic
Abstract: The aim of the work was to fabricate the 3D wide-porous scaffolds, using decellularized human
umbilical cord ECM and to assess the morphology and viability of Wharton’s jelly mesenchymal stem cells
(WJ-MSCs) during 3D cell culture. The wide-porous scaffolds were fabricated using cryogelling technique.
WJ-MSCs were cultured in monolayer or 3D conditions, afterwards their morphology and metabolic activity
have been analysed. The study shows the possibility of using 3D ECM-based scaffolds as the matrix for the
expansion of WJ-MSCs and tissue engineering applications.
Introduction
Tissue engineering is one of the most promising
advances in medical treatment [1]. Tissue
engineering is multi-disciplinary field, which
applies cell biology, chemistry, physics and
engineering to create or develop the tissue
equivalents, which can be used to restore the
function of damaged tissues or organs [2, 3]. One
of the main therapeutic approaches in tissue
engineering is based on the implantation of cell
seeded scaffolds, combining the principles of cell
therapy and the use of biomaterials [1]. Tissue
engineering research is presently being conducted
on several different types of tissues and organs,
including skin, cartilage, blood vessels, bone and
others. There are three main components of tissue
engineering: the cells, the scaffolds and the
signalling molecules/engineering approaches (e.g.
growth factors, bioreactors).
Mesenchymal stem cells (MSCs) hold great
potential as a cellular component of tissue
engineering because of their ability for self-
renewal and differentiation into tissue-specific
cells such as osteoblasts, chondrocytes or
adipocytes. Moreover, they have unique paracrine
activity [2, 3].
Administration of MSCs (intravenously or by
direct injection into the tissue) may not produce
consistent clinical results because the cells
administered show limited survival in the host
tissue [2].
The scaffolds act as templates for the three-
dimensional tissue formation. They should be
biocompatible, non-toxic and biodegradable and
provide the adhesion of cells, their ability to
function normally and migrate through the
structure. There are different biomaterials for the
scaffold fabrication, including polymeric, nature
ceramic or composite materials [3].
Decellularized extracellular matrix (ECM) is a
natural, unique and promising biomaterial for
scaffold fabrication. It can be obtained from the
allogeneic (human) or xenogeneic (animal) tissues.
From the ECM it is possible to fabricate solids
scaffolds, hydrogels or their composites [3]. The
main characteristic effects of ECM scaffolds in
supporting tissue regeneration are maintaining 3D
structure and the bioactive components. Their
natural 3D structure provides structural support
and tensile strength, attachment sites for cell
surface receptors, and a reservoir for signaling
factors, cell migration, cell proliferation, and
orientation in wound healing [4]
Umbilical cord (UC) is unique source of
human-derived biomaterial for scaffold
preparation, with low immunogenicity [7].
Wharton´s jelly is a firm mucoid connective tissue
surrounding umbilical cord vessels. Wharton´s
jelly has unique biochemical characteristics
required for scaffold.
Usually, the ECM materials are predominantly
composed of collagen, glycosaminoglycans
(GAGs), laminin, fibronectin, and other proteins
and their degradation products, with biomolecular
components depending on the source tissue and the
decellularization method [4, 6, 7]. It was
previously shown that UC ECM provides the
growth and function of MSCs derived from
different sources [7].
The aim of the work was to fabricate the 3D
wide-porous scaffolds, using decellularized human

Vavřinová et al.: Properties of mesenchymal stem cells during 3D culture in ECM-based scaffolds
14 Proc. of IMBM 2019
umbilical cord ECM and to assess the morphology
and viability of Wharton’s jelly mesenchymal stem
cells during 3D cell culture.
Materials and methods
WJ-MSCs were cultured in complete culture
medium, composed of alpha-MEM (a-MEM,
Gibco), supplemented with 5% of pooled human
platelet lysate (PL) until passage 4 and harvested
by trypsinization for further studies.
The wide-porous scaffolds were prepared by
cryogelling method. Briefly, ECM solution
(provided by the IEM AS CR) was frozen at -20 °C
overnight, dehydrated and cross-linked by 1%
EDC (1-Ethyl-3-(3-dimethylaminopropyl). After
being washed thoroughly with deionized water, the
scaffolds were placed in 70% ethanol for
sterilization. Prior to further use, the obtained
porous scaffolds were washed by PBS and
complete culture medium.
WJ-MSCs (105 cells) were seeded in a
minimal volume of culture medium into the
scaffolds or onto the tissue culture plastic (TCP).
Cells were allowed to attach during 1 hour,
afterwards the complete culture medium was
added.
The biocompatibility of scaffolds, cell
morphology and viability were assessed after 24
hours of culture. The viability and morphology of
WJ-MSCs within the scaffolds were assessed by
Live/Dead assay (Calcein AM/Ethidium
homodimer staining, Thermo Fisher Scientific Inc.,
USA), according to manufacturer’s instructions.
Briefly, cells within the scaffolds were washed
with PBS to reduce background fluorescence,
stained for 5 minute and analysed by fluorescent
microscopy. It is known that the fluorescence
microscopy allows observation of living cells with
minimal perturbation of their normal function and
visualizes the organization and dynamics of
macromolecules in the context of a living cell [8].
The biocompatibility of the scaffolds was
measured by studying the metabolic activity of WJ-
MSCs using Alamar blue assay. AlamarBlue is cell
viability reagent based on solution of resazurin
(non-toxic) which works as a cell health indicator
by using the reducing power of living cells to
quantitatively measure viability [9].
Briefly, cells within the scaffolds or on TCP
were incubated in complete culture medium,
containing 10% Alamar blue (Thermo Fisher
Scientific Inc., USA) solution for 3 hours,
afterwards the fluorescence intensity of the Alamar
blue reduced form was measured at excitation
wavelength 550 nm and emission 590 nm using
Tecan Genios microplate reader (Tecan,
Switzerland). The data was presented as ratio to
background control as relative fluorescent units
(RFU).
Results
The cryogelling technique allowed to obtain
the wide-porous spongy scaffolds from
the decellularized UC-ECM with diameter 8 mm
and height 10 mm (Figure 1).
After 24 hours of culture we analysed the
biocompatibility of the scaffolds by Alamar blue
assay. The fluorescence intensity of the WJ-MSCs
grown within the 3D ECM scaffolds was similar to
TCP control group (Figure 2), confirming high
compatibility of scaffolds and preservation of
metabolic activity of cells. Moreover, the similar
Alamar blue reduction between the groups may
confirm the high seeding efficiency of WJ-MSCs
into the UC-ECM based scaffolds.
Figure 1. The representative view of 3D umbilical cord
extracellular matrix-based scaffold.
Figure 2. The metabolic activity of MSCs 24 hours after cell
seeding (Alamar Blue assay).
0
1
2
3
4
5
ECM scaffold TCP control
Ala
mar
blu
e (R
FU
/sam
ple
)
24 hours post-seeding

Vavřinová et al.: Properties of mesenchymal stem cells during 3D culture in ECM-based scaffolds
Proc. of IMBM 2019 15
The morphology of WJ-MSCs on TCP and
within ECM-based scaffolds is presented on
Figure 3.
After seeding and culturing of MSCs within
the 3D scaffolds cells were characterized by the
normal fibroblast-like morphology (Figure 3A),
similar to those cultured on TCP (Figure 3B).
The viability of WJ-MSCs remained high,
which was confirmed by the absence of ethidium
homodimer positive (red) cells (Figure 3A).
Moreover, the cells distributed within the whole
volume of the scaffold.
Conclusion
We fabricated the 3D wide-porous scaffolds using
decellularized human umbilical cord hydrogel as
biomaterial. The obtained scaffolds are
biocompatible with WJ-MSCs, support their
attachment and growth in vitro, preserving cells
viability and specific morphology.
The study confirms great potential of 3D umbilical
cord ECM-based cryogels as scaffolds for
regenerative medicine and tissue engineering
applications.
Acknowledgements: The work was done in the department of
Biomaterials and Biophysical Methods in Institute of
Experimental Medicine AS CR (BIOCEV facilities). The
work was partly supported by the Ministry of Education,
Youth and Sports of the CR under National Sustainability
Programme II (LQ1604, BIOCEV-FAR Project).
References
[1] FERNANDEZ-VILLA, D., M. JIMENEZ GOMEZ-
LAVIN, C. ABRADELO, J. ROMAN and L. ROJO.
Tissue Engineering Therapies Based on Folic Acid and
Other Vitamin B Derivatives. Functional Mechanisms
and Current Applications in Regenerative
Medicine. International Journal of Molecular Sciences.
Switzerland: MDPI, 2018, 19(12). DOI:
10.3390/ijms19124068. ISSN 1422-0067.
[2] SAMSONRAJ, R., M. RAGHUNATH and V.
NURCOMBE. Concise Review: Multifaceted
Characterization of Human Mesenchymal Stem Cells for
Use in Regenerative Medicine. Tissue Engineering and
Regenerative Medicine [online]. 26 October 2017,
2173-2185 [cit. 2019-05-16]. Available from:
https://stemcellsjournals.online
library.wiley.com/doi/full/10.1002/sctm.17-0129
[3] O’BRIEN, F. Biomaterials & scaffolds for tissue
engineering. Materials today [online]. 2011, 88-95.
ISSN 1369 7021.
[4] EWEIDA, A. M. and M. K. MAREI. Naturally
Occurring Extracellular Matrix Scaffolds for Dermal
Regeneration: Do They Really Need Cells?. BioMed
Research International. 2015, 2015, 1-9. DOI:
10.1155/2015/839694. ISSN 2314-6133. Available from
: http://www.hindawi.com/journals/bmri/2015/839694/
[5] JADALANNAGARI, S., G. CONVERSE, Ch.
MCFALL, E. BUSE and M. FILLA. Decellularized
Wharton’s Jelly from human umbilical cord as a novel
3D scaffolding material for tissue engineering
applications. PLOS ONE [online]. 2017, 21.2.2017,
12(2), 1-23 [cit. 2019-05-15]. DOI:
10.1371/journal.pone.
0172098. ISSN 1932-6203. Available from :
https://dx.plos.org/10.1371/
journal.pone.0172098
[6] KUBINOVA, S. Extracellular matrix based biomaterials
for central nervous system tissue repair: the benefits and
drawbacks. Neural Regen Res. 2017 Sep;12(9):1430-
1432.
[7] KOCI, Z., K.VYBORNY, J. DUBISOVA, I.
VACKOVA, A. JÄGER, O. LUNOV, K. JIRAKOVA
and S. KUBINOVA. Tissue Engineering Part C:
Methods 2017 Jun;23(6):333-345
[8] HOPPE, A., S. SEVEAU and J. SWANSON. Live cell
fluorescence microscopy to study microbial
pathogenesis. Cellular Microbiology. 2009, 11(4), 540-
550. DOI: 10.1111/j.1462-5822.2009.01283.x. ISSN
14625814.
[9] AlamarBlue™ Cell Viability Reagent. ThermoFisher
Scientific [online]. [cit. 2019-08-08]. Available from
https://www.thermo
fisher.com/order/catalog/product/DAL1025
Figure 3. Morphology WJ-MSCs within the 3D ECM-based
scaffolds (A, phase contrast microscopy) and on the TCP (B,
Live/Dead assay, fluorescent microscopy).

16 Proc. of IMBM 2019
Growth and metabolic activity of mesenchymal stem cells derived
from different sources
Simona Stuchlíková1*, Taťána Jarošíková1, Yuriy Petrenko2
1Czech Technical University in Prague, Faculty of Biomedical Engineering, Kladno, Czech Republic. 2Institute of Experimental Medicine AS CR, Prague, Czech Republic
Abstract: The mesenchymal stem cells are multipotent cells with high therapeutic potential. The aim of the
work was to compare the proliferation and metabolic activity of mesenchymal stem cells (MSCs), derived
from human bone marrow, adipose tissue and Wharton’s jelly. The metabolic and proliferation activity were
assessed by Alamar blue assay. The study shows differences and similarities between properties of MSCs
derived from different tissues for further regenerative medicine applications.
Introduction
Mesenchymal stem cells (MSCs) are multipotent
cells with unique therapeutic potential. These cells
are expected to have a highly effective treatment
mainly in the overall response of the organism to
infection, transplant medicine and autoimmune
diseases. They have the capacity of immune
modulation and can differentiate into tree lineages:
adipogenic, osteogenic, and chondrogenic [1].
MSCs produce cytokines and growth factors,
which affect the host cells and tissues.
MSCs can be derived from the variety of
tissues such as bone marrow, adipose tissue,
peripheral blood, or internal organ harvesting, if
present for life [2]. In newborns, MSCs can be
obtained from umbilical cord, amniotic fluid,
placenta or amniotic membrane.
In this study we compared MSCs from adipose
tissue (AT-MSCs), bone marrow (BM-MSCs) and
Wharton‘s jelly (WJ-MSCs).
BM-MSCs are multipotent adult stem cells
that are found in the bone marrow
microenvironment. These cells have multisided
abilities (induction of angiogenesis, rapid
proliferation, differentiation into at least three
mesenchymal lineages cells) [8].
Adipose tissue as a source of MSC is
becoming preferred over bone marrow because of
the higher concentration of MSCs and also the
possibility of easier and non-invasive isolation. It
has been shown that AT-MSCs have higher
stability in culture and replicative potential,
compared to BM-derived cells [6,7] (Table 1).
Wharton's jelly is a gelatinous substance
inside the umbilical cord. Wharton's jelly is a
potential source of adult stem cells. WJ-MSCs
have low immunogenicity and are tolerated in
donor transplantation. It was shown that WJ-MSC
transplantation may have therapeutic potential and
may reduce traumatic damage [9].
Table 1. Differences in the properties of BM- and AT-derived
MSCs [6].
Differentiating
Characteristic
Adipose tissue
MSC
Bone
Marrow
MSC
Aging Less advance More
advanced
Stability in
culture Higher Lower
Replicative
potential Higher Lower
Mesenchymal stem cells, which are used in
regenerative medicine, may be influenced by
various factors affecting the differentiation ability,
therapeutic effects and genome stability [3]. It is
known that culture conditions may also contribute
to the growth kinetics and overall functional
activity of the MSCs [1].
Fetal bovine serum (FBS) is collected from
fetal blood from a bovine subject via a closed
collection system directly at the slaughterhouse. It
is the most widespread serum-supplement for in
vitro cell cultures of eukaryotic cells. It has a very
low level of antibodies and contains more growth
factors. The major component of FBS is globular
protein, bovine serum albumin (BSA). The
diversity of proteins in FBS causes cells to be
cultured in the medium (cells survive here divide
and grow) [10]. For regenerative medicine or cell
therapy, cell culture media should be free of
xenogenic components (such as FBS) [11]. Human

Stuchlíková et al.: Growth and metabolic activity of mesenchymal stem cells derived from different sources
Proc. of IMBM 2019 17
platelet lysate (PL) is often used as a replacement
for FBS in experimental and clinical MSC culture.
PL is a pale yellow, turbid liquid obtained from
platelets after freeze-thaw cycles. One freeze /
thaw cycle results in platelet lysis and subsequent
release of a large number of growth factors
important for cell expansion. It is known that
human platelet lysate (PL) contains a cocktail of
growth factors, for example FGF (fibroblast
growth factor), EGF (epidermal growth factor),
PDGF (platelet derived growth factor), which can
be used to support cell growth in culture [4].
The aim of this work was to assess the
metabolic and proliferation activity of MSCs
derived from different sources in different culture
conditions [5].
Materials and methods
After being cryopreseved at passage 3, AT-, BM-
and WJ-MSCs were thawed in water bath at 37 °C,
washed of cryoprotectant and seeded into tissue
culture plastic at similar density (5 x 10³ cells per
cm2). Cells were cultured in alpha-MEM (a-MEM
(Gibco, USA)) culture medium in the presence of
either 10% FBS or pooled human PL. The Figure 1
shows the scheme of PL preparation. In several
experiments cells were cultured in the absence of
supplements (serum starvation groups) and the
metabolic activity of starved cells were assessed
after 24 hours of culture in corresponding
conditions.
The metabolic activity of MSCs was assessed
on day 1 and day 5 of cell culture by Alamar blue
(AB) assay [12]. Briefly, cells were incubated in
complete culture medium, containing 10% Alamar
blue (Thermo Fisher Scientific Inc., USA) solution
for 3 hours, afterwards the fluorescence intensity of
the Alamar blue reduced form was measured at
excitation wavelength of 550 nm and emission
wavelength of 590 nm using Tecan Genios
microplate reader (Tecan, Switzerland). The data
Figure 2. The morphology of 1) BM-MSCs, 2) AT-MSCs,
3) WJ-MSCs.
Figure 1. The scheme of PL preparation.
1
2
3

Stuchlíková et al.: Growth and metabolic activity of mesenchymal stem cells derived from different sources
18 Proc. of IMBM 2019
was presented as ratio to background control as
relative fluorescent units (RFU). The index of cell
proliferation was determined as a ratio of AB
fluorescence intensity obtained at day 5 of cell
culture to the values of same samples obtained at
day 1.
The morphology of MSCs was assessed by
phase-contrast microscopy.
Results
The morphology of cells on passage 4 is presented
on Figure 2. Obviously, the morphology of AT-,
BM- and WJ-MSCs has similar, fibroblastic
character, which is specific for MSCs.
Then, we assessed the proliferation rate of
MSCs cultured in the presence of fetal bovine
serum or human PL.
The differences in proliferation rate of cells,
depending on the source of isolation were detected.
In case of BM-MSCs and AT-MSCs, the culture of
cells in FBS-supplemented medium resulted in
significantly lower cell proliferation, compared to
PL-based medium. In WJ-MSCs samples we could
not detect any differences between the culture
conditions (Figure 3).
The highest proliferation capacity was
detected in WJ-MSC cultures, independently on
the culture conditions (FBS- or PL-based). The
lowest proliferation index was obtained in BM-
MSC cultures.
Then we assessed the effect of serum
starvation (cultured in the absence of FBS or PL)
on the metabolic activity of MSCs after expansion
in different media. After expansion in FBS, the
serum starvation reduced the metabolic activity of
MSCs, derived from all sources (cca 2-times
reduction in BM- and AT-MSC cultures).
However, after expansion of cells in PL, the
metabolic activity was reduced only in BM-MSCs,
while in AT- and WJ-MSC cultures there were no
differences.
Conclusion
We confirmed that platelet lysate acts as a strong
mitogen, significantly increasing the proliferative
activity of MSCs from different sources.
Wharton’s jelly MSCs have highest proliferation
capacity, compared to other sources. The culture
conditions may determine the response of BM- and
AT-MSCs towards stress conditions.
Acknowledgements: The work was supported by the
Department of Biomaterials and Biophysical Methods at the
Institute of Experimental Medicine of the Academy of
Sciences of the Czech Republic (BIOCEV).
References
[1] WEISS ARR, DAHLKE MH. Immunomodulation
by Mesenchymal Stem Cells (MSCs): Mechanisms of
Action of Living, Apoptotic, and Dead MSCs. Front
Immunol. 2019 Jun 4;10:1191
[2] ANDRZEJEWSKA A, LUKOMSKA B, JANOWSKI
M. Concise Review: Mesenchymal Stem Cells: From
Roots to Boost. Stem Cells. 2019.
[3] K. MATSUNAGA, K. FUJISAWA, T. TAKAMI, G.
BURGANOVA, N. SASAI,T. MATSUMOTO, N.
YAMAMOTO, and I. SAKAIDA, NUPR acts as a pro-
survival factor in human bone marrow-derived
mesenchymal stem cells and is induced by the hypoxia
mimetic reagent deferoxamine, Published online 2019
Mar 23.
[4] BEREBICHEZ-FRIDMAN R, MONTERO-OLVERA
PR. Sources and Clinical Applications of Mesenchymal
Stem Cells: State-of-the-art review. Sultan Qaboos
University medical journal. DOI. 2018;18(3):e264-e77.
[5] FEKETE N, GADELORGE M, FURST D, MAURER
C, DAUSEND J, FLEURY-CAPPELLESSO S, et al.
Platelet lysate from whole blood-derived pooled platelet
concentrates and apheresis-derived platelet concentrates
for the isolation and expansion of human bone marrow
mesenchymal stromal cells: production process, content
and identification of active components. Cytotherapy.
DOI..2012;14(5):540-54.
[6] BOCHON B, KOZUBSKA M, SURYGAŁA
G, WITKOWSKA A, KUŹNIEWICZ
R, GRZESZCZAK W, WYSTRYCHOWSKI G
Mesenchymal Stem Cells-Potential Applications in
Kidney Diseases. Int J Mol Sci. DOI. 2019 May
18;20(10). pii: E2462
[7] SANDHYA S , CHENGXIANG Y , SMARAJIT
CH , WINSON T , MIN P , ASIM S , SUE-ANNE
T , WEIPING H , A SHIGEKI S, Oxidative stress
mediates depot-specific functional differences of human
adipose-derived stem cells, Published online 2019 May
21.
Figure 3. Proliferation rate index of MSCs, derived from
different tissues and cultured in the presence of FBS or PL.
0
1
2
3
4
5
6
BM-MSCs AT-MSCs WJ-MSCs
Prol
ifer
atio
n in
dex
Proliferation index
Fetal bovine serum Platelet lysate
https://www.ncbi.nlm.nih.gov/pubmed/?term=Fujisawa%20K%5BAuthor%5D&cauthor=true&cauthor_uid=31138954
https://www.ncbi.nlm.nih.gov/pubmed/?term=Yamamoto%20N%5BAuthor%5D&cauthor=true&cauthor_uid=31138954
https://www.ncbi.nlm.nih.gov/pubmed/?term=Yamamoto%20N%5BAuthor%5D&cauthor=true&cauthor_uid=31138954

Stuchlíková et al.: Growth and metabolic activity of mesenchymal stem cells derived from different sources
Proc. of IMBM 2019 19
[8] M. CAI, R. SHEN, L. SONG, M. LU, J. WANG, S.
ZHAO, Y. TANG, X. MENG, Z. LI, and Z. HEB, Bone
Marrow Mesenchymal Stem Cells (BM-MSCs) Improve
Heart Function in Swine Myocardial Infarction Model
through Paracrine Effects DOI: 10.1038/srep28250
[9] L. MARINO , M. A. CASTALDI , R.
ROSAMILIO , E. RAGNI , R. VITOLO , C.
FULGIONE, S. G. CASTALDI , B. SERIO , R.
BIANCO , M. GUIDA and C. SELLERI Mesenchymal
Stem Cells from the Wharton's Jelly of the Human
Umbilical Cord: Biological Properties and Therapeutic
Potential. DOI.10.15283/ijsc18034.
[10] KENNETH V. HONN, J. A. SINGLEY, W. CHAVIN
Fetal Bovine Serum: A Multivariate Standard
DOI.org/10.3181/00379727-149-38804
[11] V. BECHERUCCI , L. PICCINI , S.
CASAMASSIMA, S. BISIN , V. GORI , F.
GENTILE , R. CECCANTINI , E. DE RIENZO , B.
BINDI , P. PAVAN , V. CUNIAL, E. ALLEGRO , S.
ERMINI , F. BRUGNOLO , G. ASTORI , F.
BAMBI Human platelet lysate in mesenchymal stromal
cell expansion according to a GMP grade protocol: a cell
factory experience DOI.: 10.1186/s13287-018-0863-8
[12] PETRENKO Y, CHUDICKOVA M, VACKOVA I,
GROH T, KOSNAROVA E, CEJKOVA J, et al.
Clinically Relevant Solution for the Hypothermic
Storage and Transportation of Human Multipotent
Mesenchymal Stromal Cells. Stem Cells Int.
DOI.2019;2019:5909524.
https://www.ncbi.nlm.nih.gov/pubmed/?term=Fulgione%20C%5BAuthor%5D&cauthor=true&cauthor_uid=31022994
https://www.ncbi.nlm.nih.gov/pubmed/?term=Fulgione%20C%5BAuthor%5D&cauthor=true&cauthor_uid=31022994

20 Proc. of IMBM 2019
Automatic segmentation of basal ganglia and thalamus and comparison
of susceptibility values in patients with Parkinson's disease
Pavla Marousková1*, Radim Krupička1, Petr Dušek2
1Czech Technical University in Prague, Faculty of Biomedical Engineering, Kladno, Czech Republic. 2Clinic of Neurology, General University Hospital in Prague, Czech Republic
Abstract: Parkinson’s disease is neurodegenerative disease with temporal death of dopaminergic neurons in
basal ganglia. Dopamine deficiency leads to movement disorders. We focused on quantify the amount of iron
in basal ganglia in patients with Parkinson's disease, patients with REM sleep behavior disorder and healthy
controls. Processing, segmentation and quantification was performed by implemented scripts in FSL. The
FIMBRE Software Library (FSL) is software that includes image analysis and statistical tools for functional,
structural and diffuse MRI brain imaging. The results for each group are compared and statistically processed.
Introduction
Parkinson's Disease (PD) is a complex
neurological disorder that has been described for
two centuries back. Despite this, it is still a problem
to diagnose this disease in time. It is a
neurodegenerative disease with early death of
dopaminergic neurons in the basal ganglia.
Dopamine deficiency then leads to movement
disorders. Nowadays, Parkinson's disease is
considered a slowly progressive neurodegenerative
disease that begins several years before it can be
diagnosed. It is created by a combination of genetic
and environmental factors. [1]
Parkinson’s disease and uptake of iron in basal
ganglia Iron can accept and donate electrons and it’s
important for essential for cellular homeostasis and
various biological reactions. Higher iron
deposition in the brain may lead to deleterious
effects.
In PD, iron levels increase in neuromelanin
neurons in certain areas of the brain. Some studies
have found higher iron level in basal ganglia in
Parkinson’s disease than in healthy controls.
However, it is not clear why. It has been
determined for a long time whether iron uptake is
an early event that causes neurodegeneration or a
disease. [2, 3]
Magnetic resonance imaging (MRI)
Magnetic resonance imaging is a three-
dimensional diagnostic imaging technique to
visualize inside structures and organs of the body,
which doesn’t used x-rays or other radiation.
MRI is commonly used for diagnostic in
neurology and provides detail of the brain in
sagital, axial and coronal planes. [4]
Quantitative susceptibility mapping (QSM)
QSM is used to quantify the spatial distribution of
magnetic sensitivity of biological tissues, allowing
the deposition of iron in the brain. In general,
magnetic sensitivity is a physical quantity that
describes a change in the magnetization of a
material in response to an applied magnetic field.
In conventional procedures, QSM calculates
the magnetic sensitivity of phase sequence GRE
images, with phase shifts being the primary result
of field inhomogeneity that induced sensitivity.
This tomographic ability is unique. No other
imaging technique allows such 3D sensitivity
mapping within an object with a measurement
device located outside the object. [3, 5]
FSL
FSL is stands for The FIMBRE Software Library.
It is software that includes image analysis and
statistical tools for functional, structural and
diffuse MRI brain imaging. This software is freely
available for non-commercial use. released in 2000
by FIMBRE (Functional Magnetic Resonance Imaging of the Brain) from Oxford University. [6]
In this project we focused on evaluating the
iron susceptibility value in basal ganglia in patients
with Parkinson’s disease (PD), patients with REM
sleep behavior disorder (RBD) and healthy
controls (CON). We used tools and scripts in FSL
to measure iron from QSM.

Marousková et al.: Automatic segmentation of basal ganglia and thalamus and comparison of susceptibility values in patients with
Parkinson's disease
Proc. of IMBM 2019 21
Methods
Patients for this project were selected from MRI
studies in General University Hospital in Prague.
From each group were chosen 5 patients.
QSM maps were reconstructed from 3D multi-
gradient echo (GRE) acquisitions with
TR/TEs = X/X ms, voxel resolution is
0.5x0.5x2 mm3. Phase images were reconstructed
offline using a virtual reference coil approach [7].
QSM reconstruction consisted of (i) continuous
Laplacian unwrapping; (ii) variable, spherical
mean value property based background field
removal (starting radius, 25 mm; 1-mm radius at
the brain boundary; without deconvolution) and
(iii) non-linear MEDIN inversion with λ=500 [8].
MRI images and QSM were converted form
DICOM format to Nifti format (the analysed
format), which works in MATLAB and FSL.
Firstly, we repaired QSM images in MATLAB
and resize on the size of T1 images in FSL by flirt
tool. The wrong QSM and repaired QSM can be
seen on Figure 1.
Next, we used the model-based segmentation
tool in FSL. This tool is called first and the script
first_run_all can segment all the subcortical
structures. We choose putamens, palladium and
caudatus for calculating susceptibility value of
iron. [9]
Secondly, we must create a mask from images
of the segmented structures. It’s necessary because
this image contains the value between 0 – 1
(represent probability each voxel is part of segment
structures). We turned this image to binary image
with threshold value 0.5 (50 % probability). In
binary image each voxel has value of 0 or 1.
Finally, we applied mask on QSM and
calculate the susceptibility value of iron in regions
of interest.
We did this with help of fslmaths and fslstats
tool. Fslmaths is a general image calculator, which
can be used to perform a great variety of
manipulations of images and fslstats is a general
tool for calculating various values/statistics from
the image intensities. [6]
Results
Uptake iron was measured in caudatus, putamens
and palladium. Each step is described above, and
we used FSL software.
Table 1: Results of measurement of susceptibility value of iron
in left/right caudatus (average of the mean values measured in
5 patients ± SD)
Patient Left
Caudatus
Right
Caudatus
CON 0,025±0,01 0,022±0,011
RBD 0,03±0,016 0,032±0,02
PD 0,029±0,009 0,03±0,009
Table 2: Results of measurement of susceptibility value of iron
in left/right palladium (average of the mean values measured
in 5 patients ± SD).
Patient Left
Palladium
Right
Palladium
CON 0,029±0,015 0,034±0,02
RBD 0,035±0,025 0,032±0,026
PD 0,03±0,014 0,03±0,009
Table 3: Results of measurement of susceptibility value of iron
in left/right putamens (average of the mean values measured
in 5 patients ± SD)
Patient Left
Putamens
Right
Putamens
CON 0,025±0,02 0,027±0,02
RBD 0,022±0,016 0,027±0,01
PD 0,024±0,01 0,031±0,025
Figure 2: T1 image with segment structures putamens (green),
palladium (blue) and caudates (red).
Figure 1: Image of QSM. The yellow QSM is wrong and the
pink QSM is repair (sagittal, coronal and transversal plane).
Marousková et al.: Automatic segmentation of basal ganglia and thalamus and comparison of susceptibility values in patients with
Parkinson's disease
22 Proc. of IMBM 2019
The results of measurement can be seen in
Table 1, Table 2 and Table 3. The tables show the
average of the mean values measured in 5 patients.
From Table 1 it can be seen that the value of
iron in caudatus in parkinsonian patients is higher
than in healthy controls.
In palladium the value in parkinsonian patients
is almost the same as in healthy controls.
Table 3 shows the average of the mean value
in putamens. When comparing the values in left
putamens, the value in healthy controls is slightly
higher than patients with Parkinson’s disease, but
in right putamens is the value higher in
parkinsonian patients.
Conclusion
This project was focused on comparing the uptake
iron in basal ganglia in parkinsonian patients,
patients with RBD and healthy controls. For now,
we segmented the palladium, putamens and
caudatus from T1 images and calculated the
susceptibility value of iron in these regions. We
created a mask and applied the mask on repair
QSM for calculating.
From the table which shows average of the
mean value is clear that the value in parkinsonian
patients is slightly higher than controls except the
left putamens.
Further work
The next step of the project is compared larger
group of patients, measuring of value of iron in
other parts of the brain (left/right thalamus) and
selects other parameters to define the susceptibility
values of iron in the brain. These results confirm
with clinical hypotheses.
References
[1] KALIA, Lorraine V a Anthony E LANG. Parkinson's
disease. The Lancet [online]. 2015, 386(9996), 896-912
[cit. 2018-11-21]. DOI: 10.1016/S0140-6736(14)61393-
3. ISSN 01406736.
[2] JIANG, Hong, Jun WANG, Jack ROGERS a Junxia
XIE. Brain Iron Metabolism Dysfunction in Parkinson’s
Disease. Molecular Neurobiology [online]. 2017, 54(4),
3078-3101 [cit. 2018-11-21]. DOI: 10.1007/s12035-
016-9879-1. ISSN 0893-7648.
[3] BARBOSA, Jeam Haroldo Oliveira, Antonio Carlos
SANTOS, Vitor TUMAS, Manju LIU, Weili ZHENG,
E. Mark HAACKE a Carlos Ernesto Garrido SALMON.
Quantifying brain iron deposition in patients with
Parkinson's disease using quantitative susceptibility
mapping, R2 and R2*. Magnetic Resonance
Imaging[online]. 2015, 33(5), 559-565 [cit. 2018-11-
21]. DOI: 10.1016/j.mri.2015.02.021. ISSN 0730725X.
Dostupné z: https://linkinghub.elsevier.com/
retrieve/pii/S0730725X15000600
[4] Magnetic resonance imaging (MRI) [online].
Encyclopædia Britannica, Inc., 2019 [cit. 2019-06-19].
[5] Quantitative Susceptibility Mapping: Contrast
Mechanisms and Clinical Applications. Tomography
[online]. 2015, 1(1), 3-17 [cit. 2018-11-21]. DOI:
10.18383/j.tom.2015.00136. ISSN 2379-1381.
[6] JENKINSON, Mark, Christian F. BECKMANN,
Timothy E.J. BEHRENS, Mark W. WOOLRICH a
Stephen M. SMITH. FSL. NeuroImage [online].
2012, 62(2), 782-790 [cit. 2019-06-19]. DOI:
10.1016/j.neuroimage.2011.09.015. ISSN 10538119.
[7] D.L. Parker et al, MRM 72:563-9, 2014
[8] J. Acosta-Cabronero et al, Neuroimage, 183:7-24, 2018
[9] Patenaude, B., Smith, S.M., Kennedy, D., and Jenkinson
M. A Bayesian Model of Shape and Appearance for
Subcortical Brain NeuroImage, 56(3):907-922, 2011.
Proc. of IMBM 2019 23
Influence of pH environment on fluorescence spectra of samples of
healthy and carcinoma cell cultures
Petr Adámek1*, Marie Pospíšilová1, Jana Turňová1
1Czech Technical University in Prague, Faculty of Biomedical Engineering, Kladno, Czech Republic
Abstract: Influence of pH environment on fluorescence spectra (FS) of NADH is studied on the base of
changes these spectra for sample environment pH 5, 7 and 8 and temperature 20 °C. The samples are prepared
as suspensions of healthy and carcinoma cell cultures line BALB/3T3 and CT26.WT in PBS buffer. The
normalized FS for excitation wavelength 365 nm were compared for healthy and tumor cells and cannot
distinguish between position of the maximum intensity for healthy and tumor cells. The GASpeD program was
used to decompose the normalized FS for more detail its analyses. The optimal number of spectra
decomposition curves was set at 4. There was found a difference in the concentration of free and bound NADH,
with more free than bound NADH in healthy cells, in tumor cells it is the opposite. By comparing normalized
FS for the same cells and pH 7, it is assumed that it does not depend on cell concentration at temperature 20
°C. The effect of pH on FS of healthy and tumor cells is the change in concentration of NADH in healthy cells
and in concentration of FAD in tumor cells.
Introduction
Cancer is one of the most common and serious
diseases that significantly shorten human lives. The
incidence of cancer is increasing both in the Czech
Republic and worldwide. Early diagnosis,
significantly improving the prognosis for the
patient, is important in the fight with cancer. An
important therapeutic approach is the use of
photodynamic therapy for which the knowledge of
viability of irradiated cells is crucial. Cell viability
can be determined, inter alia, by the NADH
concentration (Nicotinamide Adenine
Dinucleotide), which is important for cellular
respiration and is a biofluorophore naturally
present in each cell. The biofluorophore content in
the cell can be assessed by its fluorescence [1]. The
currently used cell viability assays are in vitro or
even toxic and unusable for medicine. This work is
coming out from the Ing. Ratanak Sio’s diploma
thesis. [2]. Our goal is to enable distinguishing of
healthy and cancerous tissue in vivo using non-
invasive fluorescence techniques using NADH [3-
5]. The use of NADH as a biofluorophore is
intensively studied from 1956 [6]. It is a substance
naturally present in the human cell. There is no
need to add any other substances that are foreign or
even toxic for the cells. NADH is in the cell at a
sufficiently high concentration, it is one of the
dominant cell biofluorophores (NADH, FAD,
proteins). In addition, NADH is present in the cell
in two forms: free and bound on proteins [7]. It has
been discovered that healthy and carcinoma cells
differ from each other by the ratio of free and
bound NADH (see below), which could be further
employed to distinguish them. In our work, the
NADH content was measured in cells at different
pH levels (5, 7 and 8) and at temperatures 20 °C
and 37 °C in order to determine changes in cell
viability under changing conditions, which may
occur in the patient spontaneously or as a result of
treatment. But we did not receive sufficient FS of
samples at temperature 37 °C.
Materials
We were used the same materials for sample
preparation as was described in the work of author
[2, 8, 9].
Cell lines BALB/3T3 and CT26.WT (Sigma
Aldrich, USA).
Cultivation medium Dulbecco’s Modified
Eagle’s Medium (DMEM – low glucose, with 1000
mg/L glucose and sodium bicarbonate, with L-
glutamine without phenol red) (Sigma Aldrich,
USA).
The cells were cultivated adding Fetal Bovine
Serum (FBS) (Gibco, USA) and antibiotics
Gentamycin (Sandoz, Switzerland) into the
cultivation medium.
Phosphate Buffered Saline (PBS) with pH 7
(Sigma Aldrich, USA) for sample cell dilution. The
pH 5 buffer was prepared from D PBS (Dulbecco's
Phosphate Buffered Saline - D1283) (Sigma
Aldrich, USA) by 1:5 dilution with distilled water.

Adámek et al.: Influence of pH environment on fluorescence spectra of samples of healthy and carcinoma cell cultures
24 Proc. of IMBM 2019
The pH 8 buffer was prepared by mixing the
ingredients and then adjusting the pH as
recommended in [10].
Methods
Cell lines cultivation
Cells were cultured from frozen cells at - 80 °C in
DMEM, with of 10% FBS and antibiotics in a Petri
dish for 2 days in an incubator at 37 °C, 5% carbon
dioxide atmosphere and 99,5% relative humidity.
All operations which demanded sterility were done
in laminar flow box BIOAIR aura vertical S.D.4.
Preparation of cell suspension
After cell cultivation the cell cultures were checked
in a microscope and the Petri dish was rinsed twice
with PBS buffer pH 7 to remove dead cells. The
cells were release from the bottom of Petri dish by
0.25% solution of trypsin with ethylene
diaminetetraacetic acid (EDTA) and the Petri dish
was placed in the incubator for 5-10 minutes.
Subsequently, the Petri dish was checked in a
microscope to see if all cells were released from the
bottom of the dish and float freely in solution.
Trypsin activity was stopped by adding 8 ml of
DMEM medium to the Petri dish. The contents of
the Petri dish were transferred to cone tubes and
centrifuged at an overload of 193 g. After the
supernatant was removed, the pellet was
resuspended in 1 ml of PBS buffer with pH 7.
Cell suspensions with pH 5 and 8 were
prepared by the next steps: A small volume
(usually 200-300 μl) of the prepared cell
suspension in PBS buffer with pH 7 was placed in
a fuse silica cuvette already used for measurements
on spectrofluorometer and the volume was
supplemented with PBS buffer with pH 5 or 8 for
the entire volume 3 ml. The pH of cell suspension
was measured immediately in the cuvette by
Denver UB-10 Deluxe pH-meter (Denver
Instruments, USA) [11]. FS of samples were
measured on Fluoromax-4 spectrofluorometer
(Horiba Japan) [13].
Determination of cell concentration
The cell concentration was determined in a Burker
chamber. 8 µl of the solution was pipetted into the
Burker chamber. Cells were counted in individual
squares under a microscope. The number of cells in
1 mm3 (1 µl) was calculated according to the
formula [12]:
hvc
znb
(1)
Where:
b … number of cells in 1 mm3
n … total number of cells counted
c … number of squares in which were cells
counted
v … the area of the used square
h … depth of the Burker chamber
z … used dilution.
Fluorescence spectra measurement and
treatment
FS of cell samples were measured always with
2 nm slit for excitation and emission light.
Excitation wavelength was always 365 nm as the
wavelength which is the best to eliminate a
contribution to fluorescence from another
bioflurophores as are Pyridoxine and Tryptophan
and emission was scanned from 380 nm to 700 nm.
The measured spectra must be corrected in
following ways:
1. The instability, fluctuation of the light
source i.e. the xenon lamp is corrected in the
spectrofluorometer. Part of the light source beam is
directed to a reference detector. The resulting
measured intensity is corrected by this reference
signal.
2. Further, correction files supplied by the
manufacturer were used to remove artefacts
embedded in the optical signal of monochromator.
3. The spectra of samples and buffers were
processed in the same way as described above, and
the spectra of the buffers were subtracted from the
spectra of the samples to eliminate the Raman
scattering of buffers.
4. To eliminate the effect of different cell
concentrations, we normalized intensity of FS
samples. The normalized FS intensity IFN(λ) was
defined by relation IFN(λ) = IF(λ)/IFM, where
IF(λ) is the measured and corrected fluorescence
intensity as a function of wavelength and IFM is
the maximum corrected intensity between 380 nm
and 700 nm for the measured sample. The normalized FS of samples were
decomposed by GASpeD (Genetic Algorithm
Spectra Decomposition) software [14] using
4 Gaussian curve representing bound and free
NADH, FAD and proteins. It corresponds with
literature as well as the best fit of measured
fluorescence curve [3].

Adámek et al.: Influence of pH environment on fluorescence spectra of samples of healthy and carcinoma cell cultures
Proc. of IMBM 2019 25
Results
Our work partly used results of Ing. Ratanak Sio’s
diploma thesis [2]. He compared FS suspensions of
healthy and carcinoma cells in PBS with pH 7 and
at temperature of 20 °C. The wavelength 365 nm
was determined by him as the most suitable for
excitation of NADH therefore we used only this
excitation wavelength [2, 4]. FS were measured in
the range from 380 nm to 700 nm and normalized
as described in section Methods. Examples of
comparisons of normalized FS are shown in Figure
1 which shows no differences between position of
maxima intensity FS of 3T3 and CT26 cells
samples.
Normalized FS were analyzed using GASpeD
software [14] which allowed us more detail
analyzes of normalized FS and determined
differences between 3T3 and CT26 cell samples.
In healthy cells, there is always a higher
concentration of free than bound NADH. On the
contrary, in tumor cells, there is always a higher
concentration of bound than free NADH.
Examples of FS decomposition for healthy and
tumor cells are shown in Figure 2.
The area under the spectral decomposition
curve is proportional to the concentration of the
substance in the cell. The first peak of FS (about
450 nm) is mainly due to the fluorescence of bound
and free NADH. The second peak of FS (about 530
nm) is mainly due to the fluorescence of FAD and
proteins.
Influence of environmental pH of sample 3T3
and CT26 at the temperature of 20 °C were studied
on the base at differences in FS for pH 5, 7 and 8.
We compared normalized FS as a function:
A: as a concentration, separately for the same
cells and pH. We found that normalized FS does
not depend on cell concentration prepared the same
way in different time. The fit curve normalized FS
were overlapping very good only in case of pH 7
but overlapping fit curve normalized FS for pH 5
and pH 8 had small differences as is shown in
Figure 3.
B: for 3T3 and CT26 cell samples. We found
different influence of pH for 3T3 in first peak of FS
opposite to CT26 where was differences in second
peak as is shown in Figure 4.
Measurements for all three pH values (5, 7 and
8) were performed also at 37 °C, but we did not
Figure 1: Comparisons of normalized FS for healthy (3T3) and
tumor cells (CT26).
Figure 2: Examples of FS decomposition using GASpeD
program for healthy (3T3) and tumor cells (CT26).

Adámek et al.: Influence of pH environment on fluorescence spectra of samples of healthy and carcinoma cell cultures
26 Proc. of IMBM 2019
obtain relevant FS intensities to study the effect of
higher temperature. These measurements will be
taken again during the next work.
Conclusion
GASpeD software allowed us compared
normalized FS healthy (3T3) cells and carcinoma
(CT26) cells and find differences between them of
bound and free NADH and as well as influence of
pH of environmental samples.
For the measurements at the temperature of
37 °C we only have preliminary results, because
the cell cultures were not in good condition and the
intensity of fluorescence was too low. We have
ordered new cells and we will continue with the
measurements in next work.
Acknowledgements: Author would like to thank to his
supervisor Marie Pospíšilová and Jana Turňová for their
support, help and valuable advices and comments.
Furthermore, author would like to thank to the grant agency of
the CTU in Prague for the financial support of the grant
number SGS19/135/OHK4/2T/17.
References
[1] Lakowicz, J. R. Principles of fluorescence spectroscopy.
(Springer, 2006). ISBN 978-0387312781
[2] SIO, Ratanak. Comparison of fluorescence spectra of
healthy and carcinoma cell cultures. Kladno, 2018.
Diploma thesis. Czech Technical University in Prague,
Faculty of biomedical engineering, Department of
natural sciences.
[3] Croce, A.C. a G. Bottroli. Autofluorescence
spectroscopy and imaging: a tool for biomedical
research and diagnosis. European Journal of
Histochemistry [online]. 2014, 58(4) [cite 2019-05-14].
doi: 10.4081/ejh.2014.2461. ISSN 2038-8306.
Accessible from: http://ejh.it/index.php/ejh/article/
view/2461.
[4] Podrazky, O. Monitoring of Environmental Influence on
Model Microorganism Cultures by Optical Methods.
Dissertation thesis, University of Chemistry and
Technology, Prague, (2002).
[5] Cepa M. Measurement of NADH fluorescence of cell
cultures during photodynamic therapy, Diploma thesis,
Czech Technical University in Prague, (2014).
[6] Chance B. (1954) Spectrophotometry of intracelular
respiratory Spigments. Science 120, p. 767 – 775.
[7] Ghukasyan, V. V. & Kao, F.-J. Monitoring Cellular
Metabolism with Fluorescence Lifetime of Reduced
Nicotinamide Adenine Dinucleotide. The Journal of
Physical Chemistry C 113, 11532–11540 (2009). doi:
10.1021/jp810931u.
[8] Sio R., Pospíšilová M., Jarošíková T., Analyses of
emission spectra of biological fluorophores, IMBM
2017, Conference Proceedings, FBME CTU, pp 25-29,
(2017). ISBN 978-80-01-06303-3.
[9] Sio R., Pospíšilová M., Kučera P.,Turňová J.,
Comparison of fluorescence spectra of healthy and
carcinoma cell cultures, IMBM 2018, Conference
Figure 3: Examples of overlapping normalized fluorescence
spectra.
Figure 4: Decrease of NADH concentration in healthy and
increase of FAD concentration in tumor cells with more extreme
pH.

Adámek et al.: Influence of pH environment on fluorescence spectra of samples of healthy and carcinoma cell cultures
Proc. of IMBM 2019 27
Proceedings, FBME CTU, pp 53-58, (2018). ISBN 978-
80-01-06502-0.
[10] Fosfátový pufr. LabGuide.cz [online]. Prague:
LabGuide.cz, 2019 [Accessed: 2019-06-21]. Accessible
from: http://labguide.cz/wp-
content/uploads/2014/10/Fosfátový-pufr.pdf.
[11] Denver Instrument, Electrochemistry Meters. Denver
Instrument [online]. Bohemia, NY: Denver Instrument,
2013 [Accessed: 2019-06-19]. Accessible from:
http://www.denverinstrument.com/denverusa/media/pd
f/Op-Man-UB-Long-RevA.pdf.
[12] Stanovení počtu erytrocytů v jednotce objemu krve.
Institute of Pathological Physiology, Faculty of
Medicine, Charles University in Prague [online]. Pilsen:
Faculty of Medicine in Pilsen, Charles University, 2018
[Accessed: 2019-06-23]. Accessible from:
http://patofyziologie.lfp.cuni.cz/wp-
content/uploads/2018/09/pocitani.pdf.
[13] FluoroMax®-4 & FluoroMax®-4P with USB:
Operation manual Part number 810005 version B.
HORIBA. 2009.
[14] Adámek P., Application of Genetic Algorithms to
Analysis of High-parameter Plasma, Diploma thesis,
Czech Technical University in Prague, Faculty of
Nuclear Sciences and Physical Engineering (2004).
.

28 Proc. of IMBM 2019
Biophysical characterisation of non-motor actin translocations
Daniel Janda1*, Ondřej Kučera2
1Czech Technical University in Prague, Faculty of Biomedical Engineering, Kladno, Czech Republic 2Institute of Biotechnology of the Academy of Sciences of the Czech Republic, Vestec, Czech Republic
Abstract: Actin cytoskeleton plays an essential role in cellular shape changes such as motility and division.
Cytokinesis is the final stage of the cell division during which a contractile ring generates force that divides
the maternal cell into two daughters. The ring is composed of actin filaments and myosin motors. Several other
additional regulators are involved either in the formation or contraction of the ring. It is expected that myosins
drive the contraction; however, recent observations question this paradigm by showing that, in some cells,
myosins are not necessarily required and the contraction occurs even if the motor activity is impaired. Which
mechanism contributes or fully replaces the activity of myosin motors remains incompletely understood. This
work aims to characterise actin translocations mediated by diffusible non-motor crosslinkers. We used
reconstituted actin filaments to study minimal models of actin interactions in vitro. Using TIRF microscopy,
we showed that actin filaments can move along each other by the aid of a crosslinker.
Introduction
Cytokinesis is the terminal step of cell division
which ensures the formation of new daughter cells
from the parental ones. Cell division is facilitated
by the assembly and contraction of a contractile
ring (Fig 1). This ring is composed of actin
filaments and the contractile forces are, in
particular, generated by myosin motors which bind
actin filaments and move them along each other
while consuming chemical energy in the form of
ATP. A considerable number of other additional
proteins have an important role in placing, forming,
constricting and disassembling of the ring [1].
Previous research raises the question of how
the cytokinesis can proceed even if the activity of
molecular motors is restricted [2]. Here we show
that anillin, a multidomain cytokinetic regulator
which binds several key components within the
cytokinetic ring, may contribute to the successful
cell division. Indeed, in anillin-depleted cells, the
cytokinesis cannot proceed [3]. This protein has a
number of binding sites. Using three of these sites,
anillin is capable of binding F-actin. Therefore,
anillin also has an ability to bundle these filaments.
While the contribution of anillin to the contractility
signalling pathways was studied recently [4], here
we tested the hypothesis if anillin can use its
binding properties to promote translocation of actin
filaments.
Materials and methods
This study aimed at imaging and evaluation of the
interactions between actin and anillin. The imaging
was performed in vitro by using TIRF (Total
Internal Reflection Fluorescence) microscopy.
This microscopy technique is a powerful method
having an ability to generate evanescent wave
along the glass surface and image only a thin layer
of the solution, suppressing the fluorescence
background from the entire volume (Fig 2).
We studied actin filaments in microfluidic
chambers that fit into the custom-made holder,
placed above the objective of the microscope. The
procedure of preparing these chambers was
adopted from ref. [5]. The chambers are made of
two low fluorescent DDS coated coverslips, which
have approximately 2222 mm and 1818 mm in
size. Firstly, clean and low fluorescence coverslips
with the correct reactivity to enable subsequent
silanisation were prepared. The silanisation was
then performed with a 0.05% solution of
dimethyldichlrosilane (DDS) and trichlorethylene
(TCE). This step is essential for further
functionalisation of the glass surface.
We used approximately 1.5 mm wide strips of
parafilm, which were gently laid down onto
2222 mm slide to form three or four channels.
After this step, the 1818 mm slide was pressed
down onto the bigger one (Fig. 3).
G-actin was isolated from rabbit muscle using
protocol from refs. [6, 7], lyophilised and stored at
-80 ºC. Actin filaments were prepared by
polymerisation from the G-actin. We used

Janda et al.: Biophysical characterisation of non-motor actin translocations
Proc. of IMBM 2019 29
phalloidin-stabilised actin filaments, which were
prepared by the following protocol. Dry
rhodamine-phalloidin (Thermo Fisher Scientific)
was resuspended in methanol (final 125 M).
Subsequently, Mili-Q ultrapure water, 2
polymerisation buffer (200 mM KCl, 20 mM
HEPES, pH 7.0), G-actin (4.5 mg/ml) and
rhodamine-phalloidin (final 5 M) were put
together and mixed gently. Prior to use, the
solution was left for incubation at 4 ºC overnight.
Anillin was prepared by recombinant protein
expression in HEK 293 cells. Anillin was
fluorescently labelled (Green Fluorescent Protein -
GFP).
At the beginning of the experiments, a
coverslip glass passivation was performed by the
F127 pluronic for at least 45 minutes. The channels
were washed by HEPES buffer afterwards.
Observing of actin-anillin interactions was
performed by using imaging buffer that consists
HEPES buffer, 10 mM Cleland’s reagent (DTT),
20 mM D-glucose, 0.1 % Tween 20 (10 % in
HEPES), Casein (0.5 mg/ml), 1 mM ATP. This
solution was stirred and put to degas for 20
minutes. The whole time of preparation, the
mixture was cooled down by residing in an ice
bath. An anti-bleaching cocktail which consists of
glucose oxidase (final 0.22 mg/ml) and catalase
(final 0.02 mg/ml) was added just before use due to
its short extinction time. These reagents reduce the
amount of reactive oxygen species and hydrogen
peroxide in the solution during imaging.
Polymerised actin filaments were filled into
the microfluidic channel, followed by imaging
buffer to which we added methylcellulose
(crowding agent). Using TIRF microscopy, we
observed these filaments with an excitation
wavelength of 561 nm. The filaments were free to
move on the passivated glass surface while they
were pressed down to the lateral plane by
methylcellulose. The next step was to observe
behaviour between two actin filaments in the
presence of anillin. Therefore, GFP-anillin diluted
(1:100) in the imaging buffer with methylcellulose
was added to the identical channel, into which the
actin filaments were flushed before.
Live imaging was performed using Nikon H-
TIRF microscope with a CFI Apo TIRF 60x oil
immersion objective, numerical aperture 1.49 and
working distance 0.12 mm. The holder of the
microfluidic chamber was placed on the
microscope stage and the objective could come into
contact with a lower glass coverslip from
underneath. We used 488 nm and 561 nm
excitation wavelengths. Depending on the intensity
of the fluorescent signal, the laser power was set
from 0.803 mW to 2.409 mW (488 nm laser) and
from 0.856 mW to 2.568 mW (561 nm laser). We
Figure 1. The contractile ring composed of actin cytoskeleton
physically divides the cell into two.
Figure 2. Optical geometry for the TIRF microscopy. When the
laser light comes into contact with the glass coverslip at a critical
angle , the evanescent wave is propagated. This wave excites
fluorophores near the coverslip surface.
Figure 3. Schematic illustration of a microfluidic chamber
consisting of two coverslips, four stripes of parafilm and three
channels.

Janda et al.: Biophysical characterisation of non-motor actin translocations
30 Proc. of IMBM 2019
recorded fluorescence images with an exposure
time of approximately 1 frame per 200
milliseconds. An acquisition software Nikon NIS-
Elements and an image processing software
ImageJ were used as well.
Results and discussion
At the previous section, the methods we used for
assembly and imaging of reconstituted, rhodamine-
labelled and phalloidin stabilised actin filaments
were described. Through all of our experiments,
the filaments typically have up to 20 m in length,
depending on the conditions of the polymerisation.
A concentration of free monomers in the solution
prior to polymerisation determines the distribution
of the filament length.
We used TRITC (561 nm) and FITC (488 nm)
fluorescence filter cubes for imaging with
both 561 nm and 488 nm lasers. Actin filaments
were excited by 561 nm laser due to rhodamine
phalloidin excitation wavelength of about 540 nm,
while no crosstalk with 488 nm channel was
observed. In our experiments, individual actin
filaments were tracked under the condition of low
concentration of filaments. Between those
filaments, no interactions were observed.
Since the anillin was flushed into the same
channel, we could detect GFP fluorescence signal
from a 488 nm excitation wavelength. The GFP
signal comes from the identical filament as the
TRITC signal does. In both channels, the filaments
have identical shape, thus on that basis, we could
determine that it was the same filament. Despite the
fact that fast switching between the two filter cubes
mentioned before causes time constrains, we did
not use beam splitter due to the possible crosstalk
between the channels.
When the concentration of the filaments
increased, actin-anillin networks were formed as
anillin can bundle these filaments through its three
binding sites (Fig. 5)
We studied the actin-anillin interactions in
terms of measuring of the overlap length between
two partially overlapping filaments in the course of
time (Fig. 6). Through all of our experimental data,
we observed translocations of the filaments. See
Figure 6 for the one representative case.
Conclusion
For our experiments, we used reconstituted actin
filaments and microfluidic channels to study actin-
anillin models. It was shown that anillin can bind
to actin filaments. At low concentrations of the
filaments, we can study how two actin filaments
crosslinked by anillin behave. At high
concentrations, anillin promotes the formation of
actin bundles.
This work proved that actin-anillin
interactions can be studied in vitro. Subsequent
analysis revealed that anillin promotes
translocation of the filaments.
Acknowledgements: This work was funded by the Institute of
Biotechnology of the Czech Academy of Sciences.
Figure 4. Actin filaments in the absence of anillin. No
interactions were observed between the filaments without the
presence of anillin. Scale-bar 5 𝜇m
Figure 5. Actin-anillin network. Several actin filaments are
interconnected by anillin. The higher fluorescence intensity
indicates that large quantities of actin filaments are bundled.
Scale-bar 5 𝜇m.
Figure 6. Actin filaments translocate along each other in the
presence of anillin. When the two actin filaments come into
contact at t = 0 seconds, they start to move along each other.
(Scale-bar 2 𝜇m)

Janda et al.: Biophysical characterisation of non-motor actin translocations
Proc. of IMBM 2019 31
References
[1] Cooper, GM., The Cell: A Molecular Approach [online].
2nd ed. Sunderland (MA): Sinauer Associates 2000.
Available at: https://www.ncbi.nlm.nih.gov/books/
NBK990
[2] Cheffings, Thomas H., Nigel J. et al.: Actomyosin Ring
Formation and Tension Generation in Eukaryotic
Cytokinesis. Current Biology. 2016, 26(15), R719-
R737, ISSN 09609822. doi:10.1016/j.cub.2016.06.071
[3] KIM, Hyunjung, James M. JOHNSON, Robert F.
LERA, Sarang BRAHMA, Mark E. BURKARD a Amy
MADDOX. Anillin Phosphorylation Controls Timely
Membrane Association and Successful
Cytokinesis. PLOS Genetics. 2017, 13(1)
doi:10.1371/journal.pgen.1006511. ISSN 1553-7404
[4] Budnar, S., Husain, K. B., Gomez, G. A., Naghibosadat,
M., Varma, A., Verma, S., … Yap, A. S. (2019). Anillin
Promotes Cell Contractility by Cyclic Resetting of
RhoA Residence Kinetics. Developmental Cell, 1–13.
doi:10.1016/j.devcel.2019.04.031
[5] Gell, Ch., Volker, B., Gary J. B. et al.: Microtubule
Dynamics Reconstituted In Vitro and Imaged by Single-
Molecule Fluorescence Microscopy. Methods in Cell
Biology, Elsevier, 2010, pp. 221-245
[6] Ebashi, S., and K. Maruyama.: Preparation and some
properties of a-actinin-free actin. J. Biochem (Tokyo).
58:20-26
[7] Spudich, J.A., and S. Watt.: The regulation of rabbit
skeletal muscle contraction. I. Biochemical studies of
the interaction of the tropomyosin-troponin complex
with actin and the proteolytic fragments of myosin. J.
Biol. Chem. 246:4866-4871.

32 Proc. of IMBM 2019
Consequence of the decrease of dopaminergic neurons and movement
parameters in the presymptomatic and manifest phase of Parkinson's
disease
Martin Bejtic1*, Radim Krupička1
1Czech Technical University in Prague, Faculty of Biomedical Engineering, Kladno, Czech Republic
Abstract: The thesis focuses on the quantification of dopaminergic neurons. subsequently compare this
decrease with movement parameters in patients suffering from Parkinson's disease in the presymptomatic and
manifest phase. The aim was to create a SPECT image processing methodology in SPM12, quantify the amount
of dopaminergic neurons and correlate the results with the finger tapping test by BradykAN. There were 24
probands with PD an age of 64.36 ± 7.74 years. There were 33 probands with an age of 65.65 ± 5.55 years in
this study group of RBDs. Procedures that have been altered in different groups in probands suffering from
manifest phases PD reach 3.08 ± 0.68 for left caudate, 1.77 ± 0.54 for left putamen, 3.04 ± 0.58 for right
caudate,and 1.61 ± 0.46 for the right putamen. In RBDs group the BASGAN index of the left caudate reach
4.44 ± 1.03, in the left putamen 4.03 ± 1.1, in the right caudate, 4.07 ± 1.07 and 4.27 ± 1. Another result is the
individual parameters for the left and right hand, using the parameters of the amplitude decrement, finger
tapping, average frequency, velocity of tapping, and AngMean10 for each proband. The final step was to find
the data with BasGan indexes. In the PD group, there are parameters (AmpDec, Frq, AngMean10) in the left
caudate, which correlate with the loss of dopaminergic neurons, in the left putamen and the AmpDec parameter,
the same is true for the right caudate.
Introduction
Parkinson's disease (PD) is a long-term
degenerative disorder of the central nervous
system that mainly affects the motor system. The
symptoms generally progress slowly over time.
Early in the disease, the most obvious symptoms
are shaking, rigidity, slowness of movement,
and difficulty walking. Thinking and behavioral
problems may also occur. Dementia becomes
common in the advanced stages of the disease. [1]
It is increasingly recognized as a prodromal
stage of neurodegeneration since a majority of
RBD (REM sleep behavior disorder) subjects
ultimately develop a neurodegenerative disorder
from the synucleinopathy group, i.e., Parkinson's
disease (PD), dementia with Lewy bodies (DLB) or
multiple system atrophy (MSA)
1. Overlap syndromes were also described,
and it is possible that neurodegenerative disorder
with initial RBD is a distinct subtype of
synucleinopathies characterized by a specific
motor, cognitive and autonomic profile. [2]
2. The conversion rate is high: 33% at 5 years,
rising to 91% at 14 years. [2]
3. The median interval between the emergence
of RBD and diagnosis of the neurodegenerative
disorder is 11 years but may range up to 50 years.
It is not clear whether all RBD patients ultimately
convert to neurodegeneration. [2]
The aim of this diploma thesis is to find out
which parameters of kinematic analysis of a finger
movement in patients with REM sleep disorder and
Parkinson's disease correlate with a loss of
dopaminergic neurons. Finger movements were
analysed using the BradykAn device; the loss of
dopaminergic neurons were measured by
displaying a dopamine transporter by means of
Ioflupane (DaTscan) and neuromelanin-sensitive
magnetic resonance (MR).
Equipment
DaTscan
DaTscan™ (Ioflupane I 123 Injection) is a
radiopharmaceutical method indicated for striatal
dopamine transporter visualization using SPECT
(single photon emission computed tomography)
brain imaging to assist in the evaluation of adult
patients with suspected parkinsonian syndromes
(PS). DaTscan (dopamine reuptake transporter
scan) may be used for helping differentiate
essential tremor from tremor due to PS. [3]

Bejtic et al.: Consequence of the decrease of dopaminergic neurons and movement parameters in the presymptomatic and manifest
phase of Parkinson's disease
Proc. of IMBM 2019 33
DaTscan: dopamine reuptake transporter
(DAT) - single photon emission computed
tomography (SPECT) was performed using the
[123I]-2-b-carbomethoxy-3b-(4-iodophenyl)-N-
(3-fluoropropyl) nortropane ([123I]FP-CIT,
DaTSCAN®, GE Healthcare) tracer.
Approximately 185 MBq [123I]FP-CIT was
injected intravenously. Scans were acquired
3 hours after tracer injection on a dual-head camera
system (Siemens). The acquisition parameters
were as follows: rotational radius 13-15 cm, matrix
128×128, angular sampling with 120 projections at
3° interval and 40 seconds per view, zoom 1.3,
peak 159±10 % keV. Reconstruction of the raw
SPECT projection data was performed using the
ordered subset expectation maximization (OSEM)
algorithm with 10 iterations and 10 subsets
including attenuation correction (μ = 0.11 cm−1)
and 3D Butterworth post-filtering with
FWHM = 8 mm.
MRI
Magnetic resonance imaging (MRI) is one of the
most commonly used tests in neurology and
neurosurgery. MRI provides an exquisite detail of
the brain, the spinal cord and the vascular system
and has the advantage of being able to visualize the
anatomy in all three planes: axial, sagittal and
coronal MRI has an advantage over CT in being
able to detect flowing blood and cryptic vascular
malformations. It can also detect demyelinating
diseases, and has no beam-hardening artifacts such
as can be seen with CT. Thus, the posterior fossa is
more easily visualized with MRI than with CT. The
MRI imaging is also performed without any
ionizing radiation. [4]
T1w MRI: 3D T1-weighted Magnetization
Prepared Rapid Gradient Echo (MPRAGE;
repetition time (TR) = 2200 ms; echo time
(TE) = 2.43 ms; inversion time (TI) = 900 ms; flip
angle (FA) = 8°; voxel resolution = 1×1×1 mm3;
176 slices; scan time 4:16 min)
Neuromelanin sensitive MRI: 2D GRE with
magnetization transfer pulse (TR = 394 ms; TE =
2.7 ms; FA = 40°; voxel resolution = 0.5x0.5x3
mm3; 14 slices positioned perpendicular to the
dorsal edge of the brainstem at midline covering
the pons and mesencephalon, 7 measurements,
total scan time = 12:43 min).
Finger tapping
The tapping rate is a psychological test given to
assess the integrity of the neuromuscular system
and examine motor control. The finger tapping test
has the advantage of being a relatively pure
neurologically driven motor task, because the
inertial and intersegmental interactions are so
small, that biomechanical influences on the
movement are reduced. Finger tapping involves
three important features: time, spatial amplitude,
and frequency. Studies have reported that the
average number of taps per 10-second interval can
be used to distinguish between patients with
mild traumatic brain injury and the
healthy controls. The average number is still
slower in people one month after sustaining a mild
traumatic brain injury. For this project was chosen
these movement parameters: average frequency
(Frq), amplitude decrement (AmpDec) maximum
opening velocity (VelO) and AngMean10. These
parameters and its modifications can be used for
the other UPDRS-III tasks. [5]
Average frequency (Frq) is defined as the
number of taps per 1 s.
𝐹𝑟𝑞 = 𝑛𝑢𝑚𝑏𝑒𝑟 𝑜𝑓 𝑡𝑎𝑝𝑖𝑛𝑔𝑠
𝑟𝑒𝑐𝑜𝑟𝑑 𝑡𝑖𝑚𝑒 [𝐻𝑧], (1)
Amplitude decrement (AmpDec) is defined
𝐴𝑚𝑝𝐷𝑒𝑐 = 1 −min(𝑃)
𝑚𝑎𝑥5(𝑃), (2)
where P is the vector of maximal finger
distances between taps filtered by a median filter of
3, max5 is the maximum value of P from the first 5
values in the series of finger taps, and min is
minimum value from P. [5]
Maximum opening velocity [m/s] (VelO) is a
median of maximum opening velocities in all
tapping cycles. Median was used because of
removing extremes in movement (e.g. stopping).
Maximal opening velocity and amplitude
decrement in the finger tapping test (FT) are
sensitive, independent parameters of bradykinesa
in Parkinson disease (PD) [5]. Whereas amplitude
decrement characterizes the sequence effect,
opening velocity corresponds to motor slowing.
Studying these parameters may contribute to an
earlier and more precise diagnosis of PD.
AngMean10 is the combination of velocity and
amplitude decrement angle and is computed from
the first ten finger taps.[5]
Subjects and methods
RBD
For the purposes of the thesis, 33 probands with
RBD were selected (REM sleep behavior disorder).
with an age of 65.65 ± 5.55 years. Out of this
group28 were male with age 65.06 ± 5.52 years,

Bejtic et al.: Consequence of the decrease of dopaminergic neurons and movement parameters in the presymptomatic and manifest
phase of Parkinson's disease
34 Proc. of IMBM 2019
5 were female with age 69.6 ± 3.92. All
measurements were made on Department of
Neurology General University Hospital in Prague.
PD
For this thesis, 24 Parkinson's probands were
selected with an average age of 64.36 ± 7.74 years
in this group. Out of this 5 female and 19 male
patients participating.
Image processing and Basgan Index
Firstly, images were converted from DICOM
image to Nifti. Nifti is format for working in
MATLAB and SPM12.
After this process is necessary to realign the
images, because images from MRI and SPECT are
in different position and they are rotated and
translated differently.
Thirdly, T1 images were segmented to
generate important transformation matrices,
forward and inverse.
These deformation matrices were used for
deformation of T1images and the template by
Garcia.
For normalisation Garcia’s template was used.
This is the 123I-FP-CIT (Ioflupane/DaTSCAN)
template and it is intended for use as template for
SPM automated normalisation.
Available in NifTI file format on this website:
https://www.nitrc.org/projects/spmtemplates. [7]
This template is deformed using an inverse
transformation matrix, to create a new template
wsTmpl1.nii
The next step was coregistration, where
SPECT images were coregistrated with wsTmpl.nii
to create a new SPECT rSPECT.nii
The last step of the image processing was
segmentation, where the anatomical structures
were segmented, the left caudata, the right caudata
and the left putamen, the right putamen. From these
structures, binding indices and volumes were found
for both groups, proband group of Parkinson's
disease manifestation and the presymptomatic
proband groups in the RBD group.
BASGAN (Basal Ganglia index) was defined
by volumes of interest (VOI) over the caudate,
putamen and posterior occipital cortex. The
posterior occipital cortex is used as a reference
region to determine nonspecific binding. [6]
𝐵𝑎𝑠𝑔𝑎𝑛𝐼𝑛𝑑𝑒𝑥 =𝑉𝑂𝐼𝐶𝐴𝑈𝑜𝑟𝑃𝑈𝑇−𝑉𝑂𝐼𝑂𝐶𝐶)
𝑉𝑂𝐼𝑂𝐶𝐶 (3)
The analyzed data was tested for normality
using a single-sample Kolmogorov-Smirnov test.
In MATLAB, the KEStest function is used. The
data did not match the Gaussian normal
distribution, was tested by the Mann-Whitney U-
test. For two-sample nonparametric tests, the null
hypothesis defines that the median of the parameter
being studied is the same. The alternative
hypothesis is that the medians are different.
Parametric tests test equality of mean values. The
output of this function is the value of h, which is
either 1 or 0. If h = 1, we can reject the null
hypothesis at a predefined significance level (the
tests automatically assume a significance level
p = 0.05). If h = 0, the null hypothesis cannot be
rejected at a given significance level. In MATLAB,
the Ttest2 function is used for normal distribution,
ranksum is used for abnormal distribution.
Correlation was used to display the
dependence of binding indexes and individual
parameters from finger tapping. To evaluate the
correlation, Spearman's correlation coefficient ρ is
calculated, which determines the dependency of
the data being compared. This dependency is
defined by a value lying in the interval <-1.1>.
Results
The first result of diploma paper was a new way of
image processing without using CT images for
anatomical knowledge. MRI images were fused
with SPECT images. This new way is good for old
SPECT, where the CT scanner isn’t a part of hybrid
scanner, which includes SPECT and CT.
BASGAN index was measured, the results you can
see in Table 1. In this table you can see BASGAN
index for every anatomical structures with mean
value±SD.
Table 1: Quantification of dopaminergic neurons
BASGAN INDEX PD RBD
Left Caudate 3.08±0.68 4.40±1.03
Left Putamen 1.77±0.54 4.03±1.10
Right Caudate 3.04±0.58 4.07±1.07
Right Putamen 1.61±0.46 4.27±1.00
The second result of this thesis was to
statistically process the data measured by
BradykAN (Table 2.) There are all parameters for
both groups, for left and right hand. There are mean
values ±SD.

Bejtic et al.: Consequence of the decrease of dopaminergic neurons and movement parameters in the presymptomatic and manifest
phase of Parkinson's disease
Proc. of IMBM 2019 35
Table 2: Individual parameters measured by BradykAN
Left hand Right hand
P
D
AmpDec [-] 0.24±0.16 0.27±0.13
Frq [Hz] 3.10±1.580 3.01±1.39
Velo [m/s] 80.46±45.43 83.87±34.84
AngMean10 [-] 12.36±8.41 14.48±8.67
Left hand Right hand
R
B
D
AmpDec [-] 0.19±0,09 0.19±0,10
Frq [Hz] 3.28±0.87 3.35±1.04
Velo [m/s] 110.56±36.17 109.23±33.54
AngMean10 [-] 10.98±4.83 12.68±6.78
The third result of the thesis was to find which
movement parameters correlate with decrease of
dopaminergic neurons (Table 3,4). There the
correlation coefficient rho with p-value for every
anatomical structure and 4 movement parameters.
Table 3: Correlation of decrease of dopaminergic neurons and
movement parameters for PD
Correlation
coefficent Left Caudate Left Putamen
rho (p) Right hand Right hand
AmpDec -0.580 (0.004) -0.630 (0.001)
Frq -0.520 (0.011) -0.271(0.212)
Velo -0.375 (0.078) -0.176 (0.423)
AngMean10 -0.464 (0.026) -0.247 (0.256)
Table 4: Correlation of decrease of dopaminergic neurons and
movement parameters for RBD
Correlation
coefficent Right Caudate Right Putamen
rho (p) Left hand Left hand
AmpDec -0.451 (0.031) -0.162 (0.459)
Frq -0.394 (0.063) 0.031 (0.888)
Velo 0.010 (0.964) -0.001 (0.996)
AngMean10 -0.122 (0.580) -0.018 (0.934)
Conclusions
This work dealt with the relationship of decrease of
dopaminergic neurons and movement parameters
in the presymptomatic and manifest phase of
Parkinson's disease. A series of MATLAB and
SPM 12 scripts were designed for SPECT images,
based on T1 images. With these series, 57 probands
were processed, namely 33 probands in the
presymptomatic phase. These probands suffered
from RBD (REM sleep behavior disorder).
Another 24 probands were in a manifest phase and
had Parkinson's disease confirmed. Subsequently,
the BASGAN index of the left, the right caudate
and the left, right putamen were measured in these
probands. The next phase of the thesis was to
analyze the movement parameters measured using
BradykAN software and Optitrack camera system
[5], the following parameters AmpDec amplitude
decrement, Frq frequency, Velo finger opening
speed and AngMean10 angle combination of speed
and amplitude drop were selected. Using the
obtained data, correlation coefficients for all
motion parameters, BASGAN indexes were
calculated using MATLAB and partial correlation.
Partial correlation was used because of the need to
suppress the patient's age to binding index, since
age is related to the binding index of individual
anatomical structures. Based on these calculations,
it was found that the parameters of the RBD
probands largely do not correlate, since their values
were very close to zero, here only the medium-
parameter Velo was the only parameter that was
relatively correlated with the left Caudata finger
opening speed. In PD subjects, this was different,
with AmpDec, Frq, AngMean10 in the left caudate
correlated, AmpDec correlated with left putamen
and right caudate. Other parameters were close to
zero.
The diploma thesis has brought an interesting
way of image adjustment and subsequent
quantification of dopaminergic neurons,
unfortunately it has not been clearly demonstrated
whether the loss of dopaminergic neurons is related
to movement parameters.
Acknowledgements: Project was supported by Czech Science
Foundation (GACR), grant. number 16‐07879S.
References
[1] Kalia, L. V. & Lang, A. E. Parkinsons disease. The
Lancet 386, 896–912 (2015). doi: 10.1016/S0140-
6736(14)61393-3
[2] Claassen, D. O. et al. REM sleep behavior disorder
preceding other aspects of synucleinopathies by up to
half a century. Neurology 75, 494–499 (2010). doi:
10.1212/WNL.0b013e3181ec7fac
[3] Soret, M., Koulibaly, P. M., Darcourt, J. & Buvat, I.
Partial volume effect correction in SPECT for striatal

Bejtic et al.: Consequence of the decrease of dopaminergic neurons and movement parameters in the presymptomatic and manifest
phase of Parkinson's disease
36 Proc. of IMBM 2019
uptake measurements in patients with neurodegenerative
diseases: impact upon patient classification. European
Journal of Nuclear Medicine and Molecular Imaging 33,
1062–1072 (2006). doi: 10.1007/s00259-005-0003-4
[4] Yan, J., Lim, J. C.-S. & Townsend, D. W. MRI-guided
brain PET image filtering and partial volume correction.
Physics in Medicine and Biology 60, 961–976 (2015).
doi: 10.1088/0031-9155/60/3/961
[5] KRUPICKA, Radim, Slavka VITECKOVA, Vaclav
CEJKA, Ondrej KLEMPIR, Zoltan SZABO a Evzen
RUZICKA. BradykAn: A motion capture system for
objectification of hand motor tests in Parkinson Disease.
2017 EHealth and Bioengineering Conference (EHB).
IEEE, 2017, 446-449. DOI: 61
10.1109/EHB.2017.7995457. ISBN 978-1-5386-0358-
1.
[6] SODERLUND, T. A., J. C. DICKSON, E.
PRVULOVICH, et al. Value of Semiquantitative
Analysis for Clinical Reporting of 123I-2- -
Carbomethoxy-3 -(4-Iodophenyl)-N-(3-
Fluoropropyl)Nortropane SPECT Studies. Journal of
Nuclear Medicine. 2013, 54(5), 714-722. DOI:
10.2967/jnumed.112.110106. ISSN 0161-5505.
[7] Salas-Gonzalez, D. et al. Building a FP-CIT SPECT
Brain Template Using a Posterization Approach.
Neuroinformatics 13, 391–402 (2015). doi:
10.1007/s12021-015-9262-9

Proc. of IMBM 2019 37
Neuromelanin quantification in the substantia nigra in neuromelanin-
sensitive MRI scans
Martin Lang1*, Radim Krupička1, Petr Dušek2
1Czech Technical University in Prague, Faculty of Biomedical Engineering, Kladno, Czech Republic 2Clinic of Neurology, General University Hospital in Prague, Czech Republic
Abstract: Neuromelanin (NM) is a black pigment located in the brain in substantia nigra pars compacta (SN)
and locus coeruleus. Its loss is directly connected to the loss of nerve cells in this part of the brain, which plays
a role in Parkinson’s Disease. Magnetic resonance imaging (MRI) is an ideal tool to monitor the amount of
NM in the brain. The aim of the work was the development of tools and methodology for the quantification of
NM in neuromelanin-sensitive MRI images. The first approach was done by creating areas of interest,
corresponding to the anatomical position of SN based on anatomical atlas and determining signal intensity
threshold. By linking the anatomical and signal intensity information, we were able to segment the SN. As a
second approach the neural network U-Net was used for segmentation of SN. Subsequently, the volume
characterizing the amount of NM in the SN region was calculated. To verify the method and assumptions,
available data from various patient groups were correlated. The main benefit of this work is the objectivity of
quantification and facilitation of the image processing process and subsequent quantification compared to the
manual approach. It is ideal for processing many image sets in one batch.
Introduction
Neuromelanin is a black pigment present in
neurons in substantia nigra. Neurons which are
coloured with neuromelanin are typically in higher
risk of cell death than neurons without
pigmentation. The death of these neurons leads to
depletion of dopamine in corpus striatum. Because
the corpus striatum is responsible for body
movement control, symptoms are typically tremor,
rigidity and generally lower quality of motion.
These symptoms are typical for Parkinson’s
disease (PD). [1, 2]
Prior to PD, many people suffer from REM
sleep behaviour disorder, known as RBD. This
disease has typical symptoms such as loss of
muscle atonia during sleep and abnormal
behaviour during sleep, even violent. [3] Long term
studies have proven, that up to 81 % of people
suffering from RBD develop PD or other
neurodegenerative disease in 15 and more years. In
shorter periods of time, up to 48 % patients with
PD and RBD developed dementia in 4 years. 0 %
of patients in control group with PD but without
RBD developed dementia. [4]
Pigmentation of substantia nigra (SN) with
neuromelanin is a physiological process. The
volume of pigmented neurons is increasing during
life until approximately age of 60. Pigmented
neurons are more vulnerable and die easier than
non-pigmented neurons. The loss of neuromelanin
in SN is directly connected to the degeneration of
neurons in SN and suggests PD or other
neurodegenerative diseases. [1]
Neuromelanin-sensitive imaging using MRI is
a promising approach for monitoring disease
development in time and even for detecting early
stages of PD in patients with or without RBD.
Another method used for such purposes is DaTscan
scintigraphy, however the localisation of SN is not
as precise as in MRI scans. [6]
Several approaches are currently used for
processing of neuromelanin-sensitive MRI scans.
All of them are at least partly done manually. This
human factor is the biggest problem in case of
processing more data or creating some reliable,
precise and at least partly universal quantification
system.
Our work was therefore focused on
automatization of data processing and elimination
of the human factor during evaluation of the data
acquired from MRI. This should help to process
more data in shorter time and increase precision
and reliability of obtained results. On the other
hand, we wanted to maintain the possibility for the
doctor to intervene into the process of data
processing in case of some non-standard data
sequences.

Lang et al.: Neuromelanin quantification in the substantia nigra in neuromelanin-sensitive MRI scans
38 Proc. of IMBM 2019
Patients and methods
Participants
Information about the study and its goals were
published in media and interested patients were
invited to fill in RBD screening questionnaire.
Patients scoring above threshold were contacted by
hospital personnel and those with symptoms
suggestive of RBD were invited for clinical
examination. About 50 subjects with no history of
RBD or neurodegenerative disease were enrolled
as controls. After signing informed consent, all
patients and subjects underwent a set of clinical,
cognitive, neurophysiological, biochemical and
neuroimaging investigations. After the baseline
tests, patients were regularly re-examined in one-
year intervals. In total, there were 122 patients
involved in the study. 36 with PD, 47 with RBD
and 39 healthy controls. Age vary from 40 to 77
years.
MRI scanning protocol
All MRI scans were performed on 3T system.
High-resolution T1 and T2 weighted sequences
were included for morphometric analysis and to
exclude focal lesions in brainstem. Experimental
neuromelanin-sensitive T1 weighted sequence was
included among other sequences. The addition of
experimental sequences prolonged the standard
protocol by approx. 20 minutes. Final sequences
have voxel size 0.5x0.5x3mm.
Software
For processing sequences of images acquired from
MRI we used MATLAB (matrix laboratory)
developed by MathWorks. In addition to be able to
process MRI images we used SPM 12 (Statistical
Parametric Mapping) as a suite of MATLAB. SPM
is a free but copyright software, distributed under
the terms of the GNU General Public Licence. This
software enabled us to create a pipeline, which
processes acquired MRI sequences. Partial steps of
this process are described later in the text.
Processing of the data
All patient data obtained from General University
Hospital in Prague are anonymized, a combination
of letters and numbers is used as identification of
each patient involved in the study. The dataset
contains seven repeated neuromelanin-sensitive
sequences of mesencephalon area, displaying SN.
In addition to these sequences we are also provided
with T1 and T2 weighted sequences of the whole
brain.
Primary data adjustment
Raw data from MRI are in TAR format, containing
images in DICOM format (Digital Imaging and
Communications in Medicine). First, we unpacked
the TAR archives. For this purpose, we created
script which generates new folder and unpacks all
the data inside the folder.
After this, we need to transfer the data from
DICOM to NIfTI Data Format (Neuroimaging
Informatics Technology Initiative) so SPM can
process and work with the data. A script created for
this step generates a new folder and imports images
through SPM into this folder. As a result, we get
one file containing large number of individual
images of MRI scans.
Final step of primary data adjustment consists
of changing file names accordingly to their content.
After this step we have individual folders for every
patient named with his code. In every folder there
are data named “nm” for neuromelanin-sensitive
sequences and “t1”, “t2” for T1 and T2 weighted
sequences of the whole brain.
Pre-processing of images
First step of this process is the realigning of T1 and
T2 weighted images. During this procedure, all
images are realigned and if necessary, cropped
according to the first image of the whole sequence.
At the end of the realigning a new set of images is
generated in which all individual images have the
same spatial orientation.
The next step is focused in neuromelanin-
sensitive images. Firstly, all the 7 sequences are
individually realigned the same way as T1 and T2
weighted sequences described before. After that, a
new set of images is created, containing mean
values from each individual neuromelanin-
sensitive sequence.
Sixth step of processing is co-registration of
T1 and T2 weighted sequences according to the
mean neuromelanin-sensitive sequence. Mutual
registration of sequences enables us to localize
functional information contained in NM-sensitive
sequences in topographical images of the brain
(T1, T2 weighted sequences). The output is a
transformation matrix, which will be applied on
sequences in the last step of the process. The reason
for this is to minimalize negative influence of the
transformation.
In the next step the tissue probability map for
brain is used for segmentation of the different
tissues in brain. This map enables us to specify
tissue type for every voxel in the sequence and
helps us to localise substantia nigra more

Lang et al.: Neuromelanin quantification in the substantia nigra in neuromelanin-sensitive MRI scans
Proc. of IMBM 2019 39
accurately. Segmentation is done on the T1
weighted image.
The final step of image pre-processing is back
transformation. In this step the areas of SN are
transformed into the neuromelanin-sensitive
sequences. In this step the transformation matrix
generated in step six is used to match the template
of SN with actual neuromelanin-sensitive images
in the sequence.
Segmentation of SN signal
Because of the differences between patients and
number of slices displaying SN, only 3 slices with
the most visible SN were chosen from the whole
neuromelanin-sensitive sequence for every patient.
Further work and calculations are done on these
3 slices only.
Anatomical and signal intensity threshold
After obtaining the rough position of SN in the
brain the precision of SN localisation was
increased by implementing the threshold of MRI
signal in the area. For every patient, a circle with
4 mm diameter was placed in the background of the
caudal slice, outside of the SN signal. The mean
value from this circle multiplied by 1.2 was
implemented as signal threshold. Signal values
above this threshold were incorporated in the
calculations. Combination of anatomical position
and signal intensity threshold provided better
localisation of the SN.
However, there were still some areas, which
were included in the SN signal but did not belong
there. To deal with this problem, MatrixUser v2.2
software was used to clean the signal map. After
this step, there was a binary map of SN signal in
which we could calculate the volume of
neuromelanin.
Implementation of U-Net
After the binary maps of NM signal were obtained,
we implemented the artificial convolutional neural
network U-Net into the process of signal
segmentation. This neural network is modified for
use in segmentation of biomedical images, so it
does not need as many learning and training data as
standard convolutional neural network.
For training of the neural network, a set of
middle slices and its corresponding binary maps
was used. Solver was set as “adam”, global
learning rate was 0,001. After 500 iterations the
precision of signal segmentation was
approximately 99 %. After this step, the neural
network was used for segmentation of the cranial
and caudal slices. As a result of this process a set
of segmented maps of NM signal was obtained.
Neuromelanin volume calculation
To calculate the volume of NM we used the signal
binary map from SN area and information about
the voxel size in MRI slices. We identified the
number of pixels representing the signal and
multiplied it by the size of the MRI voxel. From
this calculation we obtained the volume for each
slice and the total volume for all three slices of the
SN area in mm3. This calculation was applied on
signal binary map both from atlas and signal
threshold segmentation and U-Net segmentation.
Finally, statistical processing of the calculated
values was done using ANOVA (Analysis of
variance) for measuring the differences between
patient groups and Wilcoxon signed-rank test for
measuring the differences between used methods
of segmentation.
Results and discussion
Applying all the steps described above, we get a
normalised set of image sequences for each
Figure 1. Comparison of neuromelanin in substantia nigra in
healthy brain (Control brain, left) and brain suffering from
Parkinson's disease (right). [5]
Figure 2. Signal intensity above threshold (blue) in
neuromelanin-sensitive MRI image in SN area.
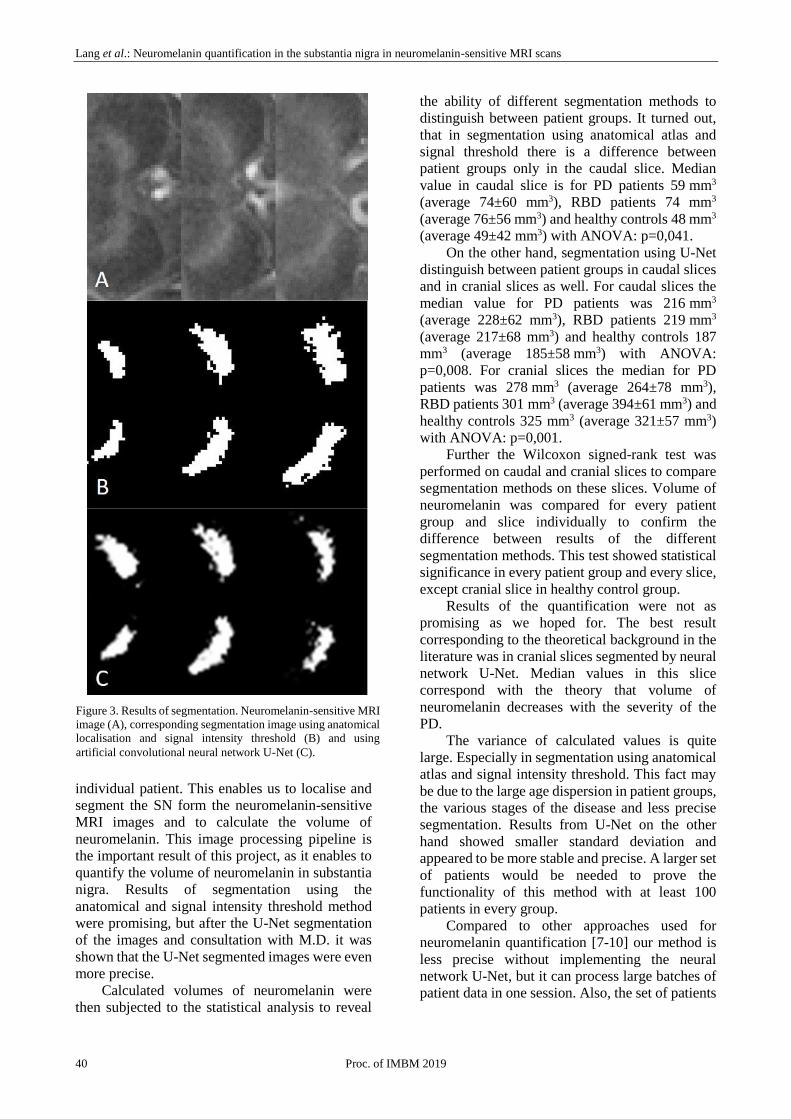
Lang et al.: Neuromelanin quantification in the substantia nigra in neuromelanin-sensitive MRI scans
40 Proc. of IMBM 2019
individual patient. This enables us to localise and
segment the SN form the neuromelanin-sensitive
MRI images and to calculate the volume of
neuromelanin. This image processing pipeline is
the important result of this project, as it enables to
quantify the volume of neuromelanin in substantia
nigra. Results of segmentation using the
anatomical and signal intensity threshold method
were promising, but after the U-Net segmentation
of the images and consultation with M.D. it was
shown that the U-Net segmented images were even
more precise.
Calculated volumes of neuromelanin were
then subjected to the statistical analysis to reveal
the ability of different segmentation methods to
distinguish between patient groups. It turned out,
that in segmentation using anatomical atlas and
signal threshold there is a difference between
patient groups only in the caudal slice. Median
value in caudal slice is for PD patients 59 mm3
(average 74±60 mm3), RBD patients 74 mm3
(average 76±56 mm3) and healthy controls 48 mm3
(average 49±42 mm3) with ANOVA: p=0,041.
On the other hand, segmentation using U-Net
distinguish between patient groups in caudal slices
and in cranial slices as well. For caudal slices the
median value for PD patients was 216 mm3
(average 228±62 mm3), RBD patients 219 mm3
(average 217±68 mm3) and healthy controls 187
mm3 (average 185±58 mm3) with ANOVA:
p=0,008. For cranial slices the median for PD
patients was 278 mm3 (average 264±78 mm3),
RBD patients 301 mm3 (average 394±61 mm3) and
healthy controls 325 mm3 (average 321±57 mm3)
with ANOVA: p=0,001.
Further the Wilcoxon signed-rank test was
performed on caudal and cranial slices to compare
segmentation methods on these slices. Volume of
neuromelanin was compared for every patient
group and slice individually to confirm the
difference between results of the different
segmentation methods. This test showed statistical
significance in every patient group and every slice,
except cranial slice in healthy control group.
Results of the quantification were not as
promising as we hoped for. The best result
corresponding to the theoretical background in the
literature was in cranial slices segmented by neural
network U-Net. Median values in this slice
correspond with the theory that volume of
neuromelanin decreases with the severity of the
PD.
The variance of calculated values is quite
large. Especially in segmentation using anatomical
atlas and signal intensity threshold. This fact may
be due to the large age dispersion in patient groups,
the various stages of the disease and less precise
segmentation. Results from U-Net on the other
hand showed smaller standard deviation and
appeared to be more stable and precise. A larger set
of patients would be needed to prove the
functionality of this method with at least 100
patients in every group.
Compared to other approaches used for
neuromelanin quantification [7-10] our method is
less precise without implementing the neural
network U-Net, but it can process large batches of
patient data in one session. Also, the set of patients
Figure 3. Results of segmentation. Neuromelanin-sensitive MRI
image (A), corresponding segmentation image using anatomical
localisation and signal intensity threshold (B) and using
artificial convolutional neural network U-Net (C).

Lang et al.: Neuromelanin quantification in the substantia nigra in neuromelanin-sensitive MRI scans
Proc. of IMBM 2019 41
is much bigger than in other studies and
corresponds more to real clinical data.
Conclusion
In this project we created the pipeline processing
raw image datasets from clinical MRI. This
pipeline can localise substantia nigra, perform
segmentation and calculate the volume of
neuromelanin in neuromelanin-sensitive MRI
images. This process uses two different approaches
in neuromelanin signal segmentation. The first one
is more traditional with anatomical atlas-based
localisation combined with signal intensity
threshold. Results of this method are not perfectly
precise but can be used as training data for the
artificial convolutional neural network.
The second approach in signal segmentation is
artificial convolutional neural network U-Net.
Using this neural network, segmentation results are
more precise and correspond more to the
theoretical assumptions about volume of
neuromelanin in the brain in different stages of PD.
Although results of quantification do not fully
correspond with the theoretical assumptions, this
method is able to localise, segment and calculate
the volume of neuromelanin in substantia nigra.
Acknowledgements: I would like to thank to my supervisor
Radim Krupička for all the time he spent during consultations
on this project.
References
[1] ZECCA, Luigi, D. TAMPELLINI, M. GERLACH, P.
RIEDERER, R. FARIELLO a D. SULZER. Substantia
nigra neuromelanin: structure, synthesis, and molecular
behaviour. Journal of Clinical Pathology. 2001, 54(6).
[2] HAINING, RobertL a Cindy ACHAT-MENDES.
Neuromelanin, one of the most overlooked molecules in
modern medicine, is not a spectator. Neural
Regeneration Research. 2017, 12(3). DOI:
10.4103/1673-5374.202928. ISSN 1673-5374.
[3] MONTPLAISIR, Jacques. Abnormal motor behavior
during sleep. Sleep Medicine. 2004, 5(1), 34-34. ISSN
1389-9457.
[4] KIM, Yoon, Young Eun KIM, Eun Ok PARK, Chae
Won SHIN, Han-Joon KIM a Beomseok JEON. REM
sleep behavior disorder portends poor prognosis in
Parkinson’s disease: A systematic review. Journal of
Clinical Neuroscience. 2017. DOI:
10.1016/j.jocn.2017.09.019.
[5] Substantia nigra. The Science of Parkinson's [online].
2017.
[6] OHTSUKA, Chigumi, Makoto SASAKI, Kanako
KONNO, Kanako KATO, Junko TAKAHASHI, Fumio
YAMASHITA a Yasuo TERAYAMA. Differentiation
of early-stage parkinsonisms using neuromelanin-
sensitive magnetic resonance imaging. Parkinsonism
and Related Disorders. 2014. DOI:
10.1016/j.parkreldis.2014.04.005.
[7] ISAIAS, Ioannis U., Paula TRUJILLO, Paul
SUMMERS, Giorgio MAROTTA, Luca MAINARDI,
Gianni PEZZOLI, Luigi ZECCA a Antonella COSTA.
Neuromelanin Imaging and Dopaminergic Loss in
Parkinson's Disease. Frontiers in Aging Neuroscience.
2016, 8, -. DOI: 10.3389/fnagi.2016.00196. ISSN 1663-
4365. Available from: http://journal.frontiersin.org/
Article/10.3389/fnagi.2016.00196/abstract
[8] SCHWARZ, Stefan, Timothy RITTMAN, Vamsi
GONTU, Paul MORGAN, Nin BAJAJ a Dorothee
AUER. T1-Weighted MRI shows stage-dependent
substantia nigra signal loss in Parkinson's disease.
Movement Disorders. 2011, 26(9), 1633-1638. DOI:
10.1002/mds.23722. ISSN 08853185. Available from::
http://doi.wiley.com/10.1002/
mds.23722
[9] CASTELLANOS, Gabriel, María FERNÁNDEZ-
SEARA, Oswaldo LORENZO-BETANCOR et al.
Automated Neuromelanin Imaging as a Diagnostic
Biomarker for Parkinson's Disease. Movement
Disorders. 2015, 30(7), 945-952. DOI:
10.1002/mds.26201. ISSN 08853185. Dostupné také z:
http://doi.wiley.com/10.1002/mds.26201
[10] TRUJILLO, Paula, Paul SUMMERS, Alex SMITH,
Seth SMITH, Luca MAINARDI, Sergio CERUTTI,
Daniel CLAASSEN a Antonella COSTA. Pool size ratio
of the substantia nigra in Parkinson’s disease derived
from two different quantitative magnetization transfer
approaches. Neuroradiology. 2017, 59(12), 1251-1263.
DOI: 10.1007/s00234-017-1911-2. ISSN 0028-3940.
Available from: http://link.springer.com/10.1007
/s00234-017-1911-2

42 Proc. of IMBM 2019

Proc. of IMBM 2019 43
Biophysical Methods
and Imaging

44 Proc. of IMBM 2019

Proc. of IMBM 2019 45
Microwave monitoring of ischemia by newborns
Jan Rédr1*, Jan Vrba1
1Czech Technical University in Prague, Faculty of Biomedical Engineering, Kladno, Czech Republic
Abstract: Microwave imaging is a non-invasive method for stroke detection and classification. It has been
widely researched for an adult stroke diagnostic and classification. However, there is a lack of studies
considering microwave imaging of newborn’s ischemic stroke. In this work, initial computer simulations of
electromagnetic waves propagation through 1D and 2D models of a newborn’s head are presented. The
simulations have been undergone in COMSOL Multiphysics software for frequency range from 1 GHz to
3 GHz. This frequency range was chosen from our experience with an adult imaging system operating at
1 GHz. These simulations provide initial milestone for a microwave tomography imaging system. This system
should be capable to monitor the development of an ischemic stroke in real-time and improve the treatment of
this illness.
Introduction
Neonatal ischemic stroke (NIS) occurs when a
blood vessel is blocked in the brain area and affects
one in 4000 infants. The symptoms are, however,
hard to identify due to the nature of a patient. The
conventional imaging methods, used for this cause,
consist of sonography, computational tomography
(CT) and magnetic resonance imaging (MRI). Each
of those imaging modalities has their benefits and
negatives. For instance, sonography uses non-
ionising ultrasound, but the effectiveness of this
method is around 68 %. CT evaluation is much
quicker than sonography but this method uses
ionising radiation, thus this method is dangerous
for the patient. Nowadays, MRI is the best option
for visualisation of NIS. MRI uses non-ionising
radiation and provides the best resolution of those
imaging modalities listed above. However, MRI
systems are expensive to buy, use and maintain. Microwave imaging (MWI) systems provide
non-ionising radiation and reasonable resolution
capabilities with not so costly hardware, so that
MWI neglect most disadvantages of conventional
imaging methods. Also, MWI becomes more and
more time efficient method, which means this
imaging modality can be used for real-time
monitoring of the stroke development and can
improve the treatment of this disease. [1-4]
Methods
COMSOL
For model creation and afterwards simulation,
COMSOL Multiphysics software was used [5].
First of all, two 1D (for x- and y-axis) and one
2D models were created in COMSOL Multiphysics
software. Every model consists of five tissue
domains: skin, bone, cerebrospinal fluid (CSF),
grey and white matter tissues. Each model
represents the transmission path of electromagnetic
(EM) waves. As a transmitter and receiver of EM
waves, the dipole antennas were created as port
domains in COMSOL. Then, the whole model was
surrounded with a matching medium domain.
Matching medium is used to decrease the reflection
of EM waves, when propagating from dipole
antennas to the skin.
Eventually, all of the simulations have been
carried out for frequency range from 1 GHz to
3 GHz.
All the specific dimensions of neonatal head
were taken from [6]. For all models, the x-axis
refers to the head length in lateral head plane and
the y-axis refers to the head length in frontal head
plane. The specific dimensions of neonatal head
are 111 mm for x-axis dimension and 90 mm for y-
axis dimension. Dimensions of the tissue domains
and neonatal head are listed in Table 1.
Figure 3 shows the 1D model for propagating
EM waves along x-axis. Dipole antennas were
modelled as circles with diameter of 2 mm. For y-
axis 1D model were used the same geometric
setting of tissues as for x-axis model, the only
difference is in thickness of white matter tissue and
the dimension of the whole head.
Figure 4 shows the 2D model of neonatal head.
It is an ellipse shaped structure; it’s major and
minor axes refers to x and y dimensions of neonatal
head.
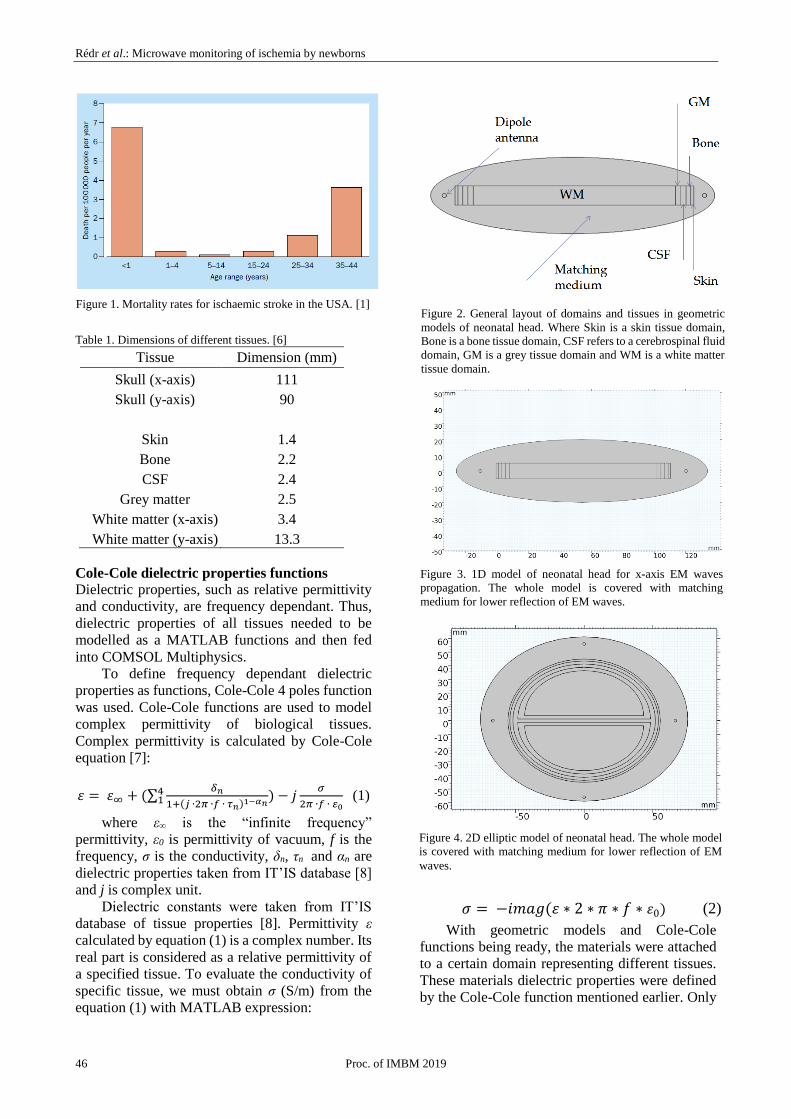
Rédr et al.: Microwave monitoring of ischemia by newborns
46 Proc. of IMBM 2019
Table 1. Dimensions of different tissues. [6]
Tissue Dimension (mm)
Skull (x-axis) 111
Skull (y-axis) 90
Skin 1.4
Bone 2.2
CSF 2.4
Grey matter 2.5
White matter (x-axis) 3.4
White matter (y-axis) 13.3
Cole-Cole dielectric properties functions
Dielectric properties, such as relative permittivity
and conductivity, are frequency dependant. Thus,
dielectric properties of all tissues needed to be
modelled as a MATLAB functions and then fed
into COMSOL Multiphysics.
To define frequency dependant dielectric
properties as functions, Cole-Cole 4 poles function
was used. Cole-Cole functions are used to model
complex permittivity of biological tissues.
Complex permittivity is calculated by Cole-Cole
equation [7]:
𝜀 = 𝜀∞ + (∑𝛿𝑛
1+(𝑗 ∙2𝜋 ∙𝑓 ∙ 𝜏𝑛)1−𝛼𝑛)4
1 − 𝑗𝜎
2𝜋 ∙𝑓 ∙ 0 (1)
where ε∞ is the “infinite frequency”
permittivity, ε0 is permittivity of vacuum, f is the
frequency, σ is the conductivity, δn, τn and αn are
dielectric properties taken from IT’IS database [8]
and j is complex unit.
Dielectric constants were taken from IT’IS
database of tissue properties [8]. Permittivity ε
calculated by equation (1) is a complex number. Its
real part is considered as a relative permittivity of
a specified tissue. To evaluate the conductivity of
specific tissue, we must obtain σ (S/m) from the
equation (1) with MATLAB expression:
𝜎 = −𝑖𝑚𝑎𝑔(𝜀 ∗ 2 ∗ 𝜋 ∗ 𝑓 ∗ 𝜀0) (2)
With geometric models and Cole-Cole
functions being ready, the materials were attached
to a certain domain representing different tissues.
These materials dielectric properties were defined
by the Cole-Cole function mentioned earlier. Only
Figure 1. Mortality rates for ischaemic stroke in the USA. [1]
Figure 2. General layout of domains and tissues in geometric
models of neonatal head. Where Skin is a skin tissue domain,
Bone is a bone tissue domain, CSF refers to a cerebrospinal fluid
domain, GM is a grey tissue domain and WM is a white matter
tissue domain.
Figure 3. 1D model of neonatal head for x-axis EM waves
propagation. The whole model is covered with matching
medium for lower reflection of EM waves.
Figure 4. 2D elliptic model of neonatal head. The whole model
is covered with matching medium for lower reflection of EM
waves.

Rédr et al.: Microwave monitoring of ischemia by newborns
Proc. of IMBM 2019 47
the dielectric properties of matching medium were
set constant using IEEE standard [9].
Eventually, the mesh was established using
default mesh options included in the COMSOL
software and the simulations have been carried out
for frequency range from 1 GHz to 3 GHz with a
frequency step of 0.1 GHz.
Results
Cole-Cole functions
For each tissue model the Cole-Cole function
presented in equation (1) was implemented in
MATLAB. To evaluate the precision of the Cole-
Cole function with the reference, the IT’IS
foundation, the functions of relative permittivity
and conductivity were plotted. The results for grey
matter are presented in figures 5 and 6. The results
were also compared to IT’IS foundation graphs of
dielectric parameters of grey matter.
Initial EM simulations
The initial EM simulations are shown on figures 7,
8 and 9. Figures are shown for frequency of
1.6 GHz. Further examination of those simulations
needs to be done, especially evaluate the S11
parameters. The S11 parameter represents how
much power is reflected from the antenna, the S11
parameter is usually displayed in dB. The
propagation of EM waves in figures 6, 7 and 8
shows the necessity of matching medium and
proves that matching medium is indeed need for a
better propagation of EM waves. For 2D model,
two simulations are presented, each for different
port (dipole antenna) being active.
Conclusion
Microwave imaging is a perspective imaging
method for stroke detection. The ischemic strokes
Figure 5. Cole-Cole function modelling conductivity of grey
matter tissue for frequency range from 1 GHz to 3 GHz with a
step of 0.1 GHz.
Figure 6. Cole-Cole function modelling relative permittivity of
grey matter tissue for frequency range from 1 GHz to 3 GHz
with a step of 0.1 GHz.
Figure 7. EM simulation of 1D model of neonatal head
(x-axis) for frequency 1.6 GHz.
Figure 8. EM simulation of 2D model of neonatal head
for frequency 1.6 GHz. Active port number 1.
Figure 9. EM simulation of 2D model of neonatal head
for frequency 1.6 GHz. Active port number 4.

Rédr et al.: Microwave monitoring of ischemia by newborns
48 Proc. of IMBM 2019
in new-born children have higher mortality rates
than strokes occurring in adults. Conventional
imaging systems used for detection of neonatal
ischemic stroke are partly dangerous, ineffective or
expensive. This paper is about initial works on a
microwave tomography system that would be
suitable for neonates and would improve the
treatment of ischemic stroke. The Cole-Cole
functions were modelled in MATLAB and
implemented in COMSOL Multiphysics and the
initial electromagnetic simulations of the models
were carried out. For future work, it is necessary to
complete the COMSOL simulations and establish
suitable frequency that will be used for the new
tomography system. With suitable frequency
comes the challenge to improve the geometry of an
antenna element which has been developed for
adult use.
References
[1] Stroke in newborn infants. Neurology. 2004, 2004(3), 9.
[2] COWAN, F. Does cranial ultrasound imaging identify
arterial cerebral infarction in term neonates? Archives of
Disease in Childhood - Fetal and Neonatal
Edition [online]. 2005, 90(3), F252-f256 [cit. 2018-11-
25]. doi: 10.1136/adc.2004.055558. ISSN 1359-2998.
Available at: http://fn.bmj.com/cgi/doi/
10.1136/adc.2004.055558
[3] LEQUIN, M.H., J. DUDINK, K.A. TONG a A.
OBENAUS. Magnetic resonance imaging in neonatal
stroke. Seminars in Fetal and Neonatal Medicine
[online]. 2009, 14(5), 299-310 [cit. 2019-08-04]. doi:
10.1016/j.siny.2009.07.005. ISSN 1744165X. Available
from: https://linkinghub.elsevier.com/retrieve/
pii/S1744165X09000572
[4] LI, Xuyang. Body Matched Antennas for Microwave
Medical Applications. Karlsruhe, Baden: KIT Scientific
Publishing, 2013. ISBN 9783731501473. [5] Holmes S.:
Analysis of tobacco ash. In: Doyle A.C. (ed.) Chemistry
in forensic practice. Scotland Yard Publishing, London,
1905, pp. 269-301.
[5] COMSOL Inc., COMSOL Multiphysics 5.1 [software].
Cerven 2019. [přístup 13.6.2019]. Dostupné z:
https://www.comsol.com/products. Požadavky na
systém: operační paměť alespoň 1 GB (doporučeny
4GB), volné místo na disku 1 až 5 GB, operační systém
Microsoft Windows Vista, 7, 8, 8.1, 10.
[6] HOLEK, Lukáš. Phantom of a Neonatal Head for
Purpose of Testing Microwave Imaging System. Czech
republic, 2018. Diploma thesis. CTU in prague.
[7] SAID, Tarek a V. VARADAN. Variation of Cole-Cole
Model Parameters with the Complex Permittivity of
Biological Tissues. In: IEEE MTT-S International
Microwave Symposium digest. IEEE MTT-S
International Microwave Symposium. USA, 2009, s. 5.
ISBN 978-1-4244-2804-5.
[8] HASGALL, P.A., F. Di Genarro, C. Baumgartner, E.
Neufeld, B. Lloyd, M. C Gosselin, D. Payne, A.
Klingenböck, N. Kuster, “IT’IS Database for thermal
and electromagnetic parameters of biological tissues,”
Version 4.0, May 15, 2018, doi: 10.13099/VIP21000-
04-0. itis.swiss/database.
[9] IEEE Recommended Practice for Determining the Peak
Spatial-Average Specific Absorption Rate (SAR) in the
Human Head from Wireless Communications Devices:
Measurement Techniques, IEEE Std 1528-2013
(Revision of IEEE Std 1528-2003), s. 1–246, zář. 2013.

Proc. of IMBM 2019 49
Pulse length optimization of a picosecond CPA-based disc laser with
power of > 100 W
Lucie Horáčková1, 2*, Martin Smrž2, Jan Mikšovský1, Tomáš Mocek2
1Czech Technical University in Prague, Faculty of Biomedical Engineering, Prague, Czech Republic 2HiLASE Centre, Institute of Physics ASCR, v.v.i., Za Radnicí 828, 25241 Dolní Břežany, Czech Republic
Abstract: The aim of the work is to develop pulse length optimization algorithm. Pulse temporal modulation
has the ability to control the energy distribution over time to suit a particular application, e.g. pulsed laser
deposition, nonlinear optical microscopy or fiber optics. Using spectral characteristics measured via FROG
method the programmable spatial light modulator filter was established. It was found out the pulse length
optimization handled by solely spectral phase filter is possible only when having symmetric spectrum. Pulses
with asymmetric spectrum should be amplitude modulated, since FROG method detects asymmetric pulses
inaccurately.
Introduction
Temporal modulation enables us to compress,
stretch or shape pulse in time domain to distribute
power in time [1, 2] to suit the application as
(Pulsed laser deposition) PLD [1], nonlinear
optical microscopy, fiber optics or optical
communications [4]. Pulse temporal modulation
could be accomplished using diffraction gratings
[5], acousto-optic programmable dispersive filter
(AOPDF) [6] or programmable spatial light
modulator [2]. The transform limited pulse is
usually understood as pulse with the shortest pulse
duration possible for a given optical spectrum,
which has optimized constant relative spectral
phase [7, 8]. That is equivalent to the pulse having
a flat spectral phase [7, 8].
The aim of the work is to develop pulse length
optimization computational procedure
for picosecond high power CPA-based disc laser
named PERLA C (located in HiLASE R&D
Centre). PERLA C operates at 100 kHz
and provides 2 ps pulses with 3 nm bandwidth
at centre wavelength of 1030 nm. The algorithm
should provide the laser pulse with duration
as short as permits its spectral bandwidth
by compensating any deviations from a flat phase
using programmable spatial light modulator
(PSLM). Temporal modulator and
frequency-resolved optical gating methods are
used for spectral and temporal measurements.
In this paper, we demonstrate the use of PSLM
as a pulse shaper to modulate solely the spectral
phase, since modulation of purely the phase
preserves the pulse power. The proposed algorithm
was tested for pulse length optimization
on symmetric and asymmetric pulse bandwidths.
Experimental setup and algorithm
Flat-phase optimization setup
Temporal shaping was accomplished by Finisar
Waveshaper 1000A, which is a programmable
spatial light modulator with liquid crystals. The
Waveshaper resolution was 1 GHz (0.0035 nm).
Modulated pulse was detected using Ape
pulseCheck FROG based on frequency-resolved
optical gating method (FROG). A 60 MHz
repetition rate ANDi Yb:glass fiber femtosecond
oscillator with pulse length of 12 ps was used
for testing. The schematic flat phase optimization
setup diagram is depicted in Figure 1.
The pulse length optimization was tested on
two different spectral characteristics (thus different
pulse lengths). Firstly, a 12 ps long pulse with a
20 nm wide asymmetric bandwidth shown in
Figure 2 with central wavelength at 1030 nm was
tested. Secondly, a 1.08 ps long pulse with 3 nm
wide symmetric bandwidth shown in Figure 3 with
central wavelength around 1029 nm was tested.
The spectral modulation was done using a
Gaussian optical filter.
Flat-phase optimization algorithm
The communication between Waveshaper and
phase calculation program was established in
LabVIEW development environment with use of
Queued Message Handler architecture (QMH) as
illustrated in Figure 4. The QMH combines two
parallel loops communicating with each other via

Horáčková et al.: Pulse length optimization of a picosecond CPA-based disc laser with power of > 100 W
50 Proc. of IMBM 2019
message queue. A producer loop handles user
interface events and pushes user messages to the
queue. A consumer loop provides appropriate
response given by state machine.
The developed computational procedure uses
a measured spectrum and spectral phase by the Ape
pulseCheck FROG spectral phase filter calculation
afterwards. The whole setup is treated as a black
box, thus an iterative approach compensates any
distortions that can occur. The algorithm diagram
is shown on the flowchart in Figure 5. The FROG
data are utilized for Waveshaper.
Firstly, the algorithm waits till the FROG data
are measured. Secondly, the desired Waveshaper
spectral phase filter required for flat-phase
compensation is calculated. Thirdly, the calculated
phase filter is sent to the Waveshaper
by the program. If the resulting spectral phase is
not optimized, next algorithm iteration enables
spectral phase filter modification by taking
the difference between the newly measured data
and the desired spectral phase (flat-phase).
Results and discussion
The developed algorithm was tested on pulses
with symmetric 3 nm wide bandwidth with pulse
length of 1.08 ps (see Figure 3). After first program
iteration of spectral phase filter the pulse length
was shortened to 668.2 fs. Any other iteration
Figure 1: Flat-phase optimization setup
Figure 2: Spectral characteristic of the 12 ps long tested pulse
1015 1020 1025 1030 1035 1040 10450,0
0,2
0,4
0,6
0,8
1,0
I [a
.u.]
[nm]
Figure 3: Spectral characteristic of the 1.08 ps long tested pulse
1024 1026 1028 1030 1032 10340,0
0,2
0,4
0,6
0,8
1,0
I [a
.u.]
[nm]
Figure 4: Flat-phase optimization communication diagram
Figure 5: Flat-phase optimization algorithm diagram

Horáčková et al.: Pulse length optimization of a picosecond CPA-based disc laser with power of > 100 W
Proc. of IMBM 2019 51
did not have an impact on the pulse temporal
characteristics. The intensity over time graphs
of the original pulse and pulse after phase
optimization measured using FROG method is
depicted in Figure 6. Transform limited pulse with
equivalent spectral bandwidth would be 658.6 fs.
The result could be considered favourable. The
PERLA C laser has very similar spectral
characteristics as shown in Figure 3, thus, the
developed algorithm is suitable for PERLA C laser
pulses as well.
In contrast, the algorithm was tested on pulses
with asymmetric 20 nm wide bandwidth with pulse
length of 12 ps as well. One can see in Figure 2 the
spectrum contains a significant peak at 1039 nm.
However, the FROG measurement of the
asymmetric pulse converged with high error or did
not converge at all. Since FROG analysis involves
iterative calculations, the computation accuracy is
dependent among others on an initial guess of pulse
shape [9]. Nowadays, majority of algorithms
implemented in FROG instruments available on
the market compute using initial guess with
Gaussian shape [9]. In such conditions, highly
asymmetric pulse shapes as depicted in Figure 2
could hardly be analysed [9]. In case
of the asymmetric pulses, deliberate spectral
modulation might solve the problem while losing
some fraction of the output power.
Conclusion
The goal of the work was to develop and test
algorithm ensuring transform limited pulse by
modulating relative spectral phase. The program is
planned to be used as a part of picosecond 100 kHz
CPA-based laser. The spectral phase was
modulated by programmable spatial light
modulator, spectral and temporal measurements
were done by means of frequency-resolved optical
gating (FROG). Fiber oscillator ANDi Yb:glass
with 60 MHz repetition rate was employed as a
testing source.
The pulse length optimization computational
procedure was tested on two different pulse shapes, 1.08 ps long pulse with symmetric 3 nm spectral
bandwidth, and 12 ps asymmetric pulse with 20 nm
wide spectral bandwidth. The transform limited
pulse length of the 1.08 ps pulse is around 658.6 fs,
while our algorithm shortened the 1.08 ps pulse
to 668.2 fs.
Measurements by FROG method of the 12 ps
pulse was not accurate due to the significant
asymmetry in spectrum or time domain.
For this reason, the proposed calculation program
may be enrich with spectral amplitude modulation
while bearing in mind a loss of the output power
if there is a need of using it for asymmetric pulses.
Since PERLA C laser system has very similar
spectral characteristics as in case of the 1.08 ps
pulses, the result for symmetric pulse are favorable.
The developed algorithm could be used as a part
of PERLA C control system.
References
[1] GARRELIE, Florence, et al. Control of femtosecond
pulsed laser ablation and deposition by temporal pulse
shaping. Optics & Laser Technology, 2016, 78: 42-51.
doi: 10.1016/j.optlastec.2015.09.020
[2] NAKAZAWA, Masataka; YOSHIDA, Masato;
HIROOKA, Toshihiko. The nyquist laser. Optica. 2014,
1.1: 15-22. doi: 10.1364/OPTICA.1.000015
[3] DIELS, Jean-Claude; RUDOLPH, Wolfgang. Ultrashort
laser pulse phenomena. Elsevier, 2006, 443 - 454. ISBN:
9780080466408.
[4] WEINER, Andrew M. Ultrafast optical pulse shaping: A
tutorial review. Optics Communications, 2011, 284.15:
3669-3692. doi: 10.1016/j.optcom.2011.03.084
[5] KOECHNER, W. Solid-State Laser Engineering.
Springer Verlag, ed. 6., New York, USA, 2006. ISBN:
978-3540650645
[6] DUGAN, M. A.; TULL, J. X.; WARREN, W. S. High-
resolution acousto-optic shaping of unamplified and
amplified femtosecond laser pulses. JOSA B, 1997, 14.9:
2348-2358. doi: 10.1364/JOSAB.14.002348
[7] CHRISTOV, I. P., et al. Attosecond time-scale intra-
atomic phase matching of high harmonic generation.
Physical Review Letters, 2001, 86.24: 5458. doi:
10.1103/PhysRevLett.86.5458
[8] ZHANG, Betty Meng, et al. Demonstration of arbitrary
temporal shaping of picosecond pulses in a radially
polarized Yb-fiber MOPA with > 10 W average power.
Figure 6: Temporal pulse shapes before (black curve) phase
modulation and after one spectral phase modulation iteration
(red curve)

Horáčková et al.: Pulse length optimization of a picosecond CPA-based disc laser with power of > 100 W
52 Proc. of IMBM 2019
Optics express, 2017, 25.13: 15402-15413. doi:
10.1364/OE.25.015402
[9] DELONG, K. W., et al. Frequency-resolved optical
gating with the use of secondharmonic generation. JOSA
B, 1994, 11.11: 2206-2215. doi:
10.1364/JOSAB.11.002206
Proc. of IMBM 2019 53
Reconstruction and properties of T2* maps based on the number of
iterations and their correlation with QSM in Parkinson's disease
patients
Jozefína Vaľková1*, Radim Krupička2, Petr Dušek3
1Czech Technical University in Prague, Faculty of Biomedical Engineering, Kladno, Czech Republic 2Clinic of Neurology, General University Hospital in Prague, Czech Republic
Abstract: Parkinson's disease (PD) is a long-term degenerative disorder of the central nervous system that
mainly affects the motor system. Nowadays, magnetic resonance imaging has significant role at enhanced
understanding of the pathological progression and clinical diagnosis of PD. The aim of the project is to choose
from the available tools for the reconstruction of the T2* maps from the multi-echo GRE and to develop a
methodology for the reconstruction of the T2* maps in healthy people, Parkinson's patients and patients with
sleeping disorder. The project is also focused on evaluating the impact of the number of iterations on the T2*
map quality. Sum of squared differences, comparison between the values of pixels in the image matrix and
cross-correlation as quality indicators between images with different number of iterations have been done.
According these calculations the T2* parametric maps made with 130 iterations calculated by open source
image processing program ImageJ with right settings are considered as mapss with appropriate quality for
further research.
Introduction
Parkinson's disease (PD) is the second most
common neurodegenerative disorder of the elderly
and is clinically characterized by the motor
symptoms of tremor, bradykinesia, and rigidity.
Non-motor features including cognitive and
neuropsychiatric disturbances are also commonly
manifest, dispelling previous beliefs that PD is
solely a disorder of movement. The main
pathological characteristic of PD is the progressive
loss of dopamine neurons in the substantia nigra
pars compacta [1].
Iron overload has been implicated in the
pathology and pathogenesis of PD. The substantia
nigra, where the selective loss of dopaminergic
neurons occurs, is the primary region in the brain
known to deposit iron. Additionally, aberrant iron
concentrations have been observed in other brain
regions such as red nuclei, globus pallidus and
cortex of PD patients, despite of unknown
pathology [2]. Many studies have shown that some
MRI sequences such as Quantitative Susceptibility
Mapping (QSM), T2-weighted imaging, T2*, and
R2* mapping can measure the amount of iron
deposition in the brain as a biomarker for
prognostic the disease and help diagnosis of the
disease more accurately [3].
The sequence of a multiecho gradient recalled
echo (GRE) T2*-weighted imaging is a relatively
new magnetic resonance imaging (MRI) technique.
In contrast to T2 relaxation, which acquires a spin
echo signal, T2* relaxation acquires a gradient
echo signal. The sequence of a GRE T2*WI
requires high uniformity of the magnetic field.
GRE T2*WI can detect the smallest changes in
uniformity in the magnetic field and can improve
the rate of small lesion detection. In addition, the
T2* value can indirectly reflect changes in tissue
biochemical components. The measurement of the
T2* value of tissues on the GRE T2*WI can
indirectly reflect the iron content of the tissues,
which demonstrates two advantages: non-
invasiveness and rapidness. The increase in iron
content of tissues causes a shortening in the T2*
relaxation time. This is conducive to quantitatively
study iron deposition [4].
T2* value is widely used in clinical
applications. T2* mapping can measure the amount
of iron deposition in the brain as a biomarker for
prognostic the PD [4]. Therefore, the main aim of
the project is to choose from the available tools for
the reconstruction of the T2 * maps from the multi-
echo GRE and to develop a methodology for the
reconstruction of the T2 * maps.

Val’ková et al.: Reconstruction and properties of T2* maps based on the number of iterations and their correlation with QSM in
Parkinson's disease patients
54 Proc. of IMBM 2019
Subject and Methods
Subject consisted of 8 parkinsonian patients.
Patients were selected from Clinic of Neurology,
General University Hospital in Prague. All subjects
were scanned on a 3T MRI system.
Primary data adjustment
First of all, we had to convert available DICOM
(Digital Imaging and Communications in
Medicine) format images to NIfTI (Neuroimaging
Informatics Technology Initiative) format images
by using free available programme Mricron. The
NIFTI file is generally made up of a header
followed by volumetric data. The format supports
up to 5 dimensions. One of the key capabilities of
the format (stored in the header) is an affine
mapping between voxel indices (i,j,k) and real
world spatial location (x,y,z) [5].
Post-processing of images
The next step was the calculation parametric maps
from T2* images. From the available tools for the
reconstruction of the T2* maps from the multi-
echo GRE we selected program ImageJ. ImageJ is
an open source image processing program
designed for scientific multidimensional images
with thousands of plugins and scripts. For our
research we used the plugin Mri processor which
calculates parametric maps in MRI images. We
selected an appropriate parametres for calculation
such as Levenberg–Marquardt fit algorithm, cap-T
map at 100 and echo times of images (figure 1).
We used free available program MicroDicom
viewer to find out the echo times of our images
from available raw data. For each patient we made
15 parametric maps with different number of
iterations (from 50 to 190 iteration).
Quality indicators
After that we compared quality of these maps in
MATLAB 2018a. We wrote the matlab script for
calculation of three parameters of quality: cross-
correlation, pixels and sum of squared differences.
We decided to choose 3 parameters to get the most
accurate results. Like the pattern matrix we used
the T2* parametric map (8-bit image) with 200
iteration. We elected the image with 200 iterations
because there were no differences or they were
negligibly small between neighbouring images
(image made with 190 iterations and image made
with 200 iterations).
Results
Three parameters (cross-correlation, sum of
squared differences and pixels) of each map have
been calculated in MATLAB.
The cross-correlation was the least precise
parameter. It was insensitive to changes in images
from 80 iteration. For images with higher number
of iteration than 70 was cross-correlation 1 (table
1).
Table 1. Values of cross-correlation parameter in T2*
parametric maps calculated with 50-90 iterations for
8 patients.
Iter 50 60 70 80 90
1 0.9870 0.9984 0.9996 1 1
2 0.9824 0.9974 0.9994 1 1
3 0.9853 0.9980 0.9995 1 1
4 0.9853 0.9981 0.9996 1 1
5 0.9834 0.9980 0.9996 1 1
6 0.9863 0.9984 0.9996 1 1
7 0.9808 0.9976 0.9995 1 1
8 0.9866 0.9984 0.9997 1 1
Figure 1. ImageJ program with appropriate parameters for
calculation T2* parametric maps for the research.
Figure 2. T2* parametric map calculated with 30 iterations (left)
and T2* parametric map calculated with 200 iteration (right).

Val’ková et al.: Reconstruction and properties of T2* maps based on the number of iterations and their correlation with QSM in
Parkinson's disease patients
Proc. of IMBM 2019 55
After that we calculated sum of squared
differences parameter. The resulting values were
considered to be a little more accurate than in the
previous case. There were negligible changes in
images from 90 iteration (table 2).
Table 2. Values of sum of squared differences parameter in
T2* parametric maps calculated with 50-90 iterations for 8
patients.
The pixels (comparison between the values of
pixels in the image matrix) were the best quality
image indicator. The resulting values are shown in
figure 3. The figure 4 shows the log-scale graph of
these values. As we can see the values in pixels for
images are really similar without significant
differences in images from 130 iterations. For
images with 140 iterations and higher values
differed just in 1 to 3 pixels per image.
Discussion
Sum up, according to cross-correlation and sum of
squared differences parameters there are no
significant changes in quality between images with
90 iterations and higher. Although, the pixels
parameter pointed out the differences between
individual images until 130 iterations. From
images with 140 iterations and higher the
individual values were negligibly small. For
obtaining the most relevant results in further work
we decided to work with maps of 130 iterations.
Conclusion
The first part of project was focused on the
detecting the program for postprocessing of T2*
maps. We chose the program called ImageJ and
then we defined and validated parameters for
creation T2 * parametric maps.
In the second part we compared quality of
individual maps for all 8 patients. We wrote the
script in MATLAB for calculation three image
quality indicators (cross-correlation, sum of
squared differences and pixels). Following, the
different values between images were evaluated.
The quality of T2* parametric maps created with
130 iterations is considered as adequate. These
images will be used in further research.
Further work
Our following goal is to create T2* parametric
maps using 130 iterations for images in healthy
people, patients with Parkinson's disease and
patients with sleep disorder (at least for 20 patients
in each group). Then we correlate these T2* maps
with same QSM images and compare the amount
of iron in the substantia nigra pars compacta.
References
[1] POLITIS, Marios a Flavia NICCOLINI. Serotonin in
Parkinson's disease. Behavioural Brain Research
[online]. 2015, 277, 136-145 [cit. 2019-06-20]. DOI:
10.1016/j.bbr.2014.07.037. ISSN 01664328. Available
from: https://linkinghub.elsevier.com/retrieve/pii/
S0166432814004860
[2] WANG, Jian-Yong, Qing-Qing ZHUANG, Lan-Bing
ZHU, et al. Meta-analysis of brain iron levels of
Parkinson’s disease patients determined by postmortem
and MRI measurements. Scientific Reports [online].
2016, 6(1) [cit. 2019-06-20]. DOI: 10.1038/srep36669.
ISSN 2045-2322. Available from::
http://www.nature.com/articles/srep36669
[3] SHAHMAEI, Vahid, Fariborz FAEGHI, Ahmad
MOHAMMDBEIGI, Hasan HASHEMI a Farzad
ASHRAFI. Evaluation of iron deposition in brain basal
ganglia of patients with Parkinson's disease using
quantitative susceptibility mapping. European Journal of
Radiology Open [online]. 2019, 6, 169-174 [cit. 2019-
06-18]. DOI: 10.1016/j.ejro.2019.04.005. ISSN
Iter 50 60 70 80 90
1 e+06 e+05 e+04 e+02 e-05
2 e+06 e+05 e+05 e+03 e-05
3 e+06 e+05 e+05 e+03 e-04
4 e+06 e+05 e+04 e+02 e-02
5 e+06 e+05 e+04 e+03 e-03
6 e+06 e+05 e+04 e+02 e-04
7 e+06 e+05 e+04 e+02 e-06
8 e+06 e+05 e+04 e+02 e-04
Figure 3. Non-log scale graph of pixels.
Figure 4. Log scale graph of pixels.

Val’ková et al.: Reconstruction and properties of T2* maps based on the number of iterations and their correlation with QSM in
Parkinson's disease patients
56 Proc. of IMBM 2019
23520477. Available from:: https://linkinghub.
elsevier.com/retrieve/pii/S2352047719300206
[4] TANG, Meng Yue, Tian Wu CHEN, Xiao Ming
ZHANG a Xiao Hua HUANG. GRE T2 * -Weighted
MRI: Principles and Clinical Applications. BioMed
Research International [online]. 2014, 2014, 1-12 [cit.
2019-06-20]. DOI: 10.1155/2014/312142. ISSN 2314-
6133. Available from:: https://www.hindawi.com/
journals/bmri/2014/312142/
[5] LAROBINA, Michele a Loredana MURINO. Medical
Image File Formats. Journal of Digital Imaging [online].
2014, 27(2), 200-206 [cit. 2019-06-22]. DOI:
10.1007/s10278-013-9657-9. ISSN 0897-1889.
Available from:: http://link.springer.com/10.1007
/s10278-013-9657-9

Proc. of IMBM 2019 57
4D embryogenesis study using X-Ray micro-CT
Kristýna Merglová1*, Jan Žemlička2, Jan Dudák1, 2
1Czech Technical University in Prague, Faculty of Nuclear Sciences and Physical Engineering, Prague, Czech Republic 2Czech Technical University in Prague, Institute of Experimental and Applied Physics, Prague, Czech Republic
Abstract: In recent years, X-ray micro-tomography has found its application in many previously unthinkable
scientific fields. Thanks to the development of nano-focus sources, 3D data with a spatial resolution of less
than 1 µm can be obtained in radiographic laboratories and new digital detectors allow the imaging of structures
made of materials with very similar X-ray absorption. In this work, we focus on the possibilities of displaying
soft tissues of mouse embryos, where it is possible to monitor embryonic development by measuring various
developmental stages. Various ways of stabilization, contrast agents, and mechanical fixation methods have
been tried for selected stages E14, E18 and P1, which consequently led to the establishment of an appropriate
protocol for measuring this type of samples. The results of tomographic measurements of samples stabilized
in ethanol series, contrasted with Lugol's solution and mechanically fixed by agarose gel, enable identification
of individual organs and follow their growth in the monitored time period.
Introduction
Microradiography and micro-tomography (micro-
CT) are imaging modalities based on the
attenuation of X-rays (X-rays) by the observed
sample. X-rays are usually generated using an X-
ray tube and recorded on a detector. Thanks to
continuous technological advances in the field of
X-ray sources and detectors, the resolution of X-
ray imaging techniques is almost comparable with
optical methods. The great advantage of these
methods is, in contrast to standard microscopic and
histological processing, the non-destructivity of
both methods. Individual samples can be used for
further research [1].
Methods based on the use of X-rays are used
both in medicine and in preclinical research to
display bones and soft tissues [2]. However, the use
of contrast media is usually necessary to visualize
fine soft tissue structures. Contrast agents are those
that can selectively change the effective proton
number (Z) of examined soft tissues, thereby
increasing the differential attenuation of X-rays
[3].
A three-dimensional (3D) visualization of an
embryo morphology is important both for a
complete understanding of the function of organs
and tissues, and for an understanding their
development. It may also be particularly important
in combination with spatial analysis of gene
expression, in which case, it can provide an
exceptional insight into the embryonic
development and an understanding of mechanisms
causing abnormal development or congenital
diseases. It has shown that the main challenge for
3D visualization is to find an imaging method that
is suitable for both generating digital volume data
with appropriate resolution and for displaying a
wide range of biological samples, including those
that are large and optically opaque [4].
The aim of this work is to demonstrate that the
micro-CT X-ray method can be used to monitor
embryonic development of mammals. To achieve
this goal, it was necessary to develop a suitable
protocol for the preparation of the various stages of
the laboratory mouse, i.e. to achieve the best
contrast in soft tissues by means of stabilization,
contrasting and mechanical fixation. Furthermore,
the measured data of embryonic (E) and postnatal
(P) samples had to be evaluated and consulted with
anatomists to determine whether the micro-CT
system is a suitable tool for such research.
Materials and methods
Samples
Due to the high homology between the human and
mouse genome, laboratory mice are commonly
used to monitor embryonic development of
mammals. Embryonic stages of E-labeled
laboratory mice (approximately the first 19 days)
and postnatal stages of P-labeled mice are used in
the preclinical research experiments. A description
of the development of individual organ systems can
be found eg in [5, 6].

Merglová et al.: 4D embryogenesis study using X-Ray micro-CT
58 Proc. of IMBM 2019
The easily obtainable P1 stage of the
laboratory mouse (Fig. 1) was used as a reference
in our experiment. Individual samples were
stabilized, contrasted and mechanically fixed in
different ways to find a suitable protocol achieving
the best contrast in soft tissues. Using the selected
protocol, we used stages E14, E18 and P1 to build
a series of different developmental stages. A
detailed description of the preparation of all
samples is given in the following sections.
The samples were provided in cooperation
with the Faculty of Science RNDr. Jana Bulantová,
Ph.D. and with the 3rd Faculty of Medicine,
Charles University, MUDr. Jana Mrzilkova, Ph.D.
The animals were treated following the guidelines
defined by the Ethics Committee of the Third
Faculty of Medicine of Charles University in
Prague in Decisions No. 246/1992 and No.
419/2012. Laboratory BALB / c mice were
sacrificed with ether overdose for the purpose of
this study.
Stabilization, contrast staining and mechanical
fixation of samples
A preparation of individual stages of laboratory
mice involved several processes before the
measurement itself. For the reference P1 sample,
various methods were gradually selected:
stabilization, contrasting or mechanical fixation
leading to a suitable protocol.
The selected protocol for the preparation of
both P and E samples was characterized based on
previous experiments using the reference P1 stage
of the laboratory mouse. The stabilization of the
reference P1 stage specimens was done by an
ascending alcohol line. First, the sample had to be
placed in a 25% ethanol solution for 24 hours, in a
50% ethanol solution for a further 24 hours and
finally in 96% ethanol for at least 24 hours. The
second step of the sample preparation was
contrasting with the use of a Lugol's solution. It is
a solution of elemental iodine and potassium iodide
in water, where iodine (with Z = 53) is a contrast
agent. The immersion time of 6 days has been
found to be satisfactory in the case of P1 stage of
the mouse. The third step (called the intermediate
step) consisted of rinsing the sample with 96%
ethanol, then drying the sample and spraying it
with a clear varnish. After the paint had dried, the
sample had to be soaked in distilled water before
the last step. The last step of sample preparation
was mechanical fixation with the use of an agarose
gel, and it was experimentally demonstrated that
the measurement had to be performed immediately
after this step.
The preparation of the E samples consisted of
the same steps as the preparation of the reference
P1 stage of the laboratory mouse, except that the
stabilization process and the individual preparation
process times were optimized. The first difference
was the stabilization of the samples using a wider
ascending alcohol line. In this case, samples of
stages E18 and E14 had to be immersed for 12
hours in a 30% ethanol solution, then for 12 hours
in a 50% ethanol solution, then for 12 hours in a
70% ethanol solution and finally in 96% ethanol
for 12 hours or more. The second difference was in
the contrast time using Lugol's solution. For these
smaller samples the optimal contrast time was
2 days.
Micro-CT system
To monitor the embryonic development of mice,
we have used the micro-CT system built at the
IEAP CTU in Prague (see Fig. 2). The whole
system is placed in a shielding cabinet and consists
of a detector, an X-ray tube, and a positioning
system and a filter carousel. Nano-focus X-ray tube
(FeinFocus FXE-160.51) with tungsten target and
large-area pixel detector WidePIX4x5 registering
individual photons were used for individual
measurements. Another component is a positioning
system equipped with precision stepper rotary
stage motors (Newport URS75BPP), which is used
for positioning the sample and rotating it at a given
angular step and position it in the axis x (right and
left), y (forward and back) and z ( up and down) [7,
8].
An important part of the micro-CT used is also
a carousel consisting of two discs, each disc
containing aluminum filters of different
thicknesses (0, 20, 50, 100, 150, 200, 300, 600,
1000, 2 000, 4 000, 6 000, 10 000 μm). A set of
Figure 1: Photograph of P1 (postnatal) stage of laboratory
mouse stabilized in ascending alcohol line.

Merglová et al.: 4D embryogenesis study using X-Ray micro-CT
Proc. of IMBM 2019 59
filters is used to retrieve the data needed to perform
berm-hardening correction and thus improve image
quality [9].
Parts of the measuring system (detector,
positioning system and revolver with filters) are
controlled by computer using Pixet software which
is used to set detector parameters, control
acquisition and control a positioning system driven
by stepper motors. The various functions provided
by this software are called using scripts in the
Python programming language [10].
Data Acquisition and processing
To obtain E14, E18, and P1 stage data from
laboratory mice prepared according to the
characterized protocol, the following parameters
were selected to obtain sufficient image quality.
The source-to-detector distance (SDD) was set to
300 mm for the E14, 250 mm to the E18 and 115
mm to the P1, and the E14 to 48 mm to the E14 to
55 mm and the P1 to 26 mm. Thus, the
magnification factor was 6.3 × for E14, 4.5 × for
E18 and 4.42 × for P1, resulting in an effective
pixel size (EPS) of 8.8 μm for E14, 12.1 μm for
E18, and 12.43 μm for P1.
The X-ray tube operated in the micro-focus
mode was set to 70 kVp for E14, E18 and P1, and
a current of 125 μA for E14 and E18 and 55 μA for
P1. The angular step was 0.65 degrees for E14 and
E18 and 0.92 degrees for P1, with 2,353
projections for E14, 2,953 for E18, and 3,522 for
P1 on spiral scan data acquisition. Projection times
were 0.35 s for E14, 0.25 s for E18 and 0.5 s for
P1.
After measurement, beam-hardening
correction was applied to the data using a set of
aluminum filters in a revolver up to 4 mm thick for
E14 and E18 and up to 6 mm for P1.
Reconstruction of measured data was performed by
VG studio Max [11]. A Dragonfly programme [12]
was used to visualize 3D sample volumes and
individual planes.
Results
Based on the selected protocol, the stage of
laboratory mouse E14 was prepared and first
measurement (M1) was then performed.
The resulting visualizations of the E14 stage of
the laboratory mouse show livers occupying most
of the space in the abdominal cavity and oppressing
the intestinal loops. We can also notice a relatively
large heart and small lungs.
Further, the E18 stage of the laboratory mouse
was prepared based on the selected protocol.
Subsequently, second measurement (M2) was
performed with this sample.
The resulting visualizations of the E18 stage of
the laboratory mouse show that most of the organ
systems are already established, but they are still
developing.
Based on the selected protocol, the P1 stage of
the laboratory mouse was prepared and third
measurement (M3) was then performed.
The resulting visualizations of the P1 stage
data of the laboratory mouse demonstrate the
complete development of most organ systems.
Thanks to the chosen protocol it is possible to
Figure 2: The used micro-CT system built at the IEAP CTU in
Prague consists of: detector WidePIX4×5, nano-focus X-ray tube
FeinFocus FXE-160.51, motorized positioning system with a
rotating table Newport URS75BPP, carousel with a set of
aluminum filters for beam-hardening correction [7].
Figure 3: M1: Sagittal slice of the E14 stage of a laboratory
mouse prepared according to the selected protocol. EPS = 8.8
μm.

Merglová et al.: 4D embryogenesis study using X-Ray micro-CT
60 Proc. of IMBM 2019
recognize not only all important organs, but also
such structures as individual muscle groups,
muscle fascias, spinal roots and envelopes, vocal
cords and mucosa-forming cell layer.
Conclusion
Several steps were performed in order to
demonstrate that the X-ray micro-CT method can
be used to monitor embryonic development of
mammals. First, it was necessary to characterize a
suitable protocol for the preparation of samples of
laboratory mice to achieve the best contrast in soft
tissues. The micro-CT system built at IEAP CTU
in Prague was therefore used for experimental
measurements of P1 stage with various preparation
variants and the measured data were subsequently
evaluated to determine if better results were
obtained than in the previous measurement.
For a sample preparation, there was an effort to
choose the simplest procedures and non-toxic
substances for easy reproducibility in radiographic
workplaces. Experiments have shown that the most
efficient sample preparation will consist of a
stabilization process using an ascending ethanol
series to gradually dehydrate the tissues of
laboratory mice, followed by contrast with Lugol's
iodine solution as a contrast agent increasing the
soft tissue differential attenuation, the so-called
intermediate step in particular limiting diffusion of
the contrast substance from the tissues and
mechanical fixation by means of agarose gel
preventing excessive drying and sample
movements during measurement. It has also been
experimentally found that measurements must be
carried out immediately after the last step to avoid
a diffusion of the contrast medium back into the
surrounding agarose gel.
Tomography measurements of the various
embryonic and postnatal stages of the laboratory
mouse were also required to achieve the stated
goal. Stages E14, E18, and P1 were visualized to
demonstrate that the X-ray micro-CT method can
be used for high-resolution 3D imaging and the
results can be implemented to study embryonic
development of laboratory mice. Micro-CT has
countless advantages over competing methods,
although it is not yet possible to replace the cellular
and subcellular distinctions obtained by
histological analysis. Micro-CT in contrast to OPT
(Optical Projection Tomography) allows
examination of opaque samples, compared to
HREM (high-resolution episcopic microscopy) is
simple and fast in terms of sample preparation and
compared to micro-MR (micro-magnetic
resonance) is commercially available.
Using a micro-CT system and a selected
protocol, surprisingly detailed anatomical results
were obtained according to morphological
evaluation. This fact could be therefore used to
Figure 4: M2: Sagittal slice of the E18 stage of a laboratory
mouse prepared according to the selected protocol. EPS = 12.1
μm.
Figure 5: M3: Sagittal section of the P1 stage of a laboratory
mouse prepared according to the selected protocol. EPS = 12.43
μm.

Merglová et al.: 4D embryogenesis study using X-Ray micro-CT
Proc. of IMBM 2019 61
extend the histological-embryological study.
Histology based on two-dimensional histological
sections would also have a spatial component due
to this method. Also, the micro-CT method could
also be used in this respect for spatial focusing of
individual sections for subsequent histological
analysis of samples. The resulting visualizations of
the individual stages with the added interphases
could be used in a further research also to
investigate congenital developmental defects that
arise from abnormal ontogenetic development or
acquired defects. Thus, for example, the possible
teratogenic effects of new pharmaceuticals and
other chemical substances could be investigated at
individual stages.
Acknowledgements: The work has been supported by
European Regional Development Fund-Project "Engineering
applications of microworld physics" (No.
CZ.02.1.01/0.0/0.0/16_019/0000766).
References
[1] DUDAK, Jan, Jan ZEMLICKA, Jakub KARCH, et al.
High-contrast X-ray micro-radiography and micro-CT
of ex-vivo soft tissue murine organs utilizing ethanol
fixation and large area photon-counting detector.
Scientific Reports [online]. 2016, 6(1) [cit. 2019-04-06].
DOI: 10.1038/srep30385.
[2] CHEN, Hongyu, Melissa M. ROGALSKI a Jeffrey N.
ANKER. Advances in functional X-ray imaging
techniques and contrast agents. Physical Chemistry
Chemical Physics [online]. 2012, 14(39) [cit. 2019-03-
15]. DOI: 10.1039/c2cp41858d.
[3] WONG, M. D., A. E. DORR, J. R. WALLS, J. P.
LERCH a R. M. HENKELMAN. A novel 3D mouse
embryo atlas based on micro-CT. Development [online].
2012, 139(17), 3248-3256 [cit. 2019-03-17]. DOI:
10.1242/dev.082016.
[4] MOHUN, T. J. a W. J. WENINGER. Episcopic Three-
Dimensional Imaging of Embryos. Cold Spring Harbor
Protocols [online]. 2012, 2012(6), pdb.top069567-
pdb.top069567 [cit. 2019-04-12]. DOI:
10.1101/pdb.top069567.
[5] HEDRICH, Hans J. The laboratory mouse. Second
edition. Amsterdam: AP, Elsevier, 2012. ISBN
9780123820082.
[6] HILL, M.A. Mouse Timeline Detailed. In: Embryology
[online]. c2019, 6 May 2019 [cit. 2019-05-03].
Available from:: https://embryology.med.unsw.edu.au/
embryology/index.php/Mouse_Timeline_Detailed.
[7] DUDAK, J., J. KARCH, K. HOLCOVA a J.
ZEMLICKA. X-ray imaging with sub-micron resolution
using large-area photon counting detectors Timepix.
Journal of Instrumentation [online]. 2017, 12(12),
C12024-C12024 [cit. 2019-03-21]. DOI: 10.1088/1748-
0221/12/12/C12024.
[8] JAKUBEK, Jan. Data processing and image
reconstruction methods for pixel detectors. Nuclear
Instruments and Methods in Physics Research Section
A: Accelerators, Spectrometers, Detectors and
Associated Equipment [online]. 2007, 576(1), 223-234
[cit. 2019-02-18]. DOI: 10.1016/j.nima.2007.01.157.
[9] Products. Institute of Experimental and Applied Physics:
Czech Technical University in Prague [online].
6/20/2017 [cit. 2019-04-20]. Available from::
http://www.utef.cvut.cz/products.
[10] TURECEK, D, T HOLY, J JAKUBEK, S POSPISIL a
Z VYKYDAL. Pixelman: a multi-platform data
acquisition and processing software package for
Medipix2, Timepix and Medipix3 detectors. Journal of
Instrumentation [online]. 2011, 6(01), C01046-C01046
[cit. 2019-03-02]. DOI: 10.1088/1748-
0221/6/01/C01046.
[11] VGSTUDIO MAX: High-End lndustrial CT Software.
In: VOLUME GRAPHICS: Enabling Better Products
[online]. c2019 [cit. 2019-04-09]. Available from::
https://www.volumegraphics.com/en/products/vgstudio
-max.html.
[12] DRAGONFLY. In: OBJECT RESEARCH SYSTEMS
[online]. c2019 [cit. 2019-04-09]. Available from:
http://www.theobjects.com/dragonfly/index.html.

62 Proc. of IMBM 2019
Applicator for regional hyperthermia based on metamaterial theory
Matouš Brunát1*, David Vrba1
1Czech Technical University in Prague, Faculty of Biomedical Engineering, Kladno, Czech Republic
Abstract: This work is concerned with innovative prototype of applicator for regional hyperthermia.
Advantages of this applicator is primarily in its easy construction, low manufacturing cost and homogeneity
of radiated electromagnetic field. Applicator is inspired with one dimensional metamaterial structures and
works for electromagnetic field with frequency of 70 MHz. Numerical model of the applicator was created in
software COMSOL Multiphysics which use numerical calculation for distribution of temperature field and
specific absorption rate were calculated and depicted. It was determined the optimal number of applicators
surrounding tissue for regional hyperthermia with regards of homogeneity of the electromagnetic field and
reflectivity coefficient. Results of simulations are then confirmed using experiments with newly build
prototype on agar phantom.
Introduction
Generally, hyperthermia refers to the treatment of
a disease by applying heat. In this paper it means
elevated temperature inside of a human body up to
an interval 41–45°C. Temperature growth is caused
by absorption of electromagnetic (EM) waves.
Hyperthermia which does not exceed 45°C is
generally well tolerated by human body and rarely
affects healthy tissues. [1]
Hyperthermia is rarely used as a main
treatment. Usually it is combined with other
therapeutic modalities such as radiation therapy,
radio chemotherapy or just chemotherapy. In
combination with these treatments it can almost
double the chances of successful treatment for
many cancer types as seen in figure 1. [2]
Mechanisms of affect
Hyperthermia induces numerous changes inside a
cell. Studies have suggested two main types of
cellular response to a stress: the heat shock
response and programmed cell death. When cell
undergoes heat shock it produces heat shock
proteins and proteins inside the cell are unfolded
(denaturation). These changes in protein structure
renders it defunct [3]. Nuclear proteins are the most
important for hyperthermia. These proteins are
very sensitive to temperature changes and when
damaged, they cause vast secondary damage to the
cell, such as stopping cell proliferation, causing
membrane damage and finally cell death. [4]
Cell death (apoptosis) is a controlled
mechanism, which induces signalling pathways
involving the coordinated action of many kinases
and cysteine proteases resulting into a cells demise
[6]. Apoptosis is beneficial type of cell death since
it does not produce inflammatory response.
When cell is exposed to a higher temperature
it tends to survive for some period. From many
hours around 40 °C to quick death around 45 °C.
Exact duration and upper limit of these values is till
this day debated.
On the other hand, cells produce so called heat
shock proteins (HSPs) in order to survive in high
temperatures. HSPs help with maintaining right
structures of proteins inside the cell. HSPs work as
antiapoptotic and cytoprotective substances and
therefore have negative affect on overall treatment.
There are some studies, which suggest that HSPs
do in fact activate immune system and can help
with the treatment, but negative affect should have
bigger impact. [7]
Malignant cancerous tumours are regarded as
autonomous organs with their own micro-
Figure 1: Percentage of successfully treated tumors using
conventional treatment and combined treatment with
hyperthermia. [5]

Brunát et al.: Applicator for regional hyperthermia based on metamaterial theory
Proc. of IMBM 2019 63
environment. Healthy tissues have significant
differences in contrast to tumours. For
hyperthermia, two of those differences are
significant: Reduced blood flow and blood vessel
density. Lower blood perfusion rate leaves
cancerous tissues vulnerable to higher
temperatures as well as hypoxic and acidic. [8]
When heated reduced blood flow ensures
lower ability of tumours to dissipate heat than in
healthy tissue. Therefore, when cancerous tissue is
suffering from heat damage, healthy tissue is
usually barely affected. [9]
Methods
In order to heat up tissue, energy needs to be
transferred from electric power source and then
absorbed inside a body. In this paper metamaterial
applicator is used as depicted in figure 2.
The applicator works as follows: EM field at
frequency 70 MHz is brought through the coaxial
cable. Core of the coaxial cable is connected to the
microstrip and outer conductor is connected to the
grounding plane. The microstrip line is used to
distribute power equally between antennas (here
called airbridges. Airbridges radiate EM power
inside the body and shades around the applicator
are used to direct more power into the tissue.
Airbridges are then connected back to the
grounding plane which is coupled back to the
coaxial cable.
Since EM waves with a frequency 70 MHz
should resonate with structures of minimal size
around 1 m, metamaterial theory is used to free
resonance from dimensions of the applicator. To do
so, capacitors are introduced into the circuit as seen
in figure 3. The proposed applicator is essentially
four cells of metamaterial divided into two parallel
branches.
The applicator is evaluated using four
methods. Specific absorption rate (SAR), effective
field size (EFS), therapeutic temperature area
(TTA) and S11 parameter. SAR is quantity
measuring how much electromagnetic energy was
absorbed by one kilogram of tissue. It is mainly
used to show shape of area which is heated by
applicators. EFS is closely connected with SAR. It
is a single value which takes a plane 1 cm deep in
a tissue and finds the area with more than 50% of
maximum SAR in this plane. Usually, this area is
then divided by a size of applicator to compare
different applicators. TTA is simply the area or
volume with temperature above 41°C and the S11
parameter shows how much energy is reflected
back to the source. [10]
Results
As shown in figure 4, simulated S11 parameter was
similar to that measured on built applicator. The
Figure 2: Geometry of the numerical model. a) Applicator from
above. The largest plane is substrate with dimensions 470 mm
to 120 mm made out of dielectric material with ground plane on
one side and microstrips on the other. b) Look from a side of the
applicator. Blue line is ground plane. Airbridges are 12 mm
from ground plane. From this angle shades from all sides of the
applicator can be seen. c) Zoom in on microstripes and
capacitors dividing power equally from coaxial cable to
airbridges. d) Highlighted conductive parts of the applicator
without shades. Capacitors are not included in this picture and
are seen as disconnected microstrip lines.
Figure 3: Circuit forming one cell of the metamaterial. CL and
LL are part of pure left-handed metamaterial and CR and LR are
usual right-handed material part. Together forming combined
left-right handed metamaterial. Inductances are integral part to
the applicator and can be tweaked only by changing geometry.
Capacitances are added through capacitors integrated into the
circuit.

Brunát et al.: Applicator for regional hyperthermia based on metamaterial theory
64 Proc. of IMBM 2019
airbridges have proven themselves to be very
sensitive on even small imprecisions, hence the
different resonance.
Qualitative evaluation is provided in figure 5,
where simulated SAR distribution and measured
temperatures are compared. Temperature
distribution should be the same as SAR distribution
and using infrared camera it can be seen, that they
are very similar, thus confirming simulations.
For regional hyperthermia several applicators
need to be positioned around the body. Positions
for 4, 6 and 8 applicators were optimized and
Figure 4: S11 parameters for different frequencies. a) From
numerical simulations. b) Measured in constructed prototype.
Figure 7: Realization of the applicator. a) Microstrip line with
soldered capacitors. b) Heating under the microstrip line. At this
temperature the rising of the temperature stopped. c) Soldered
airbridges with shades around the applicator.
Figure 6: Numerical simulations of regional hyperthermia with
six applicators around a human body. Upper picture shows SAR
field and lower picture TTA. Simulations were done only on
quarter of the model, because symmetry of the model allowed
it.
Figure 5: Power distribution under the applicator. All three
pictures planes in 1 cm in phantom (tissue). From left: SAR
distribution, SAR distribution shown under the applicator and
the temperature distribution from experiments.

Brunát et al.: Applicator for regional hyperthermia based on metamaterial theory
Proc. of IMBM 2019 65
compared. The most suitable were 6 applicators as
shown in figure 6.
Building the prototype proved to be
challenging, since the applicator is sensitive for
changes in geometry in some dimensions. Figure 7
shows soldering of the applicator and heating
losses under the microstrip line. In figure 7c, blue
plastic combs can be seen. These were 3D printed
in order to place the airbridges with maximum
precision.
Conclusion
The proposed applicator is functional, and results
suggest, that it can be used in clinical practice.
Currently, however, it is too sensitive to changes in
geometry, which should be solved before any
further development. One possible solution would
be adjusting the distance between ground plane and
airbridges.
This applicator could be used to treat
abdominal cancers such as cervical cancer, prostate
cancer and bladder cancer.
Furthermore, regional hyperthermia needs
very precise planning of the treatment, which than
influence amplitude and phase of waves radiating
from each applicator. Such planning needs new
algorithms specifically designed for proposed
applicators.
References
[1] KUBASZEWSKA a Marek KANIKOWSKI.
Hyperthermia – description of a method and a review of
clinical applications. Reports of Practical Oncology &
Radiotherapy [online]. 2007, 12(5), 267-275 [cit. 2019-
04-20]. DOI: 10.1016/S1507-1367(10)60065-X. ISSN
15071367. Available from:
https://linkinghub.elsevier.com/retrieve/pii/S15071367
1060065X
[2] VRBA, Jan. Lékařské aplikace mikrovlnné techniky.
Praha: Vydavatelství CVUT, 2003. ISBN 80-01-02705-
8.
[3] Dubois, Marie & Hovanessian, Ara & Bensaude,
Olivier. (1991). Heat-shock-induced denaturation of
proteins: Characterization of the insolubilization of the
interferon-induced p68 kinase. The Journal of biological
chemistry. 266. 9707-11.
[4] DEWEY, W. C. Arrhenius relationships from the
molecule and cell to the clinic. International Journal of
Hyperthermia [online]. 2009, 25(1), 3-20 [cit. 2019-04-
20]. DOI: 10.1080/02656730902747919. ISSN 0265-
6736. Available from: http://www.tandfonline.com/
doi/full/10.1080/02656730902747919
[5] Proven Clinical Evidence: Clinical Evidence supports
the use of Hyperthermia in many Cancer Indications.
Pyrexar medical [online]. [cit. 2017-05-14]. Dostupné z:
http://www.pyrexar.com/clinical
[6] WOLF, Beni B. a Douglas R. GREEN. Suicidal
Tendencies: Apoptotic Cell Death by Caspase Family
Proteinases. Journal of Biological Chemistry [online].
1999, 274(29), 20049-20052 [cit. 2019-04-20]. DOI:
10.1074/jbc.274.29.20049. ISSN 0021-9258. Available
from: http://www.jbc.org/lookup/doi/10.1074/
jbc.274.29.20049
[7] OHNISHI, Ken. OHNISHI, Takeo. Hyperthermic
sensitizers targeting heat-induced signal transductions.
Annals of Cancer Research and Therapy [online]. 2007,
15(2), 35-40 [cit. 2019-07-10]. DOI: 10.4993/acrt.15.35.
ISSN 1344-6835. Available from:
https://www.jstage.jst.go.jp/article/acrt/15/2/15_2_35/_
article
[8] SCHILDKOPF, P., O. J. OTT, B. FREY, M.
WADEPOHL, R. SAUER, R. FIETKAU a U. S.
GAIPL. Biological Rationales and Clinical Applications
of Temperature Controlled Hyperthermia - Implications
for Multimodal Cancer Treatments. Current Medicinal
Chemistry [online]. 2010, 17(27), 3045-3057 [cit. 2019-
04-20]. DOI: 10.2174/092986710791959774. ISSN
09298673. Available from:
http://www.eurekaselect.com/openurl/content.php?genr
e=article&issn=0929-
8673&volume=17&issue=27&spage=3045
[9] WUST, P, B HILDEBRANDT, G SREENIVASA, B
RAU, J GELLERMANN, H RIESS, R FELIX a PM
SCHLAG. Hyperthermia in combined treatment of
cancer. The Lancet Oncology [online]. 2002, 3(8), 487-
497 [cit. 2019-07-10]. DOI: 10.1016/S1470-
2045(02)00818-5. ISSN 14702045. Available from:
https://linkinghub.elsevier.com/retrieve/pii/S14702045
02008185
[10] DOBŠÍCEK TREFNÁ, Hana, Johannes CREZEE,
Manfred SCHMIDT, et al. Quality assurance guidelines
for superficial hyperthermia clinical trials.
Strahlentherapie und Onkologie[online]. 2017, 193(5),
351-366 [cit. 2019-04-20]. DOI: 10.1007/s00066-017-
1106-0. ISSN 0179-7158. Available from:
http://link.springer.com/10.1007/s00066-017-1106-0

66 Proc. of IMBM 2019
Proposal and realization of hybrid antenna suitable for microwave
hyperthermia and microwave imaging based on radar method
Andrew Rybář1*, Ondřej Fišer1
1Czech Technical University in Prague, Faculty of Biomedical Engineering, Kladno, Czech Republic
Abstract: The Aim of this study is to create hybrid applicator that is capable to fulfil the role of both at
once. The applicator is capable of efficient microwave energy transmission in interval of 0.3 to 3 GHz.
Applicator was developed and tested using software SEMCAD X and Creo 4. This applicator was adjusted
and improved via iteration loops based on simulation results. After reaching promising parameters,
applicator was created and experimentally tested. Reconstruction algorithm (Delay and sum) was
implemented for radar method in MATLAB at the same time. Proposed applicator design, simulation and
results of the experiment are shown in this work. The experimental measurement indicates that the selected
concept is suitable for use in clinical practice. This design is promising for further development on
hyperthermia field.
Introduction
Breast cancer is serious oncological disease.
Common treatment includes surgery, radiotherapy
and chemotherapy. The new trend is a combination
of the above-mentioned therapies with
hyperthermia in more advanced stages of the
disease. This combination has generally resulted in
higher treatment success rate. For the heating of
tumor tissue can be used electromagnetic (EM)
waves with wavelength in the region of
microwaves. For transfer energy to the patient are
used so called applicators. There are two
distinguished types of microwave applicators – the
first for detecting the position of the tumor based
on the radar method [4-6] and second for
microwave hyperthermia therapy. Each of those
methods require different functional parameters of
applicators.
Microwave hyperthermia is modern method
for curing cancer diseases [2, 3]. Main principle is
in difference sensitivity of tissue. In temperatures
above 42 °C cancer tissues are selectively killed
without damaging healthy tissue that is cooled by
blood.
Cancer is serious oncological disease that can
get any human at any age or race [1]. Till today,
there is not known cure that could cure cancer
without side effects or with 100% reliability.
Breast cancer is the most common cancerous
illness in women. And its second leading cause of
cancer death among women.
This study aims to design a new applicator that
can be used for microwave hyperthermia and
detection of tumor position in the tissue. By fusing
these two functions to one applicator self-imaging
system is created and there wouldn’t be need for
external imaging systems such as CT. That means
less radiation to sensitive breast tissue and lower
risk of side effects.
Methods
First design proposal was created in CAD software
Creo 4, then exported and simulated in SEMCAD
X simulation software. Basic simulation for
calculation reflective parameter was made.
Reflective parameter highly depends on the shape
of metallic part of the applicator.
Shape of the applicator was altered based on
the simulation results. Shape was not altered only
in one dimension but multiple times. Each change
of any dimension was created on separated models.
These models were sent to the simulation process
again. According to simulation results most
effective shape has been chosen. This chosen
applicator was altered yet again to check if the
applicator can be improved even more. Each step
finished with simulation evaluation is called
iteration look. These iteration loops perfected the
design to the point where his energy transfer
efficiency was high enough to perform microwave
hyperthermia on frequencies of 434 MHz and
2.45 GHz and radar position detection. For radar
position detection design proposal have to be
efficient on interval from 0.3 to 3 GHz. Graph of
reflection coefficient and final shape can be seen
on Figs. 1, 3.

Rybář et al.: Proposal and realization of hybrid antenna suitable for microwave hyperthermia and microwave imaging based on radar
method
Proc. of IMBM 2019 67
After getting suitable design proposal heavy
simulations for hyperthermia and tumor position
detection was made. For these simulations four
applicators has been used. Setup array can be seen
on fig. 2. Sunflower oil was used as cooling
medium of breast tissue and for better energy
transfer due to his similar values of relative
permittivity. Simulations were made by FTDT
method. This method simulates each parameter
with respect to time. So final results are
representations of values of each parameter on time
axis. Fineness of grid was set by maximum size of
cell 0.3 mm in diameter.
Simulation results are values of
electromagnetic field in time.
For tumor position detection script in
MATLAB software was made. Tumors has against
breast healthy tissue very different values of
relative permittivity. Due to this difference, there is
a significant reflection of electromagnetic energy.
Time generated electromagnetic wave and time of
measured reflected energy can be converted to
distance due to known wave speed in this medium.
That distance can be represented in space
according to Delay and Sum algorithm [2].
Delay and Sum is an algorithm that is capable
of visualizing sum of reflected electromagnetic
signals from cancer in distance from their origin. In
this scenario the origin is in the center of each
applicator. Reconstruction equation is [3]:
𝐼(𝑟0) = (∑ ∑ 𝑦𝑑,𝑛(𝜏𝑛(𝑟0) + 𝜏𝑤)
𝑇𝑤/2
−𝑇𝑤/2
𝑁
𝑛=1
), (1)
where I is Intensity of signal, r0 is center
position of applicator, N is number of applicators,
Tw is time window, τn is time delay from r0 defined
by origin n, yd,n is recorded signal in time from
applicator n.
In other words, script process values in time
and creates images containing measured position
and true position of tumor in transversal cut of
breast tissue. Example of detected tumor can be
seen in fig. 4.
Table 1. Values of parameters used in simulations
Sample Number of
pulses
Density of
energy (J/cm²)
Tumor 49.6 1.078814
Sunflower
oil 2.52 0.021
Substrate 3.38 0
Breast tissue 9.97 0.19
After pinpointing position of tumor.
Microwave energy from applicators can be focused
on defined position of tumor in tissue. Results of
simulated hyperthermia are values of specific
absorption ratio distribution in transversal cut.
Specific absorption ratio can be substituted for heat
distribution if heat transfer is ignored. In real
condition this can be achieved by shortening the
heating duration and increasing output power of
applicator.
Results
Final shape of the applicator is shown in fig. 2.
Dimensions of the applicator are 120 mm in high
115.2 mm width. Tip between two sides of metallic
parts has angle of 160° and angle between base and
coincidental side is 52°.
Example of detected tumor position can be
seen on fig. 4. Metallic parts of the applicators that
are spread around the model can cause mirror effect
that multiplies hotspot. In fact, these reflections can
Figure 1: Graph of reflection coefficient as result of simulation
for final shape of design proposal. Effectivity in selected
interval of 0.3-3 GHz is more than 90 %.
Figure 2: Setup array for hyperthermia simulations and tumor
position detection. Red represents tumor, black applicators, blue
is sunflower oil and yellow is breast tissue.

Rybář et al.: Proposal and realization of hybrid antenna suitable for microwave hyperthermia and microwave imaging based on radar
method
68 Proc. of IMBM 2019
be seen on fig. 4. They are caused by ideal
conditions of virtual model and they have minimal
effect in real conditions.
On fig. 5 and 6 is specific absorption ratio
distribution for frequencies 434 MHz and
2.45 GHz. These frequencies can be legally used
for microwave hyperthermia in Czechia. From
results can be seen that lower frequency is more
suitable for focusing bigger sized tumors. On the
other hand, higher frequency is more suitable for
smaller tumors such as 20 mm in diameter or less.
Conclusion
Simulation results confirms capability to use
proposed design for hyperthermia treatment and
radar detection using radar method with Delay and
Sum algorithm. Tumor position detection is
accurate enough for using as targeting system for
microwave hyperthermia. Study shows that
4 applicators are capable of selectively heating
tumor tissue.
Microwave hyperthermia has proved to be a
new efficient method in curing cancer. It works
well as enhancer for classic treatment methods
such as radiotherapy and chemotherapy. These
results can be implemented in future academic
works or even in clinical practice.
References
[1] Miriskav Procházka. "TEM aplikátor pro mikrovlnnou
hypertermii". Diplomová práce Univerzita Karlova
v Praze, 1. lékařská fakulta, 2010
[2] LI, X., S.K. DAVIS, S.C. HAGNESS, D.W.
VANDERWEIDE a B.D. VANVEEN. Microwave
Imaging via Space–Time Beamforming: Experimental
Investigation of Tumor Detection in Multilayer Breast
Phantoms. IEEE Transactions on Microwave Theory
and Techniques [online]. 2004, 52(8), 1856-1865 [cit.
Figure 3: Final shape of applicator. Orange is metallic part of
applicator and white represents low loss dielectric material-
substrate.
Figure 4: Detection of tumor position. Red circle represents true
shape and position of tumor and hot spot is detected position.
Figure 5: Specific absorption ratio distribution for hyperthermia
application on frequency 2,45 GHz.
Figure 6: Specific absorption ratio distribution for hyperthermia
application on frequency 434 MHz.

Rybář et al.: Proposal and realization of hybrid antenna suitable for microwave hyperthermia and microwave imaging based on radar
method
Proc. of IMBM 2019 69
2019-05-10]. DOI: 10.1109/TMTT.2004.832686. ISSN
0018-9480. Available from:
http://ieeexplore.ieee.org/document/1318781/
[3] CONCEIÇÃO, Raquel Cruz, Johan Jacob MOHR a
Martin O'HALLORAN, ed. An Introduction to
Microwave Imaging for Breast Cancer
Detection [online]. Cham: Springer International
Publishing, 2016 [cit. 2019-05-10]. Biological and
Medical Physics, Biomedical Engineering. DOI:
10.1007/978-3-319-27866-7. ISBN 978-3-319-27865-0.
Available from:
https://www.springer.com/gp/book/9783319278650
[4] MERUNKA, Ilja, Ondrej FISER, Jan VRBA, Jan
VRBA a David VRBA. Comparative study
ofantennasformicrowavetomography. In: 2017 Progress
In ElectromagneticsResearchSymposium - Spring
(PIERS) [online]. IEEE, 2017, 2017, s. 727-731 [cit.
2019-04-22]. DOI: 10.1109/PIERS.2017.8261837.
ISBN 978-1-5090-6269-0. Available from:
http://ieeexplore.ieee.org/document/8261837/
[5] MERUNKA, I., J. VRBA, O. FISER a D. VRBA.
ComparisonofBowtie Slot and RectangularWaveguide-
BasedAntennasforMicrowaveMedicalImaging. In: 12th
EuropeanConference on Antennas and Propagation
(EuCAP 2018) [online]. InstitutionofEngineering and
Technology, 2018, 2018, 477 (5 pp.)-477 (5 pp.) [cit.
2019-04-22]. DOI: 10.1049/cp.2018.0836. ISBN 978-1-
78561-816-1. Available from: https://digital-
library.theiet.org/content/conferences/10.1049/cp.2018.
0836
[6] FISER, O., I. MERUNKA, D. VRBA, J. VRBA a J.
VRBA. Comparisonofthree UWB
microwaveantennasintendedfor brain
strokedetectionsystem. In: 2016 Progress in
ElectromagneticResearch Symposium (PIERS) [online].
IEEE, 2016, 2016, s. 4648-4648 [cit. 2019-04-22]. DOI:
10.1109/PIERS.2016.7735714. ISBN 978-1-5090-
6093-1. Available from:
http://ieeexplore.ieee.org/document/7735714/

70 Proc. of IMBM 2019
Accuracy of energy expenditure measurement by wearable electronics
Olga Tsirkunova1*, Jan Muzik1
Czech Technical University in Prague, Faculty of Biomedical Engineering, Kladno, Czech Republic
Abstract: Wearable physical activity monitors provide the opportunity for many peoples to self-monitor
physical activity. Accurate measurement of physical activity is important for health care. The accuracy of
energy expenditure measurement is necessary for control glucose metabolism in type 1 diabetes to better
describe normal life conditions. The purpose of this study is to determine the accuracy of energy expenditure
measurement of persons for different activities by wireless monitoring systems (Fitbit Charge 2, Xiaomi Mi
Band 2) and compare them with reference method (System Oxycon Mobile). Set of experiments for energy
expenditure estimation was planned and performed. The processed data are reported.
Introduction
The estimation of the energy expenditure of people
by using wearable electronics is currently a popular
trend [1]. As these wearable devices become more
commonplace, there is the potential to harness
these technologies to engage patients in the self-
management of their care as well as provide
lifestyle information to health care providers [2].
For example, exercises are affecting on glucose
homeostasis, they cause a transient increase of
insulin action and may lead to hypoglycemia. The
accuracy of energy expenditure measurement is
necessary for control glucose metabolism in type 1
diabetes to better describe normal life conditions
[3].
Energy expenditure (EE) is the amount of
energy needed by the human body for both
physical rest and exercise. Total energy
expenditure (TEE) is physiological quantity
consisting of three basic components. The first
component is the so-called basal metabolic rate
(BMR), which accounts for almost 70% of total
energy expenditure, the second component is
thermic effect of food (TEF) 10% and physical
activity or activity energy expenditure (AEE) 20%.
BMR is defined as the smallest amount of
energy to maintain the basic functions of an
organism. This basically means that it is the lowest
energy expenditure that the human body can
theoretically spend. The basic metabolic activities
including maintaining the body temperature and
keeping the functioning of vital organs such as the
brain, the kidneys, the heart, and the lungs.
TEF is the energy that the human body must
deliver for food intake, digestion, absorption,
transport and conversion into usable substances. Its
value is given as a percentage and is specific for
each nutrient [4].
The physical activity performed has the
highest share of total energy expenditure and is the
most variable EE component. Factors that
influence AEE include activity frequency, intensity
and duration [4].
Now, many companies offer many different
devices (pedometers, fitness trackers, smart
watches) that can measure steps, distance, heart
rate, speed etc. Manufacturers also provide them
with a mobile device application that will evaluate
the measured data in clear graphs. Portable
electronics differ not only in price range and
function, but also in measurement accuracy which
is a very important parameter for estimating energy
expenditure in humans.
Equipment
Oxycon™ mobile device
Oxycon Mobile is a multifunctional measuring
device designed primarily for measurement of
respiratory and heart parameters in field
conditions. The system can measure a wide range
of physiological quantities at different types of
examination. The system also includes measuring
EE proband by indirect calorimetry, based on the
calculation of oxygen consumption, carbon dioxide
production and more [5].
The Oxycon Mobile is consists of a facemask
and 2 small units worn as a backpack. Before each
session, this device flowmeter and gas analyzers
were calibrated using a 3-L syringe and a known
gas mixture (16.03% O2 and 4.02% CO2). This
method is recognized as a reference method in the
world and should therefore be used for the project
[6].

Tsirkunová et al.: Accuracy of energy expenditure measurement by wearable electronics
Proc. of IMBM 2019 71
Methods
Human energy is produced by the combustion of
fuel in the form carbohydrates, proteins, fats or
alcohol. This process includes oxygen absorption
and carbon dioxide formation. Measurement of
flow energy by directly measuring heat production
or loss is called "direct calorimetry." Measurement
of production or loss heat by measuring oxygen
consumption is called “indirect calorimetry.
Direct calorimetry
Direct calorimetry is used to determine the amount
of heat excreted by the body in the laboratory using
a calorimeter. It requires an isolated, very complex
and large enough camera to commit physical
activity. This method is costly, but it is the most
accurate method for quantifying metabolic rate.
Indirect calorimetry
The technique of indirect calorimetry relies on the
measurement of inspired and expired gas volume,
and the concentrations of O2 and CO2 [4]. The
energy costing approach is based on the ratio
between oxygen consumption and energy
produced. It usually serves as a reference method
to assess the accuracy of other methods of energy
expenditure measurement, such as the validation of
accelerometers or pedometers.
Doubly Labeled Water (DLW) Technique
The DLW technique is widely acknowledged as the
criterion or “gold standard” approach to assess
TEE. In the DLW technique, daily urine samples
are collected over a 7- to 14-day period and
subsequently analysed using isotope ratio mass
spectrometry. The stable isotopes, deuterium (2H)
and oxygen-18 (18O) are administered orally via a
drink of water, and elimination of the isotopes from
the body is tracked. The difference between the
elimination rates of 2H and 18O is equivalent to the
rate of carbon dioxide production that can then be
converted to average TEE [7].
Heart rate monitor
The method is based on proportionality between
heart rate and intensity of movement with aerobic
activity of medium and high intensity. However,
heart rate monitor is associated with errors up to
30%, since the heart rate cuts are affected by
external factors including the level of physical
preparation, emotions and ambient temperature.
Unfortunately, the expense energy intensity of low
intensity is difficult to estimate by heart rate. But
heart rate monitors remain popular among
researchers as they present advantages of relatively
low cost, non-invasive nature and versatility [4].
Pedometry
Pedometers are used to measure walking, which is
one of the most frequently performed activities. In
addition, pedometers can be used to estimate the
distance travelled by multiplying the number of
steps by the step length. This method is
inexpensive, but not accurate to estimate distances
and energy expenditure.
Experiments
One of the tasks was to learn how to work with
Oxycon Mobile, its software, and learn how to get
data from trackers. For this it were pre-planned and
realized sets of experiments.
We had at our disposal activity trackers Fitbit
Charge 2, Xiaomi Mi Band 2 (all connected to
associated apps) and Oxycon Mobile (criterion).
During laboratory testing probands wore two (one
on each wrist) consumer devices with balancing of
left and right arm wear for each device. These
trackers provide minute-by-minute data allowing
us to calculate per minute energy expenditure of
each activity. During testing, total energy
expenditure estimates from trackers Fitbit were
obtained from the device itself, total energy
expenditure estimates from trackers Xiaomi were
obtained by calculation using data heart rate.
The first experiment (see Fig. 1) of 88 minutes
duration consisted of such activities as break in
supine position – 20 minutes, walking – 7 minutes,
seated break – 5 minutes self-paced ascending and
descending of one flight of stairs – 7 minutes,
seated break – 5 minutes, working by hands –7
minutes, seated break – 5 minutes, ergometer 1 (at
50 W for females and 80 W for males) - 10 minutes,
ergometer 2 (at 80 W for females and 120 W for
males) -10 minutes, seated break – 5 minutes. In
Figure 1., you can see a comparison energy
expenditure data from each wearable device during
first experiment. The second experiment (see Fig.
2) of 85 minutes duration consisted of such phases
as break in supine position -15 minutes, sweeping
– 10 minutes, seated break – 15 minutes, walking –
15 minutes, typing – 15 minutes, loaded walking –
15 minutes. In Figure 2., you can see a comparison
energy expenditure data from each wearable device
during second experiment.
The data from wearable devices were
compared to reference method for each activity.
The pre-processed data from all probands sorted
into phases and then was subjected to a normality

Tsirkunová et al.: Accuracy of energy expenditure measurement by wearable electronics
72 Proc. of IMBM 2019
test. To test for differences between estimated and
criterion energy expenditure, paired t-test analyses
with a level of significance set at P < 0.05 were
used for all activities. Mean values and standard
deviations for all activities from all type’s devices
were evaluated.
Results
The Fitbit significantly underestimated EE for
activities - ergometer 1 and ergometer 2,
significantly overestimated EE for activities -
walking and loaded walking. During the
measurements the accuracy of energy expenditure,
overestimation of results was found at slow motion
rates and underestimation at higher rates. Accuracy
of energy expenditure measurement fitness tracker
Fitbit for other activities is enough high compared
to Xiaomi. The true mean difference energy
expenditure between device Xiaomi and Oxycon
for all activities is not equal to zero (p-value
<0.05). Mean and standard deviation from
experiment 1 are presented in Tables 1 and 2.
Table 1 Mean ± Standard deviation energy expenditure from
Xiaomi and Oxycon for each activity (experiment 1)
Xiaomi [Watt] Oxycon [Watt]
Supine
position 97.47±51.90 70.98±17.33
Walking 269.55±116.45 182.81±29.39
Seated break 239.81±97.41 106.04±24.67
Stairs 301.91±107.21 393.22±76.69
Working by
hands 217.92±129.47 184.08±32.9
Ergometer 1 270.17±225.73 346.75±50.37
Ergometer 2 695.20±60.35 483.12±69.8
Table 2 Mean ± Standard deviation energy expenditure from
Fitbit and Oxycon for each activity (experiment 1)
Fitbit [Watt] Oxycon [Watt]
Supine
position 64.16±1.98 70.98±17.33
Walking 317.89±8.66 182.81±29.39
Seated break 91.27±62.1 106.04±24.67
Stairs 363.29±48.07 393.22±76.69
Working by
hands 138.47±58.69 184.08±32.9
Ergometer 1 197.6±83.69 346.75±50.37
Ergometer 2 216.17±108.86 483.12±69.8
The true mean difference energy expenditure
between device Fitbit and Oxycon only for such
activities as sweeping, seated break and typing is
nearly equal to zero (p-value > 0.05). For other
activities p-value <0.05, it means that mean value
EE compared reference method are not the same.
Figure 1. Energy expenditure data from wearable devices
(Experiment 1).
0
200
400
600
800
1 11 21 31 41 51 61 71 81Ener
gy e
xpen
dit
ure
[W
att]
Time [min]Fitbit Oxycon mobile Xiaomi
Figure 2. Energy expenditure data from wearable devices
(Experiment 2).
0
100
200
300
400
500
600
700
1 11 21 31 41 51 61 71 81
Ener
gy e
xpen
dit
ure
[W
att]
Time [min]Oxycon mobile Fitbit Xiaomi
Figure 3. Energy expenditure from the devices during second
experiment.
0
100
200
300
400
500
600
Ene
rgy
exp
en
dit
ure
[W
att]
Oxycon mobile Xiaomi Fitbit

Tsirkunová et al.: Accuracy of energy expenditure measurement by wearable electronics
Proc. of IMBM 2019 73
Data for energy expenditure during the second
experiment is displayed in Fig 3.
Conclusion
In this project we were focused on energy
expenditure measurement of people by using
wearable electronics and his accuracy.
Multi-sensor device Fitbit Charge provided
reasonably good estimates of energy expenditure.
Monitor Xiaomi compared Oxycon Mobile does
not lead to the same results (i.e., they are not
equivalent).
Acknowledgements: Author wants to thank to his supervisor
Jan Muzik for guiding him through the work.
References
[1] HENRIKSEN, André, Martin HAUGEN MIKALSEN, Ashenafi Zebene WOLDAREGAY,
Miroslav MUZNY, Gunnar HARTVIGSEN, Laila
Arnesdatter HOPSTOCK a Sameline GRIMSGAARD.
Using Fitness Trackers and Smartwatches to Measure
Physical Activity in Research: Analysis of Consumer
Wrist-Worn Wearables. Journal of Medical Internet
Research. 2018, 20(3). DOI: 10.2196/jmir.9157.
[2] CHOWDHURY, Enhad A., Max J. WESTERN,
Thomas E. NIGHTINGALE, Oliver J. PEACOCK,
Dylan THOMPSON a Luca Paolo ARDIGÒ.
Assessment of laboratory and daily energy expenditure
estimates from consumer multi-sensor physical activity
monitors. PLOS ONE. 2017, 12(2). DOI:
10.1371/journal.pone.0171720.
[3] YOUNK, Lisa M, Maia MIKELADZE, Donna TATE a
Stephen N DAVIS. Exercise-related hypoglycemia in
diabetes mellitus. 2014, 6(1), 93-108. DOI:
10.1586/eem.10.78.
[4] NDAHIMANA, Didace a Eun-Kyung KIM.
Measurement Methods for Physical Activity and Energy
Expenditure: a Review. Clinical Nutrition Research.
2017, 6(2). DOI: 10.7762/cnr.2017.6.2.68.
[5] ZDOBINSKÝ, Jaroslav. Srovnání energetického výdeje
měřeného pomocí bezdrátových monitorovacích
systémů a konvenčních referenčních metod. Kladno,
2016. Diplomová práce. Ceské Vysoké Učení Technické
v Praze.
[6] SASAKI, Jeffer Eidi, Amanda HICKEY, Marianna
MAVILIA, Jacquelynne TEDESCO, Dinesh JOHN,
Sarah Kozey KEADLE a Patty S. FREEDSON.
Validation of the Fitbit Wireless Activity Tracker for
Prediction of Energy Expenditure. Journal of Physical
Activity and Health. 2015, 12(2), 149-154. DOI:
10.1123/jpah.2012-0495.
[7] HILLS, Andrew P., Najat MOKHTAR a Nuala M.
BYRNE. Assessment of Physical Activity and Energy
Expenditure: An Overview of Objective
Measures. Frontiers in Nutrition. 2014, 1. DOI:
10.3389/fnut.2014.00005. ISSN 2296-861X. Available
from: http://journal.frontiersin.org/
article/10.3389/fnut.2014.00005/abstract

74 Proc. of IMBM 2019

Proc. of IMBM 2019 75
Development and Application
of Nanomaterials

76 Proc. of IMBM 2019

Proc. of IMBM 2019 77
Using a fluorescent nanodiamond for targeted knock-down of
microRNA
Eva Neuhöferová1*, Romana Křivohlavá1, Veronika Benson1
1Institute of Microbiology, Czech Academy of Sciences, Prague, Czech Republic
Abstract: Fluorescent nanodiamonds have been proven as promising drug carriers that are able to visualize
the binding and release of functional molecule in cell cytoplasm. We developed a dual sensor consisting of
fluorescent nanodiamond functionalized with transferrin protein, carrying inhibitory microRNA
complementary to oncogenic microRNA-135b. Transferrin functionalization enables specific delivery of
microRNA-carrying nanoparticles into breast cancer cells.
We conducted in vitro studies confirming the ability of nanodiamond-protein-RNA complex to deliver the
short RNA inside 4T1 breast tumor cell line and downregulate the level of oncogenic microRNA occurring in
cytoplasm. We also developed 3D model for growing 4T1 and 4T1 mixed with peritoneal macrophages
spheroid cell culture, transfected the nanodiamond complexes in vitro, visualized the model and studied the
levels of oncogenic microRNA.
Introduction
Nanodiamonds are carbon-based biocompatible
nanoparticles with a wide range of applications.
Different surface modifications can be used for the
link-up and delivery of various types of
biomolecules, and the surface area useful for
functionalization is higher compared to the volume
of the bigger particle consisting of the same
material.
There are several methods of nanodiamonds
preparation with different specification of the
resulting material; convenient properties can be
added to the particle by a suitable modification of
the fabrication process. Nitrogen-vacancy center
(NVC) is a naturally occurring defect of the crystal
lattice with a stable photoluminescence. NVC
emits a broad far red spectra of light
(610 – 800 nm) when excited by green wavelength
laser beam around 550 nm. Therefore,
nanodiamonds could serve as a visualization tool in
biological or medical applications [1, 2].
In our research, 35-50 nm size nanodiamonds
were produced by a high-pressure high-
temperature method; they were exposed to high
energy particles (15.5 MeV) and further annealed
in high temperatures (> 650 °C). Resulting
fluorescent nanodiamonds (FNDs) were kindly
provided by Dr. Vladka Petrakova (Faculty of
Biomedical Engineering, Czech Technical
University in Prague).
FNDs were modified by polyethyleneimine
coat (PEI 800) which shifts the zeta-potential of the
nanodiamond surface from negative to positive
values, allowing functionalization with short RNA
molecules [3].
Our goal was to design, deliver and visualize
the delivery of antisense RNA that is able to knock-
down the level of oncogenic microRNA-135b in
breast cancer cells [3]. This non-coding type of
RNA is present in healthy cells and is used in cell
regulatory mechanisms. To target the cancer cells
specifically we needed to bring targeting molecule
into the functionalized FND complex. Like other
cancers, it has been confirmed that breast cancer
has abnormal expression of transferrin receptor.
Clinical testing of drugs targeting transferrin
receptor has showed anti-cancer effects [4, 5].
We combined the method of RNA
functionalized FND complex preparation with
adsorption of transferrin protein on the
nanodiamond surface to ensure specific cell
targeting (Figure 1). Different biological models,
including in vitro and in vivo approaches were used
to assess the dual sensor delivery and function. 4T1
(ATCC® CRL-2539™, Mus musculus) breast
cancer cell line was cultured both adherently and in
3D spheroids to mimic the in vivo environment.
Cells from BALB/c spleen and peritoneal
macrophages were isolated and the level of
transferrin receptor was assessed. We developed an
animal model with mammary tumor and we
injected the dual sensory complex in vivo, both
intravenously and directly into the tumor, to
investigate the delivery and targeting of the tumor
cells.

Neuhöferová et al.: Using a fluorescent nanodiamond for targeted knock-down of microRNA
78 Proc. of IMBM 2019
Materials and Methods
FND complex preparation
Fluorescent nanodiamonds were prepared
according to the previously published article by
Petrakova et al. [1]. Obtained FNDs (1 mg/ml
concentration in deionized water) were sonicated
for 30 minutes in ultrasonic bath, 1 mg was mixed
with 200 µg of transferrin conjugate (Alexa
Fluor 488; Life Technologies) for 1 hour in room
temperature and agitated with the same volume of
PEI 800 (Sigma-Aldrich, Prague, Czech Republic;
0.9 mg/ml) overnight. Free PEI molecules were
disposed by centrifugation (9000 g, 1 hour) and
270 µg of antisense RNA was bound
electrostatically by incubation in room temperature
for 1 hour.
Adherent and 3D culturing
4T1 mammary carcinoma cell line was cultured in
37 °C, humid atmosphere and 5 % CO2. Medium
used for standard growing conditions contained
10 % fetal bovine serum (Gibco, Thermo Fisher
Scientific) in RPMI (Sigma Aldrich) enriched with
44 mg/l gentamicin (Sandoz, Novartis), 1.1 %
pyruvate (Sigma Aldrich) and 4.5 g/l glucose
(Sigma Aldrich).
Adherent culture prior FND stimulation was
seeded in plastic 6-well plates, 5 x 10⁵ cells/well
with 1 ml media and stabilized overnight. 3D
spheroids were grown for 10 days from 103 cells in
40 µl hanging drop of cell growth media. After
10 days they were transferred to plastic 6-well
plates with 2 % agarose covered bottoms.
Stimulation with FNDs (25 µg/ml) was 48 hours
long, as control stimulations, matching volume of
PBS was used. As for a transfection control, we
used Xtreme GENE HP DNA Transfection
Reagent (Roche).
Confocal microscopy
Adherent cells were seeded in glass bottom 6-
well plates (105 cells/well) to obtain a confocal
analysis of FND complexes internalization. Cell
nuclei were stained using Hoechst 33342 (1 µg/ml;
Invitrogen, Life Technologies). 3D cell cultures
were mixed with peritoneal macrophages to
visualize the integration to 4T1 mammary
spheroid, to distinguish different cell types,
peritoneal cells were labelled using CellTracker™
Violet BMQC Dye (Thermo Fisher Scientific)
prior addition to the spheroid culture. Confocal
microscopy was performed using Olympus
FluoView FV1000 confocal microscope
(Olympus) and analysed with Olympus
FluoView 2.0 software (Olympus). Following
wavelengths of light excited/emitted were set on
the confocal microscope: Hoechst 405/461 nm;
CellTracker Violet 415/516 nm; Alexa
Fluor 488 473/520 nm; FNDs 559/655–755 nm.
Normalized expression of microRNA-135b
At the end of the incubation time, cells were
harvested; miRNA was isolated and purified using
High Pure miRNA Isolation Kit (Roche) according
to the manufacturer’s instructions. Samples with
eluted miRNA were reverse transcribed
(4 µl/reaction) using specific primers (miRNA-
135b and miRNA-16 as an internal control,
Thermo Fisher Scientific) and High capacity
cDNA Archive Kit (Thermo Fisher Scientific).
Figure 1: Schematic application of dual sensory complex.
Complex of FND functionalized with antisense RNA
combined with Alexa Fluor® 488 labelled transferrin protein
(ND-Alexa) was delivered in the mammary tumor site both
intravenously (i.v.) and directly into the tumor (i.t.).
Fluorescence positivity was measured using the Olympus
OV100 whole mouse imaging system and compared to control
with no complex injection [4]. Control animal (control) was
injected with PBS; FNDs with no transferrin was injected as
another control (ND).

Neuhöferová et al.: Using a fluorescent nanodiamond for targeted knock-down of microRNA
Proc. of IMBM 2019 79
2 µl of cDNA was analysed in triplicates using
Taq Man Universal PCR Master Mix and miRNA
specific PCR primer (Thermo Fisher Scientific).
Results were obtained by iQ5 Real Time PCR
Detection System and analysed using iQ5 Optical
System Software 2.1 (BioRad).
In vivo application of FND complex
BALB/c female animal model was used for in vivo
experiments. The experimental plan was approved
by the Czech Academy of Sciences and all
experiments were following the Czech law
regarding animal protection.
6-weeks old animals were injected into fat
pads with 106 4T1 cells in PBS. 14 days after
injection, visible and measurable breast tumor was
developed near the fat pad. Figure 1 shows
schematic plan of in vivo experiment with the
photo of animal model with developed breast
tumor.
Animals were then injected with FND
complexes, one group intravenously, second group
directly into the tumor; third control group was
injected with PBS intravenously. One dose of FND
complex contained 20 µg of FND and amount of
transferrin and antisense RNA according to the
complex preparation protocol described in the first
method section. Each animal obtained one dose per
day for three consecutive days. At the end of
experimental method, tumor was visualized using
Olympus OV 100 fluorescent whole body imager,
transferrin was measured with 473/520 nm
excitation/emission.
Results
FND complex internalization
Confocal microscopy of adherent 4T1 cells
stimulated with antisense RNA functionalized and
transferrin enriched FNDs is shown in
Figure 2 (Top). The delivery of the FND complex
inside cell is proven by nuclei-focused image and
visible signal from Alexa Fluor 488 labelled
transferrin (green) and fluorescence of FND (red)
inside cell cytoplasm.
As a proof of the antisense RNA delivery and
release in cytoplasm, knock-down of miRNA-135b
was detected using qPCR method,
Figure 2 (Bottom) shows significant decrease of
miRNA-135b after incubation with functionalized
FND complexes (NDA135b). The graph also
shows comparison to stimulation with PBS (NC),
bare FNDs (ND), control RNA functionalized
FNDs (NDSc) and commercial transfection reagent
delivering antisense RNA (A135bCR). The graph
represents mean values ± standard deviation, ** p-
value < 0.01 (versus PBS-treated group) was
calculated by ANOVA.
Complex of antisense RNA functionalized
FND was confirmed as successful delivery system
in vitro, since the knocked-down level of
microRNA-135b is similar to commercial
transfection method.
3D spheroid models and release of RNA
Confocal microscopy of 4T1 mammary spheres
with actively incorporating peritoneal macrophage
cells is showed in Figure 3 (Top). This 3D cell
culture was also assessed in terms of antisense
RNA delivery and release in cytoplasm using
qPCR. Figure 3 (Bottom) shows significant
decrease of miRNA-135b level after incubation of
3D mammosphere co-cultures with functionalized
FND complexes (NDA135b). The graph also
shows comparison to stimulation with PBS (NC),
Figure 2: Visualization and assessment of dual sensor
internalization. (Top) Confocal microscopy of adherent 4T1
cells stimulated with antisense RNA functionalized and
transferrin enriched FNDs (NDA135b) by Olympus FV1000,
40x; compared to nontreated cells (NC); TDI – transmission
channel, Tf-A – Alexa Fluor 488 channel (473/520 nm, green),
ND – FND channel (559/655–755 nm, red), merged channel –
all channels and nuclei stained Hoechst 33342 (405/461 nm,
blue). Scale bar is 20 µm.
(Bottom) Normalized level of microRNA-135b in adherent
4T1 culture after stimulation with NDA135b compared to
nontreated control (NC) [4]. Control stimulations were
following: bare FND stimulation (ND), control RNA
functionalized FNDs (NDSc) and commercial transfection
reagent delivering antisense RNA (A135bCR). Values
of p≤0.01 (**) were statistically significant.

Neuhöferová et al.: Using a fluorescent nanodiamond for targeted knock-down of microRNA
80 Proc. of IMBM 2019
bare FNDs (ND), control RNA functionalized
FNDs (NDSc) and commercial transfection reagent
delivering antisense RNA (A135bCR). The graph
represents mean values ± standard deviation, ** p-
value < 0.01 (versus PBS-treated group) was
calculated by ANOVA.
Complex of antisense RNA functionalized
FND was confirmed as successful delivery system
in model of cell culturing more similar to the
tumorous tissue in living organism.
Conclusion
Combining cancer research with nanotechnology
may bring new opportunities for diagnosis and
treatment, as well as unexpected obstacles may
arise. We presented an innovative complex usable
for visualization and targeted knock-down of
microRNA in vivo. As we described in [4], there
are some interesting interactions between
biological interface and FND complexes and
further research regarding mechanism of in vivo
application would be convenient.
Acknowledgements: Fluorescent nanoparticles used in this
project were kindly provided by Dr. Vladka Petrakova
(Faculty of Biomedical Engineering, Czech Technical
University in Prague). 4T1 cell line was kindly provided by
Dr. Jaroslav Truksa (Institute of Biotechnology, Czech
Academy of Sciences, Prague). Confocal visualization, whole
body imaging and flow cytometry was measured in the
Cytometry and Microscopy Core Facility (Institute of
Microbiology, Czech Academy of Sciences, Prague).
References
[1] PETRAKOVA, V., I. REHOR, J. STURSA, M.
LEDVINA, M. NESLADEK and P. CIGLER. Charge-
sensitive fluorescent nanosensors created from
nanodiamonds. Nanoscale . 2015, 7(29), 12307-12311
[cit. 2019-07-23]. doi: 10.1039/C5NR00712G.
[2] PETRAKOVA, V., V. BENSON, M. BUNCEK, A.
FISEROVA, M. LEDVINA, J. STURSA, P. CIGLER
and M. NESLADEK. Imaging of transfection and
intracellular release of intact, non-labeled DNA using
fluorescent nanodiamonds. Nanoscale. 2016, 8(23),
12002-12012 [cit. 2019-07-23]. doi:
10.1039/C6NR00610H.
[3] LUKOWSKI, Sonja, Eva NEUHOFEROVA, Marek
KINDERMAN, Romana KRIVOHLAVA, Andrea
MINEVA, Vladimira PETRAKOVA and Veronika
BENSON. Fluorescent Nanodiamonds are Efficient,
Easy-to-Use Cyto-Compatible Vehicles for Monitored
Delivery of Non-Coding Regulatory RNAs. Journal of
Biomedical Nanotechnology. 2018, 14(5), 946-958. doi:
10.1166/jbn.2018.2540.
[4] KŘIVOHLAVÁ, Romana, Eva NEUHӦFEROVÁ,
Katrine Q. JAKOBSEN and Veronika BENSON.
Knockdown of microRNA-135b in Mammary
Carcinoma by Targeted Nanodiamonds: Potentials and
Pitfalls of In Vivo Applications. Nanomaterials. 2019,
9(6). doi: 10.3390/nano9060866.
[5] DANIELS, Tracy R., Tracie DELGADO, Gustavo
HELGUERA a Manuel L. PENICHET. The transferrin
receptor part II: Targeted delivery of therapeutic agents
into cancer cells. Clinical Immunology. 2006, 121(2),
159-176. doi: 10.1016/j.clim.2006.06.006.
[6] DANIELS, Tracy R., Tracie DELGADO, Jose A.
RODRIGUEZ, Gustavo HELGUERA a Manuel L.
PENICHET. The transferrin receptor part I: Biology and
targeting with cytotoxic antibodies for the treatment of
cancer. Clinical Immunology. 2006, 121(2), 144-158.
doi: 10.1016/j.clim.2006.06.010.
Figure 3: Application of FND complex on 3D cultured cell line.
(Top) Visualized 3D spheroid mammary culture of 4T1 cell line
with integrated peritoneal macrophages made by Olympus
FV1000, 20x. Peritoneal macrophages were tracked by cell
tracker (MF – Cell Tracker, 415/516 nm, purple), total size of
the spheroid is 200 µm. Merged with TDI – merged cell
tracker and transmission channel. (Bottom) Knock-down of
microRNA-135b in 3D spheroid culture after stimulation with
NDA135b compared to nontreated control (NC) [4]. Control
stimulations were following: bare FND stimulation (ND),
control RNA functionalized FNDs (NDSc) and commercial
transfection reagent delivering antisense RNA (A135bCR).
Values of p ≤ 0.01 (**) were statistically significant.

Proc. of IMBM 2019 81
Calcium doped carbon based biocompatible coating
Ondřej Sekyrka1*, Miroslav Jelínek1, Jan Remsa1
1Czech Technical University in Prague, Faculty of Biomedical Engineering, Kladno, Czech Republic
Abstract: Two pulsed laser depositions were performed using excimer KrF lasers to prepare thin layers of
Calcium doped diamond like carbon (DLC) for potential use in implantology for material properties and
biocompatibility improvement. For the first deposition a single bought CaO target was used to prepare thin
layers under various deposition conditions. The layers were examined by optical microscopy, atomic force
microscopy and surface profilometer. We have used the gathered data along with relative atomic masses and
elementary densities to calculate the setup for lasers used in the following dual pulsed laser depositions. The
CaCO3 target for depositions was created by pressing and sintering. For the deposition of DLC, graphite target
was used. A series of depositions was performed to create a set of samples with various concentrations of
Calcium in DLC from 1 at.% up to 20 at.% plus reference samples made from single targets. Surface
profilometry was then performed using Alphastep IQ to obtain data of film thickness and roughness. Surfaces
were also observed using AFM and SEM. Chemical compositions of layers were characterized using XPS and
WDS methods. Thought we have not achieved calculated atomic concentrations properly, we have created a
set of samples with increasing concentrations of Ca in DLC.
Introduction
The article provides information about experiments
performed in order to clarify if Calcium doped
DLC layers could be used for implantology.
Diamond like carbon (DLC) is believed to be
one of the choices for surfaces of implants. The
structure of DLC is composed of both sp2 and sp3
hybridizations. Problem of DLC layers is the
adhesion to metallic substrates. Parameters of DLC
can be improved by Cr, Si, Mg, Ti, Ag and other
dopants. Chromium and silver dopations have been
studied by M. Jelínek’s team in the past. It has been
concluded that Calcium might be also the dopant
providing good results. DLC deposition with Ca or
CaO leads to the better osseointegration, bone
formatting and blood biocompatibility [1, 2].
Ca:DLC is meant to be used as an option,
when choosing a material for implants coating. The
structure of the implant should be comparable to
the outer bone structure with the incorporation of
calcium [3].
Experimental teams have used chemical
methods and current discharges to prepare Ca:DLC
layers. They have exposed the vapours into the
chamber and by changing inner pressure and
temperature, the layer was prepared [1, 4, 5].
The possibility to prepare Ca: DLC layers
using laser deposition was studied. The aim was to
create a set of samples with various atomic
concentrations of Calcium. Prepared layers have
been then characterized in order to gain
information about their thickness, surface
morphology and chemical composition.
Dual pulsed laser deposition is a modification
of a classic pulsed laser deposition (PLD). Two
pulsing lasers ablate rotating targets while the
evaporating material condenses on the substrate to
create a thin layer. For our experiment two excimer
KrF (λ=248 nm) lasers were used. Surface
morphology and chemical parameters of the layers
were studied afterwards.
Experimental
Experiment 1: Pulsed laser deposition (PLD)
At first, the pulsed laser deposition from a bought
CaO target was performed. Due to later
observations we believe, that the target was mostly
composed of CaCO3 instead, because of being
exposed to air. The deposition helped us obtain
growth rate parameters for Calcium target under
various conditions. We have prepared 5 samples on
Si substrates under room temperature, Ar pressure
of 0.25 Pa, laser frequency of 10 Hz, target-
substrate distance of 45 mm. Deposition results are
summarized in Table 1.
Experiment 1: Thickness and roughness
Thickness and roughness measurements were
performed using the line scans of profilometer
Alphastep IQ (by KLA-Tencor). Each line was
scanned twice and the average value is considered
as a result.

Sekyrka et al.: Calcium doped carbon based biocompatible coating
82 Proc. of IMBM 2019
Table 1. Table of deposition conditions for PLD from Calcium
based target.
Sample Number
of pulses
Energy
density
(J/cm2)
Spot on
target
(mm2)
Growth rate
(nm/pulse)
1 5000 0.6 10.0 0.0158
2 10000 0.6 10.7 0.0545
3 10000 1.0 10.7 0.0589
4 10000 1.3 10.7 0.0702
5 10000 1.8 7.33 0.1460
Experiment 1: AFM
Atomic force microscopy (AFM) was realized in
dynamic mode using etalon HA_NC tips (6 nm of
better curvature) on Solver NEXT (NT-MDT)
device. Several AFM scans (10×10 µm) were made
and quantified by roughness average (Sa) and root
mean square (Sq), adapted from ISO 4287/1
(Software Gwyddion 2.39).
Experiment 2: Dual-PLD
The dual-PLD was then performed. CaCO3 and
graphite targets were used simultaneously. At first,
experimental setups were tested for each target
separately under calculated deposition conditions.
We have used simple calculations based on
observed growth rates, relative atomic weights,
elemental densities and targeted thickness of 400
nm.
Table 2. Table of deposition conditions used for dual PLD
Sample
Number
of
pulses
Frequency
(Hz)
Number
of
pulses
Frequency
(Hz)
Graphite target CaCO3
6 23000 10 -
7 20861 30 4868 7
8 16000 10 16000 10
9 14231 10 28462 20
10 14829 8 42635 23
11 11459 7 49110 30
12 - 90000 20
Experiment 2: Thickness and Roughness
The first series of thickness measurements was
performed right after depositions in the laboratory
using the profilometer P-6 (by KLA-Tencor) to
obtain rough data about usability of prepared
layers. The final measurements were performed on
the profilometer Alphastep IQ (by KLA-Tencor)
using the same as during Experiment 1.
Experiment 2: SEM
For the second experiment, scanning electron
microscopy is a method we have chosen to obtain
the surface pictures with. Measurements were
performed by the colleagues of Department of
Structural Analysis (AV CR, FZÚ).
Experiment 2: Chemical characterization
Two different methods were used for obtaining
chemical characterization. Both X-Ray
photoelectron spectroscopy (XPS) and wavelength
dispersive spectroscopy (WDS) were performed by
the same team as the SEM measurement. We have
chosen these methods for their good applicability
on thin layers.
Results and discussion
As a result of the single PLD, we obtained five
layers (samples 1, 2, 3, 4, 5), with various
thicknesses. The layer nr.5 has cracked, so it wasn’t
possible to measure it further.
Experiment 1: Optical microscopy
We have visualized our samples using optical
microscope with 50× magnification (Fig. 2).
Layers were examined for major inhomogeneity,
but none was found.
Figure 1. Scheme of dual PLD.
Figure 2. Picture of surface of Sample 2, magnified 50×.
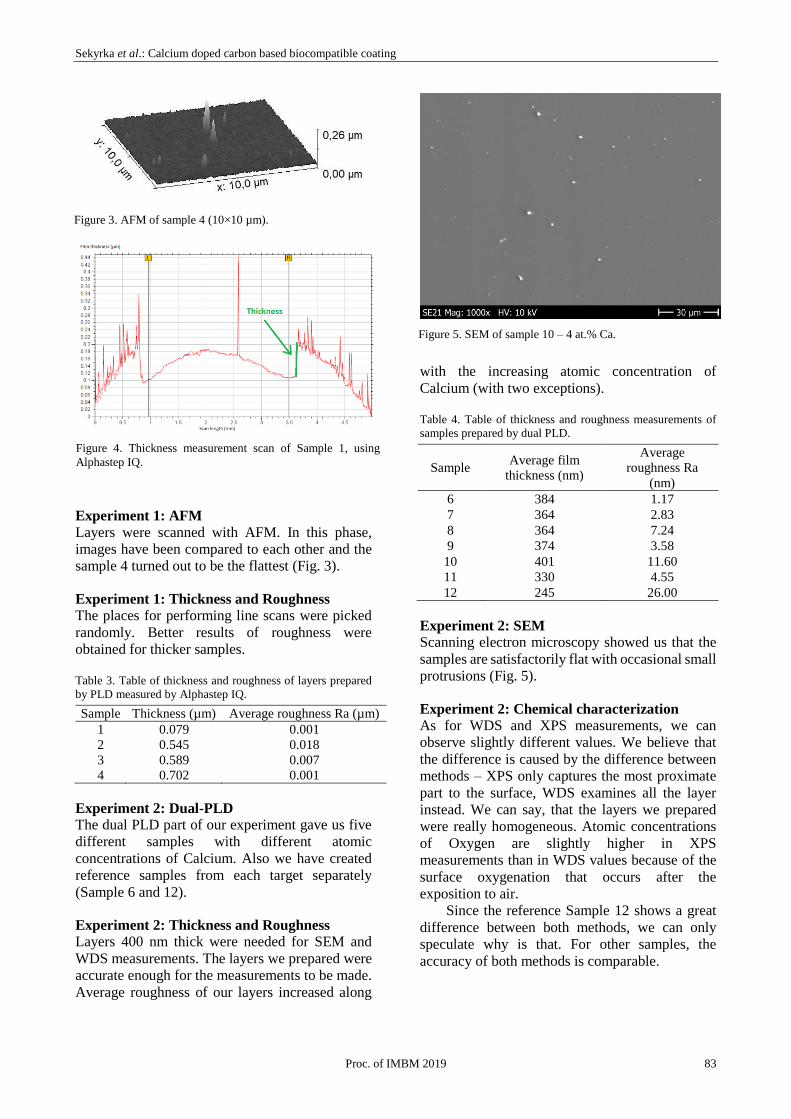
Sekyrka et al.: Calcium doped carbon based biocompatible coating
Proc. of IMBM 2019 83
Experiment 1: AFM
Layers were scanned with AFM. In this phase,
images have been compared to each other and the
sample 4 turned out to be the flattest (Fig. 3).
Experiment 1: Thickness and Roughness
The places for performing line scans were picked
randomly. Better results of roughness were
obtained for thicker samples.
Table 3. Table of thickness and roughness of layers prepared
by PLD measured by Alphastep IQ.
Sample Thickness (µm) Average roughness Ra (µm)
1 0.079 0.001
2 0.545 0.018
3 0.589 0.007
4 0.702 0.001
Experiment 2: Dual-PLD
The dual PLD part of our experiment gave us five
different samples with different atomic
concentrations of Calcium. Also we have created
reference samples from each target separately
(Sample 6 and 12).
Experiment 2: Thickness and Roughness
Layers 400 nm thick were needed for SEM and
WDS measurements. The layers we prepared were
accurate enough for the measurements to be made.
Average roughness of our layers increased along
with the increasing atomic concentration of
Calcium (with two exceptions).
Table 4. Table of thickness and roughness measurements of
samples prepared by dual PLD.
Sample Average film
thickness (nm)
Average
roughness Ra
(nm)
6 384 1.17
7 364 2.83
8 364 7.24
9 374 3.58
10 401 11.60
11 330 4.55
12 245 26.00
Experiment 2: SEM
Scanning electron microscopy showed us that the
samples are satisfactorily flat with occasional small
protrusions (Fig. 5).
Experiment 2: Chemical characterization
As for WDS and XPS measurements, we can
observe slightly different values. We believe that
the difference is caused by the difference between
methods – XPS only captures the most proximate
part to the surface, WDS examines all the layer
instead. We can say, that the layers we prepared
were really homogeneous. Atomic concentrations
of Oxygen are slightly higher in XPS
measurements than in WDS values because of the
surface oxygenation that occurs after the
exposition to air.
Since the reference Sample 12 shows a great
difference between both methods, we can only
speculate why is that. For other samples, the
accuracy of both methods is comparable.
Figure 3. AFM of sample 4 (10×10 µm).
Figure 4. Thickness measurement scan of Sample 1, using
Alphastep IQ.
Figure 5. SEM of sample 10 – 4 at.% Ca.

Sekyrka et al.: Calcium doped carbon based biocompatible coating
84 Proc. of IMBM 2019
Table 5. Table of atomic concentrations of samples prepared
by dual PLD measured by WDS and XPS techniques.
Sample WDS – Ca
(at.%)
XPS - Ca
(at.%)
at.% of
Ca (avg.)
6 0.01 0.00 0.00
7 1.05 0.67 0.86
8 2.73 2.80 2.77
9 3.79 3.54 3.67
10 4.16 3.99 4.08
11 7.66 7.59 7.63
12 28.45 17.07 22.76
Conclusion
Based on our experiments, using the similar
conditions and calculations of our work, layers of
targeted atomic concentration can be prepared
accurately.
The set of prepared layers shows that with
exceptions, the increase of atomic concentration of
Calcium also increases surface roughness.
Our experiment has shown, that DLC layers
doped with Calcium show good properties for
potential use in bioimplantology because of their
chemical composition and layer properties. More
measurements should be performed to prove other
parameters like stability and biocompatibility of
such layers.
Acknowledgements: The authors thank to the CTU Student
Grand Agency (SGSC18/157/OHK4/2T/17) also to Josef
Zemek for the XPS analysis and Karel Jurek for the SEM a
WDS measurement.
References
[1] KWOK, S.C.H., P.C.T. HA, D.R. MCKENZIE,
M.M.M. BILEK a Paul K. CHU. Biocompatibility of
calcium and phosphorus doped diamond-like carbon thin
films synthesized by plasma immersion ion implantation
and deposition. Diamond and Related Materials.
2006, 15(4-8), 893-897. DOI:
10.1016/j.diamond.2005.10.062. ISSN 09259635.
Available from: http://linkinghub.elsevier.com/
retrieve/pii/S0925963505005121
[2] Chu P.K.: Thin Solid Films, Volume: 420-421, Pages
263-268, 2002
[3] FEDEL, M. Blood compatibility of diamond-like carbon
(DLC) coatings. Diamond-Based Materials for
Biomedical Applications. Elsevier, 2013, 71-102. DOI:
10.1533/9780857093516.1.71. ISBN 9780857093400.
Available from: https://linkinghub.elsevier.com/
retrieve/pii/B9780857093400500047
[4] DORNER-REISEL, Annett, Christian SCHÜRER,
Claudia NISCHAN, Olaf SEIDEL a Eberhard
MÜLLER. Diamond-like carbon: alteration of the
biological acceptance due to Ca–O incorporation. Thin
Solid Films. 2002, 420-421, 263-268. DOI:
10.1016/S0040-6090(02)00745-9. ISSN 00406090.
Available from: http://linkinghub.elsevier.com/
retrieve/pii/S0040609002007459
[5] DORNER-REISEL, Annett, Christian SCHÜRER,
Guido REISEL, Frank SIMON, Gert IRMER a Eberhard
MÜLLER. CaO-modified diamond-like carbon coatings
synthesised by a direct current discharge. Thin Solid
Films. 2001, 398-399, 180-186. DOI: 10.1016/S0040-
6090(01)01391-8. ISSN 00406090. Available from:
http://linkinghub.elsevier.com/retrieve/pii/S004060900
1013918

Proc. of IMBM 2019 85
Improvement of DLC implant coating using hybrid laser technology
and germanium dopation
Jana Kondratievová1*, Miroslav Jelínek1,2, Tomáš Kocourek1,2
1Czech Technical University in Prague, Faculty of Biomedical Engineering, Kladno, Czech Republic 2Institute of Physics ASCR v.v.i., Na Slovance 2, 182 21 Prague 8, Czech Republic
Abstract: This paper deals with the study of the properties of germanium-doped diamond-like carbon (DLC)
films. GeDLC layers are capable of improving the biocompatibility of biomedical applications, including
implant coverage. Advantages and present state of art and experiences with GeDLC layers are summarized
and discussed. For deposition of GeDLC films, hybrid laser technology was used. These layers were prepared
by the dual pulsed laser deposition (PLD) on the Si (100) and fused silica (FS) substrates at room temperature.
Using two lasers, it was possible to arrange the dopant concentrations by varying the laser repetition rate.
Concentration ranged from 0 % to 12 %. The layers were characterized by scanning electron microscopy
(SEM), wavelength dispersive spectroscopy (WDS). The surface roughness was studied by mechanical
profilometer (Alphastep IQ ‒ KLATencor). Finally, an in-vitro biocompatibility test was performed. These
layers have higher roughness with increasing germanium concentration and also the cytotoxicity of these layers
is higher with increasing germanium dopation.
Introduction
DLC layers, which are metastable amorphous
carbon layers with many excellent properties for
use in many areas. DLC is widely used for coating
implants. DLC layers have potential applications in
cardiovascular areas to cover and improve
hemocompatibility of prosthetic valves, stents,
artificial cardiac and lung devices, in orthopedic
areas for implantation of lumbar and knee
implants, in ophthalmic areas to improve lens
function and conformal packaging of medical
devices. and surgical instruments.
DLC impurities cause changes in hardness,
coefficient of friction, surface roughness, adhesion
and even affect biocompatibility. The properties of
many of the proposed elements used as dopants
have been successfully tested and characterized
[1].
Germanium as dopant: Pure thin layers of
DLC or doped DLC layers can be prepared in many
ways. They can be prepared by modifying the
surface of the material, for example (heat,
oxidation) or depositing. Deposition methods are
physical (physical vapor deposition - PVD) or
chemical (vapor deposition - CVD). One type of
physical method is the pulsed laser deposition
method PLD, where the laser beam is guided to a
vacuum chamber where a target is attached and
material from target is transported to the substrate.
However, if we want to make the DLC layer with
an additional dopant, it is necessary to use the dual
pulsed laser depositions as like coating method [1].
Pure germanium is a semiconductor. It is
similar to elemental silicon. Like silicon,
germanium reacts naturally and forms complexes
with oxygen in nature. Unlike silicon, it is too
reactive and naturally found on Earth in a free
(elemental) state [3]. The melting point of
germanium is 1211.40 K (938.25 °C). Until the
1930s, germanium was considered a poorly
conductive metal [4].
Under standard conditions, germanium is a
brittle, silver-white semi-metallic element [5].
Germanium and health: Germanium is not
considered as an important element for alive
organism. Some possible organic germanium
compounds have been investigated as possible
medicinal products, although none have been
successful so far. Like silicon and aluminum,
natural germanium compounds tend to be insoluble
in water and therefore have little oral toxicity [6].
Germanium occurs in the human body at a
concentration of 71.4 ppb. The biological role of
germanium is unknown, although it stimulates
metabolism. Germanium may interfere with
enzymes such as lactate and alcohol
dehydrogenase. Organic germanium compounds
are more toxic than inorganic germanium
compounds. Severe germanium poisoning can
cause death due to respiratory paralysis [7].

Kondratievová et al.: Improvement of DLC implant coating using hybrid laser technology and germanium dopation
86 Proc. of IMBM 2019
On the other side, despite serious concerns
about our health, germanium is used to improve
cardiac and vascular conditions, including high
blood pressure, high cholesterol and heart disease,
to improve eye diseases, including glaucoma and
cataract, and to improve liver disease, including
hepatitis and cirrhosis of the liver. Germanium is
also used to increase blood circulation to the brain,
to support the immune system and is also used as
an antioxidant. Germanium may also exert an anti-
inflammatory effect [4]. Although germanium has
been relatively poorly studied so far, no significant
cytotoxicity has been observed [8]. However,
germanium products have been proven to be a
potential risk to human health [9]. Therefore,
thorough biocompatibility tests of manufactured
materials were performed. Studies were performed
at the cellular level using various cell lines. In
addition, short-term parameters of cell death were
monitored. GeDLC layers were prepared in many
ways, mostly using RF-PECVD [10]. In our case,
dual PLD was used.
Germanium + DLC: New results show that
GeDLC layers have better mechanical properties
(high hardness, high durability, low voltage, low
absorption, broadband IR transparency, variable
refractive index from 1.7 to 4) and good adhesion
[8]. GeDLC layers were made using two KrF
excimer lasers in a methane atmosphere at room
temperature [9]. Layer properties were measured
by X-ray photoelectron spectroscopy (XPS) and
atomic force microscopy (AFM). The results show
that carbon atoms are incorporated into the
germanium lattice and form a GeDLC alloy for
concentrations below 10 at% where germanium
atoms are evenly distributed [10]. GeDLC
multilayer films were also prepared on a
germanium substrate by ultraviolet laser [11]. The
layers were characterized by methods for layer
thickness and hardness determination, XPS and
SEM. GeDLC layer hardness was higher than 48.1
GPa, which is almost the same as pure DLC film
[12].
From the literature study we see that GeDLC
films can be a promising material for a wide range
of applications, including biomedicine. However,
studies with higher germanium concentrations
have not been performed. Therefore, we will carry
out physical and biocompatible studies of GeDLC
layers. These layers will then be studied by several
methods (study of growth rate, roughness,
morphology, composition, accuracy and biological
properties (cytotoxicity, adhesion).
Methods
Dual pulsed laser deposition
Dual PLD differs from classical pulsed laser
deposition by using two laser beams guided into a
vacuum chamber. While the PLD method was
applied to a single target, dual PLD were applied to
two targets. The two laser beams emanating from
the two laser devices are focused on the respective
targets, where from one target the vaporized
material is transported to the substrate and the
second target (materially different from the first
target) is also transferred to the same substrate.
Here, the two materials condense and form the
layer [1].
Deposition conditions
In this part of the experiment we used the dual PLD
method to create GeDLC layers. These layers were
prepared by using two excimer KrF lasers
(λ = 248 nm, τ = 20 ns). Flows of two target
materials were directed to a rotating substrate
(substrate). The equipment what we used makes it
possible to prepare doped layers with a high dopant
concentration in a simple way by changing the
laser fluence to the target and the laser repetition
rate. The first laser beam (Coherent, Compex Pro)
was focused on a high purity carbon target with an
energy density of 8 J / cm². The repetition rate was
set between 18-26 Hz. The second laser beam
Figure 1 Modifited scheme of proposed doping elements of
DLC [2].
Figure. 2 Deposition arragement for Ge-DLC synthesis using
two KrF excimer lasers [1].

Kondratievová et al.: Improvement of DLC implant coating using hybrid laser technology and germanium dopation
Proc. of IMBM 2019 87
(Lumonics PM-800) was focused on a germanium
target with an energy density of 1.5 J / cm² and a
repetition rate of 1 to 23 Hz. The number of pulses
has been adjusted to achieve approximately the
same layer thickness. The distance between the
target and the substrate is 40 mm. Targets were
rotated at 0.5 Hz. We used silicon Si (99.99%) and
fused quartz FS (SiO2) as a substrates. To increase
the adhesion of the layers, the substrates were
cleaned with a radiofrequency discharge before
deposition for 2 min at 100W power. Si substrates
were used for studing morphology and
composition, and FS substrates were used for
biological assays. The vacuum chamber operated at
a pressure of 5 × 10¯⁴ Pa. The layers were deposited
in argon (0.25 Pa) at room temperature. The
deposition conditions are summarized in Table 1.
Table 1. Deposition conditions for Laser 1, for film thickness
cca 160 nm.
Laser 1 Compex (grafitový terč)
Sample
Energy
density
[J/cm2]
Number
of pusles
Frequency
[Hz]
GeDLC 5
(Si+7×FS) 8 21685 14
GeDLC 6
(Si+7×FS) 8 29083 30
GeDLC 7
(Si+7×FS) 8 31891 27
GeDLC 8
(Si+7×FS) 8 36216 30
GeDLC 9
(Si+7×FS) 8 38680 37
GeDLC 10
(Si+7×FS) 8 40000 30
Table 2. Deposition conditions for Laser 2, for film thickness
cca 160 nm.
Laser 2 Lumonics (germanium)
Sample
Energy
density
[J/cm2]
Number
of pulses
Frequency
[Hz]
GeDLC 5
(Si+7×FS) 1.5 29429 19
GeDLC 6
(Si+7×FS) 1.5 17450 18
GeDLC 7
(Si+7×FS) 1.5 12992 11
GeDLC 8
(Si+7×FS) 1.5 6036 5
GeDLC 9
(Si+7×FS) 1.5 2091 2
GeDLC
10
(Si+7×FS)
1.5 - -
Roughness, morphology and composition
We first observed the surface roughness,
morphology and composition of samples by using
the Scanning electron microscopy (SEM) with
Wavelength dispersive microscopy (WDS) JEOL
JXA 733.
In vitro biocompatibility test
The human hepatocellular carcinoma cell line
(Huh7) obtained from the Japanese collection of
research bioreactors (JCRB) was cultured in
Eagles’s minimum essential medium EMEM
(ATCC) supplemented with 10% fetal bovine
serum (FBS, Thermo Fisher Scientific) and 0.1%
(v / v) penicillin / streptomycin (Sigma, St. Louis,
MO) as recommended by the supplier. Cultures
were stored in a humidified 5% CO₂ atmosphere at
37°C and the medium was changed once a week
[13].
The cytotoxic activity of the compounds was
determined quantitatively by a fluorimetric assay
using propidium iodide (PI) [14].
The biocompatibility of the materials
themselves is a key step in the research of materials
for biomedical applications. First, it was studied
how substrates with different germanium
concentrations affect the overall cell growth rate.
Our research focused on a special type of cell -
hepatocytes. These cells are polarized and specific,
making them uniquely sensitive to infections [15].
Thus, Huh7 cells were used for the study. This type
of Huh7 cell is one of the most widely used in vitro
model systems for the study of human hepatocytes
[16].
Prior to cell seeding, all germanium-based
experimental substrates were sterilized with 70%
ethanol for 20 minutes followed by ultraviolet
(UV) exposure for one hour. For all cell
experiments in this study, cells on sterilized
substrates were seeded at an initial density of
25.000 cells/cm 2 and maintained under standard
cell culture conditions (37 °C, 5% CO₂). Cells were
allowed to grow on germanium-based substrates
for 5 days under standard cell culture conditions
[13]. When the cells were in exponential growth
phase, the monolayer was washed once with
phosphate buffered saline (PBS) and then stained
by adding 1 ml of PI (50 µg/mL) into plates for five
minutes in the dark at room temperature. The
nuclei were contrasted with Hoechst blue 33342
(Thermo Fisher Scientific). Fluorescence images
were recorded using an epifluorescence
microscope IM-2FL (Optics Microscopes,
Ponteranica, Italy).

Kondratievová et al.: Improvement of DLC implant coating using hybrid laser technology and germanium dopation
88 Proc. of IMBM 2019
Results and discussion
Roughness and morphology (SEM)
Roughness measurement showed that Ra changed
from 3 nm to 120 nm – see Table 3. SEM analysis
showed that the layer consisted of small grain
droplets and the surface was covered with grains
sizes up to several micrometers. From the SEM
photos, we could see that for lower dopant
concentration, the surface was smoother - see
Fig. 3
Table 3. Results of roughness measurements
Sample
Concentration:
Ge in DLC (WDS)
[at. %]
Roughness
Ra [nm]
GeDLC5 12 120.1
GeDLC6 9 83.6
GeDLC7 5 63.6
GeDLC8 2.5 61.7
GeDLC9 1 14.4
GeDLC10 0 2.8
Figure. 3 SEM photographs of GeDLC layers, magnified 400x. a) 0 at. %, b) 1 at. %, c) 2.5 at. %, d) 5 at. %, e) 9 at. % a f) 12 at. %
Ge v DLC.
Figure. 4 Huh7 cell viability on various Ge substrates after 5 days of culture. (A) Cells were stained with propidium iodide (PI, red) to
determine cell viability. The nuclei were counterstained with Hoechst Blue. Cells were imaged with an IM-2FL (Optics Italy)
epifluorescence microscope. Representative images are displayed. As a positive control, cells were treated with 20% ethanol for 60
minutes.

Kondratievová et al.: Improvement of DLC implant coating using hybrid laser technology and germanium dopation
Proc. of IMBM 2019 89
Composition (WDS)
The concentration of GeDLC films moved with
deposition conditions from 0.0 at.% to 12 at.% - see
Table 3.
In vitro biocompatibility test - cytotoxicity
Remarkably, for some time, germanium and
germanium compounds were considered safe and
used in nutritional supplements [17]. Many reports
have shown that germanium supplements pose a
high risk to humans at high doses [7]. So far,
however, Germanic medical products are still
available [18]. In general, systemic studies of
germanium toxicity are still relatively limited. A
number of studies have shown that germanium
supplements pose a high risk to humans at high
doses. Germanium compounds are relatively less
toxic compared to other metalloids and metals.
However, relatively high doses of germanium
oxide and other inorganic germanium compounds
can cause severe poisoning, including death. In this
study, we identified the threshold of germanium
concentration in the cell culture substrate to avoid
a severe toxic response. We found that the
germanium concentration above 2.5% induces
signs of cell death in liver cells. Interestingly,
germanium-based materials with a concentration of
up to 1.5% have already demonstrated cytotoxic
effects [18,19,20]. In this respect, our Ge 1%
material showed lower toxicity compared to 1.5%
Ge described in [18].
Figure 4. shows the cytotoxic behavior of cells
grown on different germanium substrates as
observed by phase contrast microscopy (PhC) and
dead fluorescence imaging assay. For all samples,
most of the Huh7 cells tightly attached to the
material surface and spread efficiently during the
culture period.
Conclusions
GeDLC films with germanium doping up to 12 at.
% were prepared by using dual pulsed laser
deposition. The lasers beams were guided to the
germanium and graphite targets. Film properties,
such as roughness, WDS composition, SEM
morphology and cytotoxicity were studied in
relation to dopant concentrations. Roughness (Ra)
increased with germanium doping. Also, with
higher germanium concentrations the number of
“droplets” increased and the surface was rougher.
These droplets were caused by germanium because
DLC material forms the smooth surface. In vitro
analysis showed that GeDLC layers exhibit
cytotoxicity for higher germanium doping. We
revealed that germanium concentration higher than
2.5 % induced signs of cells death and germanium
concentration as low as 1.5 % have already been
shown to exhibit cytotoxic effects. The cytotoxicity
of germanium-based materials should be carefully
considered for clinical practice. Our results
indicate that the cytotoxic effects of the germanium
layers require further study and should be
considered in biological applications.
Acknowledgements: The work was supported by the grant
Agency of Technical University in Prague, grant number
SGSC18/157/OHK4/2T/17.
References
[1] JELÍNEK, Miroslav, Josef ZEMEK, Jan REMSA, et al.
Hybrid laser technology and doped
biomaterials. Applied Surface Science. 2017, 417, 73-
83. DOI: 10.1016/j.apsusc.2017.03.103. ISSN
01694332. Available from:
https://linkinghub.elsevier.com/retrieve/pii/S01694332
17307547
[2] SÁNCHEZ-LÓPEZ, J. C., A. FERNÁNDEZ, Jan
REMSA, et al. Doping and Alloying Effects on DLC
Coatings. Tribology of Diamond-Like Carbon Films.
Boston, MA: Springer US, 2008, 417, 311-338. DOI:
10.1007/978-0-387-49891-1_12. ISBN 978-0-387-
30264-5. ISSN 01694332. Available from:
http://link.springer.com/10.1007/978-0-387-49891-
1_12
[3] Germanium. Wikipedia (2018). Available from:
https://en.wikipedia.org/wiki/Germanium
[4] HALLER, E.E. Germanium: From its discovery to SiGe
devices. Materials Science in Semiconductor
Processing [online]. 2006, 9(4-5), 408-422 [cit. 2019-
04-18]. DOI: 10.1016/j.mssp.2006.08.063. ISSN
13698001. Available from: https://linkinghub.elsevier.
com/retrieve/pii/S1369800106001326
[5] EMSLEY, John. Nature's building blocks: an A-Z guide
to the elements. New York: Oxford University Press,
2001. ISBN 0-19-850341-5.
[6] W.K., Germanium for Electronic Devices. NY Times
(1953). Available from: https://www.nytimes.com/
1953/05/10/archives/germanium-for-electronic-
devices.html
[7] TAO, Shyy-Hwa a P.Michael BOLGER. Hazard
Assessment of Germanium Supplements. Regulatory
Toxicology and Pharmacology[online]. 1997, 25(3),
211-219 [cit. 2019-04-18]. DOI:
10.1006/rtph.1997.1098. ISSN 02732300. Available
from: http://linkinghub.elsevier.com/retrieve/
pii/S0273230097910989
[8] SOUSANI, F., H. JAMALI, R. MOZAFARINIA a A.
ESHAGHI. Thermal stability of germanium-carbon
coatings prepared by a RF plasma enhanced chemical
vapor deposition method. Infrared Physics &
Technology [online]. 2018, 93, 255-259 [cit. 2019-04-

Kondratievová et al.: Improvement of DLC implant coating using hybrid laser technology and germanium dopation
90 Proc. of IMBM 2019
18]. DOI: 10.1016/j.infrared.2018.08.006. ISSN
13504495. Available from: https://linkinghub.elsevier.
com/retrieve/pii/S1350449518303505
[9] SHAFI, H.Z., A. MAHMOOD, Z. ALI a M.
MEHMOOD. Optical and Structural Analysis of GeC
Thin Films Deposited by Reactive Pulsed Laser
Ablation Technique. Key Engineering
Materials [online]. 2010, 442, 178-186 [cit. 2019-04-
18]. DOI: 10.4028. ISSN 1662-9795. Available from:
https://www.scientific.net/KEM.442.178
[10] MAHMOOD, Arshad, A. SHAH, F.F. CASTILLON, L.
Cota ARAIZA, J. HEIRAS, M. Yasin AKHTAR RAJA
a M. KHIZAR. Surface analysis of GeC prepared by
reactive pulsed laser deposition technique. Current
Applied Physics [online]. 2011, 11(3), 547-550 [cit.
2019-04-18]. DOI: 10.1016/j.cap.2010.09.011. ISSN
15671739. Available from:
https://linkinghub.elsevier.com/retrieve/pii/S15671739
10003135
[11] CHENG, Y., Y. M. LU, Y. L. GUO, G. J. HUANG, S.
Y. WANG a F. T. TIAN. Multilayers diamond-like
carbon film with germanium buffer layers by pulsed
laser deposition. Surface Review and Letters [online].
2017, 24(02) [cit. 2019-04-18]. DOI:
10.1142/S0218625X17500147. ISSN 0218-625X.
Available from: http://www.worldscientific.com/doi/
abs/10.1142/S0218625X17500147
[12] Cheng Y., et al.; private communication February 2017
[13] LUNOVA, Mariia, Vitalii ZABLOTSKII, Nora M.
DEMPSEY, et al. Modulation of collective cell
behaviour by geometrical constraints. Integrative
Biology [online]. 2016, 8(11), 1099-1110 [cit. 2019-04-
18]. DOI: 10.1039/C6IB00125D. ISSN 1757-9694.
Available from: https://academic.oup.com/ib/
article/8/11/1099-1110/5163504
[14] WROBEL, Kazimierz, Estefanía CLAUDIO, Fernando
SEGADE, Sofía RAMOS a Pedro S. LAZO.
Measurement of cytotoxicity by propidium iodide
staining of target cell DNA. Journal of Immunological
Methods[online]. 1996, 189(2), 243-249 [cit. 2019-04-
18]. DOI: 10.1016/0022-1759(95)00253-7. ISSN
00221759. Available from:
http://linkinghub.elsevier.com/retrieve/pii/0022175995
002537
[15] MARCH, Sandra, Vyas RAMANAN, Kartik TREHAN,
et al. Micropatterned coculture of primary human
hepatocytes and supportive cells for the study of
hepatotropic pathogens. Nature Protocols [online].
2015, 10(12), 2027-2053 [cit. 2019-04-18]. DOI:
10.1038/nprot.2015.128. ISSN 1754-2189. Available
from: http://www.nature.com/articles/nprot.2015.128
[16] TERJUNG, Ronald, ed. Comprehensive
Physiology [online]. Hoboken, NJ, USA: John Wiley &
Sons, 2013 [cit. 2019-04-18]. ISBN 9780470650714.
[17] SCHAUSS, Alexander G. Nephrotoxicity and
neurotoxicity in humans from organogermanium
compounds and germanium dioxide. Biological Trace
Element Research [online]. 1991, 29(3), 267-280 [cit.
2019-04-25]. DOI: 10.1007/BF03032683. ISSN 0163-
4984. Available from:: http://link.springer.com/
10.1007/BF03032683
[18] BIAN, Dong, Weirui ZHOU, Jiuxu DENG, et al.
Development of magnesium-based biodegradable
metals with dietary trace element germanium as
orthopaedic implant applications. Acta
Biomaterialia[online]. 2017, 64, 421-436 [cit. 2019-04-
25]. DOI: 10.1016/j.actbio.2017.10.004. ISSN
17427061. Available from:
https://linkinghub.elsevier.com/retrieve/pii/S17427061
17306207
[19] HWANG, Suk-Won, Gayoung PARK, Chris
EDWARDS, et al. Dissolution Chemistry and
Biocompatibility of Single-Crystalline Silicon
Nanomembranes and Associated Materials for Transient
Electronics. ACS Nano [online]. 2014, 8(6), 5843-5851
[cit. 2019-04-25]. DOI:

Proc. of IMBM 2019 91
DLC nanolayers doped by titanium for surgical implants
Filip Kallmünzer1*, Jan Mikšovský1
1Czech Technical University in Prague, Faculty of Biomedical Engineering, Kladno, Czech Republic
Abstract: We developed thin layers for surgical implants potentially used mainly for human hip and knee
joints. We want to minimize the need of their replacement for both economical and health savings, associated
with longer implant life in patient’s body. Diamond-like carbon (DLC) thin layers have an enormous potential
for covering materials for the purpose of improving their properties. For extra better mechanic and
biocompatibility behaviour of these layers we chose dopants of titanium. Our enriched thin layers produced
by dual pulsed laser deposition (PLD) and hybrid (with magnetron sputtering) pulsed laser deposition
(PLD/MS) reduce friction (0.3727 against the sample of minimum friction 0.762) and wear (346 µm3/N·m
against less than 5 µm3/N·m except of two samples) of the base material (substrate Ti6Al4V) and resist enough
Hercian pressure due to its future use. The results and methods of measuring friction, wear, roughness,
wettability and Hercian contacts are here presented.
Introduction
The aim of our basic research is the development
of thin layers for surgical implants, primarily to
extend life of the replacements of human hip and
knee joints. The motivation is therefore the health
aspects of the patient, for whom we are looking for
ways to minimize the need to replace the implant
with a new one, as well as economical savings,
both related to the longer durability of the implant
in his body. The aim is to find the best possible
combination of thin film base material applied
subsequently to the implant and the degree of its
possible doping with certain elements. It is also
necessary to select an efficient method of
manufacture and suitable thin-film dimensional
parameters.
Diamond-like carbon (DLC) layers improve
mechanical properties of surface such as hardness,
friction, wettability, biocompatibility, etc.
Unfortunately, there is a problem with adhesion.
The solution could be in use of some relevant
dopants. Particles of titanium have exactly this
function and moreover they improve tribological
properties of DLC thin layers. In this field
of investigation DLC layers doping by other
elements than Ti (W, Ta, Si, F, N) were also
already tested. [1]
We focused on such layers produced by dual
pulsed laser deposition (PLD) and hybrid pulsed
laser deposition (PLD/MS). We evaluated them for
friction, wear, roughness and wettability.
Our testing layers were somewhere between
the state of graphitic-like carbon bonds
and diamond-like carbon bonds. That means they
were between sp2 and sp3. Basically, more
diamond-like carbon sp3 causes more inner tension
and that has positive effect on cracking of the layer.
[2] DLC phase diagram is shown in Figure 1 and
mathematical model of our samples are in Figure 2.
Experimental - Methods
Our samples were created by two methods. The
first method is dual pulsed laser deposition, where
the first laser points to Ti target whereas the second
laser points to high purity graphite target (PLD),
see Figure 3. The second method is pulsed laser
deposition with magnetron sputtering, where
instead of first laser is used a magnetron
(PLD/MS).
The particle size is determined by the
deposition method and the material properties of
the target. Coverage of substrate made by PLD
should be harsher, meanwhile finer for the layers
which were co-created by MS. Our twelve DLC
samples varied in production method (PLD and
PLD/MS) and concentration of titanium (0, 1, 3, 5,
10, 25 at. %).
Friction was measured using our tribometer
of Anton Paar, see Figure 4, via method of PIN on
PLATE. PIN as a small wear-resistant chromium
steel ball (Steel 100Cr6) of 6 mm in diameter with
speed of oscillation on surface of the samples 5
cm/s under loading forces of 1, 2 and 5 newtons
were used. The total path of the test pin on the
surface of tested thin layers were 10 m with length
of one cycle 2x8 mm, corresponding to 625 cycles.
All experiments were realized without use
of any lubricants.

Kallmünzer et al.: DLC nanolayers doped by titanium for surgical implants
92 Proc. of IMBM 2019
Wear of the samples was measured
on a profilometer Alphastep IQ KIA Tencor (on
three locations of each sample with downforce 10
mg of diamond tip of 80 nm radius) at Albertov in
Prague (FBMI, CTU) and with the optical
microscope (Olympus BX51), to which a digital
camera was connected in laboratories in Kladno
(also FBMI, CTU), see Figure 5.
The water wettability of our samples was
measured on Krüss DSA100 via Dropshape
3 analysis program based of their contact angles.
The drops had volume of 1± 0.25 μl.
Results and discussion
DLC layers improve friction even without Ti
relative to the substrate. In the Figure 6 one can see
a comparison of tribological tests as friction
coefficient according to distance of PIN between
the substrate, the worst and best layers in case
of friction under load of 5 N.
The thin DLC + Ti layers with the least friction of
both methods and all three loads are compared in
Figure 7 below. Most preferably, a layer of 25% Ti
produced by a dual PLD is formed. At a load of
2 N, the coefficient of friction was 0.0875 ±
0.0201, at 5 N, the smallest average value of the
coefficient of friction was 0.0762 ± 0.0263 of all
measured samples. That corresponds with study
[6], where average coefficient of friction of DLC
thin layers doped by titanium were 0.076.
Figure 8 consists of photographs of a PIN,
substrate and all DLC layers taken with a digital
camera through an optical microscope (Olympus
BX51) under load of 5 N.
From the photos above, you can see how the
wear of the PIN and layers (except TiC-10)
decreases with increasing amount of Ti in the DLC
layers. Wear of 10 (total 12) samples were under 5
µm3/N·m and that corresponds e.g. with study in
[7].
Mean arithmetic deviations of the surfaces
(Ra) of our thin layers and the substrate itself are
given on Figure 9 bellow.
Except of two samples (0 and 5 of Ti at. %),
our layers had Ra (and quadratic deviations Rq)
less than 50 nm. These samples were not probably
made fine. Figure 10 shows the wettability of our
DLC layers with distilled water using the contact
angles measured by Dropshape3 analysis program.
Figure 1. DLC phase diagram. Our tested layers were between
sp2 and sp3 which correspond with hydrogen free ta-C. [3]
Figure 2. Mathematical model of our ta-C samples. a) complete,
b) half of the structure. [4]
Figure 3. Scheme of dual pulsed laser deposition (PLD).
In case of hybrid pulsed laser deposition (PLD/MS) the first
laser was replaced by magnetron. [5]
Figure 4. Tribometer for PIN on PLATE (left) with detail
on PIN holder, PIN and sample underneath (right). Obtained
in KPO laboratories at FBMI at CTU.
Figure 5. Left: Imaging technology: optical microscope
(Olympus BX51) with digital camera, obtained at KPO
laboratories at FBMI at CTU. Right: Profilometer Alphastep IQ
KIA Tencor, obtained in laboratories of FZU Albertov.
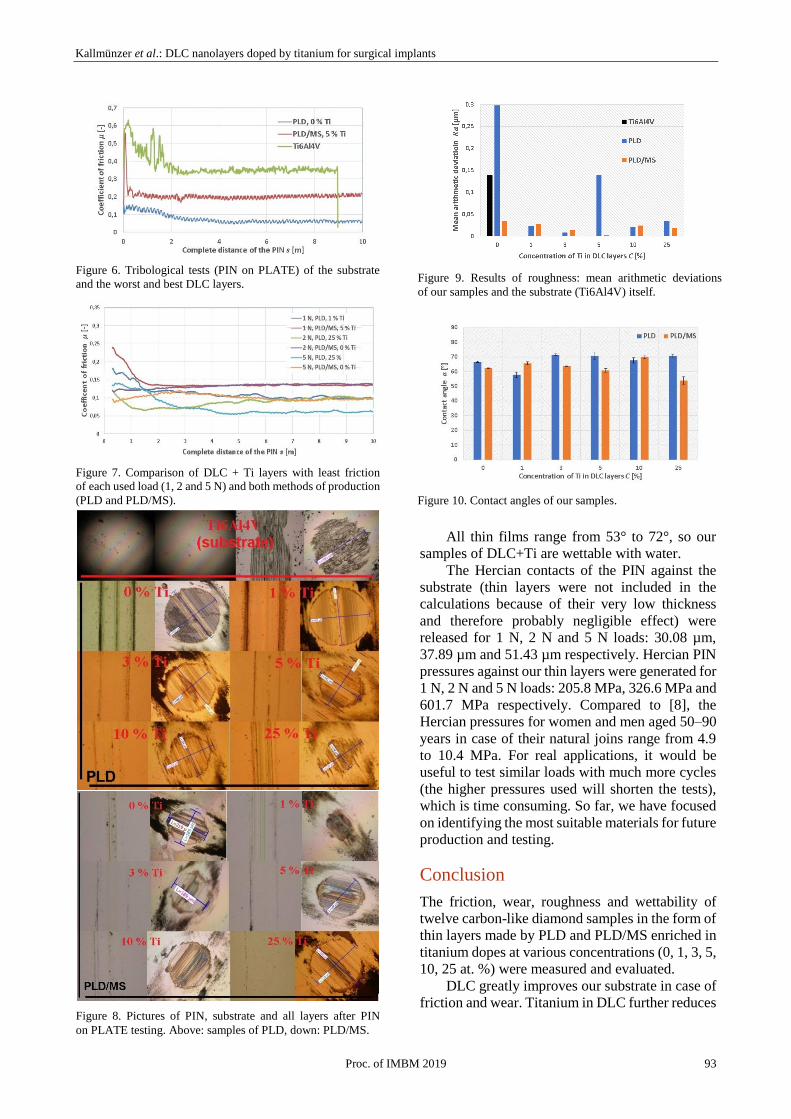
Kallmünzer et al.: DLC nanolayers doped by titanium for surgical implants
Proc. of IMBM 2019 93
All thin films range from 53° to 72°, so our
samples of DLC+Ti are wettable with water.
The Hercian contacts of the PIN against the
substrate (thin layers were not included in the
calculations because of their very low thickness
and therefore probably negligible effect) were
released for 1 N, 2 N and 5 N loads: 30.08 µm,
37.89 µm and 51.43 µm respectively. Hercian PIN
pressures against our thin layers were generated for
1 N, 2 N and 5 N loads: 205.8 MPa, 326.6 MPa and
601.7 MPa respectively. Compared to [8], the
Hercian pressures for women and men aged 50–90
years in case of their natural joins range from 4.9
to 10.4 MPa. For real applications, it would be
useful to test similar loads with much more cycles
(the higher pressures used will shorten the tests),
which is time consuming. So far, we have focused
on identifying the most suitable materials for future
production and testing.
Conclusion
The friction, wear, roughness and wettability of
twelve carbon-like diamond samples in the form of
thin layers made by PLD and PLD/MS enriched in
titanium dopes at various concentrations (0, 1, 3, 5,
10, 25 at. %) were measured and evaluated.
DLC greatly improves our substrate in case of
friction and wear. Titanium in DLC further reduces
Figure 6. Tribological tests (PIN on PLATE) of the substrate
and the worst and best DLC layers.
Figure 7. Comparison of DLC + Ti layers with least friction
of each used load (1, 2 and 5 N) and both methods of production
(PLD and PLD/MS).
Figure 8. Pictures of PIN, substrate and all layers after PIN
on PLATE testing. Above: samples of PLD, down: PLD/MS.
Figure 9. Results of roughness: mean arithmetic deviations
of our samples and the substrate (Ti6Al4V) itself.
Figure 10. Contact angles of our samples.

Kallmünzer et al.: DLC nanolayers doped by titanium for surgical implants
94 Proc. of IMBM 2019
friction, wear and internal stress. Dual PLD
samples have slightly smaller friction, meanwhile
Hybrid PLD/MS samples have slightly smaller
roughness. The best result of friction had TiC-12
(25% Ti, PLD): 0.0762, meanwhile in [5] were
friction of similar samples 0.076. Wear of 10 (total
12) samples were under 5 µm3/N·m and that
corresponds e.g. with study in [6]. Hercian contacts
and pressures of our thin films were calculated and
compared with [7].
Titanium-doped DLC thin layers appear to be
potentially suitable materials for implants.
However, more and more detailed studies are
needed for taking these materials into mass
production. The focus of next studies should be
especially in measurements with lubricants and in
greater consideration of targeted joint mechanics.
Acknowledgements: This work was supported by Czech
Technical University’s foundation SGS17/156/OHK4/2T/17.
References
[1] ZHAO, Fei. Ti-DLC films with superior friction
performance. Diamond & Related Materials [online].
2010, (19), 8 [cit. 2017-08-03]. Available from:
http://www.sciencedirect.com/science/article/pii/S0925
963510000282
[2] MUGURUMA, Takeshi a Masahiro IIJIMA. Effects of
sp2/sp3 Ration and Hydrogen Content on In Vintro
Bending and Frictional Performance of DLC-Coated
Orthodontic Stainless Steels [online]. 12 [cit. 2019-08-
19]. Available from:
https://webcache.googleusercontent.com/search?q=cac
he:hID5GurtQr8J:https://pdfs.semanticscholar.org/7679
/76767f9f6ab5f7569cc4049f4e0ebb654bea.pdf+&cd=2
4&hl=cs&ct=clnk&gl=cz
[3] Classification of Carbon Films [online].[cit. 2018-05-
13]. Available from:
https://www.google.cz/search?q=f%C3%A1zov%C3%
BD+diagram+dlc&tbm=isch&tbo=u&source=univ&sa
=X&ved=0ahUKEwi7u4Kf64LbAhUHKVAKHbJ-
AwMQsAQIJw&biw=1455&bih=695#imgrc=tD0enp-
HAPQ00M:
[4] QIANG, ZHANG, ZHOU a ZHANG. Improving the
internal stress and wear resistance of DLC film by low
content Ti doping. Solid state Sciences [online]. 2013, 6
[cit. 2019-05-13]. Available from:
https://www.sciencedirect.com/science/article/pii/S129
3255813000873
[5] JELÍNEK, Miroslav a Josef ZEMEK. Dual laser
edposition of Ti:DLC composite for implants [online]. 9
[cit. 2018-05-13]. Available from:
http://www.iopscience.iop.org/article/10.1088/1054-
660X/26/10/105605
[6] WANG, Q., ZHOU, YANG, et al. Influence of Ti
content on the structure and tribological properties of Ti-
DLC coatings in water lubrication. Diamond and
Related materials [online]. 2012, 13 [cit. 2019-05-13].
Available from:
https://www.sciencedirect.com/science/article/pii/S092
5963512001021
[7] QIANG, ZHANG, ZHOU, et al. Improving the internal
stress and wear resistance of DLC film by low content
Ti doping. Solid state Sciences [online]. 2013, 6 [cit.
2019-05-13]. Available from:
https://www.sciencedirect.com/science/article/pii/S129
3255813000873
[8] AFOKE, BYERS a HUTTON. Contact pressures in the
human hip joint. The Polytechnic of Central London:
British Editorial Society of Bone and Joint Surgery,
1987.

Proc. of IMBM 2019 95
Effect of nanodiamond particles on neuronal tissue
Veronika Šimková1, 2*, Veronika Benson1,2
1Czech Technical University in Prague, Faculty of Biomedical Engineering, Kladno, Czech Republic 2Institute of Microbiology, Czech Academy of Sciences, Prague, Czech Republic
Abstract: Nanoparticles formed under high pressure and temperature are considered highly biocompatible.
Because of their high compatibility, chemical stability and luminescence, nanoparticles can be considered as
suitable drug carriers for biomedical applications. Nanoparticles can directly or indirectly affect nerve tissue.
In order to determine whether this effect is pathological or whether the diamonds are biocompatible with nerve
tissue, it was necessary to monitor the interaction of nanodiamonds with nerve tissue ex vivo. In order to pass
the pathological signal across the blood-brain barrier, it was necessary to monitor the behavior of nerve tissue
after the application of nanodiamonds in vivo. Nerve tissue consists of neurons and glial cells. A neuron is a
specialized cell that is capable of receiving signals and responding to them in some way. Glial cells have a
supportive and metabolic function. The aim of the study was to investigate how nanodiamonds affect neuronal
tissue cells in ex vivo contact and whether they cross the blood-brain barrier in vivo.
Introduction
Nanodiamonds are carbon nanomaterials that are
very promising in use for therapeutic applications.
[1] Their highlights include high hardness, high
refractive index and high thermal conductivity.
They have excellent biochemical and optical
properties and a very wide surface modification
potential for binding specific molecules such as
drugs. [2] The brain occupies a small percentage of
body weight, but it is a very extraordinary organ
with its complexity. It consists of a billion nerve
cells, including neurons and glial cells. [3] Neuron
is a specialized cell, consisting of the body (soma)
and the processes (neurites). Neurons are capable
of receiving signals and also responding to signals.
Glial cells are essential for normal brain function.
Their goal is to maintain neuronal tissue
homeostasis, control, protect and promote neuronal
function. [4]
Methods
Nanodiamond Characteristics
We use 35-50 nm HPHT (high pressure high
temperature) nanodiamonds. These nanodiamonds
possess negative surface potential and can be
surface-coated by proteins, polymers like
polyethyleneimine 800 (PEI), and nucleic acid. We
have prepared several nanodiamond complexes for
the experiments. They differed in surface coatings.
Cell cultures from adult mouse BL6
For experiment were used black C57BL/6 mice
(male), about 3 months old. Primary neurons were
regenerated in MACS media with NeuroBrew-21
supplement and 10% of FBS. The cells were
maintained in37°C and 5% CO2 and incubated with
different nanodiamonds complexes of final
concentration (25g/ml). We used adherent
primary culture that we seeded onto poly-D-lysine
coated surface. In parallel we used suspension
neuronal culture that we grew in non-coated dishes
with supplements of growth factors like PDGF-b
and FGF.
Intracellular markers staining
The intracellular markers were detected with a
confocal microscopy and individual settings are
listed below. In the end of experimental period
(about 3 weeks), the adherent cells were washed
with PBS, fixed with 4% paraformaldehyde and
permeabilized with Triton X-100. Primary neurons
were stained with anti-tubulin III antibody. The
cells were incubated with 1% bovine serum
albumin to block non-specific binding sites.
Subsequently, we used specific primary antibody
against tubulin III derived from mouse and
incubated the cells overnight. Than we washed
cells with PBS and incubated them with anti-mouse
secondary antibody conjugated with Alexa Fluor-
488. Next to tubulin βIII we used Phalloidin. It is a
cyclic peptide that binds to high affinity F-actin
fibers. [5] Phalloidin we used was conjugated with
fluorophore emitting light in orange spectra region.

Šimková et al.: Effect of nanodiamond particles on neuronal tissue
96 Proc. of IMBM 2019
The cells were incubated with Phalloidin –
conjugate for 30 minutes and washed with PBS.
Cell nuclei were then stained with Hoechst 33342
for 15 minutes. It is a fluorescent dye that is water
soluble and relatively non-toxic.
After staining, cells were observed by
confocal microscopy. We used settings: ND Ex/Em
559/655-755 nm, tubulin βIII Ex/Em 473/520
nm,Phalloidin Ex/Em 559/620 nm, Hoechst Ex/Em
405/461 nm. The suspension culture has been
stained accordingly for presence of tubulin βIII and
analyzed with flow cytometry.
Results
Neurons and glial cells were stained for
cytoskeletal markers like F-actin and neuron-
specific tubulinβIII. The photograph was taken
with a confocal microscope at a magnification of
40x. Cell nuclei were stained with Hoechst 33342.
It shows the composition of primary culture grown
with primary attachment to the surface. The
neurons grow in a co-culture with astrocyte feeding
layer and regenerate the neurites shortly after
plating.
The neuronal cells grown in suspension
formed clusters. We identified both, primary
neurons (tubulin βIII positive events) as well as
tubulin βIII –negative cells representing glial
population. In suspension culture the cells grow
Figure 1: Staining of neurons and glial cells growing in
adherent culture for two weeks. Cell nuclei are stained
with Hoechst 33342 (blue). Neurons are stained with
tubulin βIII (green). The redcolor indicates F-actin fibers
that are stained with Phalloidin. From the left: merged
fluorescence signals with transmission; tubulin
βIII/nuclei; F-actin/nuclei.
Figure 2: Flow cytometry analysis of primary neuronal
culture two weeks after plating. Neurons are stained for
the presence of tubulin βIII marker and Hoechst 33342
has been used to define intact cells and acellular debris.
Figure 3: Primary culture of neurons and glial cells
growing in suspension for one week and in presence of
different nanodiamond complexes. The percentage of
dead cells and primary neurons (positive for tubulin βIII)
is shown. Control cells: incubated with saline; ND: non-
coated nanodiamonds; ND-P: coated with PEI800; ND-T:
coated with transferrin; ND-PR: coated with PEI800 and
nucleic acid; and ND-TPR: coated with transferrin,
PEI800, and nucleic acid.

Šimková et al.: Effect of nanodiamond particles on neuronal tissue
Proc. of IMBM 2019 97
without surface attachment and possess instead
additional cell-cell interactions.
After their incubation with different
nanodiamond complexes we found higher toxicity
when ND were coated only with PEI. On the other
hand naked or protein-coated ND resulted in lower
toxicity. However in those samples we also
experienced low amount of primary neurons.
Conclusion
The aim of this work was to find out whether
nanodiamonds affect cortical tissue in some way.
We experienced change in viability of the primary
cells and amount of primary neurons in dependence
on surface modification of the nanodiamond
particles.
References
[1] HUANG, Y., KAO, CH., LIU, K., et al. The effect of
fluorescent nanodiamonds on neuronal survival and
morphogenesis.Scientific Reports [online].2015, 4(1)
[cit. 2018-10-14]. ISSN 2045-2322. DOI:
10.1038/srep06919.
http://www.nature.com/articles/srep06919
[2] PŘIBYL, V. Nanodiamanty. Aldebaran Bulletin
[online]. 2015, 13(30), 1 [cit. 2018-10-14]. ISSN 1214-
1674.
https://www.aldebaran.cz/bulletin/2015_30_dia.php
[3] OREL, M., PROCHÁZKA, R. Vyšetření a
výzkummozku: pro psychology, pedagogy a
dalšínelékařskéobory. 1. vydání. Praha: Grada, 2017.
ISBN 978-80-2475539-7
[4] FERNÁNDEZ-ALBARRAL, J. A., SALOBRAR-
GARCÍA, E., MARTÍNEZPÁRAMO, R., I. RAMÍREZ,
A., DE HOZ, R., M. RAMÍREZ, J., SALAZAR, J. J.
Retinal glial changes in Alzheimer'sdisease – A review.
Journal of Optometry[online]. 2018. [cit. 2018-11-04].
ISSN 18884296. DOI: 10.1016/j.optom.2018.07.001.
https://linkinghub.elsevier.com/retrieve/pii/S18884296
18300803
[5] SATISH A., KORRAPATI, P.S. Tailored release of
triiodothyronine and retinoic acid from a spatio-
temporally fabricated nanofiber composite in stigating
neuronal differentiation. Nanoscale. [online]. 2017,
9(38), [cit. 2019-01-03].DOI: 10.1039/C7NR05918C.
https://www.researchgate.net/publication/319343158

98 Proc. of IMBM 2019


