instrumentation docments
35
CHAPTER 6: INSTRUMENTATION DOCUMENTS Reporters: Maria Romina P. Angustia Ma. Janine Losabio BSEE -5B
-
Upload
maria-romina-angustia -
Category
Engineering
-
view
18 -
download
4
Transcript of instrumentation docments

CHAPTER 6: INSTRUMENTATION
DOCUMENTSReporters:
Maria Romina P. AngustiaMa. Janine Losabio
BSEE -5B

Every technical discipline has its own standardized way(s) of making descriptive diagrams, and
instrumentation is no exception.
This chapter will discuss three different types of instrumentation diagrams:
• Process Flow Diagrams (PFDs)• Process and Instrument diagrams (P&IDs)• Loop diagrams (“loop sheets”)• SAMA diagrams

6.1 Process Flow Diagrams
At the highest level, the instrument technician is interested in the interconnections of
process vessels, pipes, and flow paths of process fluids. The proper form of diagram to
represent the “big picture” of a process is called a process flow diagram. Individual
instruments are sparsely represented in a PFD, because the focus of the diagram is the
process itself.


One might guess the instrument interconnections based on the instruments’ labels.
For instance, a good guess would be that the level transmitter (LT) on the bottom of the knockout
drum might send the signal that eventually controls the level valve (LV) on the bottom of that
same vessel. One might also guess that the temperature transmitter (TT) on the top of the evaporator
might be part of the temperature control system that lets steam into the heating jacket of that
vessel.

Based on this diagram alone, one would be hard-pressed to determine what control system, if
any, controls the compressor itself. All the PFD shows relating directly to the
compressor is a flow transmitter (FT) on the suction line.
This level of uncertainty is perfectly acceptable for a PFD, because its purpose is merely to show the
general flow of the process itself, and only a bare minimum of control instrumentation.

6.2 Process and Instrument DiagramsProcess and instrument diagrams (P&IDs) lie
somewhere in the middle between process flow diagrams and loop diagrams. A P&ID shows the layout of all relevant process vessels, pipes, and machinery, but with instruments superimposed
on the diagram showing what gets measured and what gets controlled.
Here, one can view the flow of the process as well as the “flow” of information between instruments
measuring and controlling the process.


Now we see there is more instrumentation associated with the compressor than just
a flow transmitter. There is also a differential pressure transmitter (PDT), a flow indicating
controller (FIC), and a “recycle” control valve that allows some of the vapor
coming out of the compressor’s discharge line to go back around into the
compressor’s suction line.

Additionally, we have a pair of temperature transmitters that
report suction and discharge line temperatures to an indicating
recorder.Some other noteworthy details
emerge in the P&ID as well. We see that the flow transmitter, flow

Please note the differences in the instrument “bubbles” as shown on this P&ID. Some of the
bubbles are just open circles, where others have lines going through the middle. Each of these
symbols has meaning according to the ISA (Instrumentation, Systems, and Automation society)
standard:

6.3 Loop diagramsAt the lowest level, the instrument technician is
interested in the interconnections of individual instruments, including all the wire numbers, terminal numbers, cable types, instrument calibration ranges, etc. The proper form of
diagram for this level of fine detail is called a loop diagram.
Here, the process vessels and piping are sparsely represented, because the focus of the diagram is
the instruments themselves.


The only type of diagram at a lower level of abstraction than a loop diagram would be
an electronic schematic diagram for an individual instrument, which of course
would only show details pertaining to that one instrument.
Thus, the loop diagram is the most detailed form of diagram for a control system as a whole, and thus it must contain all details
omitted by PFDs and P&IDs alike.

The more detail you put into a loop diagram, the easier it makes the
inevitable job of maintaining that system at some later date.
An interesting detail seen on this loop diagram is an entry specifying “input calibration” and “output calibration” for each and every instrument in the
system.

Another interesting detail seen on this loop diagram is the action of each instrument. You will notice a box and arrow (pointing
either up or down) next to each instrument bubble. An “up” arrow (↑) represents a direct-acting instrument: one whose output signal increases as the input stimulus increases.
A “down” arrow (↓) represents a reverse-acting instrument: one whose output signal decreases as the input stimulus increases.
All the instruments in this loop are direct-acting with theexception of the pressure differential transmitter PDT-42:

6.4 SAMA diagramsSAMA is an acronym standing for Scientific Apparatus Makers
Association, referring to a unique form of diagram used primary in the power generation industry to document control strategies.
These diagrams focus on the flow of information within a control system rather than on the process piping or instrument
interconnections (wires, tubes, etc.). The general flow of a SAMA diagram is top-to-bottom, with the process
sensing instrument (transmitter) located at the top and the final control element (valve or variable-speed motor) located at the
bottom. No attempt is made to arrange symbols in a SAMA diagram to
correlate with actual equipment layout: these diagrams are all about the algorithms used to make control decisions, and nothing
more.

A sample SAMA diagram appears here, showing a
flow transmitter (FT) sending a process
variable signal to a PID controller, which then sends a manipulated
variable signal to a flow control
valve (FCV):

A cascaded control system, where the output of one controller acts as the set point for another controller to follow, appears in
SAMA diagram form like this:

SAMA diagrams may show varying degrees of detail about the control strategies they document.
For example, you may see the auto/manual controls represented as separate entities in a SAMA
diagram, apart from the basic PID controller function.
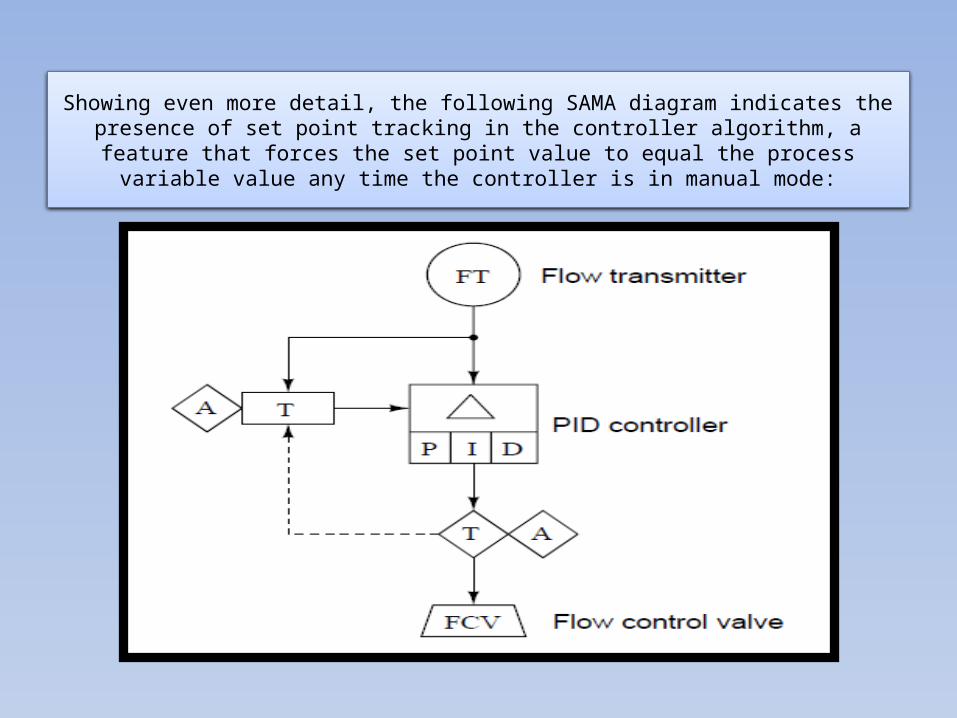
Showing even more detail, the following SAMA diagram indicates thepresence of set point tracking in the controller algorithm, a feature that forces the set point value to equal the process variable value any time the controller
is in manual mode:

Types of line in a SAMA Diagram
• Solid lines represent analog (continuously variable) signals such as processvariable, setpoint, and manipulated variable.
• Dashed lines represent discrete (on/off) signal paths,in this case the auto/manual state of the controller commanding the PID algorithm to get its setpoint either from the operator’s input (A) or from the process variable input (the flow transmitter: FT).

6.5 Instrument and process equipment
symbols

This section shows some of the many instrument symbols included in the ISA 5.1 standard.
These symbols find application in Process Flow Diagrams (PFDs), Process and Instrument Diagrams (P&IDs), and loop diagrams alike.

6.5.1 Line types

6.5.2 Process/Instrument line connections

6.5.3 Instrument bubbles

6.5.4 Process valve types

6.5.5 Valve actuator types

6.5.6 Valve failure mode

6.5.7 Flow measurement devices (flowing left-to-right)


6.5.8 Process equipment


6.5.9 SAMA diagram symbols