
Instrument Science Report on Standard Calibration Sources - STScI
14
Transcript of Instrument Science Report on Standard Calibration Sources - STScI

Instrument Science Report on Standard Calibration Sources
CAL/SCS{005
WHITE DWARF STANDARD STARS:
G191{B2B, GD 71, GD 153, HZ 43
Ralph C. Bohlin, Luis Colina1
Space Telescope Science Institute
3700 San Martin Drive
Baltimore, MD 21218
David S. Finley
Center for EUV Astrophysics
2150 Kittredge Street
University of California
Berkeley, CA 94720
To be published in the The Astronomical Journal
Received 24 April 1995 ; Accepted 16 May 1995
1On assignment from the Space Science Department of ESA.
ABSTRACT
Three additional white dwarfs, GD 71, GD 153, and HZ 43, covering a wide range in
e�ective temperature, have been observed with HST Faint Object Spectrograph (FOS)
to check the G191{B2B white dwarf based absolute calibration of HST instruments. The
FOS spectrophotometry of the three additional white dwarfs agree with model spectra
to �2%. The FOS absolute ux of G191{B2B, GD 71 and GH 153 agree with Landolt
photometry to better than 1% on average, in B and V.
Consequently, the white dwarfs G191{B2B, GD 71, GD 153, and HZ 43 are the
primary reference standards that are recommended for all ultraviolet and optical absolute
calibrations from 1000�A to 10000�A.
1. INTRODUCTION
Starting with Cycle 4 in January 1994, the
calibrated absolute ux of the HST instrument
complement has been on a preliminary white dwarf
(WD) scale (Bohlin 1994, Bohlin & Colina 1994,
Finley 1994). This WD scale has a relative ux
distribution that is de�ned by a preliminary pure
hydrogen model atmosphere with Te� = 60,000 K
and log g = 7.50 for G191{B2B. Recently, Finley,
Koester, & Basri (1995) derive an improved Te� =
61,300 K, which makes the far�UV ux of the model
1.5% brighter at 1200 �A with respect to 5490 �A.
The absolute ux scale is determined by V band
photometry from Landolt (Colina & Bohlin 1994).
In the case of the FOS, the absolute calibration
is determined by direct observation of G191{B2B.
For other HST instruments, a transformation of
the uxes of their observed standard stars to the
WD scale is required (Bohlin 1994, Bohlin 1995 in
preparation).
Section 2 describes the FOS observations of the
three additional white dwarfs. Section 3 details
the pure hydrogen models and the procedure used
to put the model spectra on an absolute ux
scale. Section 4 describes the accuracy of the FOS
spectrophotometry by comparing the FOS spectra
with the models and with Landolt's photometry.
Section 5 explains where to obtain digital versions
of the absolute ux distributions for the white dwarf
models.
2. OBSERVATIONS OF WHITE DWARF
STANDARDS
Three additional white dwarf stars, GD 71,
GD 153, and HZ 43, were observed in HST cycle 4
with the high dispersion modes of FOS in order to
verify the consistency of the HST WD scale over
a range of temperatures for three more stars with
pure hydrogen atmospheres. The selection criteria
required (1) a range of e�ective temperatures, (2) a
high ux to minimize HST observing time, (3) a
negligible interstellar extinction (Vennes et al. 1994),and (4) a zero metallicity, as veri�ed by EUV
observations.
The astrometric parameters and �eld charts used
in the HST/FOS observations of the three additional
white dwarfs, plus G191{B2B, are presented inTable 1 and Figure 1, respectively. All FOS
observations of the additional white dwarfs used
the B{3 (0.8600
) aperture. The targets were acquired
using a four stage peakup acquisition procedure.
The journal of the observations is in Table 2.
3. PURE HYDROGEN MODELS OF
WHITE DWARF STANDARDS
The three white dwarfs are modeled by pure
hydrogen atmospheres characterized by the e�ective
temperatures and gravities listed in Table 3. Te�
and log g are derived from detailed �ts to the Balmer
line pro�les using high S/N optical spectra of thesestars obtained by D. Finley. As for G191{B2B,
the comparison model uxes were calculated using
Detlev Koester's white dwarf model atmosphere
codes. Koester's models are described in Koester,
Schulz, & Weidemann (1979). A more complete
description of the optical observations, Balmer�tting procedure, and a description of the models
will be presented in Finley, Koester, & Basri (1995).
The uncertainties in the predicted uxes due to
uncertainties in the models or in the derived stellar
parameters are small. The stars are all hotter than30,000 K; and the Balmer and Paschen continuua
are on the Rayleigh-Jeans tail. Thus, the e�ects of
errors on the slopes of the spectra are minimized.
The largest uncertainties are in the coolest star of the
sample, GD 71. For this object, the formal 1 � error
in the Te� determination is 100 K, while a 200 Kdi�erence in Te� changes the ux at 1150 �A relative
to that at 5490 �A by only 0.7%. This di�erence
monotonically decreases toward longer wavelengths,
except in the lines, where a maximum di�erence of
4% is seen at the center of the Ly � line. Di�erences
within the Balmer lines are all less than 1%.
2

The 1 � uncertainty in log g is 0.03 dex, but
changing log g by twice that amount only changes
the relative continuum uxes by 0.2%. Di�erences
in the lines exceed 0.5% only in the core of Ly �,
where the di�erence is 5%.
One uncertainty in the modeling is the pa-
rameterization of the Hummer-Mihalas occupation
probability formalism (Hummer & Mihalas 1988).
Our models are calculated for an assumed critical
�eld strength of twice the nominal value, to achieve
consistent �ts to all Balmer lines as suggested by
Bergeron (1992). Assuming the nominal value would
give Te� = 31,900 K, log g = 7.69, compared to our
adopted parameters of Te� = 32,300 K and log g =
7.73. The di�erences between the two models are
< 2% in the red wing of Ly �, 5% in Ly �, < 1%
longward of 1250 �A, and barely exceeds 1% between
high Balmer lines.
The models are placed on an absolute ux
scale using the V magnitudes in Table 3 and the
technique of Colina & Bohlin (1994). Figure 2 shows
the adopted absolute uxes for the additional WD
standard stars along with G191{B2B.
4. FOS ABSOLUTE
SPECTROPHOTOMETRY
4.1 FOS Spectra Versus Models
Figure 3 shows the ratio of the uxes of the co-
added FOS spectra to the corresponding models for
the blue side, red side, and best combined FOS data.
There are narrow glitches in the ratios because of
small di�erences in Balmer line pro�les, Geocoronal
Lyman-alpha, and residual at �eld features on the
red side. The at �elding should improve after
accounting for the changes with time of the red side
ats for H19 and H27. In Figure 3d for G191{
B2B, the extensive cycle 1{3 observations have been
combined with the cycle 4 data to produce a high
S/N FOS spectrum; and the even-higher S/N data
of Oke (1990) are used longward of 3850 �A. Since
the G191{B2B model de�nes the absolute ux scale
for FOS calibration and since the Oke spectrum
has been corrected to the ux distribution of the
model with a smooth spline �t, the only di�erences
between model and data for G191{B2B are in the
narrow features.
The 500 �A wide dip of almost 3% at 1750 �A
in Figure 3c for HZ 43 is probably a 2{3 sigma
statistical e�ect at the limit of the FOS photometric
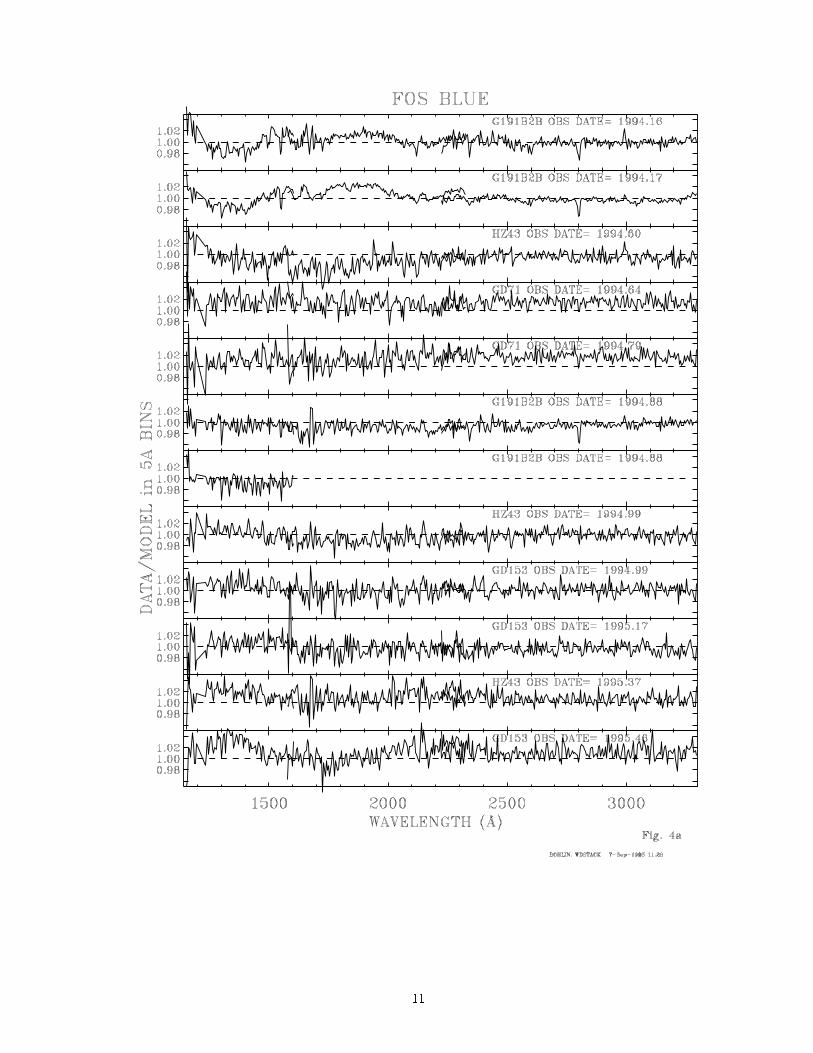
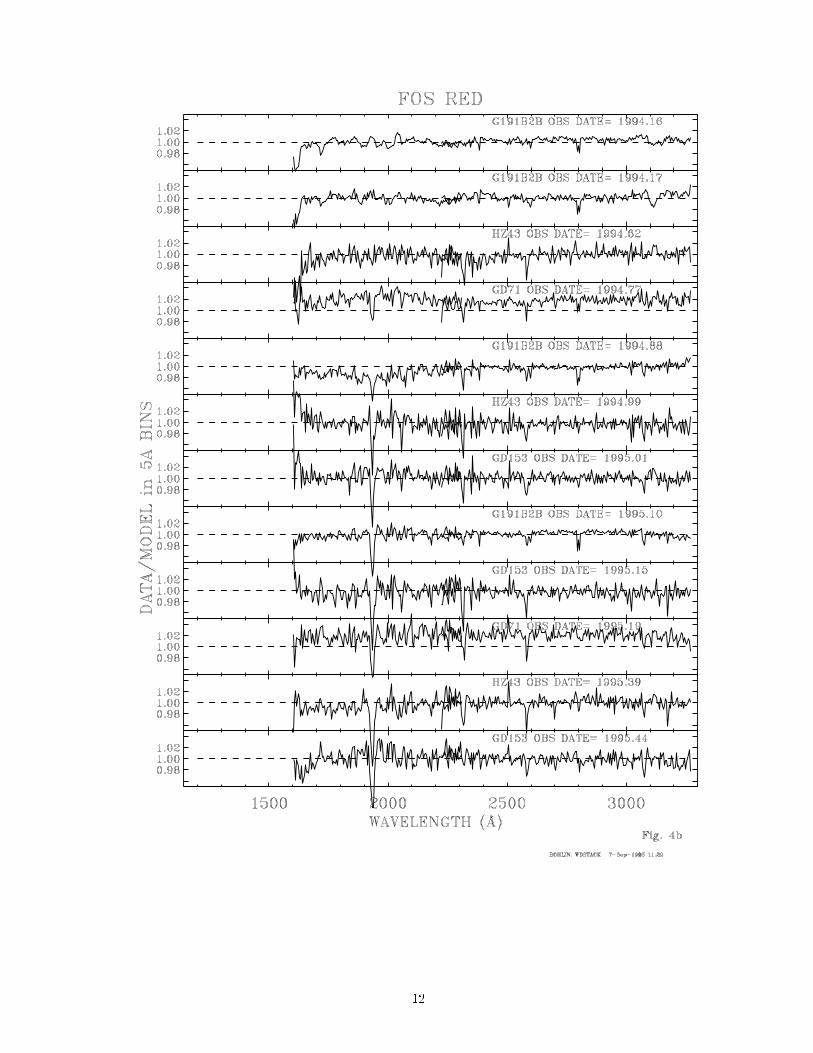
repeatablility. Figure 4 shows the individual cycle 4
observations that are included in the data used
for Figure 3. Figure 4a demonstrates that neither
observation of HZ 43 di�ers more from unity than
the �rst two ratios for G191{B2B. More FOS
observations of the three new white dwarf standardsare needed to verify the ux distributions to the 1%
level.
4.2 FOS Versus Landolt Broad-band Photometry
One more check of the FOS spectrophotometry
is provided by the comparison of the syntheticbroad-band photometry of the FOS spectra with
Landolt's B and V magnitudes. Following themethod outlined in Colina & Bohlin (1994), B and
V Landolt magnitudes for the FOS spectra of all fourwhite dwarfs are computed (VS and BS in Table 4).
The absolute scale of the FOS spectra of G191{B2B, GD 71, and GD 153 agrees with Landolt's
photometry (V and B in Table 4) to better than 1%,for all three of the single isolated stars.
For HZ 43, direct comparison with Landolt pho-tometry is complicated by the red, close companion,
which is separated by only � 300
(Luyten 1970; Napi-wotzki, et al. 1993). Landolt's V and B magnitudes
for HZ 43 has been obtained from recent photometricmeasurements using an aperture of 17.7 seconds of
arc centered on HZ43 (Landolt, private comm.).Consequently, the HZ 43 companion contributes to
the V and B magnitudes measured from the ground.Long-slit spectroscopic ground-based observations
provide the separate spectra for HZ43 and itscompanion (Napiwotzki et al. 1993). Synthetic pho-
tometry performed on the optical HZ 43 spectrum
and on the combined HZ 43+companion spectrum,demonstrates that the HZ 43+companion spectrum
is 0.24 mag and 0.03 mag brighter than HZ 43 in Vand B, respectively. These corrections are applied to
Landolt's photometry, and our results indicate thatthe FOS V and B photometry agrees with Landolt's
corrected values to 2%{3% (see Table 4). Becauseof the uncertainty of this correction procedure, the
FOS magnitude for HZ 43 appears in Table 3 andis used to set the absolute ux scale for the HZ 43
model.
5. PUBLIC ACCESS TO DIGITAL
SPECTRA OF THE STANDARDS
The uxes of the white dwarf models, together
with those of the rest of the HST calibration stan-dards, can be found in UNIX SDAS binary table for-
mat on the world wide web with the URL identi�er
http://www.stsci.edu/ftp/cdbs/calspec. Filenamesare * mod 001.tab where * indicates the name of the
star. On the VMS STScI science cluster, the samedata can be found in disk$calibration:[cdbsdata.refer.
calspec]* mod 001.tab. Any future updates to themodel ux distributions will have the same root
name, except that the 001 will be incremented.
3

6. SUMMARY
Whenever possible, one of the four white dwarf
standards should be observed to determine the best
instrumental calibrations on the WD scale. Finding
charts from the ST ScI GSSS appear in Figure 1 and
can be compared to similar �gures for G191{B2B and
GD 71 in Turnshek et al. (1990). However, caution
is required for ground-based observations of HZ 43
because of the red companion at � 300
(Luyten 1970;
Napiwotzki, et al. 1993). More FOS observations
of the three new white dwarfs are needed to derive
the white dwarf based FOS calibration to greater
precision. Additional work on the inclusion of metals
in the model atmosphere calculations for G191{B2B
is needed, since Sion et al. (1992) have shown that
absorption in metal lines is important at the � 2%
level in some wavelength regions.
More work on the model atmospheres is required
from 1 to 2.5 microns in order to provide primary
WD ux standards for the calibration of NICMOS,
the future HST infrared camera that is planned for
the 1997 servicing mission.
Acknowledgements
We thank Dr. Napiwotzki who generously pro-
vided the optical spectra of HZ 43 and companion.
The authors also thank Dr. A. Landolt for providing
us with accurate new photometry for GD 153 and
HZ 43. This work is based on observations with
the NASA/ESA Hubble Space Telescope, obtained
at the Space Telescope Science Institute, which is
operated by AURA, Inc. under NASA contract No.
NAS5-26555.
REFERENCES
Bergeron, P. 1992, in White Dwarfs: Advances in
Observation and Theory, NATO ASI series, ed.
M. A. Barstow (Dordrecht: Kluwer Academic
Publishers), p. 267.
Bohlin, R. C. 1994, in Proc Conf. Calibrating HST,
p. 234; also CAL/SCS-002.
Bohlin, R. C., & Colina, L. 1994, HST Newsletter
Vol. 11, No. 2, p. 17.
Cheselka, M., Holberg, J., Watkins, R., Collins, J.,
& Tweedy, R. 1993, AJ106 2365.
Colina, L., & Bohlin, R. C. 1994, AJ108 1931.
Finley, D. S. 1994, in Proc Conf. Calibrating HST,
p. 416.
Finley, D. S., Koester, D., & Basri, G. 1995, in
preparation.
Giclas, H. L., Burnham, R., & Thomas, N. G. 1980,
Lowell Obs. Bull. 166, 157.
Harrington, R. S., & Dahn, C. C. 1980, AJ85 454.
Hummer, D. G. & Mihalas, D. 1988, ApJ331 794.
Koester, D., Schulz, H., & Weidemann, V. 1979,
Astr. Ap., 76, 262.
Landolt, A. 1992, AJ104 340.
Lang, K. R. 1992, Astrophysical Data: Planets and
Stars.
Luyten, W. J. 1970, White Dwarfs, Univ. of
Minnesota Press, Minneapolis.
Napiwotzki, R., Barstow, M., Fleming, T., Holweger,
H., Jordon. S., & Werner, K. 1993, Astr. Ap.,
278, 478.
Oke, J. B. 1990, AJ99 1621.
Sion, E., Bohlin, R., Tweedy, R., and Vauclair, G.
1992, ApJ391 L29.
Turnshek, D., Bohlin, R., Williamson, R., Lupie, O.,
& Koornneef, J. 1990, AJ99 1243.
Vennes, S., Dupuis, J., Bowyer, S., Fontaine, G.,
Wiercigroch, A., Jelinsy, P., Wesemael, F., &
Malina, R. 1994, ApJ421 L35.
4
Figure 1.| ST ScI Guide Star System �nding charts for G191{B2B (WD0501+527), GD 71, GD 153, and
HZ 43. The �eld frame is 7.15 arcminutes square, and the magni�ed frame is 85 arcseconds square.
Targets with appreciable proper motion will not be centered in the crosshairs of the chart, because
the cursor is located at the predicted position for the epoch 2000.

Figure 2.| Absolute ux distributions of the four pure hydrogen model ux distributions that provide the
primary HST ux reference scale.
Figure 3.| Ratios of FOS uxes to the pure hydrogen model atmospheres in 6 �A bins. Top panels: FOS
blue side high dispersion gratings H13, H19, H27, and H40. Middle panels: FOS red side high
dispersion gratings H19, H27, H40, H57, and H78. Bottom panels for GD 71, GD 153, and HZ 43
in a{c: Best composite FOS spectrum, with blue side data shortward of 2600 �A and red side data
longward of 2600 �A. Bottom panel for G191{B2B in d: Composite spectrum of blue side 1140{2085 �A,
red side 2085{3300 �A, blue side 3300{3850 �A, and Oke spectrum longward of 3850 �A, where the main
residuals are in the hydrogen lines and in the circumstellar CIV at 1550 �A and MgII at 2800 �A. Data
from HST cycles 1{4 are included in Figure 3d.
Figure 4.| Residuals as in Figure 3 for the individual cycle 4 observations, where time of observation
increases from top to bottom. The broad systematic deviations of 2{3% from unity are the intrinsic
limits to FOS photometric precision. However, the �rst two blue side observations of G191{B2B
demonstrate a much better repeatablity that is often seen for FOS over short intervals of a few days.

9

10
11
12
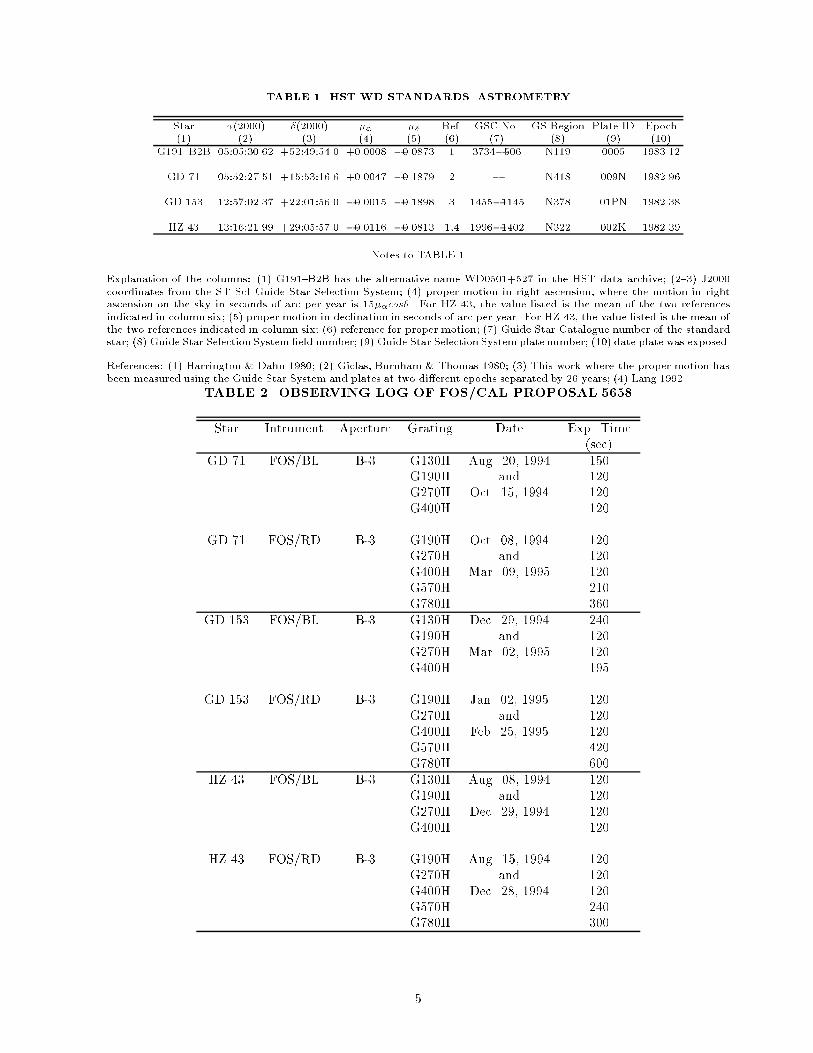
TABLE 1. HST WD STANDARDS. ASTROMETRY
Star �(2000) �(2000) �� �� Ref. GSC No. GS Region Plate ID Epoch(1) (2) (3) (4) (5) (6) (7) (8) (9) (10)
G191{B2B 05:05:30.62 +52:49:54.0 +0.0008 �0.0873 1 3734�506 N119 0005 1983.12
GD 71 05:52:27.51 +15:53:16.6 +0.0047 �0.1879 2 � N418 009N 1982.96
GD 153 12:57:02.37 +22:01:56.0 �0.0015 �0.1898 3 1455�1145 N378 01PN 1982.38
HZ 43 13:16:21.99 +29:05:57.0 �0.0116 �0.0813 1,4 1996�1402 N322 002K 1982.39
Notes to TABLE 1
Explanation of the columns: (1) G191{B2B has the alternative name WD0501+527 in the HST data archive; (2{3) J2000coordinates from the ST ScI Guide Star Selection System; (4) proper motion in right ascension, where the motion in rightascension on the sky in seconds of arc per year is 15��cos�. For HZ 43, the value listed is the mean of the two referencesindicated in column six; (5) proper motion in declination in seconds of arc per year. For HZ 43, the value listed is the mean ofthe two references indicated in column six; (6) reference for proper motion; (7) Guide Star Catalogue number of the standardstar; (8) Guide Star Selection System �eld number; (9) Guide Star Selection System plate number; (10) date plate was exposed.
References: (1) Harrington & Dahn 1980; (2) Giclas, Burnham & Thomas 1980; (3) This work where the proper motion has
been measured using the Guide Star System and plates at two di�erent epochs separated by 26 years; (4) Lang 1992.
TABLE 2. OBSERVING LOG OF FOS/CAL PROPOSAL 5658
Star Intrument Aperture Grating Date Exp. Time
(sec)
GD 71 FOS/BL B-3 G130H Aug. 20, 1994 150
G190H and 120
G270H Oct. 15, 1994 120
G400H 120
GD 71 FOS/RD B-3 G190H Oct. 08, 1994 120
G270H and 120
G400H Mar. 09, 1995 120
G570H 210
G780H 360
GD 153 FOS/BL B-3 G130H Dec. 29, 1994 240
G190H and 120
G270H Mar. 02, 1995 120
G400H 195
GD 153 FOS/RD B-3 G190H Jan. 02, 1995 120
G270H and 120
G400H Feb. 25, 1995 120
G570H 420
G780H 600
HZ 43 FOS/BL B-3 G130H Aug. 08, 1994 120
G190H and 120
G270H Dec. 29, 1994 120
G400H 120
HZ 43 FOS/RD B-3 G190H Aug. 15, 1994 120
G270H and 120
G400H Dec. 28, 1994 120
G570H 240
G780H 300
5
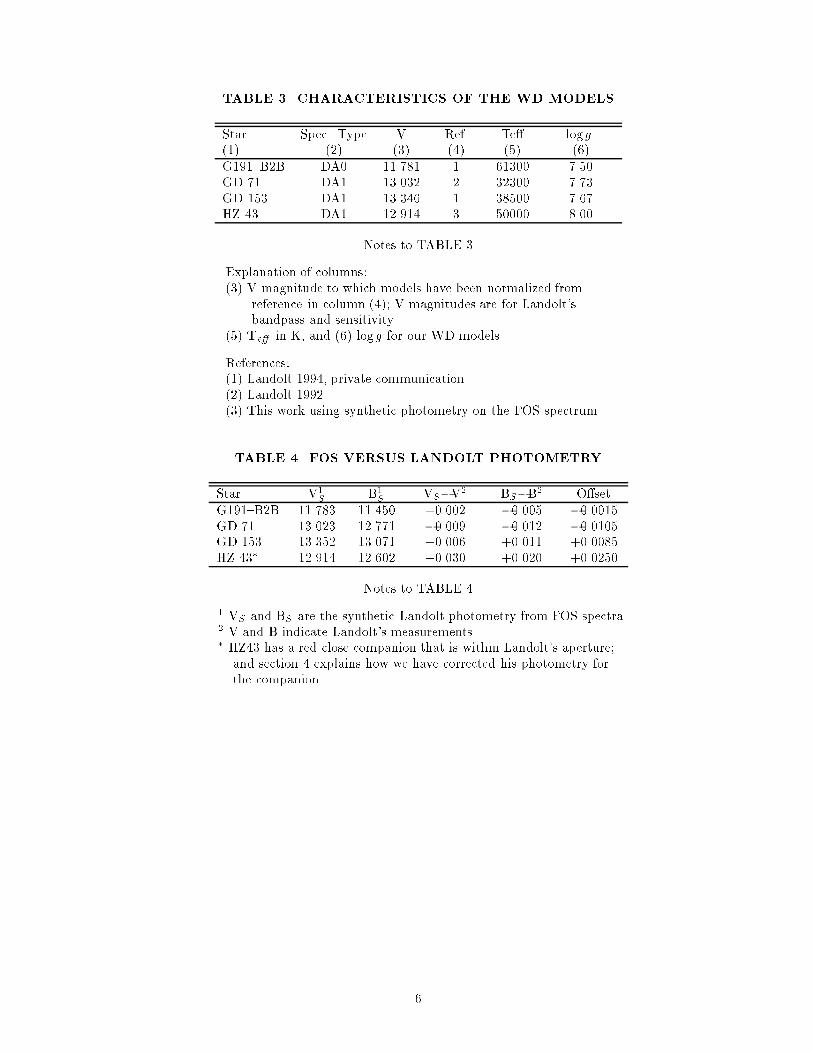
TABLE 3. CHARACTERISTICS OF THE WD MODELS
Star Spec. Type V Ref. Te� logg
(1) (2) (3) (4) (5) (6)
G191{B2B DA0 11.781 1 61300 7.50
GD 71 DA1 13.032 2 32300 7.73
GD 153 DA1 13.346 1 38500 7.67
HZ 43 DA1 12.914 3 50000 8.00
Notes to TABLE 3
Explanation of columns:
(3) V magnitude to which models have been normalized from
reference in column (4); V magnitudes are for Landolt's
bandpass and sensitivity.
(5) Te� in K, and (6) logg for our WD models.
References:
(1) Landolt 1994, private communication.
(2) Landolt 1992.
(3) This work using synthetic photometry on the FOS spectrum.
TABLE 4. FOS VERSUS LANDOLT PHOTOMETRY
Star V1
SB1
SVS�V
2 BS�B2 O�set
G191{B2B 11.783 11.450 +0.002 �0.005 �0.0015
GD 71 13.023 12.771 �0.009 �0.012 �0.0105
GD 153 13.352 13.071 +0.006 +0.011 +0.0085
HZ 43� 12.914 12.602 +0.030 +0.020 +0.0250
Notes to TABLE 4
1 VS and BS are the synthetic Landolt photometry from FOS spectra.2 V and B indicate Landolt's measurements.� HZ43 has a red close companion that is within Landolt's aperture;
and section 4 explains how we have corrected his photometry for
the companion.
6