
Instruction Goals Assessment For Each Student For All Students Using Assessment Data to Improve...
48
Instructio n Goals Assessment For Each Studen t For All Student s Using Assessment Data to Using Assessment Data to Improve Outcomes for Each Improve Outcomes for Each Student Student Institute on Beginning Institute on Beginning Reading II Reading II
-
date post
22-Dec-2015 -
Category
Documents
-
view
215 -
download
1
Transcript of Instruction Goals Assessment For Each Student For All Students Using Assessment Data to Improve...

Instruction
GoalsAssessment
For Each
Student
For All Students
Using Assessment Data to Using Assessment Data to
Improve Outcomes for Each StudentImprove Outcomes for Each Student
Institute on Beginning Reading IIInstitute on Beginning Reading II

Harn © 2003 2
AcknowledgmentsAcknowledgments
Oregon Department of Education
Institute for the Development of Educational
Achievement, College of Education, University
of Oregon
U.S. Department of Education,
Office of Special Education Programs

Harn © 2003 3
Content DevelopmentContent Development
Content developed by:
Edward J. Kame’enui, Ph. D. Deborah C. Simmons, Ph. D.Professor, College of Education Professor, College of EducationUniversity of Oregon University of Oregon
Beth Harn, Ph.D. Michael D. Coyne, Ph. D. University of Oregon University of Connecticut
David Chard, Ph. D.University of Oregon
Additional support:
Patrick Kennedy-PaineKatie Tate Nicole Sherman-Brewer University of Oregon Oregon Reading First

Harn © 2003 4
CopyrightCopyright
All materials are copy written and should
not be reproduced or used without
expressed permission of Dr. Edward J.
Kame’enui or Dr. Deborah C. Simmons.
Selected slides were reproduced from
other sources and original references
cited.

Harn © 2003 5
Schoolwide:
Each & All
Prevention Oriented Scientifically
Based
Results Focused
IBR Foundational Features: IBR Foundational Features: Translating Research into PracticeTranslating Research into Practice

Harn © 2003 6
For Each
Student
Instruction
GoalsAssessment
For All Students
Ongoing Progress Monitoring and Differentiated and
Individualized Instruction for Each Student
A Schoolwide Beginning Reading A Schoolwide Beginning Reading ModelModel

Harn © 2003 7
Today’s Focus
1. Goals: What outcomes do we want for our students in our
state, district, and schools?
2. Knowledge: What do we know and what guidance can we
gain from scientifically based reading research?
3. Progress Monitoring Assessment: How are we doing? What
is our current level of performance as a school? As a
grade? As a class? As an individual student?
4. Outcome Assessment: How far do we need to go to reach
our goals and outcomes?
5. Core Instruction: What are the critical components that
need to be in place to reach our goals?
6. Differentiated Instruction: What more do we need to do and
what instructional adjustments need to be made?
IBR Guiding QuestionsIBR Guiding Questions

Harn © 2003 8
The goals and objectives of today’s session:
1. Identify the types of student performance
DIBELS reports.
2. Determine what kinds of information are
available from reports.
3. Interpret reports to improve instructional
decision making.
Objectives: What You WillObjectives: What You WillLearn and DoLearn and Do

Harn © 2003 9
Using data to improve educational decision making DIBELS data can be used to make decisions
at two levels: School & class level
How is our reading program meeting the needs of all students?
Individual student level How is our reading program meeting the
needs of our most at-risk students?
Once You’ve Collected the DataOnce You’ve Collected the Data

Harn © 2003 10
Types of Reports Available for Types of Reports Available for Interpreting DIBELS DataInterpreting DIBELS Data
All reports can be accessed or generated at http://dibels.uoregon.edu/
School-Level Reports: Histogram Box Plots Grade List
Class & Student Level Reports: Class List Grade List Individual Student Profile

Harn © 2003 11
Enter/Edit Data
View/Create Reports
InterpretReports
Administrative Menu
MigrateStudents
System Status
FAQ
ManualContact
Information
DIBELS WebDIBELS Web

Harn © 2003 12
1. What essential big idea is assessed?
2. What is the established goal for that measure?
Critical value? Critical time period?
3. How is student performance displayed?
4. How do you identify students needing additional instructional support?
How to Interpret Each ReportHow to Interpret Each Report

Harn © 2003 13
Big Idea DIBELS Measure
Phonological Awareness
Alphabetic Principle
Fluency and Accuracy
Vocabulary
Comprehension
Initial Sounds Fluency (ISF)Phonemic Segmentation Fluency
(PSF)
Nonsense Word Fluency (NWF)
Oral Reading Fluency (ORF)
Word Use Fluency (WUF)
Oral Reading Fluency & Retell Fluency (RTF)
Q1: What Essential Big Idea is Q1: What Essential Big Idea is Assessed?Assessed?

Harn © 2003 14
During each Benchmark data collection period, multiple essential skills are assessed:
Depending on the grade and time of year, some measures are more important than others.
Essential Measures at the Beginning of K
Essential Measure at
the End of K
Essential Measure at the
Middle of K
Q1: What Essential Big Idea is Q1: What Essential Big Idea is Assessed?Assessed?

Harn © 2003 15
Essential Measures in Fall of
1st
Essential Measures
in Winter of 1st
Essential Measure in
Spring of 1st
Q1: What Essential Big Idea is Q1: What Essential Big Idea is Assessed?Assessed?

Harn © 2003 16
Q1: What Essential Big Idea is Q1: What Essential Big Idea is Assessed?Assessed?

Harn © 2003 17
For every goal, there are two questions to answer:
1. How much? Determine the critical value for the measure.
2. By when? Determine when the child should attain proficiency of the skill to remain on-track.
How far away a child is from the critical benchmark indicates the level of instructional
intensity needed.
Q2: What is the Established Goal for Q2: What is the Established Goal for that Measure?that Measure?

Harn © 2003 18
Measure How Much? By When?
Initial Sounds Fluency 25 or more Middle of K
Phonemic Segmentation
Fluency35 or more End of K
Nonsense Word Fluency 50 or more Middle of 1st
Oral Reading Fluency
1st: 40 or more2nd: 90 or more3rd: 110 or more
1st: End of year2nd: End of year3rd: End of year
Q2: What is the Established Goal for Q2: What is the Established Goal for that Measure?that Measure?

Harn © 2003 19
Developing Skill Goal Skill
Low Risk Established
Some Risk Emerging
At Risk Deficit
Depending on the student’s performance and time of year, a student’s score will be described as one of the following:
DIBELS Terminology For A Student’s DIBELS Terminology For A Student’s PerformancePerformance

Harn © 2003 20
At the beginning-of-the year, the developing skills are the following: Kindergarten: Phonological Awareness (ISF)
First Grade: Alphabetic Principle (NWF)
2nd & 3rd Grades: Fluency and Accuracy with Connected Text (ORF)
At the beginning-of-the year, the goal skills are the following: First Grade: Phonological Awareness (PSF)
DIBELS Terminology For A Student’s DIBELS Terminology For A Student’s PerformancePerformance

Harn © 2003 21
Describing Student PerformanceDescribing Student Performance
For each DIBELS measure, the student’s performance at the expected goal is described as:
1. Established
2. Emerging
3. Deficit

Harn © 2003 22
Describing Student PerformanceDescribing Student Performance
Established: Student has met or exceeded the benchmark value for the measure. Implication: Current instructional program is meeting the
child's needs
Emerging: Student is at-risk for not meeting the next critical benchmark. Implication: Modify instructional program and monitor more
often (1-2 x a month)
Deficit: Student is at significant risk of not meeting the next critical benchmark without significant changes to the instructional program. Implication: Modify instructional program significantly and
monitor student performance more often (2-3 x a month)

Harn © 2003 23
Kindergarten Measures
Beginning Middle End
Measure Score Status Score Status Score Status
ISF< 44-7≥ 8
At riskSome riskLow risk
< 1010-24≥ 25
DeficitEmergingEstablished
LNF< 22-7≥ 8
At riskSome riskLow risk
< 1515-26≥ 27
At riskSome riskLow risk
< 2829-39≥ 40
At riskSome riskLow risk
PSF< 6
7-17≥18
At riskSome riskLow risk
< 910-34≥ 35
DeficitEmergingEstablished
NWF< 4
5-12≥ 13
At riskSome riskLow risk
< 1415-24≥ 25
At riskSome riskLow risk
Progressive Benchmarks: Is the Student Progressive Benchmarks: Is the Student On-Track to Achieve the Benchmark On-Track to Achieve the Benchmark
Goal?Goal?

Harn © 2003 24
Beginning Middle End
Measure Score Status Score Status Score Status
LNF< 25
25-36≥ 37
At riskSome riskLow risk
PSF< 10
10-34≥ 35
DeficitEmergingEstablished
< 1010-34≥ 35
At riskSome riskLow risk
< 1010-34≥ 35
At riskSome riskLow risk
NWF< 1313-23≥ 24
At riskSome riskLow risk
< 2930-49≥50
DeficitEmergingEstablished
< 2930-49≥ 50
DeficitEmergingEstablished
ORF< 7
8-19≥ 20
At riskSome riskLow risk
< 1920-39≥ 40
At riskSome riskLow risk
First Grade Measures
Progressive Benchmarks: Is the Student Progressive Benchmarks: Is the Student On-Track to Achieve the Benchmark On-Track to Achieve the Benchmark
Goal?Goal?

Harn © 2003 25
Progressive Benchmarks: Is the Student Progressive Benchmarks: Is the Student On-Track to Achieve the Benchmark On-Track to Achieve the Benchmark
Goal?Goal?
Beginning Middle End
Measure Score Status Score Status Score Status
2nd Grade
ORF
< 2626-43≥ 44
At riskSome riskLow risk
< 5252-67≥ 68
At riskSome riskLow risk
< 7070-89≥ 90
At riskSome riskLow risk
3rd Grade ORF
< 5353-76≥ 77
At riskSome riskLow risk
< 6767-91≥ 92
At riskSome riskLow risk
< 7980-109≥ 110
At riskSome riskLow risk
2nd & 3rd Grade ORF Scores

Harn © 2003 26
School-Level Report: Histogram A histogram summarizes the distribution of scores of all
children in a grade within a school/district. It provides information on both the number and percentage of children
performing at specified values.
3
9
Q3: How is Student Performance Q3: How is Student Performance Displayed?Displayed?
Phoneme Segmentation Fluency

Harn © 2003 27
Interpreting HistogramsInterpreting Histograms
At this school, how many students received a score between the following scores?
0-4: ______ 25-29: ________ 45-49: _______ What percent of these beginning-of-the-year first graders have
established skills in phonological awareness? ____
Phoneme Segmentation Fluency
Harn © 2003 28
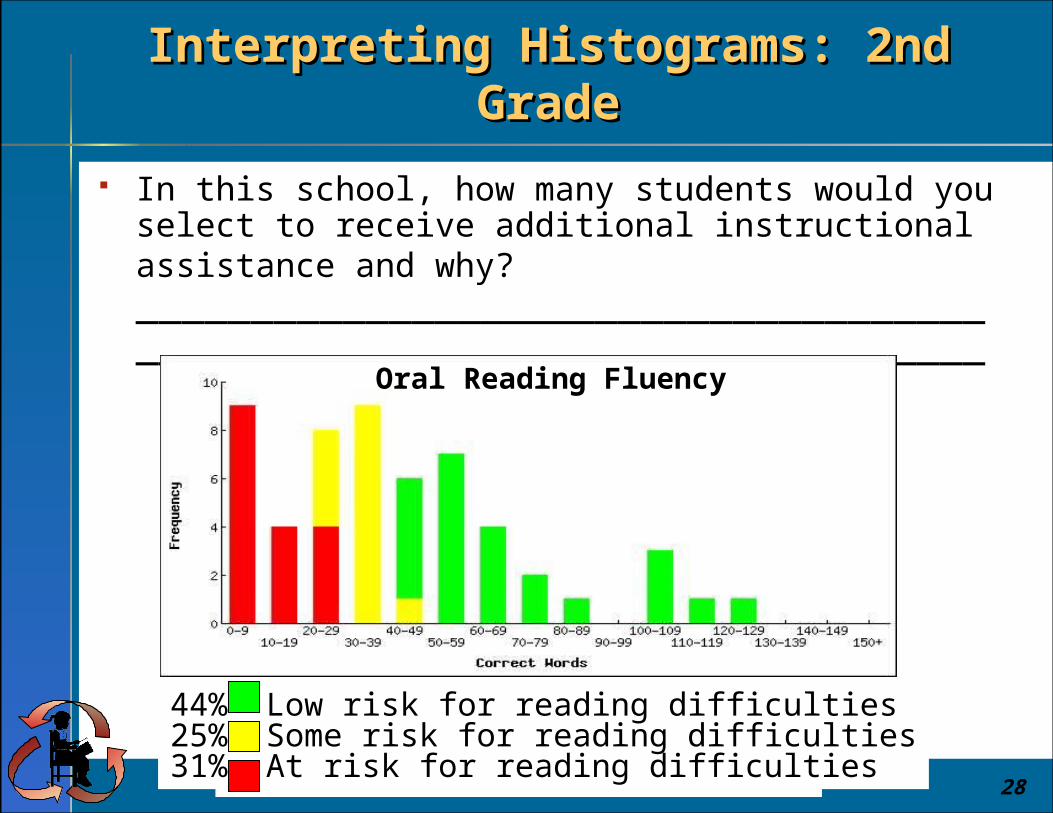
In this school, how many students would you select to receive additional instructional assistance and why? __________________________________________________________________________
44% Low risk for reading difficulties25% Some risk for reading difficulties31% At risk for reading difficulties
Oral Reading Fluency
Interpreting Histograms: 2nd GradeInterpreting Histograms: 2nd Grade

Harn © 2003 29
Using the School Summary Sheet,
analyze your school’s histograms and
identify the percent of students at each
status level. At risk
Some risk
Low risk
Applying It to Your School: Applying It to Your School: Interpreting HistogramsInterpreting Histograms

Harn © 2003 30
School-Level Report: Box Plot A box plot illustrates an entire grade’s
distribution of scores in relation to the goalBox Plot of End of Year Grade 2 ORF Results
Progressive ORF Goals
Q3: How is Student Performance Q3: How is Student Performance Displayed?Displayed?

Harn © 2003 31
Interpreting Box PlotsInterpreting Box Plots
At the beginning of the year, how many words per minute were students reading at the following percentiles?
20%ile: _____ 50%ile: _____ 80%ile: _____ In the middle of the year, how many words per minute were
students reading at the following percentiles?20%ile: _____ 50%ile: _____ 80%ile: _____
Beginning Middle

Harn © 2003 32
Boxplot of End of Year Grade 2 ORF Results
2.46 words/week
2.46 words/week
.77 words/week 1.53 words/week
.65 words/week
.94 words/week
Evaluating the Effectiveness of a School’s Reading Program
Interpreting Box PlotsInterpreting Box Plots

Harn © 2003 33
Percentile Beginning Middle DifferenceGrowth
(13 weeks)
80%ile 90 118 28 2.15
50%ile 58 82 24 1.85
20%ile 36 44 8 .62
Interpreting Box Plots: Is the Reading Interpreting Box Plots: Is the Reading Program Meeting the Needs of All?Program Meeting the Needs of All?
Harn © 2003 34
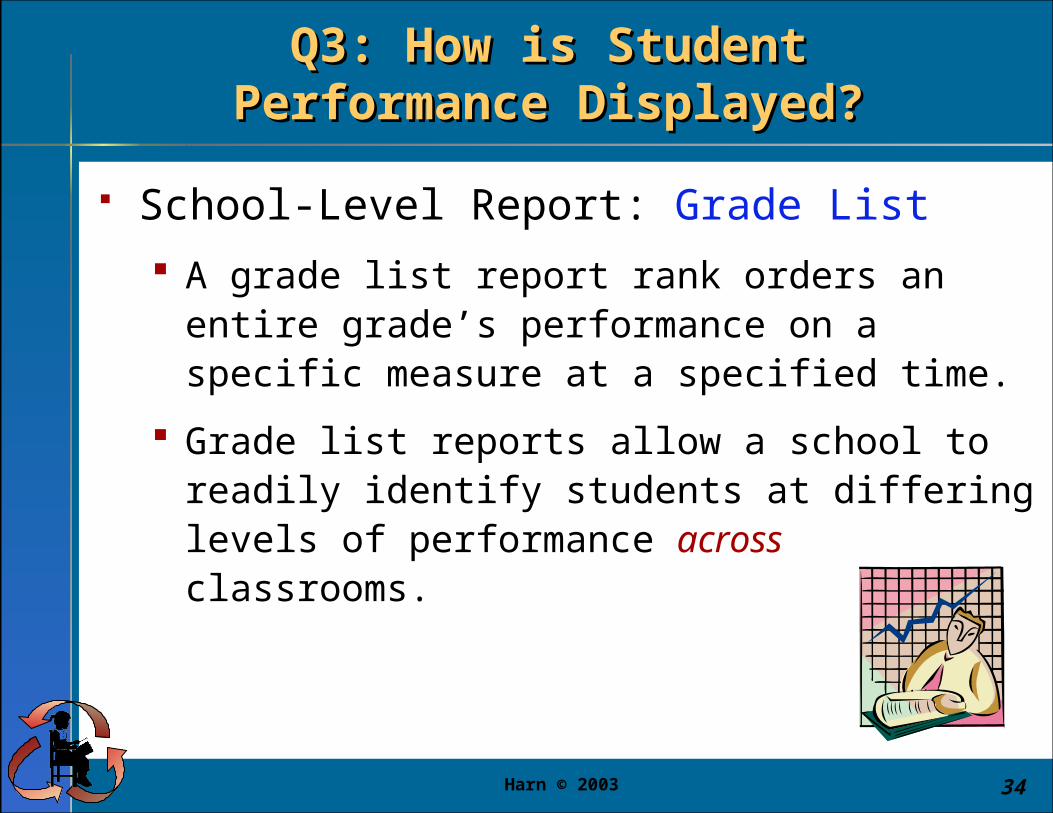
Q3: How is Student Performance Q3: How is Student Performance Displayed?Displayed?
School-Level Report: Grade List
A grade list report rank orders an entire grade’s performance on a specific measure at a specified time.
Grade list reports allow a school to readily identify students at differing levels of performance across classrooms.

Harn © 2003 35
Name
Oral Reading Fluency
Instructional RecommendationScore Percentile Status
John 1 2 At Risk Intensive - Needs Substantial Intervention
Lee 1 2 At Risk Intensive - Needs Substantial Intervention
Thomas 6 4 At Risk Intensive - Needs Substantial Intervention
Sheila 19 14 At Risk Intensive - Needs Substantial Intervention
Aaron 21 16 At Risk Intensive - Needs Substantial Intervention
Timothy 27 22 Some Risk Strategic - Additional Intervention
Tiffany 28 23 Some Risk Strategic - Additional Intervention
Jose 31 25 Some Risk Strategic - Additional Intervention
Austin 38 36 Some Risk Strategic - Additional Intervention
Kayla 40 38 Some Risk Strategic - Additional Intervention
Ashley 41 39 Some Risk Strategic - Additional Intervention
Mitchell 42 40 Some Risk Strategic - Additional Intervention
Greg 44 43 Low Risk Benchmark - At Grade Level
Darek 47 46 Low Risk Benchmark - At Grade Level
Jerry 48 47 Low Risk Benchmark - At Grade Level
Jesus 64 59 Low Risk Benchmark - At Grade Level
Melissa 68 63 Low Risk Benchmark - At Grade Level
Justin 88 80 Low Risk Benchmark - At Grade Level
Maria 89 82 Low Risk Benchmark - At Grade Level
Jake 112 92 Low Risk Benchmark - At Grade Level
Tammy 113 93 Low Risk Benchmark - At Grade Level
Which 2nd graders are in most need of instructional
support?
Example of a Grade 2 Grade List Example of a Grade 2 Grade List ReportReport

Harn © 2003 36
Class List/Teacher Report, Fall Grade 1 provides a class-level report of children’s performance on all
measures administered in relation to the goals.
Name
Letter Naming Fluency
Phoneme SegmentationFluency
Nonsense Word Fluency
Instructional RecommendationScore %ile Status Score %ile Status Score %ile Status
Casey 2 1 At risk 6 4 Deficit 0 1 At Risk Intensive - Needs Substantial Intervention
Greg 17 12 At risk 30 17 Emerging 6 6 At Risk Intensive - Needs Substantial Intervention
Cassie 15 9 At risk 17 8 Emerging 8 8 At Risk Intensive - Needs Substantial Intervention
Sandra 23 23 At risk 29 15 Emerging 15 18 Some Risk Strategic - Additional Intervention
Rachel 28 32 Some risk 30 17 Emerging 19 26 Some Risk Strategic - Additional Intervention
Ben 20 17 At risk 38 31 Established 20 29 Some Risk Strategic - Additional Intervention
Jill 59 92 Low risk 30 17 Emerging 24 39 Low Risk Benchmark - At Grade Level
Ivan 26 28 Some risk 41 39 Established 24 39 Low Risk Benchmark - At Grade Level
Katie 27 30 Some risk 31 19 Emerging 28 51 Low Risk Benchmark - At Grade Level
Erin 23 23 At risk 44 49 Established 28 51 Low Risk Strategic - Additional Intervention
Page 47 75 Low risk 38 31 Established 33 62 Low Risk Benchmark - At Grade Level
Juanita 33 42 Some risk 30 17 Emerging 49 85 Low Risk Benchmark - At Grade Level
Jose 51 82 Low risk 52 74 Established 68 94 Low Risk Benchmark - At Grade Level
Taylor 65 96 Low risk 44 49 Established 98 99 Low Risk Benchmark - At Grade Level
Q3: How is Student Performance Q3: How is Student Performance Displayed?Displayed?

Harn © 2003 37
Class list reports provide the following information for each student:
Raw scores on all measures administered Percentiles: compares a child’s performance to
other children in your school/district Skill status: Established, Emerging, Deficit or
Low, Some, At-Risk Instructional Recommendation: Benchmark,
Strategic, Intensive
Interpreting Class List ReportsInterpreting Class List Reports

Harn © 2003 38
DIBELS Instructional DIBELS Instructional RecommendationRecommendation
The Instructional Recommendation is created by analyzing a student’s performance across all of the measures administered. Provides a general description of the instructional
intensity needed for the student to achieve the next benchmark goal.
Instructional recommendation categories: Benchmark: Established skill performance across all
administered measures. Strategic: One or more skill areas are not within the
expected performance range. Intensive: One or more skill areas are significantly at-
risk for later reading difficulty

Harn © 2003 39
Name
Initial Sound Fluency Letter Naming Fluency
Instructional RecommendationScore %ile Status Score %ile Status
Roth 0 4 At Risk 0 5 At risk Intensive - Needs Substantial Intervention
Harry 0 4 At Risk 2 22 Some risk Intensive - Needs Substantial Intervention
Steve 0 4 At Risk 6 41 Some risk Intensive - Needs Substantial Intervention
Brock 7 24 Some Risk 1 15 At risk Intensive - Needs Substantial Intervention
Jess 7 24 Some Risk 5 37 Some risk Strategic - Additional Intervention
Tony 11 37 Low Risk 3 28 Some risk Strategic - Additional Intervention
Tom 12 40 Low Risk 5 37 Some risk Strategic - Additional Intervention
Daj 12 40 Low Risk 26 83 Low risk Benchmark - At Grade Level
Carrie 15 54 Low Risk 2 22 Some risk Strategic - Additional Intervention
Erin 16 58 Low Risk 18 69 Low risk Benchmark - At Grade Level
John 16 58 Low Risk 18 69 Low risk Benchmark - At Grade Level
Chris 18 64 Low Risk 24 79 Low risk Benchmark - At Grade Level
Maria 21 73 Low Risk 11 55 Low risk Benchmark - At Grade Level
Sara 23 77 Low Risk 29 87 Low risk Benchmark - At Grade Level
Jose 25 81 Low Risk 9 50 Low risk Benchmark - At Grade Level
Evan 28 85 Low Risk 3 28 Some risk Strategic - Additional Intervention
Tatiana 28 85 Low Risk 29 87 Low risk Benchmark - At Grade Level
Kindergarten Fall Teacher ReportKindergarten Fall Teacher ReportPut a box around students needing intensive Intervention
Underline students needing strategic intervention

Harn © 2003 40
Name
Letter Naming Fluency
Phoneme SegmentationFluency
Nonsense Word Fluency
Instructional RecommendationScore %ile Status Score %ile Status Score %ile Status
Casey 2 1 At risk 6 4 Deficit 0 1 At Risk Intensive - Needs Substantial Intervention
Greg 17 12 At risk 30 17 Emerging 6 6 At Risk Intensive - Needs Substantial Intervention
Cassie 15 9 At risk 17 8 Emerging 8 8 At Risk Intensive - Needs Substantial Intervention
Sandra 23 23 At risk 29 15 Emerging 15 18 Some Risk Strategic - Additional Intervention
Rachel 28 32 Some risk 30 17 Emerging 19 26 Some Risk Strategic - Additional Intervention
Ben 20 17 At risk 38 31 Established 20 29 Some Risk Strategic - Additional Intervention
Jill 59 92 Low risk 30 17 Emerging 24 39 Low Risk Benchmark - At Grade Level
Ivan 26 28 Some risk 41 39 Established 24 39 Low Risk Benchmark - At Grade Level
Katie 27 30 Some risk 31 19 Emerging 28 51 Low Risk Benchmark - At Grade Level
Erin 23 23 At risk 44 49 Established 28 51 Low Risk Strategic - Additional Intervention
Page 47 75 Low risk 38 31 Established 33 62 Low Risk Benchmark - At Grade Level
Juanita 33 42 Some risk 30 17 Emerging 49 85 Low Risk Benchmark - At Grade Level
Jose 51 82 Low risk 52 74 Established 68 94 Low Risk Benchmark - At Grade Level
Taylor 65 96 Low risk 44 49 Established 98 99 Low Risk Benchmark - At Grade Level
What is the essential
measure in Fall of 1st?
Similar performance, why different Instructional Recommendations?
First Grade Fall Teacher ReportFirst Grade Fall Teacher Report

Harn © 2003 41
Name
Oral Reading Fluency
Instructional RecommendationScore Percentile Status
Kelsey 12 2 At Risk Intensive - Needs Substantial Intervention
Tyler 25 9 At Risk Intensive - Needs Substantial Intervention
Nick 33 11 At Risk Intensive - Needs Substantial Intervention
Jemane 37 13 At Risk Intensive - Needs Substantial Intervention
Jessie 38 14 At Risk Intensive - Needs Substantial Intervention
Tim 40 15 At Risk Intensive - Needs Substantial Intervention
Jack 47 18 At Risk Intensive - Needs Substantial Intervention
Les 50 21 At Risk Intensive - Needs Substantial Intervention
AJ 54 24 Some Risk Strategic - Additional Intervention
Jon 63 31 Some Risk Strategic - Additional Intervention
Leann 76 46 Some Risk Strategic - Additional Intervention
Dan 81 52 Low Risk Benchmark - At Grade Level
Vick 83 53 Low Risk Benchmark - At Grade Level
Tom 88 59 Low Risk Benchmark - At Grade Level
Donovan 96 66 Low Risk Benchmark - At Grade Level
Vira 97 67 Low Risk Benchmark - At Grade Level
Frank 100 70 Low Risk Benchmark - At Grade Level
Wes 113 79 Low Risk Benchmark - At Grade Level
Destiny 135 92 Low Risk Benchmark - At Grade Level
Maria 148 96 Low Risk Benchmark - At Grade Level
3rd Grade Fall Teacher Report3rd Grade Fall Teacher Report
These students need instruction on significantly different reading
skills
Draw boxes around students who may have
similar instructional
needs

Harn © 2003 42
One student’s ORF Progress Across Years
Q3: How is Student Performance Q3: How is Student Performance Displayed?Displayed?
Class or Student Level Report: Individual Student Performance Profile or Student History An individual student progress summary provides both a numerical
and pictorial display of student performance on one measure across a year(s) in relation to the established goal.

Harn © 2003 43
This same student’s DIBELS scores in Kindergarten and First Grade
Monitoring Individual Student Monitoring Individual Student ProgressProgress
Beginning Middle End
Kindergarten
ISF=7 ISF=18
LNF=1 LNF=7
PSF=24
1st
PSF=59 PSF=66 PSF=40NWF=34 NWF=68 NWF=153
ORF=29 ORF=79

Harn © 2003 44
Different reports answer different questions:
Class list/Teacher reports rank order students by
instructional recommendation status from highest
to lowest
Grade list reports rank order students from
highest to lowest on the selected DIBELS
measure
Individual student performance reports all
DIBELS data collected on an individual student
across grades
Q4: How Do You Identify Students Q4: How Do You Identify Students Needing Additional Instructional Support?Needing Additional Instructional Support?

Harn © 2003 45
Using the School Summary Sheet and your Class List / Teacher Report, write the names and DIBELS scores of the students identified as needing: Strategic Instruction
Intensive Instruction
Group students with similar reading skills.
Identifying Students Needing Identifying Students Needing Additional Instructional SupportAdditional Instructional Support

Harn © 2003 46
Class and Student Level Questions: Who is the lowest reader in my class?
Class list report
Who is the lowest reader in the first grade?
Grade list report
How did my third grader perform in first grade?
Student history
Which report should I use to communicate an individual student’s reading performance to parents?
Individual student performance profiles
Each Report Helps to Answer Each Report Helps to Answer Different QuestionsDifferent Questions

Harn © 2003 47
School-Level Questions What percent of children have met the
phonological awareness goal by the end of Kindergarten?
Histogram
How is our reading program meeting the needs of all children in teaching fluency and accuracy with connected text across a school year?
Box Plot
Each Report Helps to Answer Each Report Helps to Answer Different QuestionsDifferent Questions

Harn © 2003 48
Types of reports available from dibels.uoregon.edu/
PDF Reports: Downloadable reports designed for printing. The school and district PDF reports combine the most common reports into a single file.
Web Reports: Individual reports designed for quick online viewing. Select the specific report you would like.
Enter/Edit Data
View/Create Reports
InterpretReports
Administrative Menu
MigrateStudents
System Status
FAQ
ManualContact
Information
Where Do We Get These Helpful Where Do We Get These Helpful Reports?Reports?


