Institutions, Human Capital and Entrepreneurial ...
45
Munich Personal RePEc Archive Institutions, Human Capital and Entrepreneurial Orientation (EO): Implications for Growth Strategy Mthanti, Thanti and Ojah, Kalu Wits Business School, University of the Witwatersrand, Wits Business School, University of the Witwatersrand January 2017 Online at https://mpra.ub.uni-muenchen.de/89551/ MPRA Paper No. 89551, posted 27 Oct 2018 13:48 UTC
Transcript of Institutions, Human Capital and Entrepreneurial ...

Munich Personal RePEc Archive
Institutions, Human Capital andEntrepreneurial Orientation (EO):Implications for Growth Strategy
Mthanti, Thanti and Ojah, Kalu
Wits Business School, University of the Witwatersrand, Wits
Business School, University of the Witwatersrand
January 2017
Online at https://mpra.ub.uni-muenchen.de/89551/
MPRA Paper No. 89551, posted 27 Oct 2018 13:48 UTC

1
Institutions, Human Capital and Entrepreneurial Orientation (EO): Implications for Growth
Strategy
Thanti Mthanti and Kalu Ojah
Wits Business School, University of Witwatersrand
2 St David’s Place, Parktown, Johannesburg, South Africa 2193
Abstract
Motivated by the long established postulation by Adam Smith and Joseph Schumpeter that human capital and
institutions enable Schumpeterian entrepreneurship which, in turn, facilitates economic growth, we sought to
establish a more robust empirical support for this relationship. Adopting EO (i.e., innovativeness, proactiveness
and risk-taking; Mthanti and Ojah, 2017, Research Policy, 46:4, 724-739) as the measure of Schumpeterian
entrepreneurship at the macro-level, and using a sample of 93 countries, over 1980-2008, we employ system-
GMM to investigate institutions and human capital as possible determinants of Schumpeterian entrepreneurship
(EO). We find that the human capital—EO nexus is robust across economic development levels. However, there
is a cross-country variation in the institutions—EO nexus. In line with theoretical predictions, institutions indeed
drive EO in middle-to-high income countries. However, in low income countries, building institutions in order
to foster EO yields perverse outcomes, which, for us and especially based on deeper analysis, suggest that
improving the quality of institutions may not be a necessary precondition for EO/growth policy in low income
countries. Furthermore, we find that EO is a highly persistent series, with self-reinforcing network effects; i.e.,
lofty EO behaviour encourages more lofty EO behaviour. Overall, therefore, we argue that where
Schumpeterian entrepreneurship is hampered by low private returns or poor institutional environment, a sensible
growth strategy would be to: (1) invest in human capital and (2) subsidize EO directly to exploit its network
effects.
Entrepreneurial orientation, Economic growth, Institutions, Human capital, Policy
Version: January, 2017

2
1. Introduction
The economics literature suggests that institutions and policy variables are possible
antecedents of economic growth because they enable productivity enhancing Schumpeterian
entrepreneurship (Acemoglu et al., 2001 and Glaeser et al., 2004) by increasing returns to private
endeavour. For instance, strong financial institutions may increase access to funds for Schumpeterian
entrepreneurs’ innovation and launching of new products to market (Schumpeter, 1912); and
consequently, enhancing technological diffusion and growth. Additionally, high levels of corruption
may increase uncertainty levels and transactions cost for a Schumpeterian entrepreneur and, as a
result, reduce the number of innovative and/or productivity-enhancing opportunities that are exploited
(Anokhin and Schulze, 2009). Similarly, differing levels of human capital in middle-to-high income
countries explain the cross-country variation in innovation, technological upgrading and thus catching
up with the income of advanced countries (Lee and Kim, 2009). Moreover, in a society with
distributional conflict (inequality), growth promoting activities such as the accumulation of human
capital, and the creation and diffusion of new production knowledge engendered by Schumpeterian
entrepreneurship, are likely to be constrained (Persson and Tabellini, 1991).
Based on the preceding insights, it follows that, theoretically, in both the institutions—growth
nexus, and the human capital—growth nexus, the implied causal direction is from institutions and
human capital to productivity enhancing Schumpeterian entrepreneurship; and only then to growth.
However, the broader macro-analysis literature has mainly investigated institutional variables and
human capital as direct determinants of economic growth (King and Levine, 1993, Barro, 2000,
Acemoglu et al. 2001 and Glaeser et al. 2004); and not necessarily as enablers of Schumpeterian
entrepreneurship. Yet, these variables are theorised to facilitate growth either: (1) indirectly, by
increasing the private appropriation of returns to Schumpeterian entrepreneurship through effectively
securing property rights (Knack and Keefer, 1995), and/or (2) directly, by enabling learning and the
diffusion of that learning (Devereux and Smith, 1994).
Nevertheless, scholars tend to just link institutional and human capital variables to growth
instead of establishing the causal link between growth and the hypothesized channel to growth – i.e.,
Schumpeterian entrepreneurship. This omission, in our view, may partially emanate from the tenuous`
relationship, in empirical analyses, between entrepreneurship – defined as entry density/small
business activity1 – and growth2. This inconsistent link between entry density and growth is not
1 Good examples of such measure of entrepreneurship are the Global Entrepreneurship Monitor’s (GEM) Total
Early-stage Entrepreneurial Activity (TEA) Index, the World Banks’ new business registration data, the self-employment ratio and the private employment ratio. 2 Some scholars find a positive correlation between entry density and economic growth (McMillan and Woodruff, 2002, Acs et al., 2012 and Audretsch and Keilbach, 2004); conversely, others suggest that the entry density—growth nexus is non-existent (van Stel, Carree and Thurik, 2005, Wong, Ho, and Autio, 2005 and Naude, 2011). Moreover, even the micro-economic literature on the nexus between firm age and firm

3
surprising because entry density itself is a weak proxy of Schumpeterian entrepreneurship3.
Fortunately, Mthanti and Ojah (2017) address the need for an improved macro-level proxy of
Schumpeterian entrepreneurship and devised a measure, i.e., aggregate-level entrepreneurial
orientation (EO), which is more in line with Schumpeter’s (1912) conception of what entrepreneurial
firms do: i.e., co-opting, creating, diffusing and exploiting new production knowledge.
Macro-level EO, characterised as firms’ “enhancing innovative capabilities; investing in
risky, unique and uncertain sectors; and proactively seeking new markets and advanced technology”;
may be important to countries’ learning through both imitation and experimentation (Mthanti and
Ojah, 2017). Empirically, lofty EO4 behaviour amongst firms seems a more plausible channel, than
entry density, through which institutions and human capital facilitate growth because it (EO): (1) is
positively associated with knowledge diffusion; (2) correlates positively with high levels of income,
(3) correlates positively with economic growth, and (4) it subsumes the impact of institutions and
human capital on growth (Mthanti and Ojah, 2017), as Schumpeter had theorised.
Furthermore, if institutions and human capital indeed, partially, foster economic growth
through enhancing entrepreneurship, then appropriate proxies of Schumpeterian entrepreneurship
should positively correlate with institutions and human capital. Additional support for lofty EO
behaviour amongst firms as a more plausible channel than entry density, through which institutions
and policies facilitate growth, is provided in Figure 1. As can be seen in the figure, EO closely tracks
time-varying institutional and human capital variables. On the other hand, there seems to be little
association between proxies of entry density (GEM’s Total Early-stage Entrepreneurial Activity
[TEA] and the World Banks’ new business registration data) and, institutional and human capital
variables. These divergent relations are further corroborated by the correlation matrix in Table 1: EO
is a robust correlate of human capital and institutional variables; while, conversely, entry density
proxies are either not as robust or are negatively related to human capital and institutional variables.
Insert Figure 1
Insert Table 1
productivity shows that: (1) productivity increases with firm age, and (2) new firms die young (Shane, 2008). Based on these macro- and micro-level findings, it is self-evident that the hypothesized channel (if represented as entry density) through which institutions and human capital are deemed to facilitate growth may itself not be a consistent correlate of growth. 3 In the Schumpeterian model, entrepreneurs engage in innovation, risk-taking and business activities that lead to knowledge spill-over, new combinations and technological progress (Audretsch and Feldman, 1996); thus, facilitating economic growth. However, entry density indicators correlate negatively with measures of innovation, risk-taking and knowledge diffusion (Henrekson and Sanandaji, 2013), which Schumpeterian entrepreneurship is meant to engender. Based on the foregoing, it follows that small business activity is an inadequate measure of aggregate level Schumpeterian entrepreneurship. 4 Note that we use the terms Schumpeterian entrepreneurship, Macro-level EO and lofty EO interchangeably because we consider them all to reflect Schumpeterian entrepreneurship.

4
Therefore, based on a comprehensive review of the literature and preliminary correlational
and trend analyses, which suggest lofty EO behaviour amongst firms might be (1) a more appropriate
proxy of Schumpeterian entrepreneurship and consequently (2) a more plausible channel through
which institutions and human capital shape growth, it follows that understanding the possible
correlates (or more intuitively, antecedents) of EO is vital for clarifying the institutions— and/or
human capital—growth nexus5. However, EO has hitherto been researched mainly as purely a firm-
level phenomenon. And although firm-level antecedents of firm-level EO such as firm size,
technology, the personality of the founder/CEO and environmental hostility have been identified
(Rauch et al., 2009); the empirical macro-level literature gives us little guidance on the association
between aggregate level EO and its potential drivers6.
For instance, for us, it is not self-evident that different personality types of founders/CEOs
would explain cross-country variations in macro-level EO. So, there seems to be a clear research gap
which is a significant omission particularly since entrepreneurial processes (such as macro-level EO),
as Schumpeterian theory submits, are expected to manifest differently across: (1) different
institutional and policy set-ups, and (2) different levels of income (development)7. In this paper, we
address this gap and build on Mthanti and Ojah’s (2017) work; recasting human capital and
institutional variables as correlates/antecedents of macro-level EO, instead of growth, as is
traditionally done in the growth literature.
However, the characterization of Schumpeterian entrepreneurship as entry density creates an
awkward difficulty in identifying potential determinants of EO since what are in the literature
considered drivers of entrepreneurship may merely be determinants of entry density8. This attribution
is problematic because the empirical evidence suggests that entry density correlates negatively with
measures of productivity, innovation and knowledge diffusion, as well as EO itself9. All the same, the
literature suggests that there are instances, particularly in countries transitioning from communism
(planned economic system) to a market driven economic system, where entry density may embody
5 This clarification is important because the said nexus may largely be shaped by Schumpeterian entrepreneurship.
6 EO has hitherto been researched mainly as a firm-level phenomenon. And although firm-level antecedents of firm-level EO such as firm size, technology and environmental hostility have been identified (Rauch et al., 2009); the association between macro-level EO and its potential drivers has yet to be researched.
7 In fact, Lee and Kim (2009) argue that there are two stages of development. The first one involves the transition from low-to-middle income, and that Schumpeterian entrepreneurship in this stage might be facilitated by improving institutions and primary/secondary education. The second stage involves transitioning from middle-to-high income and technological upgrading, where growth in this stage involves improving mainly policy variables and tertiary education. 8 For example, culture (Hofstede, 2010), the protestant work ethic (Weber, 2002), self-efficacy (Markman et al., 2002), etc., which are linked to entry density, would also, erroneously, be assumed antecedents of entrepreneurship. 9 The TEA and new business density correlate negatively or insignificantly, with entrepreneurial orientation, with a Pearson correlation coefficient of -0.38 (p<0.01) and 0.09 (p<0.10), respectively.
5
Schumpeterian entrepreneurship, and as a consequence correlates positively with productivity and
knowledge diffusion, both of which Schumpeterian entrepreneurship engenders10. In these ex-
communist economies, new firms are the main drivers of structural transformation and reform
(Johnson et al., 1999, McMillan and Woodruff, 2002, Audretsch and Keilbach, 2004 and Berkowitz
and Dejong, 2005) because existing large firms are usually rigid former planning institutions that must
be transformed before they can begin to embrace lofty EO behaviour (Estrin et al., 2006).
By deduction, the correlates of entry density in transition economies may very well be
potential correlates of risk-taking, innovativeness and proactiveness, generally, since they engender
growth by facilitating Schumpeterian entrepreneurship11. In fact, the growth literature on transition
economies finds that the effectiveness of facilitating technology diffusion and growth is shaped
particularly by: (1) human capital (Berkowitz and Dejong, 2005 and Aidis and Sauka, 2005), (2) the
availability of finance (e.g., banking development) (Johnson et al., 1999 and Pissarides 2004), (3) the
control of corruption (Johnson et al., 1999; and Djankov et al., 2005) and (4) inequality (Glaeser et al.,
2003). The broader macro-analysis literature has, however, mainly investigated these institutional
variables (banking development, corruption, and inequality), and human capital, as direct
determinants of economic growth (King and Levine, 1993, Barro, 2000, Acemoglu et al. 2001 and
Glaeser et al. 2004); and not, necessarily, as enablers of Schumpeterian entrepreneurship.
Therefore, we more specifically address this omission by investigating whether banking
development, corruption, and inequality, and human capital that have been hereto identified as critical
drivers of knowledge diffusion in transition economies; also, partially, explain more broadly the
cross-country variation in Schumpeterian entrepreneurship (macro-level EO). We ask: (a) do
institutions or human capital enhance/correlate positively with Schumpeterian entrepreneurship (EO)?
And (b) does the impact of institutions and human capital on EO vary with the level of economic
development? That is, are the hitherto said determinants of growth (e.g., quality institutions and good
policies) positive correlates of the hypothesized channel of growth, Schumpeterian entrepreneurship,
across all levels of development? And what is the true place of these correlates in the economic
10 Berkowitz and Dejong (2005) suggest that entrepreneurs in former socialist countries have enhanced productivity in construction, trade, commerce, small-scale manufacturing and services. 11
Therefore, for institutional variables, we relied on banking development, inequality and corruption instead of
Polity IV Project (Jaggers and Marshall’s, 2000); International Country Risk Guide (ICRG) (Acemoglu et al.,
2001); etc. In particular, the control of corruption and inequality are appropriate proxies of institutions because, firstly, unlike governance measures, they are more likely to have a direct association with EO (Asiedu and Villamil, 2000; and Wei, 2000). For example, innovation, risk taking and proactiveness can take place in an autocracy, such as China or a democracy, such as Sweden. However, corruption in either of these countries would alter the calculus of entrepreneurial firms. They would have to decide whether to use valuable resources on rent seeking and bribery or on innovation and risk taking. Similarly, inequality occasioned by arbitrary discrimination alters the opportunity set faced by talented individuals from minority groups. Exclusion from educational opportunities and business leadership reduces both the human and entrepreneurial capital stock, with possibly dire consequences for lofty EO behaviour amongst firms.

6
growth calculus in (1) low income countries that are transitioning to middle income and (2) in middle
income countries that are transitioning to high income? The clarification of this overarching question
would, no doubt, better inform a more effective framing of growth policy or sequencing/prioritizing
of growth antecedents.
Our results show that the human capital—EO nexus is robust across diverse levels of
development. However, the institutions—EO nexus seems conditional on the level of economic
development (income). In line with theoretical predictions, institutions indeed drive EO in middle-to-
high income countries; but in low income countries, institution building that seeks to foster EO may
yield perverse outcomes. Importantly, the institutions— and policies—EO associations, which
virtually replicate the institutions— and policies—growth relationships, coupled with EO explaining a
large degree of unique variance in growth, even at low levels of productive capabilities, support the
notion that EO is indeed an important conduit through which institutions and policies engender
growth. By implication, therefore, although improving the quality of institutions is critical for EO and
growth in middle-to-high income countries; it may not be a necessary precondition for EO and growth
in low income countries; especially since: (1) EO may very well lead institutional development in low
income countries and (2) EO is a highly persistent series with self-reinforcing network effects; in
other words, lofty EO behaviour encourages more lofty EO behaviour.
Our work is closely related to the emerging literature that seeks to explain why
entrepreneurial and innovative activities differ systematically across countries due to cross-country
variations in institutions and policies (Autio et al., 2014, Acs et al., 2017 and Lehmann and Seitz,
2017). In this literature, the National Systems of Entrepreneurship (NSE) framework clarifies how
differing national policies, and formal and informal institutions, shape cross-country variation in
individual entrepreneurial endeavour (Acs et al., 2014); and the National Systems of Innovation (NSI)
(Nelson, 1993) explains the effect of national institutions and policies on cross-country variation in
R&D and innovation. We add to this literature by clarifying the impact of national institutions and
policies on cross-country variation in what entrepreneurial firms actually do: that is, innovate, take
risks and proactively acquire both new technology and markets (i.e., EO). Importantly, we do not
(erroneously in our view) use firm age, or for that matter invention alone, as a cross-country proxy of
Schumpeterian entrepreneurship12.
12 In our view, both the NSI and the NSE frameworks present rooms for improvement: (1) the NSI framework implicitly assumes firm age/size is an appropriate proxy for knowledge diffusion and (2) the NSE framework assumes diffusing new production knowledge equates to invention. However, Schumpeter (1912) cautioned that, as long as entrepreneurial firms do not assume risks and proactively diffuse production knowledge, inventions maybe economically irrelevant. And it follows that merely counting the number of new firms and/or the number of self-employed individuals or group of individuals will tell us very little about innovation, risk-taking and proactiveness and, consequently, tell us little or nothing about economic growth.

7
So, overall, the main unique contributions of our paper are: (i) explicating the potential
macro-level correlates/drivers of macro-level EO, which may be quite distinct from antecedents (or
correlates) of firm-level EO (e.g., firm age); and (ii) positioning more productively the role of
Schumpeterian entrepreneurship vis-à-vis other linked correlates of growth in the calculus of
economic growth at varying levels of development. This better placement or sequencing of growth
antecedents, whilst accounting for context, would, no doubt, improve future growth
strategies/policies13. To this end, we directly link human capital and institutional variables to the
channel through which they are hypothesized to enhance growth – i.e., Schumpeterian
entrepreneurship. Additionally, we further buttress the development of EO as an improved aggregate
level construct (proxy) by clarifying: (1) the human capital—EO nexus and (2) the institutions—EO
nexus, across different levels of economic development.
For the remainder of the paper, Section 2 explores the literature that underpins potential
antecedents of Schumpeterian entrepreneurship (EO), alongside hypotheses of their expected relations
to EO. Section 3 discusses the research design and the estimation techniques used in the analyses
conducted. Section 4 presents and discusses the documented results. Section 5 contains further
discussion of results, with concluding remarks that highlight key policy derivatives of our findings.
2. The determinants of EO
2.1 Corruption
The corruption—growth relation has been investigated extensively; however, the literature
has not definitively resolved whether corruption hinders or facilitates economic development. There
are basically two main theories: sanding the wheels and greasing the wheels hypotheses. The sanding
the wheels hypothesis views corruption as an impediment to development, entrepreneurship and
growth since in corrupt countries the rewards to entrepreneurial endeavour may not accrue to the risk
taker (Méon and Sekkat, 2005), which in turn may hinder productivity and growth (Lambsdorff,
2003).
This point of view, hitherto, has some empirical support (Mauro, 1995). Cross-country
regressions suggest that the operating channels through which corruption may influence growth are:
reduced foreign direct investment (Wei, 2000), entrepreneurship (Johnson et al., 1999; and Djankov et
al., 2005) and openness (Pellegrini and Gerlagh, 2004). And Mo (2001) suggests that this association
is economically important — a 1% increase in corruption reduces the growth rate by about 0.72%.
13
For instance, there is likely to exist resource demand (and thus cost) differential between provisioning the “encompassing” Schumpeterian entrepreneurship (EO), and provisioning a single or a couple of institutions and/or human capital variables that are ascertained to empirically relate to economic growth. Further, besides the cost differential, the questions of which of these two groups of antecedents have more economic and sustainable effects on growth, and at what level of a country’s development either of these groups of antecedents elicit incremental growth, remain so important that they should also inform a more effective growth strategy.
8
However, Ehrlich and Lui (1999), supporting the greasing the wheels hypothesis14, question the
positive relationship between reduced corruption and growth in developing countries. They contend
that higher corruption does not necessarily have a negative impact on economic growth. Instead,
corruption may positively mediate the relation between growth and bureaucratic inefficiency such
that, in developing countries with inefficient administration, corruption may facilitate
entrepreneurship and economic activity (Aidt, Dutta and Sena, 2008 and Méon and Weill, 2010).
Olken (2005) suggests that the inconsistent corruption—growth link may not merely be due to
poor institutions in developing countries; instead, it may be due to measurement error — i.e., the
majority of empirical studies do not measure objective corruption; rather, they calibrate people’s
subjective perceptions of corruption. He, therefore, cautions against using perception-based indicators
to measure corruption in countries that are not socially cohesive, as this may lead to results that do not
reflect effects of objective corruption15.
In sum, this literature suggests that corruption facilitates growth through the productivity
channel by increasing the private appropriation of returns to Schumpeterian entrepreneurship/EO
(Knack and Keefer, 1995). It follows that reduced levels of corruption and arbitrary discrimination
would support EO. However, in developing countries, due to bureaucratic inefficiency and arbitrary
discrimination, higher levels of corruption may, counterintuitively, facilitate EO. Therefore, the
hypothesised positive association between the control of corruption and EO may be conditional on:
(1) social trust and (2) on the level of development.
2.2 Banking (financial) market development
Theoretically, financial institutions are important because they evaluate and finance
entrepreneurs’ innovation and launching of new products to market (Schumpeter, 1912), as well as
ease the pooling, trading and hedging of risk which encourages investment in projects with high risk
and corresponding high expected returns (Devereux and Smith, 1994 and Obstfeld, 1995).
Empirically, financial depth16 facilitates the diffusion of new productive knowledge (Gemünden et al.,
1992) and, as a result, accelerates economic growth through a large positive effect on total factor
productivity; however, the association with physical capital, private savings rates and labour are
questionable (Beck et al., 2000). Essentially, better financial intermediaries enhance the chances of
14
This hypothesis posits that corruption may help bypass poor governance, thereby smoothing investment and Schumpeterian entrepreneurship, and consequently, growth (Huntington, 2006). 15
However, they may reflect results based on perceptions since people act based on their perceptions. And therefore, although the objective corruption—growth nexus may not be robust, the perceived corruption—growth negative association might hold. 16 Measured by credit to the private sector as a share of GDP; the rationale is that private credit is more likely, than public credit, to accurately reflect the financial intermediation and investable funds allocative roles that the banking sector play.

9
successful innovation and knowledge diffusion (King and Levine, 1993, Jayaratne and Strahan, 1996).
Consequently, countries with high levels of financial development, and effective institutions, are
better able to support the growth of innovative industries that are largely reliant on external finance
(Rajan and Zingales, 1998 and Beck et al., 2008). On the other hand, financial development does not
have a positive impact on growth in countries with weak institutions (Demetriades and Hook Law,
2006), double digit inflation (Rousseau and Wachtel, 2002 and Yilmazkuday, 2011) and small
financial sectors (Deidda and Fattouh, 2002).
Developing countries with low levels of financial development are thus unable to support
infant industries since their firms are credit and equity rationed (Ayyagari et al., 2008). And these
financial sector distortions can reduce the rate of innovation and inhibit Schumpeterian
entrepreneurship/EO (King and Levine, 1993). From this likely relationships, it follows that banking
development may hinder economic growth in developing countries (Zhang, 2003 and Shen and Lee
2006). Levine (2002) suggests that these counterintuitive results could be because: (1) banks with
market power may extract a greater share of future profits from firms than they should; (2) banks are
conservative and thus a large banking sector relative to GDP may hinder firm innovation and growth;
and (3) in firms with poor cooperate governance, banks may connive with corrupt managers if these
managers do not serve the firms’ interests (Black and Moersch 1998). In other words, where
corruption is high and the courts are ineffective, banking development might be irrelevant to
Schumpeterian entrepreneurship/EO (Johnson et al., 1999).
Our synthesis of the financial development literature suggests that banking development
would support EO by: (1) evaluating and financing Schumpeterian entrepreneurs’ innovation and
proactive knowledge diffusion; and (2) easing the trading, pooling, hedging and diversification costs
of entrepreneurial innovation and risk taking. However, this positive association with EO may be
conditional on: (i) the control of corruption and inequality, and (ii) level of economic development.
2.3 Human capital
Glaeser et al. (2004) highlights the importance of human capital accumulation for economic
development. Human capital is deemed to facilitate growth by enhancing the ability of a country to
imitate and learn advanced technologies that originate from within, and offshore (Stokke, 2008);
increasing the absorption of spill-overs from FDI (Borensztein et al., 1998); and significantly
increasing entry by knowledge-based Schumpeterian firms (Baptista and Mendonça, 2010), which,
through EO, generates a higher rate of total factor productivity growth. This argument, which views
an educated workforce as a critical prerequisite for Schumpeterian entrepreneurship and growth, has
found mixed empirical support. Larroulet and Couyoumdjian (2009) find that a high stock of human

10
capital enhances economic growth, as was supported by Glaeser et al. (2004) who record that
schooling enables total factor productivity growth (Benhabib and Spiegel, 1994).
However, some empirical growth studies find an insignificant or negative association between
schooling and economic growth. For instance, Benhabib and Spiegel (1994) and Pritchett (2001) show
that educational attainment does not explain the growth rate of output per worker. To explain these
seemingly contradictory findings on the human capital—growth nexus, literature posits that these
inconsistent findings may be due to data and methodological differences (Bils and Klenow, 2000 and
Cohen and Soto, 2007). Furthermore, there might be economic reasons for these conflicting results —
corruption, black market premium and brain drain may render human capital unproductive (Rogers,
2008). Thus, the positive impact of human capital on Schumpeterian entrepreneurship, productivity
and growth may not manifest in an economy until such time that it reaches a certain threshold level of
development (Ahsana and Haque, 2015). However, Coco and Lagravinese (2014) argue that even
developed countries may not enhance entrepreneurship and productivity through schooling since
cronyism, and corruption, may reduce the motivation to develop cognitive skills.
In sum, the literature suggests that a workforce that is good at learning, creating, and
implementing new production knowledge may support productivity enhancing EO. However, this
positive association between schooling and EO might be more likely when: (1) corruption and
cronyism are low and (2) the level of development is relatively high.
2.4 Inequality
The proactive actions necessary to attack new markets and appropriate technology require
purposeful cohesive action that is more likely in relatively more equal societies with agreed upon
long-term objectives than in both less equal and less cohesive societies. Moreover, in many unequal
societies the existence of unproductive, rent-seeking, parasitic elites may frustrate entrepreneurship
(Baumol et al., 2007), and growth promoting activities. For this reason, the accumulation of capital
and the production of knowledge in unequal countries are likely to be constrained (Persson and
Tabellini, 1991), and consequently reduce economic growth (Alesina and Rodrik, 1994 and Baumol et
al.’s 2007).
However, this hypothesised negative association between inequality, Schumpeterian
entrepreneurship and growth may not be robust. For instance, Forbes (2000) finds a positive
relationship between inequality and growth. Barro (2000) suggests that the impact of inequality on
growth depends on the level of development — inequality lowers growth only in poor countries,
whereas it promotes growth in developed countries. Shin (2012) explains Barro’s (2000) findings by
suggesting that in developed countries the rich save more than the poor, thus enabling the capital
11
accumulation necessary for growth. On the other hand, in volatile and poor countries, income
inequality may lead to redistributive political and social policies that lead to a decline in
Schumpeterian entrepreneurial endeavour.
In a similar vein but on a different note, Glaeser et al. (2003) suggest that the impact of
inequality on growth may not be direct; but rather indirect — through its negative impact on
institutions. Inequality in economies with weak institutions may allow the rich to subvert legal,
political and regulatory institutions, which are critical for protecting Schumpeterian entrepreneurs’
property rights; thus, resulting in sub-optimal economic outcomes (Knack and Keefer, 1995). In sum,
the literature suggests that inequality, entrepreneurship and growth relation may not be determinate.
Inequality may facilitate the accumulation of funds necessary for risk taking and thus supporting EO;
on the other hand, income inequality may also lead to redistributive policies that threaten the property
rights of Schumpeterian entrepreneurs, leading to a decline in EO. However, and despite the
indeterminate inequality—growth relation, inequality still might be an important intervening variable
that shapes the institutions—EO relationship.
3. Research Design
In order to clarify the aggregate level association between EO and its potential drivers, we use
secondary, longitudinal, panel data that contains both cross-sectional and time series elements. The
dataset is constructed from the Castellacci and Natera (2011) (CANA) panel database and the World
Development Indicators (WDI). Our sampling frame is the 134 nation states that have been in
existence for more than 10 years and are represented in both the CANA and the World Bank’s WDI
databases. The complete useable sample covers data on 93 countries over the period 1980-2008.
3.1 Independent variables
Our independent variables are the variables: banking development, control of corruption and
inequality (representing institutions), and human capital. First, following Čihák et al. (2012), we adopt
the private credit to GDP ratio in order to operationalise banking development. To calibrate economic
well-being gulfs in nation states, we employ the Gini coefficient (Rodrik, 1999). Next, to calibrate
corruption, we follow Olken and Pande (2011) and employ the Corruption Perception Index from
Transparency International, which ranges from 0 (indicating high corruption) to 10 (indicating low
corruption). We term this indicator the control of corruption in order to simplify analysis. The
variables employed in creating this indicator include: the frequency of bribes, the size of bribes and
political corruption by national leaders (Anokhin and Schulze, 2009).
Importantly, we use the control of corruption and inequality as proxies of institutions mainly
because unlike governance measures they have a direct association with EO (Asiedu and Villamil,

12
2000 and Wei, 2000). For example, innovation, risk taking and proactiveness can take place in an
autocracy such as China or a democracy, such as Sweden. However, corruption in either of these
countries would alter the calculus of entrepreneurial firms. Firms would have to decide whether to use
valuable resources on rent-seeking and bribery or, more productively, on innovation and risk taking.
The same holds for inequality. Banking (financial) development can be said to embody
legal/regulatory effectiveness that particularly foster appropriate contracting and recourse guarantees,
which naturally enable financing of entrepreneurial activity (La Porta et al., 1997; and Beck and
Levine, 2004)
Lastly, and analogous to Lee and Kim (2009), we operationalise the level of human capital by
using both the secondary and tertiary education enrolment ratios. Lee and Kim (2009) suggest that
tertiary and secondary educations have a divergent impact on EO, depending on the level of economic
development; therefore, we investigate both these indicators as determinants of EO.
3. 2 Dependent variable
Mthanti and Ojah (2017) employ exploratory factor and correlation analysis to confirm both
the dimensionality and validity of the sub-constructs of EO as well as of EO itself (Hair et al., 2010).
Innovativeness is validated as a composite of innovative input, scientific output and technological
output using investments in R&D, the number of scientific and technical journal articles published per
million people and US patents granted per country of origin as indicators, respectively. Proactiveness
is established as a construct that best reflects the activities of search and discovery at the international
level; implying that firms in a pro-active country (e.g., Singapore) will seek out new and/or
productive technology, export and internationalising opportunities more than firms in countries that
are insular, such as Iran.
Mthanti and Ojah (2017) follow Pietrobelli’s (1996) theorising and adopts FDI, the
export/GDP ratio, internet users per 1000 people and royalty and license fees payments as measures
of proactiveness. Risk taking is empirically confirmed as capital accumulation in highly uncertain
sectors using three indicators: Adjusted (reverse scored) agricultural value-added17, the domestic
savings rate and gross investment. Adjusted agricultural value-added reflects the propensity to
diversify and invest in risky sectors, the domestic savings rate reflects the ability to do so over time
and gross investment is an imperfect measure of the magnitude of investment. Hence, we use all three
variables to operationalise risk taking.
17
The agriculture sector includes forestry, hunting and fishing, cultivation of crops and livestock production. Summing up the sector’s output and subtracting intermediate inputs yield “agriculture value-added”. It is therefore clear to see that reverse-scoring this value-added reflects a country’s extent of participation in newer and more uncertain production sectors than in the more familiar, if not certain, agriculture sector – i.e., the reverse-scoring of agriculture sector’s production technology reflects risk-taking.

13
With the sub-constructs of EO defined and validated, Mthanti (2017) proceeds to confirm EO
at the aggregate level as a reflective, unidimensional, second-order latent construct with three
indicators that covary: risk taking, innovativeness and proactiveness. These three variables load
significantly on the same factor, and construct validity is established by showing that EO has a higher
correlation with high technology exports than high technology exports has with any of EO’s sub-
constructs.
3.3 Descriptive statistics
Table 1 displays the mean, standard deviation and rank of EO for a set of purposefully
selected countries between 1980 and 2008. The means of the hypothesized determinants of EO are
also displayed. The top 10 EO countries are all high income countries, with Singapore achieving the
highest average EO score over 29 years; and they all score highly on the control of corruption,
banking (financial) development and tertiary education. However, Singapore scores quite low on
inequality with a Gini Index of 46.02, which is substantially above the sample average of 37.56.
Former Soviet Bloc countries, the Czech Republic and Slovenia rank highly on EO, equality
and tertiary education enrolment indicators, exceeding some developed countries; for instance, the
United Kingdom. Likewise, China scores highly on EO at number 31, realising a higher grade than
both Portugal and Russia. However, China’s performance on the determinants of EO is mixed. It
ranks very poorly on corruption and tertiary education, achieving scores well below the sample
average, whereas it attains a high score on equality and access to credit by the private sector.
Insert Table 2
On the other hand, African countries attain very low scores on EO and its determinants, with
Lesotho and Ethiopia ranking last and second last, respectively. South Africa is ranked in the middle,
number 52 out of 93 countries. The country seems to have a similar profile to Latin American
countries such as Chile, Brazil, Argentina and Uruguay. They all attain average EO scores of around
zero, have high inequality, well-developed financial systems and are moderately corrupt. However,
whereas the Latin American group tends to score highly on tertiary education enrolment, South Africa
performs poorly on this measure. Figures 1 to 3 illustrate tertiary education, domestic credit and EO
trends, respectively in selected countries. The figures show that countries that have high human
capital as well as developed banking systems seem to attain a high EO.
Insert Figure 2
Insert Figure 3

14
Insert Table 3
Table 3 presents the correlations between EO, its sub-constructs – innovativeness, risk-taking
and proactiveness and its hypothesized determinants – control of corruption, inequality, domestic
credit and the human capital variables. EO is significantly and positively (p<0.00) correlated to the
control of corruption, domestic credit, tertiary and secondary education enrolments; and as expected,
it is negatively related to the Gini index. Similarly, the sub-constructs of EO, innovativeness, risk-
taking and proactiveness, are positively (p<0.00) correlated to the control of corruption, domestic
credit, tertiary and secondary education enrolments, whereas they are also negatively related to the
Gini index. Interestingly, EO has a higher association with both human capital variables than its sub-
constructs; this outcome further enhances the reliability and nomological validity of this variable.
Insert Table 3
3.4 Estimation methodology
We begin by evaluating whether corruption, inequality, banking development and human
capital are positively related to EO. EO is composed of several persistent series such as R&D and
FDI; therefore, lagged EO is likely to be associated with current EO. In addition, entrepreneurship and
institutional variables may be possibly endogenous because of omitted variables and reverse causality
(Li et al., 2012). For example, banking development might be occasioned by financial institutions
with a high EO, using innovative methods to increase credit availability to the private sector.
Likewise, countries with a high EO might attain a higher stock of human capital — e.g., a high EO
may increase demand and, as a result, increase wages for knowledge workers in innovative sectors.
Workers may in turn respond to these increased returns to education by staying longer in
school. Hasan and Tucci (2010) suggest that such endogeneity can be reasonably ameliorated by the
Generalized Method of Moments (GMM) procedure for panel estimation. Roodman (2009) suggests
that system-GMM with a linear functional relationship, an autoregressive dependent variable, fixed
country effects, heteroskedasticity and autocorrelation are appropriate for our kind of dataset. We
therefore adopt the system-GMM estimators to analyse our data. The equation takes the following
form:
𝐸𝑂𝑖𝑡 = 𝛼0 + 𝛼1𝐸𝑂𝑖𝑡−1+ 𝛼2𝐶𝑜𝑟𝑟𝑢𝑖𝑡 + 𝛼3𝐹𝑖𝑛𝐷𝑒𝑣𝑖𝑡 +𝛼4𝑆𝑜𝐶𝑜𝑖𝑡 + 𝛼5𝐻𝑢𝑚𝑎𝑛𝐶𝑎𝑝𝑖𝑡
+ 𝛼6𝜃𝑖 +𝛼7𝑍𝑡 + 𝜀𝑖𝑡 , (1)
where EOit is entrepreneurial orientation in country i at time t, the lag EOit-1 represents the expected
persistence of EO as we would expect it to manifest over time and takes into account serial

15
correlation, CORRUit represent our measure of corruption, FINDEVit measures financial development,
SOCOit calibrates social cohesion and HUMANCAPit represents human capital. In addition, 𝜃i is the
measure of time-invariant country fixed effects, Zt is the vector for time dummies and 𝜀𝑖𝑡 represents
the random error term.
3.4.1 Reliability and validity
Blundell and Bond (1998) suggest that, in system-GMM, instrument validity can be
ascertained by employing the Sargan test of over-identifying restrictions and autoregressive (AR) test
which examines serial correlation in the error terms in both the difference regression and the lagged
difference-level regression. The differenced error term is permitted to be to be AR (1). However, AR
(2) serial correlation in the differenced error term contravenes the assumption of the GMM technique.
Therefore, following Hasan and Tucci (2010), if the p-values of the AR (2) test and the Sargan test are
not significant (>0.05), we will not reject the null hypotheses of over-identification and no second
order autocorrelation of error terms.
Although the Sargan test and the AR (2) test are helpful in determining the validity of
instruments, Roodman (2009) submits that in dynamic GMM, a high instrument rank can lead to
endogenous variables being over-fit and the power of the Sargan test being reduced. To ensure
instrument validity, the ratio of the number of cross sections (n) to the instrument rank (r) should be
greater than 1, since an r < 1 increases the chances of the regression yielding spurious results.
Following Asiedu and Lien (2011), we report the instrument count and r for all our regressions and
where r < 1, we reduce the instrument rank by restricting the number of lags of the dependent variable
that can be used as instruments.
4. Estimation Results
4.1 System-GMM results
Table 4 reports the correlation matrix of the independent (and control) variables. The pairwise
correlation coefficients show that multicollinearity may be a problem between the human capital
variables (0.78); and between wealth (log of GDP) and the control of corruption (0.82) as well. We
take cognizance of these in our estimations.
Insert Table 4
Table 5 reports results of the system-GMM regressions for the whole sample. The log of GDP
per capita in 2005 US dollars is included as a basic control variable, and EO is the dependent variable.
The Sargan and AR (2) tests are satisfactory and, furthermore, r > 1 in all the regressions; thus,

16
suggesting that the Sargan test has sufficient power and the instruments are valid. The estimated
coefficient of lagged EO is positive and significant (p<0.01) across all models, justifying our decision
to use the system-GMM estimator. The control variable, log of GDP, also carries a positive sign
which is significant across all models. Model (1), in Table 5, suggests that the control of corruption
(the only independent variable included) is negatively related to EO (p<0.01).
However, when we control for inequality in Model (5), the coefficient of the control of
corruption changes sign and becomes positive (p<0.01). This positive association between EO and the
control of corruption, contingent on inequality, is both in line with literature (see section 2) and robust
to the inclusion of domestic credit, tertiary and secondary education as independent variables. These
results seemingly provide support for the assertions that: (1) perceptions of corruption may be
influenced by social trust (Olken, 2005); and (2) inequality might be an important intervening variable
that shapes institutions (Glaeser et al., 2003).
Insert Table 5
Model (2) indicates a negative relationship between domestic credit to the private sector and
EO (p<0.05). However, when we control for reduced corruption and inequality in model (7), the sign
of the coefficient of domestic credit changes from negative to positive (p<0.01). This outcome is
robust to controlling for human capital and wealth, and aligns with King and Levine’s (1993)
assertion that better financial intermediaries enhance the chances of successful innovation and
knowledge diffusion; and that this result is however, and in line with expectation from literature
(section 2), conditional on effective institutions that reduce corruption and inequality (Demetriades
and Law, 2006).
Next, we evaluate the relation between human capital variables and EO (model 3). The
tertiary education variable is negatively associated with EO (p<0.01), whereas on the other hand,
secondary education is positively related to EO; and this association is robust to the inclusion of
domestic credit, inequality and wealth as predictors (model 9). From these results we can infer that (1)
schooling is a robust predictor of EO, supporting Glaeser et al.’s (2004) assertion that human capital
accumulation enables total factor productivity growth; (2) secondary education is a more robust
predictor of EO than tertiary education; and (3) significantly, inequality and corruption do not seem to
negatively affect the EO—human capital association.
In model (4) we investigate the relation between inequality and EO, which we find to be
negative (p<0.01). However, when we include the control of corruption and banking development in
model (8), the relation becomes positive and significant (p<0.01). This result is robust to the inclusion
of the human capital variables in model (9) as well as wealth in model (10); this set of outcomes
seemingly suggests that as much as inequality may shape the institutions—EO relation (Glaeser et al.,

17
2003), reduced corruption and a well-developed banking system may also ameliorate the negative
impact of inequality on EO.
4.2 Results by income (development) levels
The results of the whole sample may provide incomplete insight into the examined relations
since (1) Schumpeterian growth theory postulates that policies and institutions may affect EO
differently according to income (development) levels (Lee and Kim, 2009) and (2) our review of
literature strongly suggests that besides institutional quality, the impact of human capital, banking
development and corruptions on EO might also be conditional on the level of development. In fact,
Lee and Kim (2009) argue that that there are two stages of development—the first one involves the
transition from low-to-middle income and Schumpeterian entrepreneurship in this stage might be
facilitated by improving institutions. The second stage involves transitioning from middle-to-high
income and technological upgrading and growth in this stage involves improving mainly policy
variables. So, we pay heed to context, follow Lee and Kim (2009), and categorise countries whose
GDP per capita in 2000 is higher than US $3000 as middle-to-high income countries, whereas
countries whose GDP is lower than US $3000 are classified as low income countries.
Tables 6 and 8 present the correlation matrices of the independent and control variables for
middle-to-high income countries and low income countries, respectively. Once again, the association
between the human capital variables (0.70), and wealth and the control of corruption (0.75), may
indicate potential problems with multicollinearity in middle-to-high income countries. On the other
hand, in low income countries the correlations between all the independent variables, except for
human capital indicators (0.82), are largely in single digits.
Insert Table 6
Insert Table 8
Tables 7 and 9 present the results of the system-GMM regressions of EO determination for
middle-to-high income countries and low income samples, respectively. We drop the log of GDP per
capita in 2005 US dollars as a control variable since we have divided the sample into two subsamples,
based on income (development) levels. However, we use wealth as a robustness measure in models 10
(Table 7) and 11 (Table9). EO remains the sole dependent variable. The Sargan and AR (2) tests in all
system-GMM regressions are not significant (p >0.05); therefore, we cannot reject the null hypotheses
of over-identification and no second order autocorrelation of error terms. The estimated coefficient of
lagged EO is positive (p<0.01). Furthermore, r ≥ 1 in all the regressions, and again suggesting that the
Sargan test has sufficient power.

18
Insert Table 7
Insert Table 9
First, the control of corruption has a robust and consistent association with EO in middle-to-
high income countries, whereas in low income countries we find a fairly persistent negative
relationship between low corruption and EO. These results, which are robust to controlling for
corruption and inequality, suggest that in middle-to-high income countries the control of corruption
plays its expected role — it fosters EO by ensuring that the rewards of entrepreneurial endeavor
accrue to the risk taker. On the other hand, in developing countries the protection of property rights is
a responsibility of inefficient bureaucracies which may, intentionally, discriminate on the basis of race
and/or ethnicity, ala South Africa, Kenya, Brazil and India, to name a few. And corruption in such
instances may very well ameliorate the perverse effects arbitrary discrimination has on Schumpeterian
entrepreneurship (Ehrlich and Lui, 1999 and Aidt et al.’s 2008) and, therefore, support EO.
Second, the banking development—EO positive association holds in middle-to-high income
countries, in line with Levine’s (2005) finding that banking development supports entrepreneurship.
Thus, Levine’s (2005) thesis seems to be contingent on the level of development. In low income
countries, banking development hinders EO, which partly supports Khan and Senhadji (2003), Zhang
(2003), and Shen and Lee’s (2006) contention that banking hinders the development of productive
capabilities especially in Latin American, Sub-Saharan African and East Asian countries18. A
plausible explanation for this finding is that in low income countries, with weak institutions, credit
may be allocated corruptly to people of the same ethnic group, leading to resources being wasted in
inefficient projects. Further, large banks with market power may extract rents and a greater share of
future profits from firms than they should (Levine, 2002). Moreover, in firms with poor corporate
governance (which are prevalent in developing countries; Ojah and Godspower-Akpomiemie, 2017),
banks may connive with inefficient managers if these managers serve their interests (Black and
Moersch, 1998); thus, frustrating EO in the process.
Third, the relationship between inequality and EO seems to be negative in both low and
middle-to-high income countries. However, this result is not robust; in the aggregated sample, the
association is positive. Literature has also found contradictory results between income inequality and
the outcomes of entrepreneurship: Forbes (2000), Aghion and Howitt (2002), and Okun (1975) find a
positive association whereas Persson and Tabellini (1994), Acemoglu (1998) and Sukiassyan (2007)
find a negative relation. Amos (1988), Barro (2000), and Banerjee and Duflo (2003) suggest the
relation is inconclusive. A possible reason for these seemingly contradictory findings is that inequality
18 These findings are robust to controlling for corruption and inequality.
19
partially shapes the relation between institutions and human capital (Naude, 2011, Glaeser et al.,
2003), and EO. Easterly (2006) posits that this emanates from the fact that the causal direction runs
from inequality to institutions and human capital, which then affects Schumpeterian entrepreneurship
and economic development; the argument being that divisions along ethnic and class lines which
inequality engenders may place severe constraints on institutional and policy reforms and, therefore,
on the implementation of growth promoting policies that would foster EO.
Fourth, human capital is a robust predictor of EO across all levels of development. In
particular, in developing countries it seems to be an important variable that shapes EO. This supports
Glaeser et al.’s (2004) point that Western colonizers facilitated technological diffusion and
development in their colonies through the higher human capital they possessed. And it contradicts the
assertion that similar to the human capital—growth relation, the human capital—EO association
might be contingent on: (1) corruption and inequality and (2) the level of development.
Fifth and importantly, across all regressions, we find that EO is a highly persistent series. In
other words entrepreneurial orientation today predicts entrepreneurial orientation in the future; and
this result is robust to controlling for institutions, human capital and wealth. Lastly, wealth is
positively associated with EO amongst low income countries; suggesting that there is a significant
within sample variation in this relation amongst this group. And by implication, there might be other
factors besides income (such as geography) that might explain this within sample variation of the
relationship between EO and institutions and human capital.
4.3 Granger Causality
Overall, the determinants—EO association virtually replicates the determinants—growth
relationship that has been well documented in the literature. These findings, combined with theory,
strongly suggest that the determinants of growth may, correctly, be the determinants of EO, not
growth. However, implicit in asserting or arguing that institutions and policies are determinants of EO
is that the direction of the causality runs from institutional and policy variables to EO; or at the very
least, it is bi-directional. And, for institutional and policy variables to be said to be antecedents of EO,
causality cannot run from EO to institutions and policies. However, so far, our specifications have
merely investigated institutions and policies as correlates (focusing on the sign of the association) of
EO across varying levels of development; we have not clarified the direction of causality. So a critical
step in clarifying the antecedents of EO is carrying out panel Granger block exogeneity tests to
determine the direction of causality whilst being sensitive to context as Schumpeterian growth theory
postulates19. Typically Granger causality tests are quite sensitive to lag length; so we employ 4
19
We run granger causality tests on the whole sample, middle income countries and low income countries.

20
different lags (from 1 to 4 lags) and only deem reliable results above the 95% significant level for 3 of
4 lag specifications.
Table 10 presents the causality test results. For the combined sample; our criterion suggests
that the control of corruption and the human capital variables, secondary and tertiary education, can
be deemed antecedents of EO. Banking development, on the other hand, seems to follow EO.
Similarly; inequality seems to be the outcome of variance enhancing entrepreneurship rather than its
antecedent. However, as previously noted, the results of the whole sample may not tell the full story
since policies and institutions may affect EO differently according to income (development) level.
Splitting the sample into middle-to-high income and low income countries yields results that
suggest corruption, banking development and human capital variables are robust antecedents of EO in
middle-to-high income countries. However, in low income countries, the situation is reversed — i.e.,
EO itself seems to be a robust antecedent to the control of corruption, banking development and
tertiary education; the association with secondary education is bi-directional. In both samples, on the
other hand, there seems to be no Granger causality between EO and inequality. Overall, these results
suggest that it is not only the sign of the association between institutions and human capital and EO
that is contingent on income (development) level but also the direction of the causality.
Insert Table 10
4.4 Validation: does EO explain growth after controlling for the determinants and the level of
EO?
We have clarified the sign and the direction of the association between institutions and human
capital, and EO across varying levels of development. And we have argued that clarifying the
determinants of EO is important because: (1) EO is a better measure of Schumpeterian
entrepreneurship since, unlike entry density, it correlates positively with growth20, and (2) EO is the
conduit through which institutions and human capital may affect growth21. These claims are partially
supported by determinants—EO association virtually replicating the determinants—growth
relationship. Importantly, however, for these assertions to hold there must be a degree of unique
variance in growth that is explained by EO even after accounting for the direct growth impact of
institutional and human capital variables.
20
In our view, if EO, similar to entry density, does not correlate positively with the level of income and growth, it would be difficult to justify how it is a better measure of Schumpeterian entrepreneurship than, say, entry density or, for that matter, any other measure of entrepreneurship that is currently thus assumed. 21 Similarly, for EO to be an important conduit through which institutions and human capital shape growth, there must be residual variance in growth explained by EO that is not directly explicated by institutional and human capital indicators.

21
Mthanti and Ojah (2017), indeed, confirm that EO subsumes the impact of institutions and
human capital on growth. So, in this paper, we ask a different but related question: do EO increments
account for the effects of institutions and policies on growth in low and/or medium-and-high EO
countries? To put it differently, is there a threshold level of EO above which an increase in EO
dominates the impact of institutions and policies on economic growth; and below which institutions
and policies might appear to or take on the role of the critical drivers of economic growth (for
instance African countries)? We control for the level of EO to assess whether in the effective absence
and/or low levels of EO, institutions and/or policies play a more direct role in facilitating
growth/development. We split the sample into four quartiles with the lowest 25% of the sample (on
the average level of EO over the sample period) belonging to the lower quartile and the highest 25%
belonging to the upper quartile. The data between the 25th percentile and the 75th is characterised as
the interquartile range. Furthermore, we use a rolling 5-year average growth rate as a measure of the
GDP growth and the 5-year change in EO as a measure of the deviation (increment) in EO (EOdev).
The Gini index and tertiary education enrolment, due to data considerations and collinearity
with secondary enrolment, respectively, are dropped from the analysis. The residual impact of EO
increment on growth, after controlling for institutions and policies, is evaluated using both system-
GMM and panel least squares regressions. The usual caveats for panel least squares about
endogeneity and omitted variable bias apply. Table 11 reports both system-GMM and panel least
squares results of these estimates. As expected, both system-GMM and panel least squares largely
confirm our contention that the EO increment (EOdev) is a consistent and robust predictor of GDP
growth at low, medium and high levels of EO22.
Overall, these results, together with the confirmed association between EO and
institutions/human capital, largely support the notion that: (1) EO correlates positively with growth
and (2) EO seems an important conduit through which institutions and human capital may affect
growth, even at low levels of productive capabilities. Furthermore, in agreement with a noteworthy
motivation of our study, are the results that speak to whether or not EO and its determinants (which
have also been shown to empirically relate to growth) can be assumed as perfect substitutes?
According to the results in Table 11, not only is it shown that EO explains a unique residual variance
in growth after controlling for direct impacts of institutions and human capital variables, but it also
22
Model (1) seems to indicate that EO increment is insignificant at low levels of EO. However, a low EO country may have a higher GDP than its productive capabilities would allow – and achieve this mainly, for instance, by financing consumption through accumulating foreign debt, through foreign aid and/or lucking out and discovering huge oil (commodity) reserves. In such instances the level of EO may be negatively related to growth, whereas the EO increment should still positively predict growth after controlling for EO level. In a system-GMM specification similar to model (1) with the additional regressor being the level of EO, we confirm that indeed the level is negatively related to growth, whereas the deviation is a positive and significant predictor of growth at the 5% level.

22
reveals the relative economic importance of EO and the seemingly competing growth antecedents.
One can see that the coefficients of EOdev, across all conditional distribution are markedly higher
than corresponding coefficients of all competing antecedents of growth. Therefore, these two sets of
growth antecedents, in line with our postulation, cannot be assumed to be perfect substitutes. In fact,
one can surmise from the results that, in the event that the two sets are perceived as competing growth
antecedents, EO would get the nod of priority in any effective growth strategy.
Insert Table 11
4.4 Further validation: does entry density correlate positively with EO/growth?
In the foregoing, we have argued that inconsistent link between entry density and growth is
not surprising since entry density itself is a poor proxy of Schumpeterian entrepreneurship. It is,
therefore, important to ascertain the antecedents of EO because, as we have amply argued in
preceding sections of this paper, it is a more appropriate measure of growth-enhancing Schumpeterian
entrepreneurship, than entry density. Implicit in this observation is that: (1) the relationship between
entry density and EO may be inconsistent and (2) the relationship between entry density and the
determinants of growth may not be robust.
To ascertain whether our observation and/or postulation is, indeed, the case, we first regress
the World Bank’s new business density on EO whilst controlling for domestic credit, the control of
corruption, Gini index, and secondary education. Second, we regress institutional and policy variables
on the TEA and new business density whilst controlling for income. The results of the first regression
suggest that secondary education enrollment, the control of corruption, and reduced inequality all
have a robust association with EO, whereas entry density does not (results not reported here)23. And
the second regression confirms our postulation that quality institutions and good policies are not a
robust predictor of entry density (See Table 12)24.
Insert Table 12
5. Discussion and conclusion
We have investigated the relation between Schumpeterian entrepreneurship at the macro-level
(EO) and what we argue are its drivers across different levels of development, and confirmed our
postulation that institutions and human capital shape EO. Moreover, our robustness tests clearly show
that entry density is not, necessarily, a prerequisite for EO/growth. We have therefore addressed what
23
These results are available from the authors upon request. 24 Hausmann test results suggests that a random effects estimator is appropriate for the regression with the TEA as the dependent variable; and a fixed effects estimator is appropriate for the regression with the new business density as the dependent variable. We report both random and fixed effects.

23
we deem to be an oversight in the literature — i.e., the need to ascertain, empirically, the theoretically
posited relationships between institutions, human capital and Schumpeterian entrepreneurship.
The results based on our overall sample suggest that contingent on the quality of institutions,
both reduced corruption and banking development enhance EO. The inequality—EO relation is not
determinate. Human capital, on the other hand, has a strong positive association with EO; and is
robust to controlling for institutional quality. However, paying heed to context, as Schumpeterian
growth theory counsels, we examine these associations along development levels and document
results that suggest the positive association between banking development and the control of
corruption, respectively, and EO, hold mainly in middle-to-high income countries. In low income
countries, a large banking sector and low corruption may hinder EO.
Importantly, the determinants—EO association, which virtually replicates the determinants—
growth relationship, coupled with EO explaining a large degree of unique variance in growth, even at
low levels of productive capabilities, support the notion that EO is indeed an important conduit
through which determinants of EO engender growth. In addition, EO is a highly persistent series;
implying that there might be some self-reinforcing mechanism (network effects) in the EO series and,
as a result, investments today in EO may yield positive outcomes well into the future. Based on these
findings, we can surmise that: (1) the human capital—EO association is robust, (2) the institutions—
EO relation may not be linear, and interestingly, (3) possessing quality institutions may not be a
necessary precondition for EO building in low income countries.
It, therefore, follows from our documented findings that for middle-to-high income countries
that wish to promote knowledge creation, diffusion and exploitation, and growth, both institutional
and human capital development are vital. On the other hand, for low income countries, committing
precious limited resources to reducing corruption and/or developing a large banking sector may be
sub-optimal because it may yield perverse outcomes. In fact, where Schumpeterian entrepreneurship
is hampered by low private returns or a poor institutional environment, the relatively sensible growth
policy to follow may be to subsidize EO directly. As Rodrik (2014) notes:
“Korea and Taiwan directly subsidized exports. Singapore subsidized foreign investors.
China created special economic zones and subsidized its exporters both directly and indirectly
through an undervalued exchange rate. Mauritius created an export processing zone. In none of these
cases did …… across-the-board institutional reforms play a significant causal role in setting off the
transition to high growth”.
Therefore, the appropriate policy prescription for enhanced Schumpeterian entrepreneurship,
technological upgrading and development, seems clear: invest precious resources in human capital

24
and in enhancing innovative capabilities, diversifying into risky sectors, and proactively seeking new
markets and advanced technology to exploit EO’s self-reinforcing network effects — i.e., lofty EO
behaviour encourages more lofty EO behaviour. And this self-reinforcing copying and learning,
experimenting and learning, and critically, the diffusion of that newly acquired production knowledge,
that these investments engender, may be the crucial conduit to sustained continuous growth.

25
References
Abramovitz, M. (1994). The origins of the post-war catch-up and convergence boom in Fagerberg, J., Verspagen, B. and von Tunzelman, N. (Eds.), The Dynamics of Technology, Trade and Growth, Edward Elgar, Aldershot, 21-52.
Acemoglu, D. (1998). Why do new technologies complement skills? Directed technical change and wage inequality. Quarterly Journal of Economics, 113(4), 1055-1089.
Acemoglu, D., Johnson, S., and Robinson, J. A. (2001). Reversal of fortune: geography and institutions in the making of the modern world income distribution (No. w8460). National Bureau of Economic Research.
Acs, Z. J., Audretsch, D. B., Braunerhjelm, P. and Carlsson, B. (2012). Growth and entrepreneurship. Small Business Economics, 39(2), 289-300.
Acs, Z. J., Autio, E., and Szerb, L. (2014). National systems of entrepreneurship: Measurement issues and policy implications. Research Policy, 43(3), 476-494.
Acs, Z. J., Audretsch, D. B., Lehmann, E. E., and Licht, G. (2017). National systems of innovation. The Journal of Technology Transfer, 42(5), 997-1008.
Aghion, P., and Howitt, P. (2002). Wage inequality and the new economy. Oxford Review of Economic Policy, 18(3), 306-323.
Aghion, P., and Howitt, P. (2006). Joseph Schumpeter lecture appropriate growth policy: A unifying framework. Journal of the European Economic Association, 4(2‐3), 269-314.
Ahsana, H. and Haque, M. E. (2015). Threshold Effects of Human Capital: Schooling and Economic Growth (No. 217). Economics, The University of Manchester.
Aidis, R. and Sauka, A. (2005). Entrepreneurship in a Changing Environment: Analyzing the impact of transition stages on SME development. Challenges in entrepreneurship and SME research, 5-36.
Aidt, T., Dutta, J., and Sena, V. (2008). Governance regimes, corruption and growth: Theory and evidence. Journal of Comparative Economics, 36(2), 195-220.
Alesina, A. and Rodrik, D. (1991). Distributive politics and economic growth (No. w3668). National bureau of economic research.
Amos Jr, O. M. (1988). Unbalanced regional growth and regional income inequality in the latter stages of development. Regional Science and Urban Economics, 18(4), 549-566.
Anokhin, S. and Schulze, W. S. (2009). Entrepreneurship, innovation and corruption. Journal of Business Venturing, 24(5), 465-476.
Asiedu, E., and Villamil, A. P. (2000). Discount factors and thresholds: Foreign investment when enforcement is imperfect. Macroeconomic Dynamics, 4(01), 1-21.
Asiedu, E., and Lien, D. (2011). Democracy, foreign direct investment and natural resources. Journal of International Economics, 84(1), 99-111.
Aterido, R., M. Hallward-Driemeier and C. Pagés (2009). "Big Constraints to Small Firms' Growth? Business Environment and Employment Growth Across Firms". Economic Development and Cultural Change, 59(3), 609-647.

26
Audretsch, D. and Keilbach, M. (2004). Entrepreneurship capital and economic performance. Regional Studies, 38(8), 949-959.
Audretsch, D. B. and Keilbach, M. (2005). Entrepreneurship capital and regional growth. The Annals of Regional Science, 39(3), 457-469.
Audretsch, D. B. and Feldman, M. P. (1996). "R&D Spill-overs and the Geography of Innovation and Production," American Economic Review, 86(3), 630-640.
Autio, E., Kenney, M., Mustar, P., Siegel, D., and Wright, M. (2014). Entrepreneurial innovation: The importance of context. Research Policy, 43(7), 1097-1108.
Ayyagari, M., Demirgüç-Kunt, A. and Maksimovic, V. (2008). How important are financing constraints? The role of finance in the business environment. The World Bank Economic Review, 22(3), 483-516.
Banerjee, A. V., and Duflo, E. (2003). Inequality and growth: what can the data say? Journal of Economic Growth, 8(3), 267-299.
Baptista, R. and Mendonça, J. (2010). Proximity to knowledge sources and the location of knowledge-based start-ups. The Annals of Regional Science, 45(1), 5-29.
Barro, R. J. (2000). Inequality and Growth in a Panel of Countries. Journal of Economic Growth, 5(1), 5-32.
Baumol, W. J., Litan, R. E. and Schramm, C. J. (2007). Sustaining entrepreneurial capitalism. Capitalism and Society, 2(2), 1-38.
Beck, T., Demirguc‐Kunt, A. S. L. I., Laeven, L. and Levine, R. (2008). Finance, firm size, and growth. Journal of Money, Credit and Banking, 40(7), 1379-1405.
Beck, T. and Levine, R. (2004). Legal institutions and financial development. NBER Working Paper, No. 10417.
Beck, T., Levine, R. and Loayza, N. (2000). Finance and the Sources of Growth. Journal of Financial Economics, 58(1), 261-300.
Benhabib, J. and Spiegel, M. M. (1994). The role of human capital in economic development evidence from aggregate cross-country data. Journal of Monetary Economics, 34(2), 143-173.
Berkowitz, D. and DeJong, D. N. (2005). Entrepreneurship and Post‐socialist Growth. Oxford Bulletin of Economics and Statistics, 67(1), 25-46.
Biggs, T. and Srivastava, P. (1996). Structural Aspects of Manufacturing in Sub-Saharan Africa: Findings from a Seven Country Enterprise Survey (Vol. 346). World Bank Publications.
Bils, M. and Klenow, P. J. (2000). Does Schooling Cause Growth?. American Economic Review, 90(5), 1160-1183.
Black, S. W., and Moersch, M. (1998). Financial structure, investment and economic growth in OECD countries. In: Black, S. W., and Moersch, M. (Eds), Competition and convergence in financial markets: The German and Anglo-American models, 157-174.North-Holland, New York.
Blundell, R. and Bond, S. (1998). Initial conditions and moment restrictions in dynamic panel data models. Journal of Econometrics, 87(1), 115-143.

27
Borensztein, E., de Gregorio, J. and Lee. J.W. (1998) ‘How does foreign direct investment affect economic growth?’ Journal of International Economics 45(1), 115-135.
Carree, M., Van Stel, A., Thurik, R. and Wennekers, S. (2002). Economic development and business ownership: an analysis using data of 23 OECD countries in the period 1976–1996. Small Business Economics, 19(3), 271-290.
Castellacci, F. and Natera, J. M. (2011). A new panel dataset for cross-country analyses of national systems, growth and development (CANA). Innovation and Development, 1(2), 205-226.
Cihak, M., Demirgüç-Kunt, A., Feyen, E. and Levine, R. (2012). Benchmarking financial systems around the world (No. w6175). World Bank Policy Research. Coad, A. and Rao, R. (2008). Innovation and firm growth in high-tech sectors: A quantile regression approach. Research Policy, 37(4), 633-648.
Coco, G. and Lagravinese, R. (2014). Cronyism and education performance. Economic Modelling, 38, 443-450.
Cohen, D. and Soto, M. (2007). Growth and human capital: good data, good results. Journal of Economic Growth, 12(1), 51-76.
Dakhli, M. and De Clercq, D. (2004). Human capital, social capital, and innovation: a multi-country study. Entrepreneurship and Regional Development, 16(2), 107-128.
Deidda, L. and Fattouh, B. (2002). Non-linearity between finance and growth. Economics Letters, 74(3), 339-345.
Demetriades, P. and Hook Law, S. (2006). Finance, institutions and economic development. International Journal of Finance and Economics, 11(3), 245.
Devereux, M. B. and Smith, G. W. (1994). International risk sharing and economic growth. International Economic Review, 34(3), 535-550.
Djankov, S., Miguel, E., Qian, Y., Roland, G. and Zhuravskaya, E. (2005). Who are Russia's entrepreneurs? Journal of the European Economic Association, 3(2‐3), 587-597.
Easterly, W. (2006). “The White Man’s Burden.” The Penguin Press, New York.
Ehrlich, I., and Lui, F. T. (1999). Bureaucratic corruption and endogenous economic growth. Journal of Political Economy, 107(S6), S270-S293.
Estrin, S., Meyer, K. E. and Bytchkova, M. (2006). Entrepreneurship in transition economies. The Oxford Handbook of Entrepreneurship, 693-725.
Faria, J. R., Cuestas, J. C. and Mourelle, E. (2010). Entrepreneurship and unemployment: A nonlinear bidirectional causality?. Economic Modelling, 27(5), 1282-1291.
Forbes, K. J. (2000). A reassessment of the relationship between Inequality and Growth. American Economic Review, 90(4), 869-887.
Gemünden, H. G., Heydebreck, P. and Herden, R. (1992). Technological interweavement: a means of achieving innovation success. R&D Management, 22(4), 359-376.
Glaeser, E., Scheinkman, J., and Shleifer, A. (2003). The injustice of inequality. Journal of Monetary Economics, 50(1), 199-222.

28
Glaeser, E. L., La Porta, R., Lopez-de-Silanes, F., and Shleifer, A. (2004). Do institutions cause growth? Journal of Economic Growth, 9(3), 271-303.
Glaeser, E. L. (2007). Entrepreneurship and the City. (No. w13551). National Bureau of Economic Research.
Hair, J.F., Black, W.C., Babin, B.J., and Anderson, R.E. (2010). Multivariate Data Analysis (7th ed.). Pearson Prentice-Hall, Upper Saddle River, NJ.
Hasan, I. and Tucci, C. L. (2010). The innovation–economic growth nexus: Global evidence. Research Policy, 39(10), 1264-1276
Hellmann, T. F., Murdock, K. C., and Stiglitz, J. E. (2000). Liberalization, moral hazard in banking, and prudential regulation: Are capital requirements enough? American Economic Review, 90(1), 147-165.
Henrekson, M., and Sanandaji, T. (2013). Billionaire entrepreneurs: A systematic analysis (No. 959). IFN Working Paper.
Hofstede, G. (2010). The GLOBE debate: Back to relevance. Journal of International Business Studies, 41(8), 1339-1346.
Hurst, E. and Pugsley, B. W. (2011). What do small businesses do? (No. w17041). National Bureau of Economic Research.
Huntington, S. P. (2006). Political order in changing societies. Yale University Press.
Jayaratne, J. and Strahan, P. E. (1996). The finance-growth nexus: Evidence from bank branch deregulation. The Quarterly Journal of Economics, 639-670.
Jaggers, K., and Marshall, M. G. (2000). Polity IV project. Center for International Development and Conflict Management, University of Maryland, 174.
Johnson, S., McMillan, J. and Woodruff, C. M. (1999). Property rights, finance and entrepreneurship. In Conference Paper, The Nobel Symposium in Economics – The Economics of Transition, Stockholm
Johnson, S., McMillan, J. and Woodruff, C. (2000). Entrepreneurs and the ordering of institutional reform: Poland, Slovakia, Romania, Russia and Ukraine compared. Economics of Transition, 8(1), 1-36.
Khan, S. and Senhadji, A. (2003). Financial development and economic growth: A review and new evidence. Journal of African Economies, 12(2), 89-110.
Knack, S. and Keefer, P. (1995). Institutions and economic performance: cross‐country tests using alternative institutional measures. Economics & Politics, 7(3), 207-227.
King, R. G. and Levine, R. (1993). Finance, entrepreneurship and growth. Journal of Monetary Economics, 32(3), 513-542.
Lambsdorff, J. G. (2003). How corruption affects productivity. Kyklos, 56(4), 457–474.
La Porta, R., Lopez-de-Silanes, F., Shleifer, A. and Vishny, R. (1997). Legal determinants of external finance. Journal of Finance, 52, 1131-1150.
Larroulet, C. and Couyoumdjian, J.P. (2009). Entrepreneurship and Growth: A Latin American Paradox?. The Independent Review, 14 (1), 81–100.

29
Lee, K., and Kim, B. Y. (2009). Both institutions and policies matter but differently for different income groups of countries: Determinants of long-run economic growth revisited. World Development, 37(3), 533-549.
Lee, K., Kim, B. Y., Park, Y. Y. and Sanidas, E. (2013). Big businesses and economic growth: Identifying a binding constraint for growth with country panel analysis. Journal of Comparative Economics, 41(2), 561-582
Lee, K., and Mathews, J. A. (2010). From Washington consensus to best consensus for world development. Asian‐Pacific Economic Literature, 24(1), 86-103.
Lehmann, E. E., & Seitz, N. (2017). Freedom and innovation: A country and state level analysis. The Journal of Technology Transfer, 42(5), 1009-1029.
Levine, R. (2002). Bank-based or market-based financial systems: which is better?. Journal of Financial Intermediation, 11(4), 398-428.
Levine, R. (2005). Finance and growth: theory and evidence. Handbook of Economic Growth, 1, 865-934, Amsterdam.
Li, H., Yang, Z., Yao, X. and Zhang, J. (2009). Entrepreneurship and growth: Evidence from China. Discussion Papers, (No. w00022). Chinese University of Hong Kong, Department of Economics.
Li, H., Yang, Z., Yao, X., Zhang, H. and Zhang, J. (2012). Entrepreneurship, private economy and growth: Evidence from China. China Economic Review, 23(4), 948-961.
Lumpkin G.T. and Dess G.G. (1996). Clarifying the entrepreneurial orientation construct and linking it to performance. Academy of Management Review, 21(1),135–172.
Markman, G. D., Balkin, D. B., and Baron, R. A. (2002). Inventors and new venture formation: the effects of general self‐efficacy and regretful thinking. Entrepreneurship Theory and Practice, 27(2), 149-165.
Mauro, P. (1995). Corruption and growth. Quarterly Journal of Economics, 110(3), 681-712.
McMillan, J., and Woodruff, C. (2002). The central role of entrepreneurs in transition economies. Journal of Economic Perspectives, 16(3), 153-170.
Méon, P. G. and Sekkat, K. (2005). Does corruption grease or sand the wheels of growth?. Public Choice, 122(1-2), 69-97.
Méon, P. G. and Weill, L. (2010). Is corruption an efficient grease? World Development, 38(3), 244-259.
Millán, J. M., van Stel, A., van Praag, M., Congregado, E. and Roman, C. (2012). The value of an educated population for an individual's entrepreneurship success (No. w201103). EIM Business and Policy Research.
Miller, D. (1983). The correlates of entrepreneurship in three types of firms. Management Science, 29(7), 770-791.
Miller, D. (2011). Miller (1983) revisited: A reflection on EO research and some suggestions for the future. Entrepreneurship Theory and Practice, 35(5), 873-894.
Mo, P. H. (2001). Corruption and economic growth. Journal of Comparative Economics, 29(1), 66-79.
Mthanti, T. and Ojah, K. (2017). Entrepreneurial orientation (EO): Measurement and policy implications of entrepreneurship at the macroeconomic level. Research Policy (In press).

30
Naudé, W. (2011). Entrepreneurship is not a binding constraint on growth and development in the poorest countries. World Development, 39(1), 33-44.
Nelson, R. R. (1993). National systems of innovation: a comparative study, Oxford: Oxford University Press.
Obstfeld, M. (1995). The logic of currency crises (pp. 62-90). Springer, Berlin Heidelberg.
Ojah, K. and Godspower-Akpomiemie, E. (2017). The market for corporate control and shareholder versus stakeholder models: whither developing and emerging market economies? In Corporate Governance in Developing and Emerging Markets, ed. Ngwu, F., Osuji, O. and Stephen, F. Rutledge, New York.
Okun, A. M. (1975). Equality and efficiency, the big trade-off. Brookings Institution Press, Washington, DC.
Olken, B. A. (2005). Monitoring corruption: Evidence from a field experiment in Indonesia (No. w11753). National Bureau of Economic Research.
Olken, B. A. and Pande, R. (2011). Corruption in developing countries (No. w17398). National Bureau of Economic Research.
Pellegrini, Lorenzo, and Reyer Gerlagh (2004). "Corruption's effect on growth and its transmission channels." Kyklos 57 (3) 429-456.
Persson, T., and Tabellini, G. (1991). Is inequality harmful for growth? Theory and evidence (No. w3599). National Bureau of Economic Research.
Persson, T. and Tabellini G, (1994). Is Inequality Harmful for Growth? Theory and Evidence. American Economic Review, 84(3), 600-621.
Pietrobelli C. (1996). Emerging Forms of Technological Cooperation: The Case for Technology Partnerships—Inner Logic, Examples and Enabling Environment. Science and Technology Issues, Geneva: UNCTAD.
Pissarides, F. (2004). ‘Financial Structures and private sector development in the new Europe’ Chapter 3 in D. Masciandoro (Ed) Financial Intermediation in the New Europe: Banks, Markets and Regulation in the Accession Countries, Edward Elgar: Northampton, MA.
Pritchett, L. (2001). Where has all the education gone? The World Bank Economic Review, 15(3), 367-391.
Rajan, R. and L. Zingales, (1998). "Financial Dependence and Growth". The American Economic Review, 88(3), 559-586
Rauch, A., Wiklund, J., Lumpkin, G.T. and Frese, M. (2009). Entrepreneurial orientation and business performance: Cumulative empirical evidence. Entrepreneurship Theory and Practice, 33(3), 761–788.
Rivera-Batiz, F.L. (2002). Democracy, governance, and economic growth: theory and evidence. Review of Development Economics 6 (2), 225–247.
Rogers, M. L. (2008). Directly unproductive schooling: How country characteristics affect the impact of schooling on growth. European Economic Review, 52(2), 356-385.
Rodrik, D. (1999). “Where Did All the Growth Go? External Shocks, Social Conflict, and Growth Collapses.” Journal of Economic Growth, 4(4): 385–412.

31
Rodrik, D. (2014a). An African Growth Miracle? (No. w20188). National Bureau of Economic Research.
Rodrik, D. (2014b). The Past, Present, and Future of Economic Growth. Challenge, 57(3), 5-39.
Roodman, D. (2007). A short note on the theme of too many instruments (No. w125). Center for Global Development.
Roodman, D. (2009). How to do xtabond2: An introduction to difference and system GMM in stata. Stata Journal, 9 (1), 86-136.
Rousseau, P. L. and Wachtel, P. (2002). Inflation thresholds and the finance–growth nexus. Journal of International Money and Finance, 21(6), 777-793.
Sala-i-Martín, X., Bilbao-Osorio, B, Blanke, J., Crotti, R., Hanouz, M. D., Geiger, T. and Ko, C. (2012). The Global Competitiveness Index 2012–2013: Strengthening Recovery by Raising Productivity. The Global Competitiveness Report 2012–2013, 49-68.
Schumpeter, J.A. (1912). Theorie der wirtschaftlichen Entwicklung. Dunker and Humblot, Leipzig. The Theory of Economic Development translated by R. Opie. Harvard University Press, Cambridge, MA, 1934.
Schumpeter, J. A. (1942). Socialism, capitalism and democracy. Harper and Brothers, New York.
Shane, S. (2009). Why encouraging more people to become entrepreneurs is bad public policy. Small Business Economics, 33(2), 141-149.
Shen, C. H., and Lee, C. C. (2006). Same financial development yet different economic growth: why?. Journal of Money, Credit and Banking, 38(7), 1907-1944.
Shin, I. (2012). Income inequality and economic growth. Economic Modelling, 29(5), 2049-2057.
Smith, A. (1776/1904). An Inquiry into the Nature and Causes of the Wealth of Nations, ed. Edwin Cannan, 282-309.
Stokke, H. E. (2008). Productivity growth and organizational learning. Review of Development Economics, 12(4), 764-778.
Sukiassyan, G. (2007). Inequality and growth: What does the transition economy data say? Journal of Comparative Economics, 35(1), 35-56.
Thurik, A. R., Carree, M. A., Van Stel, A. and Audretsch, D. B. (2008). Does self-employment reduce unemployment?. Journal of Business Venturing, 23(6), 673-686.
Van Stel, A., Carree, M. and Thurik, R. (2005). The effect of entrepreneurial activity on national economic growth. Small Business Economics, 24(3), 311-321.
Vivarelli, M. (2012). Entrepreneurship in advanced and developing countries: A microeconomic perspective (No. w6513). Discussion Paper series, Forschungsinstitut zur Zukunft der Arbeit.
Weber, M. (2002). The Protestant Ethic and the Spirit of Capitalism: and other writings. Penguin.
Wei, S. J. (2000). How taxing is corruption on international investors?. Review of Economics and Statistics, 82(1), 1-11.
Wong, P. K., Ho, Y. P. and Autio, E. (2005). Entrepreneurship, innovation and economic growth: Evidence from GEM data. Small Business Economics, 24(3), 335-350.

32
Yilmazkuday, H. (2011). Thresholds in the finance-growth nexus: A cross-country analysis. The World Bank Economic Review, 25(2), 278-295.
Zhang, K. (2003). Does Financial Development Promote Economic Growth in the East Asia? China Journal of Finance, 1(2), 1-10.

33
Table 1: Correlation Matrix of entrepreneurship proxies and determinants
1. ***, **, and * in the table indicate the levels of significance at 1%, 5%, and 10%, respectively.
Corruption Domestic credit Gini Index Secondary New Bus
Density
TEA EO
Corruption 1.00
Domestic credit 0.48*** 1.00
Gini Index -0.35*** -0.16*** 1.00
Secondary 0.55*** 0.37*** -0.49*** 1.00
New Bus Density 0.10** 0.22*** 0.06 0.18*** 1.00
TEA -0.38*** -0.36*** 0.47*** -0.37*** -0.18** 1.00
EO 0.65*** 0.51*** -0.39*** 0.66*** 0.09 -0.38*** 1.000000

34
Table 2: Rankings of EO and its determinants
EO
Rank
Country
Mean
Std. Dev.
Control of
Corruption
Gini Index
Domestic
credit
Tertiary
education
1 Singapore 2.46 0.81 9.22 46.02 81.94 32.62
2 Ireland 2.26 0.64 8.38 33.06 87.80 38.00
3 Belgium 1.39 0.32 6.13 27.04 100.38 49.39
4 Switzerland 1.36 0.27 8.64 33.15 164.27 33.45
5 Sweden 1.04 0.46 9.18 24.33 111.74 52.46
6 Japan 1.03 0.16 6.57 29.81 268.54 38.27
7 Netherlands 0.92 0.30 8.85 29.03 134.07 46.47
8 Iceland 0.91 0.49 9.32 25.08 86.71 34.87
9 Denmark 0.85 0.38 9.63 30.75 93.23 47.43
10 Finland 0.80 0.50 9.33 24.08 66.92 68.69
Selected Developed
11 United States 0.79 0.21 7.66 40.28 174.73 67.85
13 Germany 0.73 0.22 8.06 27.55 117.41 35.92
16 Canada 0.64 0.31 9.08 30.03 128.05 69.80
21 United Kingdom 0.53 0.18 8.71 31.16 112.39 47.96
38 Portugal 0.13 0.13 6.35 35.78 106.58 37.14
Selected African
25 Botswana 0.50 0.18 6.06 NA -29.73 2.78
52 South Africa -0.06 0.15 5.03 55.49 130.40 16.98
80 Senegal -0.64 0.16 3.49 NA 30.24 4.11
92 Lesotho -1.09 0.63 3.43 NA 9.94 2.18
93 Ethiopia -1.20 0.27 3.37 39.34 36.06 2.06
Selected Eastern European and former Soviet Union
15 Czech Republic 0.67 0.22 4.84 23.95 71.04 23.16
19 Slovenia 0.56 0.29 5.27 23.65 30.39 43.42
33 Russia 0.19 0.19 2.46 37.78 22.68 30.37
66 Georgia -0.34 0.29 3.36 37.49 11.01 40.11
87 Kyrgyzstan -0.90 0.19 4.16 39.07 5.04 28.65
Selected Latin American
45 Chile 0.04 0.28 7.03 55.21 85.58 28.04
60 Brazil -0.23 0.11 3.85 58.73 86.00 10.59
63 Argentina -0.29 0.14 4.09 46.38 37.52 43.56
71 Uruguay -0.44 0.18 3.95 43.00 50.33 29.85
77 Bolivia -0.55 0.17 2.96 NA 42.71 29.39
Selected Asian
17 Malaysia 0.62 0.42 5.36 47.34 157.74 17.86
31 China 0.22 0.45 2.68 26.24 98.35 7.27
32 Thailand 0.19 0.32 2.90 52.78 112.16 23.75
74 India -0.49 0.30 2.87 32.32 52.59 7.23
75 Sri Lanka -0.50 0.16 3.65 NA 41.39 18.65
46 All 0.00 0.74 4.77 37.56 63.29 26.60

35
Table 3: Correlation matrix of the sub-constructs of EO, EO and its determinants
EO
Innov
Proact
Risk
Corrupt
Domestic
credit
Gini
Index
Tertiary
education
Secondary
education
EO 1.00
Innov 0.70*** 1.00
Proact 0.76*** 0.25*** 1.00
Risk 0.81*** 0.35*** 0.43*** 1.00
Corrupt 0.67*** 0.72*** 0.30*** 0.42*** 1.00
Domestic
credit 0.53*** 0.59*** 0.18*** 0.38*** 0.47*** 1.00
Gini Index -0.40*** -0.44*** -0.12*** -0.27*** -0.35*** -0.16*** 1.00
Tertiary 0.64*** 0.64*** 0.39*** 0.40*** 0.52*** 0.41*** -0.35*** 1.00
Secondary 0.66*** 0.56*** 0.35*** 0.53*** 0.55*** 0.37*** -0.49*** 0.77*** 1.00
Notes:
1. ***, **, and * in the table indicate the levels of significance at 1%, 5%, and 10%, respectively.
2. Innov, Proact and Risk represent innovativeness, proactiveness and risk taking respectively. Corrupt indicates the control of
corruption.
Table 4: Correlation matrix of independent variables (combined sample) Corruption Domestic
credit
Secondary Tertiary Gini Index GDP per
capita
Corruption 1.00
Domestic credit 0.48*** 1.00
Secondary 0.59*** 0.37*** 1.00
Tertiary 0.55*** 0.38*** 0.78*** 1.00
Gini Index -0.39*** -0.21*** -0.50*** -0.40*** 1.00
GDP per capita 0.82*** 0.57*** 0.65*** 0.64*** -0.50*** 1.00
Notes:
1. ***, **, and * in the table indicate the levels of significance at 1%, 5% and 10%, respectively.
2. GDP per capita is measured in US 2005$.

36
Table 5: GMM analysis with the determinants as predictors of EO (combined sample)
Dependent
variable: EO
Model: 1 2 3 4 5 6 7 8 9
EO(-1) 0.57
71.88***
0.66
76.51***
0.64
75.39***
0.66
70.38***
0.69
29.28***
0.65
29.31***
0.63
26.73***
0.67
29.89***
0.62
20.11***
Log (GDP) 0.19
11.46***
0.11
6.31***
0.14
6.53***
0.23
9.38***
0.15
3.32***
0.12
2.78***
0.14
3.08***
- 0.10
1.68*
Corruption -0.08
-12.43***
0.17
13.72***
0.17
12.38***
0.14
8.99***
0.16
9.72***
0.15
9.05***
Domestic credit -0.00
-1.85**
0.00
6.29***
0.00
9.99***
0.00
8.32***
Tertiary -0.00
-3.22***
0.00
4.48***
-0.00
-0.58
-0.00
-1.96**
Secondary 0.00
4.53***
0.00
3.11***
0.01
4.98***
0.00
3.47***
Gini Index -0.00
-7.69***
0.00
0.69
0.00
0.93
0.00
2.64***
0.00
2.03**
0.00
2.08**
Number of
observations
1879 1879 1879 1370 1370 1370 1370 1375 1370
J statistic 81.86 82.50 79.70 55.24 55.93 57.43 55.75 59.25 57.07
Prob (J-
statistic)
0.33 0.31 0.39 0.35 0.33 0.28 0.34 0.23 0.29
AR(2) 0.19 0.15 0.14 0.19 0.16 0.17 0.15 0.16 0.16
No of cross
sections
92 92 92 68 68 68 68 68 68
Instrument
rank
80 80 81 55 56 58 57 58 59
N/I 1.15 1.15 1.14 1.24 1.21 1.17 1.19 1.17 1.15
Notes:
1. The dependent variable is EO assessed during the period 1982-2008 using an unbalanced panel with 27 periods included and 93
cross-sections.
2. The regressions including the GINI Index have 27 periods and 68 cross-sections.
3. ***, **, and * in the table indicate the levels of significance of the t-value at 1%, 5% and 10%, respectively
Table 6: Correlation matrix of independent variables (middle-to-high income sample)
Corruption
Domestic credit
Secondary
education
Tertiary
education
Gini Index
GDP per capita
Corrupt 1.00
Domestic credit 0.37*** 1.00
Secondary 0.49*** 0.27*** 1.00
Tertiary 0.44*** 0.26*** 0.70*** 1.00
Gini Index -0.38*** -0.09*** -0.55*** -0.39*** 1.00
GDP per capita 0.75*** 0.50*** 0.62*** 0.56*** -0.53*** 1.00
Notes:
1. ***, **, and * in the table indicate the levels of significance at 1%, 5% and 10%, respectively.
2. GDP per capita is measured in US 2005$.

37
Table 7: GMM analysis of EO determinants (Middle-to-high income sample)
Dependent
variable: EO
Model: 1 2 3 4 5 6 7 8 9 10
EO(-1) 1.06
31.32***
0.77
44.42***
0.87
57.57***
0.98
142.36***
1.09
43.34***
0.95
24.18***
1.00
36.21***
0.96
37.97***
0.94
35.01***
0.87
16.51***
Log(GDP) - - - - - - - - - -0.25
-1.34
Corruption 0.47
7.93***
0.47
11.02***
0.55
8.57***
0.55
14.64***
0.44
14.61***
0.50
18.01***
0.39
14.84***
Domestic credit 0.00
7.47***
0.00
3.55***
0.00
1.71*
0.00
4.18***
Tertiary 0.01
7.36***
0.00
1.87*
0.00
2.15**
0.00
1.29
0.00
0.85
Secondary -0.00
-2.68***
0.00
2.37***
0.00
2.91***
0.00
4.79***
0.00
2.00**
Gini Index -0.00
-3.39***
-0.00
-0.37
-0.00
-1.61
-0.00
-1.10
-0.00
-1.37
-0.01
-2.81***
Number of
observations
1036 1036 1036 888 888 1036 888 888 888 883
J statistic
26.17 28.63 35.53 33.85 27.58 24.85 25.38 28.65 26.26 30.60
Prob (J-statistic)
0.45 0.33 0.10 0.14 0.38 0.53 0.50 0.33 0.45 0.24
AR(2)
0.59
0.26
0.26
0.13
0.21
0.91
0.34
0.23
0.31
0.28
No of cross
sections
51 51 51 44 44 51 44 44 44 44
Instrument rank 28 28 29 28 29 30 31 30 32 33
N/I 1.82 1.82 1.76 1.57 1.52 1.70 1.42 1.47 1.38 1.33
Notes:
1. The dependent variable is EO assessed during the period 1982-2008 using an unbalanced panel with 27 periods included and 51
cross-sections.
2. The regressions including the Gini Index have 27 periods and 44 cross-sections.
3. ***, **, and * in the table indicate the levels of significance of the t-value at 1%, 5% and 10%, respectively.
Table 8: Correlations matrix of the independent variables (low income sample)
Corruption
Domestic
credit
Secondary
education
Tertiary
education
Gini Index
GDP per capita
Corruption 1.00
Domestic credit 0.09** 1.00
Secondary 0.14*** -0.02 1.00
Tertiary 0.09** -0.02 0.82*** 1.00
Gini Index 0.09** -0.09** -0.25*** -0.04 1.00
GDP per capita 0.29*** 0.23*** 0.51*** 0.49*** 0.05 1.00
Notes:
1. ***, **, and * in the table indicate the levels of significance at 1%, 5% and 10%, respectively.
2. GDP per capita is measured in US 2005$

38
Table 9: GMM analysis of determinants of EO (low income countries sample)
Dependent
variable: EO
Model: 1 2 3 4 5 6 7 8 9 10 11
EO(-1) 0.80
27.23***
0.93
52.03***
0.71
16.21***
0.91
231.71***
0.89
25.36***
0.52
10.24***
0.73
8.63***
0.80
28.43***
0.89
20.15***
0.70
8.59***
0.15
2.12**
Log(GDP) - - - - - - - - - - 0.59
2.25**
Corruption -0.14
-7.19***
-0.01
-0.61
-0.13
-5.26***
0.06
1.26
-0.14
-7.28***
-0.01
-0.32
0.61
0.03
-0.12
-4.74***
Domestic credit -0.00
-2.22**
-0.00
-0.88
-0.00
-2.59***
-0.00
-1.54
-0.01
-3.24***
Tertiary 0.01
3.90***
0.02
4.39***
0.02
3.78***
0.02
3.82***
0.01
1.52
Secondary 0.01
4.14***
0.01
3.94***
0.02
8.40***
0.02
6.88***
0.02
6.10***
Gini Index -0.00
-3.33***
-0.00
-2.84***
-0.00
-1.07
-0.00
-1.04
-0.01
-3.09***
-0.01
-2.01**
Number of
observ
855 855 855 470 470 855 470 855 470 470 470
J statistic 28.03 29.17 25.32 21.68 21.64 23.07 17.55 28.63 20.40 15.97 19.69
Prob (J-statistic) 0.36 0.30 0.50 0.42 0.36 0.63 0.49 0.33 0.37 0.53 0.23
AR(2)
0.61
0.28
0.17
0.90
0.94
0.53
0.81
0.57
0.88
0.42
0.94
No of cross
sections
41
41
41
23
23
41
23
41
23
23
23
Instrument rank
28
28
29
23
23
30
23
29
23
23
23
N/I
1.46
1.46
1.41
1
1
1.37
1
1.41
1
1
1
Notes:
1. The dependent variable is EO assessed during the period 1982-2008 using an unbalanced panel with 27 periods included and 41
cross-sections.
2. The regressions including the GINI Index have 27 periods and 23 cross-sections.
3. ***, **, and * in the table indicate the levels of significance of the t-value at 1%, 5% and 10%, respectively.

39
Table 10: Granger causality tests of EO and determinants
1. ***, **, and * in the table indicate the levels of significance of the t-value at 1%, 5% and 10%, respectively.
Combined Middle Income Low Income
Lag Length Lag 1 Lag 2 Lag 3 Lag 4 Lag 1 Lag 2 Lag 3 Lag 4 Lag 1 Lag 2 Lag 3 Lag 4
Null Hypothesis: F-Stat F-Stat F-Stat F-Sta F-Stat F-Stat F-Stat F-Stat F-Sta F-Stat F-Stat F-Stat
Domestic Credit does not Granger Cause EO 1.7 1.94 1.77 3.15** 2.75* 7.93*** 6.26*** 4.47*** 0.27 1.19 1.33 2.34**
EO does not Granger Domestic Credit 41.04*** 19.00*** 11.88*** 8.48*** 10.60*** 5.19*** 2.99** 2.96** 15.29*** 7.80*** 5.33*** 3.74***
Control of Corruption does not Granger Cause EO 5.82** 5.27** 7.08*** 4.67*** 3.83** 6.76*** 5.29*** 4.15*** 3.57* 1.63 3.53*** 1.68
EO does not Granger Cause CONTROL_CORRUPTION 16.95*** 7.72*** 6.30*** 4.99*** 0.46 0.13 0.14 0.50 3.19** 3.01** 3.49*** 3.40***
Secondary Enrolment does not Granger Cause EO 15.36*** 7.26*** 6.03*** 6.24*** 10.04*** 8.05*** 6.4*** 5.78*** 8.15*** 5.22*** 3.17** 2.69**
EO does not Granger Cause Secondary Enrolment 13.23*** 4.23** 1.38 0.82 0.87 0.33 1.37 1.26 22.19*** 16.70*** 12.37*** 9.70***
Tertiary Enrolment does not Granger Cause EO 23.43*** 10.66*** 6.89*** 5.30*** 14.42*** 7.70*** 4.41*** 3.82*** 5.72** 2.3** 1.90 1.64
EO does not Granger Cause Tertiary Enrolment 12.91*** 7.22*** 3.64** 2.79** 0.16 0.36 0.29 1.26 14.33*** 8.48** 6.14*** 4.68***
Gini Index does not Granger Cause EO 3.05* 2.59* 3.38** 2.89** 1.78 1.45 1.51 1.74 1.02 1.20 1.97 1.61
EO does not Granger Cause Gini Index 13.08*** 6.69*** 3.23*** 2.37** 4.28*** 2.06 1.32 1.09 2.74* 2.35 1.48 1.36

40
Table 11: Regression analyses of determinants, EO and growth
DV: GDP Growth System GMM Panel Least squares
Lower
quartile
Interquartile range
Upper
quartile
Lower
quartile
Interquartile range
Upper
quartile
Independent variable 1 2 3 4 5 6 7 8
GDP growth(-1) 0.14
1.28
0.16
3.76***
0.46
5.04***
0.45
7.71***
0.80
23.80***
0.78
43.61***
0.82
28.83***
0.84
31.58***
Log (GDP) 0.51
5.48***
0.56
8.29***
0.08
0.78
0.20
4.95***
0.00
-0.33
0.00
1.61
0.01
3.66**
0.01
5.40***
Natural resource rents 0.00
-1.68*
0.00
-1.42
0.00
-1.01
0.00
2.19**
0.00
0.72
0.00
1.63
0.00
0.85
0.00
3.35***
Population growth 0.01
0.57
0.01
0.59
0.01
0.33
-0.03
-6.20***
0.00
-0.37
-0.02
-6.14***
-0.01
-3.25***
0.00
-1.99**
EOdev -0.02
-0.71
0.11
3.02***
0.16
6.08***
0.07
6.65***
0.03
1.99**
0.08
5.45***
0.08
5.99***
0.03
3.07***
Dcredit 0.00
-3.28***
0.00
-2.21**
0.00
-0.88
0.00
-1.83*
0.00
-1.70*
0.00
-2.60***
0.00
-1.99**
0.00
-3.17***
Corruption 0.01
0.39
-0.02
-0.84
-0.02
-2.16**
-0.04
-2.54***
0.01
1.79*
0.01
2.34**
0.00
-1.53
0.00
-2.07**
Secondary 0.00
-0.43
0.00
0.24
0.00
1.62
0.00
-2.99***
0.00
1.12
0.00
-0.41
0.00
-1.33
0.00
-1.68*
J-statistic 17.74 17.97 15.23 14.03 NA NA NA NA
Prob(J-statistic) 0.22 0.26 0.36 0.52 NA NA NA NA
AR(2) 0.96 0.92 0.61 0.73 NA NA NA NA
N 22.00 23.00 22.00 23.00 NA NA NA NA
I 22.00 23.00 22.00 23.00 NA NA NA NA
N/I 1.00 1.00 1.00 1.00 NA NA NA NA
R-squared NA NA NA NA 0.85 0.84 0.92 0.91
Adjusted R-squared NA NA NA NA 0.84 0.83 0.92 0.91
Note:
1. The dependent variable is Gdp growth assessed during the period 1985-2008 using an unbalanced panel with 24 periods included and
23 cross-sections per quartile.
2. ***, **, and * in the table indicate the levels of significance of the t-value at 1%, 5% and 10%, respectively.

41
Table 12: Regression analyses of the determinants (of entrepreneurship) and measures of entry
density
DV: New Bus
density
New Bus
density
TEA
TEA
Effects Specification: Fixed Random Fixed Random
C -577885.50 -149951.90 43.24 47.62***
(-1.30) (-1.67) (0.91) (5.68)
Log(GDP) 77998.90 29039.93 -2.89 -4.40***
(1.38) (1.58) (-0.61) (-4.73)
Control of corruption -2039.15 -6610.42 -0.58 0.42
(-0.30) (-0.80) (-0.77) (1.22)
Dcredit -98.08 2.90 0.00 0.00
(-0.74) (0.03) (0.57) (0.29)
Secondary 90.09 129.37 0.00 0.01
(0.31) (0.44) (0.25) (0.81)
GINI coefficient -1103.01 -368.92 -0.09 -0.01
(-1.28) (-0.70) (-0.97) (-0.28)
Tertiary -378.20 -537.58 -0.02 0.00
(-0.96) (-1.49) (-0.30) (0.13)
R-squared 0.95 0.03 0.90 0.17
Adjusted R-squared 0.93 0.01 0.87 0.15
Mean dependent var 48016.35 5886.10 8.48 1.81
S.D. dependent var 87459.82 22984.87 5.91 2.51
F-statistic 61.74 1.68 32.94 8.08
Prob(F-statistic) 0.00 0.13 0.00 0.00
1. ***, **, and * in the table indicate the levels of significance of the t-value at 1%, 5% and 10%, respectively.

42
-2
-1
0
1
2
3
80 82 84 86 88 90 92 94 96 98 00 02 04 06 08
Mean Dcredit to private sector (% of GDP)Mean Gross Enrollment Ratio, SecondaryMean EOMean TEAMean Entry_Density
Figure 1: Comparative trends of the determinants, EO and stock measures of entrepreneurship

43
Figure 2: Comparative trends of Tertiary Education
Figure 3: Comparative trends of Domestic Credit
0
10
20
30
40
50
60
70
80
901
98
0
19
82
19
84
19
86
19
88
19
90
19
92
19
94
19
96
19
98
20
00
20
02
20
04
20
06
20
08
United States Tertiary
Singapore Tertiary
South africa Tertiary
China Tertiary
Vietnam Tertiary
0
50
100
150
200
250
300
19
80
19
82
19
84
19
86
19
88
19
90
19
92
19
94
19
96
19
98
20
00
20
02
20
04
20
06
20
08
United States Dcredit
Singapore Dcredit
South Africa Dcredit
China Dcredit
Vietnam Dcredit
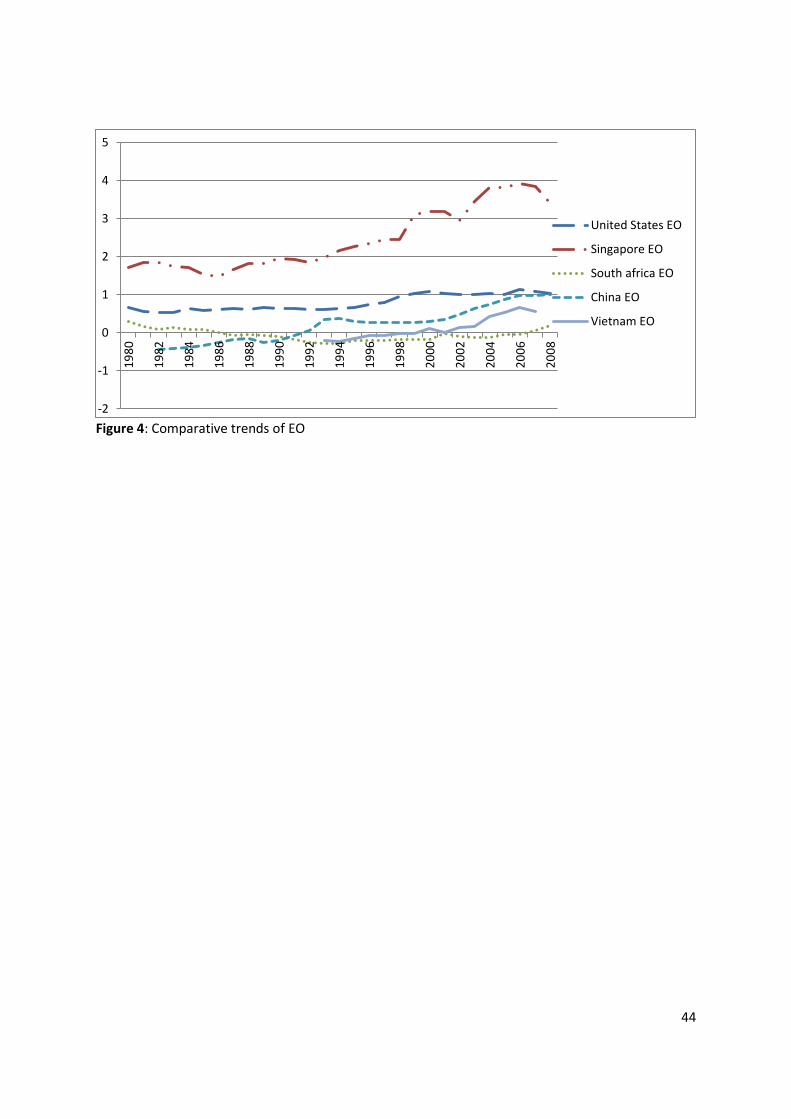
44
Figure 4: Comparative trends of EO
-2
-1
0
1
2
3
4
51
98
0
19
82
19
84
19
86
19
88
19
90
19
92
19
94
19
96
19
98
20
00
20
02
20
04
20
06
20
08
United States EO
Singapore EO
South africa EO
China EO
Vietnam EO