
Institutions and Civil Society Relations in Migori County ...
12
International Journal of Business and Management; Vol. 15, No. 11; 2020 ISSN 1833-3850 E-ISSN 1833-8119 Published by Canadian Center of Science and Education 1 Institutions and Civil Society Relations in Migori County (Kenya): A Social Network Analysis of Weak and Strong Ties Teodora Erika Uberti 1 & Francesco Salsano 2 1 Dipartimento di Economia internazionale, delle istituzioni e dello sviluppo (DISEIS) and CSCC, Università Cattolica del Sacro Cuore, Milano Italy; CRENoS, Università degli Studi di Cagliari, Cagliari, Italy 2 Dipartimento di Scienze Giuridiche “Cesare Beccaria”, Università degli Studi Milano, Milano, Italy, and Birkbeck Centre for Applied Macroeconomics, University of London, London, United Kingdom Correspondence: Teodora Erika Uberti, Dipartimento di Economia internazionale, delle istituzioni e dello sviluppo, Università Cattolica del Sacro Cuore, 20123 Largo Gemelli, 1, Milano, Italy. E-mail: [email protected] Received: August 31, 2020 Accepted: September 16, 2020 Online Published: October 20, 2020 doi:10.5539/ijbm.v15n11p1 URL: https://doi.org/10.5539/ijbm.v15n11p1 Abstract The goal of this paper is to investigate policy networks in Migori, a small county in the Western part of Kenya, near the border with Tanzania and Victoria Lake. In this study we build a unique network database and we use Social Network Analysis techniques to detect the structural relations among different stakeholders (e.g. institutions and civil society actors) within this county and we focus on different topics (i.e. overall interactions, training and cooperation, and for specific decision making on health and nutrition, and agricultural issues). The main results show the importance to distinguish, in policy networks, the rationale of interactions and their intensity, i.e. weak or strong ties. Institutions and civil society organizations are differently connected according to the functions and intensity of networks in which they operate. For example, for health and nutrition the Ministry is the core actor; the opposite occurs in agriculture, where local communities are the core players; and finally in training and coordination we have an intermediate layout, if compared to the two previous ones. Keywords: institutions, organizations, civil society, policy networks, social network analysis 1. Introduction In the last twenty years, social sciences have shown increased attention to the role and influence of civil society actors, such as activists, non-governmental organizations (NGO) and multilateral agencies, in creating and implementing public policy. Most studies focused on the impact that these actors have on domestic public policy and governance. For the most part, this research reflects an interest in understanding how transitions to democracy and participatory institutions shape the provision of equitable and effective public services, as well as the role that civil society plays in designing and implementing policy, particularly in the health sector for developing countries (Gomez, 2016; 2018; McGuire, 2010). Following Dasgupta (2003), civil society actors are known to create networks, whose formation requires many resources and continuous exchange of information. Networks, by their nature, give rise to "communitarian" institutions. So, we need to study pathways by which networks get formed and the reasons why they get formed. Putnam (1995) follows a similar line of research to study the formation of social capital in a country. Starting from this theoretical framework, the goal of this paper is to investigate policy networks in Migori, a small county in the Western part of Kenya, near the border with Tanzania and Victoria Lake (Note 1). In this study we use a unique network database of Migori county and use Social Network Analysis (SNA) techniques to explore the texture of links among different stakeholders (Note 2) (e.g. institutions and civil society) in different issues (i.e. overall interactions, training and cooperation, and for specific decision making on health and nutrition and agricultural matters). Although our evidence is related to a specific county of Kenya, with its own institutional peculiarities, there are many commonalities with other African countries, particularly former British colonies. Furthermore, in several African countries civil society is fragmented into many entities, like tribe, chiefdom and local politicians, which strongly affect public policies, such as health, education, infrastructure, and law enforcement (Note 3). So, our analysis may have broader applicability to similar institutional contexts.
Transcript of Institutions and Civil Society Relations in Migori County ...
International Journal of Business and Management; Vol. 15, No. 11; 2020 ISSN 1833-3850 E-ISSN 1833-8119
Published by Canadian Center of Science and Education
1
Institutions and Civil Society Relations in Migori County (Kenya): A Social Network Analysis of Weak and Strong Ties
Teodora Erika Uberti1 & Francesco Salsano2 1 Dipartimento di Economia internazionale, delle istituzioni e dello sviluppo (DISEIS) and CSCC, Università Cattolica del Sacro Cuore, Milano Italy; CRENoS, Università degli Studi di Cagliari, Cagliari, Italy 2 Dipartimento di Scienze Giuridiche “Cesare Beccaria”, Università degli Studi Milano, Milano, Italy, and Birkbeck Centre for Applied Macroeconomics, University of London, London, United Kingdom Correspondence: Teodora Erika Uberti, Dipartimento di Economia internazionale, delle istituzioni e dello sviluppo, Università Cattolica del Sacro Cuore, 20123 Largo Gemelli, 1, Milano, Italy. E-mail: [email protected] Received: August 31, 2020 Accepted: September 16, 2020 Online Published: October 20, 2020 doi:10.5539/ijbm.v15n11p1 URL: https://doi.org/10.5539/ijbm.v15n11p1 Abstract The goal of this paper is to investigate policy networks in Migori, a small county in the Western part of Kenya, near the border with Tanzania and Victoria Lake. In this study we build a unique network database and we use Social Network Analysis techniques to detect the structural relations among different stakeholders (e.g. institutions and civil society actors) within this county and we focus on different topics (i.e. overall interactions, training and cooperation, and for specific decision making on health and nutrition, and agricultural issues). The main results show the importance to distinguish, in policy networks, the rationale of interactions and their intensity, i.e. weak or strong ties. Institutions and civil society organizations are differently connected according to the functions and intensity of networks in which they operate. For example, for health and nutrition the Ministry is the core actor; the opposite occurs in agriculture, where local communities are the core players; and finally in training and coordination we have an intermediate layout, if compared to the two previous ones. Keywords: institutions, organizations, civil society, policy networks, social network analysis 1. Introduction In the last twenty years, social sciences have shown increased attention to the role and influence of civil society actors, such as activists, non-governmental organizations (NGO) and multilateral agencies, in creating and implementing public policy. Most studies focused on the impact that these actors have on domestic public policy and governance. For the most part, this research reflects an interest in understanding how transitions to democracy and participatory institutions shape the provision of equitable and effective public services, as well as the role that civil society plays in designing and implementing policy, particularly in the health sector for developing countries (Gomez, 2016; 2018; McGuire, 2010). Following Dasgupta (2003), civil society actors are known to create networks, whose formation requires many resources and continuous exchange of information. Networks, by their nature, give rise to "communitarian" institutions. So, we need to study pathways by which networks get formed and the reasons why they get formed. Putnam (1995) follows a similar line of research to study the formation of social capital in a country. Starting from this theoretical framework, the goal of this paper is to investigate policy networks in Migori, a small county in the Western part of Kenya, near the border with Tanzania and Victoria Lake (Note 1). In this study we use a unique network database of Migori county and use Social Network Analysis (SNA) techniques to explore the texture of links among different stakeholders (Note 2) (e.g. institutions and civil society) in different issues (i.e. overall interactions, training and cooperation, and for specific decision making on health and nutrition and agricultural matters). Although our evidence is related to a specific county of Kenya, with its own institutional peculiarities, there are many commonalities with other African countries, particularly former British colonies. Furthermore, in several African countries civil society is fragmented into many entities, like tribe, chiefdom and local politicians, which strongly affect public policies, such as health, education, infrastructure, and law enforcement (Note 3). So, our analysis may have broader applicability to similar institutional contexts.
ijbm.ccsenet.org International Journal of Business and Management Vol. 15, No. 11; 2020
2
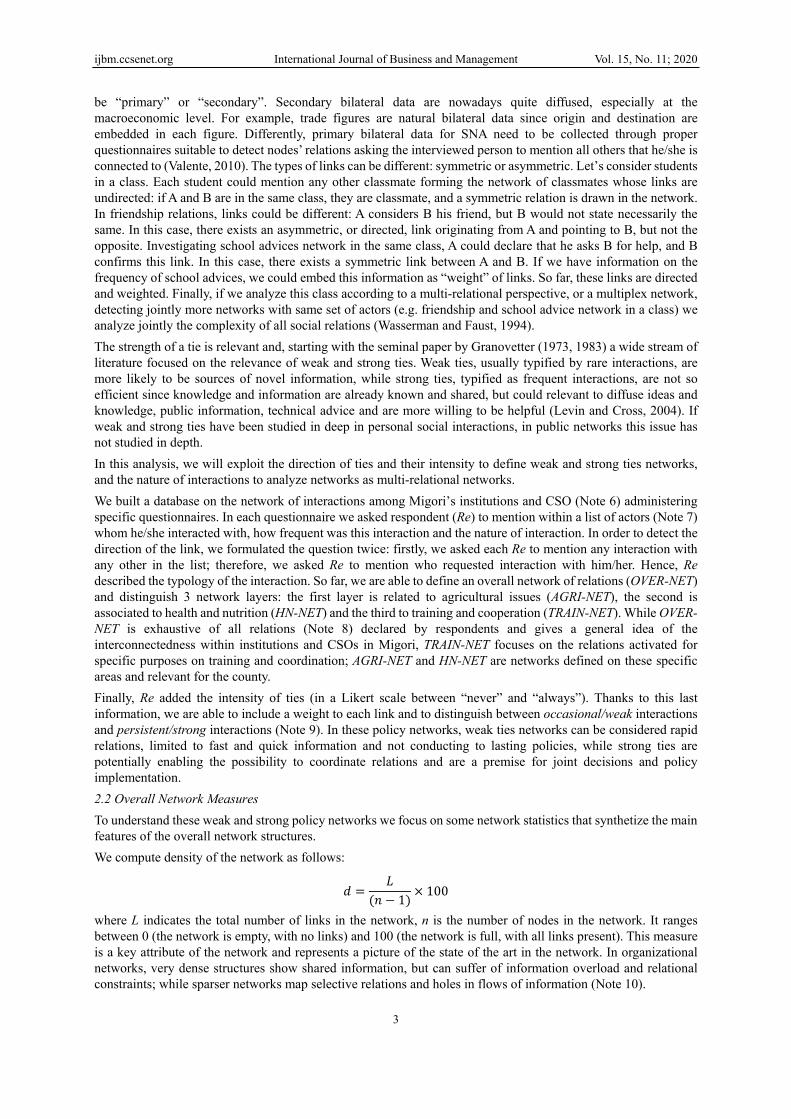
SNA is an interdisciplinary approach applying mathematical, statistical, computing methods in order to study “networks”. “A social network is a set of socially relevant nodes connected by one or more relations. Nodes, or network members, are the units that are connected by the relations whose patterns we study. These units are most commonly persons or organizations, but in principle any unit that can be connected to other units can be studied as nodes” (Marin & Wellman, 2011, pp. 11). Hence, differently from standard statistical analyses, SNA allows to detect the structural properties of social actions. This paper acknowledges the multilayered nature of institutions (Ostrom, 2005), a representation that shapes the way relations between institutions and policy networks is understood. The process of policy making is affected by both formal and informal institutions (Note 4) governing the actors within their particular context (Note 5). The central question concerns in which way some network qualities might affect the policy-making process. The research questions (RQ) of this paper are the following: in a developing area (like Migori county), which are the main structural features of policy networks among formal institutions and civil society organizations? Are there structural differences between weak and strong ties policy networks? Are core players the same in all policy networks, or are there some differences in terms of organizations and membership? What kind of network structures facilitates collective action? The paper is organized as follows: in the second paragraph, we present SNA methodology, key SNA indicators and the data; in the third paragraph we detail the main results of our RQs. Final considerations on main results conclude the paper. 2. Methodology and Data In this paper, we adopt SNA techniques and compute overall network indexes to analyze policy networks among formal institutions and civil society organizations (CSOs) in Migori, a Kenyan county located in the Western part of Kenya, near the border with Tanzania and Victoria Lake (Figure 1).
Figure 1. Kenya counties
Source: KNBS, 2020, page v. 2.1 Methodology SNA is a diffused method of analysis to study actors (i.e. individual subjects, firms, organizations, countries, and so on…) and their relations (Wasserman & Faust, 1994). In this paper, we focus on policy networks. Policy networks “identify the important actors – governmental ad non governmental organizations, interest groups, and persons - involved in policymaking institutions, to describe and explain the structure of their interactions during policy making processes and to predict collective policy decisions and outcomes” (Knoke, 2011, p. 210). Since the object of analysis of SNA are relations, the main feature for SNA is that data need to be relational, connecting different nodes, in other words they need to be “bilateral”. As all other data, sources for SNA data can
ijbm.ccsenet.org International Journal of Business and Management Vol. 15, No. 11; 2020
3
be “primary” or “secondary”. Secondary bilateral data are nowadays quite diffused, especially at the macroeconomic level. For example, trade figures are natural bilateral data since origin and destination are embedded in each figure. Differently, primary bilateral data for SNA need to be collected through proper questionnaires suitable to detect nodes’ relations asking the interviewed person to mention all others that he/she is connected to (Valente, 2010). The types of links can be different: symmetric or asymmetric. Let’s consider students in a class. Each student could mention any other classmate forming the network of classmates whose links are undirected: if A and B are in the same class, they are classmate, and a symmetric relation is drawn in the network. In friendship relations, links could be different: A considers B his friend, but B would not state necessarily the same. In this case, there exists an asymmetric, or directed, link originating from A and pointing to B, but not the opposite. Investigating school advices network in the same class, A could declare that he asks B for help, and B confirms this link. In this case, there exists a symmetric link between A and B. If we have information on the frequency of school advices, we could embed this information as “weight” of links. So far, these links are directed and weighted. Finally, if we analyze this class according to a multi-relational perspective, or a multiplex network, detecting jointly more networks with same set of actors (e.g. friendship and school advice network in a class) we analyze jointly the complexity of all social relations (Wasserman and Faust, 1994). The strength of a tie is relevant and, starting with the seminal paper by Granovetter (1973, 1983) a wide stream of literature focused on the relevance of weak and strong ties. Weak ties, usually typified by rare interactions, are more likely to be sources of novel information, while strong ties, typified as frequent interactions, are not so efficient since knowledge and information are already known and shared, but could relevant to diffuse ideas and knowledge, public information, technical advice and are more willing to be helpful (Levin and Cross, 2004). If weak and strong ties have been studied in deep in personal social interactions, in public networks this issue has not studied in depth. In this analysis, we will exploit the direction of ties and their intensity to define weak and strong ties networks, and the nature of interactions to analyze networks as multi-relational networks. We built a database on the network of interactions among Migori’s institutions and CSO (Note 6) administering specific questionnaires. In each questionnaire we asked respondent (Re) to mention within a list of actors (Note 7) whom he/she interacted with, how frequent was this interaction and the nature of interaction. In order to detect the direction of the link, we formulated the question twice: firstly, we asked each Re to mention any interaction with any other in the list; therefore, we asked Re to mention who requested interaction with him/her. Hence, Re described the typology of the interaction. So far, we are able to define an overall network of relations (OVER-NET) and distinguish 3 network layers: the first layer is related to agricultural issues (AGRI-NET), the second is associated to health and nutrition (HN-NET) and the third to training and cooperation (TRAIN-NET). While OVER-NET is exhaustive of all relations (Note 8) declared by respondents and gives a general idea of the interconnectedness within institutions and CSOs in Migori, TRAIN-NET focuses on the relations activated for specific purposes on training and coordination; AGRI-NET and HN-NET are networks defined on these specific areas and relevant for the county. Finally, Re added the intensity of ties (in a Likert scale between “never” and “always”). Thanks to this last information, we are able to include a weight to each link and to distinguish between occasional/weak interactions and persistent/strong interactions (Note 9). In these policy networks, weak ties networks can be considered rapid relations, limited to fast and quick information and not conducting to lasting policies, while strong ties are potentially enabling the possibility to coordinate relations and are a premise for joint decisions and policy implementation. 2.2 Overall Network Measures To understand these weak and strong policy networks we focus on some network statistics that synthetize the main features of the overall network structures. We compute density of the network as follows: 𝑑 = 𝐿(𝑛 − 1) × 100
where L indicates the total number of links in the network, n is the number of nodes in the network. It ranges between 0 (the network is empty, with no links) and 100 (the network is full, with all links present). This measure is a key attribute of the network and represents a picture of the state of the art in the network. In organizational networks, very dense structures show shared information, but can suffer of information overload and relational constraints; while sparser networks map selective relations and holes in flows of information (Note 10).
ijbm.ccsenet.org International Journal of Business and Management Vol. 15, No. 11; 2020
4
The average degree is the average number of direct links in the network and is computed as the ratio between the total number of total links and the number of nodes in the network. The information is complementary to density and represents how many connections, on average, an actor has in the network. With networks of the same sizes, as in this case, two useful information are the share of isolated nodes with respect to n and the share of nodes belonging to the main component with respect to n. Isolated nodes represent unconnected subjects, not part of the communication in the network, and show the level of fragmentation of the system. Conversely, a measure of the connectedness of the network is the presence and the size of the largest component, i.e. a sub-group that includes the majority of the actors in the network. A network with several isolated sub-components reflects imbalance within the network; while a network with one main large component reflects lower fragmentation into sub-groups. Reciprocity (R) is computed as the ratio between reciprocated arcs and the total number of arcs (Borgatti et al. 2002) as follows: 𝑅 = 𝐴 = 1 𝑎𝑛𝑑 𝐴 = 1𝐴 = 1 𝑜𝑟 𝐴 = 1
where Aij indicates a link between from i to j. The value of this index ranges between 0 (no links are reciprocated) and 1 (all links are mutual). This index detects the mutuality of links, hence if both actors confirm the existence of a relation. If the ratio of reciprocal links is high, actors tend to cluster together forming cohesive and trusted relations that foster cooperative behavior. Similarly, an index that detect the presence of clustered behaviors is the overall clustering coefficient, CC (Watts, 1999), i.e. the average of all actors’ clustering coefficients, a measure of the density of his/her open neighborhood. The value ranges between 0 (i.e. actors are not strictly interconnected) and 1 (i.e. actors are completely interconnected). Prominence and control are fundamental features of social relations, and centrality is a key indicator that captures these features. Freeman (1979) designed three different perspectives of centrality in the network: degree, i.e. direct relations; betweenness, i.e. the frequency a node lies on the shortest path connecting other nodes in the network; and closeness, i.e. the inverse of the average distance to all other nodes in the network. Hence different centrality indexes can be computed for each node and for the overall network (centralization). Centralization captures an overall pattern of centrality among nodes and computes, for the whole network, if one or few pivotal nodes emerge in the network and concentrate all relational flows. Centralization is computed as a standard deviation from the highest value of the centrality (Valente, 2010), and ranges between 0 (no star actor is managing the diffusion of relations since any actor of the network is linked to everybody else) and 1 (one actor is central, is broadcasting information and reaches immediately all actors in the network). Very centralized networks, with one or few central and influential actors, could be efficient since few actors reach immediately the rest of the network, but they could be gatekeeper with disproportionate influence. Conversely, low centralized networks reflect egalitarian positions in the network but could present coordination problems. A final overall structural property of a network is defined by diameter (D) and average path length (APL). The former is the length of the longest path, while the latter is the average distance between nodes (excluding isolated nodes). Both measures are macro-features of the network topology and suggest the embeddedness of people in the network: the higher is the distance, more time information takes to cross the network, or in some cases, since distance is high, information flow does not take place at all. In order to analyze the driving forces of links fixing, we compute the E-I index. In real social networks, links are not randomly distributed, but links determinants are driven by exogenous attributes of nodes, like gender or commonality of language (Newman, 2003). In particular, two nodes with the same gender are connected with a higher probability if compared to two nodes with different gender, because belonging to the same group increases the opportunity to be embedded. The network is homophily, if similar groups are close and tend to exclusively link together. Otherwise, the network has disassortative features (or heterophile), i.e. groups tend to be open and nodes with different characteristics tend to connect together. The E-I index is an overall network feature and ranges between -1 (i.e. the network is homophile) and +1 (i.e. the network is heterophile). If the value is null, the network has no particular patterns emerge. We compute the E-I index as follows: 𝐸 − 𝐼 𝑖𝑛𝑑𝑒𝑥 = 𝐸 − 𝐼𝐸 + 𝐼
Where E represents links external to the group and I identifies the links internal in the group. In this analysis,
ijbm.ccsenet.org International Journal of Business and Management Vol. 15, No. 11; 2020
5
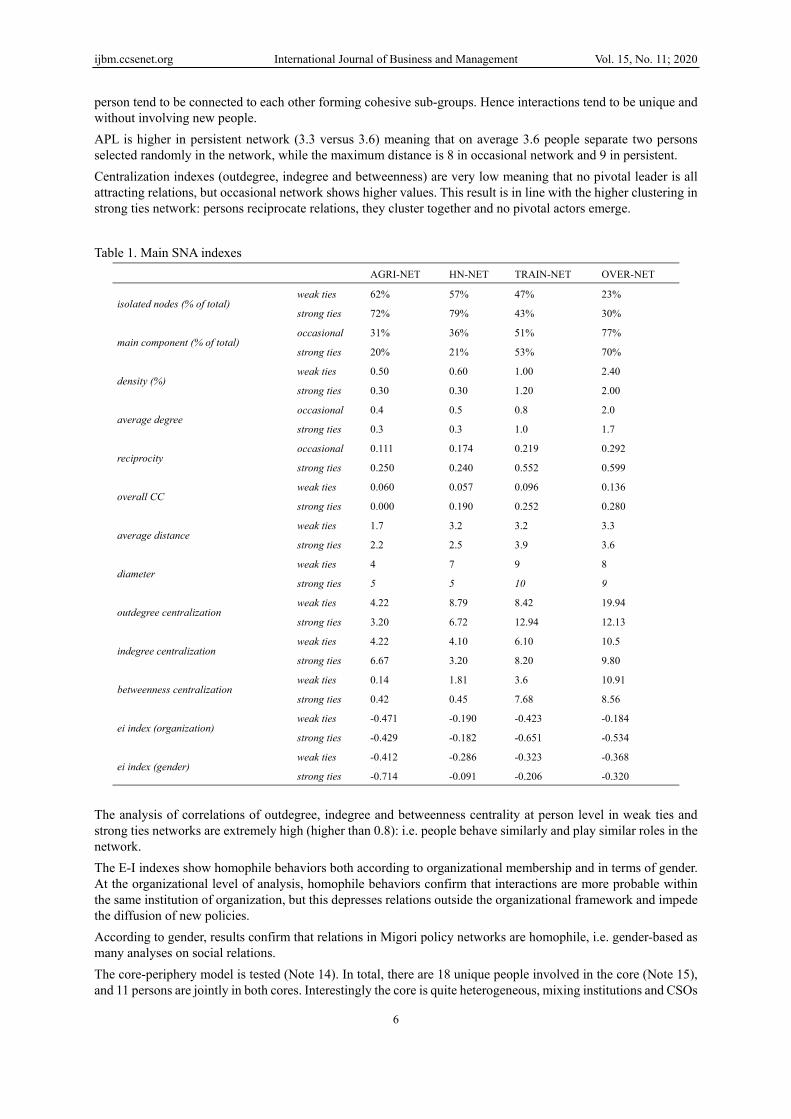
groups are defined according to gender and organizational membership. In order to calculate the extent to which two layers are similar or not we compute the Quadratic Assignment Procedure (QAP) correlation, an index that ranges between -1, the networks compared show opposite structures, and +1, i.e. networks structures completely overlap, or links are the same in both structures (Krackhardt, 1988). Following Borgatti and Everett (1999) we verify if these networks are similar to an ideal core-periphery network. In these models there exists a small group of actors (i.e. the core) highly connected to each other and linked to other actors (i.e. the periphery), whose ties with the whole network are managed exclusively by the core. The analysis of the correlation between the ideal core-periphery model and Migori networks allows evaluating if Migori players behave in a core-periphery environment, and the inspection of cores’ composition detects if there is a unique core or different ones according to layers and ties intensity networks. 2.3 Data Migori is one of the 47 counties in Kenya (Figure 1), according to the recent administrative organization that took place in 2010. In 2019, it has a population of 1,116,436 inhabitants (with 536,187 males and 580,214 females, and 35 intersex). The age distribution is 49% (0–14 years), 48% (15–64 years) and 3%, over 65 years. The young composition of population is due to high fertility rates, as shown by the highest percentage of household size: 41% of households has 4-6 children. The population density is 353 per km2 and 43% of the population live below the poverty line (KNBS, 2020). In 2017, according to data by the (KNBS, 2018) Migori’s GDP per capita USD (PPP) is 1,756, which ranks it as one of the lowest income counties in Kenya (Note 11). Migori’s main economic activities include agriculture, fishing and mining. There is some small scale gold mining (KNBS, 2020). Between mid-April and beginning of May 2018, thanks to a WeWorld project, we administered 20 questionnaires to 8 main formal institutions and CSOs actors extremely active in Migori. We interviewed people from Ministries of Agriculture, of Education and of Health, from local socio-political institutions (like representatives in Migori County Assembly and members of local communities) and from NGOs (like Dala Kiye, Kenyan Red Cross and WeWorld). We interviewed 15 males and 5 females, aged 44 on average, and most of them (11) with a secondary school diploma, and the remaining with at least a university degree. All interviewed persons are fulltime employed, working in these organizations since long time, and only 4 of them started working few years ago. In general, their experience in these institutions and organization is consolidated, knowing several aspects of the mechanisms of interactions inside and outside their organizations and in the county. In addition, all of them are multitasking playing coordination, administration, advocacy and communication roles. Thanks to the network procedure we obtained a database that includes 87 subjects (64 male and 19 female (Note 12)), 15 actors are from ministries, 6 from NGOs, 10 from local communities and 21 from different sectors of civil society (e.g. foundations and private sector). 3. Main Results Network results on Migori networks are shown in figure 2 and 3, and networks indexes are synthetized in table 1 (Note 13). In this section, firstly we present results on weak (or occasional) and strong (or persistent) ties OVERT-NET in order to synthetize the overall behavior of institutions and organizations, then we focus on all single layers (i.e. AGRI-NET, HN-NET and TRAIN-NET). Figure 2 shows weak and strong ties OVER-NET. These networks are the denser compared to other layers, in fact they include all declared relations. Interestingly the weak ties network is denser: it is easier to contact occasionally somebody rather than to maintain persistent relations with all actors of the decision process. These figures are confirmed by the quota of isolated nodes (less than one third of the nodes is isolated) and by the dimension of the largest components, which includes all connected actors. No intermediate subgroups emerge: hence, an actor is connected to the main component or is completely isolated. In Migori policy networks, on average, each actor has no more than 2 persons (2.0 in weak ties network and 1.7 in strong ties network). Focusing on reciprocal ties persistent network shows 60% of total links that is mutual confirming that people create mutually exclusive relations generating cohesive relations. This is good for overall interactions because enable reciprocal knowledge, are less costly and reinforce trust. On the other hand, mutual interactions exclude other potential interactions to emerge. CC are quite low, but higher in persistent network: i.e. people connected to a third
ijbm.ccsenet.org International Journal of Business and Management Vol. 15, No. 11; 2020
6
person tend to be connected to each other forming cohesive sub-groups. Hence interactions tend to be unique and without involving new people. APL is higher in persistent network (3.3 versus 3.6) meaning that on average 3.6 people separate two persons selected randomly in the network, while the maximum distance is 8 in occasional network and 9 in persistent. Centralization indexes (outdegree, indegree and betweenness) are very low meaning that no pivotal leader is all attracting relations, but occasional network shows higher values. This result is in line with the higher clustering in strong ties network: persons reciprocate relations, they cluster together and no pivotal actors emerge.
Table 1. Main SNA indexes
AGRI-NET HN-NET TRAIN-NET OVER-NET
isolated nodes (% of total) weak ties 62% 57% 47% 23%
strong ties 72% 79% 43% 30%
main component (% of total) occasional 31% 36% 51% 77%
strong ties 20% 21% 53% 70%
density (%) weak ties 0.50 0.60 1.00 2.40
strong ties 0.30 0.30 1.20 2.00
average degree occasional 0.4 0.5 0.8 2.0
strong ties 0.3 0.3 1.0 1.7
reciprocity occasional 0.111 0.174 0.219 0.292
strong ties 0.250 0.240 0.552 0.599
overall CC weak ties 0.060 0.057 0.096 0.136
strong ties 0.000 0.190 0.252 0.280
average distance weak ties 1.7 3.2 3.2 3.3
strong ties 2.2 2.5 3.9 3.6
diameter weak ties 4 7 9 8
strong ties 5 5 10 9
outdegree centralization weak ties 4.22 8.79 8.42 19.94
strong ties 3.20 6.72 12.94 12.13
indegree centralization weak ties 4.22 4.10 6.10 10.5
strong ties 6.67 3.20 8.20 9.80
betweenness centralization weak ties 0.14 1.81 3.6 10.91
strong ties 0.42 0.45 7.68 8.56
ei index (organization) weak ties -0.471 -0.190 -0.423 -0.184
strong ties -0.429 -0.182 -0.651 -0.534
ei index (gender) weak ties -0.412 -0.286 -0.323 -0.368
strong ties -0.714 -0.091 -0.206 -0.320
The analysis of correlations of outdegree, indegree and betweenness centrality at person level in weak ties and strong ties networks are extremely high (higher than 0.8): i.e. people behave similarly and play similar roles in the network. The E-I indexes show homophile behaviors both according to organizational membership and in terms of gender. At the organizational level of analysis, homophile behaviors confirm that interactions are more probable within the same institution of organization, but this depresses relations outside the organizational framework and impede the diffusion of new policies. According to gender, results confirm that relations in Migori policy networks are homophile, i.e. gender-based as many analyses on social relations. The core-periphery model is tested (Note 14). In total, there are 18 unique people involved in the core (Note 15), and 11 persons are jointly in both cores. Interestingly the core is quite heterogeneous, mixing institutions and CSOs
ijbm.ccsenet.org International Journal of Business and Management Vol. 15, No. 11; 2020
7
actors: majority of persons belongs to the Ministries of Agriculture and Health, and remaining are from civil society (i.e. WeWorld, Local community, Migori County Assembly - MCA and Dala Kiye). Disentangling 3 layers that constitute OVER-NET, we observe different structures (figure 3): AGRI-NET and HN-NET are pretty similar, while TRAIN-NET structures are different. All AGRI-NET and HN-NET are very sparse, with average degree less than one person, the majority of nodes is isolated, reciprocity is low, and CC as well. In general, all these networks show the lowest levels of centralization indicating that no central actors concentrate relations. Different patterns characterizes weak ties and strong ties TRAIN-NET: these networks are denser, hence the average degree is nearly 1 person per network (0.8 in occasional network and 1 in persistent network). Similarly to OVER-NET, TRAIN-NET are more clustered in strong ties network than in weak ties network (as reciprocity and CC show). For persistent training and coordination network, the interaction needs to be reciprocal in order to reach the target. Centralizations figures are pretty low, but differently from OVER-NET the more centralized is strong ties network suggesting that training and coordination interactions need a top-down management that tries to concentrate in few persons several relations, acting as manager and broadcaster of interactions. QAP correlations among these 3 layers show that there is almost no association (Note 16), and this is confirmed also by very low Pearson correlations between degrees and betweenness centralities. Hence, even if AGRI-NET and HN-NET are similar according to overall network indexes, positions of persons are different. Actors are playing different roles according to interaction issues with a pretty high specialization on topics. E-I index are in line with OVER-NET results: all these networks are homophile, indicating that similar persons (according to membership or gender) interact more than with dissimilar actors. This pattern is confirmed graphs in figure 3 that show agglomeration of nodes with the same membership. The only exception is this value computed on persistent HN-NET (-0.091) which is nearly null, confirming that on health and nutrition issues interactions go beyond gender. This result is probably because the perception of health and nutrition issues is more female-based. We conclude these results section with the core-periphery analysis on 3 different layers. The fits of this model are different for each network (Note 17), but in general it works well. Among layers, cores are different both for dimension and for composition. Cores’ dimensions are different between weak ties and strong ties networks, and cores in weak ties networks are bigger (i.e. 10 actors versus 3 actors in AGRI-NET, 8 actors versus 5 actors in HN-NET). TRAIN-NET is confirmed to be different, in fact both cores include 9 persons. Focusing on cores’ membership, these cores are unique since none of the actors belongs jointly to all networks. Apart from the area of interaction (agriculture or health and nutrition), occasional and persistent networks cores are different. In weak ties AGRI-NET, ministries of Agriculture and Education constitute core actors together with Local Community players, MCA and Dala Kiye, while in strong ties network the core in constituted exclusively by Local Community. These bottom-up relations are probably related to the local nature of agricultural topics. In weak ties, HN-NET core includes the Ministry of Health, of Education and few actors of the civil society (WeWorld and Dala Kiye), while in strong ties HN-NET the core is less heterogeneous and more selective including only the Ministry of Health and Dala Kiye.

ijbm.ccsenet.org International Journal of Business and Management Vol. 15, No. 11; 2020
8
Weak ties Strong ties
Figure 2. OVER-NET Notes. Legend: box shape indicates a Re, circle shape indicates a cited actor; colours indicate same institutions or organization.
Weak ties AGRI-NET (33 nodes) Strong ties AGRI-NET (24 nodes)
Weak ties HN-NET (37 nodes) Strong ties HN-NET (18 nodes)
Weak ties TRAIN-NET (46 nodes) Strong ties TRAIN-NET (50 nodes)
ijbm.ccsenet.org International Journal of Business and Management Vol. 15, No. 11; 2020
9
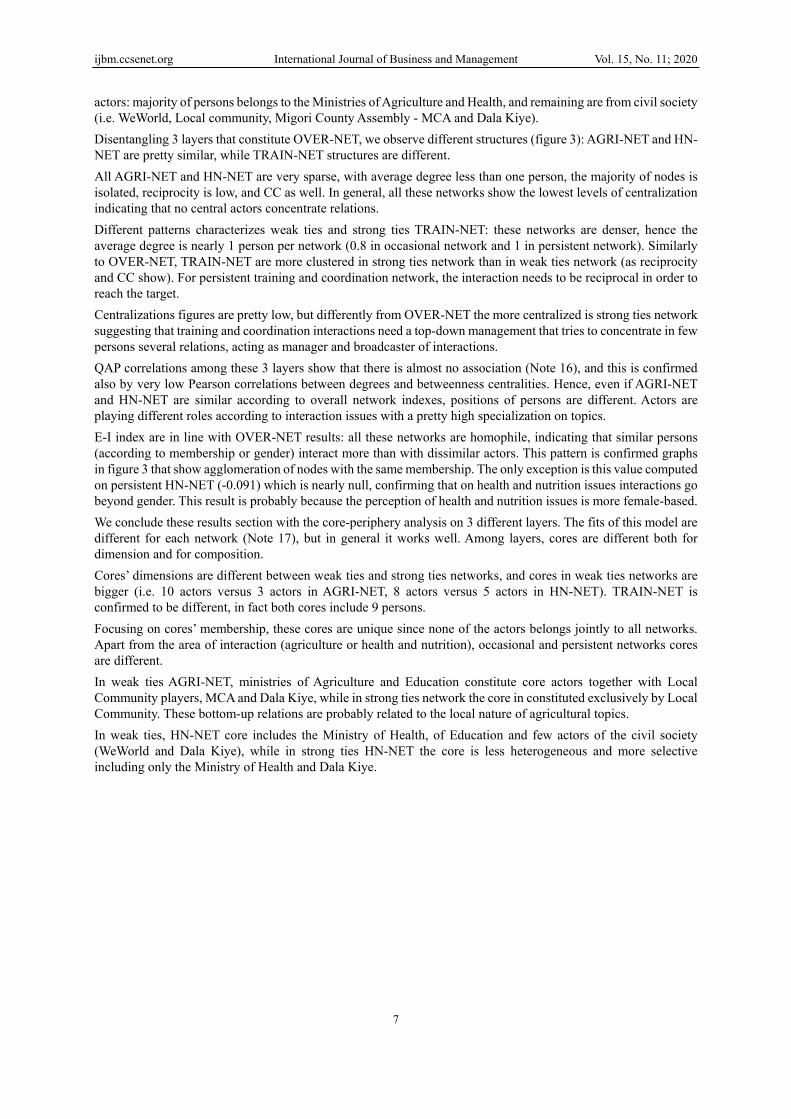
Figure 3. Networks of weak and strong ties in Migori county (only connected components)
Notes. Legend: box shape indicates a Re, circle shape indicates a cited actor; colors indicate same institutions or organization. In weak and strong ties, TRAIN-NET nearly 75% of core actors is shared and heterogeneous, including both Ministries of Agriculture and Health and civil society (like Dala Kiye, WeWorld, Kenyan Red Cross, Local community and MCA). In other words, in training and cooperation few actors are managing all interactions. These results on cores’ compositions confirm that weak and strong ties are strictly related to the complexity of interactions. When agricultural and health and nutrition interactions are rare and occasional, several actors are at play and the exclusive core includes institutions and CSOs. Conversely, when interactions become more intense, the cores become smaller and homogenous with few selected players. Cores in training and coordination show different actors: since their nature is more general, more actors (i.e. CSOs and formal institutions) are always involved. Respondents commented the weakness and strengths of interactions. A basic textual analysis on these comments (Note 18) show that forces are inclusion, consultation, coordination, community, integration, but severe weaknesses are the lack of transparency and follow-ups on ongoing activities. In policy networks, transparency is crucial for the implementation of networks because enhance the trust of the members of the network. We conclude that policy networks in this developing area are at place showing a complex texture of relations even in weak ties networks, but some fragilities emerge. For example, mutuality of relations risks clustering actors in exclusive groups that do not interact with other institutional actors, impeding an efficient diffusion of interactions. Core-periphery analysis shows different types of organizations of the core. Firstly, if relations are occasional, all cores are quite heterogeneous and include both formal institutions (like ministries) and CSOs, but when interactions become continuous and stronger, cores change and differentiate according to the issues of interactions. In some cases (e.g. agriculture), core actors are exclusively local with no governmental players. In other cases (e.g. health and nutrition), government institutions are present and interact exclusively with selected players from civil society. Finally when issues are more generic (e.g. training and cooperation), government institutions and CSOs actors strictly interact enabling the transmission of information. 5. Conclusion In this paper the potential capacity of policy networks to form institutional rules, which shape the behavior of civil society actors in the process of organization of a territory, is assumed without neglecting the impact that institutions have a higher level. This approach could be considered complementary to the political economy literature (Note 19) that analyses institutional “weakness”, or lack of “capacity” of poor countries states, as a fundamental barrier to their development. In several poor countries, there are states incapable or unwilling to provide basic public goods. This analysis showed the importance to distinguish, in policy networks, the rationale of interactions and their intensity, i.e. weak and strong ties. Institutions and CSOs are differently connected according to the functions and intensity of networks: in training and coordination networks (TRAIN-NET) there core includes all formal institutions and CSOs since this activity is quite broad. This result does not hold for other interactions purposes. For strong ties HN-NET, there is a pivotal

ijbm.ccsenet.org International Journal of Business and Management Vol. 15, No. 11; 2020
10
player (i.e. the Ministry of Health) coordinating relations, and only few selected actors from CSOs are placed in the core. Differently in strong AGRI-NET, the Local Community (which is responsible in connecting players from different organizational levels) constitutes a unique and exclusive core. In other words, while health and nutrition questions need a continuous involvement of formal institutions, agricultural issues are managed by local stakeholders filtering formal institutions information being a real community-based activity. This result is in line with Posner (1980): in the African context, local networks are a mean of reducing problems of moral hazard and adverse selection, because monitoring one another’s activities is not costly within the community of the village, since, in many cases, these relations are also kinship relations. Hence, these networks are extremely trustful within the group, but not transparent and not accessible to external members of the network. A policy implication deriving from these results indicate that the national and local communities should focus greater attention and resources to strengthen systems to control and to promote transparency and accountability throughout the public sector in order to better exploit the potential of strong and weak ties networks. Acknowledgments This paper is a part of a wider research project realized in the framework of the Nutrition program carried out by WeWorld under the financial support of EU (Project DCI –NSPAVD/2016/372-763) and Lombardy Region (call for proposal 2016). We thank WeWorld for their support in administering questionnaires in Migori County and support in identifying people to interview. References Acemoglu, D., Reed, T., & Robinson, J. A. (2014). Chiefs: Elite Control of Civil Society and Economic
Development in Sierra Leone. Journal of Political Economy, 122, 319-368. https://doi:10.1086/674988 Acemoglu, D., Chaves, I. N., Osafo-Kwaako, P., & Robinson, J. A. (2016). Indirect Rule and State Weakness in
Africa: Sierra Leone in Comparative Perspective. In S. Edwards, S. Johnson, and D. N. Weil, (Eds.), African Successes (pp. 343-370). Chicago: University of Chicago Press.
Batagelj, V., & Mrvar, A. (2020). Pajek, A Program for Large Network Analysis. http://vlado.fmf.uni-lj.si/pub/networks/pajek/
Borgatti, S. P., & Everett, M. G. (1999). Models of core/periphery structures. Social Networks, 21, 375-395. https://doi.org/10.1016/S0378-8733(99)00019-2
Borgatti, S. P., Everett, M. G., & Freeman, L. C. (2002). Ucinet 6 for Windows: Software for Social Network Analysis. Harvard, MA: Analytic Technologies.
Dasgupta, P. (2003). Social Capital and Economic Performance: Analytics. In E. Ostrom & T. K. Ahn (Eds.), Critical Studies in Economic Institutions: Foundations of Social Capital (pp. 309-333). Cheltenham: Edward Elgar.
Freeman, L. C. (1979). Centrality in Social Networks. Conceptual Clarification. Social Networks, 1, 215-239. https://doi.org/10.1016/0378-8733(78)90021-7
Freeman, R. E. (1984). Strategic management: A stakeholder approach. Boston: Pitman. Gómez, E. J. (2016). Constitutions, civil society, and the politics of pro-poor health insurance programs in the
emerging economies. Global Health Governance, 10, 67-96. Gómez, E. J. (2018). Civil society in global health policymaking: a critical review. Globalization & Health, 14, 1-
11. https://doi.org/10.1186/s12992-018-0393-2 Granovetter, M. (1973). The Strength of Weak Ties. American Journal of Sociology, 78, 1360-80.
https://doi.org/10.2307/2776392 Granovetter, M. (1983). The Strength of Weak Ties: A Network Theory Revisited. Sociological Theory, 1, 201-
233. https://doi.org/10.2307/202051 Kenya National Bureau of Statistics (KNBS). (2018). Economic Survey 2018. Nairobi: Kenya. Retrieved from
https://africacheck.org/wp-content/uploads/2019/03/Economic-Survey-2018.pdf Kenya National Bureau of Statistics (KNBS). (2020). 2019 Kenya Population and Housing Census. Volume IV:
Distribution of Population by Socio-Economic Characteristics. Retrieved from https://africacheck.org/wp-content/uploads/2020/06/VOLUME-IV-KPHC-2019.pdf
Knoke, D. (2011). Policy Networks. In J. Scott & P. J. Carrington (Eds.), The SAGE handbook of social network analysis (pp. 191-215). London: Sage.
ijbm.ccsenet.org International Journal of Business and Management Vol. 15, No. 11; 2020
11
Krackhardt, D. (1988). Predicting with networks: Nonparametric multiple regression analysis of dyadic data. Social networks, 10, 359-381. https://doi.org/10.1016/0378-8733(88)90004-4
Levin, D., & Cross R. (2004). The Strength of Weak Ties You Can Trust: The Mediating Role of Trust in Effective Knowledge Transfer. Academy of Management Annual Meeting Proceedings, 50, 1477-1490. https://doi.org/10.1287/mnsc.1030.0136
Marin, A., & Wellman, B. (2011). Social network analysis: An introduction. In J. Scott & P. J. Carrington (eds.), The SAGE handbook of social network analysis, 11-25. London: Sage.
Marsden, P. V., Karen, E., & Campbell K. E. (1984). Measuring Tie Strength, Social Forces, 63, 482-501. https://doi.org/10.1093/sf/63.2.482
McGuire, J. (2010). Health, Wealth, and Democracy. New York: Cambridge University Press. Newman, M. E. (2003). Mixing patterns in networks, Physical Review E, 67, 026126,
https://doi.org/10.1103/PhysRevE.67.026126 Ostrom, E. (2005). Understanding Institutional Diversity. Princeton, NJ: Princeton University Press. Posner, R. A. (1980). A theory of primitive society, with special references to law, Journal of Law and Economics,
23, 1-53. https://doi.org/10.2307/725284 Putnam, R. D. (1995). Bowling Alone: America’s Declining Social Capital, Journal of Democracy, 6, 65-78. Sandström, A., & Carlsson, L. (2008). The performance of policy networks: the relation between network structure
and network performance, Policy Studies Journal, 36, 497-524. https://doi.org/10.1111/j.1541-0072.2008.00281.x
Uberti, T. E., & Rotondi, C. (2019). Networks of relations in Migori County (Kenya). Some findings on health and nutrition topics. Milano: Vita Pensiero.
Valente, T. (2010). Social Networks and Health: Models, Methods, and Applications, American Journal of Epidemiology, 172, 488-488. https://doi.org/10.1093/aje/kwq243
Wasserman, S., & Faust, K. (1994). Social Network Analysis: Methods and Applications. Cambridge: Cambridge University Press.
Watts, D. J. (1999). Small worlds. Princeton, NJ: Princeton University Press. Notes
Note 1. The paper is an in deep analysis of a broader research financed by WeWorld whose general results are presented in Uberti and Rotondi (2019). Note 2. In the literature, there are several definitions of stakeholder. We refer to the original one which is widely used (Freeman, 1984, p. 46): “A stakeholder in an organization is (by definition) any group or individual who can affect or is affected by the achievement of the organization's objectives.” Note 3. For a broad discussion on this issue see Acemoglu et al. (2014).
Note 4. We remind that informal institutions include all the subjects and organizations that are able to influence the public policy activity of a country. Note 5. A similar approach is followed by Sandström and Carlsson (2008) for a comparative case study of network within the higher education policy sector in Sweden. Note 6. For details see section 2.3. Note 7. The list was an open roster of names since each respondent was able to add as new names as possible if necessary. Note 8. Apart from agricultural, health and nutrition and training and coordination issues, respondents declared to maintain interactions for schooling and children care, for specific projects, for disaster management, and so on. Since these issues are quite rare, we keep them in the OVER-NET, while in the analysis we focus on 3 layers of networks.
ijbm.ccsenet.org International Journal of Business and Management Vol. 15, No. 11; 2020
12
Note 9. Relations labelled as “at least once” and “sometimes” form the occasional/weak networks; while relations defined as “often” and “always” form the persistent/strong networks. The distribution of these links is fairly divided into two parts, hence there are no distortions. Madsen and Campbell (1984) sustain there are several measures to compute weak and strong ties, and they mention intensity as a possible method. Note 10. Usually networks from microdata and collected using questionnaires show very low density values due to the response rate, to the possibility to interview the entire population the network and to the probability that answers are not reciprocated by respondents (Valente, 2010). Note 11. In 2017, Kenya GDP per capita USD (PPP) is 3,244 (KNBS, 2018).
Note 12. For 4 persons gender is missing. Note 13. We used UCINET 6.176 to compute indexes (Borgatti et al., 2002) and Pajek 5.09 to draw graphs (Batageli and Mrvar 2020). Note 14. Correlations are 0.415 for weak ties network and 0.441 for strong ties network. Note 15. In the occasional network, there are 15 persons and the persistent network there are 14. Note 16. Correlations values are nearly null. Note 17. In particular, for occasional AGRI-NET correlation is 0.281, for persistent AGRI-NET is 0.408; correlations for occasional and persistent HN-NET values are 0.351 and 0.518; finally for occasional and Note 18. persistent TRAIN-NET values are 0.420 and 0.441. Note 19. See Uberti and Rotondi (2019) for this textual analysis. Note 20. See Acemoglu et al. (2016) for an extensive survey on this literature. Copyrights Copyright for this article is retained by the author(s), with first publication rights granted to the journal. This is an open-access article distributed under the terms and conditions of the Creative Commons Attribution license (http://creativecommons.org/licenses/by/4.0/).