INSTITUTIONAL PRESENTATION 2Q21
120
1 INSTITUTIONAL PRESENTATION 2Q21
Transcript of INSTITUTIONAL PRESENTATION 2Q21

1
INSTITUTIONALPRESENTATION
2Q21

22
Disclaimer
This presentation may contain forward-looking statements. Such statements are not
statements of historical facts and reflect the beliefs and expectations of the company's
management. The words "anticipates”, "believes”, "estimates”, "expects”, "forecasts”,
"plans”, "predicts”, "projects”, "targets" and all similar words are intended to identify these
statements, which necessarily involve both known and unknown risks and uncertainties.
Known risks include uncertainties, which are not limited to the impact of competitive
services and pricing, market acceptance of services, service transactions by the company and
its competitors, regulatory approval, currency fluctuations, changes in the service mix
offered, and other risks described in the company’s reports. Forward-looking statements
speak only in terms of the date they are made and Banco Bradesco does not assume any
obligation to update them in light of new information and/or future developments.

33
4-13
Corporate Profile
Results 90-105
Corporate Strategy
14-20
21-26
ESG 27-46
Our Businesses 47-89
106-119
Macroeconomic Information
Attachments

4
MacroeconomicInformation

5
69.865.5
73.7 75.3 74.3
88.8
82.1 83.1
2015 2016 2017 2018 2019 2020 2021 2022
GDP should show important growth in 2021
Economic growth has accelerated with progress in the COVID-19 vaccination process, companies’ low indebtedness, and good global conditions.
The formal labor market has experienced strong expansion, favoring credit and keeping delinquency rates low.
Inflation has accelerated in the context of greater demand and shocks related to food and energy prices.
Fiscal risks have diminished in light of GDP growth, and contributed to currency appreciation. Along with Selic hikes, we expect lower inflationary pressures ahead.
The global context remains favorable for commodity prices, contributing significantly to various sectors in Brazil.
Formal Employment with a Broad Recovery(Index Feb. 2020 =100)
Projections for Public-Sector Debt Have ImprovedGross Debt / GDP
Macro Context
95.7*96.7*
* Greater projection observed in Fiscal Prism report (Oct. 2020)
103.7
106.8
104.3
102.6
104.7105.1
90
92
94
96
98
100
102
104
106
108
Feb-20 Apr-20 Jun-20 Aug-20 Oct-20 Dec-20 Feb-21 Apr-21
Brazil North
Northeast Southeast
South Midwest

6
BRL vs EmergingAccumulated variation of the Real against median and emerging percentiles
Source: Bloomberg, Bradesco
3.913.83
4.08
5.20
3.5
4.0
4.5
5.0
5.5
jan/2019 mai/2019 set/2019 jan/2020 mai/2020 set/2020 jan/2021 mai/2021 set/2021
75%
25%
mediana
BRL
Jan-2019 May-2019 Sep-2019 Jan-2020 May-2020 Sep-2020 Jan-2021 May-2021 Sep-2021
Average

7
IPCA*Core Average
Source: IBGE, Bradesco* Desasonalized and annualized – 3ma, 6ma e 12 months
8.60%
6.86%
6.13%
-5%
0%
5%
10%
15%
20%
02 03 04 05 06 07 08 09 10 11 12 13 14 15 16 17 18 19 20 21
3ma 6ma 12m

8
IPCA Expectations 2022Focus Expectations, Median and top5
Source: BCB, Bradesco
Average Last 5 days Top 5
.
.
4.2
3.9
4
3.8
3.7
3.6
3.5
3.4
3.3

99
0.0
2.0
4.0
6.0
8.0
10.0
12.0
14.0
Jan
-18
Fe
b-1
8
Ma
r-18
Ap
r-18
Ma
y-1
8
Jun
-18
Jul-
18
Au
g-1
8
Se
p-1
8
Oc
t-18
No
v-1
8
De
c-1
8
Jan
-19
Fe
b-1
9
Ma
r-19
Ap
r-19
Ma
y-1
9
Jun
-19
Jul-
19
Au
g-1
9
Se
p-1
9
Oc
t-19
No
v-1
9
De
c-1
9
Jan
-20
Fe
b-2
0
Ma
r-2
0
Ap
r-2
0
Ma
y-2
0
Jun
-20
Jul-
20
Au
g-2
0
Se
p-2
0
Oc
t-2
0
No
v-2
0
De
c-2
0
Jan
-21
Fe
b-2
1
Ma
r-2
1
Ap
r-2
1
Ma
y-2
1
Jun
-21
Jul-
21
Au
g-2
1
SELIC (5.25%) DI 2022 (6.35%) DI 2023 (7.88%) DI 2024 (8.50%) DI 2025 (8.78%) DI 2027 (9.10%) DI 2030 (9.41%)
*Through 8/4/2021 | Source: Eikon
Fixed x Floating Rate (DI) Swap

10
CDI and COPOM Implied EstimateSelic Expected in the Market Curve
Source: Bloomberg, Bradesco
5,3
6,7
8,1
9,19,6 9,8 9,9 10,0 10,1 10,3 10,4 10,6
3,5
4,5
5,5
6,5
7,5
8,5
9,5
10,5
11,5
ago-21 set-21 out-21 dez-21 jan-22 mar-22 abr-22 jun-22 jul-22 set-22 out-22 dez-22
11.5
10.5
9.5
8.5
7.5
6.5
5.5
4.5
3.5
5.3
6.7
8.1
9.19.6 9.8 9.9 10.0 10.1 19.3 10.4 10.6
Aug-21 Sep-21 Oct-21 Dec-21 Jan-22 Mar-22 Apr-22 Jun-22 Jul-22 Sep-22 Oct-22 Dec-22

11
Median of GDP Projections – 2022 e 2023Projections Begin to Reflect High Interest Rates
Source: BCB, Bradesco
1.93
2.35
1.8
1.9
2
2.1
2.2
2.3
2.4
2.5
2.6
Jan-21 Feb-21 Mar-21 Apr-21 May-21 Jun-21 Jul-21 Aug-21 Sep-21
2022
2023

12
90.0
92.0
94.0
96.0
98.0
100.0
102.0
104.0
106.0
4T16 1T17 2T17 3T17 4T17 1T18 2T18 3T18 4T18 1T19 2T19 3T19 4T19 1T20 2T20 3T20 4T20 1T21 2T21
PIB x Mercado de Trabalho4T16=100, dessazonalizado
PIB Emprego
4Q16 1Q17 2Q17 3Q17 4Q17 1Q18 2Q18 3Q18 4Q18 1Q19 2Q19 3Q19 4Q19 1Q20 2Q20 3Q20 4Q20 1Q21 2Q21
GDP and JobBase 100 = 4Q16
Source: Bradesco
GDP Job

1313
Economic ScenarioProjections Table
2019 2020 2021 2022
GDP (% p.a.) 1.4 -4.1 5.2 1.8
Extended Consumer Price Index IPCA (% p.a.) 4.31 4.52 7.8 3.3
General Market Price Index IGP-M FGV (%) 7.3 23.1 18.6 4.0
Selic (% p.a.) year-end 4.50 2.00 7.50 7.50
USD - Commercial Rate (R$/US$) year-end 4.03 5.20 5.00 5.50
Industrial production (% p.a.) -1.1 -4.5 5.4 1.5
Expanded Retail Sales (% p.a.) 3.9 -1.5 6.0 3.6
Jobs created (in thousands) 1,816 -8,373 5,601 2,753
Unemployment rate (% p.a. year average) 11.9 13.2 13.8 12.4
Credit Stock (%p.a.) 6.5 15.6 12.0 9.3
Balance of Trade (BCB) (US$ billion) 40.5 43.2 71.4 83.0
Current Account Balance (US$ billion) -50.7 -12.5 9.0 10.9
Public Sector Primary Result (R$ billion) -61.9 -703.0 -110.1 -102.2
Gross Debt (% GDP) 74.3 88.8 81.5 83.2
Depec’s economic projections are reassessed every month. In times of greater volatility, the degree of uncertainty and the margin of
error increase, especially between review periods. The projections reflect the premise that the necessary adjustments to the economy will be made in the coming years. If the adjustments are not confirmed, or are even better than expected, there may be a major change in the scenario projections. Last scenario update: 09/01/2021

14
CorporateProfile

1515
ROE(accumulated)
1H21
18.2%
BankingCorrespondents
41,584Branches +
PAs/PAEs + UNs
8,720Tier 1
Capital
14.1%
R$ 288
(34.2 million account holders)
Million Clients
71.2
Recurring Net Income 1H21
Billion
R$ 12.8
BillionPremiums and Contributions
1H21
R$23.2R$ 342Total
Assets
Billion
INSURANCE OPERATIONS
Total Assets
Trillion
R$ 1.7Billion
R$ 726Expanded Loan
Portfolio
Net Income1H21
R$ 2.3Billion Billion
Technical Provisions
Financial Highlights- 2Q21One of the largest financial groups in Latin America
CONSOLIDATED GROUP

1616
1997• Credireal• Itabanco• BCN• Companhia União
de Seguros Gerais
• BCR1998
1999• Banep• Continental
• Banco BoaVistaInteratlântico
• Banco das Nações2000
2001• Banque
Banespa International Luxemburg
• Banco Postal/Correios
• Banco Cidade• BES (3%)• BEA• Banco Mercantil• Deutsche Bank
DTMV S.A.2002
2003• Banco Zogbi S.A.• BBVA• Gestão de Recursos de
Terceiros do JP Morgan S.A.
• B.E.M2004
2005• BEC
• Amex2006
2007• BMC
• Ágora Corretora• Medservice2008
2009• IBI• Odontoprev
• Baloise - Atlântica Cia Brasileira de Seguros
1996
Founding of Banco Brasileiro
de Descontos(Bradesco)
Creation of
Fundação
Bradesco
Formation
of group
Bradesco
Seguros
Our HistoryPioneering, innovation, and expansion
First company in
Latin America
to buy a computer
Bradesco Card
First Brazilian
credit card
First “cash
dispenser” installed,
SOS Bradesco,
predecessor of the
current ATM
Branch nº 1,000
opened in Chuí, far
south of Brazil
First Mobile
Banking in
Latin America
First credit card
made from
recycled plastic
1943 1956 1962 1968 1970 1995
First Internet
banking in Latin
America
2000
2007 2010
First branch on a boat
(Voyager III). It runs
about 1,600 km
between Manaus and
Tabatinga (Amazonas)
2013
1983
2014 2020
MAIN ACQUISITIONS:
2017 2018
• HSBC Brasil2016
Biometrics
End of
Password
2021
New Information technology center,
part of the IT
improvement project, started in
2003
Self-service
without card
BIA
2008
2005
Joined the UN Global Compact
2006
Included in the Dow Jones
Sustainability Indexes
Included in ISE
Joined the CDP
2011
Joined UNEP-FI
First Brazilian bank to
commit toNet-Zero
Yearbook S&P 2021 –
Only Brazilian in the
category
Relaunch of Ágora
2019• BAC Florida
2009
1717
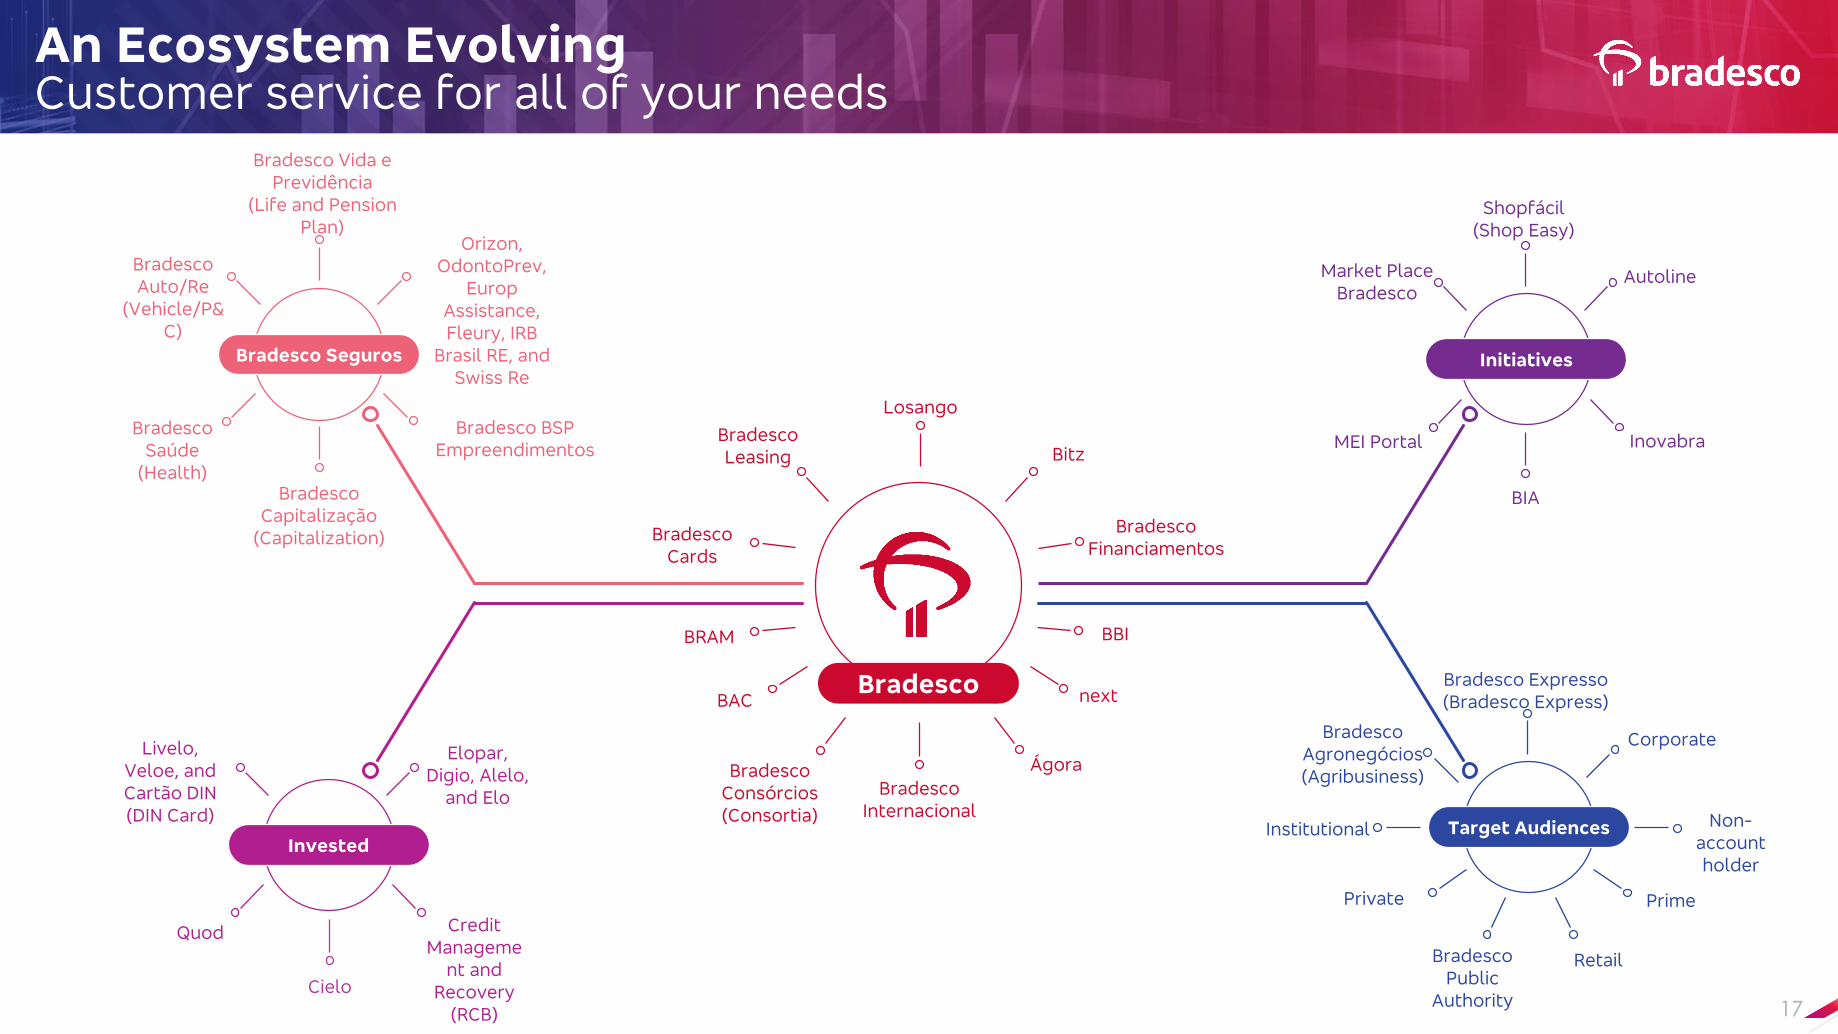
An Ecosystem EvolvingCustomer service for all of your needs
Bradesco Leasing
Losango
Bitz
Bradesco Financiamentos
BBI
next
Ágora
Bradesco Internacional
BAC
BRAM
Bradesco Cards
Bradesco Consórcios(Consortia)
Initiatives
Bradesco
Target AudiencesInvested
Bradesco Seguros
Bradesco Auto/Re
(Vehicle/P&C)
Orizon, OdontoPrev,
EuropAssistance, Fleury, IRB
Brasil RE, andSwiss Re
Bradesco Vida e Previdência
(Life and PensionPlan)
Bradesco Saúde
(Health)Bradesco
Capitalização(Capitalization)
Bradesco BSPEmpreendimentos
Livelo, Veloe, andCartão DIN (DIN Card)
Elopar, Digio, Alelo,
and Elo
Quod Credit Manageme
nt and Recovery
(RCB)
Market PlaceBradesco
Autoline
Shopfácil(Shop Easy)
MEI Portal
BIA
Inovabra
Bradesco Agronegócios(Agribusiness)
Corporate
Bradesco Expresso(Bradesco Express)
Private
Bradesco Public
Authority
Prime
Institutional Non-accountholder
Retail
Cielo

1818
46,85150,006
43,560
38,340 38,70839,100
39,100 39,10040,920 41,584
2013 2014 2015 2016 2017 2018 2019 2020 1Q21 2Q21
Service ChannelsServing customers how they desire
Digital Channels
Internet Banking Bradesco Apps
Fone Fácil ATMs
Physical Channels
Branches + Service Points (PAs + PAEs) + BUs (UNs)
Bradesco Expresso
4,674 4,659 4,507 5,314 4,749 4,617 4,478 3,395 3,312 3,168
57708 766 877
4,766 4,631 4,2474,834 4,827 4,731 4,871 4,737 4,709 4,675
9,440 9,290 8,7549,576 9,348 9,406 8,840 8,787 8,720
2013 2014 2015 2016 2017 2018 2019 2020 1Q21 2Q21
Branches UNs PAs + PAEs
10,148
98% of
transactions are made
through digital channels
91% are
concentrated in mobile
and the internet

19
Physical PresenceProximity and speed to serve customers
Exchange Services
New York
Mexico City
Cayman Islands
Buenos Aires
London
Luxemburg
Hong Kong
São Paulo
Miami Commercial/ Private bank
BBI/Securities
3,168Branches
5,552Customer
Service Points
41,584Expresso
% Network Distribution % Market ShareD M
D
M
22.5%
23.9%
D
M
7.2%
21.9%
D
M
7.9%
16.9%
D
M
14.2%
13.5%
D
M48.2 %
17.4%

20
1 – Asset management, pension funds, and securities brokers2 – Individual clients or corporate client consumers of Bradesco’s products that do not have a bank account
Large Corporate
≥ R$4 bn
Corporate
R$ 500 mn to R$ 4 bn
CorporateOne
R$ 30 mn to R$ 500 mn
Co
mp
an
ies a
nd
Bu
sin
ess
Up to R$ 30 mn
≤ R$4,000
Classic
≥ R$40,000 to R$ 149,999.99
Exclusive
R$4,000 to R$14,999.99
≥ R$5 mn
Private Bank
Pri
me
≥ R$150,000
≥ R$15,000
Non-account holders2
IND
IVID
UA
LS
InvestmentMonthly Income Annual Revenue
CO
MP
AN
IES
Multis & institutional1
Customer Segmentation A bank for everyone

21
CorporateStrategy

22
Clientsour inspiration
Digital transformationhow we do it
Sustainabilitymade to last
Peopleour team
“Create opportunities for people’s fulfillment and
the sustainable development of
companies and society
”
• Client-centered• Contextualized offers• Journeys of excellence• Digital service evolution• Customer empowerment
• Efficiency• Agility• Security• Improvement• Innovation
• Entrepreneurial attitude• High performance
• Transformational skills• Ethics, transparency, and respect
• Innovative, challenging, and diverse environment
Corporate StrategyOn four pillars, which guide our trajectory towards longevity
• Capital strength and liquidity• Integrated view of risks
• Diversity•Environmental ethics and responsibility
• Corporate governance

23
Business as a Service
Third parties developing new lines of business, reaching new segments
Portal MEI – Solutions for individual micro entrepreneurs
3. Open Banking
R$ 6 billion Invested in technology per year
R$ 2 billion
Invested in innovation
Focus on customer experience
New products and technologies (Digital Wallet)
BIA – leading bank in AI
Millennials and hyperconnected people
Construction of journeys
Without fees, with “special gifts”
2. Native Platforms
Present in the Bradesco and Next apps
Advice for clients through investment specialists
Digital wallet created with a complete ecosystem
20-25% market share in 3 years
Acquisition of Didin
Cybersecurity and SecurityPrograms
Digital StrategyThree fronts focused on digital acceleration
1. Digital Transformation
Development in Agile Methodology and teams organized in villages

24
104.5
348.0
733.1
24.045.9
1H19 1H20 1H21
233%
111%
91%
PF
PJ
Digital Account HoldersIn millions
MobileFinancial Transactions | In millions
14% 13%
+ AUTONOMY + EXPERIENCE
Ind
ivid
ua
ls
Total Sales| R$
+80%1H21 x 1H20
Number of ItensDistributed
+62%1H21 x 1H20
Mobile Sales | R$
+164%1H21 x 1H20
Internet Banking Sales| R$
+63%1H21 x 1H20
App Downloads
8MN1H21
Health Reimbursements
94%1H21
77%1H21
Private Pension Plan Sales
91%1H21
Bradesco Insurance
Digital Channels Expansion in the use and generation of financial transactions
17.520.0
22.5
Jun-19 Jun-20 Jun-21
214.6315.0
599.6
1H19 1H20 1H21
Opening of Accounts by AppIn thousands
Clients can handle everything without leaving home
98% of transactions were made via digital channels in 1H21
Investments | R$
+59%1H21 x 1H20
+51%1H21 x 1H20
Loan Operations | R$
Personal Loan and Payroll-Deductible Loans
Discount of Trade Bills
Advances to Suppliers
Granting of Loans
+21%1H21 x 1H20
PIX
+63%2Q21 x 1Q21
+108%2Q21 x 1Q21
COMPANIESINDIVIDUALS
INDIVIDUALS
COMPANIES
INDIVIDUALS
Issuing Credit Cards
+3.9MN1H21
Payments | R$
+30%1H21 x 1H20
Requests for Credit Cards
+270%1H21 x 1H20
Consortium | R$
+62%1H21 x 1H20
Light and Heavy Vehicles and Real Estate
COMPANIES
Claims Inspections of Autos
Taxes, Collections and Consumer

25
Technologies
Artificial
Intelligence
algorithms
Blockchain APIBiometricsBig
Data
CENTERS
RESEARCH
VENTURES
STARTUPS
LAB
HUB
HABITAT
INTERNATIONAL
Open innovation
AI and other
technologies
Investments
in startups
Open innovation
Space for co-innovation
NY & London
Open innovation
portal
Prototyping,
PoCs and certification
Innovation Ecosystem
inovabra.com.br
Awards
Valor Inovação Brasil 2019: 1st place in the banking category
(3rd consecutive year)
Efma Innovation of the Month: Sole Proprietorship Portal case study
Efma Innovation Awards 2019 • Digital Marketing: Vagalume case study
Gartner Eye on Innovation: Entrepreneur Sole Proprietorship Portal case study
FELABAN CLAB 2019: BIA case study
Whow! Award: Banking Category
Bank Reporting Award: Blockchain-Ripple case study
Bank Reporting Recognition: Move Caronas app
Learning & Performance Brazil 2019/2020:
BIA, in the Best in Brazil category
Most Innovative Bank in Latin America: The Banker
2020 and 2021
InnovationComplete innovation ecosystem

26
New!
8.5 million income statements
for individuals delivered by BIA Mobile
(through June 2021)
New!
1.3 million interactions
BIA on Bradesco Portal(from April 2021 to June 2021)
93Products and Services
Multi-PlatformBradesco app, Fone Fácil (Electronic
Service), WhatsApp, Google Assistant,
Amazon Alexa, Apple Business Chat,
and Bradesco Portal
100%of requests fulfilled in first call to
Fone Fácil (Electronic Service)
BIA Against HarassmentInspired by UNESCO’s “Hey Update My Voice” movement we changed BIA’s
answers so that it can react fairly and firmly against harassment
BIA, our artificial intelligence, is constantly evolving and improving its
communication skills in order to offer an experience that is even more
pleasant, intelligent, and intuitive. Bradesco is the pioneering bank in artificial
intelligence, assisting clients, and employees.
Digital Advances Centered on Clients Personalized interactions and offers
83.4 millioninteractions on WhatsApp
(from Jan. to June 2021)
Total InteractionsIn millions
61.9
192.7
275.1
1H19 1H20 1H21
43%
211%
New Features to Check
on WhatsApp
Credit Card Limits
195.9 thousand (from Jan. to June 2021)

27
ESG

28
Reference date: June 20211In thousands.2Excludes 5,402 ON and 3,845 PN shares held in treasury
53.70% COMMON
26.07% TOTAL47.93% COMMON
47.93% TOTAL
17.08% COMMON
8.56% TOTAL
28.81% COMMON
97.73% PREFERRED63.19% TOTAL
16.63% COMMON
16.63% TOTAL45.67% COMMON
0.02% PREFERRED
22.90% TOTAL
25.13% COMMON
100.00% PREFERRED
60.41% TOTAL
8.44% COMMON
2.25% PREFERRED
5.35% TOTAL
74.72% COMMON
39.51% TOTAL
0.15% COMMON
0.08% TOTAL
46.30% COMMON
100.00% PREFERRED
73.93% TOTAL
35.44% COMMON
35.44% TOTAL
# Shares June 2021 %
ON1,2 4,865,177 50.11%
PN1,2 4,844,655 49.89%
Total 9,709,832
Shareholder Structure

2929
10 members, of which 7 are
external and 3 independent
Body instated every year since 2002,
becoming permanent from 2015,
currently comprising 5 members, 2 of
which are elected by minority
shareholders.
*As of March 2021.
COMMITTEES POLICIES
BOARD OF DIRECTORS*
FISCAL COUNCILListed shares on the Brazilian Stock
Exchange, just 3 years after its
foundation
1946
Level 1 ADRs – Preferred Shares
1997
Level 2 ADRs and Latibex – Preferred Shares
2001
Level 2 ADRs – Common Shares
2012
Instrument of Policies on Disclosure and Use of
Information on Material Acts or Events and Trading
of Securities issued by Banco Bradesco S.A.;
Anti-Corruption Corporate Policy;
Internal Controls Policy;
Risk Management Policies;
Corporate Sustainability Policy;
Related-Party Transactions Policy;
Corporate Governance Policy;
Nomination and Succession of Officers Policy;
Diversity and Inclusion Policy;
Human Resources Management Policy;
Independent Auditors Hiring Policy;
Corporate Information Security and Cyber Policy;
others.
Seven Board of Director committees (Audit;
Compensation; Integrity and Ethical Conduct;
Integrated Risks Management and Capital
Allocation; Nomination and Succession; Risks;
Sustainability and Diversity) and various
executive committees
VOLUNTARY MEMBERSHIPIn 2001, joined Level 1 of Corporate
Governance at B3 S.A. – Brasil, Bolsa, Balcão
TAG-ALONG100% Common
80% Preferred
FREE FLOATCommon: 28.86%
Preferred: 97.73%
TOTAL63.22%
ETHICSCode of Corporate Ethical Conduct and various
sector codes for ethical conduct:
- For professional purchasing
- For financial and capital market professionals
- For Bradesco Seguros Group and BSP
- For internal auditors and inspectors
Corporate GovernanceRobust, transparent, and sound governance

3030*As of: March 2021.
Governance Structure
The highest governance body, responsible for
deciding on our business and electing the
members of the Board of Directors
SHAREHOLDERS’ MEETING
Ten members, 7 external and 3 independent;
responsible for establishing corporate strategy
and reviewing business plans and policies, in
addition to supervising and monitoring the
strategies assigned to the Executive Board
BOARD OF DIRECTORS*
Responsible for drawing up and monitoring
the execution of the strategic guidance
established by the Board of Directors,
managing and representing the company
BOARD OF EXECUTIVEOFFICERS
Oversight body installed
every year since 2002,
becoming permanent as of
2015, currently consisting of 5
members, 2 of which elected
by minority shareholders
FISCAL COUNCIL
Independent body, evaluating
areas and activities regarding
risk management, adequacy
of governance, and internal
controls
INTERNAL AUDIT
Audit: Monitoring of accounting practices adopted for
preparing the financial statements and the effectiveness of the
independent auditor
Compensation: Handling of the management compensation
policy
Integrity and Ethical Conduct: Disseminating and ensuring
compliance with the Bradesco oganization’s Codes of Ethical
Conduct and corporate policies
Risk Management and Capital Allocation: Management and
control of risks and capital (consolidated economic and
financial)
Nomination and Succession: Conducting succession policy and
appointing directors
Risk: Risk and capital management
Sustainability and Diversity: ESG performance evaluation,
establishing of initiatives and action strategies
COMMITTEES
Assist in the activities of the Executive Board, all regulated by
their own regulations
EXECUTIVE COMMITTEES

31
SUSTAINABILITY EVERYDAY BUSINESS
Sustainability management at
Bradesco is based on 5 core actions:
Sustainability at Bradesco
Diversity and
inclusion
High-level governance
bodies
Sustainability
governance
Policies, standards,
and manuals
Sustainability
guidelines
Integration of ESG factors into decision-making
ESG risks &
opportunities
Performance
management
Improvement of practices and
indicators
Culture and
engagement
With internal and external stakeholders
For more information about our sustainability strategy, practices and
results, visit: BradescoSustentabilidade.com.br
Sustainability Strategyand its connection with Bradesco´sprioritized SDG
Diversity and Inclusion

3232
Sustainability at Bradesco | Highlights Reinforcing our commitment to Sustainable Development
WASTE
MANAGEMENT
BIOFUELS LOW-CARBON
AGRICULTURE
HEALTH
AND SOCIALSECURITY
EDUCATION,
CULTURE ANDSPORTS
RENEWABLE
ENERGY
SANITATION
AND WATER
FOREST
MANAGEMENT
Industry group
SUSTAINABLE
BUSINESS
Credit and
capital market
advisory for
positive impact
sectors
Financial
solutions with
ESG focus
New goal: Deploy R$ 250 billion for sustainable financing by 2025
Rated Silver for the 3rd consecutive year
Only Brazilian bank among the top 5% in the sector
The only Brazilian bank to participate in the construction of the Principles for Banking Responsibility, together with the financial arm of the United Nations Environment Program (UNEP FI)

33
Sustainability at BradescoReinforcing our commitment to sustainable development
33
to commit to
*their credit and investment portfolios
*net emissions equal to zero
Forth place in the 2020 Corporate
Governance and Responsibility Ranking
Ninth among the most responsible companies
during the pandemic, in special ranking

3434
SIGNED
COMMITMENTS
DIVERSITY IS EMBODIED IN OUR:
DIVERSITY MANAGEMENT AREA:
DIVERSITY AND INCLUSION GOVERNANCE:
Code of Ethical Conduct
Human Resources Management Policy
Bradesco Organization’s Diversity and Inclusion Policy
Inserted in the Human Resources Department
Objective: To engage and strengthen diversity and inclusion within
Bradesco
Sustainability and Diversity Committee
Working Group on Diversity and Inclusion
Affinity Groups: on Gender, Sexual Orientation and Gender Identity, Accessibility, and Ethnicity
Diversity and Inclusion Commitment to diversity and representativeness
2,052interns
87,362employees
27%are black
51%are woman
4,224employees with
disabilities

3535
Human ResourcesAcknowledgments from the market (2021)
LINKEDIN TOP COMPANIES Brazil
Bradesco appears in the ranking’s top 3.
TOP EMPLOYER Certification
Excellence in people management &
employer branding.
Career of Dreams – Cia de Talentos
2nd most desirable company, being 1st
among banks.
WEPS Brazil
Silver recognition in the large corporate
category.
Best Practices in WORK AND FAMILY
BALANCE
1st place in the large corporate category
CIEE - BEST INTERNSHIP PROGRAM
1st place in the Financial and Insurance
Services category.
Best Companies GPTW WOMAN
5th place in the thematic ranking.
Best Companies GPTW LGBTQI+
Among the 10 best companies.

3636
Actions During the PandemicEthics and respect in all activities and relationships
SUPPORTING OUR CLIENTS
COMMITMENT TO SOCIETY
HEALTH AND WELL-BEINGOF OUR PEOPLE
Implementation of health and
prevention protocols to cope with
Covid-19
Opening of the new unit of Meu
Doutor Novamed, at the Head
Office Cidade de Deus
More than 79 thousand doses of
vaccines against H1N1 influenza
given to interns, employees, and
dependents
With the incentive of the
Bradesco Volunteer Program,
employees and interns donated
220 tons of food, which benefited
63 thousand people
New resources with special
conditions for personal loans
with a grace period of up to 90
days
Participation in government programs
Extension of installment
payment of loans and financing
Donation of medical supplies and
medicines to the Santa Casa
Acquisition of oxygen
concentrators for the “Oxigênio
para Todos Program” (Oxygen
for All), of the Ministry of Health
Construction of field hospital (RJ)
Installation of hospital tent in Salvador
Donations to fight the pandemic
Support in the production of low-cost respirators

3737
Under the management of human resources, the Bradesco Corporate University, Unibrad, has as its mission: promotingeducation for professional excellence and social mobility, and becoming a reference in skills training and leadership, strengthening the brand’s value and social commitment for the continuity of Bradesco’s business.
• Present in in-person hubs in the country
• Online platform with more than 2 thousand learning solutions
• Recognized nationally and internationally - Global CCU, Cubic Awards, and Micropower
• People Office area with a fundamental role to redesign and improve employee experience, collaborating for a personalized experience
NEW LEARNING SOLUTIONS
+ 184 thousand views* on the UniBrad website, which offers free educational content.
+ 545 thousand* participations in learning
solutions.
UnibradEducation, inclusion, and democratization of knowledge
• Solutions focused on Mental Health – lectures, courses, live streams to share tips and experiences related to behavior, signs and symptoms of mental illness, quality of sleep, healthy eating, and physical activity.
• InvestFlix Companies and Business – to enhance and deepen strategic and technical knowledge about investments and financial markets.
• Diversity Growing in Differences – raising awareness, educating, and showing the power of diversity and its impact on people, in business, and in the community, encouraging an environment of living together better with differences.
• Onboarding – learning pathway for new employees, with customized solutions for integration and presentation of the Bradesco culture.
* In 1H21

3838
Based on the belief in education as a key factor for life improvement, Fundação Bradesco has been operating for 64 years
COMMITMENT TO THE FUTURE
in investments planned for 2021
R$ 798.9 MN
students to benefit, of which about 90% come from local
communities
+ 83k
young people have benefited from the Jovem Aprendiz program since
2004
+ 4k
distance learning students expected through Escola Virtual (Virtual School)
+ 3.5 MN
basic education students – including high school-level technical vocational education
+ 41k
??
??
We strive for comprehensive education of students to provide opportunities for
a better future, encouraging the realization of dreams and the ability to
write their own life story.
40schools throughout Brazil
Fundação BradescoThe largest private socio-educational program in the country

39
Sustainability at BradescoRated mostly above average in major ESG indices and ratings
Average performance
0
A+C+CDD-
AA AAABBBCCC AAA
2.9 3.2 50 5
40+ 24.330+ 0
0 6344 56 100
10075 92
0 10039 87 89
D AA- AC
As Sustainalytics refers to a risk score, the closer to 0, the better.
Benchmark
Ref. June 2021

40
Added value to society
14.4%
27.1%
23.7%
32.9%
1.9%
Governmentcontribution
Return on third-party capital (rentals)
Profit reinvestment
Work compensation
Dividends / IoC(paid / provisioned)
R$16.6Billion
distributed in 2Q21

41
Guidance
DisclosedGuidance
2021
Actual1H21
ReviewedGuidance
2021
Expanded Loan Portfolio 9% to 13% 9.9% 9% to 13%
Client Portion 2% to 6% 2.2% 2% to 6%
Fee and Commission income 1% to 5% 3.6% 1% to 5%
Operating Expenses(Personnel + Administrative + Others)
-5% to -1% -4.4% -5% to -1%
Income from Insurance, Pension Plans and Capitalization Bond (includes operating financial income)1 2% to 6% -29.8% -15% to -20%
Expanded ALL - R$ Billion R$ 14.0 to R$ 17.0 R$ 7.4 R$ 14.0 to R$ 17.0
1- Billing projections with growth between 8% and 10%.

42
12.6 12.613.1
1.00.7 0.3
(0.5)
1.113.6 14.1
Mar-21 Net Income
2Q21
Prudential Adjustments
Effects
Interest on
Shareholders' Equity
Jun-21
Common Equity Additional Capital
116.1%
%
8.625 Tier I
7.125 CommonEquity
Limits 20211
Variation %
Capital and Liquidity
Basel Ratio%
Regulatory Capital and RWA
Changes in Tier I Ratio in the Quarter
Liquidity CoverageRatio (LCR)
Net Stable Funding Ratio (NSFR)
1-Refer to the required minimums, in accordance with Resolution No. 4,193/13, added to the additional capital contributions established by Circulars No. 3,768/15 and No. 3,769/15.
R$ million Jun/21Jun/21 x
Mar/21
Jun/21 x
Jun/20
Regulatory Capital 141,108 4.1 7.2
RWA 884,639 0.3 1.1
Credit Risk 799,070 0.2 1.6
Operational Risk 66,908 0.0 5.0
Market Risk 18,661 6.3 (25.3)
156.0%
11.5 11.8 12.7 12.6 13.1
15.0 15.1 15.8 15.4 16.0
12.5 12.9 13.8 13.6 14.1
1.1 1.11.1 1.0 1.1
Jun-20 Sep-20 Dec-20 Mar-21 Jun-21
Total Ratio Common Equity Additional Capital (Level I)

43
In 2020, net payout was limited to 30% as per
Central Bank Resolution nº 4,820/20.
Dividends and Interest on Shareholders’ EquityR$ Million
In 2021, a share buyback program of up to 1% of total outstanding shares
was instituted.
Gross Payout | Dividends and Interest on EquityHistorical distributions above the minimum established in the bylaws
(1) In 12M19, it considers R$8 billion of extraordinary dividends paid on October 23, 2019; and (2) Calculated on the basis of the book net income after adjustment on legal reserves. Note: In July 2021, the payment was made of interest on shareholders’ equity to intermediaries, related to the first half of 2021, to the sum of R$5.0 billion.
5,0556,035
6,976 7,204 7,299
15,863
5,548 5,992
35.3%37.0%
48.7%51.7%
40.3%
73.9%
34.8%
52.0%
10.0%
15.0%
20.0%
25.0%
30.0%
35.0%
40.0%
45.0%
50.0%
55.0%
60.0%
65.0%
70.0%
75.0%
-
5,000
10,000
15,000
20,000
25,000
30,000
2014 2015 2016 2017 2018 2019 2020 2Q21
Dividends/Interest on Shareholders' Equity (1) Gross Payout (2)

44
1Reference date: June 20212Cidade de Deus, NCF, Nova Cidade de Deus, and Fundação Bradesco3Brazilian Investors
Average Daily Trading Volume*R$ Million
Shareholders’ Profile¹
Investors and TradingGrowing volume of trades
Shareholder
Base
% of Total
Shareholders
% of
Common
Shares
% of
Preferred
Shares
% of Total
Shares
- Controlling Shareholders2 4 0.0% 71.1% 2.3% 36.8%
- Minority Shareholders 741,530 100.0% 28.9% 97.7% 63.2%
- Individuals3 704,229 95.0% 11.0% 27.7% 19.3%
- Institutional3 35,956 4.8% 6.9% 9.1% 8.0%
- Foreign Investors 1,345 0.2% 11.0% 60.9% 35.9%
Total 741,534 100.0% 100.0% 100.0% 100.0%RECOMMENDATION OF
MARKET ANALYSTS
BBDC4
100%
Buy
CONSENSUS
(R$ million) 2021
Bloomberg 25,795
Refinitiv Eikon 26,355
Sell Side 26,114
Buy Side 26,873
155 193 233 292 326 320 352 354 522734 1,089 1,240
315 312 278 239 296 327 352330
406489
497693470 505 511 531 622 647 704
684928
1,223
1,5861,933
-1000
0
1000
2000
3000
0
500
1000
1500
2000
2500
3000
2011 2012 2013 2014 2015 2016 2017 2018 2019 2020 1Q21 2Q21
Brazil U.S.A Total*Source: Economática

45
111.6 107.2132.2 128.4
146.0
100.4
161.4
201.3
243.6
283.2
227.7212.1
2010 2011 2012 2013 2014 2015 2016 2017 2018 2019 2020 Last*
+90%Ibov variation: +76%
*Last: 8/4/2021. Source: Refinitiv Eikon.
Market CapR$ Billion
MULTIPLE P/BV
2.3x 1.9x 1.9x 1.8x 1.8x 1.1x 1.6x 1.8x 2.0x 2.1x 1.6x 1.4x
MULTIPLE P/E
11.2x 9.6x 11.4x 10.5x 9.5x 5.6X 9.4x 10.5x 11.3x 10.4x 11.7x 8.6x
ROE (%)
22.2 21.3 19.2 18.0 20.1 20.5 17.6 18.1 19.0 20.6 14.8 17.6
Market Cap & MultiplexA company of value and high profitability over time

46
FITCH RATINGS
International Scale National Scale
Viability Support Domestic Currency Foreign Currency Domestic Currency
bb 4Long-term Short-term Long-term Short-term Long-term Short-term
BB B BB B AAA(bra) F1+(bra)
MOODY'S INVESTORS SERVICE(1)
Global Scale National Scale
Domestic Currency
Counterparty
Foreign Currency
Counterparty
Deposits -
Domestic Currency
Foreign Currency
DepositDomestic Currency
Long-term Short-term Long-term Short-term Long-term Short-term Long-term Short-term Long-term Short-term
Ba1 NP Ba1 NP Ba2 NP Ba2 NP AAA.br ML A-1.br
S&P GLOBAL(1) AUSTIN RATING
Global Scale - Issuer Credit Rating National Scale National Scale
Foreign Currency Domestic Currency Issuer Credit Rating
Long-term Short-term Long-term Short-term Long-term Short-term Long-term Short-term
BB- B BB- B brAAA brA-1+ brAAA brA-1
Main Credit RatingsSoundness and reliability
(1) Due to the change in methodology in June 2021, the national scale ratings were changed from "Aa1.br" and "BR-1" to "AAA.br"and "ML A-1.br".

47
Our Business

4848
BRADESCO SEGUROS
Main segments and businesses
48
BRAM
REAL ESTATE
CARDS
VEHICLES
PAYROLL-DEDUCTIBLE LOAN
ÁGORA
NEXT
BITZ
BBI

49
12th
largest economy in the world
18th
largest insurance market
in the world¹
0.9%share of global
premiums¹
²PREMIUMS EARNED / NOMINAL GDP
1.3 1.3 1.4 1.3
2.1 2.12.7
4.44.8 5.0
5.4 5.5 5.76.1
6.4 6.5 6.4 6.6 6.7
90 91 92 93 94 97 2000 2005 2010 2011 2012 2013 2014 2015 2016 2017 2018 2019 2020
Brazilian Insurance MarketGrowing revenue volume and share of GDP
¹ Source: Swiss Re / ² Source: Cnseg (R$ in premiums divided by GDP)
BRADESCO SEGUROS

50
¹ Percent of economically active population² Percent of total Active age population³ Percent of total population
INSURANCE PENETRATIONMillion
HEALTH PLAN
BENEFICIARIES
ADDITIONAL PENSION
PLAN CONTRACTS
25%3
48.1
18%2
30.0PARTICIPANTS
IN LIFE
15%
11.0INSURED
HOMES
14%3
27.7DENTAL PLAN
BENEFICIARIES
17%¹
17.8
31%
18.0INSURED
VEHICLES
Brazilian Insurance MarketOpportunities to enhance penetration
BRADESCO SEGUROS

51
Ranking 2021 Premiums Earned (R$ million) Share (%)
1st 32,595 22.9
2nd 23,773 16.7
3rd 15,842 11.1
4th 9,628 6.8
5th 7,258 5.1
6th 6,901 4.9
7th 6,812 4.8
8th 4,077 2.9
Others 35,328 24.8
Total 142,214 100,0
May 2021
Brazilian Insurance MarketLeading group in the Brazilian market
BRADESCO SEGUROS

52
50.01%
40.0%
22.5%
50.0%
100.0%
Insurance Group Structure Coverage of the main lines and groups
*IBR Brasil RE: Discontinued company. Last matchin March 2020BRADESCO SEGUROS

53
*Market share by Revenue** considering Insurers and OperatorsSource: Susep/ANS Reference date: May 2021
Market Share* Prominent position in the main lines and groups
BRADESCO SEGUROS
Market Share Ranking
Pension Plans 21.0%3rd
Life 19.0%1st
Health** 12.5% 1st
Capitalization 23.1% 1st
Bonds
Auto 11.9% 3nd
Total 22.9% 1st

54
Insurance Group - Selected dataResumption of Written Premiums
BRADESCO SEGUROS
(1)Premiums Earned from Insurance, Pension Plan Contribution and Capitalization Bond Income- In the first half of 2020, additional provisions were made in the sum of R$1,108 million, which were classified as supplementary provisions in the line of Other Income/Operating
R$ million
Variation%
2Q21 1H212Q21x1Q
21
2Q21x
2Q20
1H21x
1H20
Written Premiuns
Life and Pension Plans 9,171 18,365 (0.3) 28.3 13.3
Health 7,784 15,396 2.3 13.3 9.8
Auto / P&C 1,540 2,924 11.3 24.0 15.1
Capitalization Bonds 1,379 2,718 3.0 14.4 2.0
Total 19,874 39,403 1.8 20.7 11.2
Premiums Earned 1 11,642 23,235 0.4 12.7 6.9
Selected data
Total Assets 341,613 341,613 1.0 4.4 1.0
Financial Assets 321,125 321,125 1.0 4.0 1.0
Technical Provisions 288,364 288,364 1.1 4.9 1.1
Shareholders` Equity 36,486 36,486 1.0 (7.8) 1.0

55
Income from Insurance, Pension Plans and Capitalization BondsImpacted by events related to the pandemic
BRADESCO SEGUROS
2,065 2,034 2,347 2,1842,947
2,122
838 1,720
887
361
782
701
1,129
1,848
1,529 1,4391,533
747
831 1,009
1,443
1,417
687
3,594 3,4733,900
2,931
4,1393,913
2,982
4,266
3,422
2Q19 3Q 4Q 1Q20 2Q 3Q 4Q 1Q21 2Q
Operating Income Sinistros Avisados Covid-19 Financial Result (*) Com Efeito Covid-19
R$ million
3,778(*)3,131(*)
2,281(*)
3,137(*)
1,574(*)
Claims Reported - Covid-19 (*) With the Effect of Covid-19

56
Insurance Consolidated Income StatementResumption in Premiums and Claims impacted by the pandemic
(1) In the first half of 2020, additional provisions were made to the amount of R$1,108 million, which were classified as supplementary provisions in the line of Other Income/Operating Expenses.
Variation%
R$ million 2Q21 1H212Q21
x 1Q21
2Q21
x 2Q20
1H21
x 1H20
Premiums Earned from Insurance, Pension Plan Contribution and Capitalization
Bond Income (1)11,642 23,235 0.4 12.7 6.9
Retained Claims (8,722) (16,630) 10.3 58.1 31.4
Capitalization Bond Withdrawals and Redemptions (1,225) (2,419) 2.6 13.3 1.5
Selling Expenses (808) (1,580) 4.7 3.3 1.5
Financial Results 687 2,104 (51.5) (17.3) 33.4
Income from Insurance, Pension Plans and Capitalization Bonds 1,574 4,711 (49,8) (58.3) (29.8)
Fee and Commission Income 441 883 (0.2) (2.0) (4.6)
Personnel Expenses (398) (808) (2.9) 7.0 4.8
Other Administrative Expenses (354) (682) 8.0 (0.2) (5.1)
Others(1) (184) (351) 10.4 (84.5) (81.2)
Operating Income 1,078 3,752 (59.7) (53.4) (12.3)
Non-Operating Income / Income Tax / Social Contribution / Non-controlling
interests in subsidiaries(423) (1,468) (59.6) (55.5) (16.6)
Recurring Net Income 655 2,284 (59.8) (51.8) (9.3)
BRADESCO SEGUROS

57
Technical Provision
Adjusted Net Income and ROER$ Million
Written Premiums
Technical Provision and Selected DataHealth, Life and Pension Plans impacted by Covid-19
Net Income
4,4065,289 5,551 5,534
6,3897,451
5,120
1,629655
23.7% 24.2% 23.0%
19.4%20.0%
23.5%
14.3%19.6%
7.8%
2014 2015 2016 2017 2018 2019 2020 1Q21 2Q21
Adjusted Net Income ROE
46%
8%7%
39% Life And Pension Plans
Auto/P&C/Others
Savings Bonds
Health
Variation %
R$ million 2Q21 1Q21 2Q202Q21
x 1Q21
2Q21
x 2Q20
Life and Pension Plans 260,483 257,899 250,168 1.0 4.1
Health 14,556 14,026 11,325 3.8 28.5
Auto / P&C 4,837 4,734 4,391 2.2 10.2
Capitalization Bonds 8,488 8,504 8,755 (0.2) (3.0)
Total 288,364 285,163 274,861 1.1 4.9
BRADESCO SEGUROS
R$ million
583 627
-161
341580
544
78
108
117
359
314
155
1,361
1,629
655
2Q20 1Q21 2Q21
Auto/P&C/Others Savings Bonds Health Total

58
¹Financial Assets and Technical Reserves. ²Does not consider DPVAT segment.
Other Information¹ – Bradesco SegurosHealth, Life and Pension Plans provisions are the Highlights
R$ Billion
Financial Assets
308.8318.0 321.1
Jun-20 Mar-21 Jun-21
BRADESCO SEGUROS
Technical Provision
274.9285.2 288.4
Jun-20 Mar-21 Jun-21
Health
11.3
14.0 14.6
Jun-20 Mar-21 Jun-21
Pension Plans and Life/VGBL
250.2 257.9 260.5
Jun-20 Mar-21 Jun-21
4.4 4.7 4.8
Jun-20 Mar-21 Jun-21
Auto/P&C² Capitalization Bonds
8.8 8.5 8.5
Jun-20 Mar-21 Jun-21

5959
BRADESCO SEGUROS
59
NEXT
BRAM
CARDS
VEHICLES
PAYROLL-DEDUCTIBLE LOAN
ÁGORA
BITZ
BBI
REAL ESTATE
Main segments and businesses

6060
100
72 69
2Q20 1Q21 2Q21
Cost of Serving (CTS)(Base 100)
100
192218
2Q20 1Q21 2Q21
Cards(Base 100)
100
210263
2Q20 1Q21 2Q21
Total Transaction
Volume(Base 100)
2.7
4.45.4
2Q20 1Q21 2Q21
Total Accounts (in million)
429
689
1,016
2Q20 1Q21 2Q21
Open Accounts (in thousands)
nextThe native digital bank
77%were not Bradesco
account holders
+137% +99%
68%between 18 and 34
years old
HIGHLIGHTS
MAIN INDICATORS
The total volume transacted grew 163% YoY -
demonstrating greater customer engagement
with the platform
The amount of cards transacted
increased 118% YoY – important
business indicator for next
The 31% YoY reduction
demonstrates efficiency gains in
our operation
ACCOUNTS
Member Get Member (MGM): We launched
INDICA Y INDICA, a program that offers
rewards to those who bring new customers,
boosting the base's growth and helping to
improve the platform’s satisfaction rate.
Jornada de Adesão: We made
improvements that simplified the account
opening process. Today, more than 70%
of accounts are opened within 24 hours
ShopFácil: We completed the integration
of ShopFácil, adding to next an important
source of revenue and a new vertical of
non-financial business.
Mimos: We closed the quarter with more
than 300 partner brands and over 1,000
offers. Large promotions intensified
engagement with the hub, such as the
Valentine's Day action and with the gamer
audience.
5.4 million customers, with more than
1 million new accounts in 2Q21
NEXT
6161
BRADESCO SEGUROS
61
BRAM
ÁGORA
NEXT
BITZ
BBI
CARDS
VEHICLES
PAYROLL-DEDUCTIBLE LOAN
REAL ESTATE
Main segments and businesses

6262
ACCUMULATED DOWNLOADS
Pix releaseGenerating 41% jump in the number of users with a balance in the wallet.42% of users have at least one registered Pix key.
Free payment account with a balance that yields 100% of the CDI rate and cashback
mechanics to encourage usage. Created for the more than 40 million unbanked
Brazilians.
Main growth drivers in the period:
BITZ
ACCUMULATED ACCOUNTS
1st advertising campaignNationwide dissemination via digital, merchandising, and film for broadcast TV and local radio.
Reality show sponsorshipTwo nationwide reality shows on Record TV from May to July:• Power Couple Brasil 5• Canta Comigo
Accounts created81% increase in number of clients in the quarter.
TPV (Total Payment Value)43.5% increase in volume transacted.
NPS12.8% increase reaching the NPS of 44.
Operational results
BitzThe digital wallet created with a comprehensive ecosystem
7218
592
1,067
1,418
3QT20 4Q20 1Q21 2Q21 Aug21*
+33%
10332
853
1,546
2,051
3Q20 4Q20 1Q21 2Q21 Aug21*
+33%
In thousands
In thousands
* In Aug 11th, 2021

6363
BRADESCO SEGUROS
63
BRAM
ÁGORA
NEXT
BITZ
BBI
CARDS
VEHICLES
PAYROLL-DEDUCTIBLE LOAN
REAL ESTATE
Main segments and businesses

6464
JUN 2020
MAR 2021
JUN 2021
CLIENT BASEFUNDING
Vision: Volume under custody - billion
449 kclients
632 kclients
673 kclients
+49.9% y/y
+6.5% q/q
R$50.6
R$63.3
R$72.2
+42.7% y/y
+14.1% q/q
64
Open platform of investment products for account holders and non-account holders
Present in Bradesco and
next Apps
Advice to clients through investment specialists
ÁGORA
ÁgoraComplete and digital experience, with exclusive products and services
NETFUNDINGR$ Million
3,828
6,930
1H20 1H21
+81%

6565
BRADESCO SEGUROS
65
BRAM
ÁGORA
NEXT
BITZ
BBI
CARDS
VEHICLES
PAYROLL-DEDUCTIBLE LOAN
REAL ESTATE
Main segments and businesses

6666
Highest international credit risk classification
Moody’s Investors Service
Highest international risk classification
Standard & Poor’s
Incorporation of environmental, social and
governance issues into the decision-making process
Excellent Rating Highest international rating in investment
management
06/30/2021
INSTITUTIONAMOUNT¹
(R$ Million)
1 BB 1,283,840
2 ITAÚ-UNIBANCO 779,290
3 BRADESCO 541,768
4 CAIXA 421,715
5 SANTANDER 297,288
6 BTG PACTUAL 211,796
7 BRL DTVM 141,842
8 XP ASSET MANAGEMENT 119,472
9 CREDIT SUISSE 107,667
10 SAFRA 107,084
R$ 541.77 BILLION (US$ 108.31 BILLION2)
in assets under management
Note: (1) Domestic Market, ANBIMA Ranking of Management;(2) R$5.0022: US$ 1.00 on 06/30/2021 (Source: Brazilian Central Bank).
BRAM – Bradesco Asset Management Offering complete solutions
BRAM

6767
BRADESCO SEGUROS
67
BRAM
ÁGORA
NEXT
BITZ
BBI
CARDS
VEHICLES
PAYROLL-DEDUCTIBLE LOAN
REAL ESTATE
Main segments and businesses

68
# of transactions US$ million
ECM1 ECM1
US$ millionInternational DCM3
M&A2
US$ millionLocaL DCM4
# of transactionsProject Finance5
31
37 37
BBI BTG Pactual Itaú BBA
16,659
12,00010,350
BBI Santander Itaú BBA
30,359 30,881
15,922
BBI Itaú BBA BTG
82
48
28
Santander BBI Sumitomo
3,052 2,997
2,728
BBI Itaú BBA Morgan Stanley
22,00424,731
18,904
BBI BTG Pactual JP Morgan
BBI
Bradesco BBIOutstanding performance and presence in major transactions
US$ million
Source: Thomson Reuters; Dealogic; ANBIMA. Note: (1) Volume and number of transactions as of Dec. 2020 (2) Official Mergermarket ranking of M&A announced transactions, 2020
(3) Transaction volume as of 2019(4) Transaction volume (origination) YTD as of Nov. 2020(5) Number of transactions as of 2019

6969
BRADESCO SEGUROS
69
BRAM
PAYROLL-DEDUCTIBLE LOAN
ÁGORA
NEXT
BITZ
BBI
CARDS
VEHICLES
REAL ESTATE
Main segments and businesses

70
22.0% 20.8% 20.8% 21.3% 22.7% 21.8%23.9% 23.9%4.5% 5.1% 6.2%
7.9%9.7%
10.9%
10.7% 10.7%
16.3% 16.6% 15.5%14.3%
13.8%12.8%
12.5% 12.4%
21.3%21.8% 22.2%
20.7%17.7%
16.5%
15.9% 15.7%
12.0%12.7%
13.5%14.2%
15.1%
16.6%
15.8% 16.1%
23.8%
23.0%21.8%
21.7%
21.1%
21.4%
21.2%21.3%
247.8
273.0 287.8
310.7
337.4
379.2
440.6 452.9
Dec-14 Dec-15 Dec-16 Dec-17 Dec-18 Dec-19 Dec-20 Mar-21
Others Bank I Bank II Bank III BRADESCO Bank IV
PAYROLL-DEDUCTIBLE LOAN
Payroll-Deductible Loans / GDP Market Share – BalanceR$ Billion
Source: IF Data - BCBReference date : June 2021Source: DEPEC (Bradesco)
Payroll-Deductible Loan – BrazilSteady market growth
Dec-10 Dec-20
3.6%
6.0%

71
Bradesco – Portfolio¹ Market – Portfolio²Bradesco – Distribution¹
Market share3
20.3%
13.3%
14.1%
INSS
Private Sector
Public Sector
16.4%
Total
11.5 MILLION
RETIREES PAID THROUGH BRADESCO
¹ Source: Bradesco / In June 2021² Source: BCB / In June 2021³ Base date: June 2021
Correspondent
Banks / Others
14%
Branch
Network
86%
Payroll-Deductible Loans - PortfolioStrong positioning in retirees and pensioners
PAYROLL-DEDUCTIBLE LOAN
Social
Security
39%
Public
Sector
55%
Private
Sector
6%
Social Security
48%
Public
Sector 47%
Private
Sector 5%

7272
BRADESCO SEGUROS
72
BRAM
PAYROLL-DEDUCTIBLE LOAN
ÁGORA
NEXT
BITZ
BBI
CARDS
VEHICLES
REAL ESTATE
Main segments and businesses

73
1.5 1.8 2.23.0
4.05.2
6.37.6
9.0 9.5 9.7 9.5 9.2 9.29.8 10.2
2006 2007 2008 2009 2010 2011 2012 2013 2014 2015 2016 2017 2018 2019 2020 2021*
Brazil%
World
%
REAL ESTATE
Real Estate | Financing and Mortgages/GDPExpansion opportunities
Sources: United Kingdom, Portugal, Poland, Hungary, Czech Republic, Bulgaria, Turkey, Russia 2014; Argentina 2015; USA, Spain, France, Germany, South Africa, Chile, Italy, Mexico, Colombia2016; Brazil 2020. Sources: European Mortgage Federation, Bacen, Hypostat, Febraban, HFN, Abecip and Ecowin.*Depec estimates
75.0 77.0
59.248.0
42.0 36.0 30.0 24.022.0 20.0 16.6 16.6
11.0 9.8 8.3 6.5 6.0 1.9
UK
US
A
Po
rtu
ga
l
Sp
ain
Fra
nc
e
Ge
rma
ny
So
uth
Afr
ica
Ch
ile
Ita
ly
Po
lan
d
Hu
ng
ary
Cz
ec
h R
ep
.
Me
xic
o
Bra
zil
Bu
lga
ria
Tu
rke
y
Co
lom
bia
Arg
en
tin
a

74
HOUSING DEFICIT: 7.7 MILLION HOMES
Source: ABECIP
ANNUAL ORIGINATIONR$ Million
109,178 112,854
75,578
46,610 43,149
57,387
78,702
123,974
97,047
2013 2014 2015 2016 2017 2018 2019 2020 Jul-21
REAL ESTATE
Real Estate – BrazilRobust growth in originations

75
7.8% 8.6% 8.9% 8.6% 8.5% 7.8% 6.6% 6.2% 6.0%6.3% 6.4% 6.0% 5.6% 5.7% 5.9% 6.2% 6.4% 6.5%7.9%
8.0% 8.0% 7.7% 7.5% 7.5% 8.1% 8.8% 9.5%9.0%9.4% 10.0% 9.6% 9.4% 9.1%
10.5% 10.8% 10.9%
68.3%
67.2%67.0% 69.1% 68.9% 69.2%
68.9%68.3%
67.4%
0.7%
0.4%
0.1%0.4%
497,847
572,313605,736
624,834645,355
672,073
741,479759,339
786,121
Dec14 Dec15 Dec16 Dec17 Dec18 Dec19 Dec20 Mar21 Jun21
Bank I Bank II Bank III Bradesco Bank IV Others
Source – BCB, banks’ balance sheets, and ABECIP
BalanceR$ Millions
REAL ESTATE
Mortgage - Brazil Market share growth

76
ORIGINATION
Individuals
AVERAGE TERM:321 MONTHS
AVERAGE TICKET:
PROPERTY ASSESSMENT
R$ 522 Thousand
FINANCING
R$ 315 Thousand
LOAN TO VALUE
60.4 %
LOAN TO VALUE
(INVENTORY)
50.8 %Reference date: June 2021
REAL ESTATE
Mortgage – Retail | BradescoGreater safety margins in originations
77
Portfolio Breakdown
Origination by Beneficiary Origination
R$ million
R$ million Financed Units
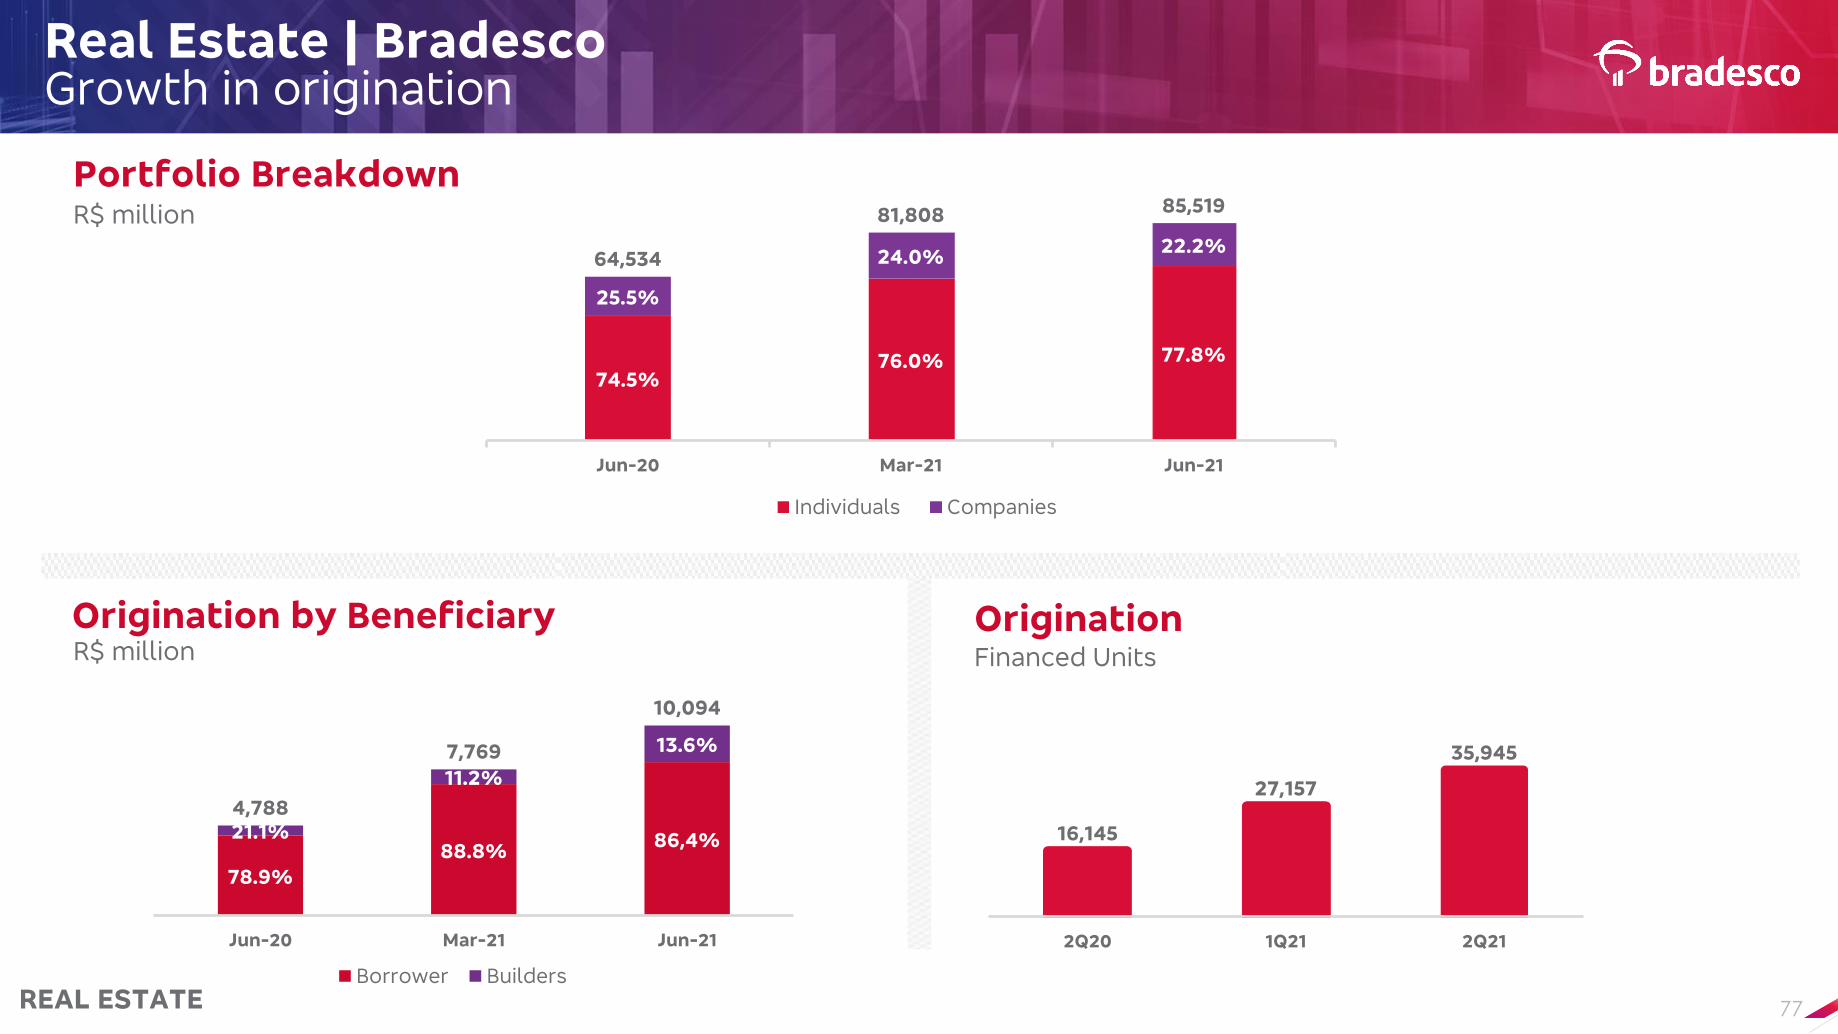
REAL ESTATE
Real Estate | Bradesco Growth in origination
74.5%76.0% 77.8%
25.5%
24.0%22.2%
64,534
81,808 85,519
Jun-20 Mar-21 Jun-21
Individuals Companies
78.9%
88.8%86,4%21.1%
11.2%
13.6%
4,788
7,769
10,094
-
2,000
4,000
6,000
8,000
10,000
12,000
Jun-20 Mar-21 Jun-21
Borrower Builders
16,145
27,157
35,945
2Q20 1Q21 2Q21

7878
BRADESCO SEGUROS
78
BRAM
PAYROLL-DEDUCTIBLE LOAN
ÁGORA
NEXT
BITZ
BBI
CARDS
VEHICLES
REAL ESTATE
Main segments and businesses

79
Evolution of billed in means ofpayment – Credit and Debit
(2Q21 X 1Q21)
Cards Market | Transaction VolumeEvolutionary resumption in billing
VOLUME BILLED IN MEANS OF PAYMENT – CREDIT AND DEBIT
Source: Abecs
CARDS
400.7
506.3
609.6558.3
609.2
2Q20 3Q20 4Q20 1Q21 2Q21
R$ Billion
+9.1%
+52.0%
9.1%
7.1 billion of transactions carried outwith cards in the 2Q21
Source: AbecsIn Aug/21
R$ 2.5
trillion
R$523
billion
R$ 2.0
trillion
2000 2021E2010

80
BRAND
LOYALTY
ACQUIRER
FOOD VOUCHER
PAYMENT TAG
ISSUER
CLIENT(Tolls, parking and others)
CARDS
Bradesco Cards PositioningOperating throughout the value chain
CLIENT

81
Distribution channelsWide distribution capacity - ominichannel
Digital Channels – App and Web 20% of total sales
Greatest Market Capillarity:+ 30 physical and digital channels with national presence+ 25 thousand points of sales and branches network
Bradesco channels synergy: Ágora, Losango, Bradesco Financiamentos, Seguros
Experience for the Customers:Card available for use immediately after
approval, no need to wait the physical card to arrive home
Integration Technology with Retail Partnerships:
best experience according to each customer's profile
Bradesco Partner Channels:Bradescard and Bradesco Expresso
banking correspondents
CARDS

82
Products portfolioC
OM
PA
NIE
S
IND
IVID
UA
LS
Complete and for everyone
BNDES TRANSPORTS PURCHASES VIRTUAL PAYROLL RETAILERS ACADEMIC COBRANDED
NIC
HE
S
Classic
Exclusive
Private Bank
Pri
me
Non-account holders
Large Corporate
Corporate
CorporateOne C
om
pa
nie
s a
nd
B
usin
ess
Multis & institutional
CARDS

83
Innovation and Services
P2P and P2M
AppBradesco
Virtual Card
BIAServices
QR Code
App BradescoCards
All forms of payment
Digital experience
CardTech - area dedicated to technological innovation entirely in agile methodology
Development of digital
applications, products and
services focused on the
better customer
experience
Focused on winning partnerships and projects for better value delivery to customers
Disney+ STAR+ with relevant
differential and integrated journey in
the bank's digital channels, with the
best payment experience in the market
Special offers in installment payments and
discounts with Apple when purchasing any
product
Complete self-service solution
Complete line of payments solutions with innovative products
CARDS

848484
Main segments and businesses
BRADESCO SEGUROS
BRAM
VEHICLES
ÁGORA
NEXT
BITZ
BBI
CARDS
PAYROLL-DEDUCTIBLE LOAN
REAL ESTATE

85
Inhabitants per Vehicle
Market Delinquency – Over 90 Days%
1Source: Brazilian Central Bank; 2 Considering only credit products with market interest rates; 3 Auto Loan (CDC) + Leasing
Credit in the Financial System (1)R$ Billion
Vehicle Financing – BrazilSlight portfolio growth and stable delinquency
Source: ANFAVEA (2021)
VEHICLES
4.9
3.53.2
1.7 1.7 1.61.2
4.8
3.4 3.2
1.7 1.7 1.61.2
Brazil Mexico Argentina Germany UK Japan USA
2014 2015
6.7 6.9
5.7 5.36.2 6.1
5.2 4.8 5.04.16.2
6.7
5.4
4.0 4.3 4.63.8
3.3 3.4 3.4
2011 2012 2013 2014 2015 2016 2017 2018 2019 jun-20
Total Credit - Individuals Auto Loan (CDC) & Leasing - Individuals
2,3682,711
3,017 3,230 3,118 3,105 3,265 3,4774,021 4,214
211 201 187 163 145 151 171 204 221 229
690 742 781 805 811 855 9541,112
1,232 1,320
2012 2013 2014 2015 2016 2017 2018 2019 2020 Jun21
Total Credit Outstanding Vehicles Financing - Individuals (3) Total Credit Individuals (2)

86
Loan book origination details
Source: Bradesco (Departamento de Empréstimos e Financiamentos1 – Customers portfolio – Jun’212 – Production R$ – Apr’21 – Jun’213 – Consider Individuals and Companies4 – Average
Indicators – 2Q21
CUSTOMERS¹ AVERAGE TERM²
AVERAGE TICKET²
AVERAGE PRODUCTION²
LOANBOOK3
392Thousand
47Months
~R$87 Thousand
~1,267 Million
Bradesco(Bank operation) ~23,584
Million
999 Thousand
44Months
~R$46Thousand
~1,430 Million
Bradesco Financiamentos (Dealer operation) ~25,439
Million
34%
36%
DOWNPAYMENT4

87
Main Indicators
Vehicle Financing - Bradesco Growth in the average loan and term
Average Term(Months)
Average Loan(R$ Thousand)
Considers CDC/Leasing (new cars, used cars, motorcycles and heavy vehicles)Source: Bradesco
VEHICLES
37.1 37.1 37.1 37.1 34.8 38.749.7
57.160.5
80.8
2012 2013 2014 2015 2016 2017 2018 2019 2020 2021
41 41 40 39 38 40 42 45 46 47
2012 2013 2014 2015 2016 2017 2018 2019 2020 2021

88
Main Indicators
Considers CDC/Leasing (new cars, used cars, motorcycles and heavy vehicles)Source: Bradesco Financiamentos
VEHICLES
Average Loan(R$ Thousand)
Average Term(Months)
Vehicle Financing - Bradesco FinanciamentosGrowth in average loan and term
43
4039 39
3839
40
42
4344
2012 2013 2014 2015 2016 2017 2018 2019 2020 2021
20.4 21.923.9 24.6 24.1
26.4 28.531.9 34.6
43.5
2012 2013 2014 2015 2016 2017 2018 2019 2020 2021

89
HIGHLIGHTS OF THE OPERATION
FINANCED ASSETS
Vehicles
Motorcycles
FINANCING OF VEHICLESthrough the branch network, digital
channels, or network of banking correspondents (14+ thousand)
Trucks & Road Implements
MachineryAgricultural
Civil ConstructionImplements
Boosted FinancingFinancing of Accessories and Services included in the vehicle installment.
Bradesco SegurosLargest insurer in Brazil and in Latin America.
LiveloLargest and most complete market place platform in the rewards sector.
VeloeInstant payments at toll booths, malls and parking lots.
Specialist inTransportation and AgricultureCustomer service structure dedicated
to the segment of heavy-duty vehicles (trucks, machinery and implements).
MAIN PARTNERS
White Label
In addition to Jeep brand vehicles, the Jeep Bank program also covers the brands Dodge, Chrysler, and RAM.
We are the financing providers for world-class automakers.
VEHICLES
Vehicle Financing Diversified offers

90
2nd QUARTER RESULTS 2021

91
Tier I Capital
1.6 p.p. y/y0.5 p.p. q/q
ROAEAccumulated
6.4 p.p. y/y-0.5 p.p. q/q
9.9% y/y3.0% q/q
Expanded Loan Portfolio
Financial Highlights 2Q21
Operating Efficiency Ratio (ER)
-2.1 p.p. y/y0.4 p.p. q/q
Recurring Net Income
63.2% y/y-3.0% q/q
(accumulated 12 months)
Interest on Shareholders’ Equity
Payout in 1H21 of 52%

92
Operational Evolution
3.6% 1H21/1H20
Fee and Commission Income
-4.4%1H21/1H20
Operating Expenses
Variation %
-52.6%1H21/1H20
Expanded ALL
R$ million 2Q21 1H212Q21
x 1Q21
2Q21
x 2Q20
1H21
x 1H20
Net Interest Income 15,738 31,316 1.0 (5.7) 0.4
Expanded ALL (3,487) (7,394) (10.7) (60.8) (52.6)
Gross Income from Financial Intermediation 12,251 23,922 5.0 57.2 53.5
Income from Insurance, Pension Plans and
Capitalization Bonds 1,574 4,711 (49.8) (58.3) (29.8)
Fee and Commission Income 8,412 16,479 4.3 10.3 3.6
Operating Expenses (10,990) (22,194) (1.9) (4.1) (4.4)
Tax Expenses+ Earnings (losses) in unconsolidated
subsidiaries(1,728) (3,631) (9.2) (15.1) (6.6)
Operating Income 9,519 19,287 (2.5) 66.9 73.7
Non-Operating Income + Income Tax + Non-
controlling interests in subsidiaries + Others(3,200) (6,453) (1.6) 74.8 85.7
Recurring Net Income 6,319 12,834 (3.0) 63.2 68.3
Income Origin(Financial and Insurance Areas)
72%
65%
75%90%
28%
35%
25% 10%
6,462
3,873
6,5156,319
2Q19 2Q20 1Q21 2Q21
Financial Insurance
Comparison 1H21 x 1H19
R$ million 1H19 1H211H21
x 1H19
Total Revenues 67,080 71,030 5.9%
Total Expenses 23,932 22,194 (7.3)%
Efficiency Ratio 49.4% 45.7% (3.7) p.p.
EBT 17,196 19,287 7.7%

93
R$35.0 bn4.5% y/y
Client Funds1
Total Funding and Loan/FundingR$ Million
Funding & Loans
4.1% y/y
Total Funding
Growth of Bacen
Portfolio + Debentures in
1H21
1- Client Funds Net of Reserve Requirements.
559.2 581.6 584.4
135.6 133.7 138.8
694.8 715.3 723.2
83.3%87.5% 89.8%
0.0%
10.0%
20.0%
30.0%
40.0%
50.0%
60.0%
70.0%
80.0%
90.0%
100.0%
0.0
200.0
400.0
600.0
800.0
1,000.0
1,200.0
2Q20 1Q21 2Q21
Borrowing, Onlending and Other obligations Client Funds Net of Reserve Requirements Loan/Funding

94
R$ million Jun/21Jun/21
x Mar/21
Jun/21
x Jun/20Jun/21
Companies 440,833 1.4 3.7 60.7
Large corporates 292,995 (0.2) (5.6) 40.3
Micro, Small and Medium-Sized Enterprises 147,838 4.6 28.7 20.4
Individuals 285,620 5.7 21.0 39.3
Payroll-deductible Loans 78,425 7.7 19.8 10.8
Real Estate Financing 68,668 7.7 40.0 9.5
Credit Cards 43,170 6.5 23.1 5.9
CDC/Vehicles Financing 30,102 1.9 6.4 4.1
Personal Loans 31,767 2.9 8.9 4.4
Other Products 33,488 2.4 15.6 4.6
Total Expanded Loan Portfolio 726,453 3.0 9.9 100.0
Without exchange variation 4.0 10.6
30% y/y
Individuals
??
28.7% y/y
SMEs
25% y/y
38% y/y
Variation % Total %
Expanded Loan Portfolio
40.0% y/y
Real Estate Financing
19.8% y/y
Payroll-deductible Loans
Loan Originationper business day
100106
130
2Q20 1Q21 2Q21
100 99
125
2Q20 1Q21 2Q21
100
119
138
2Q20 1Q21 2Q21
Companies
Total

95
Coverage Ratio – Over 90 days
Coverage Ratio – over 90 days + reneg.
Provision for Credit Risk
Expanded ALL (Expenses)R$ Billion
Allowance For Loan Losses*R$ Billion
*ALL balance includes Specific, Generic and Complementary portions.
36.9 36.1 36.840.5 43.2 44.9 45.3 46.0 44.4
8.6% 8.2% 8.1% 8.5%9.0% 9.2% 8.9% 8.7%
8.1%
2Q19 3Q19 4Q19 1Q20 2Q20 3Q20 4Q20 1Q21 2Q21
ALL Balance ALL Balance / Bacen Portfolio
267%
226%245%
228%
299%
398% 403%
350%325%
Jun-19 Sep-19 Dec-19 Mar-20 Jun-20 Sep-20 Dec-20 Mar-21 Jun-21
122% 116% 120% 121% 124% 121% 118% 120% 117%
Jun-19 Sep-19 Dec-19 Mar-20 Jun-20 Sep-20 Dec-20 Mar-21 Jun-21
3.5 3.3 4.0
6.7
8.9
5.64.6 3.9 3.5
2.4% 2.2% 2.6%
4.1%
5.4%
3.4%2.7%
2.2% 1.9%
2Q19 3Q19 4Q19 1Q20 2Q20 3Q20 4Q20 1Q21 2Q21
Expanded ALL Expanded ALL / Expanded Portfolio - Annualized Rate
95

96
15 to 90 Days%
Gross ALL Expenses X NPL Creation >90 DaysR$ billion
Delinquency Ratio
Over 90 Days%
2.7
4.8
3.43.9
4.2 4.14.5
6.0
8.6
6.6
4.2 3.7
1.9
2.6 2.6
6.1
7.4
5.56.1 6.2
5.0 4.75.5
6.9
5.54.4 4.4
3.13.5 3.4
0.50.9
0.4 0.4 0.3 0.6 0.8 0.51.2
1.91.5
0.8
0.70.4 0.4
3.4
4.9
3.6 3.9
4.13.5 3.5
4.1
5.5
4.7
3.53.3 2.2
2.5 2.5
Dec-08 Dec-09 Dec-10 Dec-11 Dec-12 Dec-13 Dec-14 Dec-15 Dec-16 Dec-17 Dec-18 Dec-19 Dec-20 Mar-21 Jun-21
Micro, Small and Medium-Sized Enterprises Individuals Large Corporates Total
4.0 4.13.3
4.1 4.1 4.3 4.3
6.0 5.9 6.1
4.3 4.23.0
3.3
2.3
8.8
7.7
6.3 6.3 6.25.6
5.2
5.7 5.85.1
4.8 4.84.0
4.63.8
0.3 0.2 0.2 0.3 0.5 0.2 0.4 0.4
2.2
0.6 0.9 0.70.2 0.3 0.1
4.9 4.63.8
4.1 4.0 3.7 3.64.1
4.64.0
3.5 3.62.8
3.22.6
Dec-08 Dec-09 Dec-10 Dec-11 Dec-12 Dec-13 Dec-14 Dec-15 Dec-16 Dec-17 Dec-18 Dec-19 Dec-20 Mar-21 Jun-21
Micro, Small and Medium-Sized Enterprises Individuals Large Corporates Total
4.5
2.2
6.4
4.54.3
8.7
4.94.3
96%
398%
78% 95%
2Q19 2Q20 1Q21 2Q21
NPL Creation - 90 days
Gross ALL Expense – Recurrent
Gross ALL Expense - Recurrent / NPL Creation 90 days

97
92% 91%Rating AA to C
R$ billionThe R$41.3 billion balance in June 2021 includes the following components:
On time – R$33.4 billion
In arrears – R$3.5 billion
Grace period – R$4.3 billion
68% 13 years
Extended Loan Portfolio
No delay history inthe 12 months prior to the pandemic
With real collateral
Average relationship time
Extensions Accounting Balance(Net of Amortizations)
* Delinquency ratio above 30 days calculated considering the balance of the expanded loan portfolio.
13.2 13.3 10.5 10.3 8.9
42.8 42.037.5
33.8 32.4
56.0 55.348.0
44.1 41.3
0.1
0.0%
1.1
0.2%
2.9
0.6%
3.9
0.7%3.5
0.6%
-50.0%
-40.0%
-30.0%
-20.0%
-10.0%
0.0%
10.0%
0.0
10.0
20.0
30.0
40.0
50.0
60.0
70.0
80.0
Jun-20 Sep-20 Dec-20 Mar-21 Jun-21
Wholesale Mass Market Product In Arreas (over 30 days)

98
66%
Renegotiated Portfolio
of renegotiations in the quarter were less than 90 days in arrears
Allowance for Loan Losses/
Renegotiated Portfolio
Delinquency Ratio Over 90 Days
Renegotiated Portfolio/ Bacen Portfolio
R$ billionEvolution of Portfolio Balance
Large Corporate
16%
SMEs
32%
Individuals
52%
12.3 13.0 13.6 14.118.5
22.8 24.5 24.0 23.5
7.3 5.8 5.4 5.5
5.0
4.74.9 5.4 5.0
19.6 18.8 19.0 19.6
23.5
27.529.4 29.4 28.5
Jun-19 Sep-19 Dec-19 Mar-20 Jun-20 Sep-20 Dec-20 Mar-21 Jun-21
Originated from portfolio in write-off Originated from active portfolio
66.4% 66.9% 66.8% 68.2% 61.7% 61.5% 63.8% 61.9%
Sep-19 Dec-19 Mar-20 Jun-20 Sep-20 Dec-20 Mar-21 Jun-21
19.0% 17.4%20.8%
11.5%
5.9% 7.4%
14.4% 14.6%
Sep-19 Dec-19 Mar-20 Jun-20 Sep-20 Dec-20 Mar-21 Jun-21
4.2% 4.2% 4.1%4.8%
5.6% 5.8% 5.6% 5.2%
Sep-19 Dec-19 Mar-20 Jun-20 Sep-20 Dec-20 Mar-21 Jun-21

99
Net Interest Income
1.0% q/q
Net Interest Income
1.9% q/q
Client NII2.5% q/q
Average Balance
R$ million
Total Net Interest Income
NII Clients Variation
R$ million
1- Relates to the result of operations made with assets (loans and other) and liabilities sensitive to spreads. The calculation of the result for assets sensitive to spreads considers the original rate of the deducted operations from the internal funding cost and the result for liabilities represents the difference between the cost of raising funds and the internal transfer rate of these funds; and 2- Composed of Asset and Liability Management (ALM), Trading and Working Capital.
R$ million 2Q21 1H212Q21
x 1Q21
2Q21
x 2Q20
1H21
x 1H20
%Total
2Q21
Net Interest Income 15,738 31,316 1.0 (5.7) 0.4 100.0
Client NII1 13,471 26,696 1.9 2.3 2.2 85.6
Average Balance 624,710 617,144 2.5 9.1 10.9
Average Rate 8.9% 8.9% (0.2) p.p. (0.6) p.p. (0.7) p.p.
Market NII2 2,267 4,620 (3.7) (35.6) (8.6) 14.4
Variation %
328
(484)
256145 13,471
13,225
13,163 13,225 13,471
3,521 2,353 2,267
16,68415,578 15,738
6.9%
6.0% 6.0%
9.5%9.1% 8.9%
-5.0%
-3.0%
-1.0%
1.0%
3.0%
5.0%
7.0%
9.0%
11.0%
2Q20 1Q21 2Q21
0
5,000
10,000
15,000
20,000
25,000
30,000
35,000
40,000
Client NII Market NII NIM Total NIM Clients

100
3.6% 1H21/1H20 6.6% 1H21/1H20 1.1% 1H21/1H20
Variation %
Fee and Commission Income
Total Fee Income Card IncomeChecking Account
Total Clients OrganizationIn million
Other clients of the organizationIn million
R$ million 2Q21 1H212Q21
x 1Q21
2Q21
x 2Q20
1H21
x 1H20
% Total
2Q21
Card Income 2,744 5,383 4.0 16.7 6.6 32.6
Checking Account 2,000 3,943 2.9 4.1 1.1 23.8
Asset Management 828 1,625 3.9 1.7 (5.9) 9.8
Loan Operations 662 1,296 4.4 0.8 (6.0) 7.9
Collections and Payments 594 1,209 (3.4) (4.3) (5.5) 7.1
Consortium Management 540 1,053 5.3 23.0 13.3 6.4
Underwriting / Financial Advisory
Services390 645 52.9 68.1 52.1 4.6
Custody and Brokerage Services 351 709 (2.0) 15.8 9.2 4.2
Other 303 616 (3.2) 5.6 8.3 3.6
Total 8,412 16,479 4.3 10.3 3.6 100.0
Business Days 62 123 1 1 0
Bradesco Checking Account HoldersIn million
30.131.4 31.8
2Q20 1Q21 2Q21
39.4 39.3 39.4
2Q20 1Q21 2Q21
69.570.7 71.2
2Q20 1Q21 2Q21

101
40,835 40,920 41,584
2Q20 1Q21 2Q21
-4.4% 1H21/1H20 -2.2% 1H21/1H20 0.3% 1H21/1H20
Variation %
Operating Expenses
Total Expenses
Administrative Expenses
Personnel Expenses
Operating Efficiency RatioAccumulated 12 months
Bradesco Expresso
R$ million 2Q21 1H212Q21
x 1Q21
2Q21
x 2Q20
1H21
x 1H20
% Total
2Q21
Personnel Expenses 5,120 10,189 1.0 5.9 0.3 46.6
Administrative Expenses 5,012 9,824 4.2 0.8 (2.2) 45.6
Administrative + Personnel Expenses 10,132 20,013 2.5 3.4 (0.9) 92.2
Other Expenses / (Operating Expenses) 858 2,181 (35.1) (48.2) (27.6) 7.8
Total Operating Expenses 10,990 22,194 (1.9) (4.1) (4.4) 100.0
47.8% 45.3% 45.7%
2Q20 1Q21 2Q21
4,167 3,312 3,168
276 766 877
4,901 4,709 4,675
9,344 8,787 8,720
2Q20 1Q21 2Q21
Branches UN PAs + PAEs
Branches + Service Points (PAs + PAEs) + BUs1 (UN)
1 –Business units these are Service Points (PAs) dedicated exclusively to relationships, financial advice and the offer of products and services to Clients. For this, digital channels, self-service machines and banking correspondents play a fundamental role.

102
Quarterly
ROAE
Insurance, Pension Plans and Capitalization Bonds
Net IncomeR$ milllion
R$ million
Income from Operations
Evolution of Premiums Issued from Insurance,
Pension Plan Contributions and Capitalization
Bond IncomeR$ million
Retained Claims
14.4% 13.6%
51.8%
15.5% 7.8%19.6%
9.3%
1,3611,629
655
2Q20 1Q21 2Q21
2,5192,284
1H20 1H21
58.3% 29.8%
20.7% 11.2%
16,466 19,529 19,874
2Q20 1Q21 2Q21
35,43239,403
1H20 1H21
361 782 701 1,129
1,8486,880 7,165 7,308 7,139 5,156
6,455 7,1236,779
6,874
6,880 7,165 7,308 7,139 5,517
7,237 7,8247,908
8,722
72.5% 74.2% 74.2% 72.9%
62.4%
74.7%83.7%
77.7%85.5%
58.4%66.7%
76.2%66.6% 67.4%
0.0%
10.0%
20.0%
30.0%
40.0%
50.0%
60.0%
70.0%
80.0%
90.0%
0
5,000
10,000
15,000
20,000
25,000
2Q19 3Q19 4Q19 1Q20 2Q20 3Q20 4Q20 1Q21 2Q21
Claims Advised Covid-19 Retained ClaimsClaims Claims (Without Covid)
3,778 3,1371,574
361 1,129
1,848
4,139* 4,266*3,422*
2Q20 1Q21 2Q21
Result Covid-19 Claims *Without Covid Effect1
1 1
6,7094,711
361 2,977
7,070* 7,688*
1S20 1S211H20 1H21
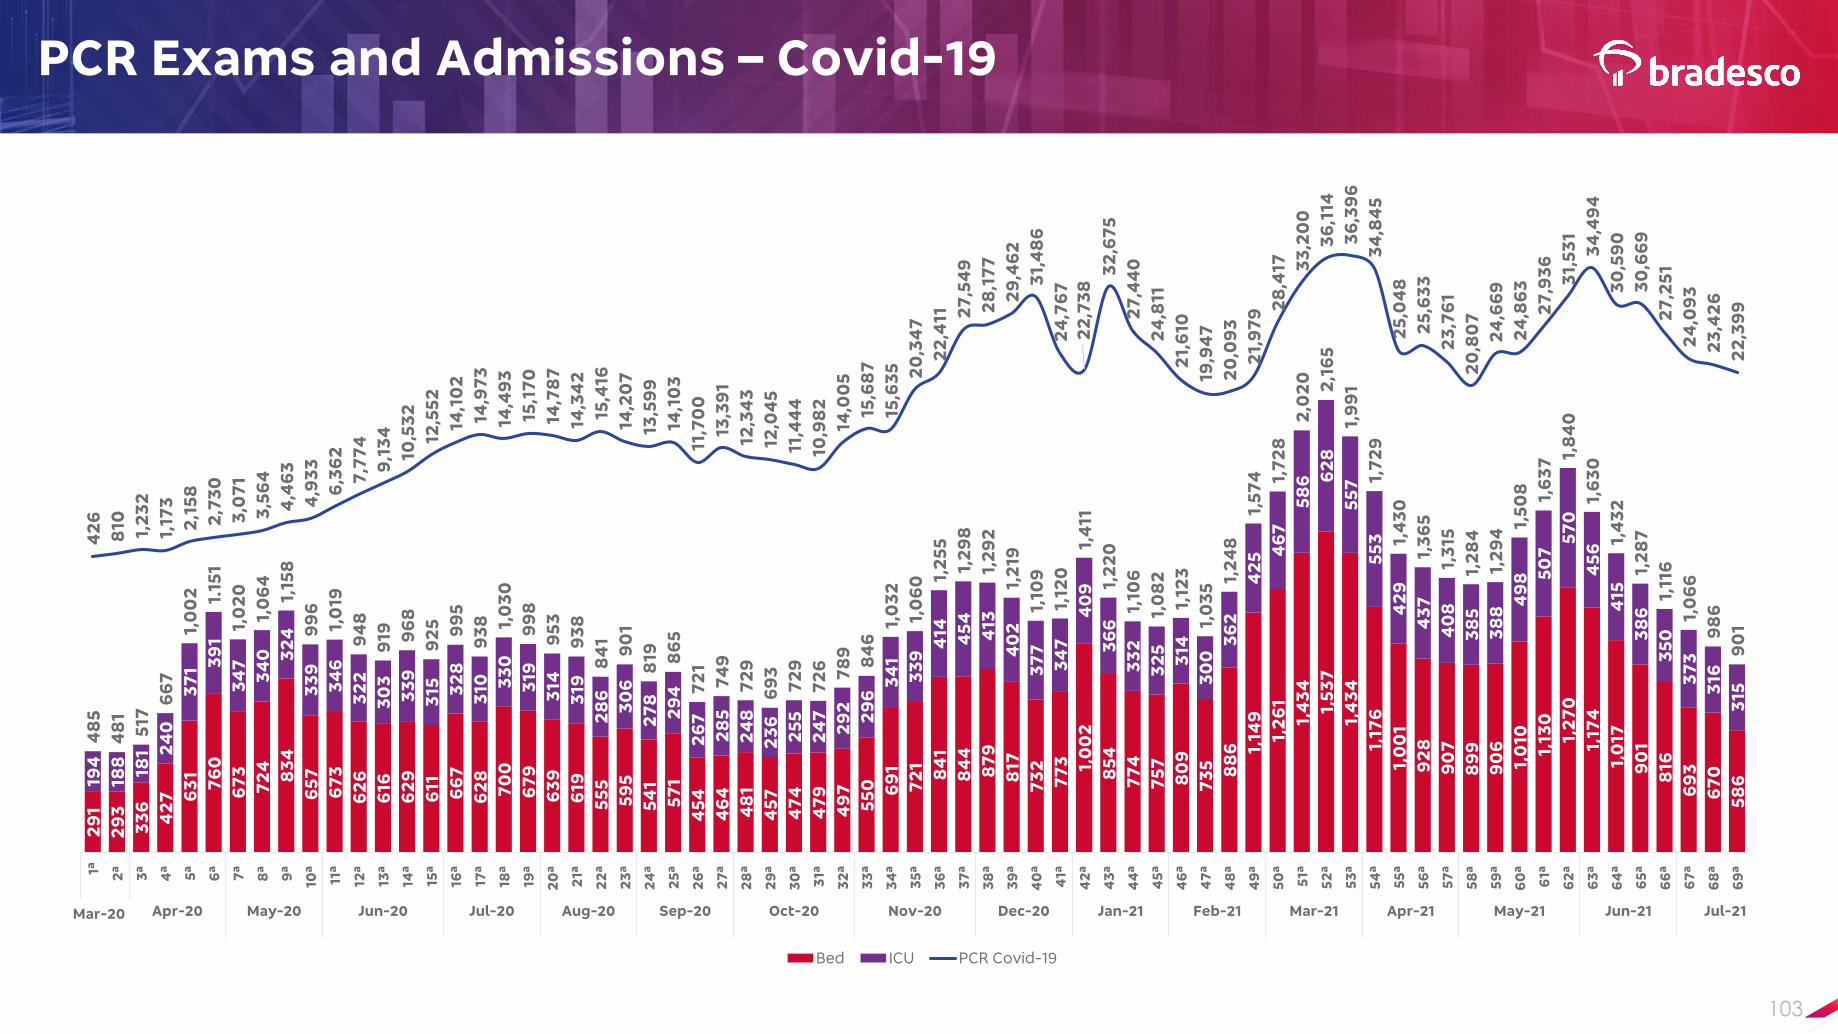
103
PCR Exams and Admissions – Covid-192
91
29
3
33
6
42
7 63
1
76
0
67
3
72
4
83
4
65
7
67
3
62
6
616
62
9
611 66
7
62
8
70
0
67
9
63
9
619
55
5
59
5
54
1
57
1
45
4
46
4
48
1
45
7
47
4
47
9
49
7
55
0 69
1
72
1
84
1
84
4
87
9
817
73
2
77
3 1,0
02
85
4
77
4
75
7
80
9
73
5 88
6 1,14
9
1,2
61
1,4
34
1,5
37
1,4
34
1,17
6
1,0
01
92
8
90
7
89
9
90
6
1,0
10
1,13
0
1,2
70
1,17
4
1,0
17
90
1
816
69
3
67
0
58
6194
188
181 2
40
37
1 39
1
34
7
34
0 32
4
33
9
34
6
32
2
30
3
33
9
315 3
28
310 3
30
319
314
319
28
6
30
6
27
8
29
4
26
7
28
5
24
8
23
6
25
5
24
7
29
2
29
6
34
1
33
9
414 45
4
413
40
2
37
7
34
7
40
9
36
6
33
2
32
5
314
30
0
36
2
42
5 46
7
58
6 62
8
55
7
55
3
42
9
43
7
40
8
38
5
38
8
49
8 50
7
57
0
45
6
415
38
6
35
0
37
3
316
315
48
5
48
1
517
66
7
1,0
02 1.15
1
1,0
20
1,0
64
1,15
8
99
6
1,0
19
94
8
919 9
68
92
5 99
5
93
8 1,0
30
99
8
95
3
93
8
84
1
90
1
819 8
65
72
1
74
9
72
9
69
3
72
9
72
6 78
9
84
6
1,0
32
1,0
60 1,
25
5
1,2
98
1,2
92
1,2
19
1,10
9
1,12
0
1,4
11
1,2
20
1,10
6
1,0
82
1,12
3
1,0
35
1,2
48
1,5
74 1,
72
8
2,0
20 2,1
65
1,9
91
1,7
29
1,4
30
1,3
65
1,3
15
1,2
84
1,2
94
1,5
08 1,6
37 1,
84
0
1,6
30
1,4
32
1,2
87
1,11
6
1,0
66
98
6
90
1
42
6
810 1,2
32
1,17
3
2,1
58
2,7
30
3,0
71
3,5
64
4,4
63
4,9
33
6,3
62
7,7
74
9,1
34
10,5
32
12,5
52
14,1
02
14,9
73
14,4
93
15,1
70
14,7
87
14,3
42
15,4
16
14,2
07
13,5
99
14,1
03
11,7
00
13,3
91
12,3
43
12,0
45
11,4
44
10,9
82
14,0
05
15,6
87
15,6
35 20
,34
7
22
,411 2
7,5
49
28
,17
7
29
,46
2
31,
48
6
24
,76
7
22
,73
8
32
,67
5
27
,44
0
24
,811
21,
610
19,9
47
20
,09
3
21,
97
9 28
,417 3
3,2
00
36
,114
36
,39
6
34
,84
5
25
,04
8
25
,63
3
23
,76
1
20
,80
7
24
,66
9
24
,86
3
27
,93
6
31,
53
1
34
,49
4
30
,59
0
30
,66
9
27
,25
1
24
,09
3
23
,42
6
22
,39
9
-35000
-25000
-15000
-5000
5000
15000
25000
35000
45000
0
500
1000
1500
2000
2500
3000
1ª 2ª
3ª
4ª
5ª
6ª
7ª
8ª
9ª
10ª
11ª
12ª
13ª
14ª
15ª
16ª
17ª
18ª
19ª
20
ª
21ª
22
ª
23
ª
24
ª
25
ª
26
ª
27
ª
28
ª
29
ª
30
ª
31ª
32
ª
33
ª
34
ª
35
ª
36
ª
37
ª
38
ª
39
ª
40
ª
41ª
42
ª
43
ª
44
ª
45
ª
46
ª
47
ª
48
ª
49
ª
50
ª
51ª
52
ª
53
ª
54
ª
55
ª
56
ª
57
ª
58
ª
59
ª
60
ª
61ª
62
ª
63
ª
64
ª
65
ª
66
ª
67
ª
68
ª
69
ª
Mar-
20
Apr-20 May-20 Jun-20 Jul-20 Aug-20 Sep-20 Oct-20 Nov-20 Dec-20 Jan-21 Feb-21 Mar-21 Apr-21 May-21 Jun-21 Jul-21
Bed ICU PCR Covid-19
Mar-20

104
12.6 12.613.1
1.00.7 0.3
(0.5)
1.113.6 14.1
Mar-21 Net Income
2Q21
Prudential Adjustments
Effects
Interest on
Shareholders' Equity
Jun-21
Common Equity Additional Capital
116.1%
%
8.625 Tier I
7.125 CommonEquity
Limits 20211
Variation %
Capital and Liquidity
Basel Ratio%
Regulatory Capital and RWA
Changes in Tier I Ratio in the Quarter
Liquidity CoverageRatio (LCR)
Net Stable Funding Ratio (NSFR)
1-Refer to the required minimums, in accordance with Resolution No. 4,193/13, added to the additional capital contributions established by Circulars No. 3,768/15 and No. 3,769/15.
R$ million Jun/21Jun/21 x
Mar/21
Jun/21 x
Jun/20
Regulatory Capital 141,108 4.1 7.2
RWA 884,639 0.3 1.1
Credit Risk 799,070 0.2 1.6
Operational Risk 66,908 0.0 5.0
Market Risk 18,661 6.3 (25.3)
156.0%
11.5 11.8 12.7 12.6 13.1
15.0 15.1 15.8 15.4 16.0
12.5 12.9 13.8 13.6 14.1
1.1 1.11.1 1.0 1.1
Jun-20 Sep-20 Dec-20 Mar-21 Jun-21
Total Ratio Common Equity Additional Capital (Level I)

105
Guidance
DisclosedGuidance
2021
Actual1H21
ReviewedGuidance
2021
Expanded Loan Portfolio 9% to 13% 9.9% 9% to 13%
Client Portion 2% to 6% 2.2% 2% to 6%
Fee and Commission income 1% to 5% 3.6% 1% to 5%
Operating Expenses(Personnel + Administrative + Others)
-5% to -1% -4.4% -5% to -1%
Income from Insurance, Pension Plans and Capitalization Bond (includes operating financial income)1 2% to 6% -29.8% -15% to -20%
Expanded ALL - R$ Billion R$ 14.0 to R$ 17.0 R$ 7.4 R$ 14.0 to R$ 17.0
1- Billing projections with growth between 8% and 10%.

106
Attachments

107
Consolidated Income Statement
R$ million
Variation %
2Q21 1H212Q21 x
1Q20
2Q21
x 2Q20
1H21
x 1H20
Net Interest Income 15,738 31,316 1.0 (5.7) 0.4
-Client Portion 13,471 26,696 1.9 2.3 2.2
-Market Portion 2,267 4,620 (3.7) (35.6) (8.6)
Expanded ALL (3,487) (7,394) (10.7) (60.8) (52.6)
Gross Income from Financial Intermediation 12,251 23,922 5.0 57.2 53.5
Income from Insurance, Pension Plans and Capitalization
Bonds1,574 4,711 (49.8) (58.3) (29.8)
Fee and Commission Income 8,412 16,479 4.3 10.3 3.6
Operating Expenses (10,990) (22,194) (1.9) (4.1) (4.4)
Personnel Expenses (5,120) (10,189) 1.0 5.9 0.3
Other Administrative Expenses (5,012) (9,824) 4.2 0.8 (2.2)
Other Operating Income / (Expenses) (858) (2,181) (35.1) (48.2) (27.6)
Tax Expenses (1,763) (3,696) (8.8) (12.3) (5.8)
Equity in the earnings (losses) of unconsolidated and jointly-
controlled subsidiaries35 65 16.7 - 75.7
Operating Result 9,519 19,287 (2.5) 66.9 73.7
Non-Operating Income (81) (170) (9.0) 211.5 -
Income Tax / Social Contribution (3,058) (6,154) (1.2) 75.0 83.9
Non-Controlling interests in subsidiaries (61) (129) (10.3) 5.2 12.2
Recurring Net Income(1) 6,319 12,834 (3.0) 63.2 68.3
(1) According to the non-recurring events described on page 32 of the Economic and Financial Analysis Report.

108
Net Interest Income
NII Clients Market Portion
Net Interest Income – YoY Growth
7.1% 5.9%4.4% 2.9%
15.3%
3.5%
8.0% 7.4%
-5.7%
2Q19 3Q19 4Q19 1Q20 2Q20 3Q20 4Q20 1Q21 2Q21
4.2%5.2%
9.2%8.4% 8.0%
2.3%
1.8% 2.0% 2.3%
2Q19 3Q19 4Q19 1Q20 2Q20 3Q20 4Q20 1Q21 2Q21
25.9%
9.9%
-15.4% -27.8%
54.2%
9.9%
40.6%53.3%
-35.6%
2Q19 3Q19 4Q19 1Q20 2Q20 3Q20 4Q20 1Q21 2Q21

109
Expanded Allowance for Loan Losses
Operating Expenses (Pers + Adm + Others)Operating Expenses (Pers + Adm)
Fee and Commission Income
Financial Information – YoY
-0.1%
-5.8%
5.2%
86.1%
154.9%
67.5%
14.7%
-41.8%-60.8%
2Q19 3Q19 4Q19 1Q20 2Q20 3Q20 4Q20 1Q21 2Q21
1.3%3.7% 4.7%
2.6%
-7.9%
-3.6%-1.3%
-2.6%
10.3%
2Q19 3Q19 4Q19 1Q20 2Q20 3Q20 4Q20 1Q21 2Q21
6.8%
10.1%
6.2%
2.1%
-7.4%
-10.7%
-6.9%-5.0%
3.4%
2Q19 3Q19 4Q19 1Q20 2Q20 3Q20 4Q20 1Q21 2Q21
5.6%6.5%
0.5%-0.4%
-5.5%
-5.7%
-9.3%
-4.7%
-4.1%
2Q19 3Q19 4Q19 1Q20 2Q20 3Q20 4Q20 1Q21 2Q21

110
Provision for Credit Risk
2.4 2.42.8 2.7
3.13.4 3.3 3.2 3.1 3.1
2.9 3.0 2.93.1
3.3 3.33.6 3.6
3.94.2
5.45.0
5.7
6.3
5.3 5.4
4.7
5.5
3.93.5 3.5
3.8 3.6 3.5 3.3
4.0
6.7
8.9
5.6
4.6
3.93.5
3.9%
3.0%
3.3%
3.1%
3.5%
3.7%
3.6%
3.3%
3.2%
3.1%
2.8%
2.8%
2.6%
2.9%
3.0%
2.9%
3.1%
3.1%
3.2%
3.5%
4.7%
4.5%
4.4%4.9%
4.3%
4.4%
3.8%
4.4%
3.2%2.7%
2.7%
2.8%
2.6%
2.4%2.2%
2.6%
4.1%
5.4%
3.4%
2.7%
2.2%1.9%
Expanded ALL Expanded ALL / Expanded Portfolio - Annualized Rate

111
¹ER calculation = (Personnel Expenses + Administrative Expenses + Other net revenue operating expenses) / (Financial Margin + Fee and Operating Income + Insurance results + Equity Income of Affiliated Companies + Tax Expenses).
Efficiency Ratio¹ and Operating Coverage Income
49.2% 49.9% 48.3% 49.3%44.0%
47.6% 44.6% 45.0% 45.8%
64.2% 63.9% 63.4%66.7%
70.5% 72.2% 72.0%67.9%
63.4%
49.4% 49.5% 49.0% 49.1% 47.8% 47.2% 46.3% 45.3% 45.8%
2Q19 3Q19 4Q19 1Q20 2Q20 3Q20 4Q20 1Q21 2Q21
Quarterly Efficiency Ratio 12- Month Risk- Adjusted Efficiency Ratio 12 Month Efficiency Ratio

112
Book Net Income x Recurring Net Income
R$ million 2Q21 1Q21 2Q20 1H21 1H20
Recurring Net Income 6,319 6,515 3,873 12,834 7,626
Non-Recurring Events (345) (362) (367) (707) (738)
- Goodwill Amortization (Gross) (345) (356) (367) (701) (738)
- Other - (6) - (6) -
Book Net Income 5,974 6,153 3,506 12,127 6,888

113
20.6 20.221.2
11.7 11.9
15.2
20.018.7
17.6
Return on Equity (ROE)%
Recurring Net Income EvolutionR$ Million
63.2%
Return on Equity / Recurring Net Income Evolution
6,462 6,542 6,645
3,753 3,873
5,031
6,8016,515 6,319
2Q19 3Q19 4Q19 1Q20 2Q20 3Q20 4Q20 1Q21 2Q21

114
93%Real
58%With
Guarantee
1.3%
9.4 bn
8.1%
58.6 bn
13.5%
98.2 bn
23.0%
167.3 bn
29.6%
214.8 bn
Loan Portfolio Concentration
Diversified loan portfolio and with low concentration in areas of greater risk
Exposure by currency
Warranty Coverage(Bacen Portfolio)
Concentration among the largest debtors
risk (R$ billion)
risk / portfolio (%)
Largest borrower 10 largest borrowers 20 largest borrowers
50 largest borrowers100 largest borrowers
Portfolio diversificationby segment
Micro, Small and Medium-Sized Enterprises
Other
CDC/Vehicle Financing
Personal Loans
Credit Card
Real Estate Financing
Payroll-deductible Loans
Large corporates
4.6%
4.1%
4.4%
5.9%
9.5%
10.8%
20.4%
40.3%

115
(1) Disregarding the BAC consolidation, the developments in 12 months would be: Expanded Portfolio 8.6%; SMEs 23.5%; and Individuals 20.0%%.
Loan Portfolio
Variation %
Jun/21 Mar/21 Jun20Jun/21
x Mar/21
Jun21
x Jun20
%Total
Jun21
R$ Milllion282,192 266,968 233,734 5.7 20.7 38.8%
Companies 264,329 261,611 245,591 1.0 7.6 36.4%
Loan Portfolio – Bacen 546,521 528,580 479,325 3.4 14.0 75.2%
Sureties and Guarantees 77,373 79,256 82,416 (2.4) (6.1) 10.7%
Operations bearing Credit Risk - Commercial Portfolio 70,611 71,113 70,791 (0.7) (0.3) 9.7%
Others 31,948 26,211 28,583 21.9 11.8 4.4%
Expanded Loan Portfolio(1) 726,453 705,160 661,115 3.0 9.9 100.0%
Without exchange rate variation 4.0 10.6

116
Expanded CriteriaR$ Billion
Mix related to Individuals687493 623532 705
?
510370 454408 529
Loan Portfolio
726
546
27.4% 29.9% 19.9% 18.7% 19.1% 18.3%
38.1% 39.6% 46.7% 45.7% 44.3% 44.3%
34.5% 30.5% 33.4% 35.6% 36.6% 37.4%
2017 2018 2019 2020 1T21 2Q21
SMEs Large Corporates Individuals
30.2% 34.0% 24.2% 22.7% 22.8% 22.6%
29.4% 26.0% 32.2% 30.1% 29.6% 26.4%
40.3% 40.0% 43.6% 47.2% 47.5% 51.0%
2017 2018 2019 2020 1Q21 2Q21
SMEs Large Corporates Individuals
25.1%
26.2%
27.0%
26.8%
26.9%
27.5%
19.2%
19.7%
19.0%
22.7%
23.6%
24.0%
19.6%
18.4%
17.6%
16.2%
15.0%
15.1%
14.7%
13.4%
12.3%
12.3%
12.1%
11.7%
11.8%
12.2%
12.4%
11.3%
10.9%
11.1%
9.6%
10.2%
11.5%
10.8%
11.4%
10.5%
2017
2018
2019
2020
1Q21
2Q21
Payroll Loans Mortgage Credit Card Others Vehicles Personal Loans
Central Bank CriteriaR$ Billion
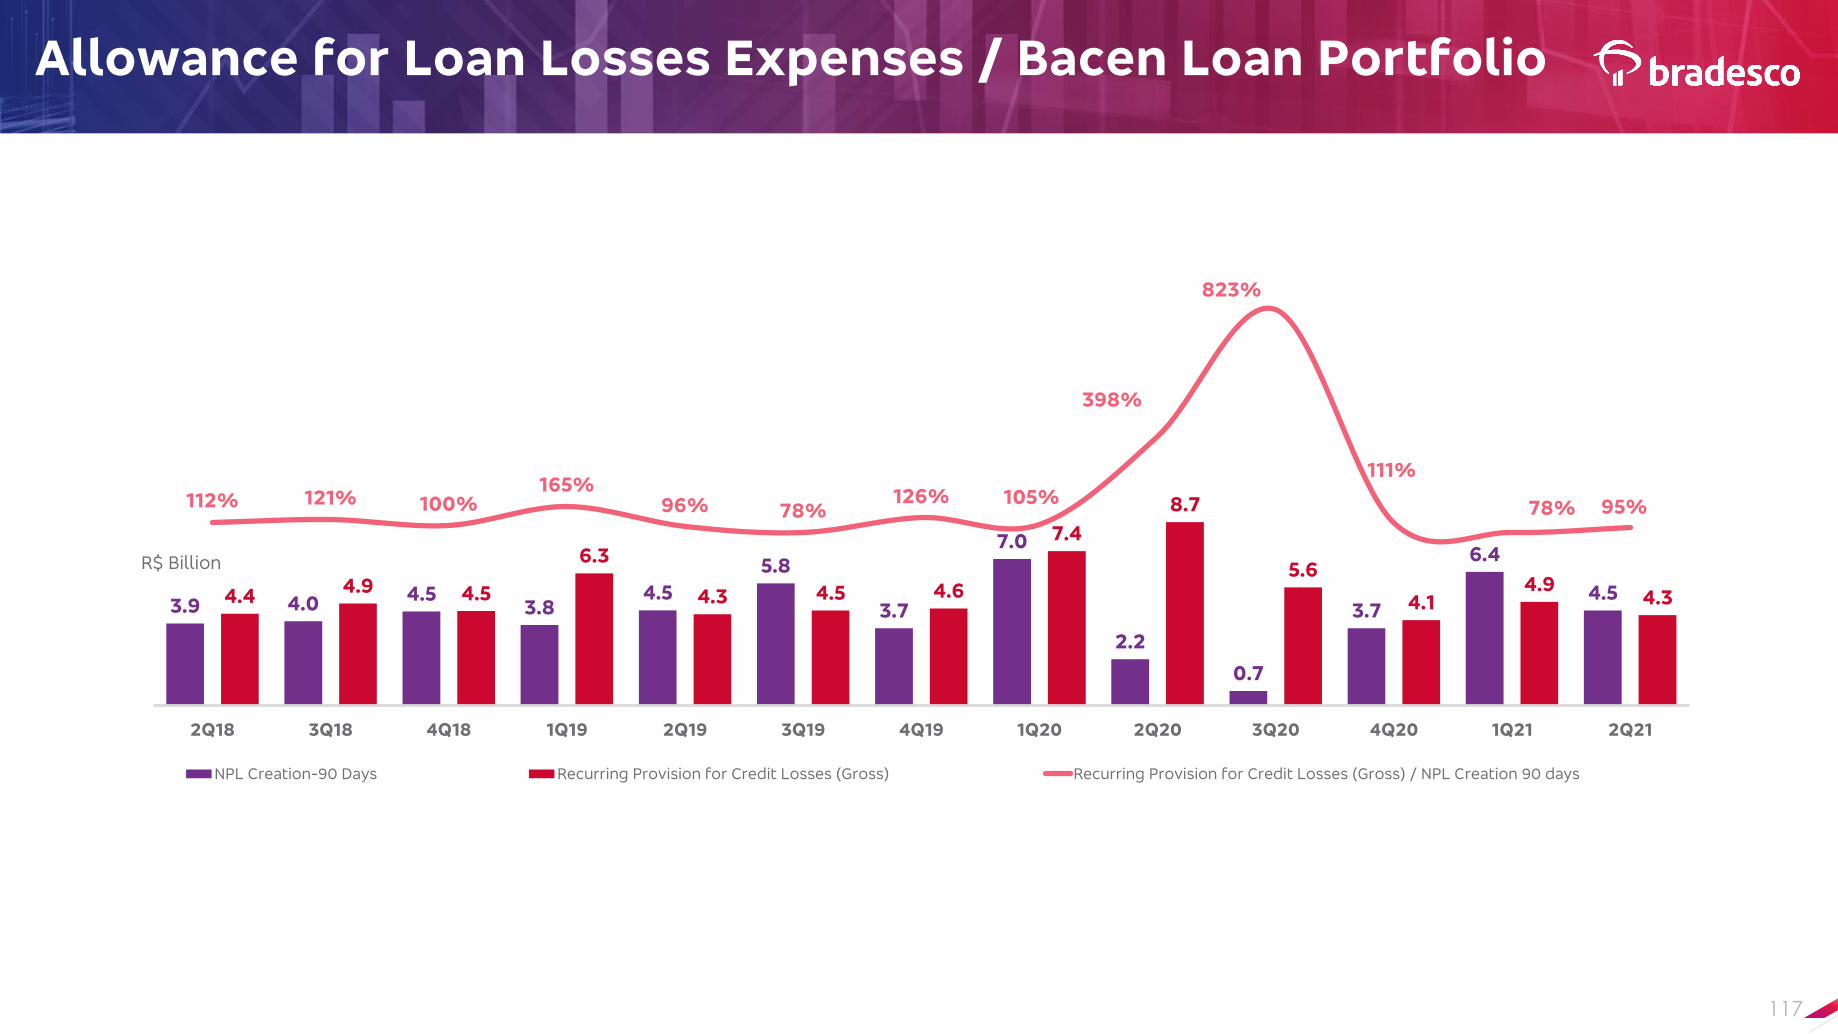
117
Allowance for Loan Losses Expenses / Bacen Loan Portfolio
3.9 4.0 4.53.8
4.5
5.8
3.7
7.0
2.2
0.7
3.7
6.4
4.54.44.9 4.5
6.3
4.3 4.5 4.6
7.4
8.7
5.6
4.14.9
4.3
112% 121% 100%165%
96% 78%126% 105%
398%
823%
111%
78% 95%
2Q18 3Q18 4Q18 1Q19 2Q19 3Q19 4Q19 1Q20 2Q20 3Q20 4Q20 1Q21 2Q21
NPL Creation-90 Days Recurring Provision for Credit Losses (Gross) Recurring Provision for Credit Losses (Gross) / NPL Creation 90 days
R$ Billion

118As of: June 2021.
Rate Remuneration
Demand Deposits
Reserve Requirements 21.0% -
Agricultural Loans 27.5% 6.00% p.a. - Reserve Requirement 5.00% p.a. - PRONAMP
Microcredit 2.0% Varies According to Type of Operation
Discretion any use 49.5%
Saving Deposits
Mortgage Loan 65.0% Varies According to Type of Mortgage
Reserve Requirements 20.0% Reference Rate (TR) + 6.17% p.a. or TR + 70% of the Selic rate
for deposits made as of May 4, 2012, with the Selic rate at
lower than 8.5% p.a.Discretionary any use 15.0%
Time DepositsReserve Requirements 17.0% SELIC
Discretion any use 83.0% -
Reserve Requirements and Restricted Loans

119
Emergency Program Total Financed
(R$ million)Average Period
(Months)
PEAC FGI 15,540 41
PESE 1,547 36
CGPE2 3,319 37
PRONAMPE 2,689 36
Financing for Micro and Small-sized EnterprisesCircular No. 4,0331
7,386 33
TOTAL (on June 30, 2021) 30,481 38
Loans in Emergency Programs
(1) Funding of the Savings Reserve Requirement(2) The program began on July 21. It includes the following products: Working Capital - Normal, Micro and Small-sized Enterprises, Receivables, Funding Savings Accounts, PESE and
PRONAMPE. Rules used: Companies with revenues up to R$300 million; Minimum grace period for payments of 180 days and a minimum term of 36 months. Does not take into account any possible volume restrictions due to a lack of rating in the sub-liabilities to be applied on December 31, provided for in Resolution No. 4,838.

120
INSTITUTIONALPRESENTATION
2Q21