
Institutional Ownership Stability and the Payout...
20
1 Institutional Ownership Stability and the Payout Policy Hamidreza Sakaki 1 The University of Texas-Pan American, TX 78539, USA Abstract This paper examines the potentially neglected link between institutional ownership stability and the payout policy. By controlling for other determinants of dividend, repurchase and total payout and considering the endogeneity between institutional ownership stability and payout policy, this study presents the first evidence for the impact of institutional owners’ stability on payout policy in the U.S. The results show that there is a positive and significant relationship between institutional ownership stability and repurchase activities. Also, institutional ownership stability affects total payout positively, while it has negative impact on dividend. In addition, institutional ownership proportion has positive impact on repurchase and total payout but it has negative impact on dividend. JEL classification: G32; G35 Keywords: Institutional ownership stability; Dividend; Repurchase; Total payout 1. Introduction Institutional owners have increased their market share in the U.S stock market dramatically since 1980. They doubled their share of the stock market from 28.4% in 1980 to 53.3% in 2005. They hold more than 50% of the U.S stock market in 2009 (Tonello and Rabimov, 2010). Institutional owners have a key role in corporate financial policies and this role has been a subject of research among scholars. (e.g. Gillan and Starks 2000; McConnell and Servaes 1990; Smith 1996;; Hartzell and Starks 2003; Carleton et al. 1998 and Boehmer and Kelley 2009). Institutional owners are associated with payout policy of the firms. Existing studies focus on the impact of institutional owners on payout policy without considering the stability of institutional owners. Different institutional owners have different agenda (Brickley et al., 1988; 1 Corresponding author at: Department of Economics and Finance, College of Business, University of Texas-Pan American, 1201 W. University Drive, Edinburg, TX 78539, USA. Tel: +1 956 404 9296. Email address: [email protected]
Transcript of Institutional Ownership Stability and the Payout...

1
Institutional Ownership Stability and the Payout Policy
Hamidreza Sakaki1
The University of Texas-Pan American, TX 78539, USA
Abstract
This paper examines the potentially neglected link between institutional ownership stability and the payout
policy. By controlling for other determinants of dividend, repurchase and total payout and considering the
endogeneity between institutional ownership stability and payout policy, this study presents the first evidence for the
impact of institutional owners’ stability on payout policy in the U.S. The results show that there is a positive and
significant relationship between institutional ownership stability and repurchase activities. Also, institutional
ownership stability affects total payout positively, while it has negative impact on dividend. In addition,
institutional ownership proportion has positive impact on repurchase and total payout but it has negative impact on
dividend.
JEL classification: G32; G35
Keywords: Institutional ownership stability; Dividend; Repurchase; Total payout
1. Introduction
Institutional owners have increased their market share in the U.S stock market dramatically
since 1980. They doubled their share of the stock market from 28.4% in 1980 to 53.3% in 2005.
They hold more than 50% of the U.S stock market in 2009 (Tonello and Rabimov, 2010).
Institutional owners have a key role in corporate financial policies and this role has been a
subject of research among scholars. (e.g. Gillan and Starks 2000; McConnell and Servaes 1990;
Smith 1996;; Hartzell and Starks 2003; Carleton et al. 1998 and Boehmer and Kelley 2009).
Institutional owners are associated with payout policy of the firms. Existing studies focus on
the impact of institutional owners on payout policy without considering the stability of
institutional owners. Different institutional owners have different agenda (Brickley et al., 1988;
1 Corresponding author at: Department of Economics and Finance, College of Business, University of Texas-Pan
American, 1201 W. University Drive, Edinburg, TX 78539, USA. Tel: +1 956 404 9296.
Email address: [email protected]

2
Del Guercio, 1996 and Woidtke, 2002). So, their different impacts on payout policy of the firms
are plausible. Existing literature neglected the potential link between the institutional owner’s
stability and payout policy. This study tries to remedy this shortcoming by investigating the
effects of institutional ownership stability on payout policy of the firms in the U.S. To
investigate this effect, I use a variable for measuring the institutional ownership stability
following Elyasiani et al. (2010) and examine that whether firms hold by more stable
institutional owners are more likely to pay more cash through dividends or repurchases. Based
on three theories which are agency cost, adverse-selection theory and substitution theory, I test
three main hypotheses in this study. The first one is that firms which hold by more stable
institutional owners pay more dividends. The second one is firms with more institutional
ownership stability are more involve in repurchase activities and the third one is that
institutional owners stability have a positive impact on the total payout which is made up of
stock repurchases.
Based on these three hypotheses, I find that firms with more stable institutional owners pay
fewer dividends to their shareholders but these firms have more repurchase activities and total
payouts. In terms of magnitude, as one standard deviation decrease in institutional ownership
volatility is associated with an increase in the repurchase ratio of 0.132 and as one standard
deviation decrease in institutional ownership volatility is associated with an increase in the total
payout of 0.051. Also, I find that the institutional ownership proportion has negative and
significant effect on dividend, while it has positive and significant effect on both repurchase and
total payout.
This paper consists of five more sections. Section 2 reviews the literature dealing with the
linkage that exists between the institutional owners and payout policy and also the stability of

3
institutional owners. A discussion of sample and data is provided in Section 3. Section 4
describes the methodology used in this study. Section 5 reports and discusses the results. Finally,
Section 6 concludes.
2. Literature review
One of the aspects that institutional ownership affects is payout policy of the firms. The
empirical evidence investigates the link between institutional ownership and payout policy.
Eckbo and Verma (1994) show that cash dividend yield increases as a result of voting power of
corporate/institutional shareholders. Moh’d et al. (1995) show the robust positive relationship
between institutional ownership and dividend. Short et al (2002) identify the role of institutional
ownership in association to dividend policy. They conclude that institutional ownership in firms
contributes to paying more dividends by firms. Grinstein & Michaely (2005) explore this link and
document that institutional shareholders prefer dividend-paying firms to non-dividend-paying-
firms and they don’t have any preference for firms that pay high amount of dividends. Also, they
show that institutional ownership and a concentration of institutional ownership don’t cause
firms to pay more dividends.
Although many researchers have been investigating the association between dividend policy
and institutional ownership, the potential relation between payout policy and institutional
ownership stability has been somewhat neglected.
Different institutional shareholders have different perspectives. (Woidtke, 2002 and Del
Guercio, 1996). Some try to monitor and affect the management, while some are looking for
short term profits. On the one hand, Stable (long term) shareholders focus on monitoring and
influencing rather than trading for profit because these shareholders have this opportunity to
learn more about the investee firms and have bigger incentives to effectively monitor them and

4
affect the management (Chen et al., 2007). On the other hand, unstable (short term) investors are
extract profits by subsequent trading activities based on the information (Yan and Zhang, 2009).
Gasper et al. (2005) examine shareholders’ investment horizons and the market for corporate
control. They show that shareholders investment horizon affect managerial behavior in merger
and acquisition transactions. Firms hold by short-term shareholders get the lower premium in
acquisition transactions. It means that managers in these firms have a weaker bargaining power.
Also, the authors show that weak monitoring by short-term shareholders allows the managers to
bargaining for personal advantages at the expense of shareholders return.
Bushe (1998) shows that firms hold by large proportion of institutional owners with high
portfolio turnover and engage in momentum trading strategy are more likely to reduce R&D to
meet short term earnings target. Elyasiani and Jia (2008) show that institutional ownership
stability has positive and significant effect on bank holding company performance. Elyasiani et
al. (2010) document that institutional ownership stability leads to a lower cost of debt. Overall,
the previous literatures suggest that stable institutional owners have monitoring rule in
influencing managerial behavior, while unstable institutional owners just focus on short-term
earnings.
There might be a link between stable institutional shareholders and firm payout policy based
on the three theories. First, Long term institutional owners provide this opportunity for managers
to engage in long term investments by reducing redemption pressures and information
asymmetry. Consequently, it might lead to generate more free cash flows for paying dividend to
shareholders. Based on the agency theory, institutional owners can reduce agency cost. Elyasiani
and Jia (2008) and Elyasiani et al. (2010) discuss that stable institutional owners are better
motivated and better able to monitor effectively, so they can reduce agency costs in the firms.

5
Consequently, firms with lower agency costs are more likely to share more profits with their
shareholders (Jensen 1986). Hartzell and Starks (2003), conclude that stable institutional
shareholdings better aligns the interests of managers with those of the shareholders. Stable
institutional shareholders allow managers to involve in long term profitable investments by
mitigating the managerial myopia problem (Bushee, 1998, 2001; Edmans, 2007; Cherkes et al
2007). So, investing in profitable projects means gaining more free cash flows by firms and they
might pay higher amount of cash to their shareholders.
Second, based on the adverse-selection theory (Brennan and Thakor, 1990) which assert that
if institutional owners are more informed than other shareholders, they prefer repurchases. Stable
shareholders are able to learn more about the investee firms than unstable investors.
(Chen et al., 2007). Also, previous studies show that institutional investors are better informed
compared to other investors. (e.g. Bennet et.al. (2003)). So, firms hold by more stable
institutional owners would have more repurchase activities.
Third, as the adverse-selection theory suggested stable institutional owners encourage firms to
repurchase. The institutional ownership stability might be the driving force behind the gradual
substitution of repurchases for dividend found by Grullon and Michaely (2002). Based on the
substitution theory, firms hold by more stable institutional owners leads to a higher total payout
going toward repurchases and a lower total payout going toward dividends. So, stable
institutional owners have a positive impact on the total payout which is made up of stock
repurchases.
The key contribution of this paper is investigating the relationship between institutional
ownership stability and payout policy. In the other words, I examine that whether the
institutional ownership stability lead to pay more dividends, repurchase or total payout by firms

6
or not. To the best of my knowledge, there is no other study examining the relationship between
institutional ownership stability and payout policy as extensively as this paper.
3. Data and sample
3.1. Data
Information on institutional ownership is obtained from Thomson Financial database. I
extract dividend and firm specific data from COMPUSTAT. To be included in the final sample,
the observations must have complete information in Thomson Financial and COMPUSTAT. I do
not exclude the financial and utility firms due to their propensity to pay dividends and repurchase
shares. The final sample includes 81637 firm-year observations for the period 1980 - 2013.
3.2.Variable construction
I construct four sets of variables: institutional ownership stability measures, institutional
ownership level, payout measures and control variables.
3.2.1. Institutional ownership stability measures
Following Elyasiani et al. (2010), I use one variable for measuring the institutional ownership
stability of the firms. This variable is institutional ownership volatility of firm i ( ) which is
the average standard deviation of institutional shareholding proportions across all investors j in
firm i ( ) over a five-year period including the sample year and the four years preceding it
(i.e.,20 quarters). Formally,
= Std (
) / (1)

7
Where
is the proportion of firm i held by investor j at quarter t (t=1, 2,…, 20), and is
the number of institutional owners in firm i. The higher the ownership volatility, the lower is the
ownership stability.
3.2.2. Institutional ownership level measures
To control for the effect of institutional ownership level on payout, in the regression using
, I also consider the aggregate ownership proportion (elyasiani et al.2010). The aggregate
ownership proportion of a firm is computed over a five year period as:
Prop = (
) / 20 (2)
Where
is the proportion of firm i held by investor j at quarter t (t=1, 2,…, 20)
3.2.3. Payout measures
For analyzing the payout policy of the firms I use four variables. The first one is dividend
yield which is measured as dividend divided by price per share, the second one is dividend
payout ratio which is measured as the total dividend to net income, the third one is repurchase
which is calculated as repurchase divided by total assets and the last one is total payout which is
the sum of dividends and repurchases divided by total assets To deal with potential outliers,
dividend yield and payout ratio winsorized at the 1% and 99% levels.
3.2.4. Control variables
The basic regression includes five control variables. I also consider industry dummies to
account for industry-specific effects on payout policy and year dummies to account for
unobserved economic variables. The first control variable is firm size which is computed as the
8
natural log of total assets. Fama and French (2002) propose that larger firms have more free cash
flow and pay more dividends. The second one is return on assets (ROA), the operating income
divided by total assets. ROA is as a proxy for profitability. Fama and French (2002) and Jensen
et al (1992) show that profitability has positive effect on dividend payout. The third variable is
market to book ratio which is a proxy for future investment opportunities (Fama and French
2001). This ratio is calculated by dividing the market value of equity to book value of equity.
Firms with higher growth opportunities are more likely to keep the cash flow for investing in
future projects. So, firms with higher growth opportunities pay lower dividend compared to firms
with few growth opportunities (Fama and French, 2002). The next variable is leverage which is
the sum of long term and short term debt divided by book value of total assets. It is proposed that
firms with higher level of leverage pay lower dividend (Fama and French 2002). The last
variable is market capitalization which is the market value of common shares outstanding. Firms
with higher market value pay more dividends. To deal with potential outliers, all control
variables winsorized at the 1% and 99% levels.
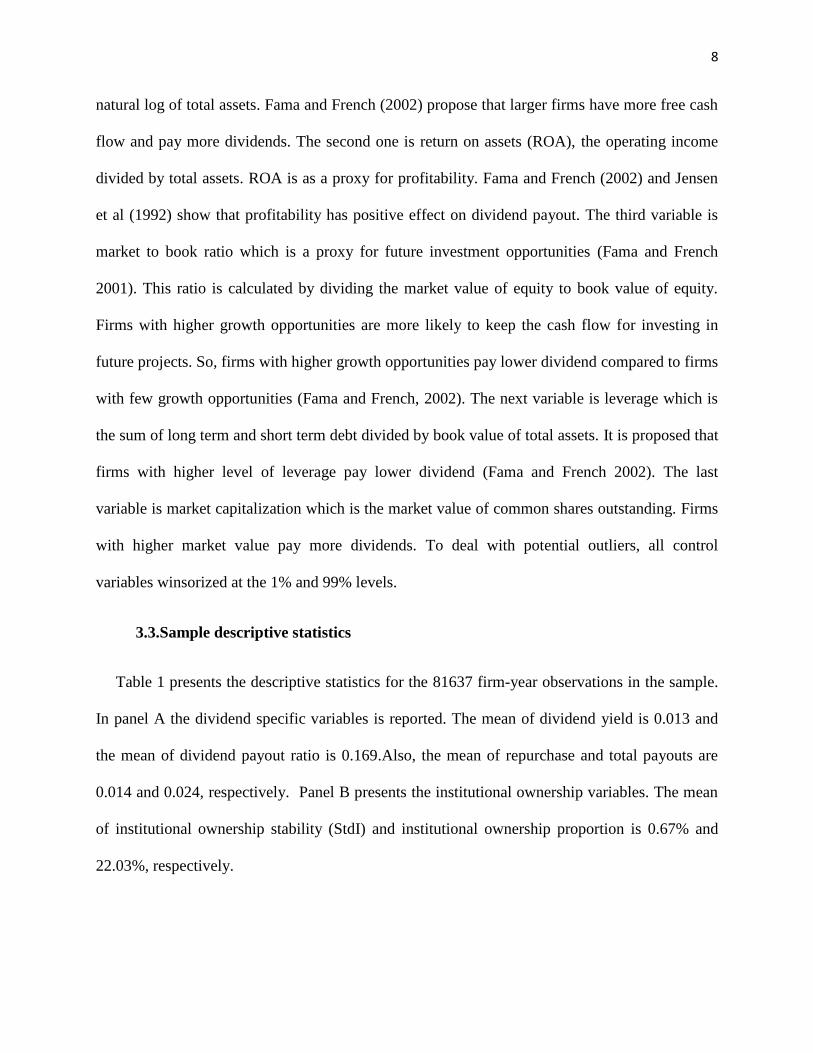
3.3.Sample descriptive statistics
Table 1 presents the descriptive statistics for the 81637 firm-year observations in the sample.
In panel A the dividend specific variables is reported. The mean of dividend yield is 0.013 and
the mean of dividend payout ratio is 0.169.Also, the mean of repurchase and total payouts are
0.014 and 0.024, respectively. Panel B presents the institutional ownership variables. The mean
of institutional ownership stability (StdI) and institutional ownership proportion is 0.67% and
22.03%, respectively.

9
4. Methodology
Regarding the univariate analysis, I classify the sample into quintiles based on the aggregate
institutional ownership proportion in each year. Then I divide each quintiles into five groups
based on the institutional ownership stability, so I obtain 25 groups. Then I calculated the
average of repurchase or total payout for each portfolio. Since other variables like firm-specific
variables could also affect the repurchase or total payout, it is important to control these
variables. I use probit regression. Then I proceed to investigate the effect of institutional
ownership stability on the amount of dividend payouts, repurchase and total payout by using
Tobit and OLS regressions. In this study there might be significant biases because of the
potential endogeneity between the ownership stability and payout. To address this endogeneity I
use difference generalized method of moments (GMM) methodology that is based on the
methodology employed in Holtz-Eakin, Newey and Rosen (1988). Refinements and validity tests
developed in Arellano and Bond (1991) are also used. Difference GMM removes fixed effects
and uses lagged values of the dependent variable and independent variables of interest as
instruments. This method avoids endogeneity problems associated with using fixed-effects when
there is autocorrelation in the dependent variable. It also corrects for any concurrent endogeneity
problems associated with the inclusion of lagged independent variables.
5. Results
To distinguish the effect of institutional ownership proportion from that of ownership
stability, I disaggregate the sample according to these two variables. In panel A table 2, at the
first step the sample is divided into quintiles based on the institutional ownership proportion.
Then each proportion quintiles is divided to five groups based on the institutional ownership

10
stability (StdI). So there are 25 repurchase portfolios. The average of repurchase ratio is reported
in panel A. In panel A, as we move vertically the institutional ownership proportion is constant
but the institutional ownership stability decrease (higher StdI means lower institutional
ownership stability). The portfolio with the highest StdI (lowest stability) has lower repurchase
ratio than the one with the lowest one (Highest stability). T-tests reported in the last row indicate
that this difference is significant. Also, as we move horizontally the institutional ownership
stability is remaining unchanged but the aggregate proportion increases. It is evident that as
ownership proportion increase, the average repurchases ratio increases.
In panel B table 2, when we move vertically we fix institutional ownership proportion while
the institutional ownership stability is decreasing. we can see the positive significant relationship
between the total payout and institutional ownership stability. The results of Table 2 suggest that
there is a positive and significant link not only between institutional ownership stability and
repurchase but also between institutional ownership stability and total payout. Indeed, even the
institutional ownership proportion fixed; higher institutional ownership stability is associated
with higher ratio of repurchase or total payout. Also, there is a significant and positive
relationship between the institutional ownership proportion and repurchase/total payout.
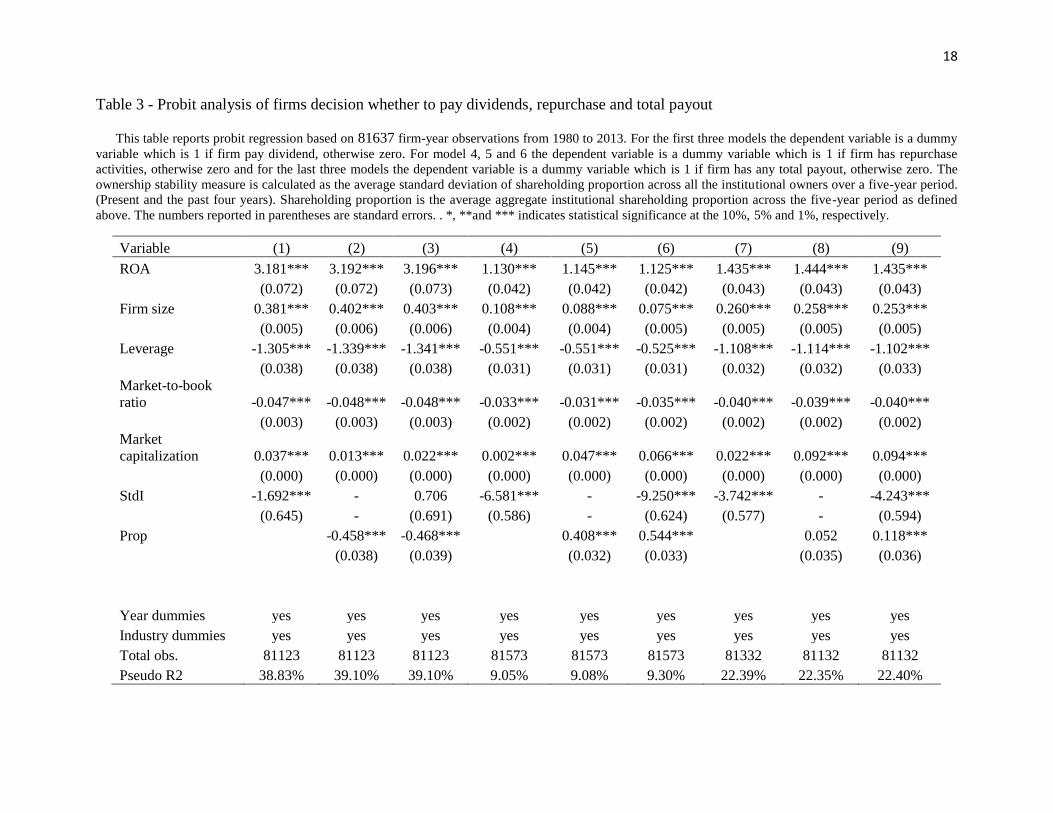
Table 3 reports the results of probit regression. For the first three models the dependent
variable is a dummy variable which is 1 if firm pay dividend, otherwise zero. For model 4, 5 and
6 the dependent variable is a dummy variable which is 1 if firm has repurchase activities,
otherwise zero and for the last three models the dependent variable is a dummy variable which is
1 if firm has any total payout, otherwise zero. As shown in model (1), StdI coefficient is negative
and significant at 1% level. It means that firms hold by more stable institutional owners are more
likely to pay dividend. As model (2) and (3) show the institutional ownership proportion has

11
negative and significant impact on the likelihood of paying dividend. Also, the StdI coefficient is
negative and significant at 1% level in model (4), (6), (7) and (9). It indicates that firms hold by
more stable institutional owners are more likely to have repurchase activities and total payout. In
addition, it is evident from model (5), (6) and (9) that firms with higher institutional owners’
proportion are more likely to have repurchases activity and total payout. So, it is apparent that in
addition to institutional ownership stability the ownership proportion is also increase the
probability of repurchase activities or total payout. Although firms hold by more stable
institutional owners are more likely to pay dividend, the institutional owners proportion has
negative and significant impact on dividend. The results on the control variables are as expected
in all models.
After examining the effect of institutional ownership stability on dividend, repurchase and
total payout. The Tobit regression conducts for investigating the impact of institutional
ownership stability on the amount of dividend. Also, the OLS regression use to examine the
impact of institutional ownership stability on the dividend yield, repurchase and total payout.
The results of Tobit and OLS regression report in table 5. Model (1)-(3) present the results for
Tobit regression. The dependent variable is dividend payout ratio. The coefficient for StdI is
positive and significant at 1% level in model (1) and (3). It means that firms with higher (lower)
institutional ownership stability have lower (higher) dividend payout ratio. The coefficient for
ownership proportion is negative and significant in model (2) and (3) which means that firms
with higher ownership proportion pay fewer dividends.
Model (4)-(6) show the results of OLS regression. Regression equations are estimated initially
using pooled ordinary least squares (OLS) with white standard errors corrected for firm
clustering. Model (4) suggests that firms with higher institutional ownership proportion pay

12
fewer dividends. Model (5) suggests that firms with higher institutional ownership stability and
proportion have more repurchase activities. In terms of the magnitude of the effect, as one
standard deviation decrease in institutional ownership volatility (0.90%) is associated with an
increase in the repurchase ratio of 0.132 (0.90%*100*0.147). Also, the model suggests that the
aggregate proportion has positive and significant impact on repurchase. As shown in model (6),
the aggregate ownership proportion is positive and significant at 1% level; also institutional
ownership volatility shows a positive and significant relation with the total payout. As one
standard deviation decrease in institutional ownership volatility (0.90%) is associated with an
increase in the total payout of 0.051 (0.90%*100*0.057). The results of this table suggest that
stable institutional ownership (low StdI) is associated with fewer dividend, more repurchase ratio
and more total payout.
Based on the results, Institutional ownership stability can increase repurchase and total payout
but having more repurchase or total payout may also encourage institutional owners to hold onto
the stock over a longer period. To account for the endogeneity problem I estimate GMM
regression.
Table 6 shows the estimation results of GMM. In both models the coefficient of StdI is
negative and significant at 5% level. It means institutional ownership stability has a positive and
significant relationship with repurchase and total payout. So, GMM estimation results show that
the firms hold by more stable institutional owners have more repurchase and total payout and
there is not any endogeneity between institutional ownership stability and repurchase or total
payout. The P-value of Hansen-Sargan for both models show that the instruments as a group are
exogenous and the model is valid. AR (1) autocorrelation is significant which is expected but the
AR (2) shows that there isn’t any correlation between second differences.

13
6. Conclusion
This paper examines the effects of institutional ownership stability on payout policy of the
firms. The evidence shows that there is a positive and significant link between the institutional
ownership stability and repurchase activities. Also, institutional ownership stability has positive
impact on total payout. These results are consistent with two theories. As adverse selection
theory suggests firms hold by more stable institutional owners would have more repurchase
activities. Based on the substitution theory firms hold by more stable institutional owners leads
to a higher total payout going toward repurchases and a lower total payout going toward
dividends. As the results suggest institutional ownership stability lead to pay fewer dividend and
more repurchase by firms. Also, I find that firms hold by more stable institutional owners pay
fewer dividends. This finding is not consistent with agency theory but it’s consistent with
substitution theory. The results of this study provide evidence that institutional ownership
stability is engage in corporate payout policy.

14
REFRENCES
Arellano, Manuel, and Stephen Bond, 1991, Some Tests of Specification for Panel Data: Monte Carlo
Evidence and an Application to Employment Equations, Review of Economic Studies 58, 277-297.
E Boehmer, EK Kelley, 2009, Institutional investors and the informational efficiency of prices, Review of
Financial Studies 22 (9), 3563-3594
Brickley, J., Lease, R., and C. Smith, 1988, "Ownership Structure and Votingon Antitakeover
Amendments,"Journal of Financial Economics 20, 267-292.
Bushee (1998), The Influence of Institutional Investors on Myopic R&D Investment Behavior, Accounting
Review, 73, 19 - 45.
Bennet, James A., Richard W. Sias, and Laura T. Starks, 2003, Greener Pastures and the Impact of
Dynamic Institutional Preferences, The Review of Financial Studies 16,1203-1238.
Brennan, Michael J., and Anjan V. Thakor, 1990, Shareholder preferences and dividend policy, Journal of
Finance 45, 993-1018.
Carleton, W., Nelson, J., and M. Weisbach, 1998, "The Influence of Institutions on Corporate Governance
through Private Negotiations: Evidence from TIAA-CREF," Journal of Finance 53, 1335-1362.
Chen, X., Harford, J., Li, K., 2007. Monitoring: Which institutions matter? Journal of Financial Economics
86, 279-305
Cherkes, M., Sagi, J.S., Stanton, R. 2007. A liquidity-based theory of closed-end funds. The Review of
Financial Studies
Del Guercio, 1996. The distorting Effect of the Prudent-Man Laws on institutional Equity Investment.
Journal of Financial Economics, 40, 31 - 62.
Eckbo, B.E., Verma, S., 1994. Managerial share ownership, voting power, and cash dividend policy.
Journal of Corporate Finance 1, 33– 62.
Elyasiani, E., and J. J. Jia, 2008, Institutional Ownership Stability and BHC Performance, Journal of
Banking and Finance, 32 (9): 1767-1781.
Elyasiani, E., J. J. Jia, and C. X. Mao (2010). Institutional ownership stability and the cost of debt. Journal
of Financial Markets 13(4), 475–500.
Gaspar, J. M., Massa, M., Matos, P., 2005. Shareholder investment horizons and the market for corporate
control. Journal of Financial Economics 76, 135-165.
Gillan, S., Starks, L., 2000. Corporate governance proposals and shareholder activism: The role of
institutional investors. Journal of Financial Economics 57, 275–305.
Grinstein, Y., & Michaely, R. (2005). Institutional holdings and payout policy. Journal of Finance, 60,
1389-1426.
Hartzell, J.C., Starks, L.T., 2003. Institutional investors and executive compensation. Journal of Finance 58
(6), 2351–2375.
Jensen, M. (1986). Agency cost of free cash flow, corporate finance and takeovers. American Economic
Review Papers and Proceedings, 76, pp. 323-329.
McConnell, J.J., Servaes, H., 1990. Additional evidence on equity ownership and corporate value. Journal
of Financial Economics 27, 595–612.
Moh’d, M.A., Perry, L.G., Rimbey, J.N., 1995. An investigation of the dynamic association between
agency theory and dividend policy. Financial Review 30 (2), 367–385.
Short, H, Zhang, H and Keasey, K. 2002. The link between dividend policy and institutional ownership.
Journal of Corporate Financ.8: 105–122.
Smith, M., 1996. Shareholder activism by institutional investors: Evidence from CalPERS. Journal of
Finance 51,227–252.
Tonello, M and Rabimov, S. 2010. The 2010 institutional investment report. The conference board.

15
Woidtke, T, 2002, "Agents Watching Agents? Evidence from Pension Fund Ownership and Firm Value,
“Journal of Financial Economics 63, 99-131.
Yan, X. and Z. Zhang, 2009. Institutional investors and equity returns: are short-term institutions better
informed? Review of Financial Studies 22(2), 893-924.

16
Table 1- Descriptive statistics of the sample
This table reports summary of statistics for our sample during 1980 – 2013. Panel A-C present summary statistics on payout-specific, institutional ownership
and control variables, respectively. Dividend yield is measured as dividend divided by price per share (Compustat item Dividends per Share - Ex-Date – Calendar
divided by Price Close – Annual). Payout ratio is measured as the total dividend to net income (Compustat item Dividends per Share - Ex-Date* common shares
outstanding divided by net income). Repurchase is calculated as repurchase divided by total assets. (Compustat item Purchase of Common and Preferred Stock
divided by Assets-Total).Total payout is measured as the sum of dividend and repurchase divided by total assets. (Compustat item Dividends per Share - Ex-Date
multiplied by common shares outstanding divided plus Purchase of Common and Preferred Stock divided by Assets-Total). The ownership stability measure is
calculated as the average standard deviation of shareholding proportion across all the institutional owners over a five-year period. (Present and the past four
years). Shareholding proportion is the average aggregate institutional shareholding proportion across the five-year period as defined above. Firm size is measured
as the natural log total assets (Compustat item Assets-Total). Leverage is measured as sum of long term and short term debt divided by book value of total assets.
(Compustat item Long-Term Debt – Total plus Debt in Current Liabilities – Total divided by Common/Ordinary Equity - Total ). ROA is measured as the
operating income divided by total assets. (Compustat item operating income before depreciation divided by Assets - Total). Market capitalization is measured as
the natural log of market value. (Compustat item Price Close – Annual multiplied by common shares outstanding). Market to book ratio is measured as the
market value of equity divided by book value of equity. (Compustat item Price Close – Annual divided by Book Value per Share).
Panel A. Payout-specific variables
Variable N Mean Median Std.Dev. Min 25thpercentile 75
th percentile Max
Dividend yield 81637 0.013 0 0.047 0 0 0.018 4.509
Dividend payout ratio 81637 0.169 0 0.418 -1.184 0 0.220 4.433
Repurchase 81637 0.014 0 0.057 0 0 0.006 9.585
Total Payouts 81637 0.024 0.004 0.068 0 0 0.025 9.585
Panel B. Institutional ownership variables
Variable N Mean Median Std.Dev. Min 25thpercentile 75
th percentile Max
StdI (%) 81637 0.67 0.49 0.90 0.00 0.24 0.84 45.76
Shareholding proportion (%) 81637 22.03 15.06 20.76 0.00 5.60 32.92 99.83
Panel C. Control variables
Variable N Mean Median Std.Dev. Min 25thpercentile 75
th percentile Max
ROA 81637 0.096 0.113 0.141 -1.302 0.049 0.170 0.417
Firm size 81637 5.452 5.336 1.878 0.471 4.049 6.777 11.040
Leverage 81637 0.208 0.177 0.187 0 0.036 0.332 0.918
Market capitalization 81637 5.169 5.106 1.922 0.133 3.746 6.581 9.662
Market-to-book ratio 81637 2.420 1.725 2.332 0.019 1.084 2.853 20.902

17
Table 2 – Repurchase and total payout Sorted by Institutional Ownership Proportion and Stability.
This table reports the average of repurchase and total payout of 25 portfolios. I classify the sample into quintiles based on the aggregate institutional
ownership proportion in each year. Then I divide each quintiles into five groups based on the institutional ownership stability. So, each cell indicates the average
of repurchase/total payout for each portfolio. The last two columns/rows present the average repurchase/total payout difference between the highest and lowest
proportion portfolio in the same StdI or proportion quintile and T-statistics. The symbols * and *** indicates statistical significance ate the 10% and 1% level,
respectively.
Panel A. Repurchase
Prop
Low
Prop
High
0 1 2 3 4 H-L T-statistics
StdI Low 0 0.011 0.016 0.024 0.032 0.040 0.029 -15.33***
1 0.009 0.010 0.014 0.023 0.039 0.030 -16.26***
2 0.008 0.010 0.012 0.021 0.029 0.021 -16.88***
3 0.008 0.009 0.013 0.015 0.026 0.017 -6.58***
StdI High 4 0.008 0.008 0.009 0.011 0.014 0.006 -3.83***
H-L -0.003 -0.008 -0.014 -0.021 -0.026
T-statistics 1.9* 7.73*** 8.07*** 11.2*** 13.31***
Panel B. Total Payout
Prop
Low
Prop
High
0 1 2 3 4 H-L T-statistics
StdI Low 0 0.023 0.035 0.047 0.051 0.059 0.036 -16.65***
1 0.023 0.032 0.031 0.038 0.049 0.026 -14.17***
2 0.019 0.025 0.026 0.031 0.039 0.019 -12.53***
3 0.013 0.018 0.024 0.024 0.032 0.019 -6.24***
StdI High 4 0.016 0.013 0.019 0.020 0.027 0.011 -8.25***
H-L -0.007 -0.022 -0.028 -0.031 -0.032
T-statistics 2.71*** 10.21*** 7.79*** 15.07*** 15.44***
18
Table 3 - Probit analysis of firms decision whether to pay dividends, repurchase and total payout
This table reports probit regression based on 81637 firm-year observations from 1980 to 2013. For the first three models the dependent variable is a dummy
variable which is 1 if firm pay dividend, otherwise zero. For model 4, 5 and 6 the dependent variable is a dummy variable which is 1 if firm has repurchase
activities, otherwise zero and for the last three models the dependent variable is a dummy variable which is 1 if firm has any total payout, otherwise zero. The
ownership stability measure is calculated as the average standard deviation of shareholding proportion across all the institutional owners over a five-year period.
(Present and the past four years). Shareholding proportion is the average aggregate institutional shareholding proportion across the five-year period as defined
above. The numbers reported in parentheses are standard errors. . *, **and *** indicates statistical significance at the 10%, 5% and 1%, respectively.
Variable (1) (2) (3) (4) (5) (6) (7) (8) (9)
ROA 3.181*** 3.192*** 3.196*** 1.130*** 1.145*** 1.125*** 1.435*** 1.444*** 1.435***
(0.072) (0.072) (0.073) (0.042) (0.042) (0.042) (0.043) (0.043) (0.043)
Firm size 0.381*** 0.402*** 0.403*** 0.108*** 0.088*** 0.075*** 0.260*** 0.258*** 0.253***
(0.005) (0.006) (0.006) (0.004) (0.004) (0.005) (0.005) (0.005) (0.005)
Leverage -1.305*** -1.339*** -1.341*** -0.551*** -0.551*** -0.525*** -1.108*** -1.114*** -1.102***
(0.038) (0.038) (0.038) (0.031) (0.031) (0.031) (0.032) (0.032) (0.033)
Market-to-book
ratio -0.047*** -0.048*** -0.048*** -0.033*** -0.031*** -0.035*** -0.040*** -0.039*** -0.040***
(0.003) (0.003) (0.003) (0.002) (0.002) (0.002) (0.002) (0.002) (0.002)
Market
capitalization 0.037*** 0.013*** 0.022*** 0.002*** 0.047*** 0.066*** 0.022*** 0.092*** 0.094***
(0.000) (0.000) (0.000) (0.000) (0.000) (0.000) (0.000) (0.000) (0.000)
StdI -1.692*** - 0.706 -6.581*** - -9.250*** -3.742*** - -4.243***
(0.645) - (0.691) (0.586) - (0.624) (0.577) - (0.594)
Prop
-0.458*** -0.468***
0.408*** 0.544***
0.052 0.118***
(0.038) (0.039)
(0.032) (0.033)
(0.035) (0.036)
Year dummies yes yes yes yes yes yes yes yes yes
Industry dummies yes yes yes yes yes yes yes yes yes
Total obs. 81123 81123 81123 81573 81573 81573 81332 81132 81132
Pseudo R2 38.83% 39.10% 39.10% 9.05% 9.08% 9.30% 22.39% 22.35% 22.40%

19
Table 4 – Tobit and OLS analysis
This table reports tobit and OLS regression based on 81637 firm-year observations from 1980 to 2013. For
model (1)-(3) the dependent variable is dividend payout ratio. For model (4), (5) and (6) the dependent variables are
dividend yield, repurchase and total payout, respectively. The ownership stability measure is calculated as the
average standard deviation of shareholding proportion across all the institutional owners over a five-year period.
(Present and the past four years). Shareholding proportion is the average aggregate institutional shareholding
proportion across the five-year period as defined above. The numbers reported in parentheses are standard errors. *,
**and *** indicates statistical significance at the 10%, 5% and 1%, respectively.
Variable (1) (2) (3) (4) (5) (6)
ROA 2.008*** 1.991*** 2.005*** 0.007*** 0.035*** 0.066***
-0.045 (0.045) (0.045) (0.001) (0.004) (0.004)
Firm size 0.155*** 0.163*** 0.166*** 0.004*** -0.002*** -0.001***
-0.003 (0.003) (0.003) (0.000) (0.000) (0.000)
Leverage -0.637*** -0.638*** -0.644*** 0.002 -0.015*** -0.026***
-0.022 (0.022) (0.022) (0.001) (0.001) (0.002)
Market-to-book ratio -0.022*** -0.023*** -0.022*** -0.001*** 0.001*** 0.002***
-0.002 (0.002) (0.002) (0.000) (0.000) (0.000)
Market capitalization 0.034** 0.069* 0.004* -0.053 0.045*** 0.063***
0 (0.000) (0.000) (0.000) (0.000) (0.000)
StdI 1.658*** - 2.365*** -0.012 -0.147*** -0.057***
(0.334) - (0.342) (0.020) (0.026) (0.043)
Prop
-0.156*** -0.191*** -0.017*** 0.027*** 0.018***
(0.021) (0.022) (0.001) (0.002) (0.002)
Year dummies yes yes yes yes yes yes
Industry dummies yes yes yes yes yes yes
Total obs. 81637 81637 81637 81637 81637 81637
Pseudo R2 24.53% 24.56% 24.59% 4.57% 5.60% 6.63%

20
Table 5 – GMM analysis
This table reports the results of GMM from 1980 to 2013. Dependent variables are repurchase in model (1) and
total payout in model (2). The ownership stability measure is calculated as the average standard deviation of
shareholding proportion across all the institutional owners over a five-year period. (Present and the past four years).
The numbers reported in parentheses are standard errors. *, ** and *** indicates statistical significance at the 10%,
5% and 1%, respectively.
Variable (1) (2)
ROA 0.032***
0.051***
(0.005)
(0.006)
Firm size -0.031**
-0.035**
(0.001)
(0.002)
Leverage 0.071***
0.065***
(0.005)
(0.006)
Market-to-book ratio 0.022
0.028
(0.008)
(0.066)
Market capitalization 0.799
0.645
(0.006)
(0.004)
StdI -0.743**
-0.947**
(0.291)
(0.273)
N 48813
48813
Number of firms 8057
8057
Hansen-Sargan 0.755
0.859
AR (1) 0
0
AR (2) 0.112 0.258


