Institutional Investors, Corporate Governance, and Firm Value
32
387 Institutional Investors, Corporate Governance, and Firm Value K.J. Martijn Cremers and Simone M. Sepe ** ABSTRACT In the corporate governance debate, the short-term versus long- term contention has grown into perhaps today’s most controversial topic. In this debate, descriptions of institutional investors tend to present a dichotomic nature. These investors are alternatively portrayed as homogenously short-termist or as consistent “forces for good,” focused on targeting underperforming companies. This Article moves beyond this dichotomy. It shows empirically that aggregate institutional investor behavior presents nuances that depend on a variety of factors, including individual firm characteristics, institutional ownership levels, and institutional propensity toward activism. CONTENTS INTRODUCTION .............................................................................388 THE SHORT-TERM VERSUS LONG-TERM DEBATE .................392 A. Short-Termism: Arguments and Counterarguments .......393 B. The Legal Stakes..............................................................396 INSTITUTIONAL INVESTOR BEHAVIOR: AN OVERVIEW..........398 A. Data Description .............................................................399 B. Time Trends in Institutional Ownership .........................401 1. Institutional Ownership Levels ..................................401 2. Institutional Duration .................................................402 3. Institutional Turnover .................................................404 4. Institutional Active Investing .....................................405 Professor of Finance, Mendoza College of Business, University of Notre Dame. ** Professor of Law and Finance, James E. Rogers College of Law, University of Arizona; and Insti- tute for Advanced Study in Toulouse—Fondation Jean-Jacques Laffont—Toulouse School of Eco- nomics. Available for correspondence at: [email protected].
Transcript of Institutional Investors, Corporate Governance, and Firm Value
387
Institutional Investors, Corporate Governance, and Firm Value
K.J. Martijn Cremers and Simone M. Sepe**
ABSTRACT
In the corporate governance debate, the short-term versus long-term contention has grown into perhaps today’s most controversial topic. In this debate, descriptions of institutional investors tend to present a dichotomic nature. These investors are alternatively portrayed as homogenously short-termist or as consistent “forces for good,” focused on targeting underperforming companies. This Article moves beyond this dichotomy. It shows empirically that aggregate institutional investor behavior presents nuances that depend on a variety of factors, including individual firm characteristics, institutional ownership levels, and institutional propensity toward activism.
CONTENTS
INTRODUCTION .............................................................................388
THE SHORT-TERM VERSUS LONG-TERM DEBATE .................392 A. Short-Termism: Arguments and Counterarguments .......393 B. The Legal Stakes..............................................................396
INSTITUTIONAL INVESTOR BEHAVIOR: AN OVERVIEW ..........398 A. Data Description .............................................................399 B. Time Trends in Institutional Ownership .........................401
1. Institutional Ownership Levels ..................................401 2. Institutional Duration .................................................402 3. Institutional Turnover .................................................404 4. Institutional Active Investing .....................................405
Professor of Finance, Mendoza College of Business, University of Notre Dame. ** Professor of Law and Finance, James E. Rogers College of Law, University of Arizona; and Insti-tute for Advanced Study in Toulouse—Fondation Jean-Jacques Laffont—Toulouse School of Eco-nomics. Available for correspondence at: [email protected].
388 Seattle University Law Review [Vol. 41:387
EXPLAINING INSTITUTIONAL INVESTMENT HORIZONS AND
ACTIVISM ......................................................................................406 A. Explaining Institutional Duration, Turnover, and
Activism ............................................................................407 B. Individual Firm Characteristics ......................................409
INSTITUTIONAL INVESTORS AND FIRM VALUE ......................413
CONCLUDING REMARKS ...............................................................417
INTRODUCTION
The rise of empowered shareholders has introduced a novel, inter-temporal dimension in the fundamental corporate law debate over the appropriate division of authority between a corporation’s board of directors and its shareholders. Among empowered shareholders, institutional investors in particular have catalyzed the attention of corporate law scholars since the early 1990s. Back then, commentators began to report a steady increase in institutional investor ownership,1 with many suggesting that this development would be the dawn of a new era of shareholder empowerment.2 While the process took longer than initially thought, and involved regulatory developments in addition to market changes, that era is now upon us. Shareholders, and especially large institutional investors, stand today as empowered as ever, having gained the ability to influence a firm’s business and investment policy in a substantial manner.3
Sharp disagreement, however, occurs when it comes to assessing the consequences of this change in the fact pattern. Defenders of the traditional board-centric model of the corporation argue that shareholder empowerment exacerbates short-termist issues, incentivizing companies to undertake courses of action that are profitable in the short term but value-decreasing in the long term.4 On the contrary, shareholder
1. See Bernard S. Black, Shareholder Passivity Reexamined, 89 MICH. L. REV. 520, 570 (1990). 2. See Bernard S. Black, Agents Watching Agents: The Promise of Institutional Investor Voice, 39 UCLA L. REV. 811, 827–31 (1991). See generally Ronald J. Gilson & Reinier Kraakman, Reinventing the Outside Director: An Agenda for Institutional Investors, 43 STAN. L. REV. 863 (1991). 3. See Stephen M. Bainbridge, Preserving Director Primacy by Managing Shareholder Interventions, in RESEARCH HANDBOOK ON SHAREHOLDER POWER 231 (Jennifer G. Hill & Randall S. Thomas eds., 2015); William W. Bratton & Michael L. Wachter, The Case Against Shareholder Empowerment, 158 U. PA. L. REV. 655, 662 (2010). 4. See Stephen M. Bainbridge, Response, Director Primacy and Shareholder Disempowerment, 119 HARV. L. REV. 1735, 1736–44 (2006); Martin Lipton, Takeover Bids in the Target’s Boardroom, 35 BUS. L. 101, 104 (1979); Michael E. Porter, Capital Choices: Changing the Way America Invests in Industry, J. APPLIED CORP. FIN., Summer 1992, at 4.
2018] Investors, Governance, and Firm Value 389
advocates praise the rise of shareholder empowerment as the long-awaited correction to the moral hazard problem arising out of the separation of ownership from control, while downplaying short-termism concerns as overstated.5
This Article examines the role played by institutional investors—which today comprise banks, insurance companies, mutual funds, investment advisors, brokers, pension funds, endowments, and hedge funds—within the short-term versus long-term debate in corporate governance. Current descriptions of institutional investor behavior tend to present a dichotomic nature, with such investors being portrayed either as homogenously short-termist or as consistent “forces for good,” focused on targeting underperforming companies. Our aim is to move beyond this dichotomy, using empirical tools to provide a more exact taxonomy of institutional investor behavior along the two crucial dimensions of institutional investors’ investment horizons and activism. Further, while our work relates to recent empirical studies examining hedge fund behavior,6 it essentially focuses on aggregate institutional behavior.
We begin our empirical investigation by examining the time trends in institutional ownership’s levels, holding periods, turnover, and activism over the past thirty-five years (from 1980 to 2015). Somewhat surprisingly, we find that while institutional investor ownership has significantly increased throughout the years, institutional investors as a whole seem to have grown more patient and less active. A possible explanation for these results is the concurrent rise of passive investment approaches, including index funds and exchange-traded funds.
Our next step is to examine what factors can explain cross-sectional differences in institutional investors’ investment horizons and activism, as the empirical finding that institutional investors have become more patient and less active runs contrary to common assumptions about institutional ownership. Our findings indicate that among our independent variables, time-invariant firm characteristics captured by firm-fixed effects explain most of the cross-sectional variation in institutional holding periods and activism (i.e., our dependent variables).
5. See Lucian A. Bebchuk, The Myth that Insulating Boards Serves Long-Term Value, 113 COLUM. L. REV. 1637, 1651 (2013) [hereinafter Bebchuk, The Myth]; Mark J. Roe, Corporate Short-Termism--In the Boardroom and in the Courtroom, 68 BUS. L. 977, 1004 (2013). 6. See Lucian A. Bebchuk et al., The Long-Term Effects of Hedge Fund Activism, 115 COLUM. L. REV. 1085, 1106–14 (2015) [hereinafter Bebchuck et al., Long-Term Effects] (documenting a positive effect of hedge fund activism on firm value in both the short term and the long term). But see K.J. Martijn Cremers et al., Hedge Fund Activism and Long-Term Firm Value (Dec. 14, 2015) (unpublished manuscript), https://papers.ssrn.com/sol3/papers.cfm?abstract_id=2693231 (documenting that the positive short-term effect of hedge funds on firm value is reversed in the long term).
390 Seattle University Law Review [Vol. 41:387
We next focus on the individual firm characteristics included in our set, obtaining the four following results. First, higher firm value (as proxied by Tobin’s Q7) predicts shorter institutional holding periods and correspondingly higher stock turnover while also being correlated with less activism. This seemingly indicates that as firm value increases, institutional investors trade stock more frequently, perhaps to exploit profit opportunities.
Second, we find that, while the adoption of a staggered board8 does not impact any of our measures of institutional investor behavior, poison pills9 predict increased short-termism because their adoption is associated with shorter institutional holding periods and higher trading frequency. Consistent with results we obtained in prior research,10 this difference between staggered boards and poison pills could be explained by the different nature of these defensive measures.
The adoption of a staggered board requires shareholder approval and therefore reflects agreement between the board and shareholders. Boards can instead unilaterally adopt the poison pill without any dialectical confrontation with the shareholders. Based on this fundamental distinction, we have argued elsewhere that staggered boards serve a positive governance function because the agreed-upon limits they impose on the ability of shareholders to interfere with board decision-making help address informational inefficiencies and commit shareholders to the creation of long-term firm value.11 Conversely, because of their unilateral nature, poison pills are more likely to be motivated by managerial moral hazard. This could explain why institutional investors react negatively to the adoption of a poison pill but remain indifferent to the adoption of a staggered board.12
Third, having more outstanding equity owned by active institutional investors considerably reduces the institutional investment horizon—that
7. Tobin’s Q is the ratio of the market value of assets to the book value of assets. See Eugene F. Fama & Kenneth R. French, Testing Trade-Off and Pecking Order Predictions About Dividends and Debt, 15 REV. FIN. STUD. 1, 8 (2002). 8. Unlike in a unitary board, in a staggered board, directors are grouped into different classes, with each class of directors standing for reelection in successive years. Typically, staggered boards have three classes of directors—the maximum number of classes most states permit—with directors in each class being elected to three-year terms. See K.J. Martijn Cremers & Simone M. Sepe, The Shareholder Value of Empowered Boards, 68 STAN. L. REV. 67, 77 (2016). 9. A poison pill consists of stock purchase rights that are granted to existing shareholders in the event a corporate raider accumulates more than a certain threshold of outstanding stock and entitle the existing shareholders (but not the raider) to acquire newly issued stock at a substantial discount from the market price. 10. K.J. Martijn Cremers, Saura Masconale & Simone M. Sepe, Commitment and Entrenchment in Corporate Governance, 110 NW. U. L. REV. 727, 732, 761–71 (2016) (showing that defensive measures benefit shareholders as long as such measures provide for shareholder approval). 11. See id. at 768–70; see also Cremers & Sepe, supra note 8, at 123–26. 12. See Cremers, Masconale & Sepe, supra note 10.
2018] Investors, Governance, and Firm Value 391
is, it is associated with shorter holding periods and increased stock turnover. Further, higher institutional ownership levels are associated with both shorter holding periods and greater activism. These results seem to support the claims of board advocates that increased shareholder activism is likely to exacerbate short-termist concerns. Indeed, active investors would enjoy greater bargaining power to influence a firm’s investment policy horizons, and this power would increase with the level of outstanding stock held by institutional investors.
Fourth, firm age is associated with longer holding periods, less turnover, and less activism, suggesting that the degree of informational asymmetry affecting a specific corporation plays an important role in predicting institutional investor behavior. Investors in older firms are likely to gather more private information about these firms over time. This could explain why institutional investors tend to have longer investment horizons in such firms, as well as interfere less with management. Alternatively, it could be that the longer a firm exists, the more likely it is that the firm is included in some benchmark index, which would explain the presence of more patient investors and less active owners.
Next, to examine the efficiency questions raised by aggregate institutional investor behavior, we estimate Tobin’s Q regressions on year- and firm-fixed effects, proxies for institutional investor holding periods and activism, staggered boards, poison pills, and a set of standard controls. Consistent again with the results we documented in prior studies,13 we find that the adoption of a staggered board is associated with increased firm value. Most importantly, for the present discussion, we also find that such a positive effect of staggered boards is considerably stronger in firms where institutional investors exhibit longer investment horizons. This finding supports the view that a main mechanism through which the staggered board adds value is by ensuring that investors give managers sufficient time to develop latent assets (i.e., long-term strategies), rather than evaluating management performance after relatively brief periods of time.
Conversely, the adoption of a poison pill continues to be negatively associated with firm value, even when institutional investors are more patient, adding to our inference that the unilateral nature of poison pills make this defense more likely to be a reflection of managerial moral hazard.
13. See K.J. Martijn Cremers, Lubomir Litov & Simone M. Sepe, Staggered Boards and Long-Term Firm Value, Revisited, 126 J. FIN. ECON. 422 (2017); Cremers & Sepe, supra note 8, at 100–08 (producing novel empirical evidence that challenges prior cross-sectional studies on the negative impact of staggered boards on firm value and showing that staggered boards are positively associated with firm value in the long term).
392 Seattle University Law Review [Vol. 41:387
Finally, we find that when investors have longer investment horizons but are more active, the positive effect of the staggered board on firm value decreases. This finding is consistent with our theory that the value added through the adoption of a staggered board is the commitment of both boards and shareholders to long-term value creation. A staggered board serves this function by allowing the board to pursue long-term investments in an environment conducive to stable relationships with both shareholders and stakeholders. However, when a substantial fraction of the firm’s institutional investors are active and thus more likely to pursue short-term changes, this challenges the conditions that are required for the staggered board to serve its commitment function.
Overall, our study generates insights on the short-term versus long-term debate in corporate governance, showing that far from the debate’s polarized rendering of homogenously “good” or “bad” institutional investors, aggregate institutional investor behavior presents nuances that depend on a variety of factors, including individual firm characteristics, institutional ownership levels, and institutional propensity toward activism.
This Article continues as follows. Part I frames the terms of the short-term and long-term debate in corporate governance, reviewing competing theoretical positions and both their economic underpinnings and policy implications. Part II begins our empirical investigation of institutional investor behavior, examining time trends in institutional ownership levels, holding periods, turnover, and activism. Part III investigates the factors that predict institutional investors’ shorter or longer holding periods and more or less activism. Part IV examines the value implications of institutional investor behavior. Part V offers some conclusive remarks.
THE SHORT-TERM VERSUS LONG-TERM DEBATE
Inter-temporal issues have captured scholarly attention since the writings of philosophers David Hume and Jeremy Bentham.14 In the corporate context, such issues first emerged during the takeover era of the 1980s, when rational (as opposed to behavioral) myopia studies made their appearance in financial economics theory. Departing from mainstream neoclassical models, rational myopia studies suggested that an excessive focus on stock market results, combined with informational asymmetries,
14. See Kevin J. Laverty, Economic “Short-Termism”: The Debate, the Unresolved Issues, and the Implications for Management Practice and Research, 21 ACAD. MGMT. REV. 825, 828 (1996).
2018] Investors, Governance, and Firm Value 393
could induce managers to privilege short-term gains over long-term returns, with short-termism potentially threatening economic decline.15
Concerns about inter-temporal choices then faded away during the bull market of the 1990s and early 2000s, only to move to the center stage of corporate governance discussions in the wake of the financial crisis of 2008. On the one hand, the near collapse of the U.S. financial system and the rise of empowered shareholders have revived claims that short-termism in response to market and shareholder pressure is a first-order governance problem that demands regulatory correction.16 On the other, shareholder advocates argue that short-termism is “insufficiently strong, empirically and theoretically, to affect corporate rulemaking,” defending the classic view that market prices are fairly information-efficient.17
The short-term versus long-term contention has grown today into perhaps the most controversial debate in corporate governance. This Part provides the background necessary for understanding the context and importance of this debate, clarifying the different economic approaches to short-termism in the corporate context, as well as the debate’s wide-ranging policy implications.
A. Short-Termism: Arguments and Counterarguments
1. Economic Literature
Rational myopia provides the classical economic argument
underpinning claims of short-termism in the corporate context. Two variations of this argument exist: “managerial myopia,” where short-termism is a form of management opportunism, and “market myopia,” where short-termism is a consequence of asset pricing inefficiencies. Informational asymmetry, however, rests at the core of both myopia models.
15. See, e.g., M.P. Narayanan, Managerial Incentives for Short-Term Results, 40 J. FIN. 1469, 1470 (1985) (“By selecting a project that yields short-term profits, the manager can expect to improve the perception about her ability . . . .”); Jeremy C. Stein, Efficient Capital Markets, Inefficient Firms: A Model of Myopic Corporate Behavior, 104 Q. J. ECON. 655, 667 (1989) [hereinafter Stein, Efficient Capital Markets] (modeling suboptimal investments where managers maximize a weighted average of near-term stock prices and long-run value); Jeremy C. Stein, Takeover Threats and Managerial Myopia, 96 J. POL. ECON. 61, 63–67 (1988) [hereinafter Stein, Managerial Myopia] (showing formally that managers threatened by a takeover will sell underpriced assets). 16. See, e.g., Jack B. Jacobs, “Patient Capital”: Can Delaware Corporate Law Help Revive It?, 68 WASH. & LEE L. REV. 1645 (2011); Leo E. Strine, Jr., Can We Do Better by Ordinary Investors? A Pragmatic Reaction to the Dueling Ideological Mythologists of Corporate Law, 114 COLUM. L. REV. 449, 450–51 (2014). 17. See Roe, supra note 5, at 1004. See generally Bebchuk, The Myth, supra note 5.
394 Seattle University Law Review [Vol. 41:387
Models of managerial myopia explore the distorted incentives of privately informed managers for inter-temporal choices that are individually optimal, but detrimental to shareholder and firm value. For example, managers may prefer projects that deliver short-term returns at the expense of long-term firm profitability because short-term returns are viewed as helpful to enhance the manager’s reputation,18 signal her superior ability in the labor market,19 or address issues of adverse selection.20
Conversely, models of stock market myopia focus on the short-termist distortions that arise from the informational asymmetry between managers and investors, which may cause market prices to fail to fully incorporate the value of long-term projects (or what Brennan refers to as “latent assets”21) in the short-term horizon.22 As a result, to avoid shareholder retribution (whether through managerial removal or a change in control) for what may appear as short-term underperformance, managers may trade off long-term cash flows for short-term stock price gains.23
In practice, however, managerial myopia models and stock market myopia models tend to be complements rather than substitutes, with stock market’s short-termism reinforcing managerial short-termism and vice versa. For this reason, this Article conflates these alternative myopia characterizations into the unifying category of “myopia studies.”
Unlike rational myopia scholars, defendants of the traditionally dominant view that market prices are fairly information-efficient argue that short-termist concerns have no, or at best little, room in corporate governance.24 Under this view, competitive markets optimize the trade-off between short-term performance and long-term investments,25 as stock prices are “generally set at levels representing the best estimate of long-term share value that can be derived from all available public information.”26 This means that any course of action that is profitable in
18. See, e.g., Bengt Holmstrom & Joan Ricart I Costa, Managerial Incentives and Capital Management, 101 Q. J. ECON. 835 (1986); Narayanan, supra note 15, at 1470. 19. See Tim S. Campbell & Anthony M. Marino, Myopic Investment Decisions and Competitive Labor Markets, 35 INT’L ECON. REV. 855 (1994). 20. Simone M. Sepe, Board and Shareholder Power, Revisited, 101 MINN. L. REV. 1377, 1395–1419 (2017) (examining the adverse selection issues arising in the shareholder–manager relationship). 21. See Michael J. Brennan, Latent Assets, 45 J. FIN. 709 (1990). 22. See generally Kenneth A. Froot et al., Herd on the Street: Informational Inefficiencies in a Market with Short-Term Speculation, 47 J. FIN. 1461 (1992); Stewart C. Myers & Nicholas S. Majluf, Corporate Financing and Investment Decisions When Firms Have Information that Investors Do Not Have, 13 J. FIN. ECON. 187 (1984). 23. See, e.g., Stein, Efficient Capital Markets, supra note 15, at 667. 24. See, e.g., Roe, supra note 5, at 1004. 25. See Michael C. Jensen, The Takeover Controversy: Analysis and Evidence, 4 MIDLAND
CORP. FIN. J., Summer 1986, at 6. 26. Bebchuk, The Myth, supra note 5, at 1661–62.
2018] Investors, Governance, and Firm Value 395
the long term will also tend to be profitable in the short term. Correspondently, any course of action that is bad in the long term can be expected to have similar negative effects in the short term.
Two basic policy implications follow from these assumptions. First, maximizing today’s stock price is the best means to maximize a firm’s long-term value. Second, optimal inter-temporal choices are a condition for maximizing stock price. Therefore, when we observe, for example, a failure to invest in long-term projects, this choice should not be taken as a proxy of underinvestment in the long term, but rather as a value-maximizing decision that reflects a lack of good long-term investment opportunities.
2. Law & Economics Literature
In the law and economics literature, the dominant explanation for short-termism focuses on liquidity needs rather than informational asymmetry. Under this explanation, short-termism results from the risk that “impatient” shareholders with short-term liquidity needs—and, therefore, a tendency to discount future gains and focus on short-term performance—might pressure companies to undertake investments that are lucrative in the short term, but value decreasing in the long run.27
Although this explanation for short-termism has points in common with models of stock market myopia, it is important to emphasize that those models conceive of short-termism as a pervasive problem that potentially affects all shareholders. In contrast, the “impatient capital” explanation characterizes short-termist preferences as an issue affecting only a subset of investors. In particular, scholars have focused on institutional investors, as they have high turnover rates (to avoid holding large, undiversified blocks of stock28) and are under constant pressure to beat competitors.29 More recently, among institutional investors, the
27. It appears that the first commentator to raise short-termism concerns was Martin Lipton. See Martin Lipton, Takeover Bids in the Target’s Boardroom, 35 BUS. L. 101, 104–05 (1979); see also William T. Allen & Leo E. Strine, Jr., When the Existing Economic Order Deserves a Champion: The Enduring Relevance of Martin Lipton’s Vision of the Corporate Law, 60 BUS. L. 1383, 1383–84 (2005) (attributing to Lipton the view that traded securities are frequently mispriced). In more recent times, short-termism concerns have been raised by academics, organizational leaders, business columnists, corporate lawyers, and business organizations. See Bebchuk, The Myth, supra note 5, at 1639–40 nn.2–6, 7–11 (collecting the most important contributions expressing short-termism concerns). 28. See S.M. Loescher, Bureaucratic Measurement, Shuttling Stock Shares, and Shortened Time Horizons: Implications for Economic Growth, 24 Q. REV. ECON. & BUS. 8, 9 (1984). 29. See Ronald J. Gilson & Jeffrey N. Gordon, The Agency Costs of Agency Capitalism: Activist Investors and the Revaluation of Governance Rights, 113 COLUM. L. REV. 863, 889–90 (2013) (describing the competitive-pressure mechanisms that affect the performance of institutional investors).
396 Seattle University Law Review [Vol. 41:387
spotlight has been on hedge funds, whose business model is commonly oriented towards short-term gains.30
In response, shareholder advocates argue that while institutional investors, including hedge funds, may occasionally raise short-termist concerns, the benefits arising from these investors’ activism and ability to efficiently exploit governance levers largely outweigh such concerns.31 For shareholder advocates, activist institutional investors are the champions of the long-dormant shareholder franchise who, as the corporation’s residual claimants, are best positioned to control the first-order problem of managerial moral hazard.32 Further, these scholars also reject the claim that activist institutional investors are at an informational disadvantage relative to boards of directors, arguing that this claim fails to take into account the increased sophistication of today’s investors. Indeed, institutional investors—and, in particular, hedge funds—would possess both the incentives and the resources to act as “governance entrepreneurs” that specialize in monitoring and providing governance and strategic inputs.33 And they could also rely on proxy advisory firms, which increasingly act as “central coordinating and information agents” to gather information regarding governance at particular firms.34
B. The Legal Stakes
The short-term versus long-term debate has wide-ranging legal implications. First and foremost, this debate has reignited discussions about the optimal allocation of power between boards and shareholders.
Critics of short-termism argue that protecting the traditional board-centric model of the corporation—by ensuring that directors are insulated from the pressure of activists—is necessary to prevent shareholders with excessive short-termist preferences from steering the corporation toward an unproductive short-term perspective.35 Enhanced board protection would be the most urgent in the current corporate scenario, where
30. See Marcel Kahan & Edward B. Rock, Hedge Funds in Corporate Governance and
Corporate Control, 155 U. PA. L. REV. 1021, 1083 (2007) (“Hedge funds come close to being the archetypal short-term investor. For some funds, holding shares for a full day represents a ‘long-term’ investment.”) (internal citation omitted).
31. See Bebchuk et al., Long-Term Effects, supra note 6, at 1089. 32. See Henry Hansmann & Reinier Kraakman, The End of History for Corporate Law, 89 GEO. L.J. 439, 449 (2001) (“[I]f the control rights granted to the firm’s equity-holders are exclusive and strong, they will have powerful incentives to maximize the value of the firm.”). 33. See Gilson & Gordon, supra note 29, at 897. 34. See Marcel Kahan & Edward Rock, Embattled CEOs, 88 TEX. L. REV. 987, 1007 (2010). 35. See, e.g., Cremers & Sepe, supra note 8, at 136–41.
2018] Investors, Governance, and Firm Value 397
shareholders have grown increasingly empowered 36 as a result of changes in both market practices and the regulatory landscape.37
On the shareholder side, scholars rebut the urgency of short-termist concerns, which they view as “complicating factors” threatening to revert us to an inefficient system of opportunistic management insulation and shareholder disempowerment.38 Further, they contend, available empirical studies are decidedly unsupportive of both claims of pervasive short-termism and the alleged benefits that management insulation would offer as a remedy to such concerns.39 In particular, contrary to what is argued by short-termist critics, the adoption of defensive measures—such as the staggered board and the poison pill—would be detrimental to shareholder and firm value, while hedge fund activism would increase firm value in both the short and long term.40
For quite some time, shareholder advocates have been rather successful in employing empirical studies to advance the idea that a shareholder-centric model of the corporation is superior to a board-centric model.41 This explains, at least in part, the developments observed in market practices in the past decade and the regulatory reforms that were introduced to promote shareholder empowerment. The changes that occurred in the use of defensive measures provide perhaps the most telling evidence to this respect.42 While directors theoretically have a veto power over decisions to destagger boards, in recent years they have increasingly acquiesced to destaggering proposals under the pressure exerted by both proxy advisors and activist shareholders.43 The use of the poison pill has
36. See Martin Lipton et al., Some Thoughts for Boards of Directors in 2016, HARV. L. SCH. F.
ON CORP. GOVERNANCE & FIN. REG. (Dec. 9, 2015), https://corpgov.law.harvard.edu/2015/12/09/ some-thoughts-for-boards-of -directors-in-2016 [https://perma.cc/9G8T-Z3JU].
37. Capital market changes have included the growth of shareholder concentration and activism, the rise of activist hedge funds, the emergence of proxy advisory firms, new universal majority voting and accompanying withhold campaigns, and the growing use and success of shareholder proposals. See Cremers & Sepe, supra note 8, at 85. Regulatory reforms have accompanied these changes, including amendments to proxy filing requirements that facilitate the use of shareholder proposals, amendments to the Delaware General Corporation Law that grant shareholders greater access to the ballot box, and most recently, the introduction of say-on-pay shareholder votes and a further expansion of the scope of shareholder proposals to effect changes in corporate election procedures. See id. at 86. 38. See Bebchuk, supra note 5, at 1651; Roe, supra note 5, at 1004–05. 39. See Bebchuk, supra note 5, at 1644, 1686–87. 40. See id. at 1652–56 (arguing that the available empirical evidence documents a negative effect of defensive measures on firm value); Bebchuk et al., supra note 6, at 1090 (documenting evidence against the alleged reversal of the positive effect of hedge fund activism in the long term).
41. See Cremers, Masconale & Sepe, supra note 10, at 744–45. 42. See Sepe, supra note 20, at 1394–95.
43. See Cremers & Sepe, supra note 8, at 98–99 (documenting that lower staggered board levels over time are largely due to increased destaggering rather than a fall in staggering events).
398 Seattle University Law Review [Vol. 41:387
similarly declined—again, largely as a result of the war waged against it by proxy advisors and activist investors.44
In more recent times, however, short-termist critics have produced new evidence that challenges prior economic studies, suggesting that, at least for some firms, board protection from shareholder and market pressure may be value increasing, while enhanced shareholder activism may have detrimental consequences.45 These studies have accordingly prompted (or in some cases, revived) reform proposals designed to re-empower boards—vis-à-vis shareholders—including proposals to grant directors terms of three or five years,46 enhance the voting rights of long-term holders,47 impose sticky default rules that embed staggered boards,48 and regulate the voting choices of money managers.49
INSTITUTIONAL INVESTOR BEHAVIOR: AN OVERVIEW
44. Stephen M. Gill et al., Structural Defenses to Shareholder Activism, 47 REV. SEC. &
COMMODITIES REG. 151, 170 n.162 (2014) (“Whereas 57% of the S&P 500 companies had poison pills at the end of 2003, only 7% had pills in place at the end of 2013.”) (internal citation omitted). 45. See, e.g., K.J. Martijn Cremers, Saura Masconale & Simone M. Sepe, Activist Hedge Funds and the Corporation, 94 WASH. U. L. REV. 261, 298–303 (2017) (documenting that hedge fund activism is not associated to reduced agency costs while it is associated to increased risk taking); William C. Johnson, Jonathan M. Karpoff & Sangho Yi, The Bonding Hypothesis of Takeover Defenses: Evidence from IPO Firms, 117 J. FIN. ECON. 307, 308 (2015) (showing that staggered boards have a positive effect on firm value in young firms with important stakeholder relationships); David F. Larcker, Gaizka Ormazabal & Daniel J. Taylor, The Market Reaction to Corporate Governance Regulation, 101 J. FIN. ECON. 431, 433 (2011) (showing a negative stock return around proposal announcements for proxy access reform, including a proposal to eliminate staggered boards, which is “inconsistent with the market viewing the elimination of staggered boards as value increasing”); Cremers & Sepe, supra note 8 (documenting a value-increasing effect of staggered boards); Cremers, Litov & Sepe, supra note 13 (producing additional empirical tests on the value-increasing effect of staggered boards); Cremers et al., supra note 6 (empirically challenging the view that hedge fund activism is beneficial in the long term). 46. William T. Allen, Jack B. Jacobs & Leo E. Strine, Jr., The Great Takeover Debate: A Mediation on Bridging the Conceptual Divide, 69 U. CHI. L. REV. 1067, 1097 (2002) (proposing a triennial board election); Martin Lipton & Steven A. Rosenblum, A New System of Corporate Governance: The Quinquennial Election of Directors, 58 U. CHI. L. REV. 187, 225–30 (1991) (proposing a quinquennial board election); Jacobs, supra note 16, at 1648, 1662 (proposing a quinquennial board election). 47. See, e.g., COLIN MAYER, FIRM COMMITMENT: WHY THE CORPORATION IS FAILING US AND
HOW TO RESTORE TRUST IN IT (2013) (proposing greater voting rights for long-term shareholders); Patrick Bolton & Frédéric Samama, L-Shares: Rewarding Long-Term Investors 3, 39 (European Corp. Governance Inst., Finance Working Paper No. 342/2013, 2013), https://papers.ssrn.com/sol3/ papers.cfm?abstract_id=2188661## (proposing option grants to shareholders made exercisable only after holder meets long-term ownership time threshold). 48. See Cremers & Sepe, supra note 8, at 137–41 (proposing a default rule favoring staggered boards that can be removed only by the board of directors). 49. See Strine, Jr., supra note 16, at 450–51 (requiring index funds and mutual funds to vote their shares to support long-term value creation).
2018] Investors, Governance, and Firm Value 399
In our prior work, we examined explanations for short-termism based on informational asymmetry, which produced theoretical and empirical results that are consistent with the view that short-termist concerns are real.50 In this Article, we proceed in another direction, focusing on impatient capital explanations and in particular, examining empirically the aggregate behavior of institutional investors. Two main reasons motivate our research. First, we maintain that short-termist explanations based on myopia studies may coexist with impatient capital explanations and in fact, overlap. Second, despite the fierce debate around the alleged virtues or vices of institutional investors in corporate governance, the law and economics literature has paid relatively little attention to the aggregate behavior of these investors so far, relying more on theoretical predictions than empirical research.
In this Part, after presenting our dataset, we begin our empirical analysis of aggregate institutional investor behavior by describing the time trends in institutional ownership over the past three decades.
A. Data Description
We use several proxies to capture the different dimensions of
aggregate institutional investor behavior. For institutional investors’ holding durations, we use three proxies: Institutional Duration, Institutional Portfolio Duration, and Institutional Turnover. All three proxies are derived from Thomson-Reuters and based on the 13F institutional holdings reports (13F forms) that institutional investors are required to file quarterly. For institutional investor activism, we use one proxy: Institutional Active Share.
The first proxy of institutional investors’ holding durations, Institutional Duration, measures how long the current institutional owners have held that particular stock in their portfolio over the last five years (averaged by each institution’s share ownership in the stock).51 Therefore, Institutional Duration only considers how long institutions have held a particular stock in their respective portfolios, irrespective of how long they hold any of the other stocks in their portfolio. This proxy captures the evidence that institutions might be short-term in some stocks and long-term in other stocks, reflecting the fact that, at many large institutions,
50. See, e.g., Cremers & Sepe, supra note 8 (producing empirical evidence that the adoption of a staggered board is beneficial to address short-termist concerns); Sepe, supra note 20 (showing theoretically that the problem of adverse selection makes short-termism a pervasive problem). 51. This measure was first introduced in a 2015 study by K.J. Martijn Cremers and Ankur Pareek. See K.J. Martijn Cremers & Ankur Pareek, Short-Term Trading and Stock Return Anomalies: Momentum, Reversal, and Share Issuance, 19 REV. FIN. 1649, 1650–51 (2015).
400 Seattle University Law Review [Vol. 41:387
different portfolio managers make investment decisions for very different reasons.
The second proxy, Institutional Portfolio Duration, measures how long the current institutional owners have held stocks in general (not just the particular stock in question) in their portfolio over the last five years (averaged by each institution’s share ownership in the stock). Institutional Portfolio Duration is first calculated at the level of each institution, based on how long the aggregate institutional portfolio has held all of its stocks over the past five years, averaged by the portfolio weights in each stock. Therefore, this proxy characterizes the whole institutional portfolio rather than only the institution’s behavior in the particular stock in question. Institutional Portfolio Duration is then calculated as the weighted average of this institutional holding duration across all institutions owning the stock.52 While the 13F holdings reports start in 1980, we require at least three years of institutional holdings reports before including the institution, such that both the Institutional Duration and Institutional Portfolio Duration data series’ start in 1983, and, like all the proxies we use in our analysis, end in 2015.
The third proxy, Institutional Turnover, calculates the amount of trading done by the current institutional owners as an average percentage of quarterly portfolio holding changes in the past year (averaged by each institution’s share ownership in the stock). This proxy is the most widely used for institutional trading frequency and is similar to the inverse of Institutional Portfolio Duration. A distinction of Institutional Turnover is that it does not matter which of the total assets are turned over but only how many of the institutional assets are turned over. As a result, this proxy does not distinguish between turnover where the institution sells shares it acquired only in the previous quarter versus where the institution sells shares it acquired ten years ago.53 In contrast, this difference is taken into account when calculating Institutional Portfolio Duration.54 Therefore, two funds may have the same Institutional Turnover but very different Institutional Portfolio Duration.55
52. This measure was first introduced in a 2016 study by K.J. Martin Cremers and Ankur Pareek. See K.J. Martin Cremers & Ankur Pareek, Patient Capital Outperformance: The Investment Skill of High Active Share Managers Who Trade Infrequently, 122 J. FIN. ECON. 288, 291–92 (2016).
53. Id. 54. For a detailed discussion and comparison of these measures of investment time horizons as applied to mutual funds rather than institutional investors, see Anne M. Tucker, The Long & The Short: An Empirical Study of Mutual Fund Investment Time Horizons, 43 J. CORP. L. (forthcoming 2017).
55. For example, consider an institution that never trades 75% of its portfolio and turns over the remaining 25% of its portfolio each quarter, such that it has an annualized turnover of 100% per year. This turnover would be the same as an institution that turns over the full portfolio once a year. However, the former portfolio would have a long holding duration, on average, while the latter portfolio would have a holding duration of one year only.
2018] Investors, Governance, and Firm Value 401
Finally, Institutional Active Share is a proxy of the percentage difference between the overall holdings’ weights of the current institutional owners and market weights. We first calculate the active share of each institution owning a particular stock, using their overall portfolio, and then average over each institution’s share ownership in the stock. Active share is the percentage of weights in the portfolio that differ from the weights in the portfolio’s benchmark. For example, an active share of 50% indicates that half of the portfolio’s weights completely overlap with the weights in the portfolio’s benchmark. In assigning benchmarks to each institutional portfolio, we select the benchmark for which the institutional portfolio has the lowest active share out of a large set of potential benchmarks used by U.S. mutual funds.56 As a result, the assigned benchmark has the largest overlap with the institutional portfolio across all reasonable, frequently used U.S. equity benchmarks.
B. Time Trends in Institutional Ownership
In this Section, we provide a description of the time trends in
institutional ownership over the past thirty-five years, from 1980 to 2015, focusing on institutional ownership levels, Institutional Duration, Institutional Turnover, and Institutional Active Share (all as defined in Part II.A).
1. Institutional Ownership Levels
As discussed in Part I.B, the growth of institutional ownership is
considered one of the crucial factors contributing to shareholder empowerment. Accordingly, we begin our analysis by examining the percentage of outstanding equity held by institutional investors throughout our sample period, reporting their 50th, 70th, and 90th percentiles, respectively.
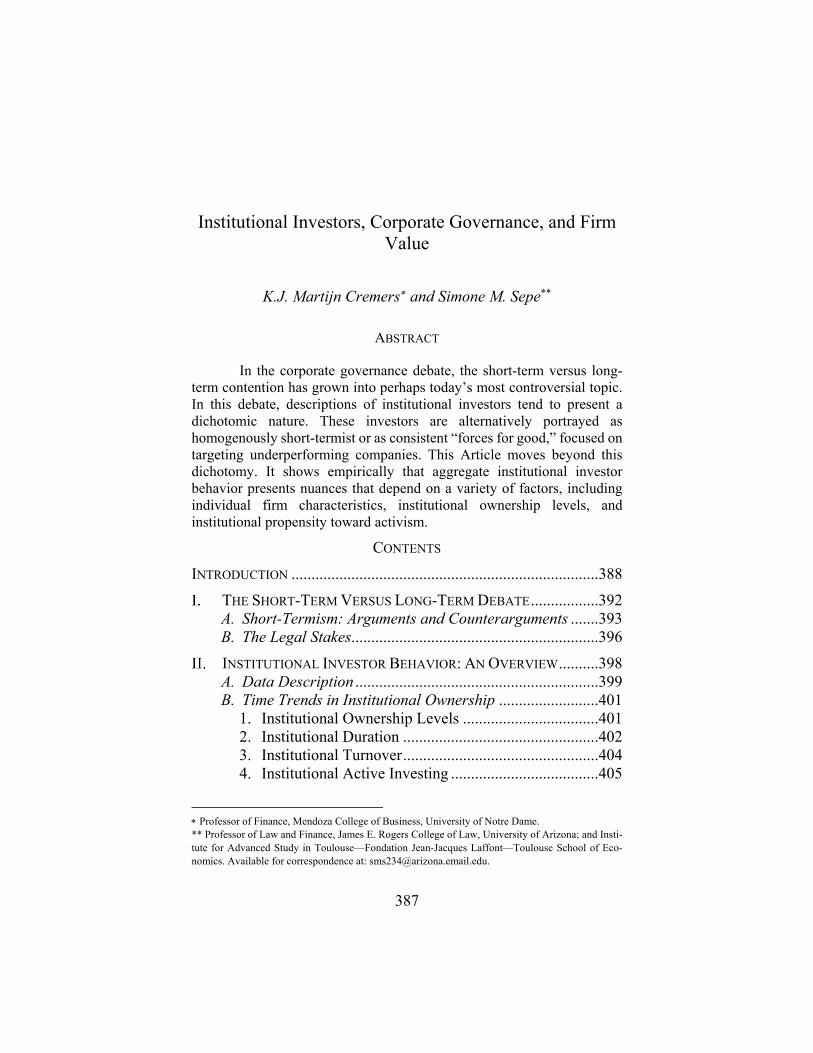
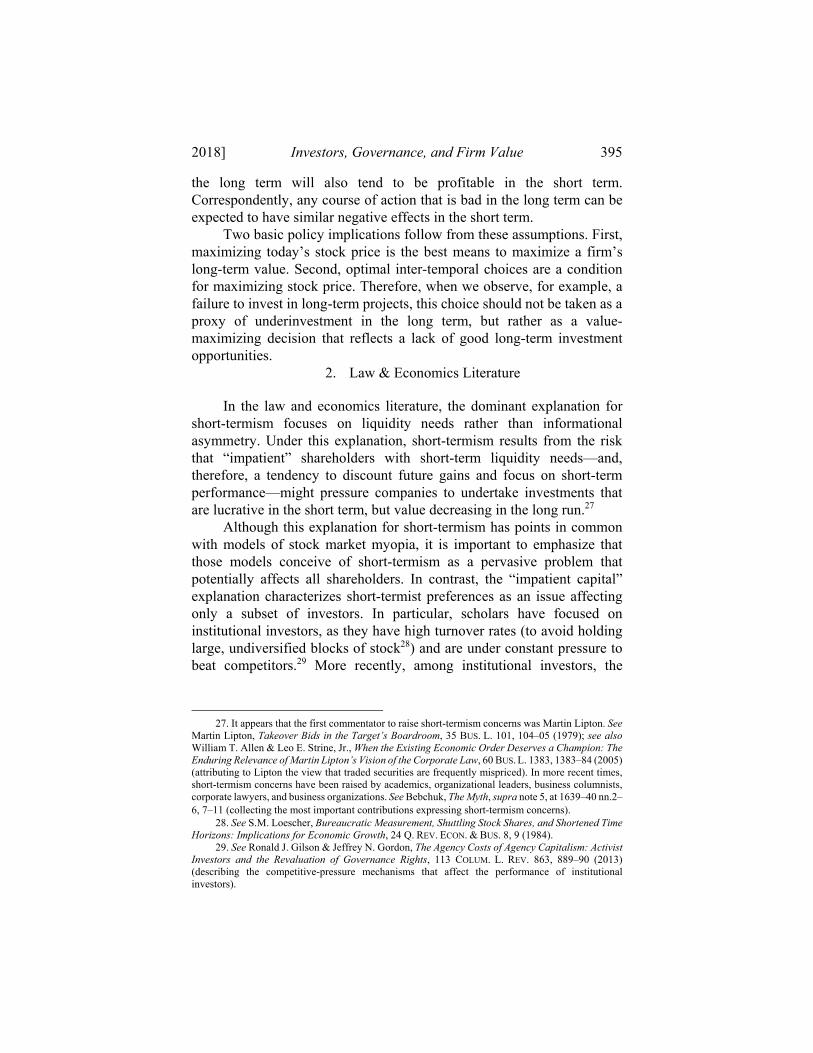
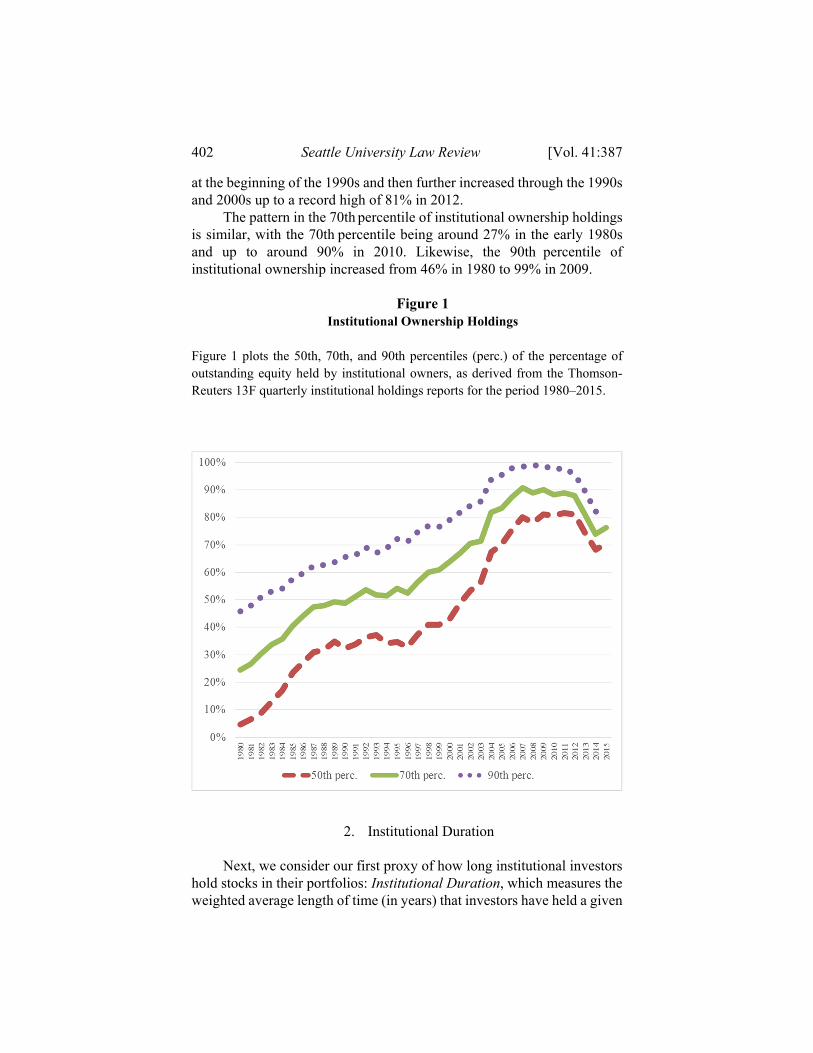
Consistent with prior studies,57 we document that the percentage of institutional ownership holdings has dramatically increased since 1980. As shown by Figure 1, if we consider, for example, the 50th percentile (i.e., the median) of institutional ownership holdings, the median was only 6% in 1980. This means that as of 1980, half the outstanding stocks had institutional ownership of 6% or below, and the other half had institutional ownership above 6%. The median progressively escalated to around 30%
56. This measure was first introduced in a 2009 study by K.J. Martijn Cremers and Antti Petajisto. See K.J. Martijn Cremers & Antti Petajisto, How Active Is Your Fund Manager? A New Measure that Predicts Performance, 22 REV. FIN. STUD. 3329 (2009). 57. See, e.g., Black, supra note 1; Kahan & Rock, supra note 34, at 987.
402 Seattle University Law Review [Vol. 41:387
at the beginning of the 1990s and then further increased through the 1990s and 2000s up to a record high of 81% in 2012.
The pattern in the 70th percentile of institutional ownership holdings is similar, with the 70th percentile being around 27% in the early 1980s and up to around 90% in 2010. Likewise, the 90th percentile of institutional ownership increased from 46% in 1980 to 99% in 2009.
Figure 1
Institutional Ownership Holdings Figure 1 plots the 50th, 70th, and 90th percentiles (perc.) of the percentage of outstanding equity held by institutional owners, as derived from the Thomson-Reuters 13F quarterly institutional holdings reports for the period 1980–2015.
2. Institutional Duration Next, we consider our first proxy of how long institutional investors
hold stocks in their portfolios: Institutional Duration, which measures the weighted average length of time (in years) that investors have held a given
2018] Investors, Governance, and Firm Value 403
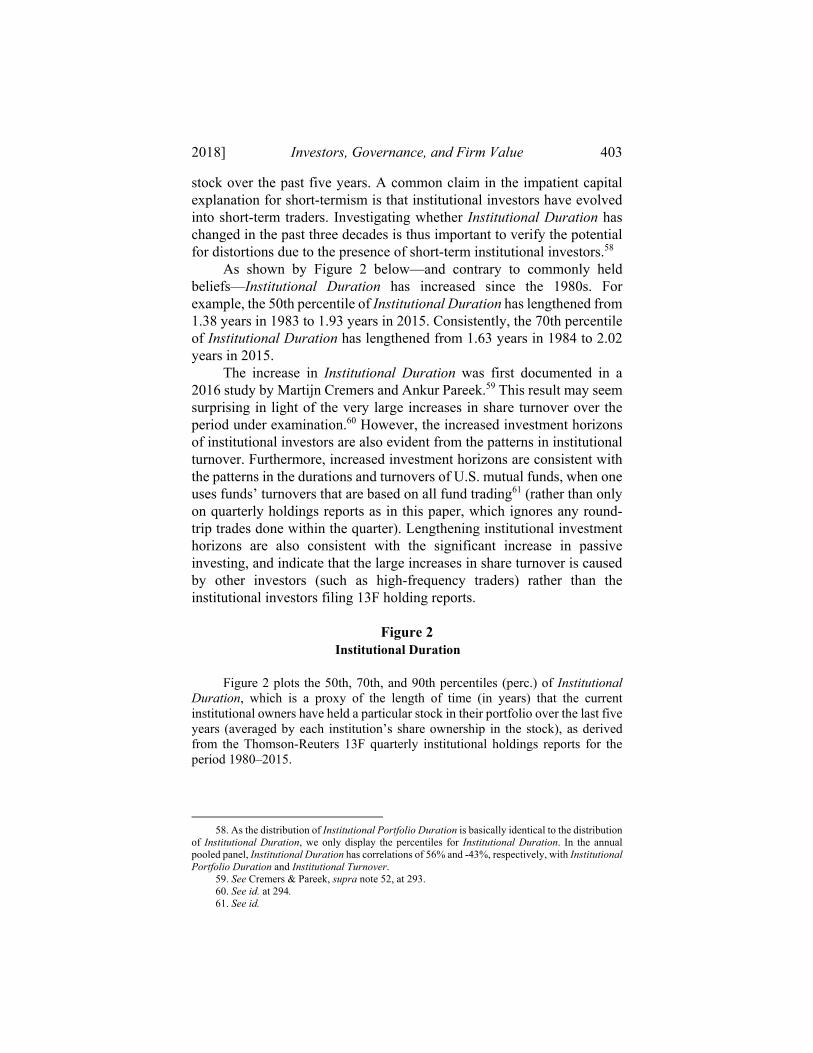
stock over the past five years. A common claim in the impatient capital explanation for short-termism is that institutional investors have evolved into short-term traders. Investigating whether Institutional Duration has changed in the past three decades is thus important to verify the potential for distortions due to the presence of short-term institutional investors.58
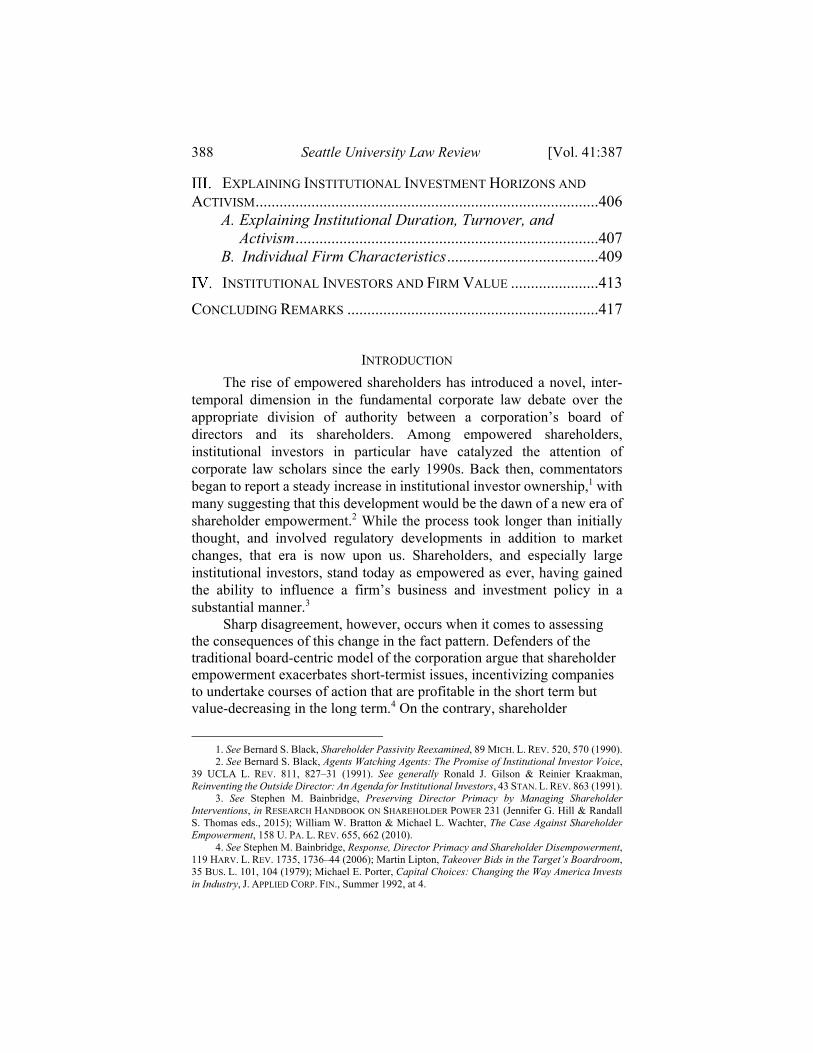
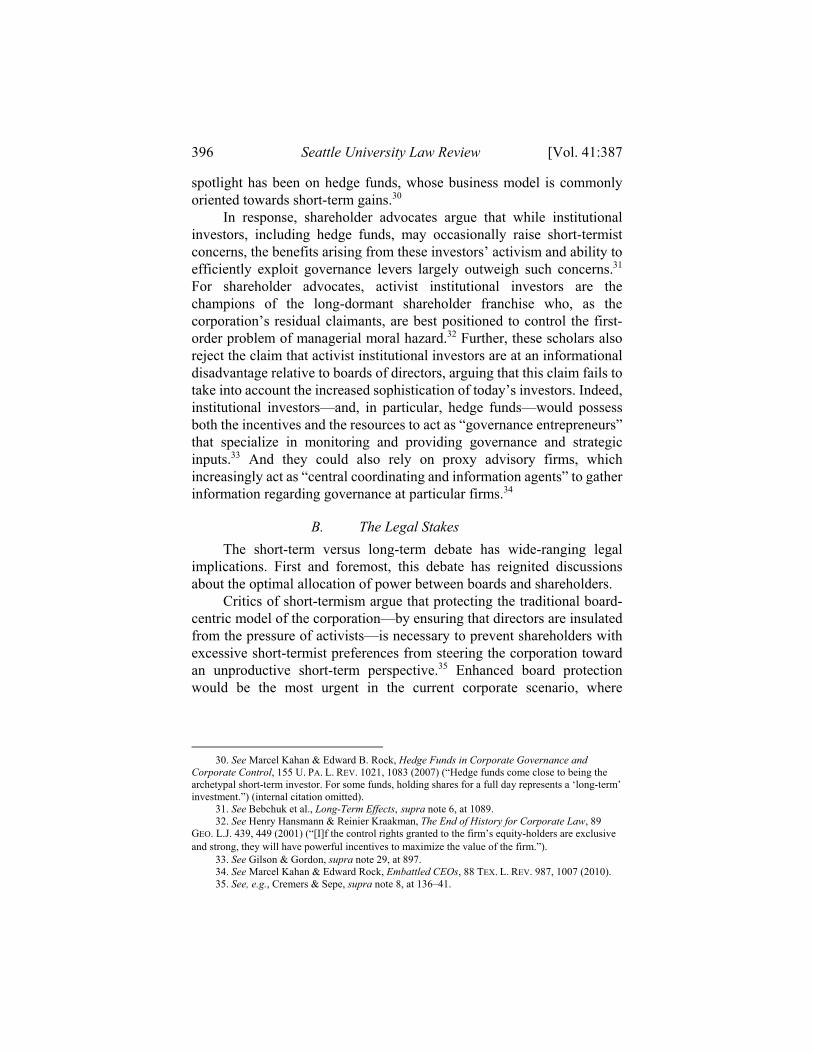
As shown by Figure 2 below—and contrary to commonly held beliefs—Institutional Duration has increased since the 1980s. For example, the 50th percentile of Institutional Duration has lengthened from 1.38 years in 1983 to 1.93 years in 2015. Consistently, the 70th percentile of Institutional Duration has lengthened from 1.63 years in 1984 to 2.02 years in 2015.
The increase in Institutional Duration was first documented in a 2016 study by Martijn Cremers and Ankur Pareek.59 This result may seem surprising in light of the very large increases in share turnover over the period under examination.60 However, the increased investment horizons of institutional investors are also evident from the patterns in institutional turnover. Furthermore, increased investment horizons are consistent with the patterns in the durations and turnovers of U.S. mutual funds, when one uses funds’ turnovers that are based on all fund trading61 (rather than only on quarterly holdings reports as in this paper, which ignores any round-trip trades done within the quarter). Lengthening institutional investment horizons are also consistent with the significant increase in passive investing, and indicate that the large increases in share turnover is caused by other investors (such as high-frequency traders) rather than the institutional investors filing 13F holding reports.
Figure 2
Institutional Duration
Figure 2 plots the 50th, 70th, and 90th percentiles (perc.) of Institutional Duration, which is a proxy of the length of time (in years) that the current institutional owners have held a particular stock in their portfolio over the last five years (averaged by each institution’s share ownership in the stock), as derived from the Thomson-Reuters 13F quarterly institutional holdings reports for the period 1980–2015.
58. As the distribution of Institutional Portfolio Duration is basically identical to the distribution of Institutional Duration, we only display the percentiles for Institutional Duration. In the annual pooled panel, Institutional Duration has correlations of 56% and -43%, respectively, with Institutional Portfolio Duration and Institutional Turnover. 59. See Cremers & Pareek, supra note 52, at 293.
60. See id. at 294. 61. See id.
404 Seattle University Law Review [Vol. 41:387
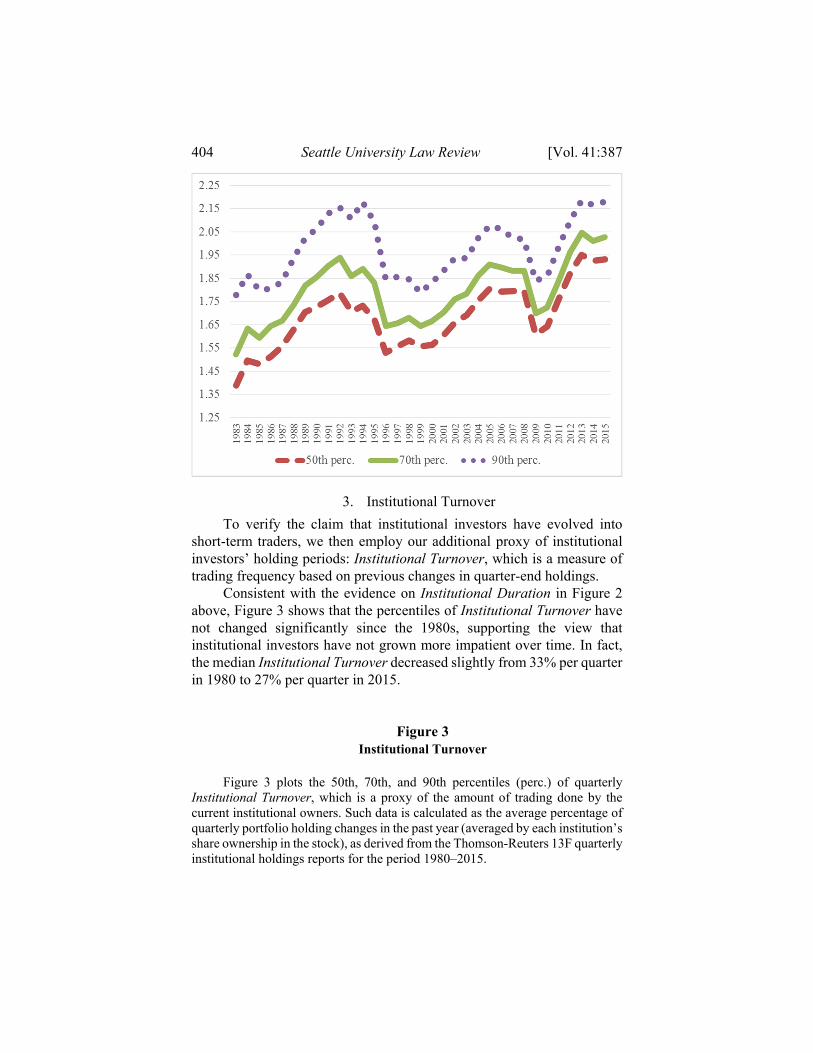
3. Institutional Turnover
To verify the claim that institutional investors have evolved into short-term traders, we then employ our additional proxy of institutional investors’ holding periods: Institutional Turnover, which is a measure of trading frequency based on previous changes in quarter-end holdings.
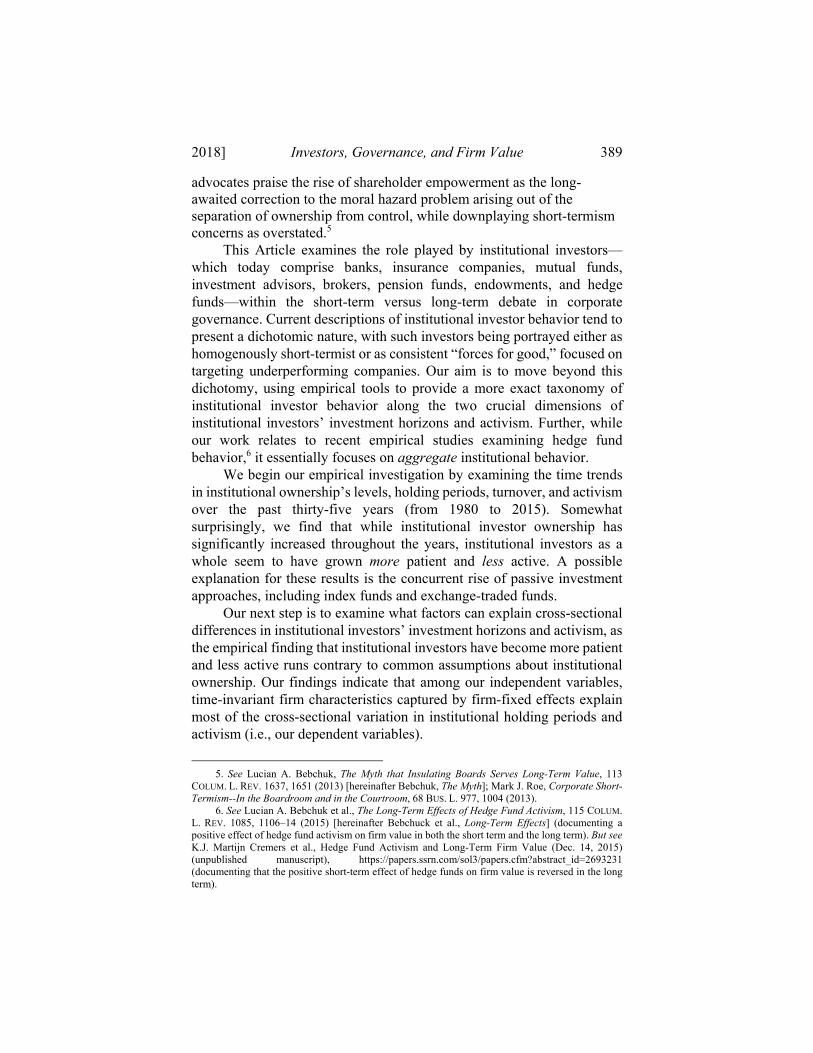
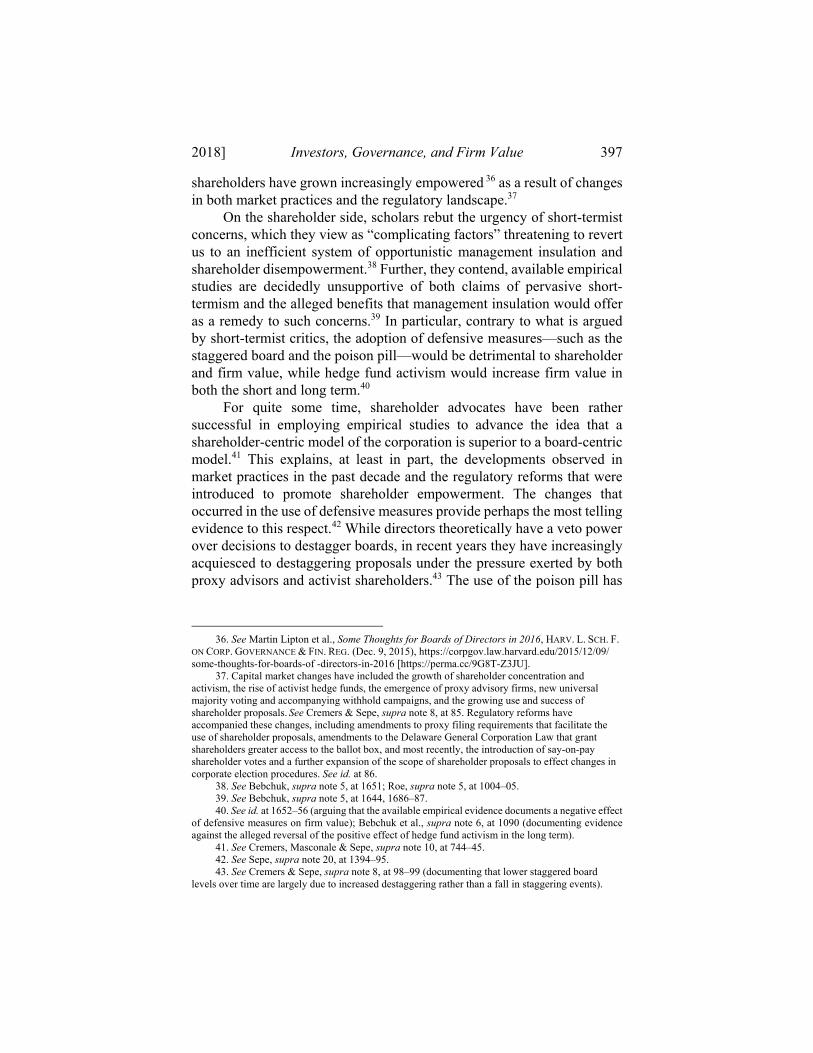
Consistent with the evidence on Institutional Duration in Figure 2 above, Figure 3 shows that the percentiles of Institutional Turnover have not changed significantly since the 1980s, supporting the view that institutional investors have not grown more impatient over time. In fact, the median Institutional Turnover decreased slightly from 33% per quarter in 1980 to 27% per quarter in 2015.
Figure 3 Institutional Turnover
Figure 3 plots the 50th, 70th, and 90th percentiles (perc.) of quarterly
Institutional Turnover, which is a proxy of the amount of trading done by the current institutional owners. Such data is calculated as the average percentage of quarterly portfolio holding changes in the past year (averaged by each institution’s share ownership in the stock), as derived from the Thomson-Reuters 13F quarterly institutional holdings reports for the period 1980–2015.
2018] Investors, Governance, and Firm Value 405
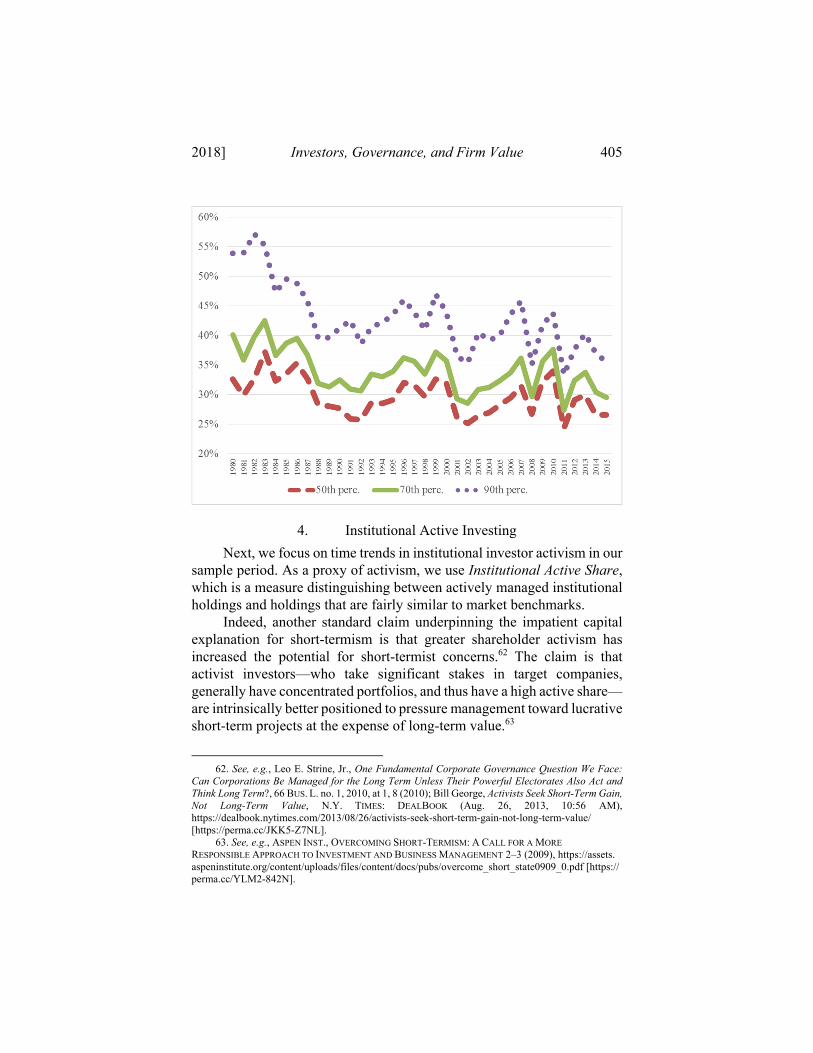
4. Institutional Active Investing
Next, we focus on time trends in institutional investor activism in our sample period. As a proxy of activism, we use Institutional Active Share, which is a measure distinguishing between actively managed institutional holdings and holdings that are fairly similar to market benchmarks.
Indeed, another standard claim underpinning the impatient capital explanation for short-termism is that greater shareholder activism has increased the potential for short-termist concerns.62 The claim is that activist investors—who take significant stakes in target companies, generally have concentrated portfolios, and thus have a high active share—are intrinsically better positioned to pressure management toward lucrative short-term projects at the expense of long-term value.63
62. See, e.g., Leo E. Strine, Jr., One Fundamental Corporate Governance Question We Face:
Can Corporations Be Managed for the Long Term Unless Their Powerful Electorates Also Act and Think Long Term?, 66 BUS. L. no. 1, 2010, at 1, 8 (2010); Bill George, Activists Seek Short-Term Gain, Not Long-Term Value, N.Y. TIMES: DEALBOOK (Aug. 26, 2013, 10:56 AM), https://dealbook.nytimes.com/2013/08/26/activists-seek-short-term-gain-not-long-term-value/ [https://perma.cc/JKK5-Z7NL].
63. See, e.g., ASPEN INST., OVERCOMING SHORT-TERMISM: A CALL FOR A MORE
RESPONSIBLE APPROACH TO INVESTMENT AND BUSINESS MANAGEMENT 2–3 (2009), https://assets. aspeninstitute.org/content/uploads/files/content/docs/pubs/overcome_short_state0909_0.pdf [https:// perma.cc/YLM2-842N].
406 Seattle University Law Review [Vol. 41:387
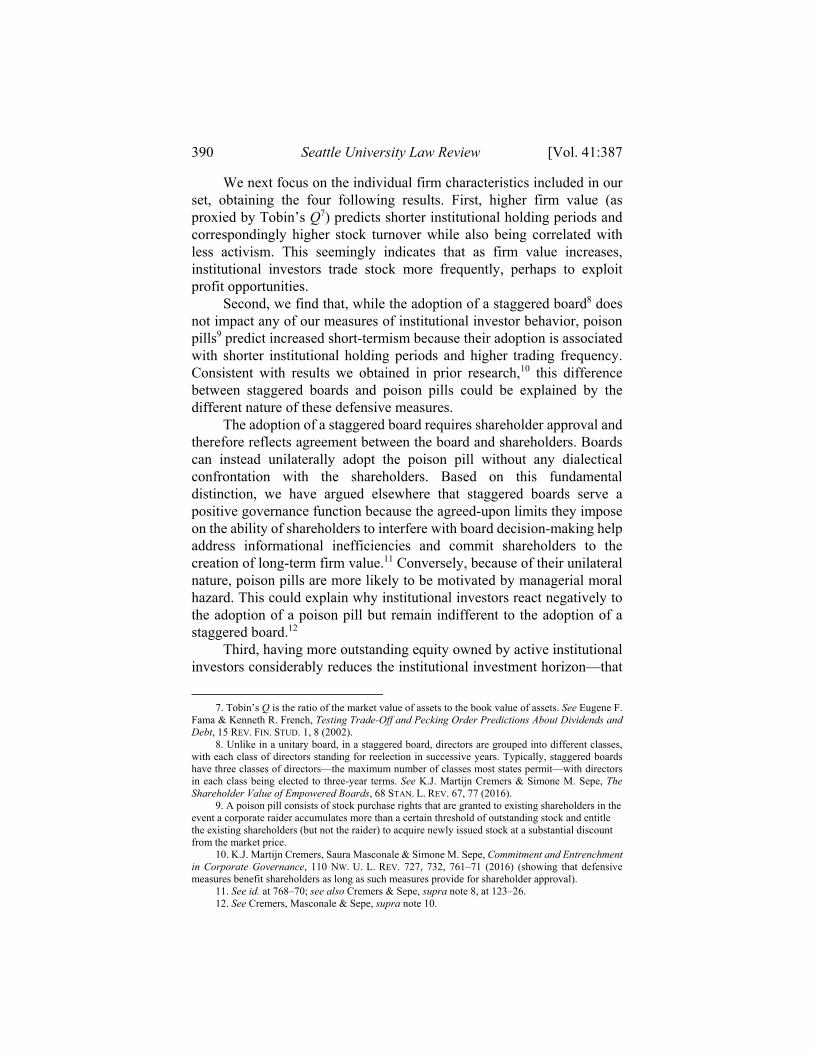
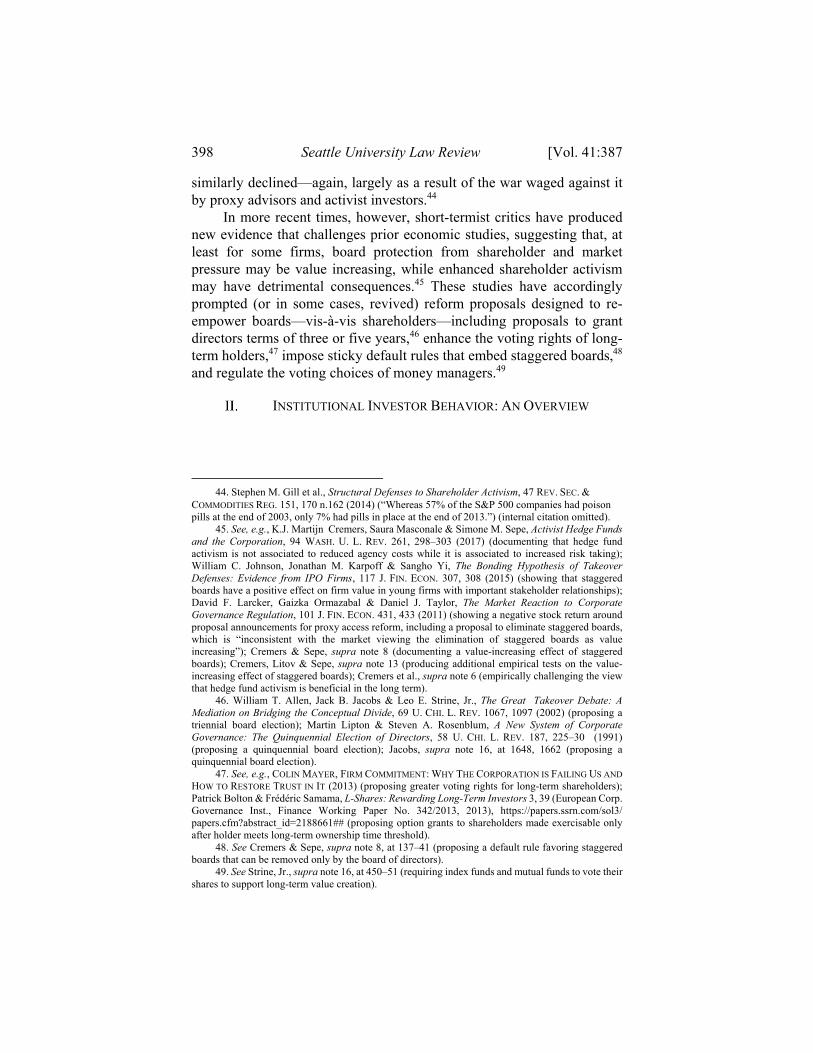
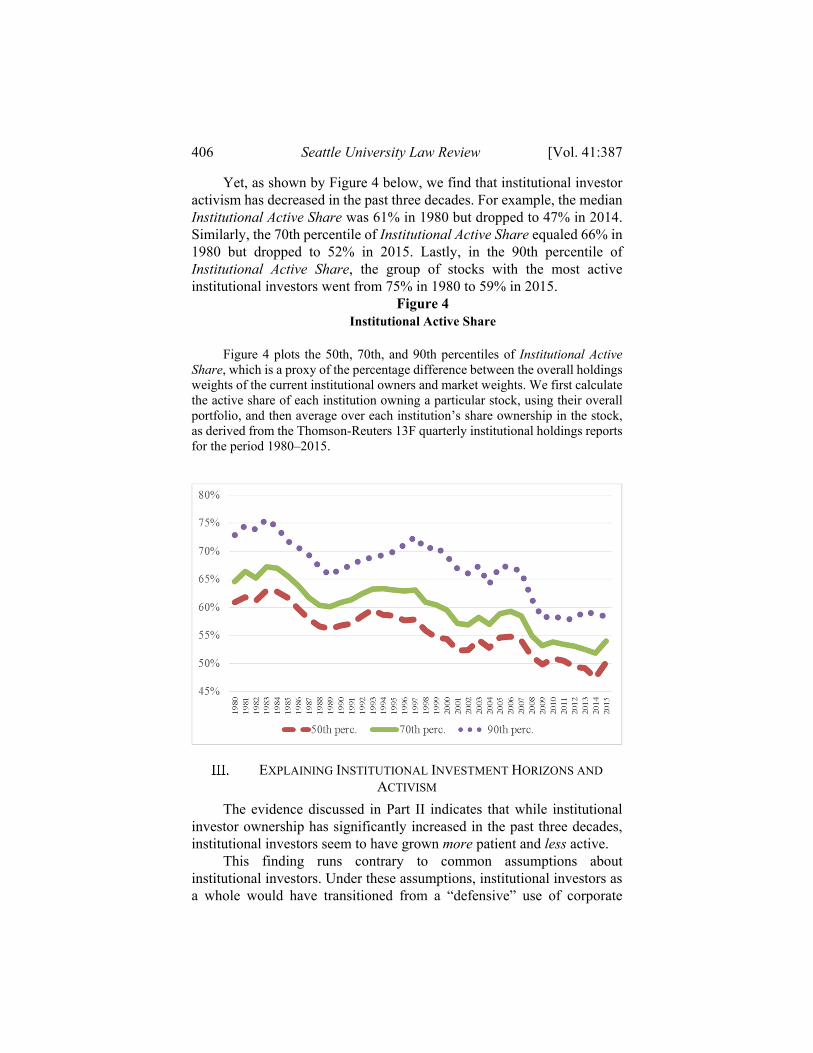
Yet, as shown by Figure 4 below, we find that institutional investor activism has decreased in the past three decades. For example, the median Institutional Active Share was 61% in 1980 but dropped to 47% in 2014. Similarly, the 70th percentile of Institutional Active Share equaled 66% in 1980 but dropped to 52% in 2015. Lastly, in the 90th percentile of Institutional Active Share, the group of stocks with the most active institutional investors went from 75% in 1980 to 59% in 2015.
Figure 4 Institutional Active Share
Figure 4 plots the 50th, 70th, and 90th percentiles of Institutional Active
Share, which is a proxy of the percentage difference between the overall holdings weights of the current institutional owners and market weights. We first calculate the active share of each institution owning a particular stock, using their overall portfolio, and then average over each institution’s share ownership in the stock, as derived from the Thomson-Reuters 13F quarterly institutional holdings reports for the period 1980–2015.
EXPLAINING INSTITUTIONAL INVESTMENT HORIZONS AND
ACTIVISM
The evidence discussed in Part II indicates that while institutional investor ownership has significantly increased in the past three decades, institutional investors seem to have grown more patient and less active.
This finding runs contrary to common assumptions about institutional investors. Under these assumptions, institutional investors as a whole would have transitioned from a “defensive” use of corporate
2018] Investors, Governance, and Firm Value 407
governance levers to a more proactive use of such levers after the rise of hedge funds.64
In this Part, we accordingly seek to understand what factors, if any, can explain institutional holding behavior and activism. We do so by investigating whether different firm characteristics can predict different aggregate investor behavior.
A. Explaining Institutional Duration, Turnover, and Activism
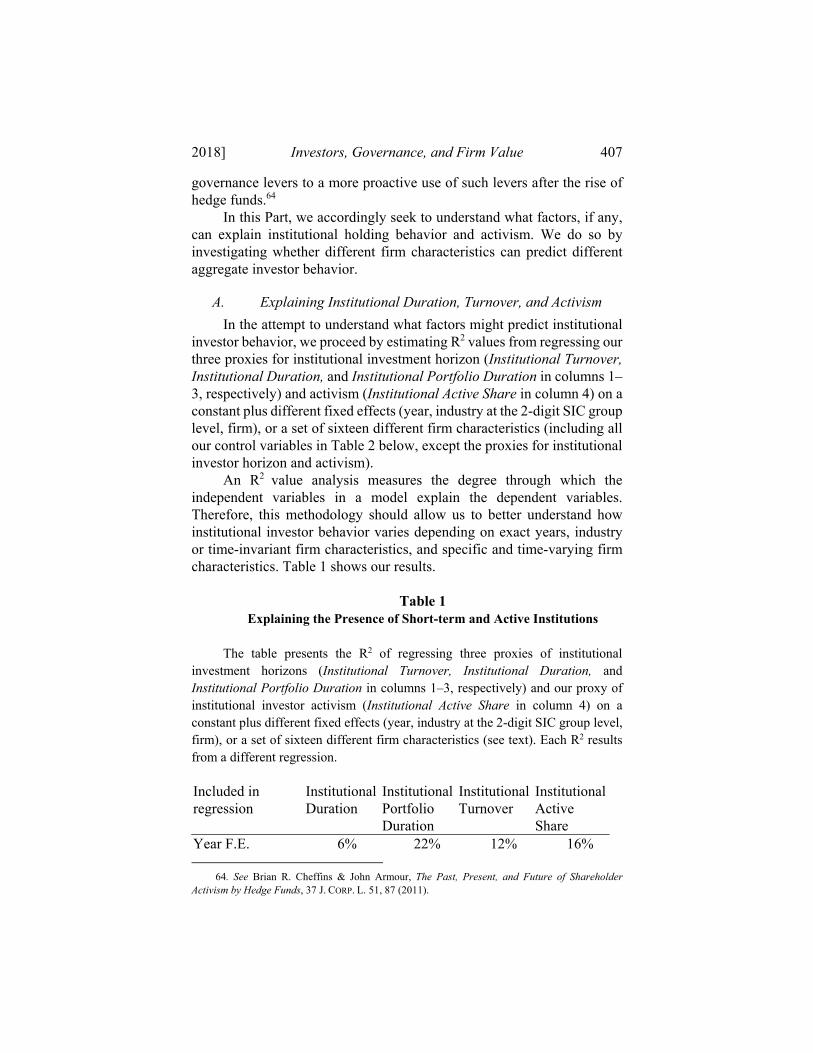
In the attempt to understand what factors might predict institutional investor behavior, we proceed by estimating R2 values from regressing our three proxies for institutional investment horizon (Institutional Turnover, Institutional Duration, and Institutional Portfolio Duration in columns 1–3, respectively) and activism (Institutional Active Share in column 4) on a constant plus different fixed effects (year, industry at the 2-digit SIC group level, firm), or a set of sixteen different firm characteristics (including all our control variables in Table 2 below, except the proxies for institutional investor horizon and activism).
An R2 value analysis measures the degree through which the independent variables in a model explain the dependent variables. Therefore, this methodology should allow us to better understand how institutional investor behavior varies depending on exact years, industry or time-invariant firm characteristics, and specific and time-varying firm characteristics. Table 1 shows our results.
Table 1
Explaining the Presence of Short-term and Active Institutions
The table presents the R2 of regressing three proxies of institutional investment horizons (Institutional Turnover, Institutional Duration, and Institutional Portfolio Duration in columns 1–3, respectively) and our proxy of institutional investor activism (Institutional Active Share in column 4) on a constant plus different fixed effects (year, industry at the 2-digit SIC group level, firm), or a set of sixteen different firm characteristics (see text). Each R2 results from a different regression.
Included in regression
Institutional Duration
Institutional Portfolio Duration
Institutional Turnover
Institutional Active Share
Year F.E. 6% 22% 12% 16% 64. See Brian R. Cheffins & John Armour, The Past, Present, and Future of Shareholder Activism by Hedge Funds, 37 J. CORP. L. 51, 87 (2011).
408 Seattle University Law Review [Vol. 41:387
Year + Industry F.E.
27% 38% 24% 33%
Year + Firm F.E. 57% 63% 46% 66% Year + Firm F.E. + Firm-Characteristics
59% 67% 50% 69%
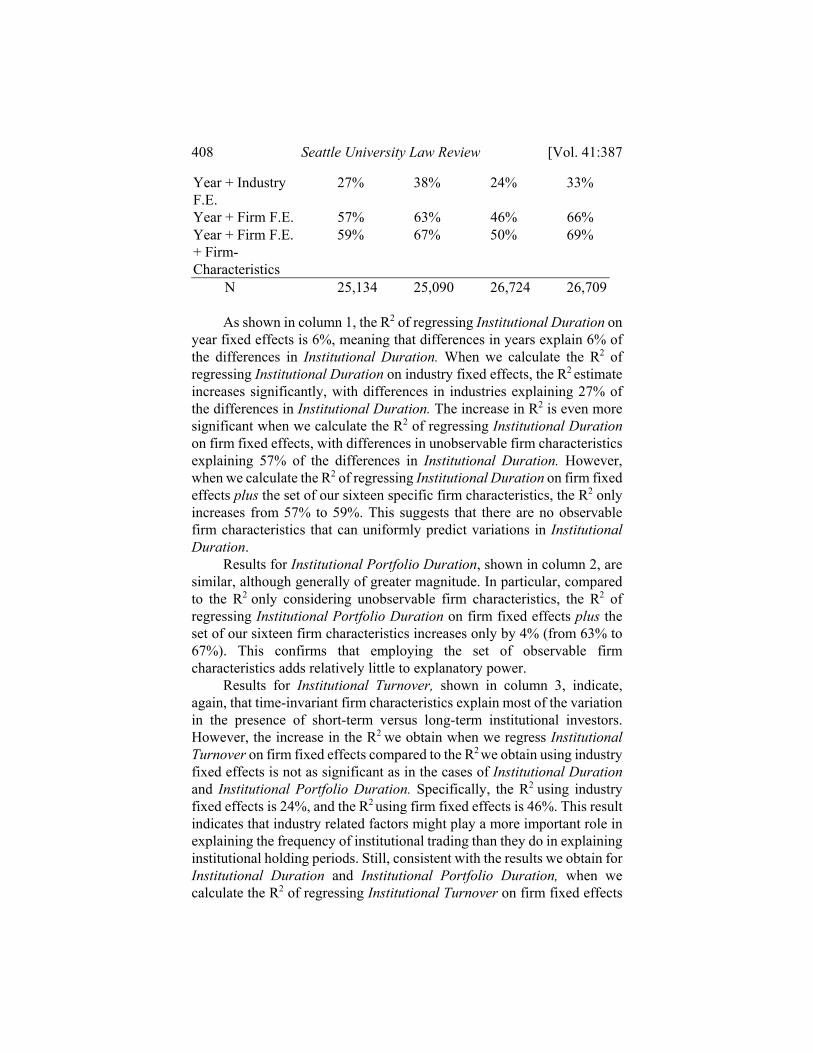
N 25,134 25,090 26,724 26,709 As shown in column 1, the R2 of regressing Institutional Duration on
year fixed effects is 6%, meaning that differences in years explain 6% of the differences in Institutional Duration. When we calculate the R2 of regressing Institutional Duration on industry fixed effects, the R2 estimate increases significantly, with differences in industries explaining 27% of the differences in Institutional Duration. The increase in R2 is even more significant when we calculate the R2 of regressing Institutional Duration on firm fixed effects, with differences in unobservable firm characteristics explaining 57% of the differences in Institutional Duration. However, when we calculate the R2 of regressing Institutional Duration on firm fixed effects plus the set of our sixteen specific firm characteristics, the R2 only increases from 57% to 59%. This suggests that there are no observable firm characteristics that can uniformly predict variations in Institutional Duration.
Results for Institutional Portfolio Duration, shown in column 2, are similar, although generally of greater magnitude. In particular, compared to the R2 only considering unobservable firm characteristics, the R2 of regressing Institutional Portfolio Duration on firm fixed effects plus the set of our sixteen firm characteristics increases only by 4% (from 63% to 67%). This confirms that employing the set of observable firm characteristics adds relatively little to explanatory power.
Results for Institutional Turnover, shown in column 3, indicate, again, that time-invariant firm characteristics explain most of the variation in the presence of short-term versus long-term institutional investors. However, the increase in the R2 we obtain when we regress Institutional Turnover on firm fixed effects compared to the R2 we obtain using industry fixed effects is not as significant as in the cases of Institutional Duration and Institutional Portfolio Duration. Specifically, the R2 using industry fixed effects is 24%, and the R2 using firm fixed effects is 46%. This result indicates that industry related factors might play a more important role in explaining the frequency of institutional trading than they do in explaining institutional holding periods. Still, consistent with the results we obtain for Institutional Duration and Institutional Portfolio Duration, when we calculate the R2 of regressing Institutional Turnover on firm fixed effects

2018] Investors, Governance, and Firm Value 409
plus the set of our sixteen firm characteristics, R2 registers, again, only a 4% increase (from 46% to 50%).
Results for Institutional Active Share are also similar, with differences in time-invariant firm characteristics explaining 66% of the differences in the activism of institutional investors and the R2 of regressing Institutional Active Share on firm characteristics and firm fixed effects only increasing to 69%. Therefore, as with institutional holding periods, there seem to be no time-varying firm characteristics that have substantial additional explanatory power for how active a stock’s institutional investor will be relative to time-invariant firm fixed effects.
Since our firm characteristics also include staggered boards and poison pills, these results suggest that contrary to commonly held beliefs, the adoption of such measures does not seem to be related to the presence of either short-term or long-term institutional investment horizons or more or less active institutions.
B. Individual Firm Characteristics
In order to analyze the importance at the margin of time variation in specific firm characteristics, we next turn to more closely examine the relationship between our set of sixteen firm characteristics and both institutional investment horizon and activism.
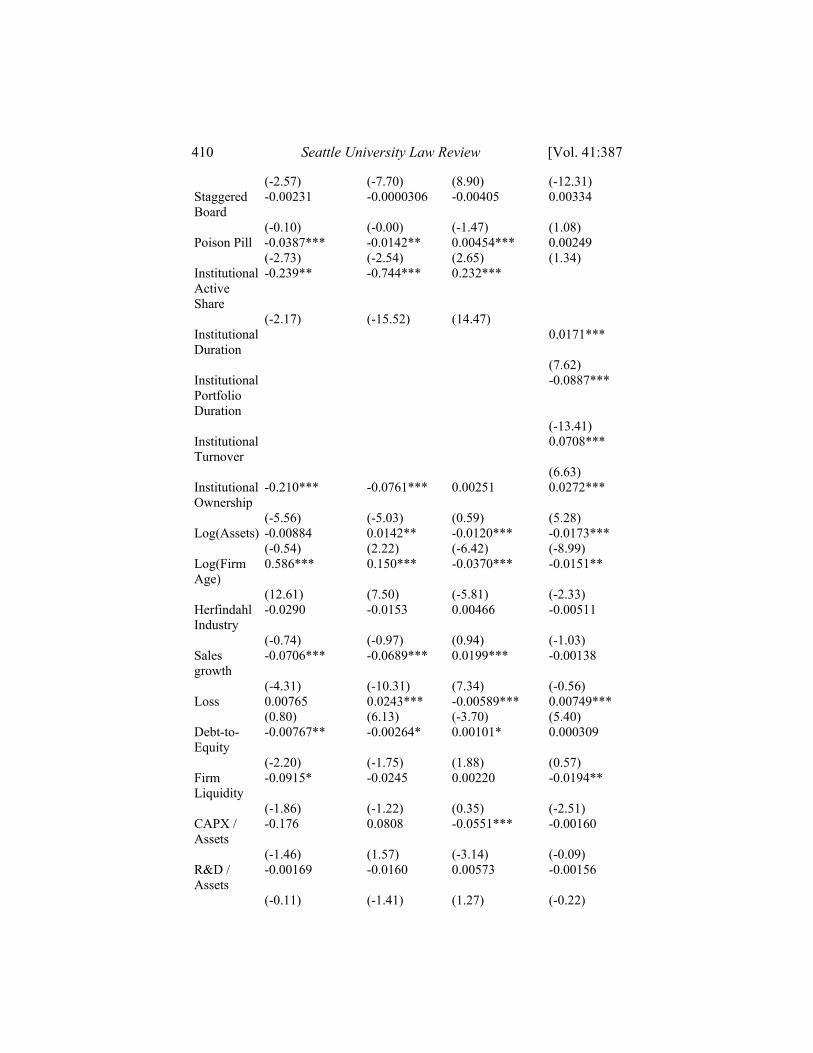
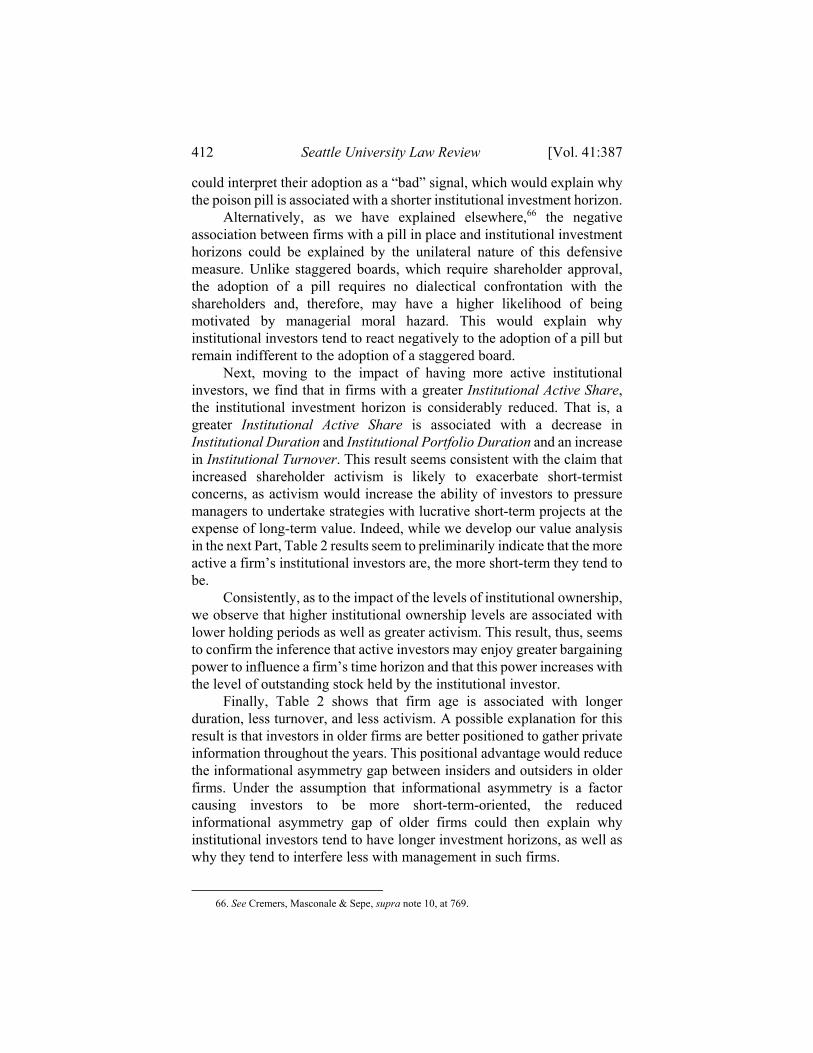
To this end, in Table 2, we present pooled panel regressions (i.e., with firm fixed effects) of our three proxies for institutional investment horizon (Institutional Turnover, Institutional Duration, and Institutional Portfolio Duration in columns 1–3, respectively) and activism (Institutional Active Share in column 4) on the set of our specific firm characteristics.
Table 2 Institutional Investor Behavior and Firm Characteristics
This table presents regressions of three different proxies of the presence of
short-term institutions (Institutional Duration, Institutional Portfolio Duration, and Institutional Turnover in columns 1–3, respectively) and of active institutions (Institutional Active Share in column 4) on a large set of firm characteristics (see text), which are lagged by one year. Each regression includes year and firm fixed effects. The symbols *, **, and *** denote statistical significance at the 10%, 5%, and 1% level, respectively, based on robust standard errors clustered by firm. Institutional
Duration Institutional Portfolio Duration
Institutional Turnover
Institutional Active Share
Tobin's Q -0.0139** -0.0187*** 0.00674*** -0.00950***
410 Seattle University Law Review [Vol. 41:387
(-2.57) (-7.70) (8.90) (-12.31) Staggered Board
-0.00231 -0.0000306 -0.00405 0.00334
(-0.10) (-0.00) (-1.47) (1.08) Poison Pill -0.0387*** -0.0142** 0.00454*** 0.00249
(-2.73) (-2.54) (2.65) (1.34) Institutional Active Share
-0.239** -0.744*** 0.232***
(-2.17) (-15.52) (14.47)
Institutional Duration
0.0171***
(7.62) Institutional Portfolio Duration
-0.0887***
(-13.41) Institutional Turnover
0.0708***
(6.63) Institutional Ownership
-0.210*** -0.0761*** 0.00251 0.0272***
(-5.56) (-5.03) (0.59) (5.28) Log(Assets) -0.00884 0.0142** -0.0120*** -0.0173***
(-0.54) (2.22) (-6.42) (-8.99) Log(Firm Age)
0.586*** 0.150*** -0.0370*** -0.0151**
(12.61) (7.50) (-5.81) (-2.33) Herfindahl Industry
-0.0290 -0.0153 0.00466 -0.00511
(-0.74) (-0.97) (0.94) (-1.03) Sales growth
-0.0706*** -0.0689*** 0.0199*** -0.00138
(-4.31) (-10.31) (7.34) (-0.56) Loss 0.00765 0.0243*** -0.00589*** 0.00749***
(0.80) (6.13) (-3.70) (5.40) Debt-to-Equity
-0.00767** -0.00264* 0.00101* 0.000309
(-2.20) (-1.75) (1.88) (0.57) Firm Liquidity
-0.0915* -0.0245 0.00220 -0.0194**
(-1.86) (-1.22) (0.35) (-2.51) CAPX / Assets
-0.176 0.0808 -0.0551*** -0.00160
(-1.46) (1.57) (-3.14) (-0.09) R&D / Assets
-0.00169 -0.0160 0.00573 -0.00156
(-0.11) (-1.41) (1.27) (-0.22)

2018] Investors, Governance, and Firm Value 411
Intangible Capital / Assets
0.0115 -0.0167 0.00698* -0.000929
(0.39) (-1.34) (1.69) (-0.21)
Large Customer
-0.0152 -0.00541 -0.000117 0.000408
(-1.24) (-1.12) (-0.08) (0.25) Log(# of Patents)
0.0181 0.0145* -0.00154 -0.00380
(0.88) (1.73) (-0.60) (-1.51) N 25,119 25,075 26,709 25,071 R-sq 0.588 0.670 0.501 0.711
Among the noticeable results of Table 2, we find that higher firm
value (as proxied by Tobin’s Q) predicts shorter institutional holding periods and correspondently higher stock turnover, while also being correlated to less activism. This seems to indicate that as a firm’s value increases, investors trade stock more frequently, perhaps in order to exploit profit opportunities. Economically, a standard deviation increase in firm value (corresponding to an increase in Tobin’s Q of 1.27) is associated with a decrease in Institutional Portfolio Duration of 0.28 months (=1.27*0.0187*12, see column 2) and with a decrease in Institutional Active Share of 1.2% (=1.27*0.0095, see column 4).
Results concerning the adoption of defensive measures are also noticeable. First, we find that staggered boards have no impact on any of our measures of institutional investor behavior.
Conversely, poison pills seem to predict increased short-termism on the side of investors, as their adoption is associated with lower Institutional Duration, lower Institutional Portfolio Duration, and increased Institutional Turnover. Considering that the adoption of a poison pill is designed to block threats of a change in control, this result might seem puzzling at first. Poison pill results, however, need to be interpreted with caution. Indeed, since boards of directors can unilaterally adopt a pill at any time, it is difficult to gather any inference about the use of “visible” rather than “shadow” pills.65 Nevertheless, because boards tend to put a pill in place when things have already gone awry, institutional investors
65. See John C. Coates IV, Takeover Defenses in the Shadow of the Pill: A Critique of the
Scientific Evidence, 79 TEX. L. REV. 271, 288 (2000) (arguing that since the endorsement of the pill by Delaware courts, “all Delaware firms . . . have had a shadow pill in place, witting or not”).
412 Seattle University Law Review [Vol. 41:387
could interpret their adoption as a “bad” signal, which would explain why the poison pill is associated with a shorter institutional investment horizon.
Alternatively, as we have explained elsewhere,66 the negative association between firms with a pill in place and institutional investment horizons could be explained by the unilateral nature of this defensive measure. Unlike staggered boards, which require shareholder approval, the adoption of a pill requires no dialectical confrontation with the shareholders and, therefore, may have a higher likelihood of being motivated by managerial moral hazard. This would explain why institutional investors tend to react negatively to the adoption of a pill but remain indifferent to the adoption of a staggered board.
Next, moving to the impact of having more active institutional investors, we find that in firms with a greater Institutional Active Share, the institutional investment horizon is considerably reduced. That is, a greater Institutional Active Share is associated with a decrease in Institutional Duration and Institutional Portfolio Duration and an increase in Institutional Turnover. This result seems consistent with the claim that increased shareholder activism is likely to exacerbate short-termist concerns, as activism would increase the ability of investors to pressure managers to undertake strategies with lucrative short-term projects at the expense of long-term value. Indeed, while we develop our value analysis in the next Part, Table 2 results seem to preliminarily indicate that the more active a firm’s institutional investors are, the more short-term they tend to be.
Consistently, as to the impact of the levels of institutional ownership, we observe that higher institutional ownership levels are associated with lower holding periods as well as greater activism. This result, thus, seems to confirm the inference that active investors may enjoy greater bargaining power to influence a firm’s time horizon and that this power increases with the level of outstanding stock held by the institutional investor.
Finally, Table 2 shows that firm age is associated with longer duration, less turnover, and less activism. A possible explanation for this result is that investors in older firms are better positioned to gather private information throughout the years. This positional advantage would reduce the informational asymmetry gap between insiders and outsiders in older firms. Under the assumption that informational asymmetry is a factor causing investors to be more short-term-oriented, the reduced informational asymmetry gap of older firms could then explain why institutional investors tend to have longer investment horizons, as well as why they tend to interfere less with management in such firms.
66. See Cremers, Masconale & Sepe, supra note 10, at 769.
2018] Investors, Governance, and Firm Value 413
INSTITUTIONAL INVESTORS AND FIRM VALUE
So far, the results of our empirical investigation indicate that more
institutional investor activism is associated with shorter institutional holding periods and more frequent institutional trading. Further, the higher the levels of institutional ownership, the more the institutional activism and the shorter the institutional investment horizon. Conversely, in older firms, we observe less activism and turnover on the one hand and longer holding periods on the other. Still, in contrast to common theoretical predictions, different defense measures seem to have a varying impact on institutional investor behavior.
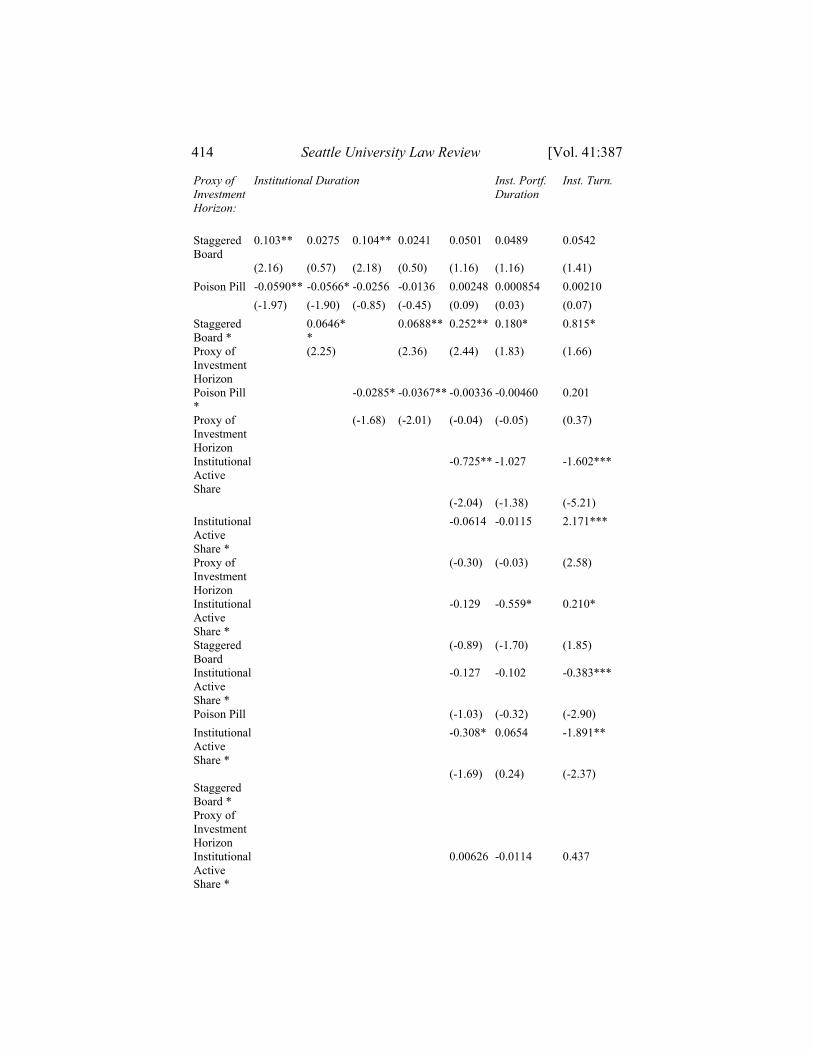
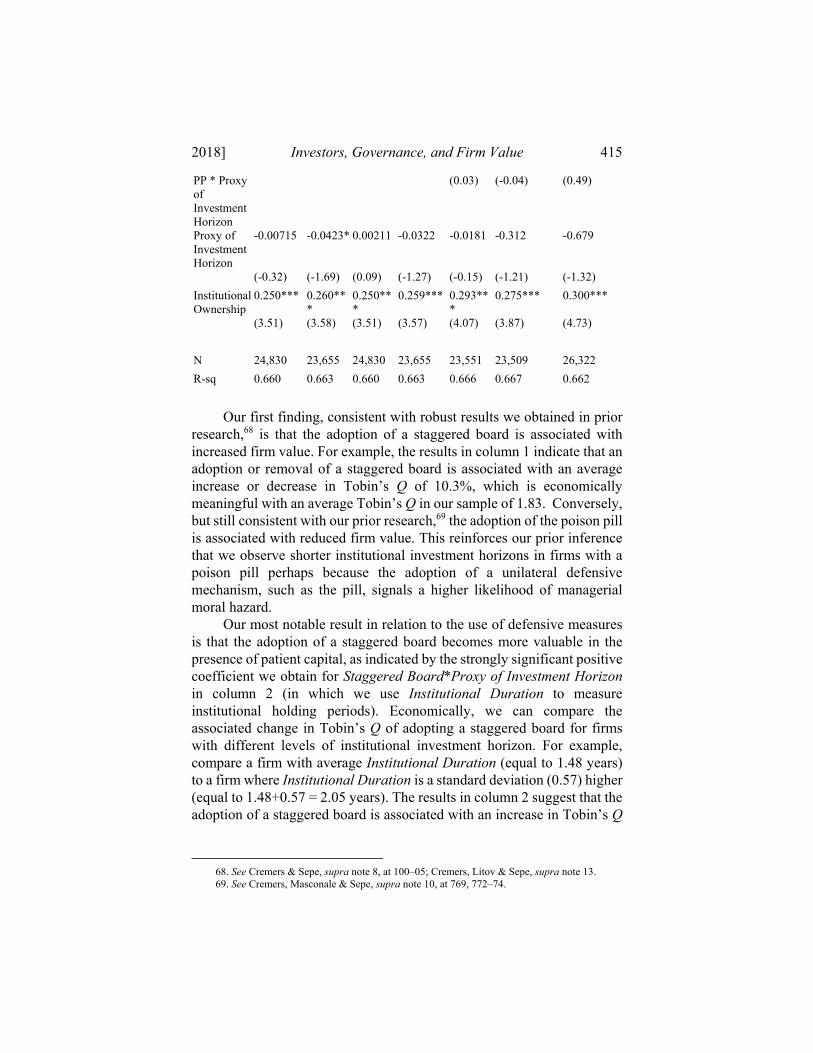
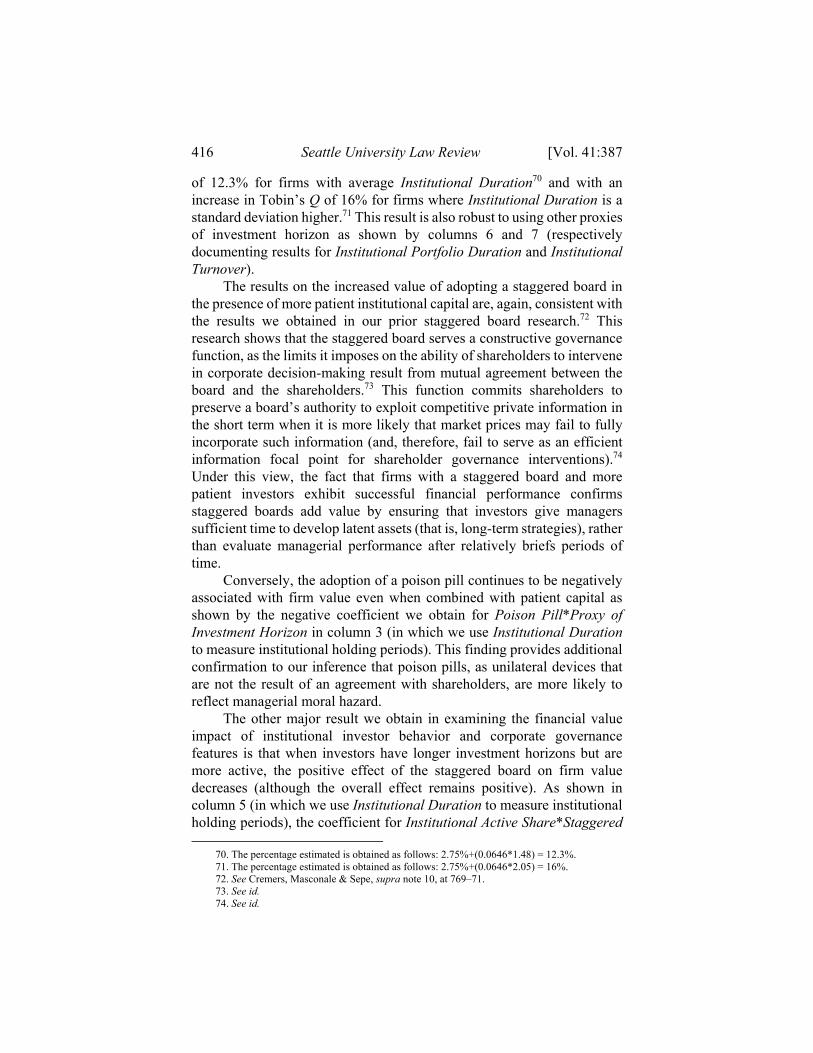
These results, however, do not address efficiency questions about institutional investor behavior. In order to address these questions, in this Part, we focus on the financial value analysis of aggregate institutional investor behavior as interacted with corporate governance features. We do so by estimating Tobin’s Q regressions on year and firm fixed effects, proxies for institutional investment horizons and activism, staggered boards, poison pills, and a set of standard controls. As shown by Table 3 below, we use different proxies for institutional investment horizons in different columns. In columns 1–5, we use Institutional Duration; in column 6, we use Institutional Portfolio Duration; and in column 7, we use Institutional Turnover.
Table 3
Firm Value, Governance, and Institutional Shareholders
This table presents Tobin’s Q regressions on year and firm fixed effects, proxies for the presence of short-term institutions (Institutional Duration, Institutional Portfolio Duration, and Institutional Turnover), a proxy of the presence of active institutions (Institutional Active Share), staggered boards (SB), poison pills (PP), plus a set of standard controls.67 All independent variables are lagged by one year. The symbols *, **, and *** denote statistical significance at the 10%, 5%, and 1% level, respectively, based on robust standard errors clustered by firm.
Dependent Variable: Tobin’s Q (1) (2) (3) (4) (5) (6) (7)
67. For brevity, we do not show the controls in the Table.
414 Seattle University Law Review [Vol. 41:387
Proxy of Investment Horizon:
Institutional Duration Inst. Portf. Duration
Inst. Turn.
Staggered Board
0.103** 0.0275 0.104** 0.0241 0.0501 0.0489 0.0542
(2.16) (0.57) (2.18) (0.50) (1.16) (1.16) (1.41)
Poison Pill -0.0590** -0.0566* -0.0256 -0.0136 0.00248 0.000854 0.00210
(-1.97) (-1.90) (-0.85) (-0.45) (0.09) (0.03) (0.07)
Staggered Board *
0.0646**
0.0688** 0.252** 0.180* 0.815*
Proxy of Investment Horizon
(2.25) (2.36) (2.44) (1.83) (1.66)
Poison Pill *
-0.0285* -0.0367** -0.00336 -0.00460 0.201
Proxy of Investment Horizon
(-1.68) (-2.01) (-0.04) (-0.05) (0.37)
Institutional Active Share
-0.725** -1.027 -1.602***
(-2.04) (-1.38) (-5.21)
Institutional Active Share *
-0.0614 -0.0115 2.171***
Proxy of Investment Horizon
(-0.30) (-0.03) (2.58)
Institutional Active Share *
-0.129 -0.559* 0.210*
Staggered Board
(-0.89) (-1.70) (1.85)
Institutional Active Share *
-0.127 -0.102 -0.383***
Poison Pill (-1.03) (-0.32) (-2.90)
Institutional Active Share *
-0.308* 0.0654 -1.891**
Staggered Board * Proxy of Investment Horizon
(-1.69) (0.24) (-2.37)
Institutional Active Share *
0.00626 -0.0114 0.437
2018] Investors, Governance, and Firm Value 415
PP * Proxy of Investment Horizon
(0.03) (-0.04) (0.49)
Proxy of Investment Horizon
-0.00715 -0.0423* 0.00211 -0.0322 -0.0181 -0.312 -0.679
(-0.32) (-1.69) (0.09) (-1.27) (-0.15) (-1.21) (-1.32)
Institutional Ownership
0.250*** 0.260***
0.250***
0.259*** 0.293***
0.275*** 0.300***
(3.51) (3.58) (3.51) (3.57) (4.07) (3.87) (4.73)
N 24,830 23,655 24,830 23,655 23,551 23,509 26,322
R-sq 0.660 0.663 0.660 0.663 0.666 0.667 0.662
Our first finding, consistent with robust results we obtained in prior
research,68 is that the adoption of a staggered board is associated with increased firm value. For example, the results in column 1 indicate that an adoption or removal of a staggered board is associated with an average increase or decrease in Tobin’s Q of 10.3%, which is economically meaningful with an average Tobin’s Q in our sample of 1.83. Conversely, but still consistent with our prior research,69 the adoption of the poison pill is associated with reduced firm value. This reinforces our prior inference that we observe shorter institutional investment horizons in firms with a poison pill perhaps because the adoption of a unilateral defensive mechanism, such as the pill, signals a higher likelihood of managerial moral hazard.
Our most notable result in relation to the use of defensive measures is that the adoption of a staggered board becomes more valuable in the presence of patient capital, as indicated by the strongly significant positive coefficient we obtain for Staggered Board*Proxy of Investment Horizon in column 2 (in which we use Institutional Duration to measure institutional holding periods). Economically, we can compare the associated change in Tobin’s Q of adopting a staggered board for firms with different levels of institutional investment horizon. For example, compare a firm with average Institutional Duration (equal to 1.48 years) to a firm where Institutional Duration is a standard deviation (0.57) higher (equal to 1.48+0.57 = 2.05 years). The results in column 2 suggest that the adoption of a staggered board is associated with an increase in Tobin’s Q
68. See Cremers & Sepe, supra note 8, at 100–05; Cremers, Litov & Sepe, supra note 13. 69. See Cremers, Masconale & Sepe, supra note 10, at 769, 772–74.
416 Seattle University Law Review [Vol. 41:387
of 12.3% for firms with average Institutional Duration70 and with an increase in Tobin’s Q of 16% for firms where Institutional Duration is a standard deviation higher.71 This result is also robust to using other proxies of investment horizon as shown by columns 6 and 7 (respectively documenting results for Institutional Portfolio Duration and Institutional Turnover).
The results on the increased value of adopting a staggered board in the presence of more patient institutional capital are, again, consistent with the results we obtained in our prior staggered board research.72 This research shows that the staggered board serves a constructive governance function, as the limits it imposes on the ability of shareholders to intervene in corporate decision-making result from mutual agreement between the board and the shareholders.73 This function commits shareholders to preserve a board’s authority to exploit competitive private information in the short term when it is more likely that market prices may fail to fully incorporate such information (and, therefore, fail to serve as an efficient information focal point for shareholder governance interventions).74 Under this view, the fact that firms with a staggered board and more patient investors exhibit successful financial performance confirms staggered boards add value by ensuring that investors give managers sufficient time to develop latent assets (that is, long-term strategies), rather than evaluate managerial performance after relatively briefs periods of time.
Conversely, the adoption of a poison pill continues to be negatively associated with firm value even when combined with patient capital as shown by the negative coefficient we obtain for Poison Pill*Proxy of Investment Horizon in column 3 (in which we use Institutional Duration to measure institutional holding periods). This finding provides additional confirmation to our inference that poison pills, as unilateral devices that are not the result of an agreement with shareholders, are more likely to reflect managerial moral hazard.
The other major result we obtain in examining the financial value impact of institutional investor behavior and corporate governance features is that when investors have longer investment horizons but are more active, the positive effect of the staggered board on firm value decreases (although the overall effect remains positive). As shown in column 5 (in which we use Institutional Duration to measure institutional holding periods), the coefficient for Institutional Active Share*Staggered 70. The percentage estimated is obtained as follows: 2.75%+(0.0646*1.48) = 12.3%. 71. The percentage estimated is obtained as follows: 2.75%+(0.0646*2.05) = 16%. 72. See Cremers, Masconale & Sepe, supra note 10, at 769–71. 73. See id. 74. See id.
2018] Investors, Governance, and Firm Value 417
Board*Proxy of Investment Horizon is negative. A possible interpretation of this result is that when investors show signs of impatience by being more active, the relationship between the board of directors and the shareholders is disrupted and falls out of the equilibrium path, so the staggered board can no longer serve a constructive function and commit investors to the longer term.
CONCLUDING REMARKS
Our analysis of aggregate institutional investor behavior has generated insights on the short-term versus long-term debate in corporate governance, in addition to providing a framework for future work on institutional investor behavior. First, our study suggests that as empirical results need to be convincingly interpreted through theoretical explanations, so too do theoretical predictions need to be verified through an examination of the empirical evidence when data is available. Indeed, far from the picture of homogenously “good” or “bad” institutional investors commonly depicted by contenders in the short- versus long-term debate, we find that different firm characteristics are associated with different investor behaviors. We also find that institutional investors’ attitudes toward activism play a role in influencing investment horizon preferences.
Second, our results call for further research into the individual classes of institutional investors and the relationship existing between governance features and both aggregate and individual institutional behavior. For example, the evidence that active institutional investors exhibit more short-term preferences seems in line with prior results we obtained on hedge fund behavior.75 This suggests that studying the behavior of other classes of institutional investors, such as banks, insurance companies, mutual funds, and the like, against the benchmark of aggregate institutional behavior could help further our understanding of the role played by institutional ownership in the corporation’s inter-temporal choices.
Third, our results suggest that further investigation of the dynamics linking firm and governance characteristics to both aggregate and individual institutional behavior could help ensure that academic recommendations to policy makers are grounded in robust empirical results and solid theoretical interpretations. To this respect, this Article has focused on exploring the association between defensive measures and aggregate institutional behavior. Empirically, it has documented that staggered boards and poison pills have radically different implications for
75. See Cremers et al., supra note 6.
418 Seattle University Law Review [Vol. 41:387
both institutional investor behavior per se and its interacted impact on firm value. Theoretically, it has drawn on our prior research and provided a plausible explanation for these results, suggesting that these different implications are a by-product of the differing nature of staggered boards and poison pills as bilateral and unilateral defensive measures, respectively. Extending this approach to other governance features would be beneficial to abandoning current partisan positions and promoting optimal solutions to the corporation’s inter-temporal issues.