Institutional Investor Cliques and Governance: Internet ...awkoch/CKM_Internet...
23
Institutional Investor Cliques and Governance: Internet Appendix Alan D. Crane Jones Graduate School of Business Rice University Andrew Koch Katz Graduate School of Business University of Pittsburgh S´ ebastien Michenaud Driehaus College of Business DePaul University Email addresses: [email protected] (Alan D. Crane), [email protected] (Andrew Koch), [email protected] (S´ ebastien Michenaud) June 22, 2017
Transcript of Institutional Investor Cliques and Governance: Internet ...awkoch/CKM_Internet...
Institutional Investor Cliques and Governance:
Internet Appendix
Alan D. Crane
Jones Graduate School of Business
Rice University
Andrew Koch
Katz Graduate School of Business
University of Pittsburgh
Sebastien Michenaud
Driehaus College of BusinessDePaul University
Email addresses: [email protected] (Alan D. Crane), [email protected] (Andrew Koch),[email protected] (Sebastien Michenaud)
June 22, 2017
Internet Appendix toInstitutional Investor Cliques and Governance
This Internet Appendix presents results from additional analysis discussed in the paper as
well as robustness tables for an alternative measure of coordinated ownership. Section IA-1
presents additional results discussed by not tabulated in the paper. Section IA-2 provides
a description of an alternative measure of institutional coordination, the cluster coefficient.
Section IA-3 presents results using the alternative measure. Finally, Section IA-4 presents
results using clique ownership calculated exclusive of block positions.
IA-1. Additional Results Discussed in Draft
1. Table IA-1.1 presents the variation in institutional characteristics across all institutions
and across institutions within the same clique.
2. Table IA-1.2 presents first stage regression from the IV estimate in Table 5.
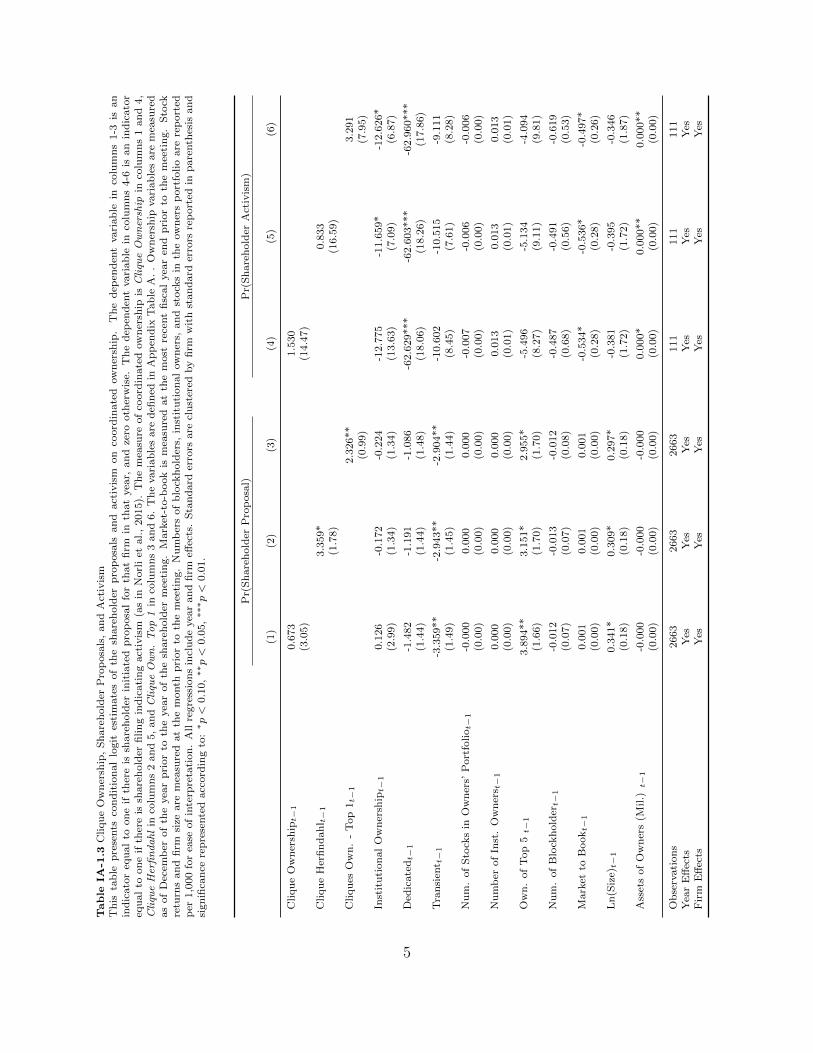
3. Table IA-1.3 presents estimates of the probability of shareholder proposals and proxy
fights on measures of clique ownership.
4. Table IA-1.4 replicates results in Crane and Koch (2016), examining differences in
ownership structure caused by a loss of a coordination mechanism. We present cross-
sectional differences in this response as a function Clique Onwership.
1
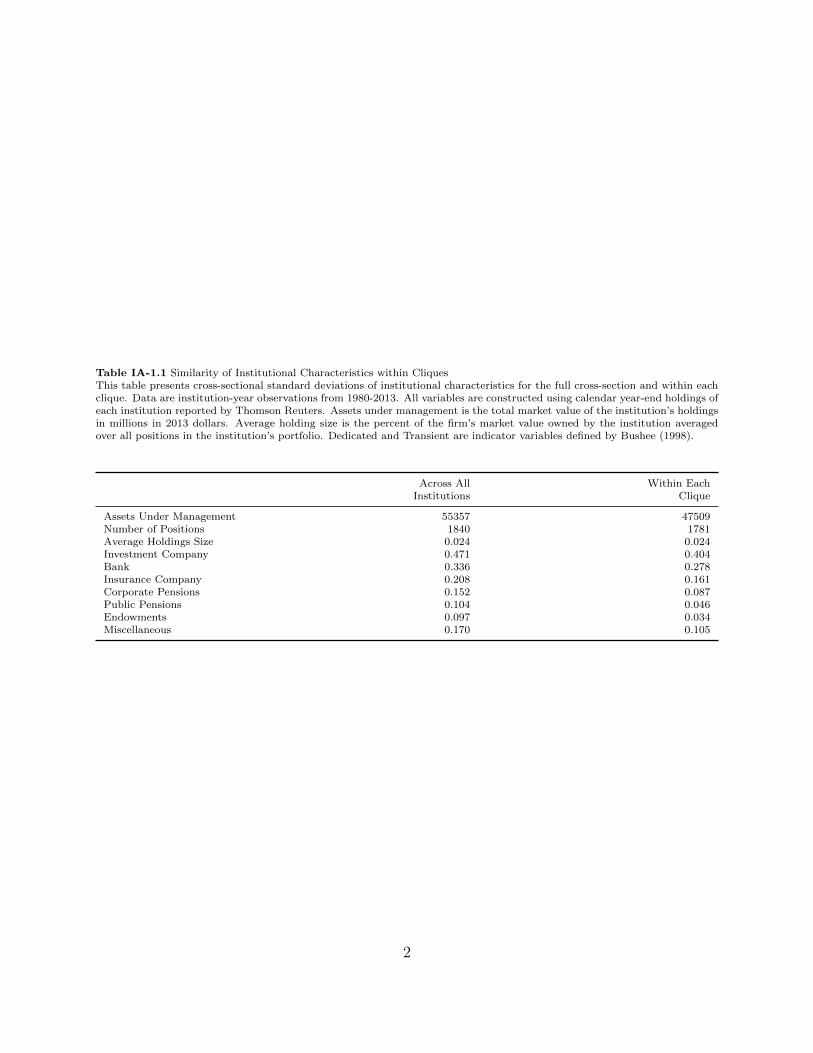
Table IA-1.1 Similarity of Institutional Characteristics within CliquesThis table presents cross-sectional standard deviations of institutional characteristics for the full cross-section and within eachclique. Data are institution-year observations from 1980-2013. All variables are constructed using calendar year-end holdings ofeach institution reported by Thomson Reuters. Assets under management is the total market value of the institution’s holdingsin millions in 2013 dollars. Average holding size is the percent of the firm’s market value owned by the institution averagedover all positions in the institution’s portfolio. Dedicated and Transient are indicator variables defined by Bushee (1998).
Across All Within EachInstitutions Clique
Assets Under Management 55357 47509Number of Positions 1840 1781Average Holdings Size 0.024 0.024Investment Company 0.471 0.404Bank 0.336 0.278Insurance Company 0.208 0.161Corporate Pensions 0.152 0.087Public Pensions 0.104 0.046Endowments 0.097 0.034Miscellaneous 0.170 0.105
2
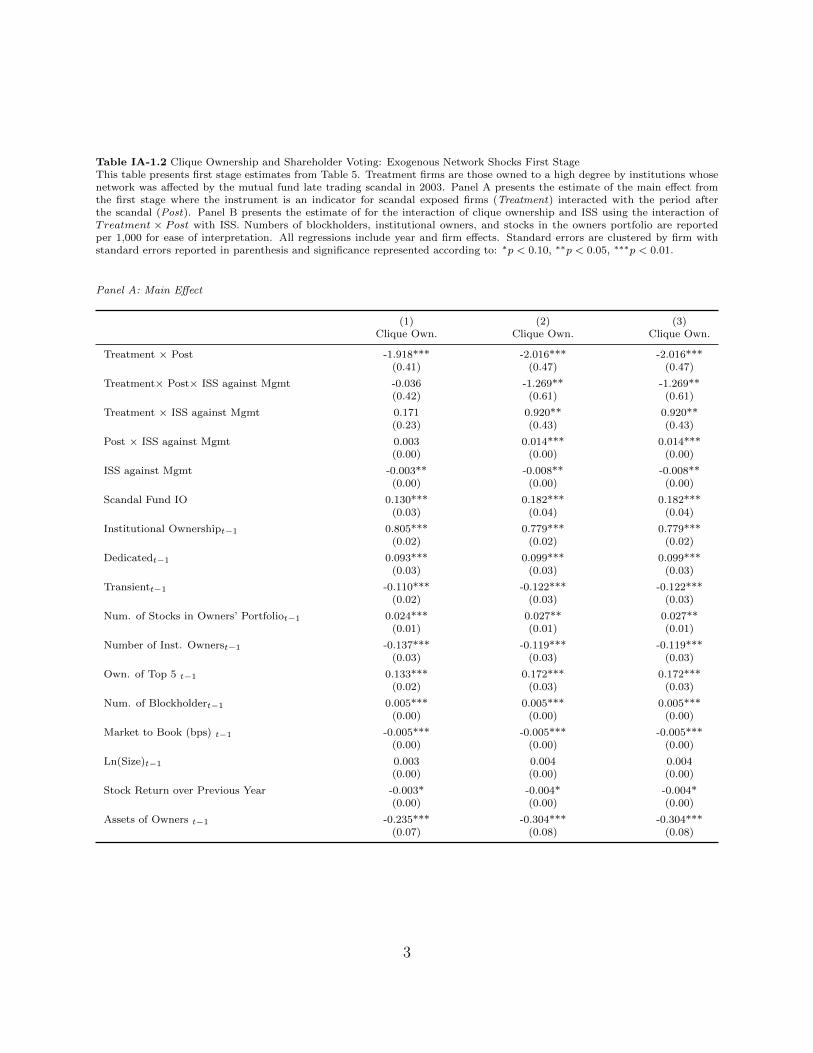
Table IA-1.2 Clique Ownership and Shareholder Voting: Exogenous Network Shocks First StageThis table presents first stage estimates from Table 5. Treatment firms are those owned to a high degree by institutions whosenetwork was affected by the mutual fund late trading scandal in 2003. Panel A presents the estimate of the main effect fromthe first stage where the instrument is an indicator for scandal exposed firms (Treatment) interacted with the period afterthe scandal (Post). Panel B presents the estimate of for the interaction of clique ownership and ISS using the interaction ofTreatment × Post with ISS. Numbers of blockholders, institutional owners, and stocks in the owners portfolio are reportedper 1,000 for ease of interpretation. All regressions include year and firm effects. Standard errors are clustered by firm withstandard errors reported in parenthesis and significance represented according to: ∗p < 0.10, ∗∗p < 0.05, ∗∗∗p < 0.01.
Panel A: Main Effect
(1) (2) (3)Clique Own. Clique Own. Clique Own.
Treatment × Post -1.918*** -2.016*** -2.016***(0.41) (0.47) (0.47)
Treatment× Post× ISS against Mgmt -0.036 -1.269** -1.269**(0.42) (0.61) (0.61)
Treatment × ISS against Mgmt 0.171 0.920** 0.920**(0.23) (0.43) (0.43)
Post × ISS against Mgmt 0.003 0.014*** 0.014***(0.00) (0.00) (0.00)
ISS against Mgmt -0.003** -0.008** -0.008**(0.00) (0.00) (0.00)
Scandal Fund IO 0.130*** 0.182*** 0.182***(0.03) (0.04) (0.04)
Institutional Ownershipt−1 0.805*** 0.779*** 0.779***(0.02) (0.02) (0.02)
Dedicatedt−1 0.093*** 0.099*** 0.099***(0.03) (0.03) (0.03)
Transientt−1 -0.110*** -0.122*** -0.122***(0.02) (0.03) (0.03)
Num. of Stocks in Owners’ Portfoliot−1 0.024*** 0.027** 0.027**(0.01) (0.01) (0.01)
Number of Inst. Ownerst−1 -0.137*** -0.119*** -0.119***(0.03) (0.03) (0.03)
Own. of Top 5 t−1 0.133*** 0.172*** 0.172***(0.02) (0.03) (0.03)
Num. of Blockholdert−1 0.005*** 0.005*** 0.005***(0.00) (0.00) (0.00)
Market to Book (bps) t−1 -0.005*** -0.005*** -0.005***(0.00) (0.00) (0.00)
Ln(Size)t−1 0.003 0.004 0.004(0.00) (0.00) (0.00)
Stock Return over Previous Year -0.003* -0.004* -0.004*(0.00) (0.00) (0.00)
Assets of Owners t−1 -0.235*** -0.304*** -0.304***(0.07) (0.08) (0.08)
3
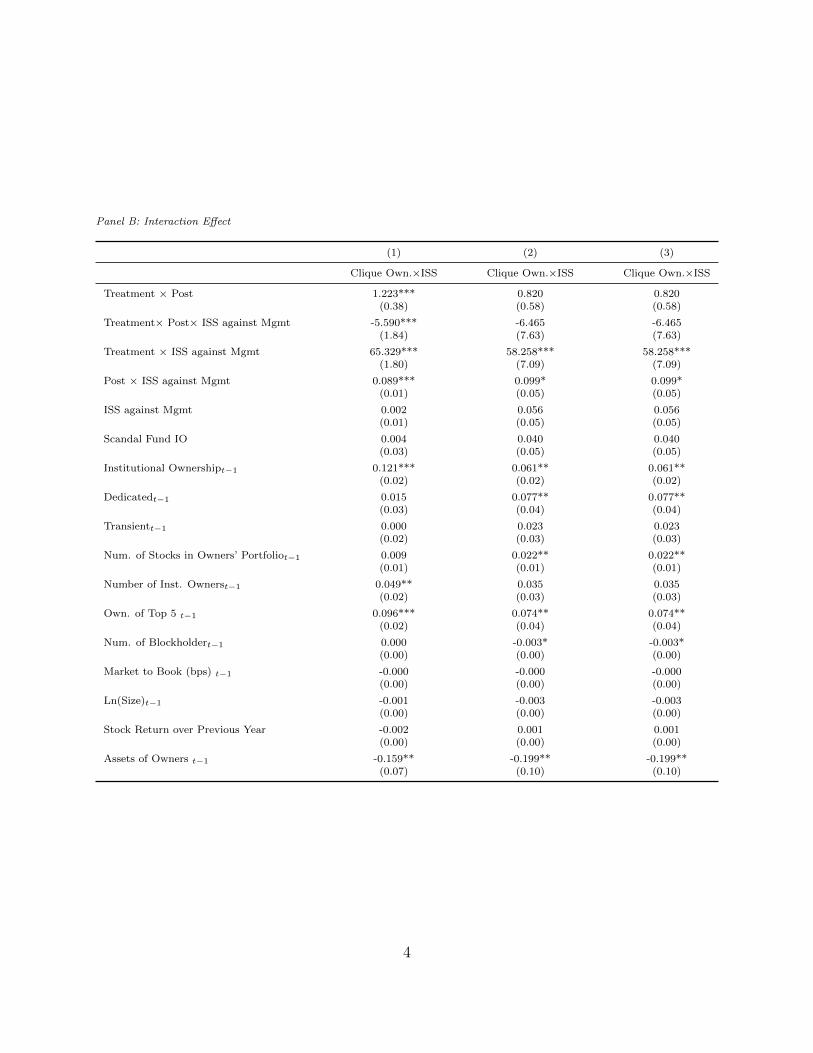
Panel B: Interaction Effect
(1) (2) (3)
Clique Own.×ISS Clique Own.×ISS Clique Own.×ISS
Treatment × Post 1.223*** 0.820 0.820(0.38) (0.58) (0.58)
Treatment× Post× ISS against Mgmt -5.590*** -6.465 -6.465(1.84) (7.63) (7.63)
Treatment × ISS against Mgmt 65.329*** 58.258*** 58.258***(1.80) (7.09) (7.09)
Post × ISS against Mgmt 0.089*** 0.099* 0.099*(0.01) (0.05) (0.05)
ISS against Mgmt 0.002 0.056 0.056(0.01) (0.05) (0.05)
Scandal Fund IO 0.004 0.040 0.040(0.03) (0.05) (0.05)
Institutional Ownershipt−1 0.121*** 0.061** 0.061**(0.02) (0.02) (0.02)
Dedicatedt−1 0.015 0.077** 0.077**(0.03) (0.04) (0.04)
Transientt−1 0.000 0.023 0.023(0.02) (0.03) (0.03)
Num. of Stocks in Owners’ Portfoliot−1 0.009 0.022** 0.022**(0.01) (0.01) (0.01)
Number of Inst. Ownerst−1 0.049** 0.035 0.035(0.02) (0.03) (0.03)
Own. of Top 5 t−1 0.096*** 0.074** 0.074**(0.02) (0.04) (0.04)
Num. of Blockholdert−1 0.000 -0.003* -0.003*(0.00) (0.00) (0.00)
Market to Book (bps) t−1 -0.000 -0.000 -0.000(0.00) (0.00) (0.00)
Ln(Size)t−1 -0.001 -0.003 -0.003(0.00) (0.00) (0.00)
Stock Return over Previous Year -0.002 0.001 0.001(0.00) (0.00) (0.00)
Assets of Owners t−1 -0.159** -0.199** -0.199**(0.07) (0.10) (0.10)
4
Table
IA-1
.3C
liqu
eO
wn
ersh
ip,
Sh
are
hold
erP
rop
osa
ls,
an
dA
ctiv
ism
Th
ista
ble
pre
sents
con
dit
ion
al
logit
esti
mate
sof
the
share
hold
erp
rop
osa
lsan
dact
ivis
mon
coord
inate
dow
ner
ship
.T
he
dep
end
ent
vari
ab
lein
colu
mn
s1-3
isan
ind
icato
req
ual
toon
eif
ther
eis
share
hold
erin
itia
ted
pro
posa
lfo
rth
at
firm
inth
at
yea
r,an
dze
rooth
erw
ise.
Th
ed
epen
den
tvari
ab
lein
colu
mn
s4-6
isan
ind
icato
req
ual
toon
eif
ther
eis
share
hold
erfi
lin
gin
dic
ati
ng
act
ivis
m(a
sin
Norl
iet
al.,
2015).
Th
em
easu
reof
coord
inate
dow
ner
ship
isC
liqu
eO
wn
ersh
ipin
colu
mn
s1
an
d4,
Cli
que
Her
fin
da
hl
inco
lum
ns
2an
d5,
an
dC
liqu
eO
wn
.T
op
1in
colu
mn
s3
an
d6.
Th
evari
ab
les
are
defi
ned
inA
pp
end
ixT
ab
leA
..
Ow
ner
ship
vari
ab
les
are
mea
sure
das
of
Dec
emb
erof
the
yea
rp
rior
toth
eyea
rof
the
share
hold
erm
eeti
ng.
Mark
et-t
o-b
ook
ism
easu
red
at
the
most
rece
nt
fisc
al
yea
ren
dp
rior
toth
em
eeti
ng.
Sto
ckre
turn
san
dfi
rmsi
zeare
mea
sure
dat
the
month
pri
or
toth
em
eeti
ng.
Nu
mb
ers
of
blo
ckh
old
ers,
inst
itu
tion
al
ow
ner
s,an
dst
ock
sin
the
ow
ner
sp
ort
folio
are
rep
ort
edp
er1,0
00
for
ease
of
inte
rpre
tati
on
.A
llre
gre
ssio
ns
incl
ud
eyea
ran
dfi
rmeff
ects
.S
tan
dard
erro
rsare
clu
ster
edby
firm
wit
hst
an
dard
erro
rsre
port
edin
pare
nth
esis
an
dsi
gn
ifica
nce
rep
rese
nte
dacc
ord
ing
to:
∗p<
0.1
0,∗∗p<
0.0
5,∗∗
∗p<
0.0
1.
Pr(
Sh
are
hold
erP
rop
osa
l)P
r(S
hare
hold
erA
ctiv
ism
)
(1)
(2)
(3)
(4)
(5)
(6)
Cliqu
eO
wn
ersh
ipt−
10.6
73
1.5
30
(3.0
5)
(14.4
7)
Cliqu
eH
erfi
nd
ah
l t−
13.3
59*
0.8
33
(1.7
8)
(16.5
9)
Cliqu
esO
wn
.-
Top
1t−
12.3
26**
3.2
91
(0.9
9)
(7.9
5)
Inst
itu
tion
al
Ow
ner
ship
t−1
0.1
26
-0.1
72
-0.2
24
-12.7
75
-11.6
59*
-12.6
26*
(2.9
9)
(1.3
4)
(1.3
4)
(13.6
3)
(7.0
9)
(6.8
7)
Ded
icate
dt−
1-1
.482
-1.1
91
-1.0
86
-62.6
29***
-62.6
03***
-62.9
60***
(1.4
4)
(1.4
4)
(1.4
8)
(18.0
6)
(18.2
6)
(17.8
6)
Tra
nsi
ent t
−1
-3.3
59**
-2.9
43**
-2.9
04**
-10.6
02
-10.5
15
-9.1
11
(1.4
9)
(1.4
5)
(1.4
4)
(8.4
5)
(7.6
1)
(8.2
8)
Nu
m.
of
Sto
cks
inO
wn
ers’
Port
foliot−
1-0
.000
0.0
00
0.0
00
-0.0
07
-0.0
06
-0.0
06
(0.0
0)
(0.0
0)
(0.0
0)
(0.0
0)
(0.0
0)
(0.0
0)
Nu
mb
erof
Inst
.O
wn
ers t
−1
0.0
00
0.0
00
0.0
00
0.0
13
0.0
13
0.0
13
(0.0
0)
(0.0
0)
(0.0
0)
(0.0
1)
(0.0
1)
(0.0
1)
Ow
n.
of
Top
5t−
13.8
94**
3.1
51*
2.9
55*
-5.4
96
-5.1
34
-4.0
94
(1.6
6)
(1.7
0)
(1.7
0)
(8.2
7)
(9.1
1)
(9.8
1)
Nu
m.
of
Blo
ckh
old
ert−
1-0
.012
-0.0
13
-0.0
12
-0.4
87
-0.4
91
-0.6
19
(0.0
7)
(0.0
7)
(0.0
8)
(0.6
8)
(0.5
6)
(0.5
3)
Mark
etto
Bookt−
10.0
01
0.0
01
0.0
01
-0.5
34*
-0.5
36*
-0.4
97*
(0.0
0)
(0.0
0)
(0.0
0)
(0.2
8)
(0.2
8)
(0.2
6)
Ln
(Siz
e)t−
10.3
41*
0.3
09*
0.2
97*
-0.3
81
-0.3
95
-0.3
46
(0.1
8)
(0.1
8)
(0.1
8)
(1.7
2)
(1.7
2)
(1.8
7)
Ass
ets
of
Ow
ner
s(M
il.)
t−1
-0.0
00
-0.0
00
-0.0
00
0.0
00*
0.0
00**
0.0
00**
(0.0
0)
(0.0
0)
(0.0
0)
(0.0
0)
(0.0
0)
(0.0
0)
Ob
serv
ati
on
s2663
2663
2663
111
111
111
Yea
rE
ffec
tsY
esY
esY
esY
esY
esY
esF
irm
Eff
ects
Yes
Yes
Yes
Yes
Yes
Yes
5
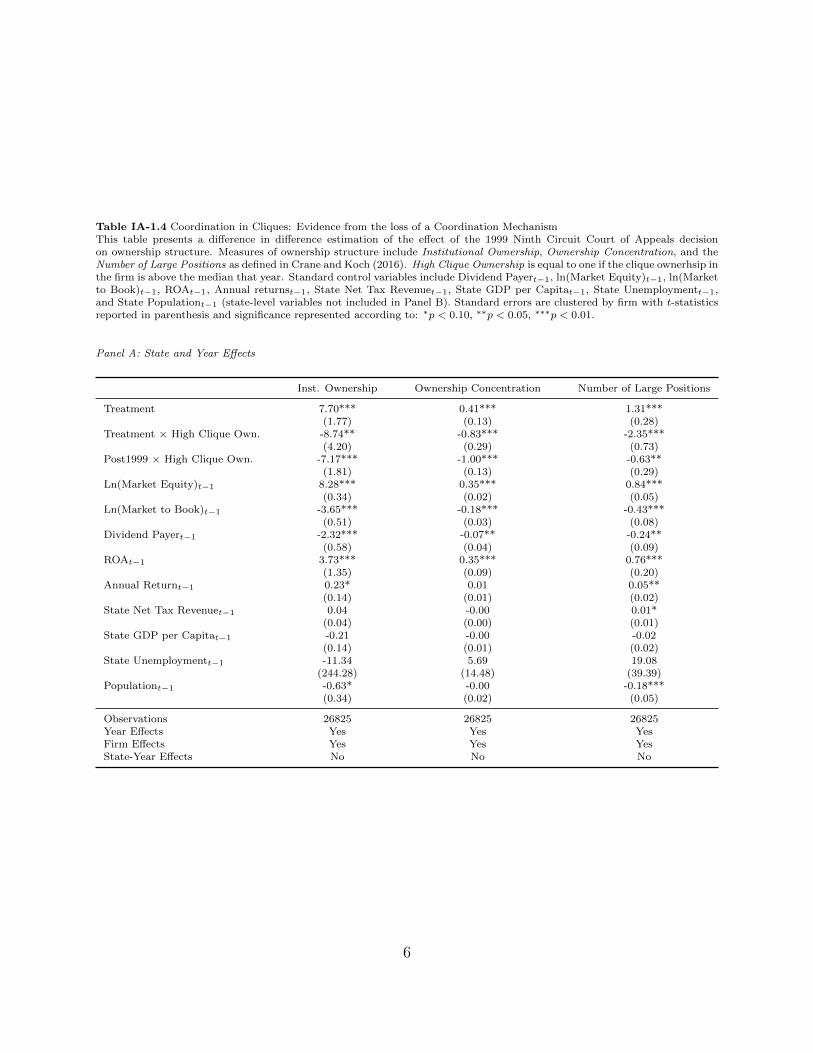
Table IA-1.4 Coordination in Cliques: Evidence from the loss of a Coordination MechanismThis table presents a difference in difference estimation of the effect of the 1999 Ninth Circuit Court of Appeals decisionon ownership structure. Measures of ownership structure include Institutional Ownership, Ownership Concentration, and theNumber of Large Positions as defined in Crane and Koch (2016). High Clique Ownership is equal to one if the clique ownerhsip inthe firm is above the median that year. Standard control variables include Dividend Payert−1, ln(Market Equity)t−1, ln(Marketto Book)t−1, ROAt−1, Annual returnst−1, State Net Tax Revenuet−1, State GDP per Capitat−1, State Unemploymentt−1,and State Populationt−1 (state-level variables not included in Panel B). Standard errors are clustered by firm with t-statisticsreported in parenthesis and significance represented according to: ∗p < 0.10, ∗∗p < 0.05, ∗∗∗p < 0.01.
Panel A: State and Year Effects
Inst. Ownership Ownership Concentration Number of Large Positions
Treatment 7.70*** 0.41*** 1.31***(1.77) (0.13) (0.28)
Treatment × High Clique Own. -8.74** -0.83*** -2.35***(4.20) (0.29) (0.73)
Post1999 × High Clique Own. -7.17*** -1.00*** -0.63**(1.81) (0.13) (0.29)
Ln(Market Equity)t−1 8.28*** 0.35*** 0.84***(0.34) (0.02) (0.05)
Ln(Market to Book)t−1 -3.65*** -0.18*** -0.43***(0.51) (0.03) (0.08)
Dividend Payert−1 -2.32*** -0.07** -0.24**(0.58) (0.04) (0.09)
ROAt−1 3.73*** 0.35*** 0.76***(1.35) (0.09) (0.20)
Annual Returnt−1 0.23* 0.01 0.05**(0.14) (0.01) (0.02)
State Net Tax Revenuet−1 0.04 -0.00 0.01*(0.04) (0.00) (0.01)
State GDP per Capitat−1 -0.21 -0.00 -0.02(0.14) (0.01) (0.02)
State Unemploymentt−1 -11.34 5.69 19.08(244.28) (14.48) (39.39)
Populationt−1 -0.63* -0.00 -0.18***(0.34) (0.02) (0.05)
Observations 26825 26825 26825Year Effects Yes Yes YesFirm Effects Yes Yes YesState-Year Effects No No No
6
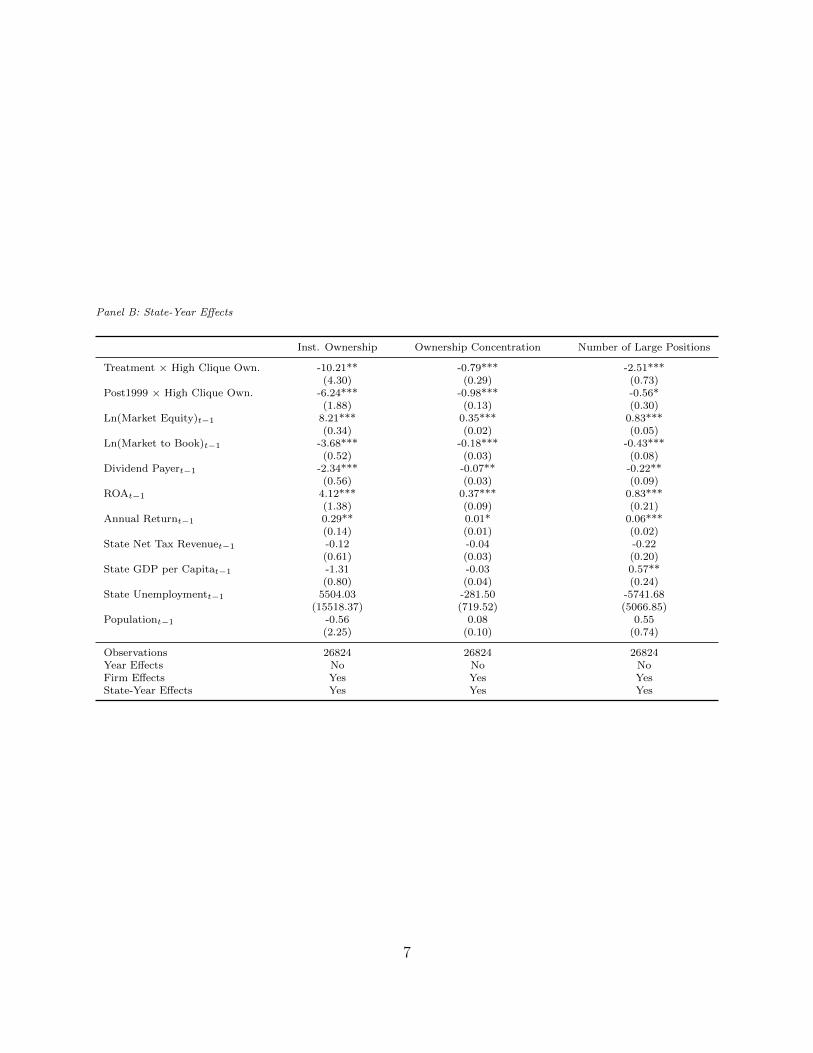
Panel B: State-Year Effects
Inst. Ownership Ownership Concentration Number of Large Positions
Treatment × High Clique Own. -10.21** -0.79*** -2.51***(4.30) (0.29) (0.73)
Post1999 × High Clique Own. -6.24*** -0.98*** -0.56*(1.88) (0.13) (0.30)
Ln(Market Equity)t−1 8.21*** 0.35*** 0.83***(0.34) (0.02) (0.05)
Ln(Market to Book)t−1 -3.68*** -0.18*** -0.43***(0.52) (0.03) (0.08)
Dividend Payert−1 -2.34*** -0.07** -0.22**(0.56) (0.03) (0.09)
ROAt−1 4.12*** 0.37*** 0.83***(1.38) (0.09) (0.21)
Annual Returnt−1 0.29** 0.01* 0.06***(0.14) (0.01) (0.02)
State Net Tax Revenuet−1 -0.12 -0.04 -0.22(0.61) (0.03) (0.20)
State GDP per Capitat−1 -1.31 -0.03 0.57**(0.80) (0.04) (0.24)
State Unemploymentt−1 5504.03 -281.50 -5741.68(15518.37) (719.52) (5066.85)
Populationt−1 -0.56 0.08 0.55(2.25) (0.10) (0.74)
Observations 26824 26824 26824Year Effects No No NoFirm Effects Yes Yes YesState-Year Effects Yes Yes Yes
7
IA-2. Description of Alternative Measure
For each institution, the clustering measure for a given year, following Barrat et al.
(2004), is given by:
Clusterwi =1
(∑
j∈Niwijaij)(ki − 1)
∑j,k∈Ni
wij + wik2
aijaikajk (IA.1)
where aij is equal to one if there is edge (at least one overlapping ownership position) between
institutions i and j, wij is the importance weight of that connection (defined in a number
of ways), Ni represents the set of institutions in the neighborhood of i (all institutions with
at least one overlapping positions with institution i), and ki is the total possible number of
connections between institutions in Ni. Therefore, this measure considers not only whether
a connection between an institution-pair exists, but also the strength of the connection.
The cluster coefficient, Clusterwi , is bounded [0,1]. Therefore we use the logit transfor-
mation to identify clustered institutions, proxying for the extent to which a given institution
belongs to a clique.
Clustered institutioni,t = ln(Clusterwi,t
1−Clusterwi,t). (IA.2)
We then aggregate this measure to the firm level:
Cluster Ownershipj,t =N∑i
λi,tClustered institutioni,t (IA.3)
where λi,t is institution i’s percent holdings in firm j at time t.
8
IA-3. Robustness to Alternate Measure: List of Exhibits
We present the following results:
1. Table IA-3.1 presents summary statistics of institutions by quartile of Clustered insti-
tution.
2. Table IA-3.2 presents regressions of Clustered institution on institutional characteris-
tics.
3. Table IA-3.3 presents summary statistics of firm-level observations by quartile of Clus-
tered Ownership.
4. Table IA-3.4 presents regressions of voting outcomes as a function of Cluster Ownership.
This table is analogous to Table 4 of the paper.
5. Table IA-3.5 examines the threat of exit as a function of Cluster Ownership. This table
is analogous to Table 9 of the paper.
6. Table IA-3.6 examines the firm characteristics associated with Cluster Ownership. This
table is analogous to Table 10 of the paper.
9
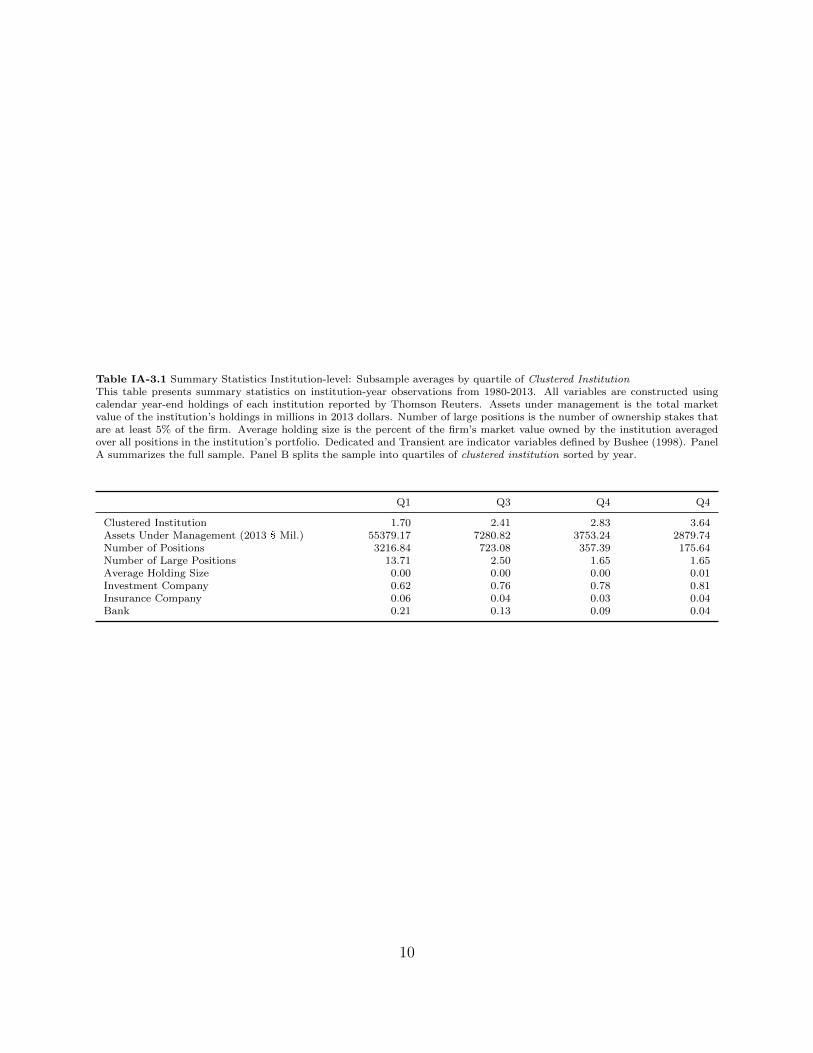
Table IA-3.1 Summary Statistics Institution-level: Subsample averages by quartile of Clustered InstitutionThis table presents summary statistics on institution-year observations from 1980-2013. All variables are constructed usingcalendar year-end holdings of each institution reported by Thomson Reuters. Assets under management is the total marketvalue of the institution’s holdings in millions in 2013 dollars. Number of large positions is the number of ownership stakes thatare at least 5% of the firm. Average holding size is the percent of the firm’s market value owned by the institution averagedover all positions in the institution’s portfolio. Dedicated and Transient are indicator variables defined by Bushee (1998). PanelA summarizes the full sample. Panel B splits the sample into quartiles of clustered institution sorted by year.
Q1 Q3 Q4 Q4
Clustered Institution 1.70 2.41 2.83 3.64Assets Under Management (2013 $ Mil.) 55379.17 7280.82 3753.24 2879.74Number of Positions 3216.84 723.08 357.39 175.64Number of Large Positions 13.71 2.50 1.65 1.65Average Holding Size 0.00 0.00 0.00 0.01Investment Company 0.62 0.76 0.78 0.81Insurance Company 0.06 0.04 0.03 0.04Bank 0.21 0.13 0.09 0.04
10
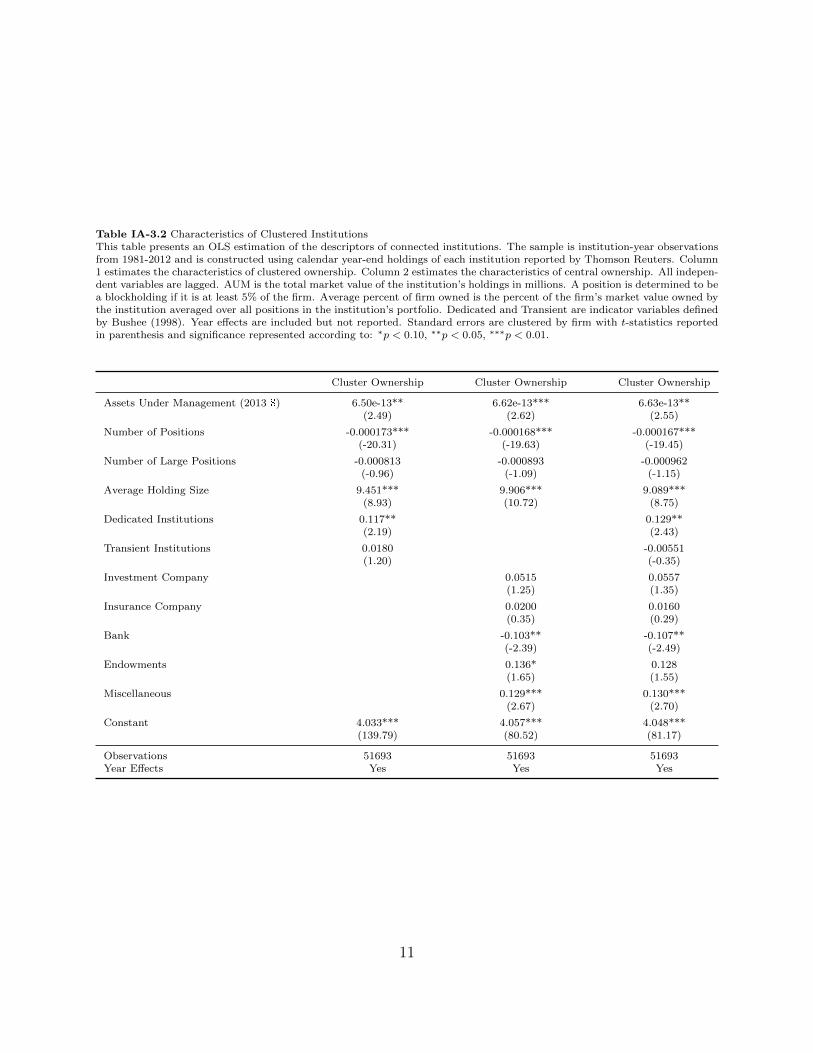
Table IA-3.2 Characteristics of Clustered InstitutionsThis table presents an OLS estimation of the descriptors of connected institutions. The sample is institution-year observationsfrom 1981-2012 and is constructed using calendar year-end holdings of each institution reported by Thomson Reuters. Column1 estimates the characteristics of clustered ownership. Column 2 estimates the characteristics of central ownership. All indepen-dent variables are lagged. AUM is the total market value of the institution’s holdings in millions. A position is determined to bea blockholding if it is at least 5% of the firm. Average percent of firm owned is the percent of the firm’s market value owned bythe institution averaged over all positions in the institution’s portfolio. Dedicated and Transient are indicator variables definedby Bushee (1998). Year effects are included but not reported. Standard errors are clustered by firm with t-statistics reportedin parenthesis and significance represented according to: ∗p < 0.10, ∗∗p < 0.05, ∗∗∗p < 0.01.
Cluster Ownership Cluster Ownership Cluster Ownership
Assets Under Management (2013 $) 6.50e-13** 6.62e-13*** 6.63e-13**(2.49) (2.62) (2.55)
Number of Positions -0.000173*** -0.000168*** -0.000167***(-20.31) (-19.63) (-19.45)
Number of Large Positions -0.000813 -0.000893 -0.000962(-0.96) (-1.09) (-1.15)
Average Holding Size 9.451*** 9.906*** 9.089***(8.93) (10.72) (8.75)
Dedicated Institutions 0.117** 0.129**(2.19) (2.43)
Transient Institutions 0.0180 -0.00551(1.20) (-0.35)
Investment Company 0.0515 0.0557(1.25) (1.35)
Insurance Company 0.0200 0.0160(0.35) (0.29)
Bank -0.103** -0.107**(-2.39) (-2.49)
Endowments 0.136* 0.128(1.65) (1.55)
Miscellaneous 0.129*** 0.130***(2.67) (2.70)
Constant 4.033*** 4.057*** 4.048***(139.79) (80.52) (81.17)
Observations 51693 51693 51693Year Effects Yes Yes Yes
11
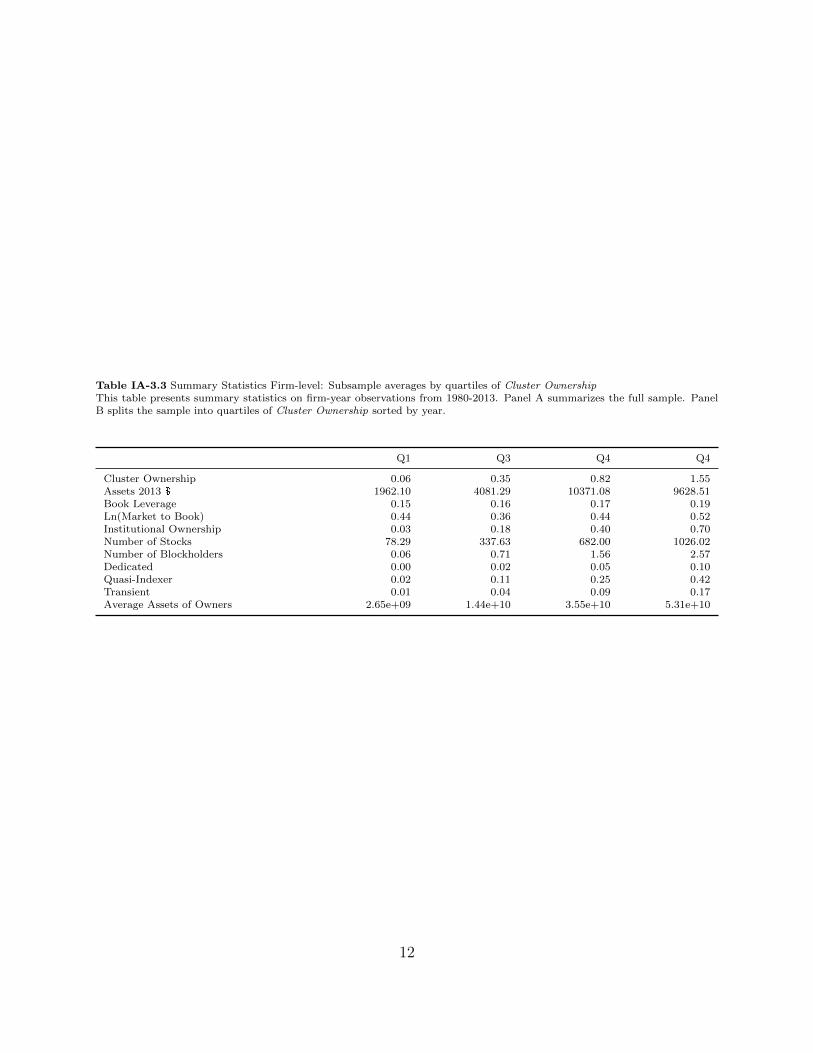
Table IA-3.3 Summary Statistics Firm-level: Subsample averages by quartiles of Cluster OwnershipThis table presents summary statistics on firm-year observations from 1980-2013. Panel A summarizes the full sample. PanelB splits the sample into quartiles of Cluster Ownership sorted by year.
Q1 Q3 Q4 Q4
Cluster Ownership 0.06 0.35 0.82 1.55Assets 2013 $ 1962.10 4081.29 10371.08 9628.51Book Leverage 0.15 0.16 0.17 0.19Ln(Market to Book) 0.44 0.36 0.44 0.52Institutional Ownership 0.03 0.18 0.40 0.70Number of Stocks 78.29 337.63 682.00 1026.02Number of Blockholders 0.06 0.71 1.56 2.57Dedicated 0.00 0.02 0.05 0.10Quasi-Indexer 0.02 0.11 0.25 0.42Transient 0.01 0.04 0.09 0.17Average Assets of Owners 2.65e+09 1.44e+10 3.55e+10 5.31e+10
12
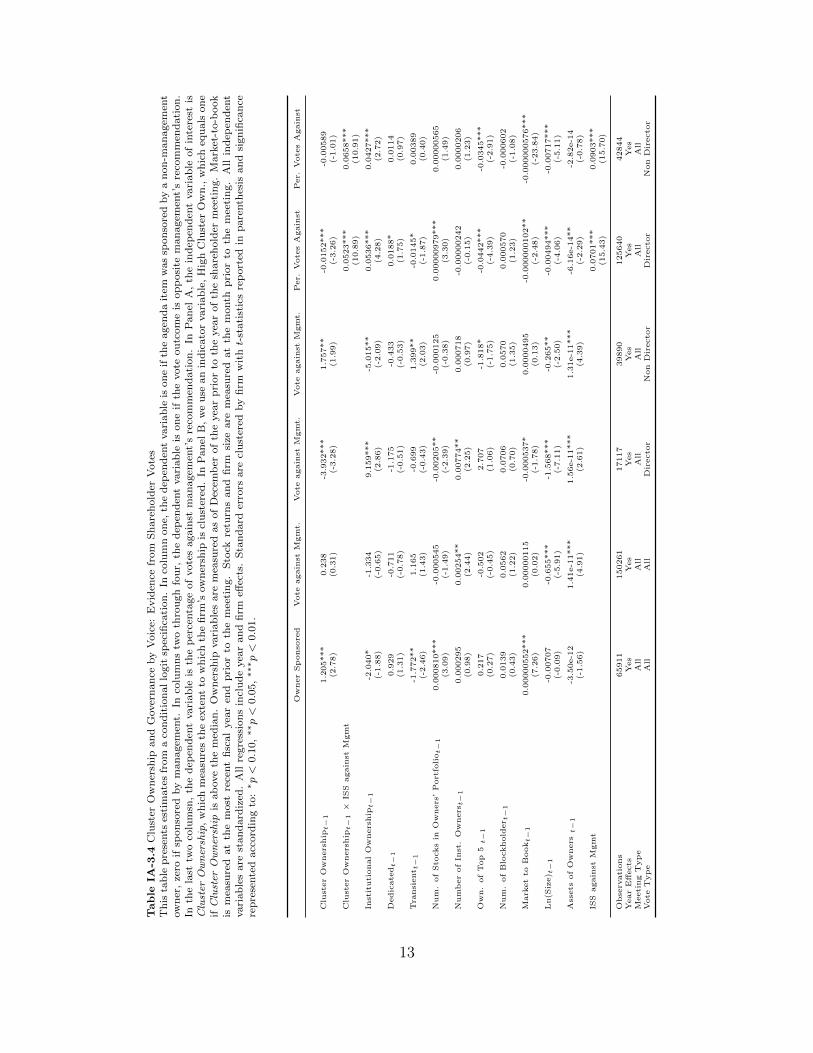
Table
IA-3
.4C
lust
erO
wn
ersh
ipan
dG
over
nan
ceby
Voic
e:E
vid
ence
from
Sh
are
hold
erV
ote
sT
his
tab
lep
rese
nts
esti
mate
sfr
om
aco
nd
itio
nallo
git
spec
ifica
tion
.In
colu
mn
on
e,th
ed
epen
den
tvari
ab
leis
on
eif
the
agen
da
item
was
spon
sore
dby
an
on
-man
agem
ent
ow
ner
,ze
roif
spon
sore
dby
man
agem
ent.
Inco
lum
ns
two
thro
ugh
fou
r,th
ed
epen
den
tvari
ab
leis
on
eif
the
vote
ou
tcom
eis
op
posi
tem
an
agem
ent’
sre
com
men
dati
on
.In
the
last
two
colu
msn
,th
ed
epen
den
tvari
ab
leis
the
per
centa
ge
of
vote
sagain
stm
an
agem
ent’
sre
com
men
dati
on
.In
Pan
elA
,th
ein
dep
end
ent
vari
ab
leof
inte
rest
isC
lust
erO
wn
ersh
ip,
wh
ich
mea
sure
sth
eex
tent
tow
hic
hth
efi
rm’s
ow
ner
ship
iscl
ust
ered
.In
Pan
elB
,w
eu
sean
ind
icato
rvari
ab
le,
Hig
hC
lust
erO
wn
.,w
hic
heq
uals
on
eif
Clu
ster
Ow
ner
ship
isab
ove
the
med
ian
.O
wn
ersh
ipvari
ab
les
are
mea
sure
das
of
Dec
emb
erof
the
yea
rp
rior
toth
eyea
rof
the
share
hold
erm
eeti
ng.
Mark
et-t
o-b
ook
ism
easu
red
at
the
most
rece
nt
fisc
al
yea
ren
dp
rior
toth
em
eeti
ng.
Sto
ckre
turn
san
dfi
rmsi
zeare
mea
sure
dat
the
month
pri
or
toth
em
eeti
ng.
All
ind
epen
den
tvari
ab
les
are
stan
dard
ized
.A
llre
gre
ssio
ns
incl
ud
eyea
ran
dfi
rmeff
ects
.S
tan
dard
erro
rsare
clu
ster
edby
firm
wit
ht-
stati
stic
sre
port
edin
pare
nth
esis
an
dsi
gn
ifica
nce
rep
rese
nte
dacc
ord
ing
to:
∗p<
0.1
0,∗∗p<
0.0
5,∗∗
∗p<
0.0
1.
Ow
ner
Sp
onso
red
Vote
again
stM
gm
t.V
ote
again
stM
gm
t.V
ote
again
stM
gm
t.P
er.
Vote
sA
gain
stP
er.
Vote
sA
gain
st
Clu
ster
Ow
ners
hip
t−
11.2
05***
0.2
38
-3.9
32***
1.7
57**
-0.0
152***
-0.0
0589
(2.7
8)
(0.3
1)
(-3.2
8)
(1.9
9)
(-3.2
6)
(-1.0
1)
Clu
ster
Ow
ners
hip
t−
1×
ISS
again
stM
gm
t0.0
523***
0.0
658***
(10.8
9)
(10.9
1)
Inst
ituti
onal
Ow
ners
hip
t−
1-2
.040*
-1.3
34
9.1
59***
-5.0
15**
0.0
536***
0.0
427***
(-1.8
8)
(-0.6
5)
(2.8
6)
(-2.0
9)
(4.2
8)
(2.7
2)
Dedic
ate
dt−
10.9
29
-0.7
11
-1.1
75
-0.4
33
0.0
188*
0.0
114
(1.3
1)
(-0.7
8)
(-0.5
1)
(-0.5
3)
(1.7
5)
(0.9
7)
Tra
nsi
ent t
−1
-1.7
72**
1.1
65
-0.6
99
1.3
99**
-0.0
145*
0.0
0389
(-2.4
6)
(1.4
3)
(-0.4
3)
(2.0
3)
(-1.8
7)
(0.4
0)
Num
.of
Sto
cks
inO
wners
’P
ort
foliot−
10.0
00810***
-0.0
00545
-0.0
0205**
-0.0
00125
0.0
0000979***
0.0
0000565
(3.0
9)
(-1.4
9)
(-2.3
9)
(-0.3
8)
(3.3
0)
(1.4
9)
Num
ber
of
Inst
.O
wners
t−
10.0
00295
0.0
0254**
0.0
0774**
0.0
00718
-0.0
0000242
0.0
000206
(0.9
8)
(2.4
4)
(2.2
5)
(0.9
7)
(-0.1
5)
(1.2
3)
Ow
n.
of
Top
5t−
10.2
17
-0.5
02
2.7
07
-1.8
18*
-0.0
442***
-0.0
345***
(0.2
7)
(-0.4
5)
(1.0
6)
(-1.7
5)
(-4.3
9)
(-2.9
1)
Num
.of
Blo
ckhold
er t
−1
0.0
139
0.0
562
0.0
706
0.0
570
0.0
00570
-0.0
00602
(0.4
3)
(1.2
2)
(0.7
0)
(1.3
5)
(1.2
3)
(-1.0
8)
Mark
et
toB
ookt−
10.0
0000552***
0.0
0000115
-0.0
00537*
0.0
000495
-0.0
00000102**
-0.0
00000576***
(7.2
6)
(0.0
2)
(-1.7
8)
(0.1
3)
(-2.4
8)
(-23.8
4)
Ln(S
ize) t
−1
-0.0
0707
-0.6
55***
-1.5
68***
-0.2
65**
-0.0
0494***
-0.0
0717***
(-0.0
9)
(-5.9
1)
(-7.1
1)
(-2.5
0)
(-4.0
6)
(-5.1
1)
Ass
ets
of
Ow
ners
t−
1-3
.50e-1
21.4
1e-1
1***
1.5
6e-1
1***
1.3
1e-1
1***
-6.1
6e-1
4**
-2.8
2e-1
4(-
1.5
6)
(4.9
1)
(2.6
1)
(4.3
9)
(-2.2
9)
(-0.7
8)
ISS
again
stM
gm
t0.0
701***
0.0
903***
(15.4
3)
(15.7
0)
Obse
rvati
ons
65911
150261
17117
39890
125640
42844
Year
Eff
ects
Yes
Yes
Yes
Yes
Yes
Yes
Meeti
ng
Typ
eA
llA
llA
llA
llA
llA
llV
ote
Typ
eA
llA
llD
irecto
rN
on
Dir
ecto
rD
irecto
rN
on
Dir
ecto
r
13
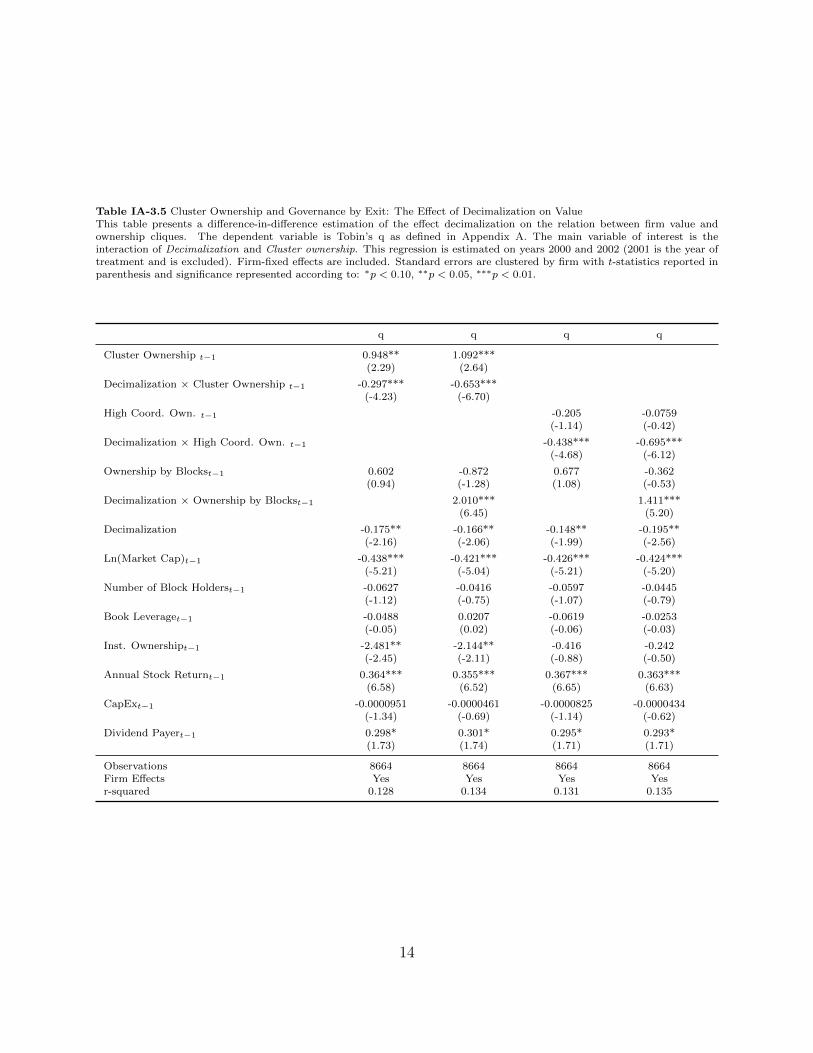
Table IA-3.5 Cluster Ownership and Governance by Exit: The Effect of Decimalization on ValueThis table presents a difference-in-difference estimation of the effect decimalization on the relation between firm value andownership cliques. The dependent variable is Tobin’s q as defined in Appendix A. The main variable of interest is theinteraction of Decimalization and Cluster ownership. This regression is estimated on years 2000 and 2002 (2001 is the year oftreatment and is excluded). Firm-fixed effects are included. Standard errors are clustered by firm with t-statistics reported inparenthesis and significance represented according to: ∗p < 0.10, ∗∗p < 0.05, ∗∗∗p < 0.01.
q q q q
Cluster Ownership t−1 0.948** 1.092***(2.29) (2.64)
Decimalization × Cluster Ownership t−1 -0.297*** -0.653***(-4.23) (-6.70)
High Coord. Own. t−1 -0.205 -0.0759(-1.14) (-0.42)
Decimalization × High Coord. Own. t−1 -0.438*** -0.695***(-4.68) (-6.12)
Ownership by Blockst−1 0.602 -0.872 0.677 -0.362(0.94) (-1.28) (1.08) (-0.53)
Decimalization × Ownership by Blockst−1 2.010*** 1.411***(6.45) (5.20)
Decimalization -0.175** -0.166** -0.148** -0.195**(-2.16) (-2.06) (-1.99) (-2.56)
Ln(Market Cap)t−1 -0.438*** -0.421*** -0.426*** -0.424***(-5.21) (-5.04) (-5.21) (-5.20)
Number of Block Holderst−1 -0.0627 -0.0416 -0.0597 -0.0445(-1.12) (-0.75) (-1.07) (-0.79)
Book Leveraget−1 -0.0488 0.0207 -0.0619 -0.0253(-0.05) (0.02) (-0.06) (-0.03)
Inst. Ownershipt−1 -2.481** -2.144** -0.416 -0.242(-2.45) (-2.11) (-0.88) (-0.50)
Annual Stock Returnt−1 0.364*** 0.355*** 0.367*** 0.363***(6.58) (6.52) (6.65) (6.63)
CapExt−1 -0.0000951 -0.0000461 -0.0000825 -0.0000434(-1.34) (-0.69) (-1.14) (-0.62)
Dividend Payert−1 0.298* 0.301* 0.295* 0.293*(1.73) (1.74) (1.71) (1.71)
Observations 8664 8664 8664 8664Firm Effects Yes Yes Yes Yesr-squared 0.128 0.134 0.131 0.135
14
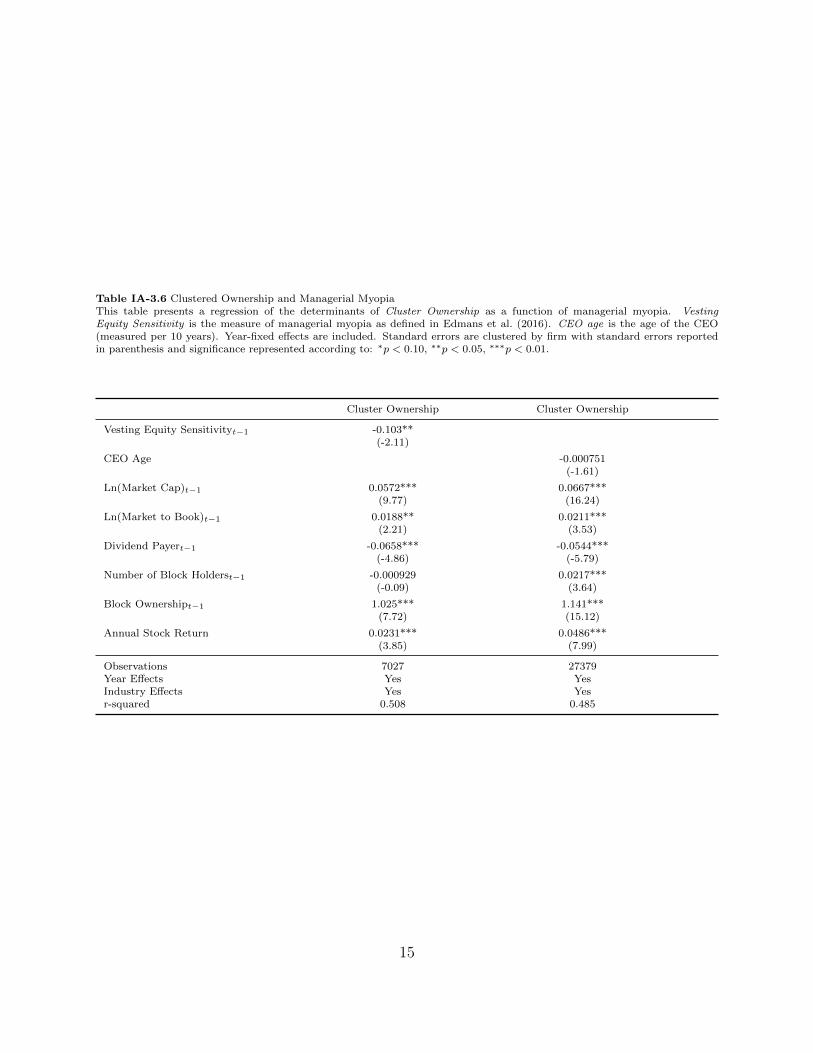
Table IA-3.6 Clustered Ownership and Managerial MyopiaThis table presents a regression of the determinants of Cluster Ownership as a function of managerial myopia. VestingEquity Sensitivity is the measure of managerial myopia as defined in Edmans et al. (2016). CEO age is the age of the CEO(measured per 10 years). Year-fixed effects are included. Standard errors are clustered by firm with standard errors reportedin parenthesis and significance represented according to: ∗p < 0.10, ∗∗p < 0.05, ∗∗∗p < 0.01.
Cluster Ownership Cluster Ownership
Vesting Equity Sensitivityt−1 -0.103**(-2.11)
CEO Age -0.000751(-1.61)
Ln(Market Cap)t−1 0.0572*** 0.0667***(9.77) (16.24)
Ln(Market to Book)t−1 0.0188** 0.0211***(2.21) (3.53)
Dividend Payert−1 -0.0658*** -0.0544***(-4.86) (-5.79)
Number of Block Holderst−1 -0.000929 0.0217***(-0.09) (3.64)
Block Ownershipt−1 1.025*** 1.141***(7.72) (15.12)
Annual Stock Return 0.0231*** 0.0486***(3.85) (7.99)
Observations 7027 27379Year Effects Yes YesIndustry Effects Yes Yesr-squared 0.508 0.485
15
IA-4. Robustness to Sample Excluding Block Positions: List of Exhibits
This section repeats our analysis excluding block positions. That is, we only use the block
positions to define cliques. We then exclude all such positions from our clique ownership
variables of interest in subsequent analysis. We present the following results:
1. Table IA-4.1 presents firm-level summary statistics where clique ownership variables
exclude block positions.
2. Table IA-4.2 presents regressions of voting outcomes as a function of clique ownership
exclusive of blocks. This table is analogous to Table 4 of the paper.
3. Table 5 presents regression of voting outcomes as a function of instrumented clique
ownership exclusive of blocks. This table is analogous to Table 5 of the paper.
4. Table IA-4.4 examines the threat of exit as a function of clique ownership exclusive of
blocks. This table is analogous to Table 9 of the paper.
5. Table IA-4.5 examines the firm characteristics associated with clique ownership exclu-
sive of blocks. This table is analogous to Table 10 of the paper.
16
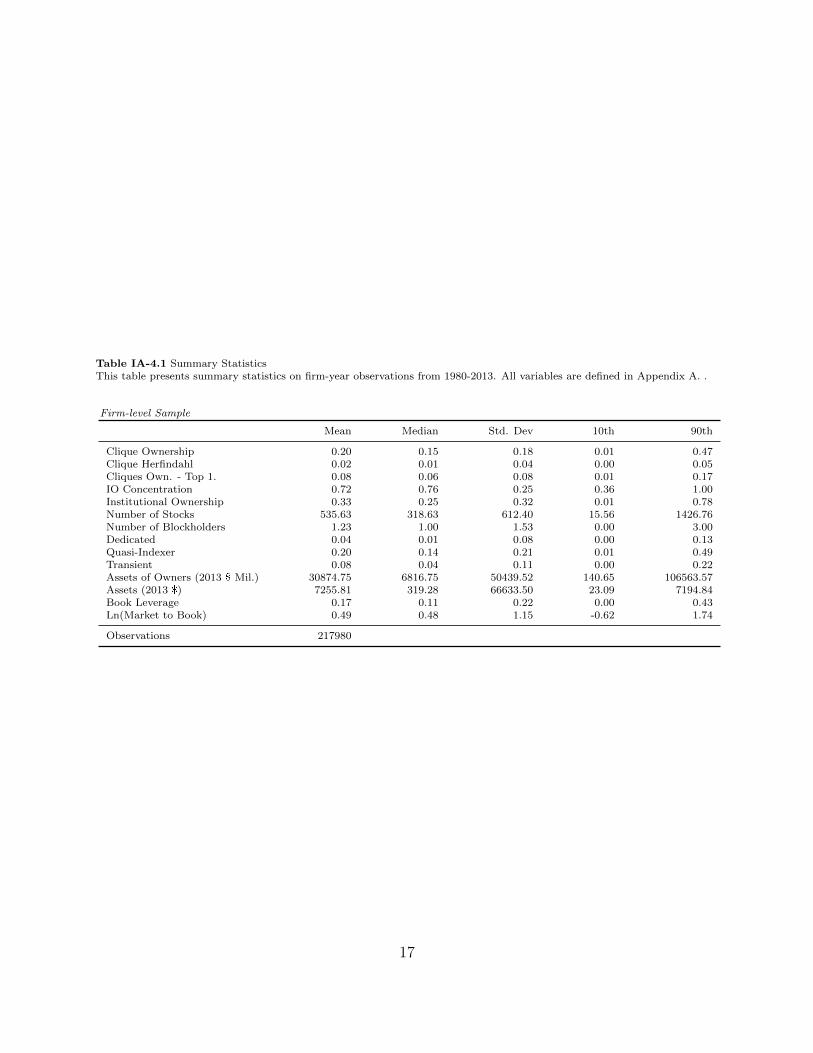
Table IA-4.1 Summary StatisticsThis table presents summary statistics on firm-year observations from 1980-2013. All variables are defined in Appendix A. .
Firm-level Sample
Mean Median Std. Dev 10th 90th
Clique Ownership 0.20 0.15 0.18 0.01 0.47Clique Herfindahl 0.02 0.01 0.04 0.00 0.05Cliques Own. - Top 1. 0.08 0.06 0.08 0.01 0.17IO Concentration 0.72 0.76 0.25 0.36 1.00Institutional Ownership 0.33 0.25 0.32 0.01 0.78Number of Stocks 535.63 318.63 612.40 15.56 1426.76Number of Blockholders 1.23 1.00 1.53 0.00 3.00Dedicated 0.04 0.01 0.08 0.00 0.13Quasi-Indexer 0.20 0.14 0.21 0.01 0.49Transient 0.08 0.04 0.11 0.00 0.22Assets of Owners (2013 $ Mil.) 30874.75 6816.75 50439.52 140.65 106563.57Assets (2013 $) 7255.81 319.28 66633.50 23.09 7194.84Book Leverage 0.17 0.11 0.22 0.00 0.43Ln(Market to Book) 0.49 0.48 1.15 -0.62 1.74
Observations 217980
17
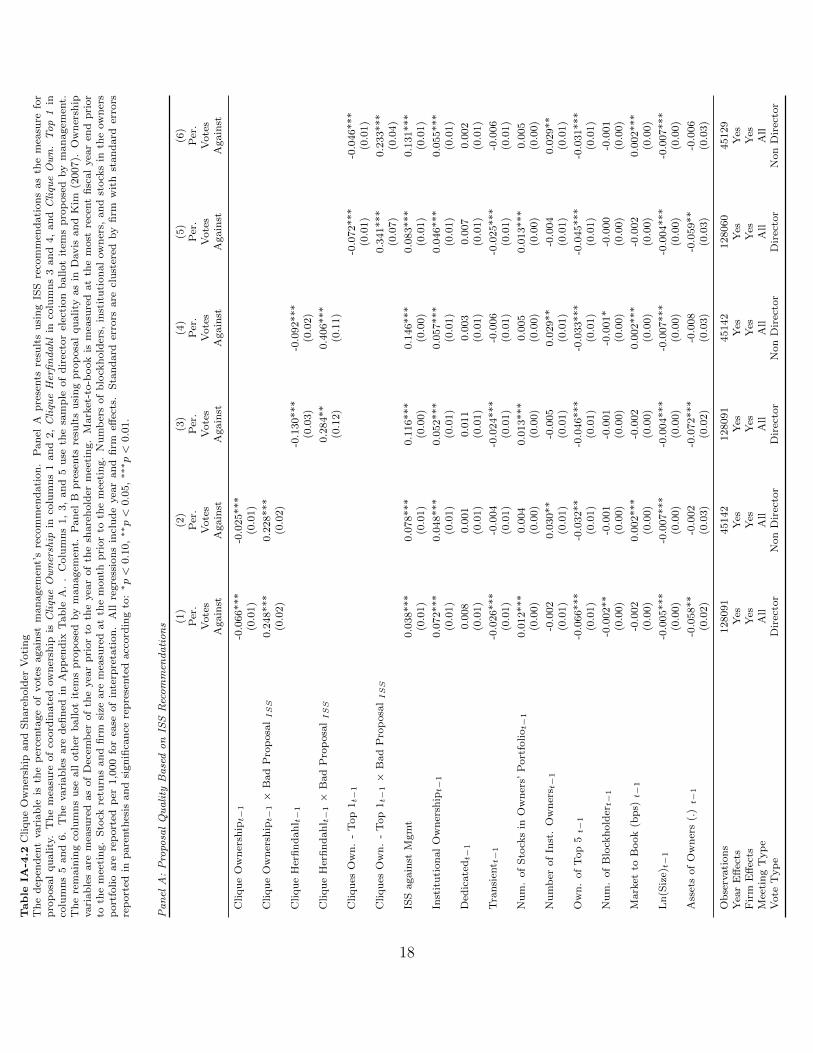
Table
IA-4
.2C
liqu
eO
wn
ersh
ipan
dS
hare
hold
erV
oti
ng
Th
ed
epen
den
tvari
ab
leis
the
per
centa
ge
of
vote
sagain
stm
an
agem
ent’
sre
com
men
dati
on
.P
an
elA
pre
sents
resu
lts
usi
ng
ISS
reco
mm
end
ati
on
sas
the
mea
sure
for
pro
posa
lqu
ali
ty.
Th
em
easu
reof
coord
inate
dow
ner
ship
isC
liqu
eO
wn
ersh
ipin
colu
mn
s1
an
d2,
Cli
que
Her
fin
da
hl
inco
lum
ns
3an
d4,
an
dC
liqu
eO
wn
.T
op
1in
colu
mn
s5
an
d6.
Th
evari
ab
les
are
defi
ned
inA
pp
end
ixT
ab
leA
..
Colu
mn
s1,
3,
an
d5
use
the
sam
ple
of
dir
ecto
rel
ecti
on
ballot
item
sp
rop
ose
dby
man
agem
ent.
Th
ere
main
ing
colu
mn
su
seall
oth
erb
allot
item
sp
rop
ose
dby
man
agem
ent.
Pan
elB
pre
sents
resu
lts
usi
ng
pro
posa
lqu
ali
tyas
inD
avis
an
dK
im(2
007).
Ow
ner
ship
vari
ab
les
are
mea
sure
das
of
Dec
emb
erof
the
yea
rp
rior
toth
eyea
rof
the
share
hold
erm
eeti
ng.
Mark
et-t
o-b
ook
ism
easu
red
at
the
most
rece
nt
fisc
al
yea
ren
dp
rior
toth
em
eeti
ng.
Sto
ckre
turn
san
dfi
rmsi
zeare
mea
sure
dat
the
month
pri
or
toth
em
eeti
ng.
Nu
mb
ers
of
blo
ckh
old
ers,
inst
itu
tion
al
ow
ner
s,an
dst
ock
sin
the
ow
ner
sp
ort
folio
are
rep
ort
edp
er1,0
00
for
ease
of
inte
rpre
tati
on
.A
llre
gre
ssio
ns
incl
ud
eyea
ran
dfi
rmeff
ects
.S
tan
dard
erro
rsare
clu
ster
edby
firm
wit
hst
an
dard
erro
rsre
port
edin
pare
nth
esis
an
dsi
gn
ifica
nce
rep
rese
nte
dacc
ord
ing
to:
∗p<
0.1
0,∗∗p<
0.0
5,∗∗
∗p<
0.0
1.
Pa
nel
A:
Pro
posa
lQ
ua
lity
Ba
sed
on
ISS
Rec
om
men
da
tio
ns (1
)(2
)(3
)(4
)(5
)(6
)P
er.
Per
.P
er.
Per
.P
er.
Per
.V
ote
sV
ote
sV
ote
sV
ote
sV
ote
sV
ote
sA
gain
stA
gain
stA
gain
stA
gain
stA
gain
stA
gain
st
Cliqu
eO
wn
ersh
ipt−
1-0
.066***
-0.0
25***
(0.0
1)
(0.0
1)
Cliqu
eO
wn
ersh
ipt−
1×
Bad
Pro
posa
lISS
0.2
48***
0.2
28***
(0.0
2)
(0.0
2)
Cliqu
eH
erfi
nd
ah
l t−
1-0
.130***
-0.0
92***
(0.0
3)
(0.0
2)
Cliqu
eH
erfi
nd
ah
l t−
1×
Bad
Pro
posa
lISS
0.2
84**
0.4
06***
(0.1
2)
(0.1
1)
Cliqu
esO
wn
.-
Top
1t−
1-0
.072***
-0.0
46***
(0.0
1)
(0.0
1)
Cliqu
esO
wn
.-
Top
1t−
1×
Bad
Pro
posa
lISS
0.3
41***
0.2
33***
(0.0
7)
(0.0
4)
ISS
again
stM
gm
t0.0
38***
0.0
78***
0.1
16***
0.1
46***
0.0
83***
0.1
31***
(0.0
1)
(0.0
1)
(0.0
0)
(0.0
0)
(0.0
1)
(0.0
1)
Inst
itu
tion
al
Ow
ner
ship
t−1
0.0
72***
0.0
48***
0.0
52***
0.0
57***
0.0
46***
0.0
55***
(0.0
1)
(0.0
1)
(0.0
1)
(0.0
1)
(0.0
1)
(0.0
1)
Ded
icate
dt−
10.0
08
0.0
01
0.0
11
0.0
03
0.0
07
0.0
02
(0.0
1)
(0.0
1)
(0.0
1)
(0.0
1)
(0.0
1)
(0.0
1)
Tra
nsi
ent t
−1
-0.0
26***
-0.0
04
-0.0
24***
-0.0
06
-0.0
25***
-0.0
06
(0.0
1)
(0.0
1)
(0.0
1)
(0.0
1)
(0.0
1)
(0.0
1)
Nu
m.
of
Sto
cks
inO
wn
ers’
Port
foliot−
10.0
12***
0.0
04
0.0
13***
0.0
05
0.0
13***
0.0
05
(0.0
0)
(0.0
0)
(0.0
0)
(0.0
0)
(0.0
0)
(0.0
0)
Nu
mb
erof
Inst
.O
wn
ers t
−1
-0.0
02
0.0
30**
-0.0
05
0.0
29**
-0.0
04
0.0
29**
(0.0
1)
(0.0
1)
(0.0
1)
(0.0
1)
(0.0
1)
(0.0
1)
Ow
n.
of
Top
5t−
1-0
.066***
-0.0
32**
-0.0
46***
-0.0
33***
-0.0
45***
-0.0
31***
(0.0
1)
(0.0
1)
(0.0
1)
(0.0
1)
(0.0
1)
(0.0
1)
Nu
m.
of
Blo
ckh
old
ert−
1-0
.002**
-0.0
01
-0.0
01
-0.0
01*
-0.0
00
-0.0
01
(0.0
0)
(0.0
0)
(0.0
0)
(0.0
0)
(0.0
0)
(0.0
0)
Mark
etto
Book
(bp
s)t−
1-0
.002
0.0
02***
-0.0
02
0.0
02***
-0.0
02
0.0
02***
(0.0
0)
(0.0
0)
(0.0
0)
(0.0
0)
(0.0
0)
(0.0
0)
Ln
(Siz
e)t−
1-0
.005***
-0.0
07***
-0.0
04***
-0.0
07***
-0.0
04***
-0.0
07***
(0.0
0)
(0.0
0)
(0.0
0)
(0.0
0)
(0.0
0)
(0.0
0)
Ass
ets
of
Ow
ner
s(.
)t−
1-0
.058**
-0.0
02
-0.0
72***
-0.0
08
-0.0
59**
-0.0
06
(0.0
2)
(0.0
3)
(0.0
2)
(0.0
3)
(0.0
3)
(0.0
3)
Ob
serv
ati
on
s128091
45142
128091
45142
128060
45129
Yea
rE
ffec
tsY
esY
esY
esY
esY
esY
esF
irm
Eff
ects
Yes
Yes
Yes
Yes
Yes
Yes
Mee
tin
gT
yp
eA
llA
llA
llA
llA
llA
llV
ote
Typ
eD
irec
tor
Non
Dir
ecto
rD
irec
tor
Non
Dir
ecto
rD
irec
tor
Non
Dir
ecto
r
18
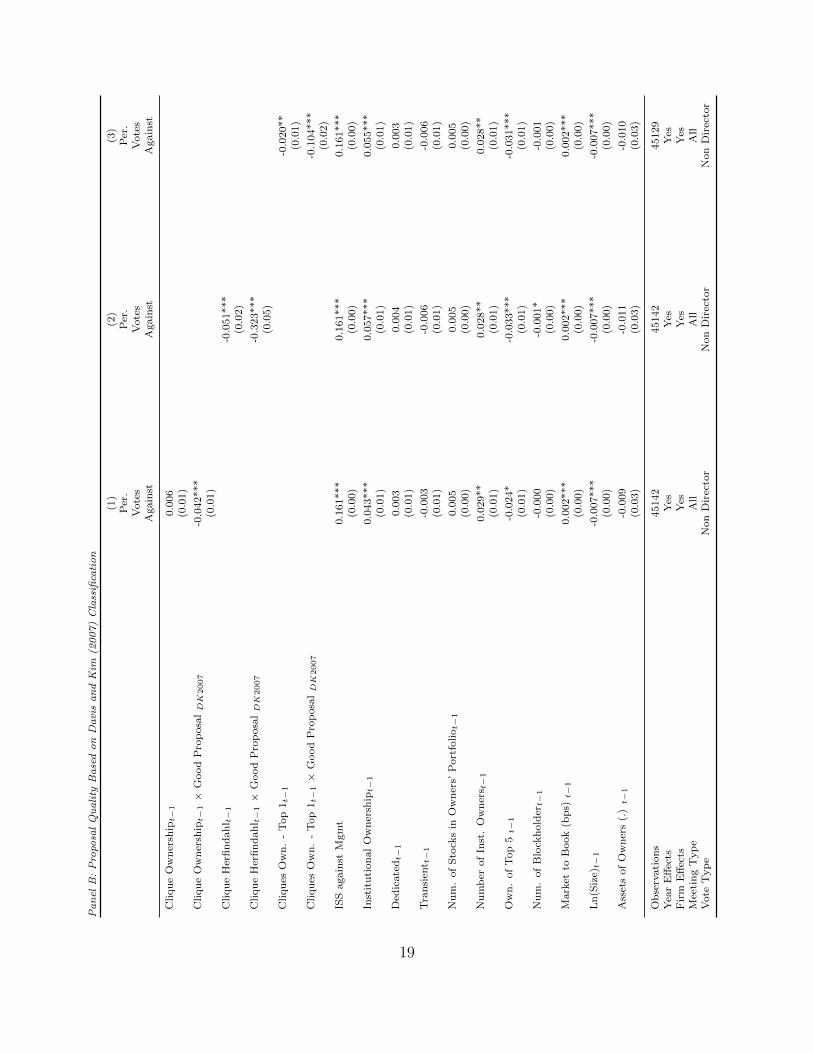
Pa
nel
B:
Pro
posa
lQ
ua
lity
Ba
sed
on
Da
vis
an
dK
im(2
00
7)
Cla
ssifi
cati
on
(1)
(2)
(3)
Per
.P
er.
Per
.V
ote
sV
ote
sV
ote
sA
gain
stA
gain
stA
gain
st
Cliqu
eO
wn
ersh
ipt−
10.0
06
(0.0
1)
Cliqu
eO
wn
ersh
ipt−
1×
Good
Pro
posa
lD
K2007
-0.0
42***
(0.0
1)
Cliqu
eH
erfi
nd
ah
l t−
1-0
.051***
(0.0
2)
Cliqu
eH
erfi
nd
ah
l t−
1×
Good
Pro
posa
lD
K2007
-0.3
23***
(0.0
5)
Cliqu
esO
wn
.-
Top
1t−
1-0
.020**
(0.0
1)
Cliqu
esO
wn
.-
Top
1t−
1×
Good
Pro
posa
lD
K2007
-0.1
04***
(0.0
2)
ISS
again
stM
gm
t0.1
61***
0.1
61***
0.1
61***
(0.0
0)
(0.0
0)
(0.0
0)
Inst
itu
tion
al
Ow
ner
ship
t−1
0.0
43***
0.0
57***
0.0
55***
(0.0
1)
(0.0
1)
(0.0
1)
Ded
icate
dt−
10.0
03
0.0
04
0.0
03
(0.0
1)
(0.0
1)
(0.0
1)
Tra
nsi
ent t
−1
-0.0
03
-0.0
06
-0.0
06
(0.0
1)
(0.0
1)
(0.0
1)
Nu
m.
of
Sto
cks
inO
wn
ers’
Port
foliot−
10.0
05
0.0
05
0.0
05
(0.0
0)
(0.0
0)
(0.0
0)
Nu
mb
erof
Inst
.O
wn
ers t
−1
0.0
29**
0.0
28**
0.0
28**
(0.0
1)
(0.0
1)
(0.0
1)
Ow
n.
of
Top
5t−
1-0
.024*
-0.0
33***
-0.0
31***
(0.0
1)
(0.0
1)
(0.0
1)
Nu
m.
of
Blo
ckh
old
ert−
1-0
.000
-0.0
01*
-0.0
01
(0.0
0)
(0.0
0)
(0.0
0)
Mark
etto
Book
(bp
s)t−
10.0
02***
0.0
02***
0.0
02***
(0.0
0)
(0.0
0)
(0.0
0)
Ln
(Siz
e)t−
1-0
.007***
-0.0
07***
-0.0
07***
(0.0
0)
(0.0
0)
(0.0
0)
Ass
ets
of
Ow
ner
s(.
)t−
1-0
.009
-0.0
11
-0.0
10
(0.0
3)
(0.0
3)
(0.0
3)
Ob
serv
ati
on
s45142
45142
45129
Yea
rE
ffec
tsY
esY
esY
esF
irm
Eff
ects
Yes
Yes
Yes
Mee
tin
gT
yp
eA
llA
llA
llV
ote
Typ
eN
on
Dir
ecto
rN
on
Dir
ecto
rN
on
Dir
ecto
r
19
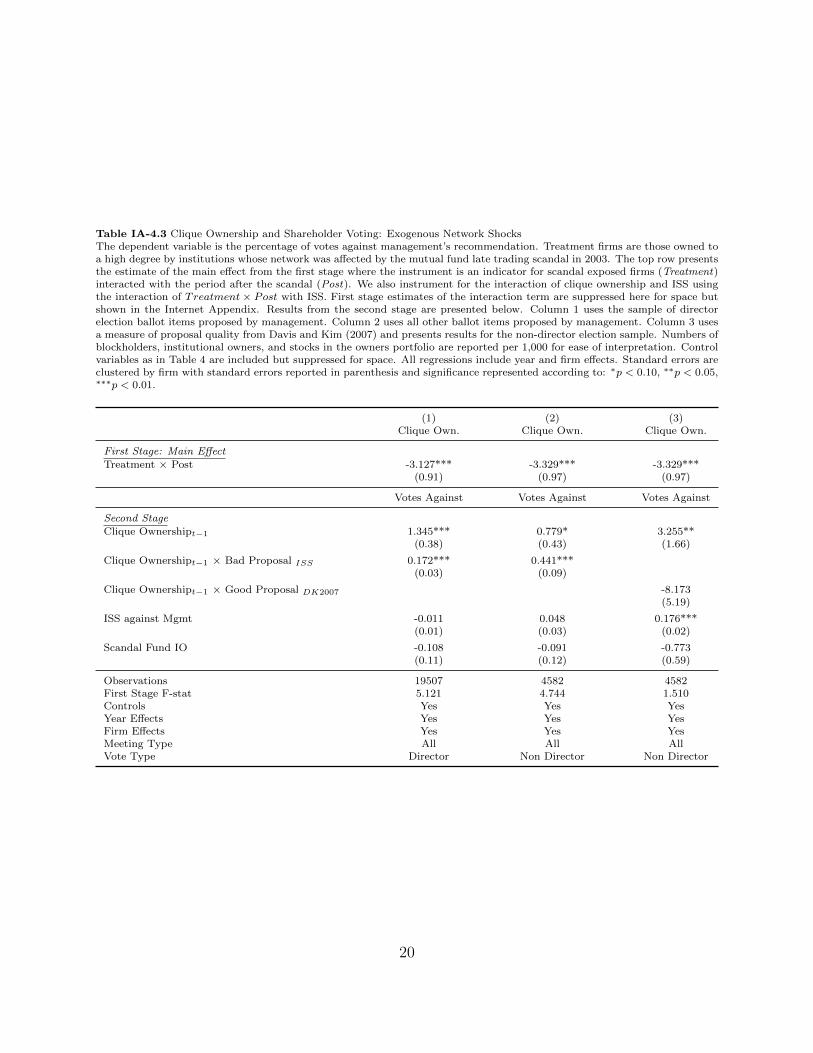
Table IA-4.3 Clique Ownership and Shareholder Voting: Exogenous Network ShocksThe dependent variable is the percentage of votes against management’s recommendation. Treatment firms are those owned toa high degree by institutions whose network was affected by the mutual fund late trading scandal in 2003. The top row presentsthe estimate of the main effect from the first stage where the instrument is an indicator for scandal exposed firms (Treatment)interacted with the period after the scandal (Post). We also instrument for the interaction of clique ownership and ISS usingthe interaction of Treatment× Post with ISS. First stage estimates of the interaction term are suppressed here for space butshown in the Internet Appendix. Results from the second stage are presented below. Column 1 uses the sample of directorelection ballot items proposed by management. Column 2 uses all other ballot items proposed by management. Column 3 usesa measure of proposal quality from Davis and Kim (2007) and presents results for the non-director election sample. Numbers ofblockholders, institutional owners, and stocks in the owners portfolio are reported per 1,000 for ease of interpretation. Controlvariables as in Table 4 are included but suppressed for space. All regressions include year and firm effects. Standard errors areclustered by firm with standard errors reported in parenthesis and significance represented according to: ∗p < 0.10, ∗∗p < 0.05,∗∗∗p < 0.01.
(1) (2) (3)Clique Own. Clique Own. Clique Own.
First Stage: Main Effect
Treatment × Post -3.127*** -3.329*** -3.329***(0.91) (0.97) (0.97)
Votes Against Votes Against Votes Against
Second Stage
Clique Ownershipt−1 1.345*** 0.779* 3.255**(0.38) (0.43) (1.66)
Clique Ownershipt−1 × Bad Proposal ISS 0.172*** 0.441***(0.03) (0.09)
Clique Ownershipt−1 × Good Proposal DK2007 -8.173(5.19)
ISS against Mgmt -0.011 0.048 0.176***(0.01) (0.03) (0.02)
Scandal Fund IO -0.108 -0.091 -0.773(0.11) (0.12) (0.59)
Observations 19507 4582 4582First Stage F-stat 5.121 4.744 1.510Controls Yes Yes YesYear Effects Yes Yes YesFirm Effects Yes Yes YesMeeting Type All All AllVote Type Director Non Director Non Director
20
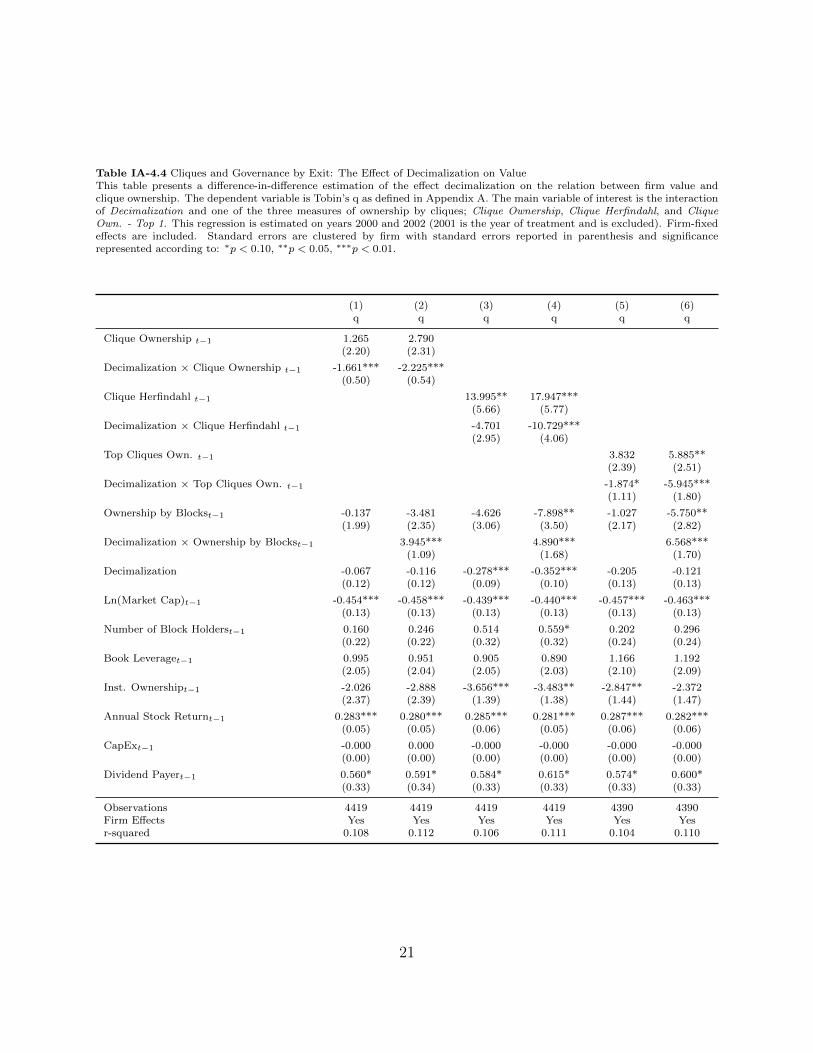
Table IA-4.4 Cliques and Governance by Exit: The Effect of Decimalization on ValueThis table presents a difference-in-difference estimation of the effect decimalization on the relation between firm value andclique ownership. The dependent variable is Tobin’s q as defined in Appendix A. The main variable of interest is the interactionof Decimalization and one of the three measures of ownership by cliques; Clique Ownership, Clique Herfindahl, and CliqueOwn. - Top 1. This regression is estimated on years 2000 and 2002 (2001 is the year of treatment and is excluded). Firm-fixedeffects are included. Standard errors are clustered by firm with standard errors reported in parenthesis and significancerepresented according to: ∗p < 0.10, ∗∗p < 0.05, ∗∗∗p < 0.01.
(1) (2) (3) (4) (5) (6)q q q q q q
Clique Ownership t−1 1.265 2.790(2.20) (2.31)
Decimalization × Clique Ownership t−1 -1.661*** -2.225***(0.50) (0.54)
Clique Herfindahl t−1 13.995** 17.947***(5.66) (5.77)
Decimalization × Clique Herfindahl t−1 -4.701 -10.729***(2.95) (4.06)
Top Cliques Own. t−1 3.832 5.885**(2.39) (2.51)
Decimalization × Top Cliques Own. t−1 -1.874* -5.945***(1.11) (1.80)
Ownership by Blockst−1 -0.137 -3.481 -4.626 -7.898** -1.027 -5.750**(1.99) (2.35) (3.06) (3.50) (2.17) (2.82)
Decimalization × Ownership by Blockst−1 3.945*** 4.890*** 6.568***(1.09) (1.68) (1.70)
Decimalization -0.067 -0.116 -0.278*** -0.352*** -0.205 -0.121(0.12) (0.12) (0.09) (0.10) (0.13) (0.13)
Ln(Market Cap)t−1 -0.454*** -0.458*** -0.439*** -0.440*** -0.457*** -0.463***(0.13) (0.13) (0.13) (0.13) (0.13) (0.13)
Number of Block Holderst−1 0.160 0.246 0.514 0.559* 0.202 0.296(0.22) (0.22) (0.32) (0.32) (0.24) (0.24)
Book Leveraget−1 0.995 0.951 0.905 0.890 1.166 1.192(2.05) (2.04) (2.05) (2.03) (2.10) (2.09)
Inst. Ownershipt−1 -2.026 -2.888 -3.656*** -3.483** -2.847** -2.372(2.37) (2.39) (1.39) (1.38) (1.44) (1.47)
Annual Stock Returnt−1 0.283*** 0.280*** 0.285*** 0.281*** 0.287*** 0.282***(0.05) (0.05) (0.06) (0.05) (0.06) (0.06)
CapExt−1 -0.000 0.000 -0.000 -0.000 -0.000 -0.000(0.00) (0.00) (0.00) (0.00) (0.00) (0.00)
Dividend Payert−1 0.560* 0.591* 0.584* 0.615* 0.574* 0.600*(0.33) (0.34) (0.33) (0.33) (0.33) (0.33)
Observations 4419 4419 4419 4419 4390 4390Firm Effects Yes Yes Yes Yes Yes Yesr-squared 0.108 0.112 0.106 0.111 0.104 0.110
21
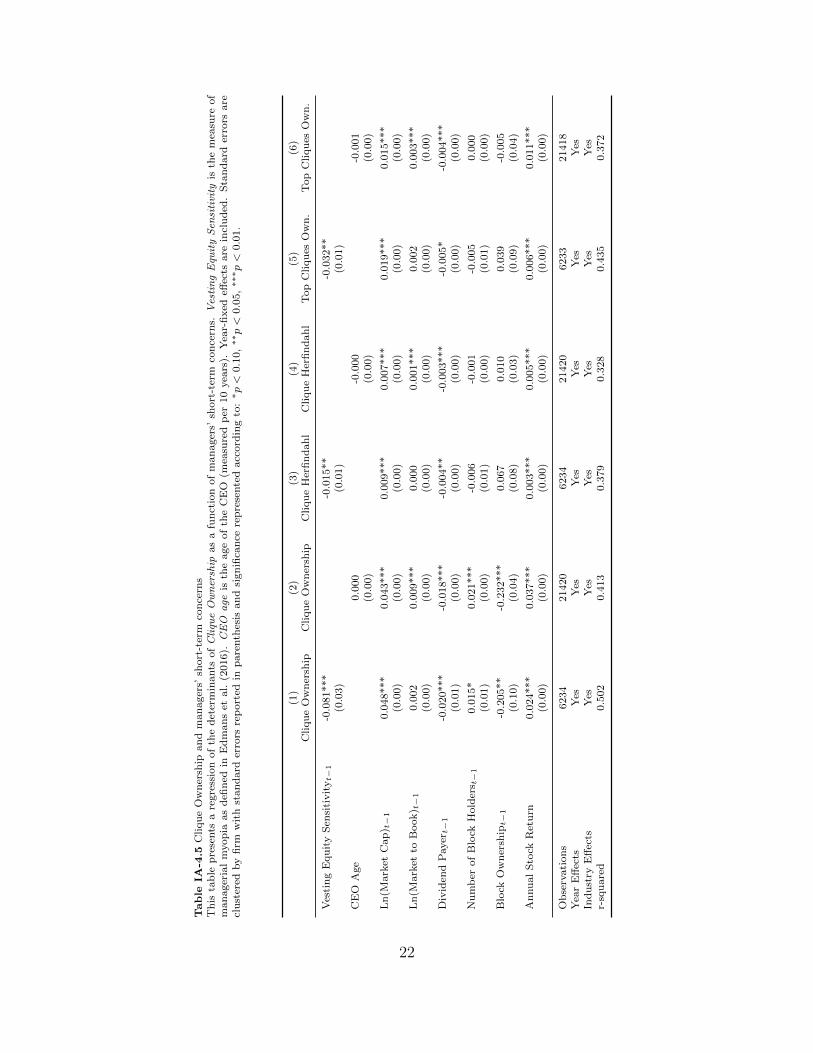
Table
IA-4
.5C
liqu
eO
wn
ersh
ipan
dm
an
ager
s’sh
ort
-ter
mco
nce
rns
Th
ista
ble
pre
sents
are
gre
ssio
nof
the
det
erm
inants
of
Cli
que
Ow
ner
ship
as
afu
nct
ion
of
man
ager
s’sh
ort
-ter
mco
nce
rns.
Ves
tin
gE
quit
yS
ensi
tivi
tyis
the
mea
sure
of
man
ager
ial
myop
iaas
defi
ned
inE
dm
an
set
al.
(2016).
CE
Oa
geis
the
age
of
the
CE
O(m
easu
red
per
10
yea
rs).
Yea
r-fi
xed
effec
tsare
incl
ud
ed.
Sta
nd
ard
erro
rsare
clu
ster
edby
firm
wit
hst
an
dard
erro
rsre
port
edin
pare
nth
esis
an
dsi
gn
ifica
nce
rep
rese
nte
dacc
ord
ing
to:
∗p<
0.1
0,∗∗p<
0.0
5,∗∗
∗p<
0.0
1.
(1)
(2)
(3)
(4)
(5)
(6)
Cliqu
eO
wn
ersh
ipC
liqu
eO
wn
ersh
ipC
liqu
eH
erfi
nd
ah
lC
liqu
eH
erfi
nd
ah
lT
op
Cliqu
esO
wn
.T
op
Cliqu
esO
wn
.
Ves
tin
gE
qu
ity
Sen
siti
vit
yt−
1-0
.081***
-0.0
15**
-0.0
32**
(0.0
3)
(0.0
1)
(0.0
1)
CE
OA
ge
0.0
00
-0.0
00
-0.0
01
(0.0
0)
(0.0
0)
(0.0
0)
Ln
(Mark
etC
ap
) t−
10.0
48***
0.0
43***
0.0
09***
0.0
07***
0.0
19***
0.0
15***
(0.0
0)
(0.0
0)
(0.0
0)
(0.0
0)
(0.0
0)
(0.0
0)
Ln
(Mark
etto
Book) t
−1
0.0
02
0.0
09***
0.0
00
0.0
01***
0.0
02
0.0
03***
(0.0
0)
(0.0
0)
(0.0
0)
(0.0
0)
(0.0
0)
(0.0
0)
Div
iden
dP
ayer
t−1
-0.0
20***
-0.0
18***
-0.0
04**
-0.0
03***
-0.0
05*
-0.0
04***
(0.0
1)
(0.0
0)
(0.0
0)
(0.0
0)
(0.0
0)
(0.0
0)
Nu
mb
erof
Blo
ckH
old
ers t
−1
0.0
15*
0.0
21***
-0.0
06
-0.0
01
-0.0
05
0.0
00
(0.0
1)
(0.0
0)
(0.0
1)
(0.0
0)
(0.0
1)
(0.0
0)
Blo
ckO
wn
ersh
ipt−
1-0
.205**
-0.2
32***
0.0
67
0.0
10
0.0
39
-0.0
05
(0.1
0)
(0.0
4)
(0.0
8)
(0.0
3)
(0.0
9)
(0.0
4)
An
nu
al
Sto
ckR
etu
rn0.0
24***
0.0
37***
0.0
03***
0.0
05***
0.0
06***
0.0
11***
(0.0
0)
(0.0
0)
(0.0
0)
(0.0
0)
(0.0
0)
(0.0
0)
Ob
serv
ati
on
s6234
21420
6234
21420
6233
21418
Yea
rE
ffec
tsY
esY
esY
esY
esY
esY
esIn
du
stry
Eff
ects
Yes
Yes
Yes
Yes
Yes
Yes
r-sq
uare
d0.5
02
0.4
13
0.3
79
0.3
28
0.4
35
0.3
72
22