Institutional Equity Research Earnings Update · Find CIBC research on Bloomberg, Reuters,...
23
Find CIBC research on Bloomberg, Reuters, firstcall.com CIBC World Markets Inc., P.O. Box 500, 161 Bay Street, Brookfield Place, Toronto, Canada M5J 2S8 (416) 594-7000 and ResearchCentral.cibcwm.com Institutional Equity Research Earnings Update December 5, 2011 Technology Hardware Wi-LAN Inc. A Good Buy, Below The NAV Wi-LAN's share price is attractive, trading below its signed deals + cash NAV of $6.11 (discounted 5%). Approximately 80% of WIN's contracts are fixed, meaning its outlook will be resistant to economic swings. Our research coverage is reinstated with a SO rating and price target of $10. 2012 catalysts would be signing new licenses. WIN has four active litigations with 14 defendants in areas such as wireless (CDMA, 3GPP, 4G) and its V-Chip, including some major players. License agreements are expected from both new OEMs and renewals for agreements set to expire. Our view is that present value of WIN's licensing pipeline is at least $6 per share (discounted 15%). The exact timing of future agreements is difficult to predict though. Deals that are likely to be signed sooner include 1) renewals with Nokia & RIM and 2) new wireless deals with HTC and others. Our SO rating and $10 PT are unchanged. WIN's price has pulled back on flat Q4 guidance and no recent signings. The shares should be bought now as there is no value being given to any future signings for 2012. Stock Price Performance Source: Re uters All figures in Canadian dollars, unless otherwise stated. 11-113255 © 2011 CIBC World Markets does and seeks to do business with companies covered in its research reports. As a result, investors should be aware that the firm may have a conflict of interest that could affect the objectivity of this report. Investors should consider this report as only a single factor in making their investment decision. See "Important Disclosures" section at the end of this report for important required disclosures, including potential conflicts of interest. See "Price Target Calculation" and "Key Risks to Price Target" sections at the end of this report, where applicable. Todd Coupland, CFA 1 (416) 956-6025 [email protected] Robin Manson-Hing 1 (416) 594-7232 [email protected] Stock Rating: Sector Outperformer Sector Weighting: Market Weight 12-18 mo. Price Target $10. 00 WIN-TSX (12/5/11) $5.51 Key Indices: NASDAQ, Toronto 3-5-Yr. EPS Gr. Rate (E) NM 52-week Range $4.18-$9.56 Shares Outstanding 123. 6M Float 123. 6M Shrs Av g. Daily Trading Vol. 1,113,005 Market Capitalization $681.0M Div idend/Div Yield $0.10 / 1.8% Fiscal Year Ends December Book Value $2.76 per Shr 2009 ROE (E) NM N et C ash $197.00M Preferred N il Common Equity $340.8M C onv ertible Av ailable No Earnings Per Share Prev Current 2010 $0.05A 2011 $0.62E $0.62E 2012 $0.79E $0.51E P/E 2010 NM 2011 8.9x 8.9x 2012 7.0x 10.8x Company Description Wi-LAN Inc. is an IP licensing firm focused on its core patent areas including V-C hip, C DMA, WiFi, DSL, WiMAX, Bluetooth and 3GPP technologies. www.wi-lan.com
Transcript of Institutional Equity Research Earnings Update · Find CIBC research on Bloomberg, Reuters,...

Find CIBC research on Bloomberg, Reuters, firstcall.com CIBC World Markets Inc., P.O. Box 500, 161 Bay Street, Brookfield Place, Toronto, Canada M5J 2S8 (416) 594-7000
and ResearchCentral.cibcwm.com
Institutional Equity Research
Earnings Update
December 5, 2011 Technology Hardware
Wi-LAN Inc. A Good Buy, Below The NAV
Wi-LAN's share price is attractive, trading below its signed deals + cash NAV
of $6.11 (discounted 5%). Approximately 80% of WIN's contracts are fixed,
meaning its outlook will be resistant to economic swings. Our research
coverage is reinstated with a SO rating and price target of $10.
2012 catalysts would be signing new licenses. WIN has four active
litigations with 14 defendants in areas such as wireless (CDMA, 3GPP, 4G)
and its V-Chip, including some major players. License agreements are
expected from both new OEMs and renewals for agreements set to expire.
Our view is that present value of WIN's licensing pipeline is at least $6 per
share (discounted 15%). The exact timing of future agreements is difficult
to predict though. Deals that are likely to be signed sooner include 1)
renewals with Nokia & RIM and 2) new wireless deals with HTC and others.
Our SO rating and $10 PT are unchanged. WIN's price has pulled back on
flat Q4 guidance and no recent signings. The shares should be bought now
as there is no value being given to any future signings for 2012.
Stock Price Performance
Source: Reuters All figures in Canadian dollars, unless otherwise stated. 11-113255 © 2011
CIBC World Markets does and seeks to do business with companies covered in its research reports. As a result, investors should be aware that the firm may
have a conflict of interest that could affect the objectivity of this report.
Investors should consider this report as only a single factor in making their
investment decision.
See "Important Disclosures" section at the end of this report for important
required disclosures, including potential conflicts of interest.
See "Price Target Calculation" and "Key Risks to Price Target" sections at the
end of this report, where applicable.
Todd Coupland, CFA 1 (416) 956-6025 [email protected]
Robin Manson-Hing 1 (416) 594-7232 [email protected]
Stock Rating:
Sector Outperformer
Sector Weighting:
Market Weight 12-18 mo. Price Target $10.00
WIN-TSX (12/5/11) $5.51
Key Indices: NASDAQ, Toronto
3-5-Yr. EPS Gr. Rate (E) NM
52-week Range $4.18-$9.56 Shares Outstanding 123.6M
Float 123.6M Shrs
Avg. Daily Trading Vol. 1,113,005 Market Capitalization $681.0M
Div idend/Div Yield $0.10 / 1.8%
Fiscal Year Ends December Book Value $2.76 per Shr
2009 ROE (E) NM
Net Cash $197.00M Preferred Nil
Common Equity $340.8M
Convertible Available No Earnings Per Share Prev Current
2010 $0.05A 2011 $0.62E $0.62E
2012 $0.79E $0.51E
P/E 2010 NM 2011 8.9x 8.9x 2012 7.0x 10.8x
Company Description Wi-LAN Inc. is an IP licensing firm focused on its core patent areas including V-Chip, CDMA, WiFi, DSL, WiMAX, Bluetooth and 3GPP technologies.
www.wi-lan.com
A Good Buy, Below The NAV - December 05, 2011
2
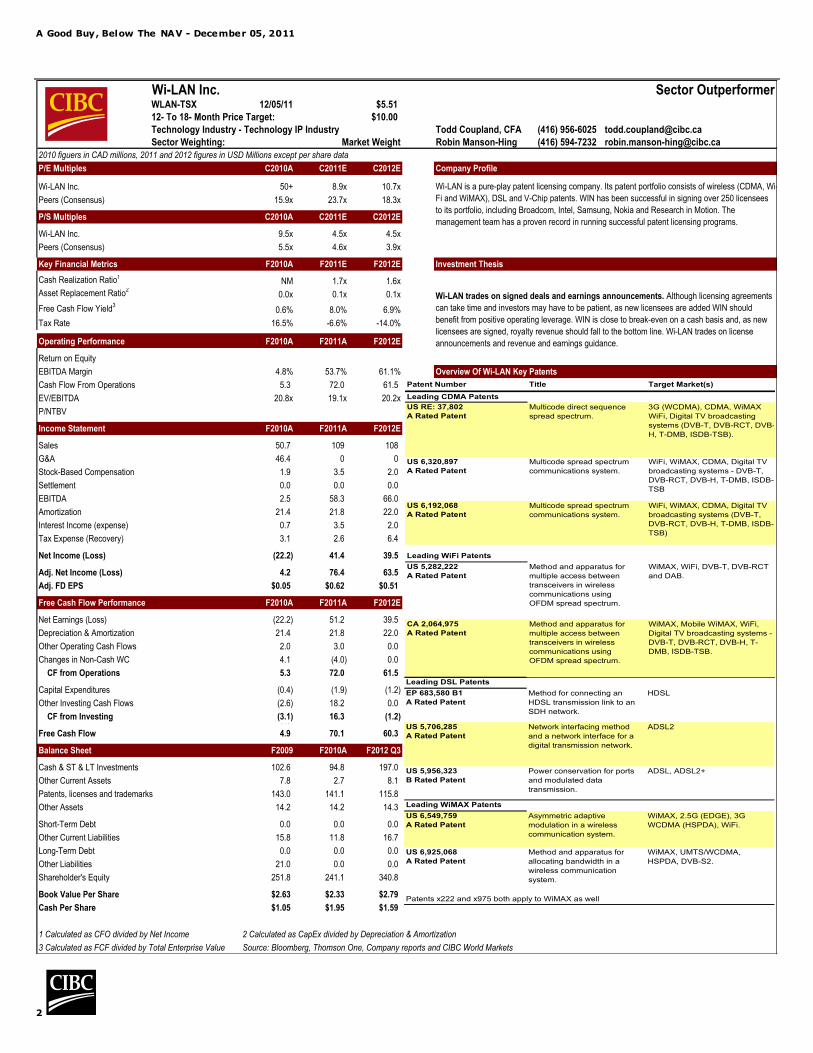
Wi-LAN Inc. Sector OutperformerWLAN-TSX 12/05/11 $5.51
12- To 18- Month Price Target: $10.00
Technology Industry - Technology IP Industry Todd Coupland, CFA (416) 956-6025 [email protected]
Sector Weighting: Market Weight Robin Manson-Hing (416) 594-7232 [email protected]
2010 figuers in CAD millions, 2011 and 2012 figures in USD Millions except per share data
P/E Multiples C2010A C2011E C2012E
Wi-LAN Inc. 50+ 8.9x 10.7x
Peers (Consensus) 15.9x 23.7x 18.3x
P/S Multiples C2010A C2011E C2012E
Wi-LAN Inc. 9.5x 4.5x 4.5x
Peers (Consensus) 5.5x 4.6x 3.9xTraditional CDN Energy Utilities (Consensus)18.1x 18.1x 18.1x 18.1x 18.1x 15.6x
Key Financial Metrics F2010A F2011E F2012E Investment Thesis
Cash Realization Ratio1NM 1.7x 1.6x
Asset Replacement Ratio2
0.0x 0.1x 0.1x
Free Cash Flow Yield3
0.6% 8.0% 6.9%
Tax Rate 16.5% -6.6% -14.0%
Operating Performance F2010A F2011A F2012E
Return on Equity
EBITDA Margin 4.8% 53.7% 61.1%
Cash Flow From Operations 5.3 72.0 61.5
EV/EBITDA 20.8x 19.1x 20.2x
P/NTBV 2.7x 2.8x 2.0x
Income Statement F2010A F2011A F2012E
Sales 50.7 109 108
G&A 46.4 0 0
Stock-Based Compensation 1.9 3.5 2.0
Settlement 0.0 0.0 0.0
EBITDA 2.5 58.3 66.0
Amortization 21.4 21.8 22.0
Interest Income (expense) 0.7 3.5 2.0
Tax Expense (Recovery) 3.1 2.6 6.4
Net Income (Loss) (22.2) 41.4 39.5
Adj. Net Income (Loss) 4.2 76.4 63.5
Adj. FD EPS $0.05 $0.62 $0.51
Free Cash Flow Performance F2010A F2011A F2012E
Net Earnings (Loss) (22.2) 51.2 39.5
Depreciation & Amortization 21.4 21.8 22.0
Other Operating Cash Flows 2.0 3.0 0.0
Changes in Non-Cash WC 4.1 (4.0) 0.0
CF from Operations 5.3 72.0 61.521.4
Capital Expenditures (0.4) (1.9) (1.2)
Other Investing Cash Flows (2.6) 18.2 0.0
CF from Investing (3.1) 16.3 (1.2)0.0
Free Cash Flow 4.9 70.1 60.3
Balance Sheet F2009 F2010A F2012 Q3
Cash & ST & LT Investments 102.6 94.8 197.0
Other Current Assets 7.8 2.7 8.1
Patents, licenses and trademarks 143.0 141.1 115.8
Other Assets 14.2 14.2 14.3
Short-Term Debt 0.0 0.0 0.0
Other Current Liabilities 15.8 11.8 16.7
Long-Term Debt 0.0 0.0 0.0
Other Liabilities 21.0 0.0 0.0
Shareholder's Equity 251.8 241.1 340.8
Book Value Per Share $2.63 $2.33 $2.79
Cash Per Share $1.05 $1.95 $1.59
1 Calculated as CFO divided by Net Income 2 Calculated as CapEx divided by Depreciation & Amortization
3 Calculated as FCF divided by Total Enterprise Value Source: Bloomberg, Thomson One, Company reports and CIBC World Markets
Wi-LAN trades on signed deals and earnings announcements. Although licensing agreements
can take time and investors may have to be patient, as new licensees are added WIN should
benefit from positive operating leverage. WIN is close to break-even on a cash basis and, as new
licensees are signed, royalty revenue should fall to the bottom line. Wi-LAN trades on license
announcements and revenue and earnings guidance.
Overview Of Wi-LAN Key Patents
Company Profile
Wi-LAN is a pure-play patent licensing company. Its patent portfolio consists of wireless (CDMA, Wi-
Fi and WiMAX), DSL and V-Chip patents. WIN has been successful in signing over 250 licensees
to its portfolio, including Broadcom, Intel, Samsung, Nokia and Research in Motion. The
management team has a proven record in running successful patent licensing programs.
Patent Number Title Target Market(s)
Leading CDMA Patents
US RE: 37,802
A Rated Patent
Multicode direct sequence
spread spectrum.
3G (WCDMA), CDMA, WiMAX
WiFi, Digital TV broadcasting
systems (DVB-T, DVB-RCT, DVB-
H, T-DMB, ISDB-TSB).
US 6,320,897
A Rated Patent
Multicode spread spectrum
communications system.
WiFi, WiMAX, CDMA, Digital TV
broadcasting systems - DVB-T,
DVB-RCT, DVB-H, T-DMB, ISDB-
TSB
US 6,192,068
A Rated Patent
Multicode spread spectrum
communications system.
WiFi, WiMAX, CDMA, Digital TV
broadcasting systems (DVB-T,
DVB-RCT, DVB-H, T-DMB, ISDB-
TSB)
Leading WiFi Patents
US 5,282,222
A Rated Patent
Method and apparatus for
multiple access between
transceivers in wireless
communications using
OFDM spread spectrum.
WiMAX, WiFi, DVB-T, DVB-RCT
and DAB.
CA 2,064,975
A Rated Patent
Method and apparatus for
multiple access between
transceivers in wireless
communications using
OFDM spread spectrum.
WiMAX, Mobile WiMAX, WiFi,
Digital TV broadcasting systems -
DVB-T, DVB-RCT, DVB-H, T-
DMB, ISDB-TSB.
Leading DSL Patents
EP 683,580 B1
A Rated Patent
Method for connecting an
HDSL transmission link to an
SDH network.
HDSL
US 5,706,285
A Rated Patent
Network interfacing method
and a network interface for a
digital transmission network.
ADSL2
US 5,956,323
B Rated Patent
Power conservation for ports
and modulated data
transmission.
ADSL, ADSL2+
Leading WiMAX Patents
US 6,549,759
A Rated Patent
Asymmetric adaptive
modulation in a wireless
communication system.
WiMAX, 2.5G (EDGE), 3G
WCDMA (HSPDA), WiFi.
US 6,925,068
A Rated Patent
Method and apparatus for
allocating bandwidth in a
wireless communication
system.
WiMAX, UMTS/WCDMA,
HSPDA, DVB-S2.
Patents x222 and x975 both apply to WiMAX as well

A Good Buy, Below The NAV - December 05, 2011
3
Our View in Summary
Once again we reinforce our view that Wi-LAN (WIN-SO) should trade at least at its signed deals plus net cash value and that the share price will track any
significant future signings. With the MOSAID acquisition attempt behind them, Wi-LAN can now turn its full attention to the dozens of other parties potentially
infringing one of their 40 patent families containing over 1,400 patents.
Recent events whilst we were restricted included Wi-LAN reporting an in-line Q3
but lowering its 2011 guidance range by $5 million to $105MM - $110MM in
revenue and adjusted earnings to $70MM - $75MM. This did not come as a surprise to us as WIN has not signed a major licensing deal since our last note in
August and previous expectations of coming to a settlement with LG on V-Chip have been pushed back. Our updated forecast now reflects the current run rate
of Wi-LAN‟s business. Any future signings would be upside to our 2012 forecast.
Our SO recommendation and price target of $10 remain unchanged and we believe the shares should be bought.
2012 Catalysts, Renewals and New Deals For 2012, specific timing on when agreements will be inked is difficult to predict.
In spite of that, there are a number of catalysts that investors should keep in
mind. For the expiring agreements, we know the dates. For current litigation we
know to focus on events which in the past have led parties on either side to
come to the table and sign licensing agreements. We believe investors should
focus on both during 2012. Exhibit 1 shows the upcoming litigation schedule.
Renewal Opportunities - Nokia‟s license is coming due at the end of
December 2011. We expect a significantly larger renewal than the $15 million in
cash they received from Nokia in 2006. Other material renewal dates include
RIM (est. August 2013 for major patents) and Samsung (est. 2014). In each
case, these agreements are expected to be substantially larger than the original
deals. In the past, these OEMs signed very narrow agreements. Our rational for
a larger agreement is that Wi-LAN‟s patent portfolio has grown from 146 just
after the Nokia signing in 2006 to 370 patents in July of 2009 to over 1400
patents currently issued or pending. Many of these acquired patents cover
technologies dealing with various 2G, 3G (general GSM patents, EDGE,
CDMA2000, HSPA) and 4G (LTE and WiMAX) technologies as well as in areas
such as Bluetooth, mobile messaging and wireless data transmission that all
read on mobile devices. It is our understanding that Wi-LAN will focus on
bringing a number of technologies into these renegotiations that should
ultimately yield higher royalty rates.
Legal Activity for 2012 - The 3GPP Markman hearing (a pre-trial hearing on
the appropriate meanings of relevant keywords used in a patent claim
determined by the Judge) in April will give us a better idea as to the strength of
Wi-LAN‟s case. The 3GPP case refers to patents covering wireless communication
products that are compliant with 3GPP standards, including mobile handsets and
base stations. The complaint named Alcatel-Lucent and Ericsson base stations
involving GSM/EDGE, WCDMA/HSPA and LTE (ex: ALU‟s 9926 Distributed Base
Station, Ericsson‟s RBS 3000 and RBS 6000 as well as Sony Ericsson phones
such as the Xperia X10 and Vivaz). Generally speaking, once the Markman
hearing has passed, the Judge‟s written ruling can take about six weeks to
complete implying a mid-May verdict. Following the ruling either side will assess
their respective positions and then decide if it makes sense to settle or push on
towards the trial.
A Good Buy, Below The NAV - December 05, 2011
4
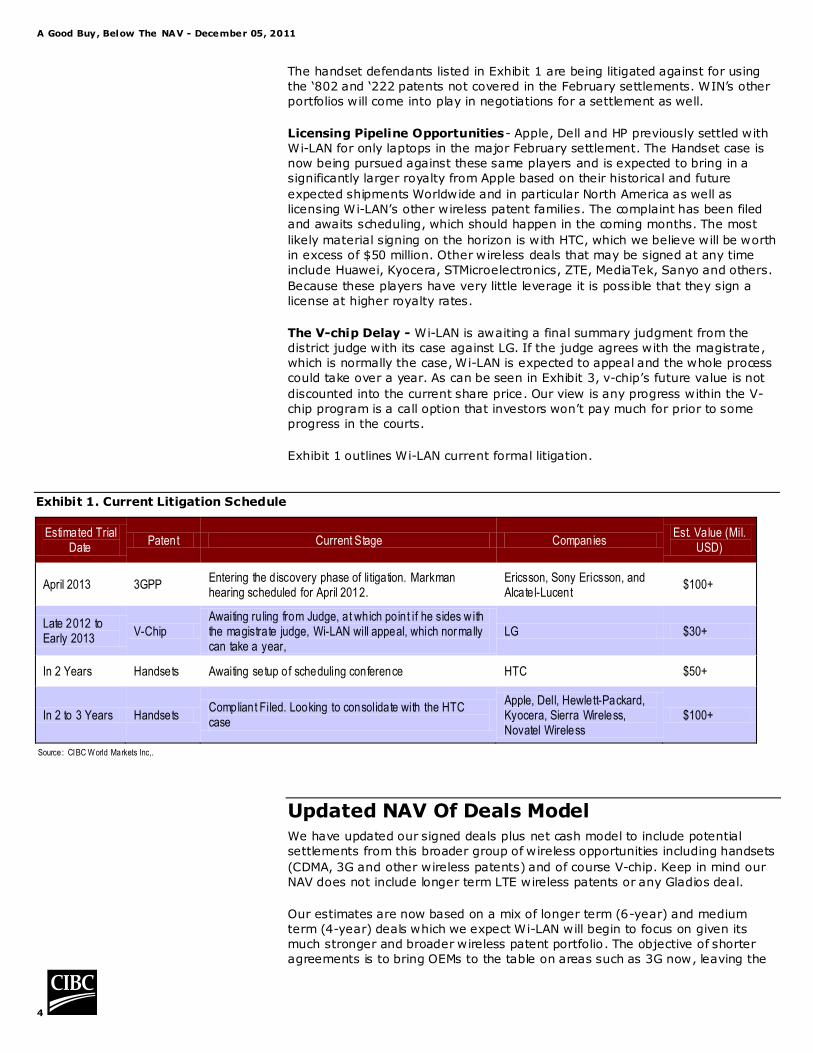
The handset defendants listed in Exhibit 1 are being litigated against for using
the „802 and „222 patents not covered in the February settlements. WIN‟s other
portfolios will come into play in negotiations for a settlement as well.
Licensing Pipeline Opportunities- Apple, Dell and HP previously settled with
Wi-LAN for only laptops in the major February settlement. The Handset case is
now being pursued against these same players and is expected to bring in a
significantly larger royalty from Apple based on their historical and future
expected shipments Worldwide and in particular North America as well as
licensing Wi-LAN‟s other wireless patent families. The complaint has been filed
and awaits scheduling, which should happen in the coming months. The most
likely material signing on the horizon is with HTC, which we believe will be worth
in excess of $50 million. Other wireless deals that may be signed at any time
include Huawei, Kyocera, STMicroelectronics, ZTE, MediaTek, Sanyo and others.
Because these players have very little leverage it is possible that they sign a
license at higher royalty rates.
The V-chip Delay - Wi-LAN is awaiting a final summary judgment from the
district judge with its case against LG. If the judge agrees with the magistrate,
which is normally the case, Wi-LAN is expected to appeal and the whole process
could take over a year. As can be seen in Exhibit 3, v-chip‟s future value is not
discounted into the current share price. Our view is any progress within the V-
chip program is a call option that investors won‟t pay much for prior to some
progress in the courts.
Exhibit 1 outlines Wi-LAN current formal litigation.
Exhibit 1. Current Litigation Schedule
Estimated Trial Date
Patent Current Stage Companies Est. Value (Mil.
USD)
April 2013 3GPP Entering the discovery phase of litigation. Markman hearing scheduled for April 2012.
Ericsson, Sony Ericsson, and Alcatel-Lucent
$100+
Late 2012 to Early 2013
V-Chip Awaiting ruling from Judge, at which point if he sides w ith the magistrate judge, Wi-LAN will appeal, which normally can take a year,
LG $30+
In 2 Years Handsets Awaiting setup of scheduling conference HTC $50+
In 2 to 3 Years Handsets Compliant Filed. Looking to consolidate with the HTC case
Apple, Dell, Hewlett-Packard, Kyocera, Sierra Wireless, Novatel Wireless
$100+
Source : CIBC World Markets Inc,.
Updated NAV Of Deals Model We have updated our signed deals plus net cash model to include potential
settlements from this broader group of wireless opportunities including handsets
(CDMA, 3G and other wireless patents) and of course V-chip. Keep in mind our
NAV does not include longer term LTE wireless patents or any Gladios deal.
Our estimates are now based on a mix of longer term (6-year) and medium
term (4-year) deals which we expect Wi-LAN will begin to focus on given its
much stronger and broader wireless patent portfolio. The objective of shorter
agreements is to bring OEMs to the table on areas such as 3G now, leaving the

A Good Buy, Below The NAV - December 05, 2011
5
less mature 4G (or LTE) infringement to deal with in follow-on renewal
agreements. This shift by Wi-LAN has merit as it is clearly designed to
encourage deals sooner rather than getting stuck in protracted negotiations on
issues and market outlooks such as the 4G market that cannot be known at this
time.
Deducting Expenses: In Q3, Wi-LAN announced $28 million ($0.23/share) in
payments to McKool Smith lawyers for their contribution in the Wi-Fi case. Wi-
LAN will make roughly 20 equal quarterly payments. We are now deducting this
amount from our NAV as it is a specific and known expense related to the signed
Wi-Fi agreements of late 2010 and 2011.
The balance of Wi-LAN expenses we do not deduct from our NAV. Our issue in
doing this is determining which expenses should be deducted. Our NAV is based
on a finite number of four to six year agreements that excludes many
opportunities. We also assume no renewals or terminal value. By contrast, total
expenses cover all the opportunities both short and long term. For those
investors who still would like an idea on the impact we present the value of that
calculation here. The present value of five years of total operating expenses
(including McKool Smith) at the current run rate at an APR of 15% is $139
million or $1.12 per share.

A Good Buy, Below The NAV - December 05, 2011
6
Exhibit 2. NAV Of Signed And Potential Deals Plus Net Cash
Wi-LAN (WIN-TSX)
Avg. Revenue Per
Year
Value
Remaining
($Mil.)
Per ShareAvg. Revenue
Per Year
Value Expected
($Mil.)Per Share
Major Wireless Deals Signed in '802/'222 EDTX Case Major Unsigned Wireless Deals
Broadcom $20.00 $100.74 $0.82 STMicroelectronics $4.22 $25.36 $0.21
Atheros $13.52 $67.72 $0.55 MediaTek $1.80 $10.80 $0.09
Intel $13.02 $65.49 $0.53 ZTE $2.98 $17.92 $0.15
Marvell $7.55 $37.76 $0.31 Pantech $1.16 $6.99 $0.06
CSR $5.72 $29.42 $0.24 Sanyo $1.02 $6.12 $0.05
UTStarcom $0.60 $12.12 $0.10 Other Semis $5.84 $35.11 $0.28
Realtek $2.45 $12.31 $0.10 Total Value of Remaining of Unsigned Deals $17.03 $102.30 $0.83
Ralink $1.52 $7.58 $0.06 3GPP (Formal Litigation Began October 2010)
2Wire $0.78 $4.56 $0.04 Alcatel-Lucent $5.13 $30.79 $0.25
Netgear $0.98 $5.70 $0.05 Ericsson $7.80 $46.77 $0.38
Acer $0.99 $4.73 $0.04 SonyEricsson $3.02 $18.11 $0.15
Dell - Laptops only $0.37 $1.98 $0.02 Total Value of Remaining $15.95 $95.68 $0.77
Apple - Laptops only $1.33 $6.45 $0.05 Wireless (Formal Litigation Began September 2011)
Hewlett-Packard - Laptops only $0.93 $4.95 $0.04 Apple (4-Year, no LTE) $17.05 $68.20 $0.55
D-Link $0.59 $3.42 $0.03 Dell $0.63 $3.76 $0.03
Belkin $0.39 $2.28 $0.02 Hewlett-Packard $0.97 $5.84 $0.05
T.I. $8.80 $0.07 HTC (4-Year, no LTE) $11.60 $46.40 $0.38
Other Wireless Deals $0.40 $2.77 $0.02 Kyocera $3.18 $19.09 $0.15
Wireless Deals Signed $71.14 $378.77 $3.07 Novatel $0.91 $5.44 $0.04
Major Other Wireless / DSL Deals Signed Sierra $2.38 $14.25 $0.12
Motorola $5.84 $28.18 $0.23 Total Value of Remaining '802 & '222 $36.70 $162.97 $1.32
LG $4.80 $21.89 $0.18 Renewal Deals
Samsung $7.34 $14.60 $0.12 Nokia (4-Year Renewal, no LTE) $8.04 $32.15 $0.26
Cisco $2.39 $11.65 $0.09 Samsung (4-Year Renewal, no LTE) $17.41 $69.65 $0.56
Sharp $0.56 $4.19 $0.03 RIM (4-Year Renewal, no LTE) $12.53 $50.13 $0.41
RIM $0.68 $1.69 $0.01 Total Value of Major Upcoming Renewals $37.98 $151.93 $1.23
Asus $0.52 $0.99 $0.01 Est. Value of Unsigned Wireless Deals $107.66 $512.87 $4.15
Other Deals $2.28 $22.80 $0.18 Major Unsigned V-Chip
CDMA/Other Wireless Signed $24.41 $105.99 $0.86 Samsung (U.S. only) $12.08 $61.34 $0.50
V-Chip Signed Sony (U.S. only) $6.92 $35.11 $0.28
Funai $3.83 $26.82 $0.22 LG (North America) $5.20 $26.42 $0.21
AmTran $3.36 $22.62 $0.18 Panasonic (North America) $4.08 $20.71 $0.17
Sanyo V-chip $1.87 $16.84 $0.14 Toshiba (U.S. only) $4.17 $21.18 $0.17
Top Victory $1.37 $12.33 $0.10 Sharp (U.S. only) $2.72 $16.30 $0.13
Other v-Chip $2.47 $22.27 $0.18 Est. Value of V-Chip Market $35.17 $181.05 $1.47
V-Chip Signed $12.91 $100.88 $0.82 Signed And Unsigned Value Of The Opportunity
Cash & Short Term Investments $196.97 $1.59 Wireless $203 $998 $8.07
Value of Deals Signed + Cash $108 $782.61 $6.33 V-Chip $48 $282 $2.28
Less: McKool Smith Payments ($28.00) ($0.23) Cash & Short Term Investments $197 $1.59
Value of Deals Signed + Net Cash $108 $754.61 $6.11 Less: McKool Smith Payments ($28) ($0.23)
Value of Signed/Unsigned + Cash $251 $1,449 $11.72
Asset Value of Deals
Discounted at 5%
Value of Potential Deals
Discounted at 15%
Todd Coupland (416) 956-6025
Robin Manson-Hing (416) 594-7232
Source: Company reports and CIB C World Markets Inc.
Valuing Wi-LAN The Share Price Tracks the NAV: Exhibit 3 outlines the share performance
versus the NAV of signed deals plus net cash, showing that the share price has
indeed traded at or above its signed deals plus net cash value for most of the
past two years. Currently the share price has dropped below their signed deals
plus net cash value. We believe by entering the stock at these levels
investors will be positioned for future agreements and upside.

A Good Buy, Below The NAV - December 05, 2011
7
Exhibit 3. Share Price Versus NAV Of Signed Deals Plus Net Cash
Source: Company reports and CIB C World Markets Inc.
The V-Chip Delay Is Already Priced In: As mentioned previously, Assuming
LG prevails with its v-chip judgment, we fully expect Wi-LAN to file an appeal on
the merits that LG does in fact infringe in spite of its claim of its work around. It
will take a year or more for Wi-LAN to appeal any ruling in favor of LG. As result,
we see the v-chip opportunity pushed out as other major players who have not
signed a license are likely to take a wait and see approach. Note that in our
upside NAV, the remaining v-chip value is approximately $1.60 per share. This is
down from about $2 per share. The differences are a lower royalty rate
assumption and to a lesser extent lower TV sales. As can be seen from Exhibit 3,
investors have taken the v-chip opportunity out of their expectations and any
future signings of v-chip players listed in our NAV would be considered
upside.
Uses for the Cash
Wi-LAN continues to take a multi-pronged approach to patent acquisitions,
including:
1. Buy Patents: Direct purchases of patent portfolios as was done with
Motorola antenna and Glenayre wireless patents. It was mentioned last
quarter that they have signed partnerships in cloud computing, internet based technology and even medical patent opportunities.

A Good Buy, Below The NAV - December 05, 2011
8
2. Partner for Patents: The Gladios IP model is already making significant
inroads with two significant agreements with 01Communique and Poynt. It was said there are a number of other deals on the table and they are
now in the process of due diligence. We generally expect these
opportunities will take until 2013 or so to establish themselves as licensing programs.
3. Full M&A: Company acquisitions could also be on the horizon, to a
smaller extent than MOSAID. Recall the last significant acquisition made
by Wi-LAN was Tri-Vision (v-chip) for $108 million in 2007. Wi-LAN has stated that with their excess cash, M&A remains an option.
Q3 Results Revenue was aided by $1 million in brokerage revenue from the sale of patents
to one party. Perhaps the only surprise was the slightly lower-than-expected
litigation expense ($2.3MM vs. estimate of $3MM) that was countered by higher
R&D costs and G&A costs. The end result was an in-line quarter.
Exhibit 4. Q3 Results
Revenue ($Mil) Net Margin (%) Adjusted Net
Income ($Mil) Adj. EPS
Q3/11 Actual $27.8 81.8% $22.8 $0.18
Q3/10 - Year Ago $11.3 9.7% $1.1 $0.01
Y/Y Change 147% 7211 bps 1979%
Q2/11 - Quarter Ago $27.4 75.9% $20.8 $0.17
Q/Q Change 1% 591 bps 9%
Q4/11E - Consensus (7 estimates) $27.6 70.6% $19.5 $0.17
Actual Difference to Consensus 1% 1122 bps 17%
Q4/11E - Prior Estimate $28.0 75.4% $21.1 $0.17
Actual Difference to CIBC Est. -1% 646 bps 8%
Source : Thomson One and CIB C World Markets Inc.

A Good Buy, Below The NAV - December 05, 2011
9
Q4 Forecast The Q4 guidance implies no new business and slightly higher operating costs
which we have forecasted for.
Exhibit 5 Q4 Forecast
Revenue
($Mil) Net Margin
(%) Adjusted Net Income ($Mil)
Adj. EPS
Q4/11E Estimate $27.0 73.3% $19.8 $0.16
Q4/10 - Year Ago $11.2 -43.6% ($4.9) ($0.04)
Y/Y Change 141% 11690 bps -506%
Q3/11 - Quarter Ago $27.8 81.8% $22.8 $0.18
Q/Q Change -3% -854 bps -13%
Q4/11E - Consensus (7 estimates) $27.4 78.6% $21.5 $0.17
Difference to our Estimate -1% -526 bps -8%
Q4/11E - Implied Guidance Range $23.4 -
$28.4 47% - 79% $13.4 - $18.4 $0.11 - $0.15
Q4/11E - Implied Mid-Point $25.9 63.0% $15.9 $0.13
Difference to our Estimate 4% 16% 24%
Q4/11E - Prior Estimate $30.0 75.4% $22.6 $0.18
Actual Difference to CIBC Est. -10% -205 bps -12%
Consensus for Net Income and EPS is GAAP based.
2011 and 2012 Forecast We have lowered our 2012 forecast to take into account updated guidance, a
delayed v-chip opportunity, as well as payments to McKool Smith over the next
five years. Our 2012 forecast is conservative and is based on the current run
rate of Wi-LAN business. Any material signings would require us to move our
estimates higher.
Exhibit 6. F2011 and F2012 Forecast
Net
Revenue ($Mil)
Net Margin (%)
Adjusted Net Income ($Mil)
Adj. EPS
2010A $51 8.3% $4.2 $0.05
2011E
CIBC – new $109 70.4% $76.4 $0.62
Y/Y Change 114% 6213 bps 1726%
CIBC – prior $112 69.0% $78.4 $0.62
Change in Estimate -3% 138 bps -2%
Guidance Range $105 -
$110 61% - 71% $70 - $75 $0.57 - $0.61
Guidance Mid-Point $108 66.1% $72.5 $0.59
Prev ious Guidance Range $110 -
$115 65% - 73% $75 - $80 $0.61 - $0.66
Prev ious Guidance Mid-Point $113 69.0% $77.5 $0.64
In Comparison to our Estimate 4% -140 bps 1%
Consensus (7 Estimates) $105 71.1% $74.5 $0.58
Consensus vs. CIBC -4% 72 bps -3%
2012E
CIBC – new $108 58.8% $63.5 $0.51
Y/Y Change -1% -1155 bps -17%
CIBC – prior $134 74.0% $99 $0.79
Change in Estimate -19% -1522 bps -36%
Consensus (7 Estimates) $128 72.7% $92.7 $0.70
Consensus vs. CIBC -15% -1384 bps -31%
Source: Thomson One A nalytics and CIBC World Markets Inc.

A Good Buy, Below The NAV - December 05, 2011
10
Recommendation And Valuation
We maintain our Sector Outperformer rating and price target of $10.
Wi-LAN‟s share price is trading just below the value of its signed agreements
plus cash. The upside to our target is based on agreements that are highly likely
given the success that Wi-LAN has demonstrated to date in its key patent areas.
We have kept LG as a potential deal until an outcome has become clearer.
Price Target Calculation
Our price target of $10 is based on our portion of potential deals in the NAV that
can possibly be signed over the next 18 months plus pro forma cash per share
of $1.59 less McKool Smith payments and interest income of $0.01.
Another way to value Wi-LAN is to deduct the run rate of operating expenses
over the next five years ($1.12) off the PV of signed and unsigned deals plus
cash ($11.95) to come up with a price of $10.83.
Finally investors could look at peer comparison for valuation, for which 14x
F2012 EPS of $0.51 plus cash per share of $1.59 gives us $8.73. Peers are
trading at 18.3x C2012 EPS, although it should be noted that only about half of
WIN‟s 2012 EPS is taxed due to back losses carrying forward until H2/2012.
Again patent licensing peers trade at 23.7x and 18.3x 2011 and 2012 EPS. WIN
trades at 10.7x next year‟s EPS. Our view is Wi-LAN valuation will continue to
close in on its peer group given its growth in revenue and earnings, licensing
agreements and this management team‟s superior business execution. Also as
they sign new agreements, their NAV of signed deals plus cash will increase.
Key Risks To Price Target Ability To Sign Remaining Players In The Market: While the majority of
major wireless players are now signed by Wi-LAN, a number still remain
outstanding including Texas Instruments and HTC. Also there are a number of
other players that Wi-LAN has yet to go after including Pantech, ZTE, Kyocera
and potentially even Qualcomm or Apple. As well, there remain a number of
other significant players in v-chip and 3GPP that still exist.
Monetizing Future Patent Acquisitions: It tends to take over two years upon
patent acquisitions to monetize them. There is a risk in going to trial that the
patents are not deemed legitimate. If this were to happen with any of the major
significant remaining patent portfolios it would likely prove to be a negative
towards the stock price.

A Good Buy, Below The NAV - December 05, 2011
11
Exhibit 7. Forecast Model
Wi-LAN 2010A 2011E 2012E Q1/10 Q2/10 Q3/10 Q4/10 Q1/11 Q2/11 Q3/11 Q4/11E Q1/12E Q2/12E Q3/12E 0.15
FY End October 31 Mar-10 Jun-10 Sep-10 Dec-10 Mar-11 Jun-11 Sep-11 Dec-11 Mar-12 Jun-12 Sep-12 Dec-12
Income Statement (CAD mlns up to 2010, USD mlns otherwise, except per share data)
Fixed revenue 22.0 23.0 22.3 23.0 23.0 23.0 23.0 23.0
Variable revenue 4.0 5.0 5.6 4.0 4.0 4.0 4.0 4.0
Top 10 Customers Revenue 35.2 12.4 9.8 9.5 22.4 21.7 21.5
# of Licensees Over 10% of Royalty Revenue 3 3 2 3 2 3 3
Royalties 46.9 13.9 10.5 11.3 11.2 26.3 27.4 26.8
Brokerage 3.8 2.5 1.3 0.0 1.0
Backlog
Revenue 50.7 108.6 108.0 16.5 11.8 11.3 11.2 26.3 27.4 27.8 27.0 27.0 27.0 27.0 27.0
Cash revenue
Non-cash revenue
Income Expenses
Patent Licencing 5.6 4.2 4.0 2.2 1.3 1.0 1.0 0.9 0.9 1.6 0.9 1.0 1.0 1.0 1.0
Litigation 29.8 17.9 12.0 4.0 6.8 7.0 12.0 11.4 2.3 1.2 3.0 3.0 3.0 3.0 3.0
McKool Smith Payments 0.0 6.0 1.5 1.5 1.5 1.5
Research and Development 3.8 6.1 8.0 0.9 0.8 0.8 1.2 1.3 1.5 1.9 1.5 2.0 2.0 2.0 2.0
G&A 7.2 10.0 10.0 1.8 1.9 1.6 2.0 2.3 2.7 2.7 2.3 2.5 2.5 2.5 2.5
Total operating expenses 46.4 38.2 40.0 8.9 10.8 10.4 16.2 15.8 7.4 7.3 7.7 10.0 10.0 10.0 10.0
Stock-based compensation 1.9 3.5 2.0 0.6 0.5 0.4 0.4 0.7 0.8 1.5 0.5 0.5 0.5 0.5 0.5
Realized FX loss (gain) (1.7)
Unrealized FX loss/(gain) 0.0 (0.2) 0.2 (0.1) 0.1 (2.1) (0.3) 12.7
EBITA 2.5 58.3 66.0 7.1 0.3 0.5 (5.5) 12.0 19.5 8.0 18.8 16.5 16.5 16.5 16.5
Amortization 21.4 21.8 22.0 5.3 5.4 5.4 5.4 5.1 5.5 5.7 5.5 5.5 5.5 5.5 5.5
EBIT (19.0) 36.5 44.0 1.8 (5.0) (4.9) (10.9) 6.9 14.0 2.3 13.3 11.0 11.0 11.0 11.0
Interest:
Interest income 0.7 3.5 2.0 0.2 0.1 0.2 0.2 0.3 0.5 2.2 0.5 0.5 0.5 0.5 0.5
Interest expense on long-term debt 0.8
Transaction costs 1.2
Accretion of debt discount 0.5
Unrealized gain on conversion feature (8.5)
Financing costs 3.6
Restructuring charges 0.8 0.8
Other interest expense
Earnings from continuing operations (19.0) 40.1 46.0 2.0 (4.9) (5.5) (10.7) 7.2 14.5 6.8 13.8 11.5 11.5 11.5 11.5
Deduct: Provision for future income tax recovery 0.0 0.0 0.9 (0.9) (13.6) 3.5
Deduct: Cumulative translation adjustment 9.8
Income Taxes 3.1 2.6 6.4 1.0 0.8 1.4 1.0 0.7 0.9 0.0 0.0 0.0 3.2 3.2
Deferred Taxes (1.4)
Net income (loss) (22.2) 41.4 39.5 1.1 (5.9) (6.2) (12.1) 10.0 10.3 7.317 13.8 11.5 11.5 8.3 8.3
Basic shares outstanding 103.3 121.4 123.0 102.1 102.8 103.3 103.4 117.1 122.3 123.4 123.0 123.0 123.0 123.0 123.0
Fully Diluted shares outstanding 103.3 123.5 123.6 103.6 102.8 103.3 103.4 119.9 124.8 125.6 123.6 123.6 123.6 123.6 123.6
Shares Outstanding End of Period 122.1 123.3 123.6
EPS - Basic ($0.21) $0.34 $0.32 $0.01 ($0.06) ($0.06) ($0.12) $0.09 $0.08 $0.06 $0.11 $0.09 $0.09 $0.07 $0.07
EPS - Fully Diluted ($0.21) $0.34 $0.32 $0.01 ($0.06) ($0.06) ($0.12) $0.08 $0.08 $0.06 $0.11 $0.09 $0.09 $0.07 $0.07
Adjusted Net Income
Net Income ($23.0) $41.4 $39.5 $1.1 ($5.9) ($6.2) ($12.1) $10.0 $10.3 $7.3 $13.8 $11.5 $11.5 $8.3 $8.3
Adjustment for discontinued Operations $0.0 $0.0 $0.0 $0.0 $0.0 $0.0 $0.0 $0.0 $0.0 $0.0 $0.0 $0.0 $0.0 $0.0 $0.0
Net Income From Continuing Operations ($23.0) $41.4 $39.5 $1.1 ($5.9) ($6.2) ($12.1) $10.0 $10.3 $7.3 $13.8 $11.5 $11.5 $8.3 $8.3
EPS From Continuing Operations ($0.22) $0.34 $0.32 $0.01 ($0.06) ($0.06) ($0.12) $0.08 $0.08 $0.06 $0.11 $0.09 $0.09 $0.07 $0.07
Add: Amortization $21.42 $21.77 $22.00 5.3 5.4 5.4 5.4 5.1 $5.48 $5.7 $5.50 $5.50 $5.50 $5.50 $5.50
Add: Provision for future income tax recovery (13.6) $3.48 ($0.5)
Add: Cumulative translation adjustment 9.8 $0.00
Taxes $3.14 $1.72 $0.00 0.0 1.0 0.8 1.4 1.0 $0.72
Stock-based compensation $1.89 $3.55 $2.00 0.6 0.5 0.4 0.4 0.7 $0.85 $1.5 $0.50 $0.50 $0.50 $0.50 $0.50
Restructuring $0.76 $0.00 0.8 $0.3
Add: Unrealized FX loss $12.7
Add: Mosaid Transaction Costs ($4.2)
Other $0.00 $0.00
Adjusted Net Income 4.2 76.4 63.5 7.0 0.9 1.1 (4.9) 13.0 20.8 $22.8 19.8 17.5 17.5 14.3 14.3
Cash EPS 0.05 0.62 0.51 0.07 0.01 0.01 (0.04) 0.11 0.17 0.18 0.16 0.14 0.14 0.12 0.12
Effective tax rate (%) 16.5% -6.6% -14.0% 0.0% 19.5% 13.8% 13.3% 13.9% 4.9% 13.3% 0.0% 0.0% 0.0% 28.0% 28.0%
Net Margin (%) 8% 70% 59% 43% 8% 10% -44% 49% 76% 82% 73% 65% 65% 53% 53%
Source: Company reports and CIB C World Markets Inc.

A G
ood
Buy
, Belo
w T
he
NA
V - D
ecem
ber 0
5, 2
011
12
Exhibit 8. Comparables Table
Ticker Fiscal Price P/Net
Symbol YE Mkt. Cap. 12/5/2011 LTM FY0 FY1 FY2 C10E C11E C12E LTM FY0 FY1 FY2 C10 C11E C12E C10 C11E C12E Tang BV C10 C11E C12E C10 C11E C12E
Mosaid Technologies (C$) MSD-T Apr-12 #N/A $45.84 #N/A $2.89 $2.26 $2.65 $3.03 $2.50 $2.36 NA 15.8x 20.3x 17.3x 15.1x 18.4x 19.5x NA NA NA NA NA NA NA #N/A #N/A NA
Wi-LAN Inc. (C$) WIN-T Dec-11 681 $5.51 $0.34 $0.05 $0.62 $0.51 $0.05 $0.62 $0.51 16.4x 50+ 8.9x 10.7x 50+ 8.9x 10.7x 50+ 8.3x 7.3x 2.0x 9.5x 4.5x 4.5x $0.18 $0.53 $0.53#N/A
Acacia Research (US$) ACTG-O Dec-11 1,520 $35.45 1.29 1.39 1.24 1.87 1.39 1.24 1.87 27.5x 25.5x 28.6x 19.0x 25.5x 28.6x 19.0x 21.6x 18.1x 11.4x 25.7x 9.2x 5.8x 4.6x $1.46 NA NA
InterDigital Inc. (US$) IDCC-O Dec-11 1,977 $43.46 2.21 3.43 1.82 2.58 3.43 1.82 2.58 19.7x 12.7x 23.9x 16.8x 12.7x 23.9x 16.8x 6.8x 11.8x 7.3x 6.3x 4.5x 6.0x 4.8x NA NA NA
Qualcomm, Inc. (US$) QCOM-O Sep-11 91,598 $54.49 2.86 3.20 3.58 4.00 2.66 3.29 3.69 19.1x 17.0x 15.2x 13.6x 20.5x 16.6x 14.8x 16.4x 11.6x 10.8x 4.5x 7.5x 5.4x 4.5x $1.75 $3.84 $3.92
Rambus Inc. (US$) RMBS-O Dec-11 864 $7.86 0.07 1.30 (0.19) 0.05 1.30 (0.19) 0.05 50+ 6.0x NM 50+ 6.0x NM 50+ 3.1x NA NA 6.0x 2.6x 2.8x 2.7x NA NA NA
RPX (US$) RPXC-O Dec-11 774 $17.00 0.30 0.30 NA NA 0.30 NA NA 50+ 50+ NA NA 50+ NA NA 22.9x NA NA NA 6.5x NA NA $1.04 NA NA
Tessera Technologies Inc. (US$) TSRA-O Dec-11 884 $17.15 0.94 1.14 0.67 0.76 1.14 0.67 0.76 18.2x 15.0x 25.6x 22.6x 15.0x 25.6x 22.6x 7.1x NA 11.4x 1.5x 2.6x 3.1x 3.0x $2.10 NA $1.02
Group Average 21.1x 15.3x 23.3x 18.0x 15.9x 23.7x 18.3x 13.0x 13.8x 10.2x 8.8x 5.5x 4.6x 3.9x
Note: Estimates for all companies were taken from Firstcall, except Wi-LAN and Mosaid which are CIBC WM estimates.
Note: WIN and MSD are rated by CIBC World Markets, all other companies are not rated by CIBC World Markets.
Pricing and financial data converted to CDN using current exchange rate of: 1.01 C$/US$
Sources: CIBC World Markets, First Call Corp., Company Reports, Bloomberg.
See “Legal Disclaimer” section at the end of this report for important disclosures, including potential conflicts of interest.
CFPS
Fiscal Yr. Adjusted FD EPS
in local currency P/S less Net CashEV/EBITDA
Price to
Adjusted FD EPS Multiples
Source: Company reports and CIB C World Markets Inc.

A Good Buy, Below The NAV - December 05, 2011
13
Appendix Assumptions on NAV of Signed Deals - In modeling the backlog of royalty
payments, we assumed the weighted average life of their signed deals is
between 4 and 6 years. Wi-LAN has signed 255 licenses as of September 30.
The breakdown is in the range of 125 v-chip deals (12% of revenue), 120
wireless (85%+ of revenue) and 10 wireline agreements. We make estimates on
smaller unannounced deals based on quarterly royalty revenue reported, public
statements on license concentration and breakdowns, licensees publicly
announced and market share data.
80% of revenue from royalties from their top 10 customers in Q3 – Our
NAV model estimates this to be 78%. The $21.5 million in royalty revenue in Q3 from their top 10 licensees compares with $21.6 million last quarter and $22.4
million the prior quarter. This contribution can be expected to remain virtually
flat for the coming quarters as the large majority of licenses are fixed payments. This will only change when Wi-LAN adds material new licenses.
V-chip adjusted – In Q2, we noticed the unusually low v-chip sales number.
On the conference call it was re-confirmed that approximately 20% of Wi-LAN‟s
revenue is variable with a major source of that coming from V-Chip, said to about 12 to 13% of revenue. We are lowering our estimates on V-Chip, both
current revenue and future opportunity, to take into account these comments
and the lower expected volumes of TVs sold. A rough 15% decline in sales of digital TVs y/y was said to be a significant factor. We now estimate average
revenue per year from v-chip to be 12% (of revenue) on average, in-line with comments last quarter. We believe v-chip licensees Funai and AmTran (who
supplies more than half the TVs sold by Vizio) were 10% customers in the
quarter and resulted in the slightly lower revenue from their top 10 customers.
Keep in mind that our assumptions could be off based on timing of the payments
and revenue recognition as well as not having the exact numbers of each agreement. Again Exhibit 9 outlines our NAV analysis of both signed and
unsigned agreements by major licensees.

A Good Buy, Below The NAV - December 05, 2011
14
Exhibit 9. List Of Major Signed Deals
Licensee Patent Estimated Date Signed Estimated Effective DateEst. Original
Contract Size
Est.
LengthEst. Type Of Contract
Fully Diluted
Shares
Outstanding
(millions)
Per Share
Current
Value
Est. Expiry Date
Cisco (Original) All Wi-LAN patents at the time December 2, 2005 December 31, 2005 $10 MM 5Term License Running Royalty Upon
Meeting Minimum Volume45.8 $0.00 December 2, 2010
Fujitsu WiMAX 802.16d May 29, 2006 June 30, 2006 $0 MM 5Term License Running Royalty Upon
Meeting Minimum Volume49.0 $0.00 June 30, 2011
Nokia All Wi-LAN patents December 4, 2006 December 31, 2006 $15 MM 0 Lump Sum Payment 66.7 December 31, 2006
Tri-Vision V-Chip March 27, 2007 June 3, 2007 $128 MM 10 Term License Running Royalty 72.3 $0.47 December 31, 2016
March Networks All Wi-LAN patents "ELP" April 3, 2007 June 30, 2007 $0 MM 5 Term License Running Royalty 72.3 $0.00 June 30, 2012
Powerstar International "Certain IP" July 31, 2007 April 3, 2007 $0 MM 5 Term License Running Royalty 83.7 $0.00 July 30, 2012
Unannounced Company All Wi-LAN patents "ELP" June 28, 2007 June 30, 2007 $15 MM 5 Term License Running Royalty 83.7 $0.01 June 30, 2012
Fujitsu Remaining patents from Wi-LAN July 25, 2007 September 30, 2007 $4 MM 5 Term License Running Royalty 83.7 $0.01 September 30, 2012
AmTRAN V-Chip October 26, 2007 October 31, 2007 $30 MM 9 Term License Running Royalty 93.5 $0.12 November 1, 2016
Panasonic CDMA and Wi-Fi November 1, 2007 December 31, 2007 $0 MM 5 Term License Running Royalty 93.5 $0.00 December 31, 2012
Hyundai IT V-Chip November 20, 2007 December 31, 2007 $2 MM 9 Term License Running Royalty 93.5 $0.01 December 31, 2016
Acer Canada V-Chip December 6, 2007 December 31, 2007 $2 MM 9 Term License Running Royalty 93.5 $0.01 December 31, 2016
Hon Hai Precision V-Chip January 29, 2008 January 31, 2008 9 Term License Running Royalty 93.5 $0.00 December 31, 2016
Other Smaller V-Chip Licenses V-Chip Late 2007 to Early 2008 Late 2007 to Early 2008 $20 MM 9 Term License Running Royalty 93.5 $0.08 December 31, 2016
Four Unidentified Companies Wi-Fi March 6, 2008 March 31, 2008 $10 MM 5 Term License Running Royalty 93.5 $0.02 March 31, 2013
Zonet Wi-Fi March 27, 2008 March 31, 2008 $0 MM 6Term License Running Royalty + Past
Use93.5 $0.00 March 31, 2014
ASUS Wi-Fi May 22, 2008 June 30, 2008 $3 MM 5 Term License Running Royalty 93.5 $0.01 June 30, 2013
RIM All Wi-LAN patents August 11, 2008 September 30, 2008 $5 MM 5 Term License Running Royalty 93.5 $0.01 September 30, 2013
Samsung All Wi-LAN patents January 15, 2009 January 15, 2009 $37 MM 5 Term License Running Royalty 93.5 $0.12 January 15, 2014
Westinghouse V-Chip March 10, 2009 March 31, 2009 $6 MM 8 Term License Running Royalty 92.8 $0.03 December 31, 2016
Infineon Technologies Wireless LAN, xDSL, other patents May 7, 2009 June 30, 2009 $2 MM 5 Term License Running Royalty 94.4 $0.01 July 1, 2014
Casio CDMA, Wi-Fi, Bluetooth June 24, 2009 June 30, 2009 $1 MM 5 Term License Running Royalty 94.4 $0.00 July 1, 2014
Agilent Wi-Fi, CDMA, Bluetooth July 31, 2009 September 30, 2009 $1 MM 5 Term License Running Royalty 94.4 $0.00 October 1, 2014
Nikon Wi-Fi October 29, 2009 December 31, 2009 $1 MM 5 Term License Running Royalty 102.9 $0.00 January 1, 2015
NEC ADSL November 10, 2009 December 31, 2009 $5 MM 5 Term License Running Royalty 102.9 $0.02 January 1, 2015
Buffalo Certain wireless technology December 15, 2009 December 31, 2009 $5 MM 5 Term License Running Royalty 102.9 $0.02 January 1, 2015
Ricoh Wi-Fi December 16, 2009 December 31, 2009 $2 MM 5 Term License Running Royalty 102.9 $0.01 January 1, 2015
Sharp Wi-Fi June 17, 2010 June 30, 2010 $6 MM 6 Term License Running Royalty 102.8 $0.03 July 1, 2016
UTStarcom Wi-Fi, CDMA, Bluetooth August 11, 2010 September 30, 2010 $3 MM 5 Term License Running Royalty 103.3 $0.02 October 1, 2015
LG Wi-Fi, CDMA, Bluetooth December 22, 2010 December 31, 2010 $29 MM 6 Term License Running Royalty 103.4 $0.17 January 1, 2017
Intel Wi-Fi, CDMA, Bluetooth January 14, 2011 March 31, 2011 $78 MM 6 Term License Fixed Payments 122.1 $0.48 April 1, 2017
Atheros Wi-Fi, CDMA, Bluetooth January 18, 2011 June 30, 2011 $81 MM 6 Term License Fixed Payments 122.1 $0.52 July 1, 2017
Broadcom Wi-Fi, CDMA, Bluetooth January 19, 2011 March 31, 2011 $120 MM 6 Term License Fixed Payments 122.1 $0.74 April 1, 2017
Realtek Wi-Fi, CDMA, Bluetooth January 25, 2011 March 31, 2011 $15 MM 6 Term License Fixed Payments 122.1 $0.09 April 1, 2017
Acer Wi-Fi, CDMA, Bluetooth January 26, 2011 March 31, 2011 $6 MM 6 Term License Fixed Payments 122.1 $0.04 April 1, 2017
Motorola CDMA, Bluetooth January 27, 2011 March 31, 2011 $35 MM 6 Term License Fixed Payments 122.1 $0.22 April 1, 2017
Marvell Wi-Fi, CDMA, Bluetooth January 31, 2011 March 31, 2011 $45 MM 6 Term License Fixed Payments 122.1 $0.28 April 1, 2017
2Wire Wi-Fi January 31, 2011 March 31, 2011 $5 MM 7 Term License Fixed Payments 122.1 $0.03 April 1, 2018
Belkin Wi-Fi January 31, 2011 March 31, 2011 $3 MM 7 Term License Fixed Payments 122.1 $0.02 April 1, 2018
Netgear Wi-Fi January 31, 2011 March 31, 2011 $7 MM 7 Term License Fixed Payments 122.1 $0.04 April 1, 2018
Lenovo Wi-Fi January 31, 2011 March 31, 2011 $2 MM 6 Term License Fixed Payments 122.1 $0.01 April 1, 2017
Westell Wi-Fi January 31, 2011 March 31, 2011 $0 MM 6 Term License Fixed Payments 122.1 $0.00 April 1, 2017
Dell Laptops Wi-Fi Only January 31, 2011 March 31, 2011 $2 MM 6 Term License Fixed Payments 122.1 $0.01 April 1, 2017
D-Link Wi-Fi Only January 31, 2011 March 31, 2011 $4 MM 7 Term License Fixed Payments 122.1 $0.03 April 1, 2018
Hewlett-Packard Laptops Wi-Fi Only January 31, 2011 March 31, 2011 $6 MM 6 Term License Fixed Payments 122.1 $0.03 April 1, 2017
Apple Laptops Wi-Fi Only January 31, 2011 March 31, 2011 $8 MM 6 Term License Fixed Payments 122.1 $0.05 April 1, 2017
Sony Wi-Fi Only January 31, 2011 March 31, 2011 $1 MM 6 Term License Fixed Payments 122.1 $0.01 April 1, 2017
Toshiba Wi-Fi Only January 31, 2011 March 31, 2011 $3 MM 6 Term License Fixed Payments 122.1 $0.02 April 1, 2017
CSR Bluetooth, Wi-Fi February 18, 2011 March 31, 2011 $34 MM 6 Term License Fixed Payments 122.1 $0.21 April 1, 2017
Ralink All Wi-LAN patents February 23, 2011 March 31, 2011 $9 MM 6 Term License Fixed Payments 122.1 $0.06 April 1, 2017
Cisco Virtually All Wi-LAN patents April 15, 2011 December 31, 2010 $16 MM 6 Term License Fixed Payments 123.3 $0.09 January 1, 2017
T.I. Bluetooth Only July 4, 2011 June 30, 2011 $10 MM 1 Agreement 123.6 $0.04 June 29, 2012
Other Smaller V-Chip Licenses
Throught 2010 and 2011V-Chip July 28, 2011 2010 to 2011 $15 MM 5 Term License Running Royalty 123.6 $0.11 December 31, 2016
Ixia Wi-Fi October 5, 2011 December 31, 2011 $3 MM 5 Term License Fixed Payments 123.6 $0.02 December 31, 2016
Source: CIB C World Marke ts Inc.

A Good Buy, Below The NAV - December 05, 2011
15
Exhibit 10. Semiconductor Insights’ General Findings + ‘759 Validity Confirmed By USPTO In November 2011
Patent Number Title Target Market(s) Technical Strength Commercial Impact Ability To Detect Strength of Claims
Leading CDMA Patents
US RE: 37,802
A Rated Patent
Multicode direct sequence
spread spectrum.
3G (WCDMA), CDMA, WiMAX
WiFi, Digital TV broadcasting
systems (DVB-T, DVB-RCT, DVB-
H, T-DMB, ISDB-TSB).
4 - In a commercial context, the invention
is unique for CDMA and OFDM based
transceiver systems for wireless
applications.
4 - The patent is expected to
have high probability of current
and future use in the listed
target markets.
3 - Significant reverse engineering would be
needed to support the claims relating to DSP
domain as it is not easy to support or detect.
4 - 4 independent and 35 dependent claims. 1
independent claim is method, the others are
apparatus.
US 6,320,897
A Rated Patent
Multicode spread spectrum
communications system.
WiFi, WiMAX, CDMA, Digital TV
broadcasting systems - DVB-T,
DVB-RCT, DVB-H, T-DMB, ISDB-
TSB
4 - In a commercial context, the invention
is unique for CDMA and OFDM based
transceiver systems for wireless
applications.
4 - The patent is expected to
have high probability of current
and future use in the listed
target markets.
3 - Significant reverse engineering would be
needed to support the claims relating to DSP
domain as it is not easy to support or detect.
4 - 4 independent claims and 42 dependent
claims. Of the 4 independent claims 2 are
methods and 2 are apparatus. The claims cover
the possible uses of the invention well.
US 6,192,068
A Rated Patent
Multicode spread spectrum
communications system.
WiFi, WiMAX, CDMA, Digital TV
broadcasting systems (DVB-T,
DVB-RCT, DVB-H, T-DMB, ISDB-
TSB)
4 - The invention is unique for CDMA and
OFDM based transceiver systems for
wireless applications.
4 - The patent is expected to
have high probability of current
and future use in the listed
target markets.
3 - Significant reverse engineering would be
needed to support the claims relating to DSP
domain as it is not easy to support or detect.
4 - 4 independent claims and 7 dependent claims.
Of the 4 independent claims, 2 are method and 2
are apparatus. Claims cover the uses for the
invention very well.
Leading WiFi Patents
US 5,282,222
A Rated Patent
Method and apparatus for
multiple access between
transceivers in wireless
communications using
OFDM spread spectrum.
WiMAX, WiFi, DVB-T, DVB-RCT
and DAB.
4 - In a commercial context the invention is
unique for multi-carrier based transceiver
systems for wireless applications.
4 - The patent is expected to
have high probability of current
and future use in the listed
target markets.
3 - Part of the claims are easy to detect, others
will require reverse engineering.
3 - 2 independent and 10 dependent claims.
Some claims cover details in terms of carrier
spacing and speed limits between TX and Rx,
which could limit the scope of the patent.
CA 2,064,975
A Rated Patent
Method and apparatus for
multiple access between
transceivers in wireless
communications using
OFDM spread spectrum.
WiMAX, Mobile WiMAX, WiFi,
Digital TV broadcasting systems -
DVB-T, DVB-RCT, DVB-H, T-
DMB, ISDB-TSB.
4 - In a commercial context the invention is
unique for multi-carrier based transceiver
systems for wireless applications.
4 - The patent is expected to
have high probability of current
and future use in the listed
target markets.
3 - Part of the claims are easy to detect, others
will require reverse engineering.
3 - 5 independent claims and 25 dependent
claims. Some claims cover details in terms of
carrier spacing and speed limits between TX and
Rx, which could limit the scope of the patent.
Leading DSL Patents
EP 683,580 B1
A Rated Patent
Method for connecting an
HDSL transmission link to an
SDH network.
HDSL 3 - Offers an interesting solution by
performing both operations at the same
location.
3 - The patent filing date is prior
to standards (G.991.1) and may
have an impact if applicable.
4 - Easy to detect by looking at literature to
detect the claims.
3 - 1 independent claim and 2 dependent claims.
The independent claim is broad enough to cover
various mapping formats.
US 5,706,285
A Rated Patent
Network interfacing method
and a network interface for a
digital transmission network.
ADSL2 3 - Data rate adaptation based on
monitoring, buffering and multiplexing for
the time of the invention is quite unique.
3 - The method is promising and
likely to be used in the target
markets.
4 - Easy to detect looking at the literature.
Could use some reverse engineering to
support the claims.
3 - 4 independent claims and 18 dependent
claims. Fixed cell size is mentioned in the claims
and could limit them.
US 5,956,323
B Rated Patent
Power conservation for ports
and modulated data
transmission.
ADSL, ADSL2+ 3 - Offers a power consumption reduction
method by monitoring the loop. Other
methods typically increase the complexity,
and therefore this solution is superior.
3 - The method is promising and
likely to be used in the target
markets.
3 - Standards documentation and literature
review would increase the likelihood of
supporting claims. Some reverse engineering
would help.
3 - 4 independent claims and 3 dependent claims.
The independent claims capture the invention.
The claims cover central office and customer side
equipment.
Leading WiMAX Patents
US 6,549,759
A Rated Patent
Asymmetric adaptive
modulation in a wireless
communication system.
WiMAX, 2.5G (EDGE), 3G
WCDMA (HSPDA), WiFi.
4 - Excellent invention and appears to
have very few, if any, known alternative for
bi-directional point-multipoint wireless
networks.
4 - The patent is expected to
have high probability of current
and future use in the listed
target markets.
3 - Likely that the invention is implemented on
a programmable processor in the form of
software code. Depending on if the code is on
chip or off chip it may be easy or difficult to
support the claims.
4 - 6 independent claims and 21 dependent
claims. 1 independent claims is method while the
rest are apparatus. Claims are well written and
cover the possible uses of the invention very well.
US 6,925,068
A Rated Patent
Method and apparatus for
allocating bandwidth in a
wireless communication
system.
WiMAX, UMTS/WCDMA,
HSPDA, DVB-S2.
4 - The invention allows instantaneous
changes in traffic asymmetry by making
real-time adjustments to upstream and
downstream capacity and bursts by users.
4 - The patent is expected to
have high probability of current
and future use in the listed
target markets.
3 - Likely that the invention is implemented on
a programmable processor in the form of
software code. Depending on if the code is on
chip or off chip it may be easy or difficult to
support the claims.
4 - 5 independent claims and 29 dependent
claims. All independent claims are method claims.
Patents x222 and x975 both apply to WiMAX as well
Source: Company reports and CIB C World Markets Inc.
A Good Buy, Below The NAV - December 05, 2011
16
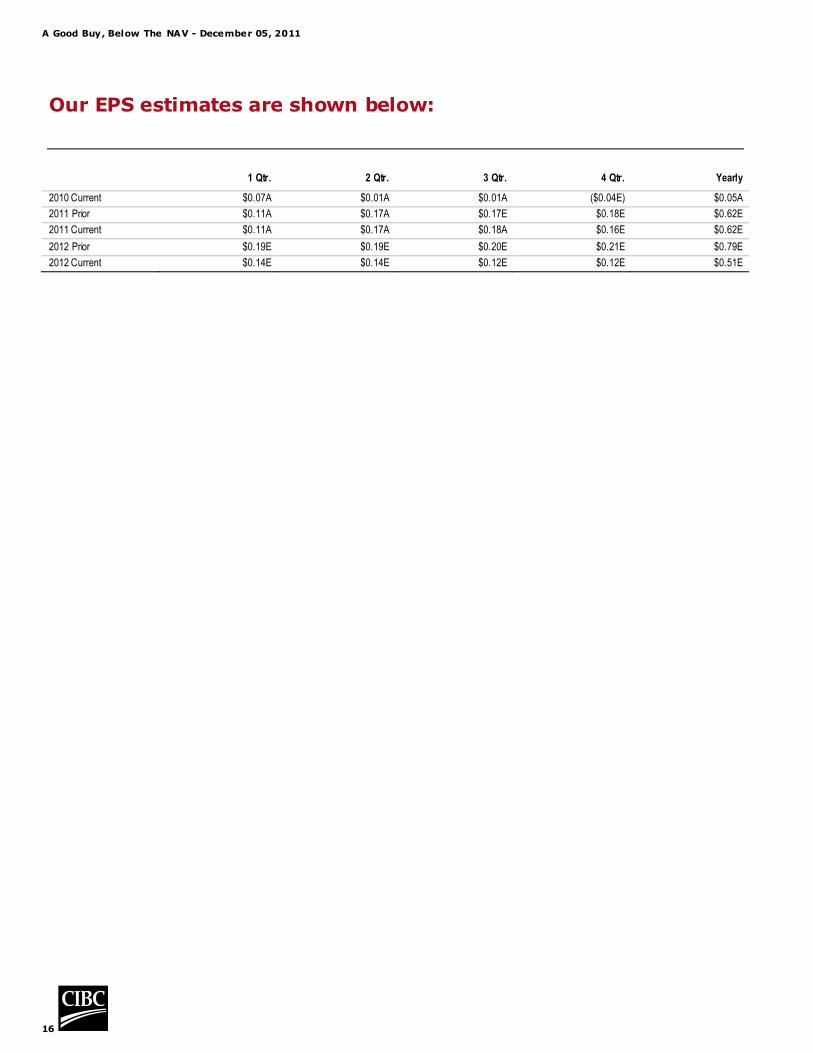
Our EPS estimates are shown below:
1 Qtr. 2 Qtr. 3 Qtr. 4 Qtr. Yearly
2010 Current $0.07A $0.01A $0.01A ($0.04E) $0.05A
2011 Prior $0.11A $0.17A $0.17E $0.18E $0.62E
2011 Current $0.11A $0.17A $0.18A $0.16E $0.62E
2012 Prior $0.19E $0.19E $0.20E $0.21E $0.79E
2012 Current $0.14E $0.14E $0.12E $0.12E $0.51E

A Good Buy, Below The NAV - December 05, 2011
17
IMPORTANT DISCLOSURES:
Analyst Certification: Each CIBC World Markets research analyst named on the front page of this research report, or
at the beginning of any subsection hereof, hereby certifies that (i) the recommendations and opinions expressed herein
accurately reflect such research analyst's personal views about the company and securities that are the subject of this
report and all other companies and securities mentioned in this report that are covered by such research analyst and (ii)
no part of the research analyst's compensation was, is, or will be, directly or indirectly, related to the specific
recommendations or views expressed by such research analyst in this report.
Potential Conflicts of Interest: Equity research analysts employed by CIBC World Markets are compensated from
revenues generated by various CIBC World Markets businesses, including the CIBC World Markets Investment Banking
Department. Research analysts do not receive compensation based upon revenues from specific investment banking
transactions. CIBC World Markets generally prohibits any research analyst and any member of his or her household from
executing trades in the securities of a company that such research analyst covers. Additionally, CIBC World Markets
generally prohibits any research analyst from serving as an officer, director or advisory board member of a company that
such analyst covers.
In addition to 1% ownership positions in covered companies that are required to be specifically disclosed in this report,
CIBC World Markets may have a long position of less than 1% or a short position or deal as principal in the securities
discussed herein, related securities or in options, futures or other derivative instruments based thereon.
Recipients of this report are advised that any or all of the foregoing arrangements, as well as more specific disclosures
set forth below, may at times give rise to potential conflicts of interest.
Important Disclosure Footnotes for Wi-LAN Inc. (WIN)
2a Wi-LAN Inc. is a client for which a CIBC World Markets company has performed investment banking services
in the past 12 months.
2c CIBC World Markets Inc. has managed or co-managed a public offering of securities for Wi-LAN Inc. in the
past 12 months.
2e CIBC World Markets Inc. has received compensation for investment banking services from Wi-LAN Inc. in the
past 12 months.
2g CIBC World Markets Inc. expects to receive or intends to seek compensation for investment banking services
from Wi-LAN Inc. in the next 3 months.

A Good Buy, Below The NAV - December 05, 2011
18
Important Disclosure Footnotes for Companies Mentioned in this Report that Are Covered by CIBC World Markets Inc.:
Stock Prices as of 12/05/2011:
March Networks Corp. (2g) (MN-TSX, $4.63, Sector Outperformer)
MOSAID Technologies Incorporated (2g) (MSD-TSX, $45.84, Sector Outperformer)
Research In Motion Limited (2g, 7) (RIMM-NASDAQ, US$17.02, Sector Outperformer - Speculative)
Sierra Wireless Inc. (2g) (SWIR-NASDAQ, US$6.84, Sector Performer)
Wi-LAN Inc. (2a, 2c, 2e, 2g) (WIN-TSX, $5.51, Sector Outperformer)
Companies Mentioned in this Report that Are Not Covered by CIBC World Markets Inc.:
Stock Prices as of 12/05/2011:
01 Communique Labratory Inc. (ONE-TSX, $0.46, Not Rated)
Acacia Research (ACTG-OTC, US$35.45, Not Rated)
Acer Inc (2353-TW, [TWD]34.00, Not Rated)
Agilent Technologies (A-NYSE, US$37.06, Not Rated)
Alcatel-Lucent (ALU-NYSE, US$1.68, Not Rated)
Amtran Technologies Co. Ltd. (2489-TW, [TWD]16.85, Not Rated)
Apple Inc. (AAPL-NASDAQ, US$393.01, Not Rated)
Asustek (2357-TW, [TWD]199.00, Not Rated)
Atheros Communications Inc. (ATHR-NASDAQ, US$44.99, Not Rated)
Broadcom Corp. (BRCM-NASDAQ, US$30.42, Not Rated)
Cisco Systems (CSCO-NASDAQ, US$18.79, Not Rated)
Comcast (CMCSA-NASDAQ, US$23.15, Not Rated)
CSR plc (CSR-L, p172.75, Not Rated)
D-Link (2332-TW, [TWD]21.00, Not Rated)
Dell Computer Corp. (DELL-NASDAQ, US$15.93, Not Rated)
Fujitsu Ltd. (6702-T, ¥416.00, Not Rated)
Funai Electric Co (6839-T, ¥1671.00, Not Rated)
Google Inc. (GOOG-NASDAQ, US$625.65, Not Rated)
Hewlett-Packard (HPQ-NYSE, US$28.12, Not Rated)
Hitachi Ltd. (6501-T, ¥425.00, Not Rated)
Hon Hai Precision (2317-TW, [TWD]81.20, Not Rated)
HTC Corporation (2498-TW, [TWD]460.00, Not Rated)
Infineon (IFNNY-OTC, US$8.30, Not Rated)
Intel Corporation (INTC-NASDAQ, US$25.01, Not Rated)
InterDigital Communications Corp. (IDCC-NASDAQ, US$43.46, Not Rated)
Ixia (XXIA-OTC, US$11.65, Not Rated)
Kyocera Corp. (6971-T, ¥6790.00, Not Rated)
Lenovo Group Ltd. (992-HK, [HKD]5.49, Not Rated)
LG Electronics (066570-KS, [KRW]79800.00, Not Rated)
LM Ericsson AB (ERIC-NASDAQ, US$10.38, Not Rated)
Marvell Technology (MRVL-NASDAQ, US$13.78, Not Rated)
MediaTek Inc. (2454.TW-TW, [TWD]270.00, Not Rated)
Motorola, Inc. (MMI-NYSE, US$38.89, Not Rated)
NEC (6701-T, ¥171.00, Not Rated)
Netgear (NTGR-OTC, US$37.00, Not Rated)
Nokia Corporation (NOK-NYSE, US$5.37, Not Rated)

A Good Buy, Below The NAV - December 05, 2011
19
Companies Mentioned in this Report that Are Not Covered by CIBC World Markets Inc.: (Continued)
Stock Prices as of 12/05/2011:
Novatel Wireless Inc. (NVTL-NASDAQ, US$3.17, Not Rated)
Panasonic Corp. (6752-T, ¥717.00, Not Rated)
Pantech Co. (025930-KS, [KRW]1230.00, Not Rated)
Poynt Corporation (PYN-V, $0.13, Not Rated)
Qualcomm (QCOM-NASDAQ, US$54.49, Not Rated)
Ralink Technologies (3534-TW, [TWD]102.50, Not Rated)
Rambus (RMBS-OTC, US$7.86, Not Rated)
Realtek (2379.TW-TW, [TWD]44.70, Not Rated)
Ricoh Ltd. (RICOY-OTC, US$43.95, Not Rated)
RPX Corporation (RPXC-NASDAQ, US$23.57, Not Rated)
Samsung Corp. (000830-KS, [KRW]69100.00, Not Rated)
Sanyo Electric (1614-TW, [TWD]26.60, Not Rated)
Sharp Corp. (6753-T, ¥760.00, Not Rated)
Sony (SNE-NYSE, US$17.88, Not Rated)
STMicroelectronics N.V. (STM-NYSE, US$6.26, Not Rated)
Tessera Technologies, Inc. (TSRA-NASDAQ, US$17.15, Not Rated)
Texas Instruments (TXN-NYSE, US$30.23, Not Rated)
Toshiba Corp. (6502-T, ¥341.00, Not Rated)
UTStarcom Inc. (UTSI-OTC, US$1.39, Not Rated)
Westell (WSTL-OTC, US$2.10, Not Rated)
Zhongxing Teleco (ZTE) (000063-SZ, [CNY]17.14, Not Rated)
ZTE Corporation (ZTCOF-OTC, US$3.00, Not Rated)
Ztest Electronics (ZTE-V, $0.22, Not Rated)
Important disclosure footnotes that correspond to the footnotes in this table may be found in the "Key to
Important Disclosure Footnotes" section of this report.

A Good Buy, Below The NAV - December 05, 2011
20
Key to Important Disclosure Footnotes:
1 CIBC World Markets Corp. makes a market in the securities of this company.
2a This company is a client for which a CIBC World Markets company has performed investment banking services
in the past 12 months.
2b CIBC World Markets Corp. has managed or co-managed a public offering of securities for this company in the
past 12 months.
2c CIBC World Markets Inc. has managed or co-managed a public offering of securities for this company in the
past 12 months.
2d CIBC World Markets Corp. has received compensation for investment banking services from this company in
the past 12 months.
2e CIBC World Markets Inc. has received compensation for investment banking services from this company in the
past 12 months.
2f CIBC World Markets Corp. expects to receive or intends to seek compensation for investment banking services
from this company in the next 3 months.
2g CIBC World Markets Inc. expects to receive or intends to seek compensation for investment banking services
from this company in the next 3 months.
3a This company is a client for which a CIBC World Markets company has performed non-investment banking,
securities-related services in the past 12 months.
3b CIBC World Markets Corp. has received compensation for non-investment banking, securities-related services
from this company in the past 12 months.
3c CIBC World Markets Inc. has received compensation for non-investment banking, securities-related services
from this company in the past 12 months.
4a This company is a client for which a CIBC World Markets company has performed non-investment banking,
non-securities-related services in the past 12 months.
4b CIBC World Markets Corp. has received compensation for non-investment banking, non-securities-related
services from this company in the past 12 months.
4c CIBC World Markets Inc. has received compensation for non-investment banking, non-securities-related
services from this company in the past 12 months.
5a The CIBC World Markets Corp. analyst(s) who covers this company also has a long position in its common
equity securities.
5b A member of the household of a CIBC World Markets Corp. research analyst who covers this company has a
long position in the common equity securities of this company.
6a The CIBC World Markets Inc. fundamental analyst(s) who covers this company also has a long position in its
common equity securities.
6b A member of the household of a CIBC World Markets Inc. fundamental research analyst who covers this
company has a long position in the common equity securities of this company.
7 CIBC World Markets Corp., CIBC World Markets Inc., and their affiliates, in the aggregate, beneficially own 1%
or more of a class of equity securities issued by this company.
8 An executive of CIBC World Markets Inc. or any analyst involved in the preparation of this research report has
provided services to this company for remuneration in the past 12 months.
9 A senior executive member or director of Canadian Imperial Bank of Commerce ("CIBC"), the parent company
to CIBC World Markets Inc. and CIBC World Markets Corp., or a member of his/her household is an officer,
director or advisory board member of this company or one of its subsidiaries.
10 Canadian Imperial Bank of Commerce ("CIBC"), the parent company to CIBC World Markets Inc. and CIBC
World Markets Corp., has a significant credit relationship with this company.
11 The equity securities of this company are restricted voting shares.
12 The equity securities of this company are subordinate voting shares.
13 The equity securities of this company are non-voting shares.
14 The equity securities of this company are limited voting shares.

A Good Buy, Below The NAV - December 05, 2011
21
CIBC World Markets Inc. Price Chart
HISTORICAL PERFORMANCE OF CIBC WORLD MARKETS INC. RECOMMENDATIONS FOR WI-LAN INC. (WIN)
Date Change Type Closing Price Rating Price Target Coverage
01/15/2009 1.70 SO 6.00 Todd Coupland, CFA
06/25/2009 2.13 R - Todd Coupland, CFA
07/20/2009 2.15 SO 6.00 Todd Coupland, CFA
11/30/2010 4.48 R - Todd Coupland, CFA
12/20/2010 4.26 SO 6.00 Todd Coupland, CFA
01/16/2011 6.93 SO 10.00 Todd Coupland, CFA
01/18/2011 7.17 R - Todd Coupland, CFA
02/04/2011 6.40 SO 10.00 Todd Coupland, CFA
08/17/2011 7.09 R - Todd Coupland, CFA
11/16/2011 6.18 SO 10.00 Todd Coupland, CFA

A Good Buy, Below The NAV - December 05, 2011
22
CIBC World Markets Inc. Stock Rating System
Abbreviation Rating Description
Stock Ratings
SO Sector Outperformer Stock is expected to outperform the sector during the next 12-18 months.
SP Sector Performer Stock is expected to perform in line with the sector during the next 12-18 months.
SU Sector Underperformer Stock is expected to underperform the sector during the next 12-18 months.
NR Not Rated CIBC World Markets does not maintain an investment recommendation on the stock.
R Restricted CIBC World Markets is restricted*** from rating the stock.
Sector Weightings**
O Overweight Sector is expected to outperform the broader market averages.
M Market Weight Sector is expected to equal the performance of the broader market averages.
U Underweight Sector is expected to underperform the broader market averages.
NA None Sector rating is not applicable.
**Broader market averages refer to the S&P 500 in the U.S. and the S&P/TSX Composite in Canada.
"Speculative" indicates that an investment in this security involves a high amount of risk due to volatility and/or liquidity issues.
***Restricted due to a potential conflict of interest.
Ratings Distribution*: CIBC World Markets Inc. Coverage Universe
(as of 05 Dec 2011) Count Percent Inv. Banking Relationships Count Percent
Sector Outperformer (Buy) 164 46.6% Sector Outperformer (Buy) 164 100.0%
Sector Performer (Hold/Neutral) 150 42.6% Sector Performer (Hold/Neutral) 143 95.3%
Sector Underperformer (Sell) 28 8.0% Sector Underperformer (Sell) 25 89.3%
Restricted 9 2.6% Restricted 9 100.0%
Ratings Distribution: Technology Hardware Coverage Universe
(as of 05 Dec 2011) Count Percent Inv. Banking Relationships Count Percent
Sector Outperformer (Buy) 9 69.2% Sector Outperformer (Buy) 9 100.0%
Sector Performer (Hold/Neutral) 3 23.1% Sector Performer (Hold/Neutral) 3 100.0%
Sector Underperformer (Sell) 1 7.7% Sector Underperformer (Sell) 1 100.0%
Restricted 0 0.0% Restricted 0 0.0%
Technology Hardware Sector includes the following tickers: DWI, GND, MN, MSD, MT, RCM, RDL, RIMM, SMT, SVC, SWIR, VCM, WIN.
*Although the investment recommendations within the three-tiered, relative stock rating system utilized by CIBC World Markets Inc.
do not correlate to buy, hold and sell recommendations, for the purposes of complying with NYSE and NASD rules, CIBC World
Markets Inc. has assigned buy ratings to securities rated Sector Outperformer, hold ratings to securities rated Sector Performer, and
sell ratings to securities rated Sector Underperformer without taking into consideration the analyst's sector weighting.
Important disclosures required by IIROC Rule 3400, including potential conflicts of interest information, our system for
rating investment opportunities and our dissemination policy can be obtained by visiting CIBC World Markets on the web
at http://researchcentral.cibcwm.com under 'Quick Links' or by writing to CIBC World Markets Inc., Brookfield Place, 161 Bay Street, 4th Floor, Toronto, Ontario M5J 2S8, Attention: Research Disclosures Request.

A Good Buy, Below The NAV - December 05, 2011
23
Legal Disclaimer
This report is issued and approved for distribution by (a) in Canada, CIBC World Markets Inc., a member of the
Investment Industry Regulatory Organization of Canada (“IIROC”), the Toronto Stock Exchange, the TSX Venture
Exchange and a Member of the Canadian Investor Protection Fund, (b) in the United Kingdom, CIBC World Markets plc,
which is regulated by the Financial Services Authority ("FSA"), and (c) in Australia, CIBC Australia Limited, a member of
the Australian Stock Exchange and regulated by the ASIC (collectively, "CIBC World Markets") and (d) in the United
States either by (i) CIBC World Markets Inc. for distribution only to U.S. Major Institutional Investors (“MII”) (as such
term is defined in SEC Rule 15a-6) or (ii) CIBC World Markets Corp., a member of the Financial Industry Regulatory
Authority (“FINRA”). U.S. MIIs receiving this report from CIBC World Markets Inc. (the Canadian broker-dealer) are
required to effect transactions (other than negotiating their terms) in securities discussed in the report through CIBC
World Markets Corp. (the U.S. broker-dealer).
This report is provided, for informational purposes only, to institutional investor and retail clients of CIBC World
Markets in Canada, and does not constitute an offer or solicitation to buy or sell any securities discussed herein in any
jurisdiction where such offer or solicitation would be prohibited. This document and any of the products and information
contained herein are not intended for the use of private investors in the United Kingdom. Such investors will not be able
to enter into agreements or purchase products mentioned herein from CIBC World Markets plc. The comments and views
expressed in this document are meant for the general interests of wholesale clients of CIBC Australia Limited.
The securities mentioned in this report may not be suitable for all types of investors. This report does not take into
account the investment objectives, financial situation or specific needs of any particular client of CIBC World Markets.
Recipients should consider this report as only a single factor in making an investment decision and should not rely solely
on investment recommendations contained herein, if any, as a substitution for the exercise of independent judgment of
the merits and risks of investments. The analyst writing the report is not a person or company with actual, implied or
apparent authority to act on behalf of any issuer mentioned in the report. Before making an investment decision with
respect to any security recommended in this report, the recipient should consider whether such recommendation is
appropriate given the recipient's particular investment needs, objectives and financial circumstances. CIBC World
Markets suggests that, prior to acting on any of the recommendations herein, Canadian retail clients of CIBC World
Markets contact one of our client advisers in your jurisdiction to discuss your particular circumstances. Non-client
recipients of this report who are not institutional investor clients of CIBC World Markets should consult with an
independent financial advisor prior to making any investment decision based on this report or for any necessary
explanation of its contents. CIBC World Markets will not treat non-client recipients as its clients solely by virtue of their
receiving this report.
Past performance is not a guarantee of future results, and no representation or warranty, express or implied, is
made regarding future performance of any security mentioned in this report. The price of the securities mentioned in
this report and the income they produce may fluctuate and/or be adversely affected by exchange rates, and investo rs
may realize losses on investments in such securities, including the loss of investment principal. CIBC World Markets
accepts no liability for any loss arising from the use of information contained in this report, except to the extent that
liability may arise under specific statutes or regulations applicable to CIBC World Markets.
Information, opinions and statistical data contained in this report were obtained or derived from sources believed to
be reliable, but CIBC World Markets does not represent that any such information, opinion or statistical data is accurate
or complete (with the exception of information contained in the Important Disclosures section of this report provided by
CIBC World Markets or individual research analysts), and they should not be relied upon as such. All estimates, opinions
and recommendations expressed herein constitute judgments as of the date of this report and are subject to change
without notice. Nothing in this report constitutes legal, accounting or tax advice. Since the levels and bases of taxation
can change, any reference in this report to the impact of taxation should not be construed as offering tax advice on the
tax consequences of investments. As with any investment having potential tax implications, clients should consult with
their own independent tax adviser. This report may provide addresses of, or contain hyperlinks to, Internet web sites.
CIBC World Markets has not reviewed the linked Internet web site of any third party and takes no responsibility for the
contents thereof. Each such address or hyperlink is provided solely for the recipient's convenience and information, and
the content of linked third-party web sites is not in any way incorporated into this document. Recipients who choose to
access such third-party web sites or follow such hyperlinks do so at their own risk. Although each company issuing this
report is a wholly owned subsidiary of Canadian Imperial Bank of Commerce ("CIBC"), each is solely responsible for its
contractual obligations and commitments, and any securities products offered or recommended to or purchased or sold
in any client accounts (i) will not be insured by the Federal Deposit Insurance Corporation ("FDIC"), the Canada Deposit
Insurance Corporation or other similar deposit insurance, (ii) will not be deposits or other obligations of CIBC, (iii) will
not be endorsed or guaranteed by CIBC, and (iv) will be subject to investment risks, including possible loss of the
principal invested. The CIBC trademark is used under license.
© 2011 CIBC World Markets Inc. All rights reserved. Unauthorized use, distribution, duplication or disclosure
without the prior written permission of CIBC World Markets is prohibited by law and may result in prosecution.