INSTITUTIONAL EQUITY RESEARCH Cadila Healthcare (CDH …
7
INSTITUTIONAL EQUITY RESEARCH Page | 1 | PHILLIPCAPITAL INDIA RESEARCH Please see penultimate page for additional important disclosures. PhillipCapital (India) Private Limited. (“PHILLIPCAP”) is a foreign broker-dealer unregistered in the USA. PHILLIPCAP research is prepared by research analysts who are not registered in the USA. PHILLIPCAP research is distributed in the USA pursuant to Rule 15a-6 of the Securities Exchange Act of 1934 solely by Rosenblatt Securities Inc, an SEC registered and FINRA-member broker-dealer. Cadila Healthcare (CDH IN) Robust visible earnings to drive re-rating INDIA | PHARMACEUTICALS | Quarterly Update 28 May 2021 Top takeaways from Q4FY21 Sales at Rs 38.4bn (+3% yoy) were largely in-line with our estimates (2% miss). Strong Domestic formulations (+15% yoy, 4% beat on our est) was largely offset by weak US sales at US$ 205mn (-13% cc yoy/-14% yoy INR) vs est of US$228mn largely on account of weak Flu season. Europe saw 15% beat (+8% yoy) which was offset by weak API (+20% yoy) at Rs 1.4bn. EBITDA margin at 22.2% (adjusted for forex) was in-line with our expectation of 22.3%. Resultant EBITDA of Rs 8.5bn (+12% yoy) was 2% below our estimates. The reported PAT was higher at Rs 6.8bn vs PC est led by deferred tax/MAT credit of Rs 2.8bn, impairment charge of Rs 731mn and forex gain of Rs 17mn. However, the Core PAT (adj for forex loss and impairment charge) was up 25% yoy to Rs 5.2bn, in-line with PC est and 12% beat to street estimates. Conference call takeaways CDH’s US biz fell 13% yoy(6% qoq) to 205mn primarily due to weak Flu season, inventory adjustment, covid temporarily impacting Asacol HD prescriptions. It guides for stronger US outlook led by continued new launch (~40) momentum, upgrade in portfolio to complex/specialty (in-licensed 20 complex, FTFs, liposomal injectabes, NDDS, etc), visible industry wide recovery and stable pricing environment,etc. India formulations continued strong growth momentum (+15% yoy) largely led by its specialty focus and new launches without any major contribution from Covid portfolio. Management expects good growth momentum ahead mainly driven by specialty product portfolio and robust incremental business from covid portfolio. Covid Vaccine – 1) CDH completed clinical trials for its ZyCoV-D vaccine on 28K volunteers (covering people aged >12yrs) and expect to seek EUA from DCGI in 2 weeks time, 2) Likely to launch in neddle-less (pain less) format, 3) While expect to launch in 3 dose regimen but completing a bridge trial for a potential 2 dose regimen in coupe of weeks time, 4) guides for producing 10mn doses per month (as per ready orders) starting June 2021 from own capacity and expects to reach capacity of 25-30mn doses in 6months time leveraging contract manufacturer. Other Covid portfolio- 1) Got DCGI approval for Virafin (interferon alpha 2b) as a targetted therapy for Covid treatment and launched in India. Targetting export opportunity CDH is currently registering virafin other markts as well. It believes other available interferons would not compete with Virafin. 2) Seeking DCGI approval for Ph1/3 human trial for its innovative antibody MAB cocktail.. CDH net debt stood at Rs 35bn, down from Rs 38bn in Dec-20. Expect further rduction with the sale proceeds of Rs 29bn from Animal health business soon. Outlook and valuation: CDH’s Q4 &FY21 earnings was in line with our estimates. Going ahead we expect robust value growth for CDH led by a) strong US outlook (upgrade in portfolio), b)profitable growth in India formulations (greater focus on specialty) , c) robust contribution from Covid portfolio and 4) financial de-leveraging. Moreover, we are axcited about the visible incremental earnings and cash flow of about Rs 40bn over FY212-23 (Refer Page 2) from the known Covid pipeline (largely Vaccine & Virafin) and cash flow of Rs 29bn from animal health biz disposal, that makes the company debt free (leading to re- rating). We raise our TP to Rs 770 (Rs 665 previously), as we value CDH base business at Rs 700, i.e., at 28x FY23E EPS + PV of Rs 70 from covid portfolio. We continue to remain bullish and recommend our conviction BUY. BUY (Maintain) CMP RS 626 / TARGET RS 770 (+23%) SEBI CATEGORY: MID CAP COMPANY DATA O/S SHARES (MN) : 1024 MARKET CAP (RSBN) : 645 MARKET CAP (USDBN) : 9.0 52 - WK HI/LO (RS) : 674 / 333 LIQUIDITY 3M (USDMN) : 66.2 PAR VALUE (RS) : 1 SHARE HOLDING PATTERN, % Mar 21 Dec 20 Sep 20 PROMOTERS 74.9 74.9 74.9 DII 11.9 12.7 12.8 FII 5.2 4.4 4.6 OTHERS 8.0 8.0 7.8 KEY FINANCIALS Rs mn FY21 FY22E FY23E Net Sales 151,022 161,475 179,691 EBIDTA 33,429 36,009 40,430 Net Profit 20,393 22,352 25,716 EPS, Rs 19.9 21.8 25.1 PER, x 30.8 28.1 24.4 EV/EBIDTA, x 19.6 17.6 15.3 PBV, x 4.8 3.9 3.5 ROE, % 16.1 24.2 14.2 Debt/Equity (%) 28.3 25.2 23.2 CHANGE IN ESTIMATES __Revised Est. __ __% Revision__ Rs bn FY22E FY23E FY22E FY23E Revenue 161.5 179.7 0.5 0.5 EBITDA 36.0 40.4 0.5 0.5 Core PAT 22.4 25.7 0.6 0.6 EPS (Rs) 21.8 25.1 0.6 0.6 Surya Patra, Research Analyst (+ 9122 6246 4121) [email protected] Hrishikesh Patole (+ 9122 6246 4123) [email protected] (Rs mn) Q4FY21 Q3FY21 QoQ Ch (%) Q4FY20 YoY Ch (%) vs. expectations % Comments Net Sales 38,467 37,956 1.3 37,287 3.2 -1.8 EBITDA 8,536 8,124 5.1 7,649 11.6 -2.4 EBITDA margin 22.2 21.4 20.5 -14bps Reported PAT 6,790 5,272 28.8 3,919 73.3 42.3 Core PAT 5,249 5,339 -1.7 4,213 24.6 -0.1 Core EPS (Rs) 5.12 5.21 -1.7 4.11 24.6 -0.1
Transcript of INSTITUTIONAL EQUITY RESEARCH Cadila Healthcare (CDH …
INSTITUTIONAL EQUITY RESEARCH
Page | 1 | PHILLIPCAPITAL INDIA RESEARCH Please see penultimate page for additional important disclosures. PhillipCapital (India) Private Limited. (“PHILLIPCAP”) is a foreign broker-dealer unregistered in the USA. PHILLIPCAP research is prepared by research analysts who are not registered in the USA. PHILLIPCAP research is distributed in the USA pursuant to Rule 15a-6 of the Securities Exchange Act of 1934 solely by Rosenblatt Securities Inc, an SEC registered and FINRA-member broker-dealer.
Cadila Healthcare (CDH IN)
Robust visible earnings to drive re-rating
INDIA | PHARMACEUTICALS | Quarterly Update
28 May 2021
Top takeaways from Q4FY21 Sales at Rs 38.4bn (+3% yoy) were largely in-line with our estimates (2% miss). Strong Domestic formulations (+15% yoy, 4% beat on our est) was largely offset by weak
US sales at US$ 205mn (-13% cc yoy/-14% yoy INR) vs est of US$228mn largely on account of weak Flu season. Europe saw 15% beat (+8% yoy) which was offset by weak API (+20% yoy) at Rs 1.4bn.
EBITDA margin at 22.2% (adjusted for forex) was in-line with our expectation of 22.3%. Resultant EBITDA of Rs 8.5bn (+12% yoy) was 2% below our estimates.
The reported PAT was higher at Rs 6.8bn vs PC est led by deferred tax/MAT credit of Rs 2.8bn, impairment charge of Rs 731mn and forex gain of Rs 17mn. However, the Core PAT (adj for forex loss and impairment charge) was up 25% yoy to Rs 5.2bn, in-line with PC est and 12% beat to street estimates.
Conference call takeaways CDH’s US biz fell 13% yoy(6% qoq) to 205mn primarily due to weak Flu season, inventory
adjustment, covid temporarily impacting Asacol HD prescriptions. It guides for stronger US outlook led by continued new launch (~40) momentum, upgrade in portfolio to complex/specialty (in-licensed 20 complex, FTFs, liposomal injectabes, NDDS, etc), visible industry wide recovery and stable pricing environment,etc.
India formulations continued strong growth momentum (+15% yoy) largely led by its specialty focus and new launches without any major contribution from Covid portfolio. Management expects good growth momentum ahead mainly driven by specialty product portfolio and robust incremental business from covid portfolio.
Covid Vaccine – 1) CDH completed clinical trials for its ZyCoV-D vaccine on 28K volunteers (covering people aged >12yrs) and expect to seek EUA from DCGI in 2 weeks time, 2) Likely to launch in neddle-less (pain less) format, 3) While expect to launch in 3 dose regimen but completing a bridge trial for a potential 2 dose regimen in coupe of weeks time, 4) guides for producing 10mn doses per month (as per ready orders) starting June 2021 from own capacity and expects to reach capacity of 25-30mn doses in 6months time leveraging contract manufacturer.
Other Covid portfolio- 1) Got DCGI approval for Virafin (interferon alpha 2b) as a targetted therapy for Covid treatment and launched in India. Targetting export opportunity CDH is currently registering virafin other markts as well. It believes other available interferons would not compete with Virafin. 2) Seeking DCGI approval for Ph1/3 human trial for its innovative antibody MAB cocktail..
CDH net debt stood at Rs 35bn, down from Rs 38bn in Dec-20. Expect further rduction with the sale proceeds of Rs 29bn from Animal health business soon.
Outlook and valuation: CDH’s Q4 &FY21 earnings was in line with our estimates. Going ahead we expect robust value growth for CDH led by a) strong US outlook (upgrade in portfolio), b)profitable growth in India formulations (greater focus on specialty) , c) robust contribution from Covid portfolio and 4) financial de-leveraging. Moreover, we are axcited about the visible incremental earnings and cash flow of about Rs 40bn over FY212-23 (Refer Page 2) from the known Covid pipeline (largely Vaccine & Virafin) and cash flow of Rs 29bn from animal health biz disposal, that makes the company debt free (leading to re-rating). We raise our TP to Rs 770 (Rs 665 previously), as we value CDH base business at Rs 700, i.e., at 28x FY23E EPS + PV of Rs 70 from covid portfolio. We continue to remain bullish and recommend our conviction BUY.
BUY (Maintain) CMP RS 626 / TARGET RS 770 (+23%)
SEBI CATEGORY: MID CAP
COMPANY DATA
O/S SHARES (MN) : 1024
MARKET CAP (RSBN) : 645
MARKET CAP (USDBN) : 9.0
52 - WK HI/LO (RS) : 674 / 333
LIQUIDITY 3M (USDMN) : 66.2
PAR VALUE (RS) : 1
SHARE HOLDING PATTERN, %
Mar 21 Dec 20 Sep 20
PROMOTERS 74.9 74.9 74.9
DII 11.9 12.7 12.8
FII 5.2 4.4 4.6
OTHERS 8.0 8.0 7.8
KEY FINANCIALS
Rs mn FY21 FY22E FY23E
Net Sales 151,022 161,475 179,691
EBIDTA 33,429 36,009 40,430
Net Profit 20,393 22,352 25,716
EPS, Rs 19.9 21.8 25.1
PER, x 30.8 28.1 24.4
EV/EBIDTA, x 19.6 17.6 15.3
PBV, x 4.8 3.9 3.5
ROE, % 16.1 24.2 14.2
Debt/Equity (%) 28.3 25.2 23.2
CHANGE IN ESTIMATES
__Revised Est. __ __% Revision__
Rs bn FY22E FY23E FY22E FY23E
Revenue 161.5 179.7 0.5 0.5
EBITDA 36.0 40.4 0.5 0.5
Core PAT 22.4 25.7 0.6 0.6
EPS (Rs) 21.8 25.1 0.6 0.6 Surya Patra, Research Analyst (+ 9122 6246 4121) [email protected] Hrishikesh Patole (+ 9122 6246 4123) [email protected]
(Rs mn) Q4FY21 Q3FY21 QoQ Ch (%) Q4FY20 YoY Ch (%) vs. expectations % Comments
Net Sales 38,467 37,956 1.3 37,287 3.2 -1.8
EBITDA 8,536 8,124 5.1 7,649 11.6 -2.4
EBITDA margin 22.2 21.4 20.5 -14bps
Reported PAT 6,790 5,272 28.8 3,919 73.3 42.3
Core PAT 5,249 5,339 -1.7 4,213 24.6 -0.1
Core EPS (Rs) 5.12 5.21 -1.7 4.11 24.6 -0.1
Page | 2 | PHILLIPCAPITAL INDIA RESEARCH
CADILA HEALTHCARE QUARTERLY UPDATE
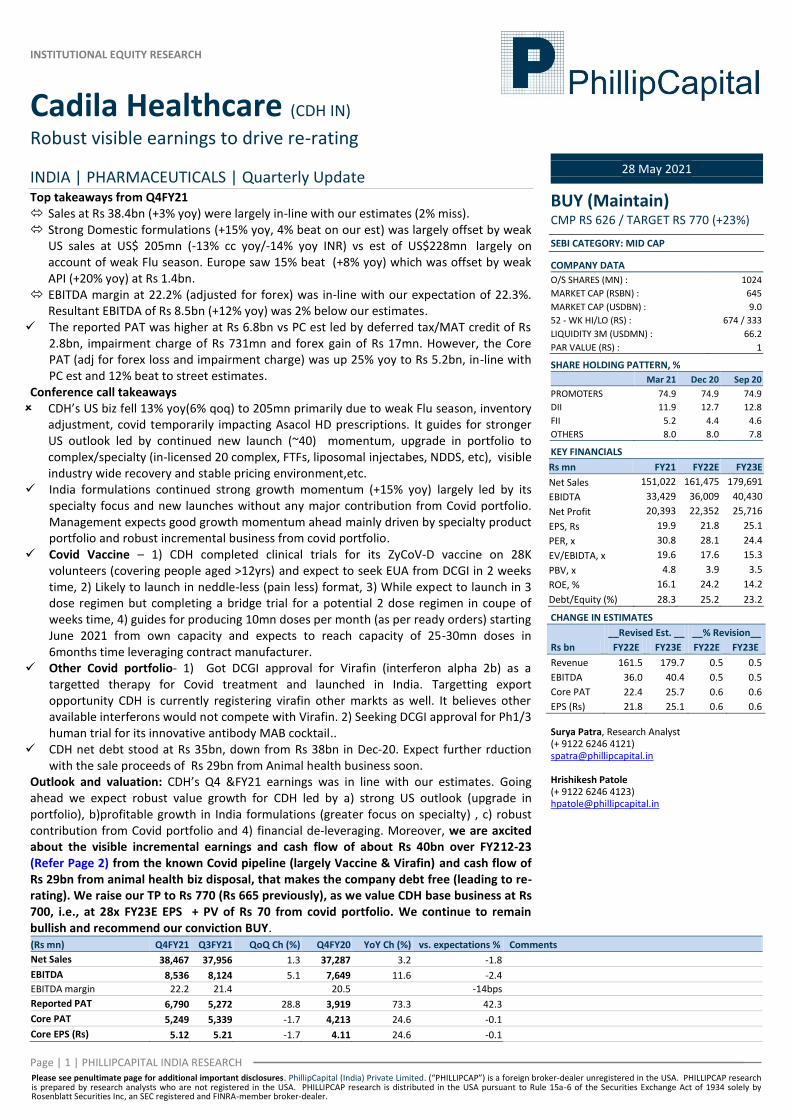
Covid portfolio to add incremental earnings and cash flow of Rs 40bn over FY212-23 CDH is one of the leading players having an extensive portfolio of products. Given the current resurgence of Covid cases in India, we expect CDH to benefit from its large basket of Covid portfolio. Our assumptions: - Remdesivir – We expect target revenue to be largely
achieved in Q1FY22 itself on account of higher demand ans then subsequent phasing out of demand as wel build Rs 1.6bn sales in FY22 and then no sales going ahead. Virafin - We expect Virafin alone to bring close to Rs 64bn / Rs 19 in FY22 / FY23 on the back of good offtake and faster adoption. Vaccine – We expect CDH to do close to 83 / 150 doses in FY22 / FY23 and assume a blended price of Rs 500 per dose We expect commercialization by early Q2FY22. Apart from this CDH is developing other pipeline products such as anti-body cocktail which we believe will be the main treatment option and Desidustat which should further complement covid portfolio growth in our view
Earning implications / conclusion: - We expect the covid portfolio opportunity to bring in incremental revenue of Rs 107bn / Rs 94bn in FY22 / FY23 and incremental PAT of Rs 18bn / Rs 21bn in FY22 / FY23 resulting in 83% / 81% earnings upgrade to our FY22 / FY23 earnings. However, we est a PV of Rs 70 per share from the covid portfolio opportunity over the 3 year period from FY22-FY24. We expect cumm cash flow of Rs 40bn over 2 year period making CDH a debt free company which can subsequently lead to re-rating for the stock.
Table 1: Cadila covid portfolio opportunity landscape
Covid portfolio - Cadila (Fig in mn) FY22 FY23 FY24
A. Treatment options
Price of product
Remdesivir 899 899 899 Virafin (interferon) 11,995 11,995 11,995
Patient volume
Remdesivir (50% of active cases, # doses -
5 / patients, 25% mkt shr) 1.9 0.0 0.0 Virafin (Daily new cases 2 lakh) 5.4 1.6 1.6
Revenue
Remdesivir 1,686 0 0 Virafin (interferon) 64,773 19,432 19,432
Total Covid treatment sales 66,459 19,432 19,432
EBITDA M% 25 25 25 EBITDA 16,615 4,858 4,858 PAT 12,337 3,607 3,607
B. Cadila - Covid vaccine (Fig in mn) FY22 FY23 FY24
Capacity 150 250 250 Launch Q2FY22
# doses 83 150 225 Pricing per dose 500 500 500
Revenue 41,250 75,000 112,500
EBITDA M% 25 35 35 EBITDA 10,313 26,250 39,375 PAT 6,105 17,100 25,650
Total Covid sales (A+B) 107,709 94,432 131,932
Total Covid EBITDA 26,927 31,108 44,233 Total Covid PAT 18,442 20,707 29,257
Covid led Earnings upgrade (%) 83 81
Covid portfolio NPV value (Fig in mn) FY22 FY23 FY24
Discounting factor at 5% 1.05 1.00 0.95 Present value 19,364 20,707 27,794 Total NPV 67,866 # shares 1,024
Per share value 70 Source: PhillipCapital India Research
Page | 3 | PHILLIPCAPITAL INDIA RESEARCH
CADILA HEALTHCARE QUARTERLY UPDATE
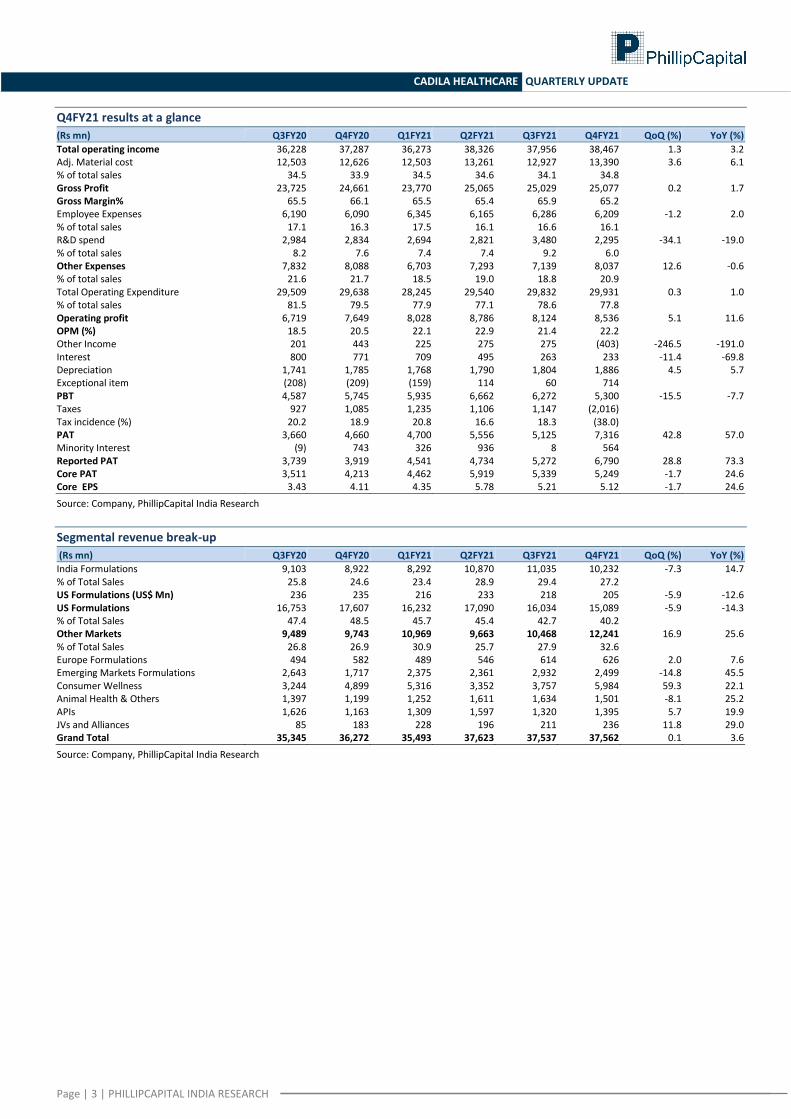
Q4FY21 results at a glance
(Rs mn) Q3FY20 Q4FY20 Q1FY21 Q2FY21 Q3FY21 Q4FY21 QoQ (%) YoY (%)
Total operating income 36,228 37,287 36,273 38,326 37,956 38,467 1.3 3.2 Adj. Material cost 12,503 12,626 12,503 13,261 12,927 13,390 3.6 6.1 % of total sales 34.5 33.9 34.5 34.6 34.1 34.8 Gross Profit 23,725 24,661 23,770 25,065 25,029 25,077 0.2 1.7 Gross Margin% 65.5 66.1 65.5 65.4 65.9 65.2 Employee Expenses 6,190 6,090 6,345 6,165 6,286 6,209 -1.2 2.0 % of total sales 17.1 16.3 17.5 16.1 16.6 16.1 R&D spend 2,984 2,834 2,694 2,821 3,480 2,295 -34.1 -19.0 % of total sales 8.2 7.6 7.4 7.4 9.2 6.0 Other Expenses 7,832 8,088 6,703 7,293 7,139 8,037 12.6 -0.6 % of total sales 21.6 21.7 18.5 19.0 18.8 20.9 Total Operating Expenditure 29,509 29,638 28,245 29,540 29,832 29,931 0.3 1.0 % of total sales 81.5 79.5 77.9 77.1 78.6 77.8 Operating profit 6,719 7,649 8,028 8,786 8,124 8,536 5.1 11.6 OPM (%) 18.5 20.5 22.1 22.9 21.4 22.2 Other Income 201 443 225 275 275 (403) -246.5 -191.0 Interest 800 771 709 495 263 233 -11.4 -69.8 Depreciation 1,741 1,785 1,768 1,790 1,804 1,886 4.5 5.7 Exceptional item (208) (209) (159) 114 60 714 PBT 4,587 5,745 5,935 6,662 6,272 5,300 -15.5 -7.7 Taxes 927 1,085 1,235 1,106 1,147 (2,016) Tax incidence (%) 20.2 18.9 20.8 16.6 18.3 (38.0) PAT 3,660 4,660 4,700 5,556 5,125 7,316 42.8 57.0 Minority Interest (9) 743 326 936 8 564 Reported PAT 3,739 3,919 4,541 4,734 5,272 6,790 28.8 73.3 Core PAT 3,511 4,213 4,462 5,919 5,339 5,249 -1.7 24.6 Core EPS 3.43 4.11 4.35 5.78 5.21 5.12 -1.7 24.6
Source: Company, PhillipCapital India Research
Segmental revenue break-up
(Rs mn) Q3FY20 Q4FY20 Q1FY21 Q2FY21 Q3FY21 Q4FY21 QoQ (%) YoY (%)
India Formulations 9,103 8,922 8,292 10,870 11,035 10,232 -7.3 14.7 % of Total Sales 25.8 24.6 23.4 28.9 29.4 27.2 US Formulations (US$ Mn) 236 235 216 233 218 205 -5.9 -12.6 US Formulations 16,753 17,607 16,232 17,090 16,034 15,089 -5.9 -14.3 % of Total Sales 47.4 48.5 45.7 45.4 42.7 40.2 Other Markets 9,489 9,743 10,969 9,663 10,468 12,241 16.9 25.6 % of Total Sales 26.8 26.9 30.9 25.7 27.9 32.6 Europe Formulations 494 582 489 546 614 626 2.0 7.6 Emerging Markets Formulations 2,643 1,717 2,375 2,361 2,932 2,499 -14.8 45.5 Consumer Wellness 3,244 4,899 5,316 3,352 3,757 5,984 59.3 22.1 Animal Health & Others 1,397 1,199 1,252 1,611 1,634 1,501 -8.1 25.2 APIs 1,626 1,163 1,309 1,597 1,320 1,395 5.7 19.9 JVs and Alliances 85 183 228 196 211 236 11.8 29.0 Grand Total 35,345 36,272 35,493 37,623 37,537 37,562 0.1 3.6
Source: Company, PhillipCapital India Research

Page | 4 | PHILLIPCAPITAL INDIA RESEARCH
CADILA HEALTHCARE QUARTERLY UPDATE
Financials
Income Statement Y/E Mar, Rs mn FY20 FY21 FY22E FY23E
Net sales 138,121 148,215 158,309 176,167 Growth, % 8 7 7 11 Other income 4,410 2,807 3,166 3,523 Total income 142,531 151,022 161,475 179,691 Raw material expenses -49,327 -52,082 -54,901 -60,735 Employee expenses -24,145 -24,902 -27,774 -30,907 Other Operating expenses -41,352 -40,609 -42,791 -47,618 EBITDA (Core) 27,707 33,429 36,009 40,430 Growth, % (6.6) 20.7 7.7 12.3 Margin, % 20.1 22.6 22.7 23.0 Depreciation -6,965 -7,248 -7,727 -8,203 EBIT 20,742 26,181 28,282 32,228 Growth, % (12.4) 26.2 8.0 14.0 Margin, % 15.0 17.7 17.9 18.3 Interest paid -3,418 -1,635 -1,216 -1,238 Other Non-Operating Income 627 372 1,615 2,156 Pre-tax profit 14,442 22,848 45,681 33,146 Tax provided -3,198 -1,472 -5,736 -6,629 Profit after tax 11,244 21,376 39,945 26,517 Others (Minorities, Associates) -278 -514 -1,067 -1,275 Net Profit 10,966 20,862 38,878 25,242 Growth, % (17.0) 37.1 9.6 15.1 Net Profit (adjusted) 14,873 20,393 22,352 25,716 Unadj. shares (m) 1,024 1,024 1,024 1,024 Wtd avg shares (m) 1,024 1,024 1,024 1,024
Balance Sheet Y/E Mar, Rs mn FY20 FY21 FY22E FY23E
Cash & bank 9,649 8,883 35,341 50,230 Debtors 36,632 31,273 43,957 48,916 Inventory 27,890 32,362 31,366 34,815 Loans & advances 5,166 4,862 4,360 4,852 Other current assets 10,124 12,353 12,353 12,353 Total current assets 89,461 89,733 127,378 151,165 Investments 7,650 8,301 8,301 8,301 Gross fixed assets 113,345 120,066 126,668 134,468 Less: Depreciation -44,955 -52,203 -59,930 -68,132 Add: Capital WIP 61,330 61,297 58,266 58,266 Net fixed assets 129,720 129,160 125,004 124,602 Total assets 236,866 238,847 272,336 295,721
Current liabilities 32,724 44,272 42,611 47,418 Provisions 4,784 6,394 7,033 7,737 Total current liabilities 37,508 50,666 49,645 55,155 Non-current liabilities 82,254 38,885 42,611 43,338 Total liabilities 119,762 89,551 92,256 98,493 Paid-up capital 1,024 1,024 1,024 1,024 Reserves & surplus 102,733 128,899 159,683 176,831 Shareholders’ equity 117,104 149,296 180,080 197,228 Total equity & liabilities 236,866 238,847 272,336 295,721
Source: Company, PhillipCapital India Research Estimates
Cash Flow Y/E Mar, Rs mn FY20 FY21 FY22E FY23E
Pre-tax profit 14,442 22,848 45,681 33,146 Depreciation 6,965 7,248 7,727 8,203 Chg in working capital 2,537 12,120 -12,208 -3,389 Total tax paid -3,135 -3,399 -5,736 -6,629 Other operating activities -2,142 -2,142 -2,142 -2,142 Cash flow from operating activities 18,667 36,675 33,322 29,189 Capital expenditure -6,676 -6,688 -3,571 -7,800 Chg in investments -915 -651 0 0 Cash flow from investing activities -7,591 -7,339 -3,571 -7,800 Free cash flow 11,887 34,016 0 24,148 Debt raised/(repaid) 870 -43,060 3,726 727 Cash flow from financing activities -2,726 -37,668 2,568 -640 Net chg in cash 8,350 -8,332 32,319 20,748
Valuation Ratios
FY20 FY21 FY22E FY23E
Per Share data
EPS (INR) 14.5 19.9 21.8 25.1 Growth, % (17.0) 37.1 9.6 15.1 Book NAV/share (INR) 101.4 126.9 157.0 173.7 FDEPS (INR) 14.5 19.9 21.8 25.1 CEPS (INR) 24.9 29.0 12.8 33.1 CFPS (INR) 19.7 37.6 33.1 28.5 Return ratios
Return on assets (%) 5.6 9.4 15.9 9.6 Return on equity (%) 10.6 16.1 24.2 14.2 Return on capital employed (%) 10.7 14.1 13.4 14.3 Turnover ratios
Asset turnover (x) 0.8 0.9 0.9 1.0 Sales/Total assets (x) 0.6 0.6 0.6 0.6 Sales/Net FA (x) 1.1 1.1 1.2 1.4 Working capital/Sales (x) 0.3 0.2 0.3 0.3 Receivable days 96.8 77.0 101.3 101.3 Working capital days 124.4 90.1 114.0 110.9 Liquidity ratios Current ratio (x) 2.7 2.0 3.0 3.2 Quick ratio (x) 1.9 1.3 2.3 2.5 Interest cover (x) 6.1 16.0 23.3 26.0 Total debt/Equity (%) 77.0 28.3 25.2 23.2 Net debt/Equity (%) 67.7 21.5 3.2 (5.0) Valuation PER (x) 43.1 31.4 28.7 24.9 PEG (x) - y-o-y growth (2.5) 0.8 3.0 1.7 Price/Book (x) 6.2 4.9 4.0 3.6 EV/Net sales (x) 5.1 4.5 4.1 3.6 EV/EBITDA (x) 25.7 20.0 17.9 15.6 EV/EBIT (x) 34.3 25.5 22.8 19.6
Page | 5 | PHILLIPCAPITAL INDIA RESEARCH
CADILA HEALTHCARE QUARTERLY UPDATE
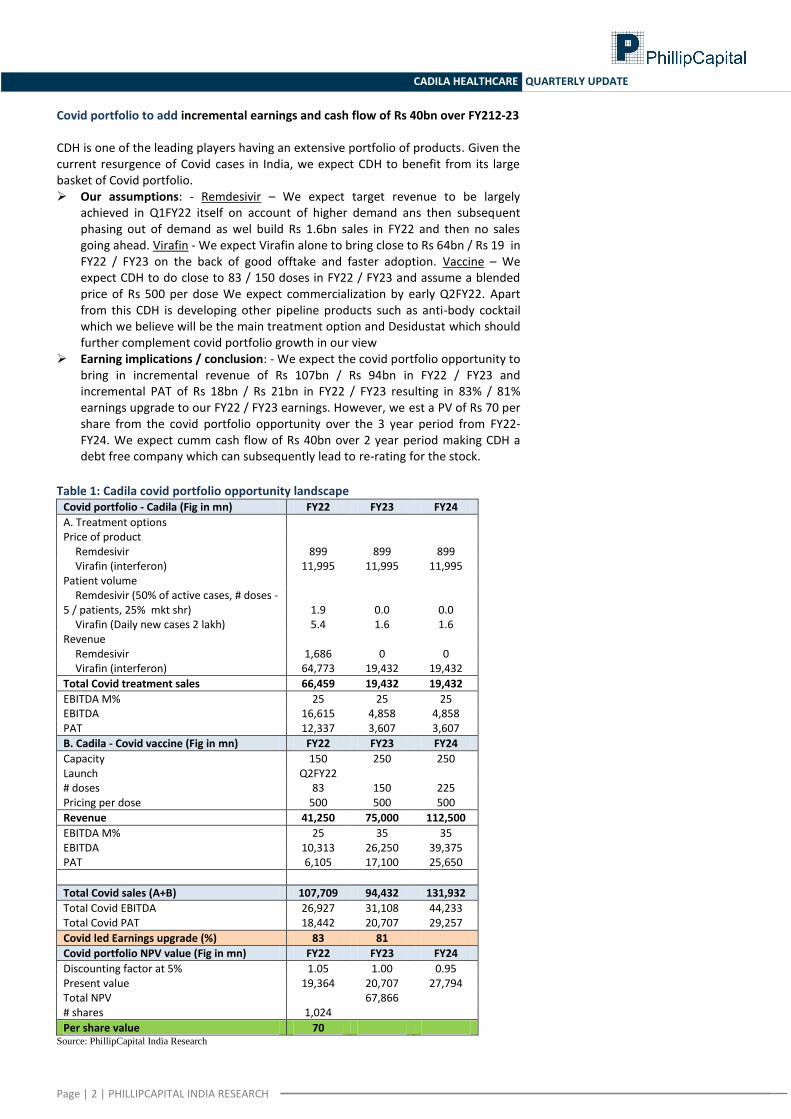
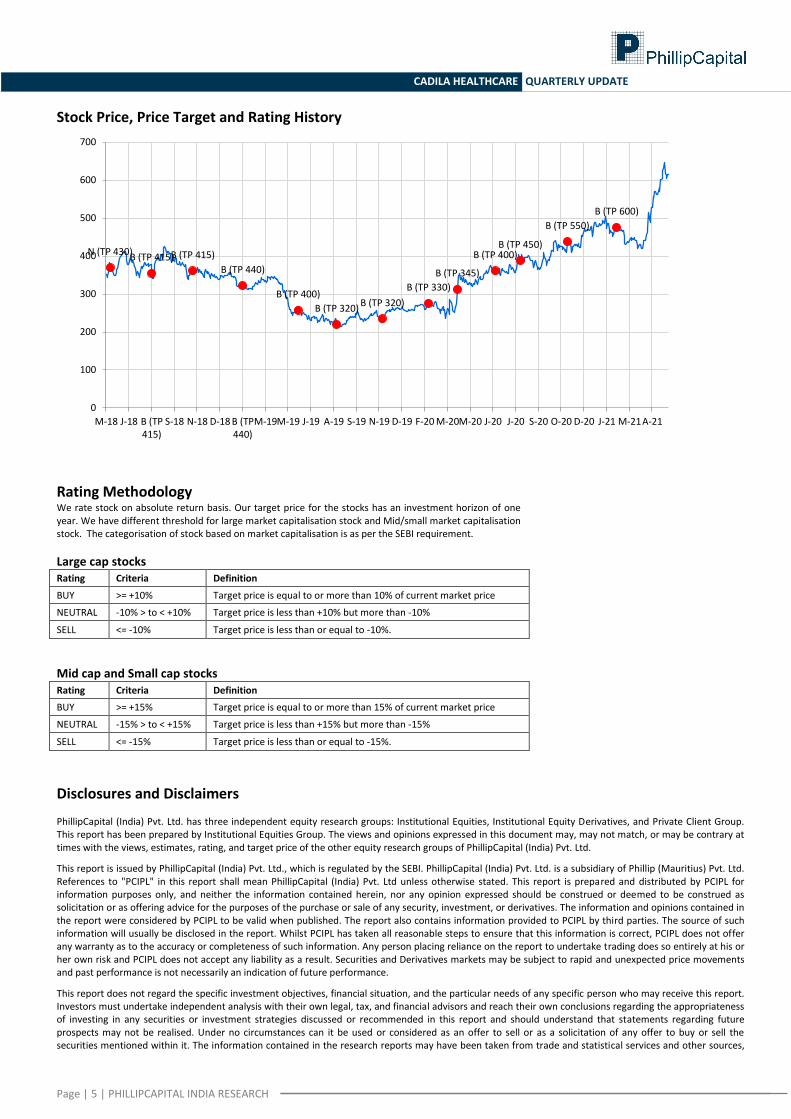
Stock Price, Price Target and Rating History
Rating Methodology We rate stock on absolute return basis. Our target price for the stocks has an investment horizon of one year. We have different threshold for large market capitalisation stock and Mid/small market capitalisation stock. The categorisation of stock based on market capitalisation is as per the SEBI requirement.
Large cap stocks Rating Criteria Definition
BUY >= +10% Target price is equal to or more than 10% of current market price
NEUTRAL -10% > to < +10% Target price is less than +10% but more than -10%
SELL <= -10% Target price is less than or equal to -10%.
Mid cap and Small cap stocks Rating Criteria Definition
BUY >= +15% Target price is equal to or more than 15% of current market price
NEUTRAL -15% > to < +15% Target price is less than +15% but more than -15%
SELL <= -15% Target price is less than or equal to -15%.
Disclosures and Disclaimers PhillipCapital (India) Pvt. Ltd. has three independent equity research groups: Institutional Equities, Institutional Equity Derivatives, and Private Client Group. This report has been prepared by Institutional Equities Group. The views and opinions expressed in this document may, may not match, or may be contrary at times with the views, estimates, rating, and target price of the other equity research groups of PhillipCapital (India) Pvt. Ltd.
This report is issued by PhillipCapital (India) Pvt. Ltd., which is regulated by the SEBI. PhillipCapital (India) Pvt. Ltd. is a subsidiary of Phillip (Mauritius) Pvt. Ltd. References to "PCIPL" in this report shall mean PhillipCapital (India) Pvt. Ltd unless otherwise stated. This report is prepared and distributed by PCIPL for information purposes only, and neither the information contained herein, nor any opinion expressed should be construed or deemed to be construed as solicitation or as offering advice for the purposes of the purchase or sale of any security, investment, or derivatives. The information and opinions contained in the report were considered by PCIPL to be valid when published. The report also contains information provided to PCIPL by third parties. The source of such information will usually be disclosed in the report. Whilst PCIPL has taken all reasonable steps to ensure that this information is correct, PCIPL does not offer any warranty as to the accuracy or completeness of such information. Any person placing reliance on the report to undertake trading does so entirely at his or her own risk and PCIPL does not accept any liability as a result. Securities and Derivatives markets may be subject to rapid and unexpected price movements and past performance is not necessarily an indication of future performance.
This report does not regard the specific investment objectives, financial situation, and the particular needs of any specific person who may receive this report. Investors must undertake independent analysis with their own legal, tax, and financial advisors and reach their own conclusions regarding the appropriateness of investing in any securities or investment strategies discussed or recommended in this report and should understand that statements regarding future prospects may not be realised. Under no circumstances can it be used or considered as an offer to sell or as a solicitation of any offer to buy or sell the securities mentioned within it. The information contained in the research reports may have been taken from trade and statistical services and other sources,
N (TP 430) B (TP 415) B (TP 415)
B (TP 440)
B (TP 400)
B (TP 320) B (TP 320)
B (TP 330)
B (TP 345)
B (TP 400) B (TP 450)
B (TP 550)
B (TP 600)
0
100
200
300
400
500
600
700
M-18 J-18 B (TP415)
S-18 N-18 D-18 B (TP440)
M-19M-19 J-19 A-19 S-19 N-19 D-19 F-20 M-20M-20 J-20 J-20 S-20 O-20 D-20 J-21 M-21A-21

Page | 6 | PHILLIPCAPITAL INDIA RESEARCH
CADILA HEALTHCARE QUARTERLY UPDATE
which PCIL believe is reliable. PhillipCapital (India) Pvt. Ltd. or any of its group/associate/affiliate companies do not guarantee that such information is accurate or complete and it should not be relied upon as such. Any opinions expressed reflect judgments at this date and are subject to change without notice.
Important: These disclosures and disclaimers must be read in conjunction with the research report of which it forms part. Receipt and use of the research report is subject to all aspects of these disclosures and disclaimers. Additional information about the issuers and securities discussed in this research report is available on request.
Certifications: The research analyst(s) who prepared this research report hereby certifies that the views expressed in this research report accurately reflect the research analyst’s personal views about all of the subject issuers and/or securities, that the analyst(s) have no known conflict of interest and no part of the research analyst’s compensation was, is, or will be, directly or indirectly, related to the specific views or recommendations contained in this research report.
Additional Disclosures of Interest: Unless specifically mentioned in Point No. 9 below: 1. The Research Analyst(s), PCIL, or its associates or relatives of the Research Analyst does not have any financial interest in the company(ies) covered in
this report. 2. The Research Analyst, PCIL or its associates or relatives of the Research Analyst affiliates collectively do not hold more than 1% of the securities of the
company (ies)covered in this report as of the end of the month immediately preceding the distribution of the research report. 3. The Research Analyst, his/her associate, his/her relative, and PCIL, do not have any other material conflict of interest at the time of publication of this
research report. 4. The Research Analyst, PCIL, and its associates have not received compensation for investment banking or merchant banking or brokerage services or for
any other products or services from the company(ies) covered in this report, in the past twelve months. 5. The Research Analyst, PCIL or its associates have not managed or co-managed in the previous twelve months, a private or public offering of securities for
the company (ies) covered in this report. 6. PCIL or its associates have not received compensation or other benefits from the company(ies) covered in this report or from any third party, in
connection with the research report. 7. The Research Analyst has not served as an Officer, Director, or employee of the company (ies) covered in the Research report. 8. The Research Analyst and PCIL has not been engaged in market making activity for the company(ies) covered in the Research report. 9. Details of PCIL, Research Analyst and its associates pertaining to the companies covered in the Research report:
Sr. no. Particulars Yes/No
1 Whether compensation has been received from the company(ies) covered in the Research report in the past 12 months for investment banking transaction by PCIL
No
2 Whether Research Analyst, PCIL or its associates or relatives of the Research Analyst affiliates collectively hold more than 1% of the company(ies) covered in the Research report
No
3 Whether compensation has been received by PCIL or its associates from the company(ies) covered in the Research report No
4 PCIL or its affiliates have managed or co-managed in the previous twelve months a private or public offering of securities for the company(ies) covered in the Research report
No
5 Research Analyst, his associate, PCIL or its associates have received compensation for investment banking or merchant banking or brokerage services or for any other products or services from the company(ies) covered in the Research report, in the last twelve months
No
Independence: PhillipCapital (India) Pvt. Ltd. has not had an investment banking relationship with, and has not received any compensation for investment banking services from, the subject issuers in the past twelve (12) months, and PhillipCapital (India) Pvt. Ltd does not anticipate receiving or intend to seek compensation for investment banking services from the subject issuers in the next three (3) months. PhillipCapital (India) Pvt. Ltd is not a market maker in the securities mentioned in this research report, although it, or its affiliates/employees, may have positions in, purchase or sell, or be materially interested in any of the securities covered in the report.
Suitability and Risks: This research report is for informational purposes only and is not tailored to the specific investment objectives, financial situation or particular requirements of any individual recipient hereof. Certain securities may give rise to substantial risks and may not be suitable for certain investors. Each investor must make its own determination as to the appropriateness of any securities referred to in this research report based upon the legal, tax and accounting considerations applicable to such investor and its own investment objectives or strategy, its financial situation and its investing experience. The value of any security may be positively or adversely affected by changes in foreign exchange or interest rates, as well as by other financial, economic, or political factors. Past performance is not necessarily indicative of future performance or results.
Sources, Completeness and Accuracy: The material herein is based upon information obtained from sources that PCIPL and the research analyst believe to be reliable, but neither PCIPL nor the research analyst represents or guarantees that the information contained herein is accurate or complete and it should not be relied upon as such. Opinions expressed herein are current opinions as of the date appearing on this material, and are subject to change without notice. Furthermore, PCIPL is under no obligation to update or keep the information current. Without limiting any of the foregoing, in no event shall PCIL, any of its affiliates/employees or any third party involved in, or related to computing or compiling the information have any liability for any damages of any kind including but not limited to any direct or consequential loss or damage, however arising, from the use of this document.
Copyright: The copyright in this research report belongs exclusively to PCIPL. All rights are reserved. Any unauthorised use or disclosure is prohibited. No reprinting or reproduction, in whole or in part, is permitted without the PCIPL’s prior consent, except that a recipient may reprint it for internal circulation only and only if it is reprinted in its entirety.
Caution: Risk of loss in trading/investment can be substantial and even more than the amount / margin given by you. Investment in securities market are subject to market risks, you are requested to read all the related documents carefully before investing. You should carefully consider whether trading/investment is appropriate for you in light of your experience, objectives, financial resources and other relevant circumstances. PhillipCapital and any of its employees, directors, associates, group entities, or affiliates shall not be liable for losses, if any, incurred by you. You are further cautioned that trading/investments in financial markets are subject to market risks and are advised to seek independent third party trading/investment advice outside PhillipCapital/group/associates/affiliates/directors/employees before and during your trading/investment. There is no guarantee/assurance as to returns or profits or capital protection or appreciation. PhillipCapital and any of its employees, directors, associates, and/or employees, directors, associates of PhillipCapital’s group entities or affiliates is not inducing you for trading/investing in the financial market(s). Trading/Investment decision is your sole responsibility. You must also read the Risk Disclosure Document and Do’s and Don’ts before investing.
Kindly note that past performance is not necessarily a guide to future performance.

Page | 7 | PHILLIPCAPITAL INDIA RESEARCH
CADILA HEALTHCARE QUARTERLY UPDATE
For Detailed Disclaimer: Please visit our website www.phillipcapital.in IMPORTANT DISCLOSURES FOR U.S. PERSONS This research report is a product of PhillipCapital (India) Pvt. Ltd. which is the employer of the research analyst(s) who has prepared the research report. PhillipCapital (India) Pvt Ltd. is authorized to engage in securities activities in India. PHILLIPCAP is not a registered broker-dealer in the United States and, therefore, is not subject to U.S. rules regarding the preparation of research reports and the independence of research analysts. This research report is provided for distribution to “major U.S. institutional investors” in reliance on the exemption from registration provided by Rule 15a-6 of the U.S. Securities Exchange Act of 1934, as amended (the “Exchange Act”). If the recipient of this report is not a Major Institutional Investor as specified above, then it should not act upon this report and return the same to the sender. Further, this report may not be copied, duplicated and/or transmitted onward to any U.S. person, which is not a Major Institutional Investor.
Any U.S. recipient of this research report wishing to effect any transaction to buy or sell securities or related financial instruments based on the information provided in this research report should do so only through Rosenblatt Securities Inc, 40 Wall Street 59th Floor, New York NY 10005, a registered broker dealer in the United States. Under no circumstances should any recipient of this research report effect any transaction to buy or sell securities or related financial instruments through PHILLIPCAP. Rosenblatt Securities Inc. accepts responsibility for the contents of this research report, subject to the terms set out below, to the extent that it is delivered to a U.S. person other than a major U.S. institutional investor.
The analyst whose name appears in this research report is not registered or qualified as a research analyst with the Financial Industry Regulatory Authority (“FINRA”) and may not be an associated person of Rosenblatt Securities Inc. and, therefore, may not be subject to applicable restrictions under FINRA Rules on communications with a subject company, public appearances and trading securities held by a research analyst account. Ownership and Material Conflicts of Interest Rosenblatt Securities Inc. or its affiliates does not ‘beneficially own,’ as determined in accordance with Section 13(d) of the Exchange Act, 1% or more of any of the equity securities mentioned in the report. Rosenblatt Securities Inc, its affiliates and/or their respective officers, directors or employees may have interests, or long or short positions, and may at any time make purchases or sales as a principal or agent of the securities referred to herein. Rosenblatt Securities Inc. is not aware of any material conflict of interest as of the date of this publication Compensation and Investment Banking Activities Rosenblatt Securities Inc. or any affiliate has not managed or co-managed a public offering of securities for the subject company in the past 12 months, nor received compensation for investment banking services from the subject company in the past 12 months, neither does it or any affiliate expect to receive, or intends to seek compensation for investment banking services from the subject company in the next 3 months. Additional Disclosures This research report is for distribution only under such circumstances as may be permitted by applicable law. This research report has no regard to the specific investment objectives, financial situation or particular needs of any specific recipient, even if sent only to a single recipient. This research report is not guaranteed to be a complete statement or summary of any securities, markets, reports or developments referred to in this research report. Neither PHILLIPCAP nor any of its directors, officers, employees or agents shall have any liability, however arising, for any error, inaccuracy or incompleteness of fact or opinion in this research report or lack of care in this research report’s preparation or publication, or any losses or damages which may arise from the use of this research report.
PHILLIPCAP may rely on information barriers, such as “Chinese Walls” to control the flow of information within the areas, units, divisions, groups, or affiliates of PHILLIPCAP.
Investing in any non-U.S. securities or related financial instruments (including ADRs) discussed in this research report may present certain risks. The securities of non-U.S. issuers may not be registered with, or be subject to the regulations of, the U.S. Securities and Exchange Commission. Information on such non-U.S. securities or related financial instruments may be limited. Foreign companies may not be subject to audit and reporting standards and regulatory requirements comparable to those in effect within the United States.
The value of any investment or income from any securities or related financial instruments discussed in this research report denominated in a currency other than U.S. dollars is subject to exchange rate fluctuations that may have a positive or adverse effect on the value of or income from such securities or related financial instruments.
Past performance is not necessarily a guide to future performance and no representation or warranty, express or implied, is made by PHILLIPCAP with respect to future performance. Income from investments may fluctuate. The price or value of the investments to which this research report relates, either directly or indirectly, may fall or rise against the interest of investors. Any recommendation or opinion contained in this research report may become outdated as a consequence of changes in the environment in which the issuer of the securities under analysis operates, in addition to changes in the estimates and forecasts, assumptions and valuation methodology used herein.
No part of the content of this research report may be copied, forwarded or duplicated in any form or by any means without the prior written consent of PHILLIPCAP and PHILLIPCAP accepts no liability whatsoever for the actions of third parties in this respect.
PhillipCapital (India) Pvt. Ltd. Registered office: 18th floor, Urmi Estate, Ganpatrao Kadam Marg, Lower Parel (West), Mumbai – 400013, India.