
Institutional Equities SKS Microfinance - nirmalbang.com MICROFINANCE-Initiating Coverag… · Loan...
36
Please refer to the disclaimer towards the end of the document. Institutional Equities Initiating Coverage Reuters: SKMS.BO; Bloomberg: SKSM IN SKS Microfinance Lone Play On Microfinance Boom With its Andhra Pradesh (AP) loan portfolio entirely written off and access to funds improving, we expect SKS Microfinance (SKS) to increase its assets under management (AUM) by a 40% CAGR over FY15-FY18E. Credit risk is under check following process improvement. With operating leverage kicking in, we expect a 49% CAGR in PBT and a 39% CAGR in PAT over FY15-FY18E. SKS is the only major listed player in the high-growth microfinance industry. We have assigned Buy rating to the stock with a target price of Rs600, valuing it through a residual income model. Microfinance industry – huge demand-supply gap: We believe the overall demand for microfinance in India could be Rs2.25trn–3.00trn. This market is serviced by bank-sponsored self-help groups (SHGs) and non-banking finance companies - microfinance institutions (NBFCs-MFIs). Both combined are able to meet only 26%-34% of potential demand, indicating huge under-penetration in the segment. We expect MFIs to post a CAGR of 25% and increase its share in microcredit to 53% by FY18E from 41% currently. Strong growth in AUM to support higher growth in profitability: SKS reported strong FY13-15 total AUM CAGR of 33% and Non-AP AUM CAGR of 44%. Given the strong underlying demand and AP portfolio completely written off, we expect FY15-FY18 disbursement and AUM CAGR of 33% and 40%, respectively, on the back of a 26% growth in client base and a 11% increase in ticket size. Despite factoring 95% CAGR in provisioning over FY15-FY18E and applicability of MAT (minimum alternate tax) to future profits, we expect PAT to post a CAGR of 39% supported by a PBT CAGR of 49%. Cost optimisation and operating leverage are profitability drivers: SKS continues to focus on enhancing the productivity of its employees and introducing technology for expeditious reporting. We expect the number of support staff other than loan officers to increase only in a calibrated manner, with fresh addition mostly in the form of loan officers. Cost-to-AUM ratio improved from 13.8% in FY12 to 8.7% in FY15. We expect this ratio to improve further to 7.1% in FY18. Credit risk under check on process improvement: Stringent regulations by the Reserve Bank of India (RBI) has improved transparency and mitigated political risk. Further, the setting up of credit bureaus and geographical diversification of its loan portfolio has kept credit risk under check. JLG model has tremendous strength of its own, with peer pressure acting as a biggest deterrent for group members to default. Despite pruning its non-AP loan portfolio, collection efficiency in those markets was at 97%, dispelling ever-greening myth. Entry barriers already in place: Currently, the spread is capped at 10% and operating expenses are very high and, therefore, larger and established companies have an advantage over new entrants, given their scale of operations. With the restriction on lending - like not more than two MFIs can lend to the same borrower - new players will find it difficult if the new territories are dominated by two or more strong players. Valuation and outlook: We expect SKS to manage RoA above 4.5% and RoE above 22.0% on a sustainable basis. Also, SKS being the only listed company in high-growth MFI sector along with a probability of being allotted a small bank licence, deserves a premium valuation. SKS stock currently trades at P/ABV of 4.4x FY16E and 3.5x FY17E. However, if we add unrecognized accumulated deferred tax assets and build-up of MAT credit in the coming years to their respective book value, the stock trades at 3.3x FY16E ABV and 2.8x FY17E ABV. We have assigned Buy rating to the stock with a target price of Rs600. BUY Sector: NBFC-MFI CMP: Rs455 Target Price: Rs600 Upside: 32% Hatim Broachwala, CFA [email protected] +91-22-3926 8068 Key Data Current Shares O/S (mn) 126.4 Mkt Cap (Rsbn/US$mn) 59.3/931.8 52 Wk H / L (Rs) 525/250 Daily Vol. (3M NSE Avg.) 1,717,735 Shareholding (%) 2QFY15 3QFY15 4QFY15 Promoter 9.3 9.3 9.3 FII 44.7 48.2 47.1 DII 15.3 15.0 14.4 Others 30.8 27.5 29.2 One Year Indexed Stock Performance Price Performance (%) 1 M 6 M 1 Yr SKS Microfinance (0.1) 32.4 53.0 Nifty Index 3.1 (1.1) 14.5 Source: Bloomberg Y/E March (Rsmn) FY14 FY15 FY16E FY17E FY18E Net interest income 2,600 3,981 5,894 8,018 10,665 PAT 699 1,877 2,352 3,471 5,011 EPS (Rs) 6.5 14.9 18.6 27.5 39.7 ABV (Rs) 42.3 82.8 103.2 130.5 170.0 P/E (x) 70.4 30.6 24.4 16.6 11.5 P/ABV (x) 10.8 5.5 4.4 3.5 2.7 RoE (%) 16.5 24.9 20.0 23.4 26.3 RoA (%) 2.8 5.2 4.3 4.9 5.3 Source: Company, Nirmal Bang Institutional Equities Research 50 70 90 110 130 150 170 190 Jun-14 Aug-14 Oct-14 Dec-14 Feb-15 Apr-15 Jun-15 SKS MICROFINANCE NSE CNX NIFTY INDEX 2 June 2015
Transcript of Institutional Equities SKS Microfinance - nirmalbang.com MICROFINANCE-Initiating Coverag… · Loan...
Please refer to the disclaimer towards the end of the document.
Institutional Equities
Initi
atin
g C
over
age
Reuters: SKMS.BO; Bloomberg: SKSM IN
SKS Microfinance
Lone Play On Microfinance Boom With its Andhra Pradesh (AP) loan portfolio entirely written off and access to funds improving, we expect SKS Microfinance (SKS) to increase its assets under management (AUM) by a 40% CAGR over FY15-FY18E. Credit risk is under check following process improvement. With operating leverage kicking in, we expect a 49% CAGR in PBT and a 39% CAGR in PAT over FY15-FY18E. SKS is the only major listed player in the high-growth microfinance industry. We have assigned Buy rating to the stock with a target price of Rs600, valuing it through a residual income model. Microfinance industry – huge demand-supply gap: We believe the overall demand for microfinance in India could be Rs2.25trn–3.00trn. This market is serviced by bank-sponsored self-help groups (SHGs) and non-banking finance companies - microfinance institutions (NBFCs-MFIs). Both combined are able to meet only 26%-34% of potential demand, indicating huge under-penetration in the segment. We expect MFIs to post a CAGR of 25% and increase its share in microcredit to 53% by FY18E from 41% currently. Strong growth in AUM to support higher growth in profitability: SKS reported strong FY13-15 total AUM CAGR of 33% and Non-AP AUM CAGR of 44%. Given the strong underlying demand and AP portfolio completely written off, we expect FY15-FY18 disbursement and AUM CAGR of 33% and 40%, respectively, on the back of a 26% growth in client base and a 11% increase in ticket size. Despite factoring 95% CAGR in provisioning over FY15-FY18E and applicability of MAT (minimum alternate tax) to future profits, we expect PAT to post a CAGR of 39% supported by a PBT CAGR of 49%. Cost optimisation and operating leverage are profitability drivers: SKS continues to focus on enhancing the productivity of its employees and introducing technology for expeditious reporting. We expect the number of support staff other than loan officers to increase only in a calibrated manner, with fresh addition mostly in the form of loan officers. Cost-to-AUM ratio improved from 13.8% in FY12 to 8.7% in FY15. We expect this ratio to improve further to 7.1% in FY18. Credit risk under check on process improvement: Stringent regulations by the Reserve Bank of India (RBI) has improved transparency and mitigated political risk. Further, the setting up of credit bureaus and geographical diversification of its loan portfolio has kept credit risk under check. JLG model has tremendous strength of its own, with peer pressure acting as a biggest deterrent for group members to default. Despite pruning its non-AP loan portfolio, collection efficiency in those markets was at 97%, dispelling ever-greening myth. Entry barriers already in place: Currently, the spread is capped at 10% and operating expenses are very high and, therefore, larger and established companies have an advantage over new entrants, given their scale of operations. With the restriction on lending - like not more than two MFIs can lend to the same borrower - new players will find it difficult if the new territories are dominated by two or more strong players. Valuation and outlook: We expect SKS to manage RoA above 4.5% and RoE above 22.0% on a sustainable basis. Also, SKS being the only listed company in high-growth MFI sector along with a probability of being allotted a small bank licence, deserves a premium valuation. SKS stock currently trades at P/ABV of 4.4x FY16E and 3.5x FY17E. However, if we add unrecognized accumulated deferred tax assets and build-up of MAT credit in the coming years to their respective book value, the stock trades at 3.3x FY16E ABV and 2.8x FY17E ABV. We have assigned Buy rating to the stock with a target price of Rs600.
BUY
Sector: NBFC-MFI
CMP: Rs455
Target Price: Rs600
Upside: 32%
Hatim Broachwala, CFA
+91-22-3926 8068
Key Data
Current Shares O/S (mn) 126.4
Mkt Cap (Rsbn/US$mn) 59.3/931.8
52 Wk H / L (Rs) 525/250
Daily Vol. (3M NSE Avg.) 1,717,735
Shareholding (%) 2QFY15 3QFY15 4QFY15
Promoter 9.3 9.3 9.3
FII 44.7 48.2 47.1
DII 15.3 15.0 14.4
Others 30.8 27.5 29.2
One Year Indexed Stock Performance
Price Performance (%)
1 M 6 M 1 Yr
SKS Microfinance (0.1) 32.4 53.0
Nifty Index 3.1 (1.1) 14.5
Source: Bloomberg
Y/E March (Rsmn) FY14 FY15 FY16E FY17E FY18E
Net interest income 2,600 3,981 5,894 8,018 10,665
PAT 699 1,877 2,352 3,471 5,011
EPS (Rs) 6.5 14.9 18.6 27.5 39.7
ABV (Rs) 42.3 82.8 103.2 130.5 170.0
P/E (x) 70.4 30.6 24.4 16.6 11.5
P/ABV (x) 10.8 5.5 4.4 3.5 2.7
RoE (%) 16.5 24.9 20.0 23.4 26.3
RoA (%) 2.8 5.2 4.3 4.9 5.3
Source: Company, Nirmal Bang Institutional Equities Research
50
70
90
110
130
150
170
190
Jun-14 Aug-14 Oct-14 Dec-14 Feb-15 Apr-15 Jun-15
SKS MICROFINANCE NSE CNX NIFTY INDEX
2 June 2015

Institutional Equities
SKS Microfinance
Valuation and outlook
We expect net interest income (NII) growth to mirror AUM CAGR of 40% over FY15-FY18E as the spread is capped. Loan origination fees have also been capped at 1% of disbursement. Despite factoring in higher credit costs, we expect PBT CAGR of 49% over FY15-FY18E on the back of cost optimisation and better distribution fees. PAT is expected to witness a 39% CAGR as the company will be paying MAT from FY16.
We believe SKS can manage RoA above 4.5% and RoE above 22% on a sustainable basis. Also, SKS being the only listed company in the high-growth MFI industry along with the prospects of being allotted a small bank licence, deserves a premium valuation. SKS stock currently trades at P/ABV of 4.4x FY16E and 3.5x FY17E. However, if we add unrecognized accumulated deferred tax assets and build-up of MAT credit in the coming years to their respective book value, the stock trades at 3.3x FY16E earnings and 2.8x FY17E earnings. We have assigned Buy rating to the stock with a target price of Rs600, valuing it through a residual income model.
Our target price implies a P/ABV of 4.6x FY17E and 3.5x FY18E. After adding back unrecognized accumulated deferred tax assets and build-up of MAT credit in the coming years to their respective book value, our target price implies a P/ABV of 3.7x FY17E and 3.1x FY18E.
Exhibit 1: Residual income model
(Rsmn) FY15 FY16E FY17E FY18E FY19E FY20E FY21E FY22E FY23E FY24E FY25E Terminal
RoA % 5.22 4.31 4.85 5.32 5.30 5.20 5.10 5.00 4.90 4.80 4.60 -
Average assets 35,980 54,503 71,546 94,125 122,363 159,072 190,886 229,064 274,877 329,852 395,822 -
Profits 1,877 2,352 3,471 5,011 6,485 8,272 9,735 11,453 13,469 15,833 18,208 -
Net worth 10,465 13,074 16,545 21,556 28,042 36,313 44,102 53,264 64,039 76,706 91,272 -
Dividend - - - - - - 1,947 2,291 2,694 3,167 3,642 -
Payout % 0.0 0.0 0.0 0.0 0.0 0.0 20.0 20.0 20.0 20.0 20.0 -
RoE % 24.9 20.0 23.4 26.3 26.2 25.7 24.2 23.5 23.0 22.5 21.7 22.0
Cost of equity % 13.6 13.6 13.6 13.6 13.6 13.6 13.6 13.6 13.6 13.6 13.6 13.6
Residual income % 11.4 6.4 9.9 12.8 12.6 12.2 10.7 10.0 9.4 8.9 8.1 8.5
Residual income (Rsmn) 857 757 1,464 2,430 3,125 3,912 4,287 4,857 5,522 6,297 6,827 127,801
PV factor - 1.00 0.88 0.78 0.68 0.60 0.53 0.47 0.41 0.36 0.32 0.32
PV residual income - 757 1,290 1,885 2,134 2,353 2,271 2,266 2,269 2,279 2,176 40,724
Valuation - Per Share
Sum of Future Residual Income 480
Book Value - FY16 104
Total 584
Present Value of MAT Credit 16
Target Price 600
Average Asset Growth (%)
Phase I 30
Phase II 20
Terminal 7
Cost of Equity
Risk Free Rate 7.5
Market Return 13
Beta 1.1
Cost of Equity 13.6
Source: Company, Nirmal Bang Institutional Equities Research

Institutional Equities
SKS Microfinance
Exhibit 2: SKS better placed on RoA versus P/BV matrix
Source: Bloomberg, Nirmal Bang Institutional Equities Research
Exhibit 3: SKS stock trades below its mean multiple
Source: Bloomberg, Nirmal Bang Institutional Equities Research
Exhibit 4: Our estimates versus Bloomberg consensus estimtaes
Y/E March Our estimates Bloomberg Cons. estimates Variation (%)
(Rsmn) FY16E FY17E FY16E FY17E FY16E FY17E
PAT 2,352 3,471 2,444 3,593 (3.8) (3.4)
ROA (%) 4.3 4.9 5.2 5.2 -85 bps -39 bps
ROE (%) 20.0 23.4 20.8 24.5 -82 bps -106 bps
Source: Bloomberg, Nirmal Bang Institutional Equities Research
SKS
AXSB
HDFCB
ICICIB
KMBINBK
YES
HDFC
LICHFMMFS
SHTF
BAF
SCUF
1.0
1.5
2.0
2.5
3.0
3.5
4.0
10.0 12.0 14.0 16.0 18.0 20.0 22.0 24.0
P/B
V -
FY
17
ROE - FY17
(%)
-
5
10
15
20
25
Au
g-1
0
De
c-1
0
Ap
r-1
1
Au
g-1
1
De
c-1
1
Ap
r-1
2
Au
g-1
2
De
c-1
2
Ap
r-1
3
Au
g-1
3
De
c-1
3
Ap
r-1
4
Au
g-1
4
De
c-1
4
Ma
y-1
5
P/AdjBVPS Mean +1 SD -1 SD
(x)

Institutional Equities
SKS Microfinance
Microfinance industry – Huge demand- supply gap
Demand
A major portion of India’s poor population has no access to banking channels on account of lack of documentation. As a result, demand for microfinance remains strong. According to 2011 World Bank statistics, 59.2% of the country’s population earns less than US$2 a day. Mean household size is 4.8 members per household (based on 2005-06 National Family Health Survey) translating into ~150mn households below the poverty line, which are necessarily demand generators for microfinance. Assuming the average credit requirement is Rs15,000-Rs20,000 per household, it translates into overall potential industry size of Rs2.25trn-3.00tn.
Supply
In India, microcredit is provided by two type of institutions - one is bank-sponsored self help groups (SHGs) and the other is microfinance institutions. The SHG-bank linkage model has reached out to around 97mn households through 7.4mn SHGs with a gross loan outstanding of Rs429bn. Microcredit services provided by MFIs in a tailor-made fashion an outstanding loan portfolio of Rs294bn. Therefore, total microcredit supply is to the tune of Rs723bn, indicating huge demand-supply gap in microcredit business.
Exhibit 5: Break-up of microfinance loans
Source: Sa-Dhan, Nirmal Bang Institutional Equities Research
Share of microfinance within microcredit increased from 22% in FY07 to 41% in FY11. Post-AP crisis, it fell 37% in FY12 and then bounced back again to 41% in FY14 as the operating environment for MFIs got stabilised after the RBI’s measures.
We expect MFI Joint liability group (JLG) model to continue to gain market share over SHG model, as with the regulatory risk being taken care of, debt as well as equity funding for MFIs improved dramatically. Also, the GNPAs (gross non-performing assets) in non-AP MFI portfolio at less than 1% is far superior to SHG GNPAs of 6.8%. We expect MFIs to post a CAGR of 25% over the next couple of years and increase its share in microcredit to 53% by FY18E.
Exhibit 6: Market share of MFIs likely to increase
Source: Sa-Dhan, Nirmal Bang Institutional Equities Research
124
170
227
280312
363393
429
3459
117
183215 209 223
294
0
50
100
150
200
250
300
350
400
450
500
FY07 FY08 FY09 FY10 FY11 FY12 FY13 FY14
SHG MFI
(Rsbn)
78.574.2
66.060.5 59.2
63.5 63.859.3
56.253.1
49.9
46.7
21.525.8
34.039.5 40.8
36.5 36.240.7
43.846.9
50.1
53.3
0
10
20
30
40
50
60
70
80
90
FY07 FY08 FY09 FY10 FY11 FY12 FY13 FY14 FY15 FY16E FY17E FY18E
SHG market share MFI market share
(%)

Institutional Equities
SKS Microfinance
Consolidation phase is behind
MFIs in India had been consolidating their operations to cope up with the effects of transition happening in the sector. Growth in loan portfolio fluctuates year on year, touching its lowest level in 2012 owing to the AP crisis and consequent drop in commercial funding to MFIs. In 2013, however, the reverse trend started. This upward growth was maintained in 2014 as well, thanks to resumption of bank funding to MFIs. A similar trend was witnessed in the number of clients served by MFI players
Exhibit 7: MFI loan growth back on track Exhibit 8: Rise in the number of clients
Source: MFIN, Nirmal Bang Institutional Equities Research Source: MFIN, Nirmal Bang Institutional Equities Research
SKS is sole survivor in Andhra Pradesh
Except Bandhan, all large MFIs had a sizeable loan exposure in the state. Exposure to AP constituted a major portion of the total loan book for MFIs including Spandana, Share, Asmitha, and BSFL. Consequently, they were badly hit by the state government’s regulations and had to restructure their debts. Four of the five largest MFIs in AP are under corporate debt restructuring or CDR.
Exhibit 9: Performance of AP based players
FY10 FY11 FY12 FY13 FY14
AUM (Rsmn)
SKS 43,210 41,110 16,690 23,590 31,130
Spandana 35,405 34,581 27,152 22,232 21,072
Share Microfin 16,935 20,649 21,102 19,315 17,577
Asmita 14,185 13,248 11,994 10,711 9,471
BSFL 7,757 12,488 2,919 2,544 2,230
Future 2,443 2,308 1,781 2,042 2,283
PAT (Rsmn)
SKS 1,740 1,116 (13,606) (2,971) 699
Spandana 2,035 (92) (2,698) (11,757) 643
Share Microfin 1,087 91 (2,566) (9,453) (449)
Asmita 588 210 (1,515) (5,846) (492)
BSFL 310 102 (5,841) (923) (992)
Future 152 67 (180) (115) 82
Portfolio at Risk (PAR) > 90 days
SKS * 0.3 2.3 30.0 16.8 10.3
Spandana 0.0 44.7 52.3 61.5 57.4
Share Microfin 0.1 47.9 52.2 53.6 56.4
Asmita 0.3 43.7 55.8 58.3 63.7
BSFL 1.4 28.5 56.8 66.5 58.3
Future 0.0 96.5 0.0 18.4 8.8
For SKS, it is PAR>60 days Source: Mix Markets, Nirmal Bang Institutional Equities Research
SKS was able to survive the AP crisis as it had started early in diversifying its portfolio outside the state and raised capital through an initial public offer (IPO) just months before the AP ordinance, and also qualified institutional placement (QIP) of shares in July 2012.
72.0
97.0
56.0
19.0
(7.0)
4.0
43.0
61.0
(20)
0
20
40
60
80
100
120
FY08 FY09 FY10 FY11 FY12 FY13 FY14 FY15
(%)
22.3
27.6
20.719.4
23.7
30.5
0
5
10
15
20
25
30
35
FY10 FY11 FY12 FY13 FY14 FY15
(No mn)

Institutional Equities
SKS Microfinance
Exhibit 10: AUM composition (December 2010) Exhibit 11: AUM composition (March 2015)
Source: Company, Nirmal Bang Institutional Equities Research Source: Company, Nirmal Bang Institutional Equities Research
Timely raising of equity capital
SKS successfully managed its debt obligations without taking recourse to the CDR route and controlled costs through downsizing. It raised equity capital several months before the IPO. SKS also raised Rs2.6bn through QIP and preferential allotment routes in July 2012. Post issuance, SKS completely wrote off its AP loan book and had the necessary capital to restart growth. It again raised Rs4.0bn in May 2014 to support future growth.
Exhibit 12: Equity raised in a timely manner
Source: Company, Nirmal Bang Institutional Equities Research
MFI industry dominated by top 5 players
Although there are more than 45 players in the domestic MFI industry, it is dominated by top 5 players with a combined market share of over 60% in gross loan portfolio (GLP) and disbursement. Post imposition of stringent regulations, top 5 players further strengthened their operations. Two of the top 5 players viz. Bandhan and Equitas, are concentrating on West Bengal and Tamil Nadu. Two of the other top 5 players viz,Janalakshmi and Ujjivan are urban MFIs. Thus, SKS is the only MFI with an efficient geographical diversification.
Exhibit 13: Market share in GLP Exhibit 14: Market share in disbursement
Source: Company, Nirmal Bang Institutional Equities Research Source: Company, Nirmal Bang Institutional Equities Research
30
13
119
8
7
4
4
43
3 1 3 AP
West Bengal
Karnataka
Orissa
Maharashtra
Bihar
Uttar Pradesh
Madhya Pradesh
Gujarat
Kerala
Rajasthan
Jharkhand
Others
(%)17
15
11
1112
9
5
6
5
4 2 2 2 Karnataka
West Bengal
Bihar
Maharashtra
Uttar Pradesh
Madhya Pradesh
Kerala
Rajasthan
Jharkhand
Punjab
Haryana
Others
(%)
9.5
17.8
4.3 3.9 4.6
10.5
1.7 1.1
(13.6)
(3.0)
0.7 1.9
(20)
(15)
(10)
(5)
0
5
10
15
20
FY10 FY11 FY12 FY13 FY14 FY15
Networth PAT
IPO of Rs6.9bn
QIP Rs2.6bn
(Rsbn) QIP Rs4bn
23.7
10.4
9.4
8.25.4
42.9
Bandhan SKS Janalakshmi Ujjivan Equitas Others
(%)
27.4
12.8
7.57.9
3.9
40.5
Bandhan SKS Janalakshmi Ujjivan Equitas Others
(%)
Institutional Equities
SKS Microfinance
AUM expected to post a 40% CAGR
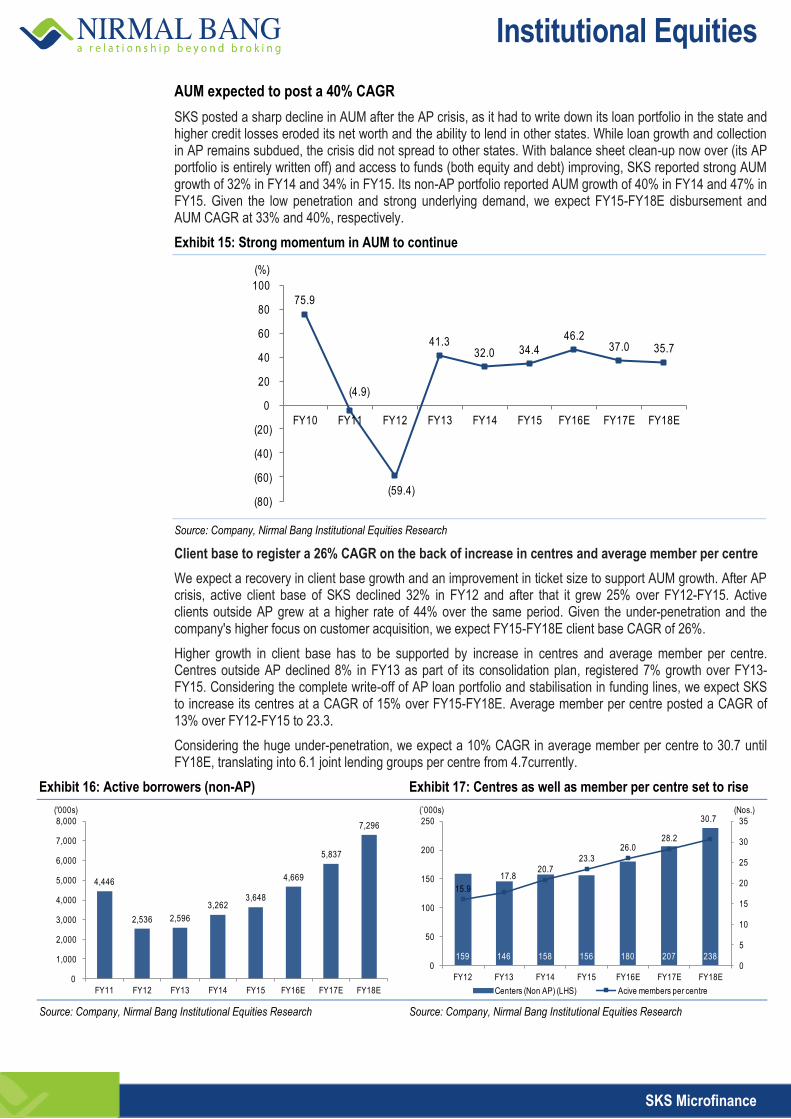
SKS posted a sharp decline in AUM after the AP crisis, as it had to write down its loan portfolio in the state and higher credit losses eroded its net worth and the ability to lend in other states. While loan growth and collection in AP remains subdued, the crisis did not spread to other states. With balance sheet clean-up now over (its AP portfolio is entirely written off) and access to funds (both equity and debt) improving, SKS reported strong AUM growth of 32% in FY14 and 34% in FY15. Its non-AP portfolio reported AUM growth of 40% in FY14 and 47% in FY15. Given the low penetration and strong underlying demand, we expect FY15-FY18E disbursement and AUM CAGR at 33% and 40%, respectively.
Exhibit 15: Strong momentum in AUM to continue
Source: Company, Nirmal Bang Institutional Equities Research
Client base to register a 26% CAGR on the back of increase in centres and average member per centre
We expect a recovery in client base growth and an improvement in ticket size to support AUM growth. After AP crisis, active client base of SKS declined 32% in FY12 and after that it grew 25% over FY12-FY15. Active clients outside AP grew at a higher rate of 44% over the same period. Given the under-penetration and the company's higher focus on customer acquisition, we expect FY15-FY18E client base CAGR of 26%.
Higher growth in client base has to be supported by increase in centres and average member per centre. Centres outside AP declined 8% in FY13 as part of its consolidation plan, registered 7% growth over FY13-FY15. Considering the complete write-off of AP loan portfolio and stabilisation in funding lines, we expect SKS to increase its centres at a CAGR of 15% over FY15-FY18E. Average member per centre posted a CAGR of 13% over FY12-FY15 to 23.3.
Considering the huge under-penetration, we expect a 10% CAGR in average member per centre to 30.7 until FY18E, translating into 6.1 joint lending groups per centre from 4.7currently.
Exhibit 16: Active borrowers (non-AP) Exhibit 17: Centres as well as member per centre set to rise
Source: Company, Nirmal Bang Institutional Equities Research Source: Company, Nirmal Bang Institutional Equities Research
75.9
(4.9)
(59.4)
41.3 32.0 34.4
46.2 37.0 35.7
(80)
(60)
(40)
(20)
0
20
40
60
80
100
FY10 FY11 FY12 FY13 FY14 FY15 FY16E FY17E FY18E
(%)
4,446
2,536 2,596
3,262 3,648
4,669
5,837
7,296
0
1,000
2,000
3,000
4,000
5,000
6,000
7,000
8,000
FY11 FY12 FY13 FY14 FY15 FY16E FY17E FY18E
('000s)
159 146 158 156 180 207 238
15.9
17.820.7
23.3
26.028.2
30.7
0
5
10
15
20
25
30
35
0
50
100
150
200
250
FY12 FY13 FY14 FY15 FY16E FY17E FY18E
Centers (Non AP) (LHS) Acive members per centre
(`000s) (Nos.)

Institutional Equities
SKS Microfinance
Loan ticket size to increase as it aims to increase long-term loans
Loan growth should also be supported by higher ticket sizes. The average outstanding loan in non-AP markets has been rising consistently over FY11-FY15, yet significantly lower at Rs11,434 as against maximum borrower indebtedness of Rs100,000 allowed for NBFC-MFIs. Average AUM per borrower for the industry is Rs13,160. This limit was recently increased by the RBI, which indicates the regulator is comfortable with the rise in ticket size. Disbursement per client is also lower at RsRs13,443 against industry average of Rs16,327. We expect a CAGR of 11% over FY15-FY18E in ticket size to Rs12,618, as the management is targeting higher growth in long-term loans having a higher ticket size of Rs28,691. The proportion of long-term loans increased to 16% in FY15 against 2% in FY14. The proportion of long-term loans is likely to increase further with a disbursement cap of 25% on overall disbursement.
Exhibit 18: Ticket size to increase with a higher proportion of long-term loans
Exhibit 19: Ticket size lowest among peers
Source: Company, Nirmal Bang Institutional Equities Research Source: Company, MFIN, Nirmal Bang Institutional Equities Research
Exhibit 20: Product offering
IGL MTL LTL Other products Gold loan
Loan portfolio (Rsbn) 22.6 11.4 6.8 0.7 0.5
Ticket size range (Rs) 7,591 to 14,959 21,943 to 29,809 Solar lamp 1,772 Mobile phone 2.495
2,000 to 200,000
Average ticket size (Rs) 13,565 12,751 28,739 2,048 13,705
Eligibility Completion of CGT/GRT age limit 18-55years
With IGL between 20th to 45th week With LTL between 20th to 96th week
Minimum two IGL loan cycles completed No current IGL outstanding
With IGL between 4th to 46th week With LTL between 4th to 100th week
-
Tenure 50 Weeks 104 weeks 25 weeks 270-365 days
Annual effective interest rates
23.55% Solar 22.85% Mobile 20.5%
24-26%
Processing fee 1% Solar 0.7% Mobile 0.9-1%
0.5%
Source: Company, Nirmal Bang Institutional Equities Research
Note: IGL - Income generating loans, MTL - Mid-term Loans, LTL - Long term loans
CGT - Compulsory group training, GRT – Group recognition test
2,665
5,205
7,766 8,682
11,434
13,099
14,358 15,593
0
2,000
4,000
6,000
8,000
10,000
12,000
14,000
16,000
18,000
FY11 FY12 FY13 FY14 FY15 FY16E FY17E FY18E
(Rs)
22,418 21,886 20,682
19,918
14,116
11,434
0
5,000
10,000
15,000
20,000
25,000
Satin Bandhan Janalakshmi Ujjivan Equitas SKS
(Rsmn)

Institutional Equities
SKS Microfinance
We expect balance sheet loans to register FY15-18 CAGR of 42%, whereas we expect securitisation CAGR lower at 33% as the norm for banks to have direct loan exposure of 13.5% to the agriculture sector under PSL (priority lending) will no longer be there. Therefore, banks will prefer indirect exposure through MFIs as against direct exposure through securitisation, as the latter involves lot of costs and paper work for banks. From a funding perspective, it should not make any difference as lending to MFIs will still be classified as PSL under various sub-heads viz. agriculture, weaker section and micro enterprise.
Exhibit 21: Share of securitisation to decline
Source: Company, Nirmal Bang Institutional Equities Research
Stable funding with increased diversification
With tight regulations in place and healthy profitability of large MFIs, the funding scenario significantly stabilised and improved further in FY15. Apart from normal funding sources such as bank borrowings and securitisation, they have now resorted to issuing non-convertible debentures and commercial paper. SKS has got rating upgrade to A1+ from A1 for short-term facilities and A+ from A for long-term facilities
Exhibit 22: Funding growth Exhibit 23: Increased diversification
Source: Company, Nirmal Bang Institutional Equities Research Source: Company, Nirmal Bang Institutional Equities Research
0%
10%
20%
30%
40%
50%
60%
70%
80%
90%
100%
FY10 FY11 FY12 FY13 FY14 FY15 FY16E FY17E FY18E
Share of B/S Loans Share of securisation
28.4
(29.7)(32.9)
29.2
17.5
55.3
(40)
(30)
(20)
(10)
0
10
20
30
40
50
60
FY10 FY11 FY12 FY13 FY14 FY15
(%)
0%
10%
20%
30%
40%
50%
60%
70%
80%
90%
100%
FY10 FY11 FY12 FY13 FY14 FY15
Bank/FI Loans Securitisation/Managed loans NCD CP

Institutional Equities
SKS Microfinance
Loan portfolio of SKS qualifies for overall PSL target of 40% and all sub-targets under new PSL norms for banks.
Exhibit 24: Classification of SKS portfolio under PSL for banks
Sector Category Target for banks (%) Qualifying portfolio of SKS (%) Explanation
Agriculture Target 18% 30%
Livestock, agriculture & allied sectors. Small & marginal farmers Sub-target
7% (March 2016) 8% (March 2017)
30%
Weaker section Target 10% 100%
100% loans to women, 16% loans to minority community and 71% loans to economically weaker sections.
Micro enterprises Target 7% (March 2016)
7.5% (March 2017) 100% Lending to micro enterprises.
Source: Company, Nirmal Bang Institutional Equities Research
SKS loan portfolio is diversified across economic activities with insignificant dependence on agriculture.
Exhibit 25: Portfolio outstanding according to economic activity
Purpose % of mix
Livestock 26%
Tailoring, cloth weaving 11%
Grocery stores & retail outlets 9%
Masonry, painting, plumbing, electrician, carpenter 8%
Trading of vegetables & fruits 8%
Vehicle repairs 6%
Trading of agri commodities 5%
Eateries 5%
Agriculture 4%
Garments & footwear retailing 3%
Other income generating activities 15%
Source: Company, Nirmal Bang Institutional Equities Research
SKS runs a positive ALM, which enabled the company to take care of liquidity problem even during the AP crisis.
Exhibit 26: Positive ALM
Average maturity (months) FY10 FY11 FY12 FY13 FY14 FY15
Assets 4.5 3.8 4.9 4.9 4.9 5.7
Liabilities 9.1 8.2 7.8 6.5 6.3 9.2
Source: Company, Nirmal Bang Institutional Equities Research

Institutional Equities
SKS Microfinance
NIM to be flattish
Loan spreads for MFIs (with loan assets of more than Rs1bn) have been capped at 10%. We expect NIM to remain flattish over FY15-FY18E, as the expected negative impact on account of decrease in the proportion of securitisation will be offset by maintainance of a lower cash balance.
Exhibit 27: NIM
Source: Company, Nirmal Bang Institutional Equities Research
Negative impact
We expect the proportion of securitisation to come off a bit as the requirement of direct agriculture sector loan exposure of 13.5% under PSL for banks has been removed. Therefore, banks would prefer to take indirect exposure via MFIs against direct exposure through securitisation, as the latter involves lot of costs and paper work for banks. From a funding perspective, it should not make any difference as lending to MFIs will still be classified as PSL under various sub-heads viz. agriculture, weaker section and micro enterprise. This move can impact NIM negatively.
Positive impact
Cash proportion as a percentage of total balance sheet increased to 33% in FY15 from 26% in FY14. Such a huge increase in cash proportion is attributable to banks’ tendency to achieve PSL targets at the end of the financial year. Most of the funding lines are available to SKS only during the end of the financial year, and so there is a tendency to accumulate funds in March and utilise them over the next year. The requirement of maintaining PSL on a quarterly basis as against yearly basis from FY17 will enable SKS to access funds on a quarterly basis and will lead to maintenance of a lower cash balance. This will impact NIM positively.
PAT CAGR growth of 39%
Despite factoring in provisioning to increase by a 95% CAGR over FY15-FY18E and applicability of MAT to future profits as SKS has completed its write-off of AP loan portfolio, we expect PAT to post a 39% CAGR supported by a PBT CAGR of 49%. Higher delta will come from improvement in operating efficiency and higher traction in distribution fees from non-microcredit products.
Exhibit 28: PAT
Source: Company, Nirmal Bang Institutional Equities Research
8.1
9.3
10.811.6 11.3 11.6 11.6
0
2
4
6
8
10
12
14
FY12 FY13 FY14 FY15 FY16E FY17E FY18E
(%)
1.1
(13.6)
(3.0)
0.7 1.9 2.4
3.5 5.0
(15)
(10)
(5)
0
5
10
FY11 FY12 FY13 FY14 FY15 FY16E FY17E FY18E
(Rsbn)

Institutional Equities
SKS Microfinance
Cross-sales of various products to enhance RoA
SKS has a huge network comprising 1,268 branches and 227,125 centres through which it distributes micro loans. Taking advantage of its network, it also distributes financial and non‐financial products of other institutions to its members. It only distributes those products which enhance income-generating activity of the members. Such products and services offering fee income enhance its overall RoA.
Exhibit 29: Share of micro loans and various other non-micro loans
Source: Company, Nirmal Bang Institutional Equities Research
Financial products and services other than micro‐loans include providing loans to its members for the purchase of Nokia mobile handsets and also loans to facilitate the purchase of solar lamps in association with D.Light Energy. Another product in the pilot phase is loans for sewing machines, biomass cook stove, water purifier and bicycles. SKS earns a commission from the manufacturers for facilitating the sale of these products.
Exhibit 30: Cross-sales
FY14 FY15
Mobile phones
No. of units facilitated (Lakhs) 1.8 4.5
Gross fees (Rsmn) 63 159
Net fees (Rsmn) 58 134
Net fees as % of profits 8.3 7.2
Loan portfolio (Rsmn) 23 331
Loan portfolio mix (%) 0.1 0.6
Solar lamps
No. of units facilitated (Lakhs) 1.0 3.9
Gross fees (Rsmn) 27 124
Net fees (Rsmn) 24 103
Net fees as % of profits 3.5 5.5
Loan portfolio (Rsmn) 146 252
Loan portfolio mix (%) 0.5 0.6
Source: Company, Nirmal Bang Institutional Equities Research
97.3
1.2
0.8
0.6
0.2 2.7
Micro Credit Gold Mobiles Solar Lamp Others
(%)
Non Micro Credit

Institutional Equities
SKS Microfinance
Contribution of distribution fees to rise to 20% of profits
Currently, distribution of others’ products contributes 1.4% to its assets and 12.6% to its profits. The management has given guidance of medium-term targets of such products contributing 10% to assets and 20% to profits, which will aid improvement in profitability. We expect distribution fees to post a CAGR of 63% over FY15-FY18E.
Exhibit 31: Contribution of distribution fees likely to rise
Source: Company, Nirmal Bang Institutional Equities Research
12.9 12.6
16.718.1
20.0
0.5
1.4
2.1
3.5
5.8
0
1
2
3
4
5
6
7
0
5
10
15
20
25
FY14 FY15 FY16E FY17E FY18E
Profitability (LHS) Loan portfolio (RHS)
(%) (%)

Institutional Equities
SKS Microfinance
Operating efficiency – biggest driver of profitability
The management has been consistently focusing on improving operating efficiency. Cost-to-AUM improved from 13.8% in FY12 to 8.7% in FY15. Key reason for improvement is better utilisation of human resources. While its GLP has grown from Rs17bn in FY12 to Rs42bn in FY15, its employee base decreased from 16,194 in FY12 to 9,698 in FY15. The management has given guidance of AUM per loan officer improving gradually. We expect cost-to-AUM ratio to improve further to 7.1% in FY18E. Similarly, we expect the cost-to-income ratio to improve from 61.1% in FY15 to 49.9% in FY18E.
Exhibit 32: Cost-to-AUM ratio Exhibit 33: Cost-to-income ratio
Source: Company, Nirmal Bang Institutional Equities Research Source: Company, Nirmal Bang Institutional Equities Research
Scope for further improvement in operational efficiency
We believe operational efficiency is a function of scale. SKS Cost-to-AUM is double of industry leader, indicating scope for further improvement in operational efficiency.
Exhibit 34: Cost-to-AUM for peers
Source: Company, Mix Market, Nirmal Bang Institutional Equities Research
Operational efficiency to come from lower addition of non-loan officers
Out of its current employee strength of 9,698, loan officers responsible for loan origination and collection constitute only 54% of its employees as rest of the employees are in non-loan category.
Exhibit 35: Break-up of employees Nos FY08 FY09 FY10 FY11 FY12 FY13 FY14 FY15
Employees 6,818 12,814 21,154 22,733 16,194 10,809 8,932 9,698
- Loan officers 3,740 7,943 11,878 15,331 10,354 6,746 5,259 5,286
- Trainee assistants 1,306 774 3,011 95 8 149 281 777
- Branch management staff 1,035 2,217 3,455 3,957 3,234 2,259 2,191 2,266
- Area office managers 52 139 198 177 123 93 85 99
- Regional office staff 529 1,458 2,215 2,772 2,148 1,304 865 988
- Head office staff 156 283 397 401 327 258 251 282
Source: Company, Nirmal Bang Institutional Equities Research
11.9
13.8
12.3
8.8 8.7 8.37.6
7.1
0
2
4
6
8
10
12
14
16
FY11 FY12 FY13 FY14 FY15 FY16E FY17E FY18E
(%)
56
155
125
74
6156 53 50
0
20
40
60
80
100
120
140
160
180
FY11 FY12 FY13 FY14 FY15 FY16E FY17E FY18E
(%)
4.8
7.47.9
8.7 9.0
11.1
0
2
4
6
8
10
12
Bandhan Satin Equitas SKS Ujjivan Janalakshmi
(%)

Institutional Equities
SKS Microfinance
The management has indicated that current distribution network can support much higher AUM, and it does not like to expand its branch network in a significant way. As a result, we expect support staff other than the loan officers to increase only in a calibrated manner. The company is more likely to add loan officers to support AUM growth. Despite factoring in a 23% CAGR in loan officers over FY15-FY18E, we expect total staff growth to be lower at 16.6% as non-loan staff is expected to rise by only 8%.
Within loan officers, we expect officers in state of AP to remain stagnant, whereas we expect 26% CAGR loan officers outside AP.
Exhibit 36: Growth in loan officer staff to outpace rise in non-loan officer staff
Exhibit 37: Loan officer outside AP to grow at a higher rate
Source: Company, Nirmal Bang Institutional Equities Research Source: Company, Nirmal Bang Institutional Equities Research
Advancement in technology
Apart from improving its staff efficiency for optimising cost structure, SKS is also introducing technology for expedient reporting and re-engineering internal processes. SKS has completed all branch connectivity with daily MIS flow to the head office. This has enabled better treasury and cash management, reduced the need for maintaining high cash balance at branches, and reduced operating costs. Other technology initiatives are enabling loan officers with hand-held devices to improve productivity and mobile banking in order to make disbursements cashless. These initiatives will lead to an improvement in the client per loan officer ratio as well as a fall in cash balance in its balance sheet.
Improvement in operating efficiency is key for improvement in average AUM per loan officer, which in turn depends on the number of members serviced by the loan officer and average loan outstanding per member.
Exhibit 38: Matrix on AUM per loan officer – Non AP
(Nos.) FY12 FY13 FY14 FY15 FY16E FY17E FY18E
Members in each JLG 5 5 5 5 5 5 5
Average JLG per centre 3.2 3.6 4.1 4.7 5.2 5.6 6.1
Average member per centre 15.9 17.8 20.7 23.3 26.0 28.2 30.7
Working days of loan officer per week 5 5 5 5 5 5 5
Centres per day attended by loan officer 3.9 5.0 7.0 6.7 6.0 5.6 5.2
Centres per week attended by loan officer 19.6 24.9 34.8 33.7 30.2 27.9 25.9
Members serviced by loan officer per week 311.9 443.7 721.5 786.5 783.5 787.4 794.2
Average AUM per member (Rs) 5,205 7,766 8,682 11,434 13,099 14,358 15,593
Average AUM per loan officer (Rsmn) 1.6 3.4 6.3 9.0 10.3 11.3 12.4
Source: Company, Nirmal Bang Institutional Equities Research
0
2,000
4,000
6,000
8,000
10,000
12,000
14,000
16,000
18,000
FY11 FY12 FY13 FY14 FY15 FY16E FY17E FY18E
Loan officer staff Non-loan officer staff
(Nos.)
0
1,000
2,000
3,000
4,000
5,000
6,000
7,000
8,000
9,000
10,000
FY12 FY13 FY14 FY15 FY16E FY17E FY18E
Loan officer in AP Loan officer outside AP
(Nos.)

Institutional Equities
SKS Microfinance
GLP per branch set to rise
With a greater importance being given to increase loan officers per branch and improvement in productivity per loan officer, we expect gross loan portfolio (GLP) per branch to double over the next three years.
Exhibit 39: GLP per branch to double over next three years Exhibit 40: Lowest GLP per branch compared to peers
Source: Company, Nirmal Bang Institutional Equities Research Source: Company, MFIN, Nirmal Bang Institutional Equities Research
GLP per employee to also increase
GLP per employee increased from 1.0mn in FY12 to 4.3mn in FY15, but it remains one of the lowest among peers. We expect GLP per employee to improve to 7.4mn by FY18.
Exhibit 41: GLP per employee set to rise Exhibit 42: Lowest GLP per employee among peers
Source: Company, Nirmal Bang Institutional Equities Research Source: Company, MFIN, Nirmal Bang Institutional Equities Research
17.3
11.4
18.7
24.8
33.0
43.9
54.6
67.4
0
10
20
30
40
50
60
70
80
FY11 FY12 FY13 FY14 FY15 FY16E FY17E FY18E
(Rsmn)
33.0
47.1
59.4
77.4 80.2
162.0
0
20
40
60
80
100
120
140
160
180
SKS Bandhan Equitas Ujjivan Satin Janalakshmi
(Rsmn)
1.8
1.0
2.2
3.5
4.3
5.3
6.3
7.4
0
1
2
3
4
5
6
7
8
FY11 FY12 FY13 FY14 FY15 FY16E FY17E FY18E
(Rsmn)
4.34.6
5.56.0
7.2
8.6
0
1
2
3
4
5
6
7
8
9
10
SKS Ujjivan Equitas Janalakshmi Bandhan Satin
(Rsmn)

Institutional Equities
SKS Microfinance
Credit risk under check because of process improvement
The AP crisis was as much about loose processes as it was about politics. Investment in data capturing, KYC or know your customer technology was minimal. Loans were disbursed after collecting minimal details, most of the times not enough to distinctly identify the borrower. Pricing was hazy, and included different kinds of charges, and so the real picture is often hidden from the borrower. Technology usage was low, often leading to delays in cash management and data aggregation for the central office.
RBI is sole regulator
RBI acts as a sole regulator for microfinance lenders and it issued a separate set of directives for MFIs categorising the segment as non‐banking finance companies - microfinance institutions (NBFCs‐MFIs).
NBFCs‐MFIs are tightly regulated by the RBI, with Micro Finance Institutions Network (MFIN) acting as the SRO (self‐regulatory organisation).
The regulator has addressed the concerns of various stakeholders, which resulted in restoration of bank funding and flow of equity capital. The Central government presented the Microfinance Institutions (Development and Regulation) Bill, 2012 (MFI Bill 2012) in Parliament in May 2012. The MFI Bill 2012 provided for the development and regulation of microfinance institutions and empowering the RBI to issue directions to MFIs. The Bill was introduced in the Lok Sabha in May 2012 and was later referred to a standing committee which did not approve the draft in its present form. The standing committee suggested that the Centre must have wider consultations with state governments as well as stakeholders and arrive at a consensus on vital issues.
Exhibit 43: RBI Regulation for Microfinance
Qualification for MFIs
Microfinance loans/total assets >85%
Loan for income generating purpose * >50%
Annual income of household* <Rs100,000 for rural areas
<Rs160,000 for urban areas
Disbursement * <Rs60,000 in first cycle
<Rs100,000 in second cycle
Indebtedness of borrower * <Rs100,000
Tenure of loan >Rs15,000 >= 24 months
Margins
Margin Cap < 10% for large MFI (loans > Rs1bn)
< 12% for others
Interest rate
Rate of interest Lower of following:
a) Cost of funds + margin
b) 2.75x average base rate of five largest commercial banks
Processing charges <= 1% of loan amount
Capital adequacy
Total CRAR >= 15%
Tier I >= 7.5%
Provisioning Higher of Following
a) 1% of loan portfolio
b) 50% of overdue form 90-180 days
100% of overdue over 180 days
*Loan for income generating purpose limit increased from 70% of total loans earlier
The rest could be for other purposes such as housing repair, education, medical and other emergencies
Annual income limit recently increased from Rs60,000 for rural areas and Rs120,000 for urban areas
Total disbursement limit recently increased from Rs35,000 in first cycle and Rs50,000 in second cycle
Total Indebtedness of borrower increased from Rs50,000 earlier
Source: RBI, Nirmal Bang Institutional Equities Research

Institutional Equities
SKS Microfinance
Credit bureau checks helps in superior origination: SKS refers all its loan applications to two credit bureaus, Equifax and Highmark. The regulations prescribe referral to at least one of these bureaus. The company has been fairly successful in tracking the repayment record of its borrowers, thereby reducing credit risk in the business. This has reduced loan approval period as well. The RBI permits a maximum of two MFI loans per borrower. In the past, borrowers have overleveraged, by borrowing from several MFIs, thereby increasing their indebtedness. Most of the MFIs share data with credit bureaus on a regular basis, resulting in an effective set-up for assessing the creditworthiness of a borrower.
Improvement in transparency: Given the greater regulatory scrutiny and the imposition of margin cap at 10% and processing fee capped at 1%, cost and process control is now at the heart of MFIs’ survival and profitability. The large MFIs now follow transparent pricing, improved data capturing and complete adherence to the code of conduct while investments in technology are aimed at making operations leaner and less risky.
Strength of JLG model: JLG model has a tremendous strength of its own. As all members in the group are liable to repay any loans under the JLG model, peer pressure acts as a biggest deterrent for group members to default. The collection efficiency has been very encouraging under the JLG model. The establishment of credit
bureaus enables the lender to check the credit history of micro‐credit borrowers and understand their credit behaviour and repayment patterns. Because of joint liability, peer borrowers act as a safeguard as they let the company know in advance if the loan is intended to be used for non-income generating activity. Also, SKS lends only to women as they tend to use the funds more productively than men and also are more likely to avoid risky ventures and instead use the loans for small, manageable activities.
Non-performing assets had increased post AP government regulations on account of the rise in loan delinquency in the state.
Exhibit 44: Asset quality trend
Source: Company, Nirmal Bang Institutional Equities Research
AP loan portfolio
Having completely provided for its AP loan exposure, any improvement in the operating environment could be value accretive for SKS. It has obtained interim relief from the Supreme Court to restart lending and collection activities in this state. The apex court has relaxed some of the criteria laid down in Andhra Pradesh Microfinance Act, 2010. The company has preferred to wait for the Parliament to pass MFI Bill, 2012, so as to avoid any possible confrontation with the state government.
Exhibit 45: AP loan provision/write-off
Source: Company, Nirmal Bang Institutional Equities Research
0.2 0.3 0.32.3
30.0
16.8
10.3
0.11.0 1.2 2.3
7.1
51.0
19.4
0.9 0.40
10
20
30
40
50
60
FY08 FY09 FY10 FY11 FY12 FY13 FY14 FY15
GNPA NNPA Credit cost
(%)
1.7
10.6
2.6
0
2
4
6
8
10
12
FY11 FY12 FY13
(Rsbn)

Institutional Equities
SKS Microfinance
However, there was no contagion risk spreading to other states. Despite pruning its non-AP loan portfolio from Rs39.4bn in 2QFY11 to Rs12.3bn in 1QFY13, collection efficiency was maintained at 97% during this phase, dispelling the ever-greening myth. Out of 5.2mn non-AP borrowers who paid on time, 1.9mn of them received no incremental credit from the company.
Exhibit 46: GNPAs excluding AP exposure Exhibit 47: Collection efficiency excluding AP exposure
Source: Company, Nirmal Bang Institutional Equities Research Source: Nirmal Bang Institutional Equities Research
We have conservatively factored in higher credit cost
SKS reported GNPA of 0.1% for FY15 as it has fully written off AP loan portfolio. We have conservatively factored in GNPA to increase in a staggered manner to 1.0% in FY18E. Credit cost stood at 0.4% in FY15. We have conservatively factored in higher average credit cost of 1.1% over FY16E-FY18E, building in buffer for any likely deterioration in asset quality.
Exhibit 48: We have conservatively factored in higher credit costs
Source: Company, Nirmal Bang Institutional Equities Research
SKS follows a conservative provisioning policy
SKS follows asset classification and provisioning norms more stringent than what are prescribed by the RBI. This gives us higher confidence on its asset quality.
Exhibit 49: SKS follows very stringent norms
RBI NBFC-MFI norms SKS compliance
Asset classification
Standard assets 0-90 days 0-60 days
Sub-standard assets 91-180 days 61-180 days
Loss assets >180 days >180 days
Provisioning norms
Standard assets 1% of overall portfolio reduced by provision for NPA (If provision for NPA < 1% of overall portfolio)
0.25-1.0% depending on NPA ,or as stipulated by RBI, whichever is higher
Sub-standard assets 50% of installments overdue* 50% of outstanding principal*
Loss assets 100% of installments overdue* 100%of outstanding principal/ write-off*
* Aggregate loan provision will be maintained at a higher amount of 1% of overall portfolio or sum of provisioning for sub-standard and loss assets; Source: Company, Nirmal Bang Institutional Equities Research
1.1
0.4
0.1 0.1
0.5
0.8
1.0
0.0
0.2
0.4
0.6
0.8
1.0
1.2
FY12 FY13 FY14 FY15 FY16E FY17E FY18E
(%)
97.3
95.1
99.9 99.9 99.8
92
93
94
95
96
97
98
99
100
101
FY11 FY12 FY13 FY14 FY15
(%)
0.9
0.4
1.1 1.11.0
0.0
0.2
0.4
0.6
0.8
1.0
1.2
FY14 FY15 FY16E FY17E FY18E
(%)

Institutional Equities
SKS Microfinance
Geographical diversification
SKS has learnt its lessons from the AP crisis and has understood that geographical spread is the most effective way of managing political risk.
Exhibit 50: State-wise loan exposure break-up (%)
Source: Company, Nirmal Bang Institutional Equities Research
Tight internal concentration norms
SKS has a well-defined matrix which will guide its geographic concentration. The stated strategy is to cap state exposure to less than 15% of disbursement and 50% of net worth. Similar caps are defined for district and branch levels as well. It also stops disbursement to a branch where collection efficiency is below its tolerable limit.
Exhibit 51: Internal norms
Metric Percentage cap on disbursement Exposure cap as a percentage of net worth
State <15% (20% for Karnataka & Orissa)
50%
District <3% (4% for Karnataka & Orissa)
5% (Only 5% of total operating districts can go up to 10% of net worth)
Branch <1% (1.25% for Karnataka & Orissa)
1% (Only 5% of total operating districts can go up to 2% of net worth)
NPA No disbursement to a branch with NPAs > 1 % -
Collection efficiency
No disbursement to a branch with on-time collection efficiency of < 95%
-
Source: Company, Nirmal Bang Institutional Equities Research
Tax liability to remain low
SKS has carried forward deferred tax assets (DTA) worth Rs4.9bn at the end of FY15. It will utilise the carried forward DTA against future profits. It also wrote off its AP loan portfolio and as a result it was exempted from paying MAT. AP portfolio was fully written off in 3QFY15 and as a result it started paying MAT in 4QFY15. SKS will pay MAT till the time it exhausts carried forward loss. It will be also eligible to take the benefit of accumulated MAT credit against future profits.
Exhibit 52: Deferred tax assets
Rsbn FY15 FY16E FY17E FY18E
Opening 5.6 4.9 3.9 2.4
Used 0.7 1.0 1.5 2.2
Closing 4.9 3.9 2.4 0.2
Source: Company, Nirmal Bang Institutional Equities Research
Exhibit 53: Accumulated MAT credit
Rsbn FY15 FY16E FY17E FY18E
Opening - - 0.6 1.4
Created - 0.6 0.8 1.2
Closing - 0.6 1.4 2.6
Source: Company, Nirmal Bang Institutional Equities Research
16.8
15.2
11.6
11.210.9
8.7
5.8
5.3
4.8
4.11.8 1.51.2 1.2
Orissa Karnataka Maharashtra Bihar West Bengal
Uttar Pradesh Kerala Madhya Pradesh Rajasthan Jharkhand
Punjab Haryana Chattisgarh Uttaranchal

Institutional Equities
SKS Microfinance
Adequately capitalised
SKS has been able to raise equity capital in a timely manner. Even without utilising the forbearance given by the RBI for its AP loan portfolio, its capital adequacy ratio has always been higher than the minimum regulatory requirement of 15%.
Exhibit 54: Healthy capital adequacy ratio
Source: Company, Nirmal Bang Institutional Equities Research
Entry barriers to further benefit existing players
Spread capped at 10%: As the spread is capped at 10%, it is crucial for microfinance players to contain their operating expenses in order to enjoy decent RoA. Microfinance is a manpower-intensive business involving cash disbursement and collection, and frequent interaction with customers. Given the higher operating expenses involved in loan origination and collection, larger and established companies have an advantage over new entrants, given their operating scale.
Not more than two MFIs can lend to the same borrower: Players intending to enter unrepresented geographies will find it tough to get ample borrowers if new territories are dominated by two or more strong players. As a result large players like SKS with a strong presence across states with a reasonable vintage branches will significantly benefit over smaller players
Exhibit 55: Branch distribution
States Branches Vintage (years)
Karnataka 170 7.3
Orissa 147 6.9
West Bengal 135 6.4
Bihar 121 6.7
Maharashtra 118 6.8
Uttar Pradesh 114 6
Madhya Pradesh 67 6.8
Rajasthan 59 6.6
Kerala 48 5
Jharkhand 41 6.3
Chattisgarh 21 6.7
Punjab 18 5.6
Haryana 16 5.9
Uttaranchal 11 5
Himachal Pradesh 3 0.3
Gujarat 1 7.2
Delhi 1 5.7
Total – Non-AP 1,091 6.6
Source: Company, Nirmal Bang Institutional Equities Research
38.5 38.5
28.6
44.9
34.4
20.7 20.7
31.7
26.924.3 22.9
0
5
10
15
20
25
30
35
40
45
50
FY08 FY09 FY10 FY11 FY12 FY13 FY14 FY15 FY16E FY17E FY18E
Tier II Tier I
(%)

Institutional Equities
SKS Microfinance
Favourable regulatory changes
RBI has recently increased disbursement and intentness limit, which indicates the regulator is comfortable with the rise in ticket size.
Exhibit 56: Increase in disbursement cap by RBI
(Rs) Earlier Now
Disbursement cap in first cycle 35,000 60,000
Disbursement cap in second cycle 50,000 1,00,000
Indebtedness of borrower 50,000 1,00,000
Annual Income of rural household 60,000 1,00,000
Annual Income of urban household 1,20,000 1,60,000
Loan for income generating purpose 70% 50%
Source: Company, Nirmal Bang Institutional Equities Research
Micro Units Development and Refinance Agency (MUDRA) Bank
The government proposes to set up MUDRA Bank through a statutory enactment. This bank will be responsible for regulating and refinancing all MFIs which are in the business of lending to micro/small business entities engaged in manufacturing, trading and service activities. The bank will partner with state level/regional level coordinators to provide finance to last mile financer of small/micro business enterprises.
A sum of Rs200bn will be allocated to MUDRA Bank from the money available from shortfalls under PSL for creating a refinance fund to provide refinance to last mile financers. Another Rs30bn will be provided to MUDRA Bank from the Union budget to create a credit guarantee corpus for guaranteeing loans being provided to micro enterprises.
The above measures will not only help in increasing the access to finance for the unbanked, but also bring down the cost of finance from last mile financers to micro/small enterprises, most of which are in the informal sector.
Small bank licence
After the final guidelines released by the RBI for small-finance banks, SKS is one of the applicants for getting a licence for small-finance bank. Given the regulatory requirement that a minimum of 75% of loans disbursed of a total small bank’s loan portfolio must be priority sector loans, we believe SKS is the ideal candidate for a small bank licence as 100% of its portfolio complies for priority sector. SKS will benefit in various ways. It can leverage its network and raise deposits, thereby lowering its funding costs and also enable the company to diversify its funding structure. It will also help the company in mitigating political risk by eliminating state government intervention.

Institutional Equities
SKS Microfinance
DuPont analysis – operating efficiency to boost RoA to more than 5%
Despite factoring in higher provisioning and increase in tax, we expect improvement in RoA and RoE over next the next three years, mainly on the back of improvement in operating efficiency.
Exhibit 57: DuPont analysis
(%) FY09 FY10 FY11 FY12 FY13 FY14 FY15E FY16E FY17E FY18E
Interest income 21.8 21.3 24.6 11.9 10.5 15.7 15.7 15.3 15.9 16.1
Income on loan securitisation 2.3 2.9 2.8 1.2 2.8 2.2 1.9 1.8 1.7 1.6
Other interest Income 0.8 0.8 0.4 0.7 1.2 1.0 1.2 1.2 1.0 0.8
Interest expenses 9.4 8.1 8.3 6.7 6.8 8.6 7.8 7.5 7.3 7.3
Net interest income 15.6 16.8 19.5 7.2 7.6 10.4 11.1 10.8 11.2 11.3
Loan origination fees 0.0 0.0 0.0 0.3 1.1 1.3 1.3 1.2 1.2 1.2
Other income 1.9 2.1 2.5 1.6 1.3 1.5 2.2 2.0 2.2 2.5
Net revenue 17.4 18.9 22.0 9.1 10.0 13.2 14.6 14.1 14.6 15.0
Operating expenses 10.8 9.9 12.2 14.1 12.5 9.8 8.9 7.9 7.7 7.5
-Employee expenses 6.6 6.1 7.8 8.7 8.2 6.6 6.4 5.9 5.9 5.9
-Other expenses 4.2 3.8 4.5 5.4 4.3 3.2 2.5 2.0 1.8 1.6
Operating profit 6.7 9.0 9.7 (5.0) (2.5) 3.4 5.7 6.2 6.9 7.5
Provisions 0.6 1.5 5.6 39.1 11.7 0.6 0.3 0.7 0.8 0.8
PBT 6.0 7.6 4.1 (44.1) (14.2) 2.8 5.4 5.5 6.1 6.7
Tax 2.1 2.6 1.4 1.2 0.0 0.0 0.2 1.1 1.3 1.4
RoA 3.9 4.9 2.7 (45.3) (14.2) 2.8 5.2 4.3 4.9 5.3
Leverage 4.7 4.4 3.1 2.7 5.1 5.9 4.8 4.6 4.8 4.9
RoE 18.4 21.5 8.2 (123.1) (72.4) 16.5 24.9 20.0 23.4 26.3
Source: Company, Nirmal Bang Institutional Equities Research

Institutional Equities
SKS Microfinance
Management team
Mr. M. R. Rao, managing director (MD) and chief executive officer (CEO)
Mr.Rao has been MD & CEO since October 2010. He joined SKS in October 2006 and has been at the forefront, driving its rural distribution reach and scale-up. He was a part of the management team responsibe for combating the AP crisis and insulating non-AP operations from the contagion risk. His expertise lies in managing operations in a large business environment, formulating business strategies and identifying new markets. An alumni of BITS Pilani, he has over 25 years of experience in profit centre management, setting up distribution facilities in insurance, retail banking and consumer finance. Prior to SKS, he was associated with ING Vysya Life Insurance, American Express, Standard Chartered Bank and Esanda Finanz & Leasing.
Mr. Dilli Raj, president
Mr.Raj joined SKS in January 2008 and introduced mainstream financial products in microfinance. He prepared SKS for its initial public offer by strengthening the financial system and by automating accounting and cash management processes. He had a strategic role in SKS turnaround and managing the AP crisis by focusing on cash flow management, cost structure optimisation and gaining the confidence of credit grantors. He lead managed SKS’ qualified institutional placements or QIPs in July 2012 and May 2014. He has 23 years of experience in corporate finance, treasury, policy advocacy and corporate tax planning. He has consummated joint venture deals with global giants. He has done his Masters in Business Administration from the Central University of Pondicherry.
Capital structure
Exhibit 58: Key shareholders Exhibit 59: Shareholding (%)
Promoter (%)
Kismet Microfinance 4.5
Westbridge Ventures II LLC 2.8
Kumaon Investment Holdings 2.0
Non-promoter
Morgan Stanley Asia 5.5
IDFC MF 5.1
Sandstone 4.6
Amansa 4.0
Vinod Khosla 3.4
Route One 4.7
Kismet SKS I 2.4
Government Pension Fund 2.2
Tree Line 3.1
Amundi 1.7
Max Life 1.6
DSP Blackrock 2.7
GMO 1.4
TVF Funds 1.3
SIDBI 1.3
Driehaus 1.3
CIMB 1.2
Shivanand Shankar 1.0
NV Scrif Mauritius 1.0
Source: Company, Nirmal Bang Institutional Equities Research Source: Company, Nirmal Bang Institutional Equities Research
9.3
14.4
7.0
8.7
8.24.7
43.9
3.3 0.5
Foreign Promoter Domestic MF/FI Domestic Corporates
Domestic Individuals Foreign Corporates NRI
FII FPI Others

Institutional Equities
SKS Microfinance
Key Risks
Political risk
The biggest risk to microfinance business is political risk, as it happened in AP. We have not factored in such a black swan event as things have changed significantly after regulations by the RBI, internal process improvement/credit bureau check has bringing in credit discipline and geographical diversification of loan portfolio.
Employee attrition
Microfinance is a manpower-intensive business. Its current attrition rate of ~30% can raise concerns regarding effective training and monitoring of employees as well as ensuring quality delivery. At one point in time, SKS successfully managed over 25,000 employees, which gives us confidence that the management can manage employee-related problems.
Change in regulations
Microfinance business operates under stringent regulations of the RBI, and if changed can pose a risk. Also SKS enjoys PSL status, which if changed, can be a risk

Institutional Equities
SKS Microfinance
Financials
Exhibit 60: Income statement
Y/E March (Rsmn) FY13 FY14 FY15 FY16E FY17E FY18E
Interest income 2,200 3,930 5,662 8,348 11,343 15,160
Income on loan securitisation 583 557 670 1,003 1,219 1,550
Other Interest 244 255 440 645 710 781
Interest expenses 1,427 2,142 2,791 4,103 5,254 6,826
Net interest income 1,600 2,600 3,981 5,894 8,018 10,665
Loan origination fees 230 338 463 659 838 1,138
Other Income 269 369 795 1,108 1,586 2,332
Net revenue 2,099 3,307 5,239 7,661 10,442 14,135
Operating expenses 2,626 2,462 3,203 4,305 5,503 7,058
-Employee expenses 1,727 1,655 2,318 3,199 4,230 5,595
-Other expenses 899 807 885 1,106 1,272 1,463
Operating profit (527) 845 2,036 3,356 4,939 7,077
Provisions 2,444 146 100 381 548 737
PBT (2,971) 699 1,936 2,975 4,392 6,340
Tax - - 59 624 920 1,329
PAT (2,971) 699 1,877 2,352 3,471 5,011
Source: Company, Nirmal Bang Institutional Equities Research
Exhibit 62: Balance sheet
Y/E March (Rsmn) FY13 FY14 FY15 FY16E FY17E FY18E
Share capital 1,082 1,082 1,263 1,263 1,263 1,263
Reserves & surplus 2,822 3,510 9,202 11,811 15,282 20,293
Networth 3,904 4,592 10,465 13,074 16,545 21,556
Borrowings 16,181 15,312 32,800 44,598 59,425 79,853
Other liability & provisions 5,029 5,068 3,722 4,348 5,102 5,769
Total liabilities 25,114 24,972 46,987 62,020 81,072 107,179
Fixed assets 113 112 102 92 83 74
Investments 2 2 2 2 2 2
Loans 15,642 17,528 29,584 42,897 60,056 84,078
Cash 8,606 6,397 15,368 16,905 18,595 20,455
Other assets 751 933 1,931 2,124 2,337 2,570
Total assets 25,114 24,972 46,987 62,020 81,072 107,179
Source: Company, Nirmal Bang Institutional Equities Research
Exhibit 61: Key ratios
Y/E March (Rsmn) FY13 FY14 FY15 FY16E FY17E FY18E
Growth (%)
Net interest income (25.6) 62.5 53.1 48.1 36.0 33.0
Operating profit (64.9) (260.3) 140.9 64.8 47.2 43.3
Profit after tax (78.2) (123.5) 168.5 25.3 47.6 44.4
Business (%)
Advance growth 64.7 12.1 68.8 45.0 40.0 40.0
Gross loan growth (incl. securitisation)
41.3 32.0 34.4 46.2 37.0 35.7
Spreads (%)
Yield on BS loans 17.5 23.7 24.0 23.0 22.0 21.0
Cost of borrowings 10.8 13.6 11.6 10.6 10.1 9.8
Spread 6.7 10.1 12.4 12.4 11.9 11.2
Spread (incl. inc on securitisation) 11.3 13.5 15.3 15.2 14.3 13.4
NIM 9.3 10.8 11.6 11.3 11.6 11.6
Operational efficiency (%)
Cost to Income 125.1 74.4 61.1 56.2 52.7 49.9
Cost to assets 12.5 9.8 8.9 7.9 7.7 7.5
Cost to AUM 12.3 8.8 8.7 8.3 7.6 7.1
Productivity (Rsmn)
Gross portfolio per branch 18.7 24.8 33.0 43.9 54.6 67.4
Profit per branch (2.4) 0.6 1.5 1.7 2.3 3.0
Gross portfolio per employee 2.2 3.5 4.3 5.3 6.3 7.4
Profit per employee (0.3) 0.1 0.2 0.2 0.3 0.3
CRAR (%)
Tier I 20.7 20.7 31.7 26.9 24.3 22.9
Tier II - - - - - -
Total 20.7 20.7 31.7 26.9 24.3 22.9
Asset quality (%)
Gross NPAs 16.8 10.3 0.1 0.5 0.8 1.0
Gross NPAs (excl. AP) 0.4 0.1 0.1 0.5 0.8 1.0
Net NPAs 0.4 0.1 0.0 0.1 0.1 0.1
Provision coverage 98.1 99.2 45.8 80.0 87.5 90.0
Credit costs 19.4 0.9 0.4 1.1 1.1 1.0
Return ratios (%)
RoE (72.4) 16.5 24.9 20.0 23.4 26.3
RoA (14.2) 2.8 5.2 4.3 4.9 5.3
Per share (%)
EPS (27.5) 6.5 14.9 18.6 27.5 39.7
BV 36.1 42.4 82.9 103.5 131.0 170.7
ABV 35.6 42.3 82.8 103.2 130.5 170.0
ABV (Including DTA) - 93.9 121.9 138.6 160.6 192.3
Valuation (x)
P/E (16.6) 70.4 30.6 24.4 16.6 11.5
P/BV 12.6 10.7 5.5 4.4 3.5 2.7
P/ABV 12.8 10.8 5.5 4.4 3.5 2.7
P/ABV (After considering DTA) - 4.8 3.7 3.3 2.8 2.4
Source: Company, Nirmal Bang Institutional Equities Research

Institutional Equities
SKS Microfinance
Microfinance Sector
Huge demand -supply gap
A major portion of India’s poor population has no access to banking channels on account of lack of documentation. As a result, demand for microfinance remains strong. As per 2011 World Bank statistics, 23.6% of the country’s population earns less than US$1.25 a day, whereas 59.2% of the population earns less than US$2 a day. Mean household size is 4.8 members per household (based on 2005-06 National Family Health Survey) translating into ~150mn household below the poverty line which are necessarily demand generators for microfinance. Assuming average credit requirement is Rs15,000-Rs20,000 per household , it translates into overall potential industry size of Rs2.25trn-3.00trn.
Exhibit 63: Poverty trend (% of population)
Source: 2011 World Bank statistics, Nirmal Bang Institutional Equities Research
MFIs to gain market share
In India, microcredit is provided by two types of institutions - one is by bank-sponsored self-help groups (SHGs) and other is through microfinance institutions (MFIs). The SHG bank-linkage model has reached out to around 97mn households through 7.4mn SHGs with gross loan outstanding of Rs430bn. Microcredit services provided by MFIs in a tailor-made fashion reached out to 33mn individuals with an outstanding loan portfolio of Rs335bn.
Exhibit 64: Break-up of microfinance credit
Source: NABARD, Sa-Dhan, Nirmal Bang Institutional Equities Research
However, the demand-supply gap remains huge. On the one hand, it requires an enabling and supportive policy and regulatory environment. On the other hand, the MFI industry has to be responsive, responsible, sustainable and scalable.
23.6
59.2
73.8
91.2
99.6
0
10
20
30
40
50
60
70
80
90
100
$1.25 $2.00 $2.50 $4.00 $5.00
(%)
21.5
25.8
34.0
39.5 40.8
36.5 36.2
40.7
0
5
10
15
20
25
30
35
40
45
0
50
100
150
200
250
300
350
400
450
500
FY07 FY08 FY09 FY10 FY11 FY12 FY13 FY14
SHG MFI MFI market share (RHS)
(%) (%)

Institutional Equities
SKS Microfinance
MFIs have grown very rapidly at a 59% CAGR over FY07-FY11, whereas SHGs managed only a 26% CAGR. As a result, MFIs’ market share in microcredit went up from 22% in FY07 to 41% in FY11. Operating environment deteriorated for MFIs post AP government’s ordinance impacting loan origination and collection efficiency. Some of the large MFI players in AP viz. Spandana, Share, BSFL and Asmita had to restructure their debt with banks. SKS was the only large player which was able to service its debt on time without any need for corporate debt restructuring or CDR.
After the AP crisis, the Reserve Bank of India or RBI set up Malegam Committee to probe the activities and impact of MFIs across the country and to make recommendations regarding improvement in their functioning. After the Malegam Committee submitted its report in January 2011, the RBI issued a set of guidelines to cover the operations of non-banking financial companies or NBFCs functioning as microfinance institutions or MFIs in March 2012. These guidelines created a new category of NBFCs called NBFCs-MFIs and specified that all NBFCs undertaking microfinance business, having capitalisation of Rs50mn and having over 85% or more of their exposure in ’qualifying assets’ (microfinance portfolio) should apply for an NBFC-MFI licence accordingly.
Operating environment for MFIs stabilised after the RBI’s measures and as a result MFIs again outpaced SHGs in FY14 and regained their 41% market share.
MFIs are well diversified
Growth in SHGs is mainly dependent on South India as 74% of the outstanding loan book is from this region, whereas MFIs are well diversified and not excessively exposed to a particular region.
Exhibit 65: Geographical spread of MFIs and SHGs
Source: Sa-dhan, MFIN, Nirmal Bang Institutional Equity
MFI business is well diversified and spread across various states, which reduces the risk of loss in case of any political intervention.
Exhibit 66: MFIs – State-wise exposure (%)
Source: MFIN, Nirmal Bang Institutional Equities Research
3128
2318
74
12 104
0
10
20
30
40
50
60
70
80
South East West North
MFI SHG
(%)
15.4
14.6
11.2
9.98.7
7.0
6.4
5.3
4.9
4.5
3.22.2
1.41.4
1.2 1.1 1.10.30.2
West Bengal Tamilnadu Karnataka Maharashtra Uttar Pradesh
Bihar Madhya Pradesh Assam Odhisa Kerala
Gujarat Rajasthan Jharkhand Chattisgarh Haryana
Uttarakhand Delhi Pondicherry Andhra Pradesh

Institutional Equities
SKS Microfinance
We expect MFIs’ JLG model to continue to gain market share over SHG model, as with regulatory risk being taken care of, access to debt as well as equity funding for MFIs have improved significantly. Also, the GNPAs of non-AP MFI portfolio at less than 1% is far superior to SHGs’ GNPAs of 6.8%.
Exhibit 67: GNPAs of SHGs Exhibit 68: MFI PAR 30 days (excluding AP)
Source: Sa-dhan, Nirmal Bang Institutional Equites Research Source: MFIN, Nirmal Bang Institutional Equities Research
Exhibit 69: MFI PAR 90 days (excluding AP) Exhibit 70: MFI PAR 180 days (excluding AP)
Source: MFIN, Nirmal Bang Institutional Equites Research Source: MFIN, Nirmal Bang Institutional Equities Research
Consolidation phase is behind
Branches were brought down by 21% in FY13 from their peak in FY11. Similarly, the number of employees was brought down by 31% during the same period. Post FY13, branches have increased 19% and employee count was increased by 35%. Considering the fact that the sector’s dynamics have stabilised post regulations issued by the RBI, we feel the consolidation phase is behind.
Exhibit 71: Growth in branch network Exhibit 72: Employee count
Source: MFIN, Nirmal Bang Institutional Equities Research Source: MFIN, Nirmal Bang Institutional Equities Research
2.9
4.7
6.1
7.16.8
0
1
2
3
4
5
6
7
8
FY10 FY11 FY12 FY13 FY14
(%)
2.3
0.5
0.3 0.3
0.0
0.5
1.0
1.5
2.0
2.5
FY12 FY13 FY14 FY15
(%)
2.2
0.4
0.2 0.2
0.0
0.5
1.0
1.5
2.0
2.5
FY12 FY13 FY14 FY15
(%)
2.0
0.4
0.1 0.1
0.0
0.5
1.0
1.5
2.0
2.5
FY12 FY13 FY14 FY15
(%)
8,508
11,276
9,380 8,848
9,741 10,553
0
2,000
4,000
6,000
8,000
10,000
12,000
FY10 FY11 FY12 FY13 FY14 FY15
(Nos.)
73,566
85,894
68,252
59,240
66,959
80,097
0
10,000
20,000
30,000
40,000
50,000
60,000
70,000
80,000
90,000
100,000
FY10 FY11 FY12 FY13 FY14 FY15
(Nos.)

Institutional Equities
SKS Microfinance
A similar trend was witnessed in the number of clients being serviced by MFI players.
Exhibit 73: Client growth trend
Source: MFIN, Nirmal Bang Institutional Equities Research
Credit growth momentum picks up again
Growth in loan portfolio fluctuated YoY and touched its lowest level in 2012 owing to AP crisis and consequent drop in commercial funding to MFIs. In 2013, however, the reverse trend started. This upward growth was maintained in 2014 as well, thanks to resumption of bank funding to MFIs.
Exhibit 74: Growth in AUM
Source: MFIN, Nirmal Bang Institutional Equity Research
Domination by top 10 players
Although there are ~50 players in the MFI space, yet top 10 players control 78.5% of total market share. SKS is the second-largest player after Bandhan.
Exhibit 75: Market share (%)
Source: MFIN, Nirmal Bang Institutional Equities Research
22.3
27.6
20.719.4
23.7
30.5
0
5
10
15
20
25
30
35
FY10 FY11 FY12 FY13 FY14 FY15
(mn)
72.0
97.0
56.0
19.0
(7.0)
4.0
43.0
61.0
(20)
0
20
40
60
80
100
120
FY08 FY09 FY10 FY11 FY12 FY13 FY14 9MFY14
(%)
0.0 5.0 10.0 15.0 20.0 25.0
ESAF
Spandana
GFSPL
Muthoot
Satin
Equitas
Ujjivan
Janalakshmi
SKS
Bandhan
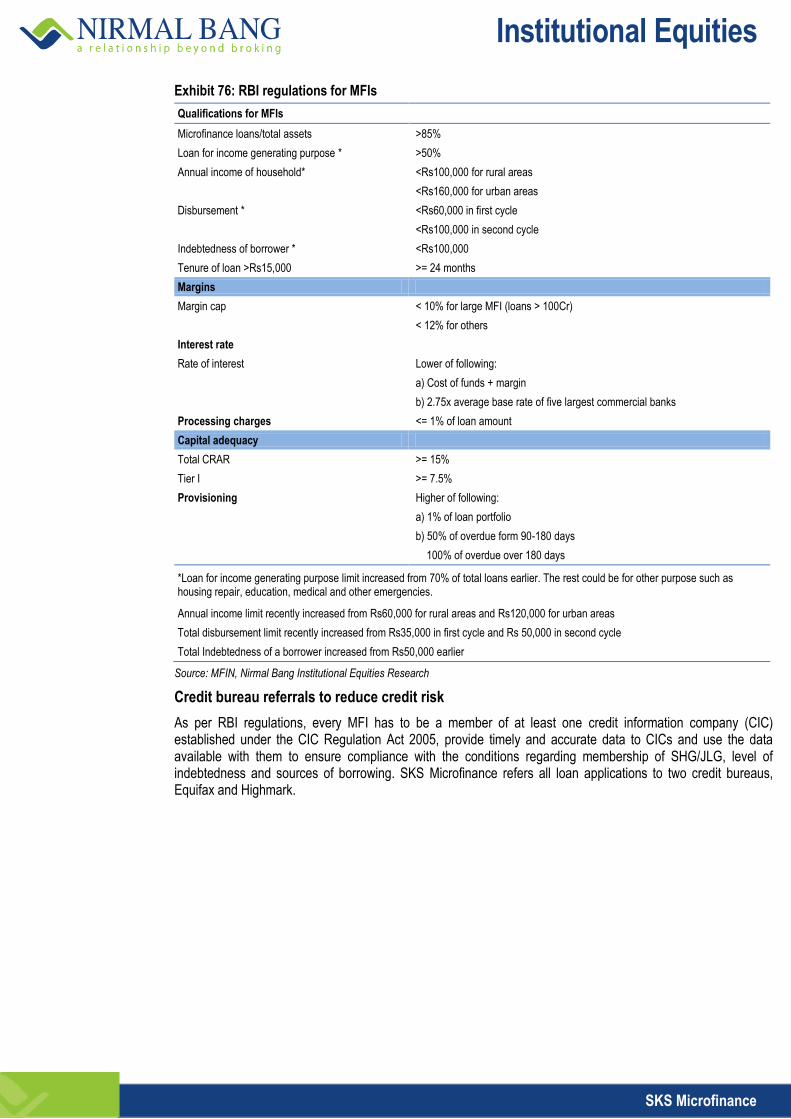
Institutional Equities
SKS Microfinance
Exhibit 76: RBI regulations for MFIs
Qualifications for MFIs
Microfinance loans/total assets >85%
Loan for income generating purpose * >50%
Annual income of household* <Rs100,000 for rural areas
<Rs160,000 for urban areas
Disbursement * <Rs60,000 in first cycle
<Rs100,000 in second cycle
Indebtedness of borrower * <Rs100,000
Tenure of loan >Rs15,000 >= 24 months
Margins
Margin cap < 10% for large MFI (loans > 100Cr)
< 12% for others
Interest rate
Rate of interest Lower of following:
a) Cost of funds + margin
b) 2.75x average base rate of five largest commercial banks
Processing charges <= 1% of loan amount
Capital adequacy
Total CRAR >= 15%
Tier I >= 7.5%
Provisioning Higher of following:
a) 1% of loan portfolio
b) 50% of overdue form 90-180 days
100% of overdue over 180 days
*Loan for income generating purpose limit increased from 70% of total loans earlier. The rest could be for other purpose such as housing repair, education, medical and other emergencies.
Annual income limit recently increased from Rs60,000 for rural areas and Rs120,000 for urban areas
Total disbursement limit recently increased from Rs35,000 in first cycle and Rs 50,000 in second cycle
Total Indebtedness of a borrower increased from Rs50,000 earlier
Source: MFIN, Nirmal Bang Institutional Equities Research
Credit bureau referrals to reduce credit risk
As per RBI regulations, every MFI has to be a member of at least one credit information company (CIC) established under the CIC Regulation Act 2005, provide timely and accurate data to CICs and use the data available with them to ensure compliance with the conditions regarding membership of SHG/JLG, level of indebtedness and sources of borrowing. SKS Microfinance refers all loan applications to two credit bureaus, Equifax and Highmark.

Institutional Equities
SKS Microfinance
Exhibit 77: Player-wise data
Market Outst loan Disbursement Disbursement Outreach GLP per GLP per Client per Client per
GLP Share per client FY15 per client States Branches Employees Clients branch employee branch employee
Rsmn (%) (Rs) Rsmn (Rs)
mn Rsmn Rsmn
1 Bandhan 95,296 23.7 14,598 149,885 21,886 22 2022 13,231 6.5 47.1 7.2 3,228 493
2 SKS 41,712 10.4 11,434 69,808 12,259 19 1135 8,724 3.6 36.8 4.8 3,214 418
3 Janalakshmi 37,736 9.4 16,098 41,210 20,682 17 233 6,257 2.3 162.0 6.0 10,061 375
4 Ujjivan 32,741 8.2 14,908 43,284 19,918 24 423 7,089 2.2 77.4 4.6 5,192 310
5 Equitas 21,440 5.3 9,342 21,290 14,116 7 361 3,925 2.3 59.4 5.5 6,357 585
6 Satin 21,407 5.3 17,950 23,669 22,418 11 267 2,496 1.2 80.2 8.6 4,467 478
7 Muthoot 15,047 3.7 15,308 18,947 19,189 9 302 2,971 1.0 49.8 5.1 3,255 331
8 GFSPL 14,471 3.6 16,941 18,939 6,660 5 238 2,658 0.9 60.8 5.4 3,589 321
9 Spandana 11,726 2.9 10,618 19,823 17,501 11 763 3,322 1.1 15.4 3.5 1,447 332
10 ESAF 10,161 2.5 17,924 11,707 13,884 9 224 2,190 0.6 45.4 4.6 2,531 259
11 Grama Vidyal 10,145 2.5 11,718 16,989 11,029 4 270 2,400 0.9 37.6 4.2 3,207 361
12 L&T Finance 9,087 2.3 10,691 11,661 14,089 8 276 1,658 0.8 32.9 5.5 3,080 513
13 Utkarsh 7,281 1.8 11,970 8,989 16,972 8 240 1,752 0.6 30.3 4.2 2,534 347
14 Share 6,433 1.6 9,046 9,911 15,848 17 756 3,334 0.7 8.5 1.9 941 213
15 Sonata 5,951 1.5 14,626 7,017 20,065 6 209 1,325 0.4 28.5 4.5 1,947 307
16 Suryoday 5,810 1.4 11,929 6,485 17,588 7 145 1,353 0.5 40.1 4.3 3,359 360
17 FFSL 4,255 1.1 15,597 4,389 22,868 6 211 673 0.3 20.2 6.3 1,293 405
18 SVCL 4,229 1.1 12,671 6,315 18,028 7 123 961 0.3 34.4 4.4 2,713 347
19 Annapurna 3,981 1.0 11,865 4,955 16,670 6 116 895 0.3 34.3 4.4 2,892 375
20 Arohan 3,839 1.0 11,906 5,140 16,824 4 104 873 0.3 36.9 4.4 3,100 369
21 Madura 3,696 0.9 11,637 3,658 14,660 3 221 1,131 0.3 16.7 3.3 1,437 281
22 Asirvad 3,424 0.9 12,333 3,869 11,876 5 141 553 0.3 24.3 6.2 1,969 502
23 BSS 3,273 0.8 18,041 3,326 16,716 2 69 495 0.2 47.4 6.6 2,629 367
24 Asmitha 3,128 0.8 9,578 5,512 15,680 12 414 1,614 0.3 7.6 1.9 789 202
25 Fusion 2,948 0.7 13,354 3,264 20,111 5 62 594 0.2 47.5 5.0 3,561 372
26 RGVN 2,290 0.6 10,106 3,087 15,980 5 104 560 0.2 22.0 4.1 2,179 405
27 Belstar 2,038 0.5 11,462 2,263 15,796 5 68 491 0.2 30.0 4.2 2,615 362
28 Disha 2,148 0.5 11,238 2,265 20,605 6 99 449 0.2 21.7 4.8 1,931 426
29 BSFL 1,957 0.5 6,999 948 16,761 15 126 1,070 0.3 15.5 1.8 2,219 261
30 Smile 1,337 0.3 5,957 2,208 12,399 2 101 680 0.2 13.2 2.0 2,222 330
31 Saija 1,222 0.3 11,194 1,649 16,403 2 27 305 0.1 45.3 4.0 4,043 358
32 VFS 1,106 0.3 8,016 1,551 12,871 3 106 557 0.1 10.4 2.0 1,302 248
33 Margdarshak 1,042 0.3 12,600 673 14,685 3 52 252 0.1 20.0 4.1 1,590 328
34 Chaitanya 997 0.2 14,254 1,459 18,632 1 47 414 0.1 21.2 2.4 1,488 169
35 Jagaran 883 0.2 8,109 1,478 12,571 3 60 308 0.1 14.7 2.9 1,815 354
36 Sahayog 747 0.2 11,106 831 16,792 4 71 413 0.1 10.5 1.8 947 163
37 Pahal 737 0.2 9,881 1,070 16,211 1 39 223 0.1 18.9 3.3 1,913 334
38 Namra 663 0.2 8,015 1,120 13,937 2 39 213 0.1 17.0 3.1 2,121 388
39 M Power 639 0.2 13,162 755 18,332 3 21 184 0.0 30.4 3.5 2,312 264
40 ASA 594 0.1 6,267 1,060 11,412 5 104 397 0.1 5.7 1.5 911 239
41 Samasta 579 0.1 12,497 719 14,088 2 26 191 0.0 22.3 3.0 1,782 243
42 Varam 561 0.1 18,473 630 22,094 2 10 62 0.0 56.1 9.0 3,037 490
43 Navachetna 519 0.1 12,552 760 17,027 2 9 142 0.0 57.7 3.7 4,594 291
44 Adhikar 511 0.1 12,822 414 8,913 2 41 102 0.0 12.5 5.0 972 391
45 Sambandh 490 0.1 13,981 374 16,947 3 8 116 0.0 61.3 4.2 4,381 302
46 Svasti 448 0.1 12,959 445 20,373 1 11 158 0.0 40.7 2.8 3,143 219
47 Svatantra 319 0.1 9,694 422 13,233 2 16 147 0.0 19.9 2.2 2,057 224
48 Shikhar 304 0.1 9,697 354 16,264 4 16 116 0.0 19.0 2.6 1,959 270
49 Nirantara 85 0.0 17,000 118 23,598 1 4 24 0.0 21.3 3.5 1,250 208
50 Agora 83 0.0 10,208 107 15,258 1 6 49 0.0 13.8 1.7 1,355 166
Total 401,516 100 13,160 546,802 17,921
10,536 80,097 30.5 38.1 5.0 2,896 381
Source: MFIN, Nirmal Bang Institutional Equities Research

Institutional Equities
SKS Microfinance
Exhibit 78: State-wise data
Outstanding
loan Disbursement Disbursement
GLP per GLP per Client per Client per
No of
MFI GLP % of per client FY15 per client Branches Employees Clients branch employee branch employee
Rsmn Total (Rs) Rsmn (Rs)
mn Rsmn Rsmn
1 West Bengal 13 60190 15.4 13,142 92,310 19,344 1,362 9,453 4.6 44.2 6.4 3,363 485
2 Tamilnadu 19 57,000 14.6 11,728 69,410 15,075 1,281 11,002 4.9 44.5 5.2 3,794 442
3 Karnataka 21 43,700 11.2 14,864 57,150 12,045 1,040 9,936 2.9 42.0 4.4 2,827 296
4 Maharashtra 27 38,720 9.9 12,821 50,470 14,928 960 8,186 3.0 40.3 4.7 3,146 369
5 Uttar Pradesh 17 33,910 8.7 14,188 42,300 17,570 820 6,413 2.4 41.4 5.3 2,915 373
6 Bihar 19 27,230 7.0 12,784 41,150 17,285 723 5,045 2.1 37.7 5.4 2,946 422
7 Madhya Pradesh 27 24,910 6.4 12,034 33,490 16,516 817 5,531 2.1 30.5 4.5 2,534 374
8 Assam 7 20,870 5.3 15,692 28,740 21,983 419 2,814 1.3 49.8 7.4 3,174 473
9 Odhisa 14 19,300 4.9 11,557 27,520 14,234 575 3,866 1.7 33.6 5.0 2,904 432
10 Kerala 8 17,650 4.5 17,304 21,390 16,387 295 2,912 1.0 59.8 6.1 3,458 350
11 Gujarat 19 12,420 3.2 11,500 15,790 18,238 426 3,015 1.1 29.2 4.1 2,535 358
12 Rajasthan 14 8,620 2.2 12,493 11,950 17,204 263 2,035 0.7 32.8 4.2 2,624 339
13 Jharkhand 14 5,660 1.4 11,098 8,830 15,148 197 1,415 0.5 28.7 4.0 2,589 360
14 Chattisgarh 14 5,440 1.4 11,574 7,690 16,141 237 1,486 0.5 23.0 3.7 1,983 316
15 Haryana 12 4,550 1.2 14,677 5,920 17,917 111 1,061 0.3 41.0 4.3 2,793 292
16 Uttarakhand 12 4,390 1.1 14,633 5,670 18,491 98 688 0.3 44.8 6.4 3,061 436
17 Delhi 10 4,240 1.1 16,308 5,090 22,510 65 1,347 0.3 65.2 3.1 4,000 193
18 Pondicherry 9 1,130 0.3 12,556 1,420 15,694 18 176 0.1 62.8 6.4 5,000 511
19 Andhra Pradesh 6 860 0.2 7,167 2,220 16,767 753 3,015 0.1 1.1 0.3 159 40
Source: MFIN, Nirmal Bang Institutional Equities Research

Institutional Equities
SKS Microfinance
Exhibit 79: Financial summary of few large peers
Bandhan
FY07 FY08 FY09 FY10 FY11 FY12 FY13 FY14
GLP (Rs mn) 1,307 3,310 6,381 14,951 25,073 37,302 44,209 61,070
Growth % - 153.3 92.8 134.3 67.7 48.8 18.5 38.1
PAT (Rsmn) 84 143 266 736 1176 1881 2085 2835
Growth % - 70.2 86.0 176.7 59.8 59.9 10.8 36.0
Active clients (mn) 0.5 0.9 1.5 2.3 3.3 3.6 4.4 5.4
Growth % - 100.0 61.1 58.6 41.3 11.4 22.4 22.1
Cost-to-AUM 9.0 10.2 8.7 5.5 6.2 5.8 4.5 4.8
RoA % 9.0 5.0 8.5 3.6 5.4 6.3 4.8 5.1
RoE % 130.8 61.3 125.3 39.1 41.6 36.6 26.9 28.9
PAR > 30 days 0.1 0.1 0.1 0.1 0.6 0.2 0.2 0.1
PAR > 90 days 0.1 0.1 0.1 0.1 0.4 0.1 0.1 0.1
Janalakshmi
FY09 FY10 FY11 FY12 FY13 FY14
GLP (Rsmn) - - 306 670 1,812 3,507 9,608 20,529
Growth % - - - 119.0 170.4 93.5 174.0 113.7
PAT (Rs mn) - - (54) (23) (22) 12 181 506
Growth % - - - NA NA NA 1,408 180
Active clients (mn) - - 0.0 0.1 0.2 0.3 0.7 1.4
Growth % - - - 90.7 131.7 57.9 133.3 101.4
Cost-to-AUM - - - 25.0 28.8 18.2 12.5 11.1
RoA % - - - (3.1) 1.4 0.4 2.0 3.0
RoE % - - - (9.0) (4.9) 1.5 8.7 13.4
PAR > 30 days - - - 0.6 1.6 1.0 0.2 0.6
PAR > 90 days - - - 0.4 1.2 0.9 0.1 0.3
Ujjivan
FY07 FY08 FY09 FY10 FY11 FY12 FY13 FY14
GLP (Rsmn) 84 366 1,690 3,708 6,251 7,034 11,260 16,173
Growth % - 335.7 361.7 119.4 68.6 12.5 60.1 43.6
PAT (RsmMn) (15) (30) (7) 96 114 17 339 550
Growth % NA NA NA NA 18.8 (85.1) 1,894.1 62.2
Active clients (mn) 0.0 0.1 0.3 0.6 0.9 0.8 1.0 1.3
Growth % - 205.3 348.3 119.2 49.1 (3.5) 22.0 30.0
Cost-to-AUM 59.3 30.5 22.0 19.2 16.8 14.4 11.3 9.0
RoA % (21.4) (11.3) (0.6) 3.2 2.1 0.2 3.4 3.6
RoE % (50.5) (46.5) (1.2) 9.4 10.3 1.1 11.9 15.9
PAR > 30 days 0.2 0.2 0.2 0.5 1.0 1.2 0.2 0.1
PAR > 90 days - 0.1 0.1 0.3 0.5 1.1 0.1 0.1
Equitas
FY08 FY09 FY10 FY11 FY12 FY13 FY14
GLP (Rsmn) - 167 2,880 6,052 7,938 7,240 11,347 15,030
Growth % - - 1,624.6 110.1 31.2 (8.8) 56.7 32.5
PAT (Rsmn) - (20) 22 229 304 182 275 565
Growth % - - NA 940.9 32.8 (40.1) 51.1 105.5
Active clients (mn) - 0.0 0.3 0.9 1.3 1.2 1.3 1.8
Growth % - - 2,025.0 161.8 46.1 (8.5) 12.6 35.8
Cost-to-AUM - - 11.2 8.2 10.5 11.5 9.3 7.9
RoA % - - 1.4 4.6 3.7 2.2 2.8 3.7
RoE % - - 3.7 12.6 11.0 8.0 12.7 19.8
PAR > 30 days - - 0.0 0.1 0.5 1.0 0.0 0.1
PAR > 90 days - - - 0.0 0.2 0.9 0.0 0.1

Institutional Equities
SKS Microfinance
Satin Creditcare
FY07 FY08 FY09 FY10 FY11 FY12 FY13 FY14
GLP (Rsmn) 262 397 760 1,278 2,296 3,201 5,800 10,561
Growth % - 51.5 91.4 68.2 79.7 39.4 81.2 82.1
PAT (Rsmn) 2 5 7 29 23 14 40 156
Growth % - 150.0 40.0 314.3 (20.7) (39.1) 185.7 290.0
Active clients (mn) 0.0 0.0 0.1 0.2 0.3 0.3 0.5 0.8
Growth % - 53.8 180.0 203.6 47.1 24.0 58.1 63.3
Cost-to-AUM 16.1 15.7 13.4 14.5 13.6 10.8 8.3 7.4
RoA % 0.8 1.0 0.9 1.8 0.9 0.5 0.8 1.7
RoE % 4.6 4.9 4.8 13.1 4.9 1.8 4.3 11.9
PAR > 30 days - 10.9 6.0 2.5 1.4 0.9 0.8 0.4
PAR > 90 days - 1.8 1.4 1.3 0.9 0.4 0.3 0.0
Spandana Sphoorty
FY07 FY08 FY09 FY10 FY11 FY12 FY13 FY14
GLP (Rsmn) 3,916 7,313 18,683 35,405 34,581 27,152 22,232 21,072
Growth % - 86.7 155.5 89.5 (2.3) (21.5) (18.1) (5.2)
PAT (Rsmn) 28 271 903 2,035 (92) (2,698) (11,757) 643
Growth % - 867.9 233.2 125.4 NA NA NA NA
Active clients (mn) 0.9 1.2 2.4 3.7 4.2 3.4 2.4 2.2
Growth % - 29.3 104.2 50.6 14.5 (17.9) (30.8) (5.9)
Cost-to-AUM 6.2 5.6 6.0 5.4 6.2 6.4 4.5 8.6
RoA % 0.7 4.2 6.7 9.0 (0.3) (9.6) (47.5) 3.3
RoE % 21.8 53.0 49.2 56.0 (1.9) (40.9) (1,120.5) (35.7)
PAR > 30 days 8.2 4.4 0.1 0.1 47.8 52.5 61.5 57.4
PAR > 90 days 7.6 4.4 0.0 - 44.7 52.3 61.5 57.4
Grameen Koota
FY07 FY08 FY09 FY10 FY11 FY12 FY13 FY14
GLP (Rsmn) 460 826 1,813 3,302 2,505 3,812 5,239 8,195
Growth % - 79.6 119.5 82.1 (24.1) 52.2 37.4 56.4
PAT (Rsmn) 35 20 5 9 35 (29) 85 185
Growth % - (42.9) (75.0) 80.0 288.9 (182.9) (393.1) 117.6
Active clients (mn) 0.1 0.1 0.2 0.4 0.3 0.3 0.4 0.5
Growth % - 46.3 75.0 66.7 (8.6) (3.1) 12.9 42.9
Cost-to-AUM 14.3 17.1 12.1 9.6 13.4 13.7 8.9 7.8
RoA % 5.7 2.1 0.2 0.4 1.0 (1.0) 2.2 2.7
RoE % 72.3 15.5 1.2 2.6 6.5 (5.9) 12.7 13.5
PAR > 30 days - - 0.1 1.5 1.4 1.2 0.9 0.0
PAR > 90 days - - 0.0 1.5 0.8 1.2 0.9 0.0

Institutional Equities
Disclaimer
Stock Ratings Absolute Returns
BUY > 15%
ACCUMULATE -5% to15%
SELL < -5%
This report is published by Nirmal Bang’s Institutional Equities Research desk. Nirmal Bang has other business units with independent research teams separated by Chinese walls, and therefore may, at times, have different or contrary views on stocks and markets. This report is for the personal information of the authorised recipient and is not for public distribution. This should not be reproduced or redistributed to any other person or in any form. This report is for the general information for the clients of Nirmal Bang Equities Pvt. Ltd., a division of Nirmal Bang, and should not be construed as an offer or solicitation of an offer to buy/sell any securities.
We have exercised due diligence in checking the correctness and authenticity of the information contained herein, so far as it relates to current and historical information, but do not guarantee its accuracy or completeness. The opinions expressed are our current opinions as of the date appearing in the material and may be subject to change from time to time without notice.
Nirmal Bang or any persons connected with it do not accept any liability arising from the use of this document or the information contained therein. The recipients of this material should rely on their own judgment and take their own professional advice before acting on this information. Nirmal Bang or any of its connected persons including its directors or subsidiaries or associates or employees or agents shall not be in any way responsible for any loss or damage that may arise to any person/s from any inadvertent error in the information contained, views and opinions expressed in this publication.
Nirmal Bang Equities Private Limited (hereinafter referred to as “NBEPL”) is a registered Member of National Stock Exchange of India Limited, Bombay Stock Exchange Limited. NBEPL is in the process of making an application with SEBI for registering as a Research Entity in terms of SEBI (Research Analyst) Regulations, 2014.
NBEPL or its associates including its relatives/analyst do not hold any financial interest/beneficial ownership of more than 1% in the company covered by Analyst.
NBEPL or its associates/analyst has not received any compensation from the company covered by Analyst during the past twelve months. NBEPL /analyst has not served as an officer, director or employee of company covered by Analyst and has not been engaged in market-making activity of the company covered by Analyst.
The views expressed are based solely on information available publicly and believed to be true. Investors are advised to independently evaluate the market conditions/risks involved before making any investment decision.
Access all our reports on Bloomberg, Thomson Reuters and Factset.
Team Details:
Name Email Id Direct Line
Rahul Arora CEO [email protected] -
Girish Pai Head of Research [email protected] +91 22 3926 8017 / 18
Dealing
Ravi Jagtiani Dealing Desk [email protected] +91 22 3926 8230, +91 22 6636 8833
Pradeep Kasat Dealing Desk [email protected] +91 22 3926 8100/8101, +91 22 6636 8831
Michael Pillai Dealing Desk [email protected] +91 22 3926 8102/8103, +91 22 6636 8830
Umesh Bharadia Dealing Desk [email protected] +91-22-39268226
Nirmal Bang Equities Pvt. Ltd.
Correspondence Address
B-2, 301/302, Marathon Innova,
Nr. Peninsula Corporate Park,
Lower Parel (W), Mumbai-400013.
Board No. : 91 22 3926 8000/1; Fax. : 022 3926 8010