Institutional and personnel capabilities for fiscal ...
24
Institutional and personnel capabilities for fiscal decentralisation in Benin
Transcript of Institutional and personnel capabilities for fiscal ...
Institutional and personnel capabilities for fiscal
decentralisation in Benin

I. Background and challenges of the fiscal decentralisation reform
II. Methodology
III. Institutional capabilities
IV. Personnel capabilities
V. Reform ecosystem
VI. Discussion of key results on capabilities for fiscal
decentralisation
Conclusion
CONTENTS
2
I. Context and challenges of the fiscal decentralisation reform (1/2)
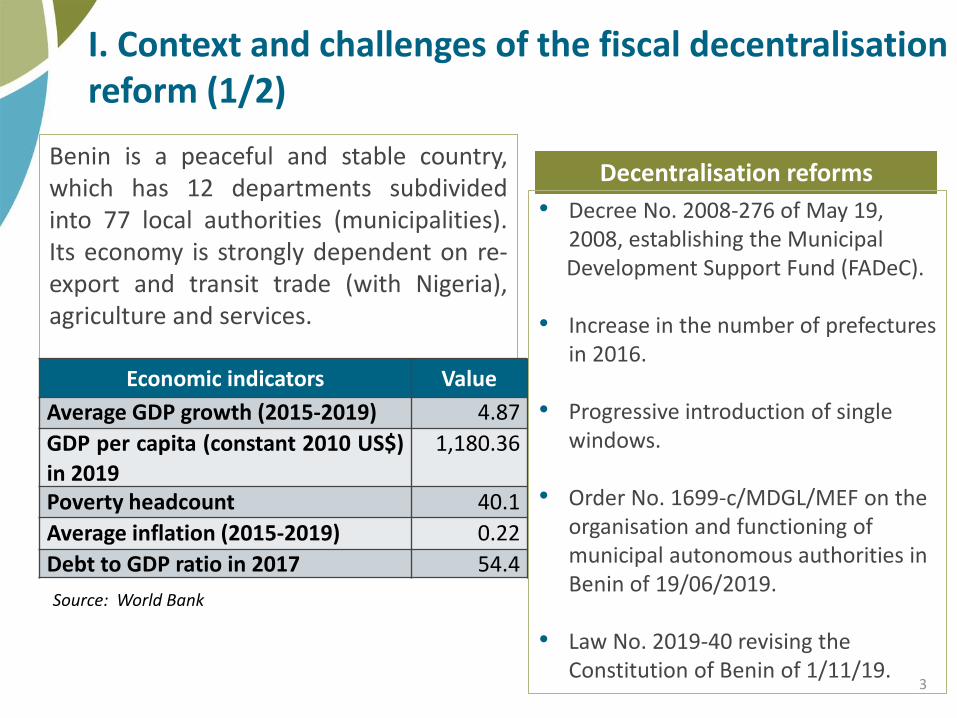
Benin is a peaceful and stable country,which has 12 departments subdividedinto 77 local authorities (municipalities).Its economy is strongly dependent on re-export and transit trade (with Nigeria),agriculture and services.
Economic indicators Value
Average GDP growth (2015-2019) 4.87
GDP per capita (constant 2010 US$)
in 2019
1,180.36
Poverty headcount 40.1
Average inflation (2015-2019) 0.22
Debt to GDP ratio in 2017 54.4
Source: World Bank
Decentralisation reforms
• Decree No. 2008-276 of May 19, 2008, establishing the Municipal Development Support Fund (FADeC).
• Increase in the number of prefectures in 2016.
• Progressive introduction of single windows.
• Order No. 1699-c/MDGL/MEF on the organisation and functioning of municipal autonomous authorities in Benin of 19/06/2019.
• Law No. 2019-40 revising the Constitution of Benin of 1/11/19.
3
I. Context and challenges of the fiscal decentralisation reform (2/2)
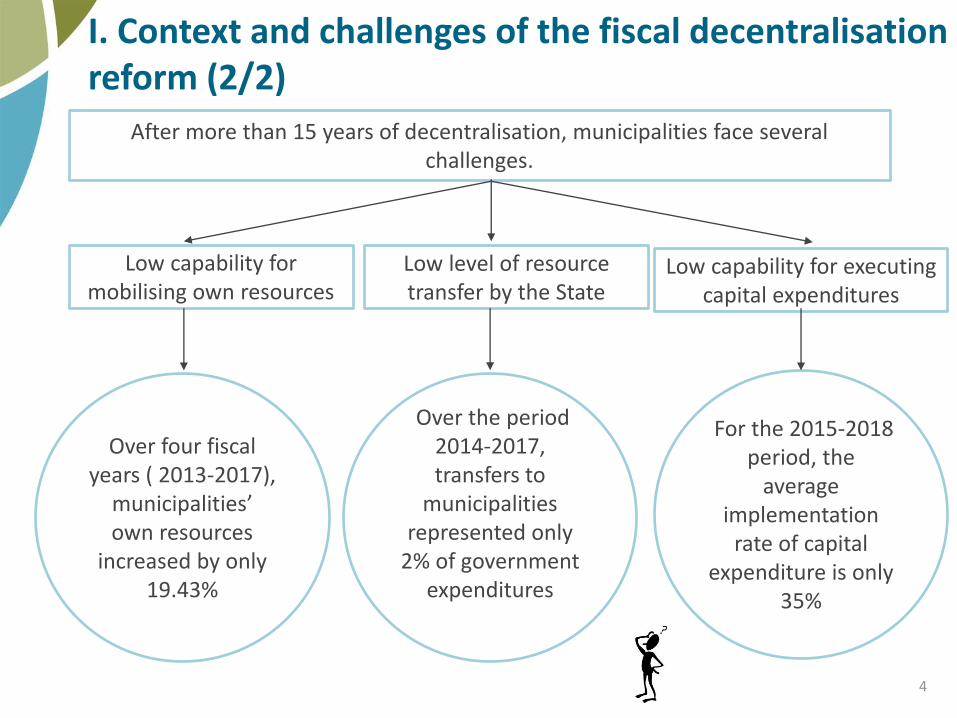
After more than 15 years of decentralisation, municipalities face several challenges.
Low capability for mobilising own resources
Low level of resource transfer by the State
Over four fiscal years ( 2013-2017),
municipalities’ own resources
increased by only 19.43%
Over the period 2014-2017, transfers to
municipalities represented only
2% of government expenditures
Low capability for executing capital expenditures
For the 2015-2018 period, the
average implementation
rate of capital expenditure is only
35%
4

II. Methodology
The data-collection work conducted for this report proceeded in four stages:
1. Scoping: The scoping exercise started with consultations with a team of budget
officials participating in an action-learning programme organized by CABRI with the
specific objective of improving revenue mobilisation.
2. Field work: A quantitative collection was conducted with 229 officials involved in the
public finance management chain at the level of three ministries (MEF, MAEP, MDGL) and
9 municipalities. It was supplemented by in-depth qualitative interviews with 17
municipalities, Conafil, CSOs ... The representative sample takes into account
intermediate and subordinate levels within each directorate.
3. Desk research: The primary data is supplemented by a desk research establishing the
context of the skills review from a variety of relevant publications such as FADEC audit
reports, municipality administrative accounts, including other assessment documents
(such as PEFA).
4. Validation: The main findings of the evaluation were triangulated and validated by a
workshop of stakeholders (including respondents to key informant interviews) before
writing the final report.5

II. Institutional capabilities (1/6)
Revenue forecasting and mobilisation
0
0,1
0,2
0,3
0,4
0,5
0,6
0,7
0,8
2017 2018
Table: Changes in revenue implementation rate• The average rate of revenue execution is low and volatile. It stands at 55.6% for 2017 and 53.7% for 2018.
• Capability to generate revenue is closely linked to the level of development and the fiscal potential of the municipality.
• Municipalities lack evidence-based strategies to develop and transform the informal sector to eventually tap its revenue potential.
• Municipalities in Benin have limited discretion to set the marginal rate on a few tax types.
Source: Compiled by the authors/CONAFIL
6

II. Institutional capabilities (2/6)
Expenditure planning
Delays in project execution as a major risk
factor having significant budgetimplications.
• Weaknesses in the financial andtechnical capacities of contractors.
• Adverse weather conditions.
Integrating risks into budget planning
• Feasibility studies.
• Environmental risk assessments.
ProspectsChallenges
Annual planning at the municipal level is anchored in the Communal Development
Plan (PDC). A number of obstacles prevent normal expenditure planning:
• Lack of own resources;
• Delays in release of information and FADeC funds;
• Poor project planning and politicisation.
7
II. Institutional capabilities (3/6)
Budget execution and efficiency
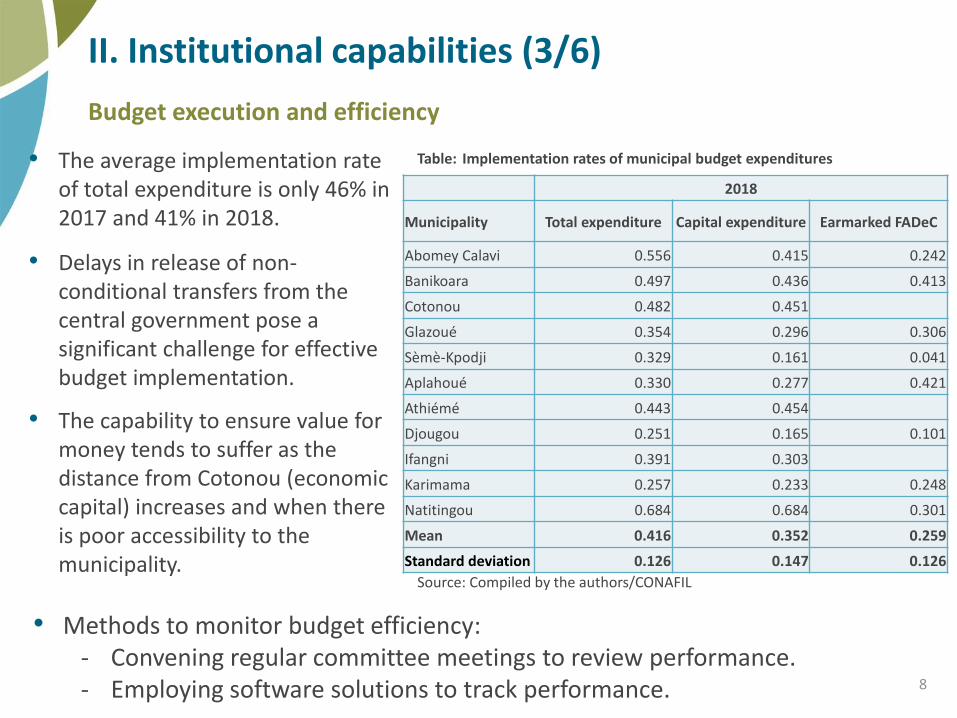
Table: Implementation rates of municipal budget expenditures• The average implementation rate of total expenditure is only 46% in 2017 and 41% in 2018.
• Delays in release of non-conditional transfers from the central government pose a significant challenge for effective budget implementation.
• The capability to ensure value for money tends to suffer as the distance from Cotonou (economic capital) increases and when there is poor accessibility to the municipality.
• Methods to monitor budget efficiency:- Convening regular committee meetings to review performance.- Employing software solutions to track performance.
Source: Compiled by the authors/CONAFIL
2018
Municipality Total expenditure Capital expenditure Earmarked FADeC
Abomey Calavi 0.556 0.415 0.242
Banikoara 0.497 0.436 0.413
Cotonou 0.482 0.451
Glazoué 0.354 0.296 0.306
Sèmè-Kpodji 0.329 0.161 0.041
Aplahoué 0.330 0.277 0.421
Athiémé 0.443 0.454
Djougou 0.251 0.165 0.101
Ifangni 0.391 0.303
Karimama 0.257 0.233 0.248
Natitingou 0.684 0.684 0.301
Mean 0.416 0.352 0.259
Standard deviation 0.126 0.147 0.126
8
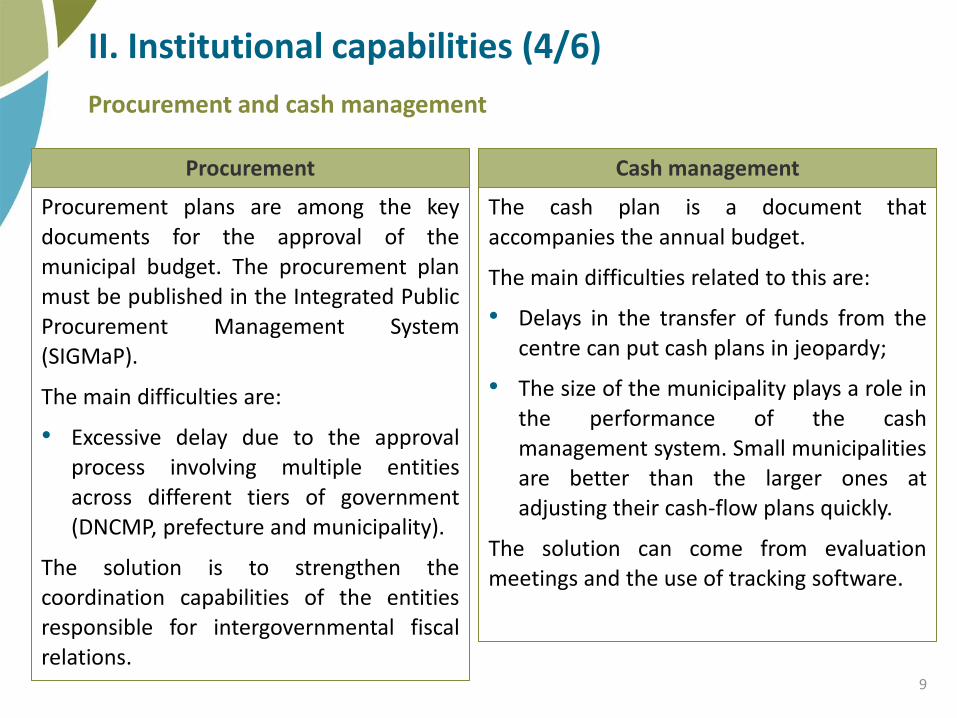
II. Institutional capabilities (4/6)
Procurement and cash management
Procurement plans are among the key
documents for the approval of themunicipal budget. The procurement planmust be published in the Integrated PublicProcurement Management System(SIGMaP).
The main difficulties are:
• Excessive delay due to the approvalprocess involving multiple entities
across different tiers of government(DNCMP, prefecture and municipality).
The solution is to strengthen thecoordination capabilities of the entitiesresponsible for intergovernmental fiscalrelations.
The cash plan is a document that
accompanies the annual budget.
The main difficulties related to this are:
• Delays in the transfer of funds from the
centre can put cash plans in jeopardy;
• The size of the municipality plays a role in
the performance of the cashmanagement system. Small municipalitiesare better than the larger ones atadjusting their cash-flow plans quickly.
The solution can come from evaluationmeetings and the use of tracking software.
Cash managementProcurement
9

II. Institutional capabilities (5/6)
Accountability mechanisms
Accountability mechanism
Directorate General of Treasury and Public Accounting (GDTPA)
• Examination of the management accounts of the municipalities.
• No control over financial management.
Annual FADeC audits • Principal means of
ensuring accountability at the local level.
• Improving the performance of municipalities.
Role of CSOs• Informed observers.• Encouraging citizen
participation in the budget process.
10

II. Institutional capabilities (6/6)
Intergovernmental fiscal relations
Prefectures
Administrative supervision of
the municipalities; serve as
intermediaries between the
central and local governments
Deconcentrated services
Coordinating state policies
Tax administrationKey role coordinating fiscal policy
The most important challenge related to
boundary delimitation appears to be that some
municipalities have a narrow tax base.
11
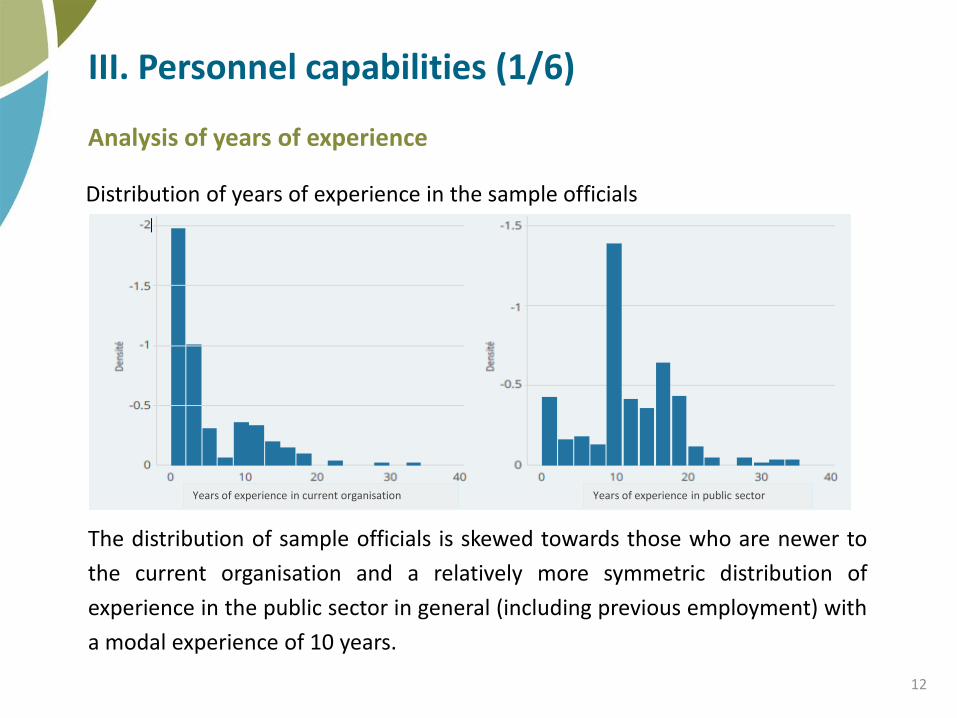
III. Personnel capabilities (1/6)
Analysis of years of experience
Distribution of years of experience in the sample officials
The distribution of sample officials is skewed towards those who are newer to
the current organisation and a relatively more symmetric distribution of
experience in the public sector in general (including previous employment) with
a modal experience of 10 years.
12
Years of experience in current organisation Years of experience in public sector

III. Personnel capabilities (2/6)
Personnel capabilities indicators
Personnel capabilities are
defined as a combination of
motivation, competencies and
resources. The table opposite
shows provides a classification
of the indicators with respect
to the three dimensions of
personnel capabilities.
Dimension Indicator used in this report
Motivation
• Perception of level of motivation of
colleagues• Main reason for joining public
service• Reward and growth opportunities • Staff turnover
Competencies • Skills mismatch in unit
Resources• Mentoring
• On-the-job training opportunities
13

III. Personnel capabilities (3/6)
Personnel motivation
Personnel motivation is a key element in improving capabilities. Most
officials feel that their colleagues are not sufficiently motivated. The
majority feel they have very good professional opportunities.14
Staff in unit motivated or highly motivated
Main reason for joining public sector: only available opportunity
Main reason for joining public sector: sector-specific training
High or very high professional growth opportunity
Good performance rarely recognised
No standard process for promotion
Central government Local government

III. Personnel capabilities (4/6)
Potential turnover reasons and destinations
Over 47% of respondents said that lack of personal satisfaction would be
the reason for leaving. NGOs and international organisations appear to be
the most popular, particularly among central government officials.15
Potential destination: start own business
Potential destination: NGOs or international organisations
Turnover reason: lack of personal satisfaction
Turnover reason: low salary
Central government Local government
III. Personnel capabilities (5/6)
Skills mismatch
Skills mismatch could significantly hamper performance.
• Most officials at the central level believed their unit’s performance has been
negatively affected by not having the right people in the right positions.
• The problem is more severe in local government institutions, where almost 70
percent of officials reported that skills mismatch has hampered performance.
Human resources capabilities of municipalities are constrained by the hiring
freeze instituted by the central government. This level of mismatch could
have far-reaching consequences, particularly because the level of perceived
motivation is also worryingly low, and there is often no mechanism for perfect
monitoring of employees in such positions.
16

III. Personnel capabilities (6/6)
Length of time worked with supervisors and horizontal colleagues
Mentoring is a key part of building human capital for new and younger officials.Central government institutions seem to offer greater opportunity for mentoringthan local government institutions. However, the frequent turnover/reshuffling ofmanagers (mentors) hinder the learning process in the long term. 17
Central governmentLocal government
Average number of months worked with immediate boss
Average number of months worked with horizontal colleague
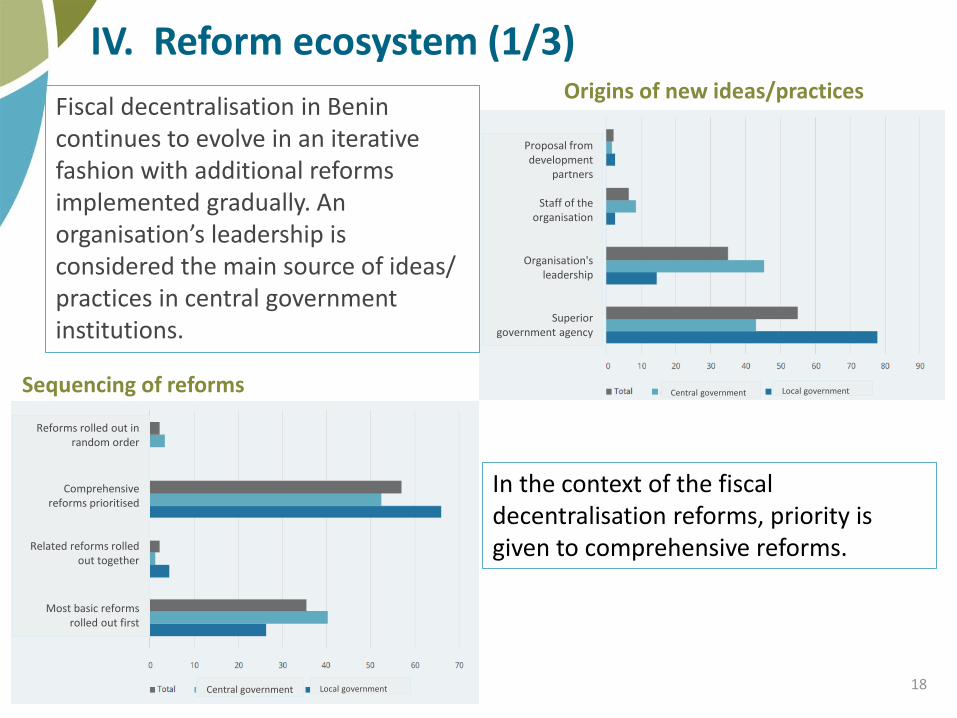
IV. Reform ecosystem (1/3)
Fiscal decentralisation in Benin continues to evolve in an iterative fashion with additional reforms implemented gradually. An organisation’s leadership is considered the main source of ideas/ practices in central government institutions.
Origins of new ideas/practices
Sequencing of reforms
In the context of the fiscal decentralisation reforms, priority is given to comprehensive reforms.
18
Proposal from development
partners
Staff of the organisation
Organisation's leadership
Superior government agency
Central government
Central government Local government
Local government
Reforms rolled out in random order
Comprehensive reforms prioritised
Related reforms rolled out together
Most basic reforms rolled out first

IV. Reform ecosystem (2/3)
Institutional relationship between the structures involved in the reform process
• Local government units rarely implement reforms on their own, as
collaborative planning and sensitisation take the biggest share.
• On the other hand, central government units either engage others at the
planning stage or plan and implement reforms on their own.
Main drivers of improved performanceMain success factors
• Insightful leadership at the
central government level.
• Application of best
practices at the local level.
There has been a greater
improvement in performance
at the local level than at the
central level.
19
Insightful leadership
Experimentation
Mutual learning between teams
Application of best practices
Central government Local government

IV. Reform ecosystem (3/3)
Means to transfer past reform lessons
Given the broad scope of public finance responsibilities at the local level relative to
existing internal capacities, it is important that external personnel be called upon
to fill in gaps, particularly in municipalities.
Official documentationis the most commonmechanism to transferlessons learned frompast reforms andprojects.
Involvement of external consultants in day-to-day activities and reform initiatives
20
Official documentation
Leaders and reformchampions
Structured diffusionplatforms
Lesson not oftentransferred
1st most popular 2nd most popular

V. Discussion of key results on capabilities for fiscal decentralisation (1/2)
Weaknesses:
• Struggle to mobilise local revenues and efficiently implement the municipal budget;
• High level of skills mismatch at the local government level.
Strengths: • Use of specialised technologies to
increase personnel capabilities in a bid
to improve efficiency.
Prospects:• Strengthening the contracting
relationship between municipalities and
(independent) tax collectors.
Regulatory capabilitiesDelivery capabilities
Weakness:
• Lack of regulatory measures between municipalities and independent tax collectors as well as other service providers in a context of information asymmetry.
Strengths: • There are robust capabilities for ex-ante
control supplemented with relevant technologies to streamline the process;
• Effectiveness of ex-post external control. Capabilities built in central government institutions have been instrumental in ensuring accountability at the local level.
21

V. Discussion of key results on capabilities for fiscal decentralisation (2/2)
Weakness:
• Lack of robust institutional mechanisms for vertical and horizontal coordination capabilities.
Strength:
• CONAFIL plays a key role in coordinating the efforts of the Government and the TFPs in the implementation of PFM reforms.
Analytical capabilitiesCoordinative capabilities
Weakness:
• Unevenly distribution of analytical capabilities across municipalities.
Strength: • Technical support from the central
government to compensate for the gaps in analytical capabilities of local governments.
Prospects:
• Foster home-grown analytical capabilities to reduce municipalities' reliance on consultants and seconded personnel at the central government level.
22

Conclusion
As one of the trickiest aspects of decentralisation, fiscal decentralisation often
requires a series of well-synchronised capabilities at various tiers of government
for local service delivery to run smoothly and efficiently.
The main findings of the review point to weaknesses in delivery capabilities at
the local level that may have been caused by a combination of personnel
problems and co-ordination failures in the intergovernmental fiscal relations
system. However, the central government plays a critical role in compensating
for overall gaps and potential disparities in analytical and regulatory capabilities
at the municipality level.
When it comes to the reform ecosystem, there is fertile ground for
implementing effective reforms and fostering organisational learning, provided
that key weaknesses in human resources capabilities are addressed.
23

Thank you for your kind attention!
24