INSTITUTION nr% - ERIC · sequentially or independently. Chapter 1, "Participant Self-Assessment,"...
134
ED 313 457 AUTHOR TITLE INSTITUTION SPONS AGENCY PUB DATE NOTE PUB TYPE EDRS PRICE DESCRIPTORS IDENTIFIERS ABSTRACT DOCUMENT RESUME UD 026 084 Cunningham, Claire; And Others Equity Training for State Education Agency Staff. Council of Chief State School Officers, Washington, nr% Wo"en's Educational Equity Act Program (ED), Washington, D.C. 86 135p. Guides Classroom Use Guides (For Teachers tu72) MFO1 Plus Postage. PC Not Available from EDRS. Administrator Guides; *Civil Rights Legislation; Elementary Secondary Education; *Equal Education; Federal Legislation; *Multicultural Education; *Sex Bias; *Sex Discrimination; Staff Development; *State Departments of Education; Womens Education Bilingual Education Act 1984; Carl D Perkins Vocational Education Act 1984; Civil Rights Act 1964 Title IV; Civil Rights Act 1964 Title VI; Education Consolidation Improvement Act Chapter 1; Education for All Handicapped Children Act; Rehabilitation Act 1973 (Section 504); Title IX Education Amendments 19,2; Womens Educational Equity Act A training manucl for state education agency (SEA) staff dealing with issues of sex bias and discrimination in the educational system is presented. The manual it designed to achieve the following primary objectives: (1) provide a status report on federal And qtAte rnlec In prnmnt,no educational equity; (2) provide an overview of inequities based on -ace, seX, national origin, and disability that exist in the educational system; and (3) encourage staff to work cooperatively in integrating equity concerns into SEA programs and activities. While portions of the manual can I>, adpted for use at the local level, the information and strategies are designed to promote coordination among SEA staff. Materials are organized into seven self-contained chapters which can be presented sequentially or independently. Chapter 1, "Participant Self-Assessment," is esigned to assess awareness of equity issues and knowledge of equity-related laws and research and comprises a self-assessment worksheet and answer sheet. Chapter 2, "The Federal and State Roles in Promoting Educational Equity," comprises the following sections: (1) "The Federal Role"; (2) "'Grove City College v. Bell''; (3) "The State Role"; and (4) "Equity Action at the State Level--A Worksneet." Chapter 3, "Equity-Related Laws at the Federal Level," comprises the following sections: (1) "Title IX of the Education Amendments of 1972"; (-I) "Title VI of the Civil Rights Act of 1964"; (3) "The Education of All Handicapped Children Act of 1975"; (4) "Section 504 of the Rehabilitation Act of 1973"; (5) "Title IV of the Civil Rights Act of 1964"; (6) "w)men's Educational Equity Act of 1984"; (7) "The Carl D. Perkins Vocational Education Act"; (8) "Bilingual Education Act of 1984"; (9) "Chapter 1 of the Education Consolidation and Improvement Act"; (10) "Summary of Federal Equity-Related Laws"; and (11) "Applying the Law--A Worksheet." Chapter 4, "Persistent Inequities," comprises the following sections: (1) "Introduction"; (2) "Social and Economic Inequities Facing Women"; (3) "Discrimination and Inequities in Elementary and Secondary Schools"; and (4) "Persistent Inequitie---Small Group Activity." Chapter 5, "Integrating Equity Concerns: A Collaborative Approach," comprises the following sections: (1) "Increasing Collaboration among Equity Staff"; (2) "Integrating Equity Concerns into SEA Activities"; (3) "Assessing Collaboration among Equity Staff--A Worksheet"; (4) "Identifying Equity Needs of SEA Staff--A Worksheet"; and (5) "A Checklist To Assess the Extent to Which Equity Concerns Have Been Integrated into SEA Activities--A Worksheet." Chapter 6 describes next steps for SEA equt-y staff and Chapter 7 provides materials on evaluation and feedback. The participant activities which accompany each chapter can be adapted for either large- or small-group meetings. Statistical data are included on nine tables and one graph. (FMW)
Transcript of INSTITUTION nr% - ERIC · sequentially or independently. Chapter 1, "Participant Self-Assessment,"...
ED 313 457
AUTHOR
TITLE
INSTITUTION
SPONS AGENCY
PUB DATE
NOTEPUB TYPE
EDRS PRICEDESCRIPTORS
IDENTIFIERS
ABSTRACT
DOCUMENT RESUME
UD 026 084
Cunningham, Claire; And OthersEquity Training for State Education Agency Staff.Council of Chief State School Officers, Washington,nr%Wo"en's Educational Equity Act Program (ED),Washington, D.C.86
135p.
Guides Classroom Use Guides (For Teachers tu72)
MFO1 Plus Postage. PC Not Available from EDRS.Administrator Guides; *Civil Rights Legislation;Elementary Secondary Education; *Equal Education;Federal Legislation; *Multicultural Education; *SexBias; *Sex Discrimination; Staff Development; *StateDepartments of Education; Womens Education
Bilingual Education Act 1984; Carl D PerkinsVocational Education Act 1984; Civil Rights Act 1964Title IV; Civil Rights Act 1964 Title VI; EducationConsolidation Improvement Act Chapter 1; Educationfor All Handicapped Children Act; Rehabilitation Act1973 (Section 504); Title IX Education Amendments19,2; Womens Educational Equity Act
A training manucl for state education agency (SEA)staff dealing with issues of sex bias and discrimination in theeducational system is presented. The manual it designed to achievethe following primary objectives: (1) provide a status report onfederal And qtAte rnlec In prnmnt,no educational equity; (2) provide
an overview of inequities based on -ace, seX, national origin, anddisability that exist in the educational system; and (3) encouragestaff to work cooperatively in integrating equity concerns into SEAprograms and activities. While portions of the manual can I>, adptedfor use at the local level, the information and strategies aredesigned to promote coordination among SEA staff. Materials areorganized into seven self-contained chapters which can be presentedsequentially or independently. Chapter 1, "ParticipantSelf-Assessment," is esigned to assess awareness of equity issuesand knowledge of equity-related laws and research and comprises aself-assessment worksheet and answer sheet. Chapter 2, "The Federaland State Roles in Promoting Educational Equity," comprises thefollowing sections: (1) "The Federal Role"; (2) "'Grove City Collegev. Bell''; (3) "The State Role"; and (4) "Equity Action at the StateLevel--A Worksneet." Chapter 3, "Equity-Related Laws at the FederalLevel," comprises the following sections: (1) "Title IX of theEducation Amendments of 1972"; (-I) "Title VI of the Civil Rights Actof 1964"; (3) "The Education of All Handicapped Children Act of1975"; (4) "Section 504 of the Rehabilitation Act of 1973"; (5)
"Title IV of the Civil Rights Act of 1964"; (6) "w)men's EducationalEquity Act of 1984"; (7) "The Carl D. Perkins Vocational EducationAct"; (8) "Bilingual Education Act of 1984"; (9) "Chapter 1 of theEducation Consolidation and Improvement Act"; (10) "Summary ofFederal Equity-Related Laws"; and (11) "Applying the Law--AWorksheet." Chapter 4, "Persistent Inequities," comprises thefollowing sections: (1) "Introduction"; (2) "Social and EconomicInequities Facing Women"; (3) "Discrimination and Inequities inElementary and Secondary Schools"; and (4) "PersistentInequitie---Small Group Activity." Chapter 5, "Integrating EquityConcerns: A Collaborative Approach," comprises the followingsections: (1) "Increasing Collaboration among Equity Staff"; (2)"Integrating Equity Concerns into SEA Activities"; (3) "AssessingCollaboration among Equity Staff--A Worksheet"; (4) "IdentifyingEquity Needs of SEA Staff--A Worksheet"; and (5) "A Checklist ToAssess the Extent to Which Equity Concerns Have Been Integrated intoSEA Activities--A Worksheet." Chapter 6 describes next steps for SEAequt-y staff and Chapter 7 provides materials on evaluation andfeedback. The participant activities which accompany each chapter canbe adapted for either large- or small-group meetings. Statisticaldata are included on nine tables and one graph. (FMW)

EQUITY TRAINING FOR STATE EDUCATION AGENCY STAFF
Resource Center, on Educational EquityCouncil of Chief State School Officers
400 North Capitol Street, N. W., Suite 379Washington, D. C. 200C1
FALL 1986
U S DEPARTMENT OF EDUCATIOP)11,, a i.f Ed. atonal Resean n and loprl,er en,
EDUCATIONAL RESOURCE', INFORMATIONCE NTER
)1C This ch.roment has been reprodur ed aoreceived trpfl, the person nr orn.mnIratnl,,nginattng
MInor rhancies have bean made Ire Jr{., vereprodoCTOn atAllty
00,11,,, slated Intl s stun IfnoM ne eV resent
PERMISSION TO REPRODUCE THISMATERIAL IN MICROt .CNE ONLYHAS BEEN GRANTED BY
t.6 fLoAc I cY ti <;it(tN-'
TO THE EDUCATIONAL RESOURCESINFORMATION CENTER ERIC,
SESI COPY AVAILABLE

ACKNOWLEDGEMENTS
"Equity Training for State Education Agency Staff" is a project of theCouncil of Chief State School Officers Resource Center on EducationalEquity. The project was funded by a grant from the U. S. Department ofEducation's Women's Educational Equity Act Program (WEEAP).
The project training manual was developed by Claire Cunningham,Director of the project and Associate Director of the Resource Center,Cynthia Brown, Director of the Resource Center, and Glenda Partee,Assistant Director of the Resource Center.
Project staff wish to express their appreciation to state and localequity staff members who contributed to the development of this manual. Aspecial thanks also goes to Ann Samuel of the CCSSO Resource Center forher long hours of secretarial assistance.
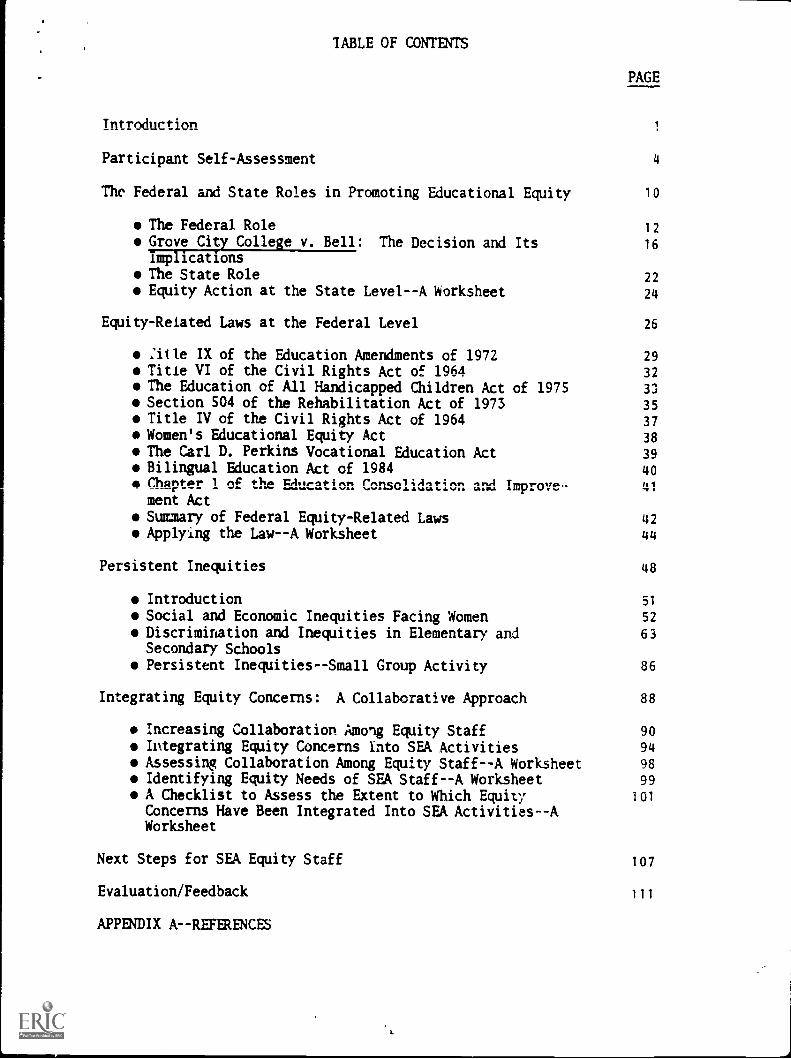
TABLE OF CONTENTS
PAGE
Introduction
Participant Self-Assessment 4
The Federal and State Roles in Promoting Educational Equity 10
The Federal Role 12
Grove City College v. Bell: The Decision and Its 16
ImplicationsThe State Role 22Equity Action at the State Level--A Worksheet 24
Equity-Related Laws at the Federal Level 26
:iite IX of the Education Amendments of 1972 29
Title VI of the Civil Rights Act of 1964 32The Education of All Handicapped Children Act of 1975 33
Section 504 of the Rehabilitation Act of 1973 35Title IV of the Civil Rights Act of 1964 37Women's Educational Equity Act 38The Carl D. Perkins Vocational Education Act 39Bilingual Education Act of 1984 40Chapter'. 1 of du. rA,..tion Consolidation arA I-prove- 41
went ActSummary of Federal Equity-Related Laws 42Applying the Law--A Worksheet 44
Persistent Inequities 48
Introduction 51
Social and Economic Inequities Facing Women 52
Discrimination and Inequities in Elementary and 63Secondary SchoolsPersistent Inequities--Small Group Activity 86
Integrating Equity Concerns: A Collaborative Approach 88
Increasing Collaboration Among Equity Staff 90
Integrating Equity Concerns Into SEA Activities 94
Assessing Collaboration Among Equity Staff--A Worksheet 98
Identifying Equity Needs of SEA Staff--A Worksheet 99
A Checklist to Assess the Extent to Which Equity 101
Concerns Have Been Integrated Into SEA Activities--AWorksheet
Next Steps for SEA Equity Staff
Evaluation/Feedback
APPENDIX A--REFERENCES
107
111


Introduction
During 1976-1978, the National Center for Sex Roles in Education, the
precursor of the current CCSSO Resource Center on Educational Equity,
developed training materials and conducted a series of
training-of-trainers sessions for state and local Title IX coordinators to
assist them in comi.lying with Title IX of the Education Amendments of
1972. The materials and the subsequent training were based on the
original Title IX regulations and were designed for participants who had
little familiarity with the law or its implications.
Today, sex-based inequities continue to exist throughout the
educational system. The situation facing educators in 1986, however,
differs in several important ways from the situation confronting them
several years ago: 1) the role of the federal government in the education
field has declined significantly during recent years; 2) ambiguities
concerning the scope of Office for Civil Rights (OCR) jurisdiction have
arisen as a result of Grove City College v. Bell; 3) the state role in
education has become more visible as the federal role has declined and as
states implement "excellence" reforms; 4) while blatant "access" issues no
longer present major obstacles to educational equity, more subtle forms of
bias and discrimination continue to surface; and 5) there has been a
significant turnover rate among equity staff in education agencies. These
and related factors, discussed in detail below, necessitated the
development of new equity training materials.
This training manual is designed to achieve three primary objectives.
First, it is intended to provide a "status report" for state education
agency (SEA) equity staff on federal and state roles in promoting
-2-
6

educational equity. Second, the manual provides an overview of inequities
based on race, sex, national origin, and disability that continue to exist
in our educational system. :lard, it encourages equity staff to work
cooperatively in integrating equity concerns into SEA programs and
activities.
The manual is designed for SEA equity personnel and is develored from
a sex equity perspective. While portions of the manual can be adapted for
use at the local level, the manual focuses on information and strategies
designed to help SEA staff do their jobs in a more coordinated fashion.
Materials included in the manual are organized into self-contained
"chapters" which can be presented in sequence or indepen2ently.
Participant activities which accompany each chapter can be adapted to suit
large or small group meetings.
3--
7

PARTICIPANT SELF-ASSESSMENT
4-
.3

PARTICIPANT SELF-ASSESSMENT
Objectives:
1) To assess participants'equity issues; and
2) To assess participants'research findings.
Procedure for Trainer:
awareness
knowledge
and understanding of diverse
of equity-related laws and
Distribute copies of the "Self-Assessment Worksheet" to participantsand ask them to respond to each question. A fact sheet providing answersto the questions can be distributed at the conclusion of the workshop.
In addition to serving as a pretest for workshop participants, thisexercise provides a mechanism for initiating discussion amongparticipants.
Materials for Participant Activities:
Self-Assessment Worksheet
Self-Assessment Answer Sheet
-5-
9

SELF-ASSESSMENT WORKSHEET
I. Public Law 94-142 requires that an individualizededucation program (IEP) be developed for each childneeding special education. The IEP must be reviewedand updated every three years.
2. There is a rebuttable presumption that once a localeducation agency (LEA) accepts federal Chapter 2funds, all of the LEA's programs and activities aresubject to U. S. Department of Education, Office forCivil Rights (OCR) jurisdiction.
3. Title VI of the Civil Rights Act of 1964, the Women'sEducational Equity Act, Title IX of the EducationAmendments of 1972, and Section 504 of theRehabilitation Act of 1973 are all civil rightsstatutes which prohibit discrimination in institu-tions which receive federal financial assistance.
4. Low-income or socioeconomically disadvantaged whitefemales drop out of high school at higher ratesthan low-income or socioeconomically disadvantagedblack females.
5. According to OCR statistics in 1980, black studentswere three times as likely as white students to beenrolled in programs for the educable mentallyretarded.
6. In 1984, only about one-third of the 3.6 millionlimited English proficient students receivededucation programs designed for their special needs.
7. In 1986, there are twelve female chief stateschool officers.
8. In 1984, 16 percent of all families in the UnitStates were headed by f(aales.
9. As a group Hispanic women tend to be raciallyhomogeneous and of common national origins.
10. The average weekly earnings of women are aboutone-third less than the average weekly earnings ofmen.
11. Males aze more likely than females to be enrolledin programs for the educable mentally retarded,trainable mentally retarded, and speech impaired.
12. Many college-going females do not acknowledge orfully understand the barriers to their success inthe world of work.
-6
10
TRUE FALSE

13. Both the high school and college attainment ratesfor disabled women are higher than attainmentrates for disabled men.
14. The full time year-round labor force participationrates for disabled men in 1981 was three timesthe participation rate for disabled women.
15. Females with four or more years of postsecondaryeducation have lower average earnings than theaverage earnings of males who complete onlyhigh school.
16. Asian American women of Japanese and Chineseorigin surpass all other groups of women intheir levels of educational achievement.
17. In 1984, the unemployment rate for black women wasmore than twice as great as the unemployment ratefor white women.
18. In 1980, approximately 40% of Native slericanwomen worked full-time, year-round jobs.
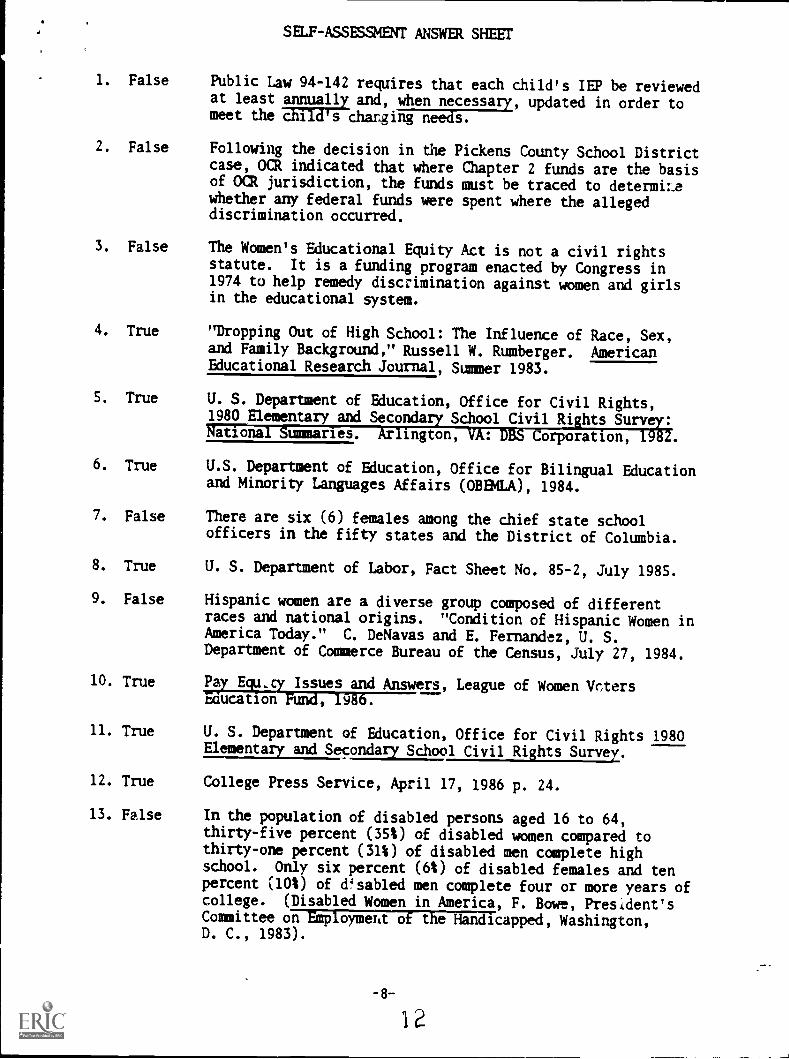
SELF - ASSESSMENT ANSWER SHEET
1. False Public Law 94-142 requires that each child's IEP be reviewedat least annuall and, when necessary, updated in order tomeet the c i s charging needs.
2. False Following the decision in the Pickens County School Districtcase, OCR indicated that where Chapter 2 funds are the basisof OCR jurisdiction, the funds must be traced to determiLewhether any federal funds were spent where the allegeddiscrimination occurred.
3. False The Women's Educational Equity Act is not a civil rightsstatute. It is a funding program enacted by Congress in1974 to help remedy discrimination against women and girlsin the educational system.
4. True "Dropping Out of High School: The Influence of Race, Sex,and Family Background," Russell W. Rumberger. AmericanEducational Research Journal, Summer 1983.
S. True U. S. Department of Education, Office for Civil Rights,1980 Elementary and Secondary School Civil Rights Survey!National Arlington, VA: DES Corporation, 1982.
6. True U.S. Department of Education, Office for Bilingual Educationand Minority Languages Affairs (OBEMLA), 1984.
7. False There are six (6) females among the chief state schoolofficers in the fifty states and the District of Columbia.
8. True U. S. Department of Labor, Fact Sheet No. 85-2, July 1985.
9. False Hispanic women are a diverse group composed of differentraces and national origins. "Condition of Hispanic Women inAmerica Today." C. DeNavas and E. Fernandez, U. S.Department of Commerce Bureau of the Census, July 27, 1984.
10. True
11. True
12. True
13. False
Pay Equ.cy Issues and Answers, League of Women Vctersgaucation Fund, 1986.
U. S. Department of Education, Office for Civil Rights 1980Elementary and Secondary School Civil Rights Survey.
College Press Service, April 17, 1986 p. 24.
In the population of disabled persons aged 16 to 64,thirty-five percent (35%) of disabled women compared tothirty-one percent (31%) of disabled men complete highschool. Only six percent (6%) of disabled females and tenpercent (10%) of disabled men complete four or more years ofcollege. (Disabled Women in America, F. Bowe, President'sCommittee OFP51155+70a7of the Handicapped, Washington,D. C., 1983).
14. True
15. True
16. True
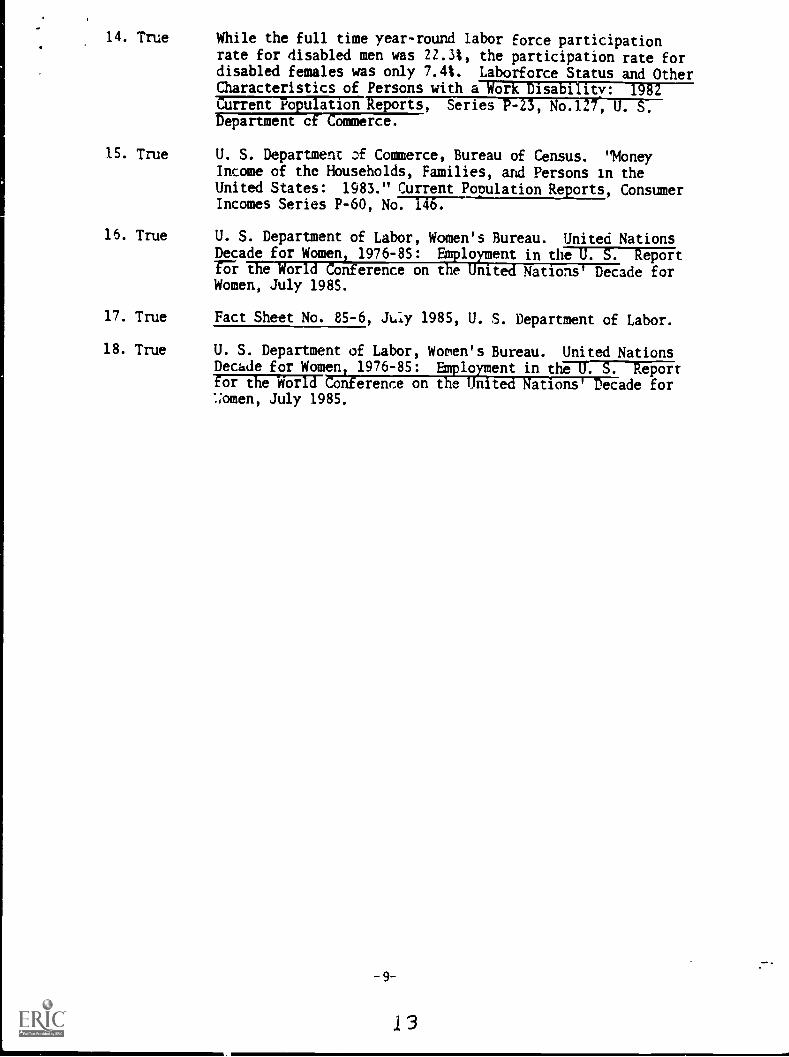
While the full time year-round labor force participationrate for disabled men was 22.3%, the participation rate fordisabled females was only 7.4%. Laborforce Status and OtherCharacteristics of Persons with a Work Disability: 1982Current Population eports, Series o.1 U.Department of Commerce.
U. S. Department Commerce, Bureau of Census. "MoneyIncome of the Households, Families, and Persons in theUnited States: 1983." Current Population Reports, ConsumerIncomes Series P-60, No. 146.
U. S. Department of Labor, Women's Bureau. United NationsDecade for Women, 1976-85: Employment in the U. S. ReportTr IIi-World Conference on the United Nations' Decade forWomen, July 1985.
17. True Fact Sheet No. 85-6, July 1985, U. S. Department of Labor.
18. True U. S. Department of Labor, Women's Bureau. United NationsDecade for Women, 1976-85: Employment in the. S. Reportfor the World 'Conference on the United Nations' Decade for:;omen, July 1985.
-9-
13

THE FEDERAL AND STATE ROLES IN PROMOTING EDUCATIONAL EQUITY
-10--

THE FEDERAL AND STATE ROLES IN PROMOTING EDUCATIONAL EQUITY
Objectives:
1) To provide a "status report" on the changing roles of federal andstate governments in fostering educational equity;
2) To provide an understanding of the Grove City College v. Belldecision and its implications; and
3) To illustrate the importance of state-level action in preservingPCIllityTPlatPef achievementsar o f past and in accomplishing 11CMIequity goals in the future.
Procedure for Trainer:
The trainer should summarize the narrative materials illustrating thedecline of the federal role in education. Particular attention can bedevoted to Grove City College and its implications.
The importance of the state role in education should be stressedduring this segment of the training. Where appropriate, the trainer mightframe this discussion in terms of the participants' job responsibilitiesas well as their state's laws and policies.
Materials for Participant Activities:
EQUITY ACTION AT THE STATE LEVEL- -Since the federal role in promotingeducational equity has been declining in recent years, this exercise isimportant for helping participants focus on state solutions/remedies toexisting inequities.
I. THE FEMERAL AND STATE ROLES IN PROMOTING EDUCATIONAL EQUITY
A. The Federal Role
"The federal government's share of the nation's total educationexpenditures has been cut from 9.2 percent in 1979.1980 to 6.7 percent
in 1984-1985." (CDF, p. 228)*
Since 1981 the Reagan Administration has recommended zero funding forthe Women's Educational Equity Act Program and, in some years, hasrecommended a rescission of existing appropriations.
"OCR will now rely on a good faith standard, rather than actualachievements, in measuring the success of desegregation plans...."(H.R. REP. 458, p. 23)
As these statements suggest, the federal role in education has been
significantly reduced during recent years. This decline has been
particularly severe with respect to federal efforts to promote educational
equity for all students. Major policy changes, budget reductions,
consolidation of education programs into block grants, less rigorous civil
rights enforcement practices at the federal level, and the consequences of
the U. S. Supreme Court's restrictive ruling in Grove City College v. Bell
are indicative of this reduced role.
1. Budget Reductions
In keeping with its "new federalism" philosophy of decreased federal
involvement, the Reagan Administration has repeatedly proposed major cuts
in the federal education budget. In some cases, the Administration has
recommended a total rescission of existing appropriations for education
programs. Although Congress has not agreed to the AdministrAtion's
proposals, in recent years it has appropriated funds at a slower growth
rate than in the past. This slower rate, combined with the effects of
inflation, have resulted in serious deficiencies in federal programs
w-aTifilTs to sources are referenced in the text by author and publicationdate. A complete list of references is included as Appendix A.
-12-
, for the educationally disadvantaged. For example, the Children's Defense
Fund reports that as a consequence of the federal decline in education
funding, compensatory education programs served only 52 students for every
100 poor school-aged children in 1984, as compared to 75 per 100 in 1979
(CDF, p. 228).
Equity-related technical assistance programs have also suffered
serious budget cuts. In six of its seven budget requests, for instance,
the Reagan Administration has recommended zero funding for Title IV of the
Civil Rights Act. Similarly, it has proposed zero funding for the Women's
Educational Equity Act Program (WEEAP) in all seven budget requests.
Congress rejected these recommendations, but did reduce appropriations for
both Title IV and WEEAP. These programs are currently operating at low
but minimally adequate levels.
Unfortunately, in this time of astronomical federal deficits,
significant increases in the federal education budget are not likely.
Lagging federal education support will, therefore, continue to threaten
progress made in improving the educational performance of educationally
disadvantaged students.
2. Program Consolidation
In addition to its proposed budget cuts, in 1981 the Reagan
Administration recommended that dozens of categoricP.1 aid programs be
consolidated into a state block grant program. Throu&h a
consolidation, it was argued, state and local officials would be given
greater program flexibility and federal resources would be conserved.
-13-
II 1981 Congress passed the Education Consolidation and Improvement
Act (ECIA) which folded 28 categorical aid programs into a single block
grant program. However, ECIA fell short of the Administration's goal
since it retained as separate some programs recommended by the
Administration for consolidation (e.g., Education of the Handicapped Act).
anticipated, state and local school districts have far greater
discretion in determining how they will spend federal education funds
under ECIA than was possible under the categorical aid programs. However,
while they are being allowed more discretion under ECIA, state and local
districts are receiving less total funding than previously. Not
surprisingly, this increased discretion and reduced funding has had a
negative impact on efforts to promote educational equity. Cities with
high minority populations have experienced particularly deep cuts in their
federally funded programs. Frequently, the limited funds states receive
are not used to support educational equity efforts. For example,
according to CDF, a survey of Florida school districts found that 82% are
using Chapter 2 (i.e., block grant) funds to buy computer equipment, while
only 5% are using these funds for school desegregation initiatives (CDF,
p. 229). This lack of attention to desegregation issues is particularly
distressing given that the Emergency School Aid Act, which provided
federal assistance for desegregation activities, accounted for
approximately 30% of all categorical funds folded into the Chapter 2 block
grant.
3. Civil Rights Enforcement
The Office for Civil Rights (OCR) in the U. S. Department of Education
enforces four statutes which .ohit.it discrimination on the basis of race,_
14-

color, national origin, sex, disability, and age by recipients of federal
financial assistance. Today's OCR is an outgrowth of the civil rights
program established in the Office of Education of the U. S. Department of
Health, Education, and Welfare (HEW) shortly after enactment of Title VI
of the Civil Rights Act of 1964.
OCR's investigative program consists of two elements:
investigation of complaints filed by individuals and groups on theirown or others' behalf; and
conduct of OCR-initiated compliance reviews of selectedinstitutions.
Between 1972 and 1981, OCR performed a third investigative
responsibility: enforcement of the civil rights provisions of the
Emergency School Aid Act (ESAA).
Over a 20 year period, the nature of federal civil rights enforcement
has changed drastically. In the 1960's a small staff focused virtually
all its efforts on opening access to education to hundreds of thousands of
black elementary and secondary school students. Two decades later, a much
larger staff spends most of its time investigating complaints of
discriminat'on against individuals. Unfortunately, today's complaints are
much less likely to raise discrimination problems suffered by minority or
low-income students (Brown and Reid, 1986).
OCR's effectiveness was recently evaluated by the House of
Representative's Intergovernmental Relations and Human Resources
Subcommittee. Among the findings included in the Subcommittee's report
were th_ following:
-1 5-

OCR and [the Department of Justice] have failed to obtain completeenforcement remedies in cases where serious violations of law werefound;
OCR will now rely on a good faith standard, rather than actualachievements, in measuring the success of desegregation plans,despite its internal firding3 that many systems of higher educationhave not eliminated the vestises of illegal dual systems ofeducation;
OCR is studying methods to substitute technical assistance forcompliance reviews, a switch that OCR's own policy and enforcementservice considers illegal;
OCR cannot ensure that more than 300 cases settled by earlycomplaint resolution were resolved according to federal law andDOE's regulations...(H.R. REP. 458).
As indicated below, OCR enforcement has also been severely curtailed
as a result of the narrow program-specific rulings in Grove City College
v. Bell and Pickens County School District.
B. Grove City College v. Bell: The Decision and its Implications*
History of the Case
This case arose when Grove City College, which was not charged with
sex discrimination, refused to sign an assurance form plmising it would
comply with Title IX. In refusing to sign the form, the College argued
that although some of its students received federal grants to pay for
their education, the College itsef was not a recipient of federal
financial assistance and, therefre, was not subject to Title IX. The
U. S. Court of Appeals for the Third Circuit rejected this argument in its
1982 decision, holding that Grove City College was a recipient of federal
financial assistance within the meaning of Title IX, and thus had to file
the Assurance of Compliance form. Under the Court of Appeals decision,
ITETTT. Supreme Court's opinion can be found at 465 U.S. 555 (1984).

the entire College would be subject to federal oversight under Title IX.
Dissatisfied with the Court of Appeals decision, Grove City College asked
the U. S. Supreme Court to review its case. Reversing more than ten years
of federal policy under both Democratic and Republican Administrations,
the U. S. Justice Department argued before the Supreme Court that Title IX
aaesnot apply to the entire institution receiving federal funds but only
to the specific program hpine firryipA.
The Supreme Court's Decision
In its decision the Supreme Court addressed three main issues.
1) Does Title IX apply to Grove City College at all? 2) If Title IX does
apply, what "education program or activity" at the College must comply
with Title IX's mandates? 3) Can federal assistance to the students be
terminated solely because the College refuses to sign an Assurance of
Compliance form as required under Title IX regulations?
The Supreme Court first concluded that Title IX was triggered in this
case since some Grove City College students received federal grants to ray
for their education. Title IX applied whether the federal funds went
directly to the College or reached the College indirectly through
financial aid to the students.
In identifying which "education program or activity" was subject to
Title IX coverage, however, the majority opinion accepted the Reagan
Administration's narrow interpretation of the law. The Court concluded
that only Grove City College's financial aid office--not the entire
institution was required to comply with Title IX's mandates.
-17-

Finally, the Court hela that unless Grove City College executed an
Assurance of Compliance, federal assistance being provided to its students
could be terminated.
Implications of Grove City
First, Lhe decision is undoubtedly a set-back to achieving educational
equity for women and girls. According to the Supreme Court, Grove City
College and other schools in a similar situation, may not discriminate on
the basis of sex in their financial aid programs; they are, however, not
prohibited from discriminating in their admissions policies, athletic
programs, and other activities which are not directly supported by federal
funds. For example, Justice Brennan points out in his dissent that Grove
City College is now free to segregate male and female students in classes
run by its mathematics department despite the fact that the affected
students may be receiving federal assistance to pay for their education.
The Court's program-specific ruling will also have implications beyond
the education field. Shortly after the Court announced its Grove City
decision, William Bradford Reynolds, Assistant Attorney General for Civil
Rights in the U. S. Department of Justice, stated that the decision would
be applied to other federal antidiscrimination statutes having similar
"program or activity" language. Consequently, the Court's narrow
interpretation of "program or activity" is now being applied to the
following statutes:
Title IX of the Education Amendments of 1972 (prohibiting sexdiscrimination in federally assisted education programs andactivities);
Title VI of the Civil Rights Act of 1964 (prohibiting discriminationbased on race, color, or national origin in federally assistedprograms and activities);

Section 504 of the Rehabilitation Act of 1973 (prohibitingdiscrimination based on disability in federally assisted programsand activities);
Age Discrimination Act (prohibiting discrimination based on age infederally assisted programs and activities).
The consequences of the Grove City decision first became apparent at
the University of Maryland within two weeks of the Court's decision.
Although the Department of Education's Office for Civil Rights had found
instances of sex discrimination in the University of Maryland's
intercollegiate athletics program, charges against the University were
dropped because the athletic program did not receive federal funds. Since
that time, several other discrimination cases have suffered the same or a
similar fate--by the end of 1985 more than 60 cases had been closed,
limited, or suspended by the Department of Education as a result of the
Grove City decision. The cases have involved Title VI and Section 504
claims as well as Title IX cases. Examples of the Department of
Education's application of the Grove City decision to actual complaints
are described below. (For additional information concerning these and
other examples, see Project on Equal Education Rights, NOW Legal Defense
and Education Fund, et al., "Injustice Under the Law: The Impact of the
Grove City College Decision on Civil Rights in America" (1985).)
A Northeastern University student filed a Title IX complaintalleging that Northeastern had no Title IX grievance procedure andthat the University had failed to redress the student's sexualharassment complaint. The University had received federal fundsthrough the federal College Housing Loan Program as well as throughstudent aid.
OCR concluded that it could not investigate this complaint since thebuilding in which the alleged discrimination occurred had net beenbuilt or renovated with federal loans. The case was put on "policyhold" at the Department of Education [OCR #01-84-2020].
A University of Charleston maintenance worker claimed tha, he was avictim of employment discrimination based on his disability. Since1979 the University had received in excess of $3 million in federaleducation funds, including $472,940 in federal student aid duringthe 1983-84 school year. Despite this federal assistance, OCR put
-19-
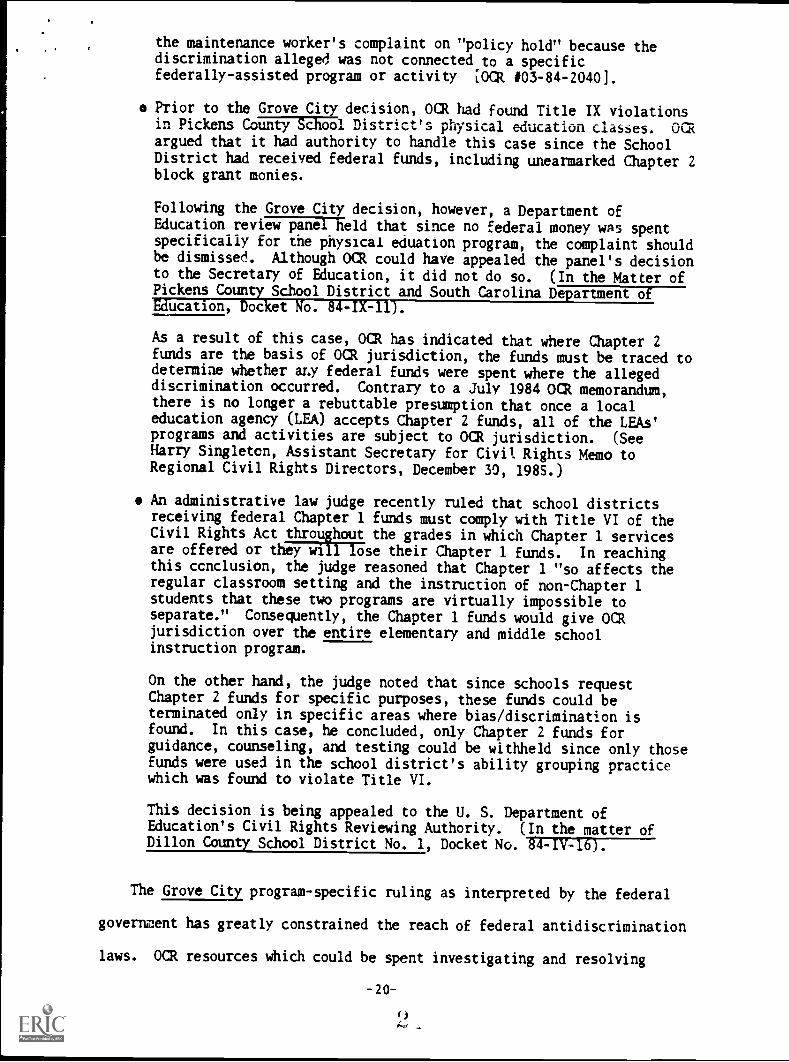
the maintenance worker's complaint on "policy hold" because thediscrimination alleged was not connected to a specificfederally-assisted program or activity [OCR #03-84-20401.
o Prior to the Grove City decision, OCR had found Title IX violationsin Pickens County School District's physical education classes. OCRargued that it had authority to handle this case since the SchoolDistrict had received federal funds, including unearmarked Chapter 2
block grant monies.
Following the Grove City decision, however, a Department ofEducation review that since no federal money was spentspecifically for the physical eduation program, the complaint shouldbe dismissed. Although OCR could have appealed the panel's decisionto the Secretary of Education, it did not do so. (In the Matter ofPickens County School District and South Carolina Department or---Education, Docket No. - - ).
As a result of this case, OCR has indicated that where Chapter 2funds are the basis of OCR jurisdiction, the funds must be traced todetermine whether al..), federal funds were spent where the allegeddiscrimination occurred. Contrary to a July 1984 OCR memorandum,there is no longer a rebuttable presumption that once a localeducation agency (LEA) accepts Chapter 2 funds, all of the LEAs'programs and activities are subject to OCR jurisdiction. (SeeHarry Singleton, Assistant Secretary for Civil Rights Memo toRegional Civil Rights Directors, December 30, 1985.)
An administrative law judge recently ruled that school districtsreceiving federal Chapter 1 funds must comply with Title VI of theCivil Rights Act throwthroughout the grades in which Chapter 1 servicesare offered or they will ose their Chapter 1 funds. In reachingthis conclusion, the judge reasoned that Chapter 1 "so affects theregular classroom setting and the instruction of non-Chapter 1students that these two programs are virtually impossible toseparate." Consequently, the Chapter 1 funds would give OCRjurisdiction over the entire elementary and middle schoolinstruction program.
On the other hand, the judge noted that since schools requestChapter 2 funds for specific purposes, these funds could beterminated only in specific areas where bias/discrimination isfound. In this case, he concluded, only Chapter 2 funds forguidance, counseling, and testing could be withheld since only thosefunds were used in the school district's ability grouping practicewhich was found to violate Title VI.
This decision is being appealed to the U. S. Department ofEducation's Civil Rights Reviewing Authority. (In the matter ofDillon County School District No. 1, Docket No. go-IV -lo).
The Grove City program-specific ruling as interpreted by the federal
government has greatly constrained the reach of federal antidiscrimination
laws. OCR resources which could be spent investigating and resolving
-20-

complaints are now being used to track federal dollars in order to
determine whether they have been spent in programs or activities in which
discrimination has been alleged. If federal assistance cannot be traced
to the program or activity. the complaint will not be investigated.
As indicated previously, more than 60 cases have been closed, limited
or suspended as a result of the Grove City test. Most likely, the
decision has also had a further "chilling effect" on discrimination
claims. Recognizing obstacles they were likely to encounter in
establishing OCR jurisdiction over their claims, potential complainants
probably have been (and continue to be) discouraged from filing
discrimination claims at all. Without remedial legislation, therefore,
federal discrimination cases, if they are filed at all, will continue to
be limited or closed without ever being investigated.
Legislative Responses to Grove City College v. Bell
Legisiators and civil rights advocates were quick to respond to the
Supreme Court's Grove City College decision. Identical bills, entitled
"The Civil Rights Act of 1984," were introduced in the U. S. House (H.R.
5490) and Senate (S. 2568) in mid-April_of 1984. The bills were intended
to ensure broad coverage of Title IX of the EducationAmendments of 1972
as well as broad coverage of the three other federal civil rights statutes
having similar "program or activity" language:- Title VI of the Civil
Rights Act of 1964; SAction 504 of the Rehabilitation Act of 1973 as
amended; and the Age Discrimination Act.
Although the House passed an amended version of this civil rights
measure, procedural delays prevented its passage in the Senate before
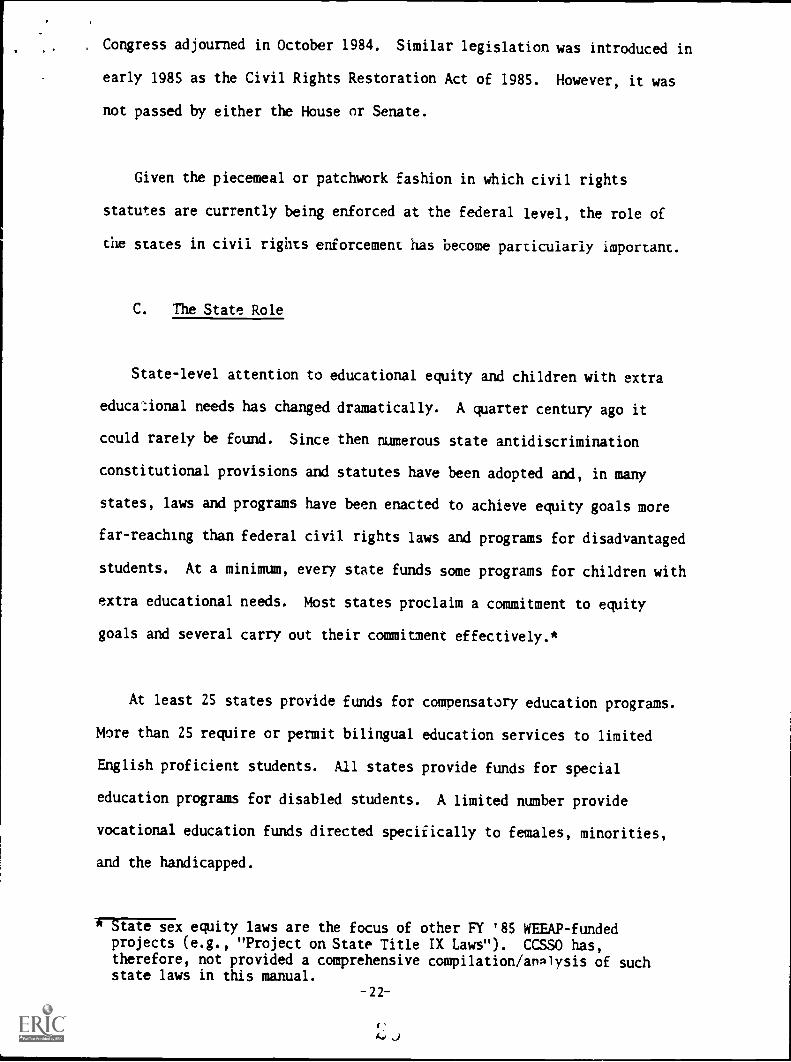
, Congress adjourned in October 1984. Similar legislation was introduced in
early 1985 as the Civil Rights Restoration Act of 1985. However, it was
not passed by either the House or Senate.
Given the piecemeal or patchwork fashion in which civil rights
statutes are currently being enforced at the federal level, the role of
the states in civil rights enforcement has become particularly important.
C. The State Role
State-level attention to educational equity and children with extra
educa :ional needs has changed dramatically. A quarter century ago it
could rarely be found. Since then numerous state antidiscrimination
constitutional provisions and statutes have been adopted and, in many
states, laws and programs have been enacted to achieve equity goals more
far-reaching than federal civil rights laws and programs for disadvantaged
students. At a minimum, every state funds some programs for children with
extra educational needs. Most states proclaim a commitment to equity
goals and several carry out their commitment effectively.*
At least 25 states provide funds for compensatory education programs.
More than 25 require or permit bilingual education services to limited
English proficient students. All states provide funds for special
education programs for disabled students. A limited number provide
vocational education funds directed specifically to females, minorities,
and the handicapped.
state sex equity laws are the focus of other FY '85 WEEAP-fundedprojects (e.g., "Project on State Title IX Laws"). CCSSO has,therefore, not provided a comprehensive compilation/analysis of suchstate laws in this manual.
-22-

In recent years, the states have as:.;umed an exceptionally prominent
role in education through their "excellence reforms". State legislatures
have mandated stricter graduation requirements, longer school days,
te.z.her testing, and other reforms designed to improve the quality of
education provided to public school students. Then) 's, however, concern
among some educators, equity advocates, and others that recently-enacted
reforms might discourage rather than assist educationally disadvantaged
students. As one commentator suggests:
Reforms that create more time in school or higher standards--withoutsalient changes in the schooling process that will increase learningfor the disadvantaged--will likely increase dropout rates among thosestudents who can scarcely hope t, meet present standaals. (Levin,p. 17)
Given the decline of the federal role in education, it is essential
that SEAS take steps to ensure that all students receive an equitable
education. Most likely, primary responsibility for taking these steps
will be left to equity staff within the SEA. These individuals must
promote programs and procedures that are r,sponsive to the educational
needs of diverse student populations. Section VI of this manual discusses
how and why equity specialists can wol., cr-,peratively in meeting these
educational needs.
-23-
t,

EQUITY ACTION AT THE STATE LEVEL
As the federal role in promu,ing educational equity continues todecline, it is essential that SEA staff understand what state remedies toinequities exist. The following questions are intended -5Eilp youidentify and apply state-level antidiscrimination mandates that areavailable in your state. The questions can be used as the basis of agroup discussion or can be answered individually by participants andresponses later compared and contrasted.
What antidiscrimination statutes or constitutional provisionscurrently exist in your state?
What types of discrimination are covered by the mandate(s) (e.g.,sex, race, national origin, disability, and/or age discrimination)?
Who is covered? Students? Teachers? Others?
Are entire educational institutions covered or just certain programswithin the institutions?
Which state agency or agencies are responsible for enforcing themand2te(s)?
-24-

How are discrimination claims filed under the mandate(s)?
Who is eligible to file complaints?
Are the state mandates more inclusive or less inclusive than TitleIX? Section 504? Title VI? Age Discrimination Act? Pleaseexplain.
How can SEA staff obtain copies of the state's antidiscriminationmandates?
Does the SEA provide technical assistance concerning the applicationof the mandate(s)?
What weaknesses or limitations exist in your state's existingantidiscrimination mandate(s)?
-25-
`2 J

EQUITY - RELATED LAWS AT THE FEDERAL LEVEL
-26-

EQUITY-RELATED LAWS AT THE FEDERAL LEVEL
Objectives:
1) To provide an overview of federal laws and regulations addressingdiscrimination in education; and
2) To provide participants with an opportunity to analyze andpropose solutions to equity-related problems.
Procedure for Trainer:
This section is intended to familiarize participants with nine federalequity-related laws and programs. Participants should be advised that inaddition to complying with federal mandates, they must also comply withstate laws, regulations, aziOTFITEles. Relevant state legislation isgenerally available through the SEA equity office(s) as well as lawlibraries.
Materials for Participant Activities:
APPLYING THE LAW- -This exercise is designed to encourage participantsto recognize and resolve equity issues which might arise in their state.
APPLYING THE LAWDISCUSSI0,4 GUIDEThe Guide identifies for thetrainer issues to be addressed by the participants in the preceedingexercise.
-27-

EQUITY-RELATED LAWS AT THE FEDERAL LEVEL
Federal antidiscrimination legislation has provided a foundation for
increasing educational equity for all students. These laws provide a
legal framework and/or funds for identifying and eliminating bias,
stereotyping, and discrimination in education. Through the enforcement of
these laws, females and minority males as well as disabled persons have
realized substantial gains in the education field. For example:
Title VI of the Civil Rights Act has played a major role indesegregating Southern schools;
Section 504 and the Education for All Handicapped Children Actensure that disabled children will receive an appropriate educationat public expense;
As a result of Title IX, there are noticeable increases in femaleenrollments in traditionally male-dominated vocational educationcourses and programs.
Clearly, significant steps towards educational equity have been
taken. However, the job has not been completed. Total equity still
remains a goal rather than a reality.
-28-
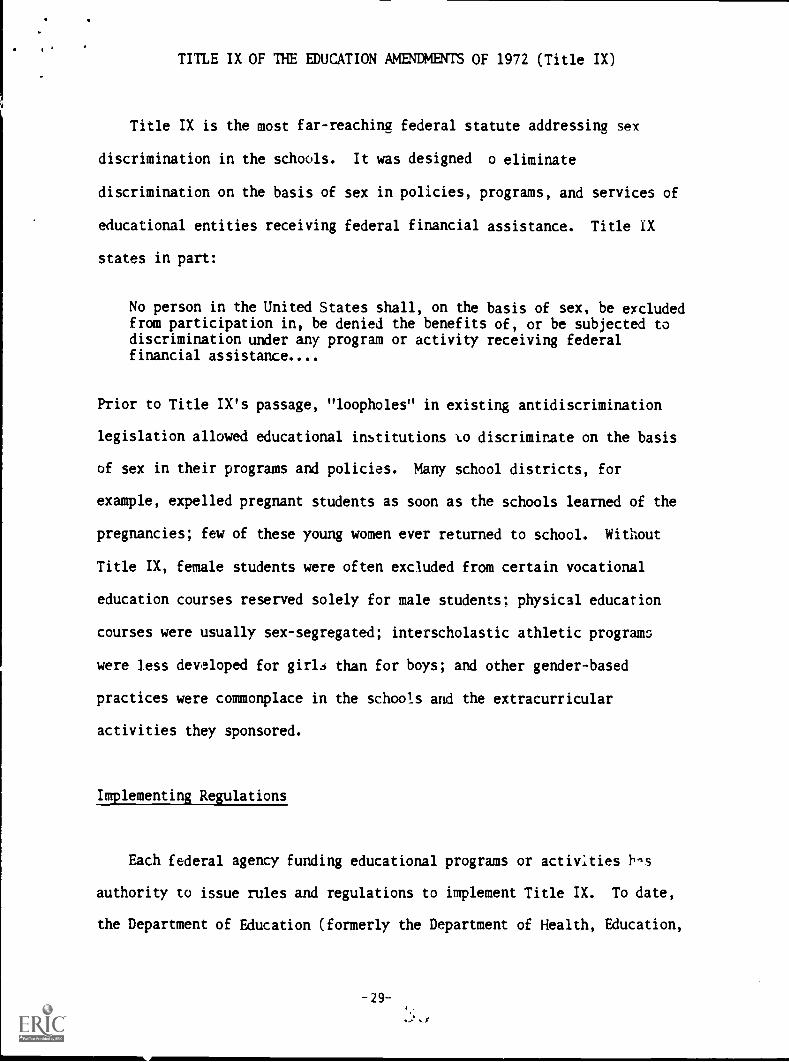
TITLE IX OF THE EDUCATION AMENDMENTS OF 1972 (Title IX)
Title IX is the most far - reaching federal statute addressing sex
discrimination in the schools. It was designed o eliminate
discrimination on the basis of sex in policies, programs, and services of
educational entities receiving federal financial assistance. Title IX
states in part:
No person in the United States shall, on the basis of sex, be excludedfrom participation in, be denied the benefits of, or be subjected todiscrimination under any program or activity receiving federalfinancial assistance....
Prior to Title IX's passage, "loopholes" in existing antidiscrimination
legislation allowed educational institutions to discriminate on the basis
of sex in their programs and policies. Many school districts, for
example, expelled pregnant students as soon as the schools learned of the
pregnancies; few of these young women ever returned to school. Without
Title IX, female students were often excluded from certain vocational
education courses reserved solely for male students; physical education
courses were usually sex-segregated; interscholastic athletic programs
were less developed for girls than for boys; and other gender-based
practices were commonplace in the schools and the extracurricular
activities they sponsored.
Implementing Regulations
Each federal agency funding educational programs or activities ti.,s
authority to issue rules and regulations to implement Title IX. To date,
the Department of Education (formerly the Department of Health, Education,
-29-

and Welfare) has played the lead role in Title IX enforcement. The
Department of Education regulations can be divided into four major
topics: 1) procedural mandates; 2) admissions and recruitment;
3) treatment of students; and 4) employment practices and policies. The
following discussion provides a general overview of these regulations. In
order to determine whether a particular educational entity is in
compliance with Title IX, the statute (20 U.S.C. Section 1681-1686) and
its regulations (34 C.F.R. Section 106 et. seq.) should be consulted.
Procedural Mandates
Title IX's regulations set out certain compliance procedures whichmust be established and followed by education entities receivingfederal financial assistance. Each recipient must, for example,develop and disseminate antidiscrimination policies, adopt grievanceprocedures for addressing student and employee complaints allegingTitle IX violations, and sign an assurance of compliance with TitleIX form. Compliance with Title IX and its regulations can beeffected by the loss of federal funding or through "other meansauthorized by law" (e.g., a private right of action).
Admissions ^nd Recruitment
Title IX and its regulations also ioentify policies and practiceswhich are prohibited in the admission and recruitment of students tovocational education and certain postsecondary institutions. Theseinstitutions may not, for example, rank applicants separately on thebasis of sex, put limitations on the number or proportion of eithersex who may be admitted, or administer admissions tests which have adisproportionately adverse effect on members of one sex unless thetests are valid predictors of success in the program and noalternative tests are available. Elementary and secondary schoolsare not bound by Title IX's admissions policies. As long as theyare receiving federal financial however, schools thatare exempt from the admissions requirements are not exempt from theobligation to treat students in a nondiscriminatory manner once theyare admitted to the school.
Treatment of Students
Title IX and its regulations provide detailed guidance on whatconstitutes sex discrimination in such areas as access to courseofferings, counseling, use of appraisal materials, e-Aracurricularactivities, and housing facilities. Students must generally beassured nondiscriminatory access to these services, programs, andbenefits provided by schools receiving federal assistance. Undersome limited circumstances, however, institutions and activities maybe exempt from Title IX's gender-based prohibitions. If, forexample, the application of Title IX would be inconsistent with thetenets of a religious educational institution, that institution
-30-
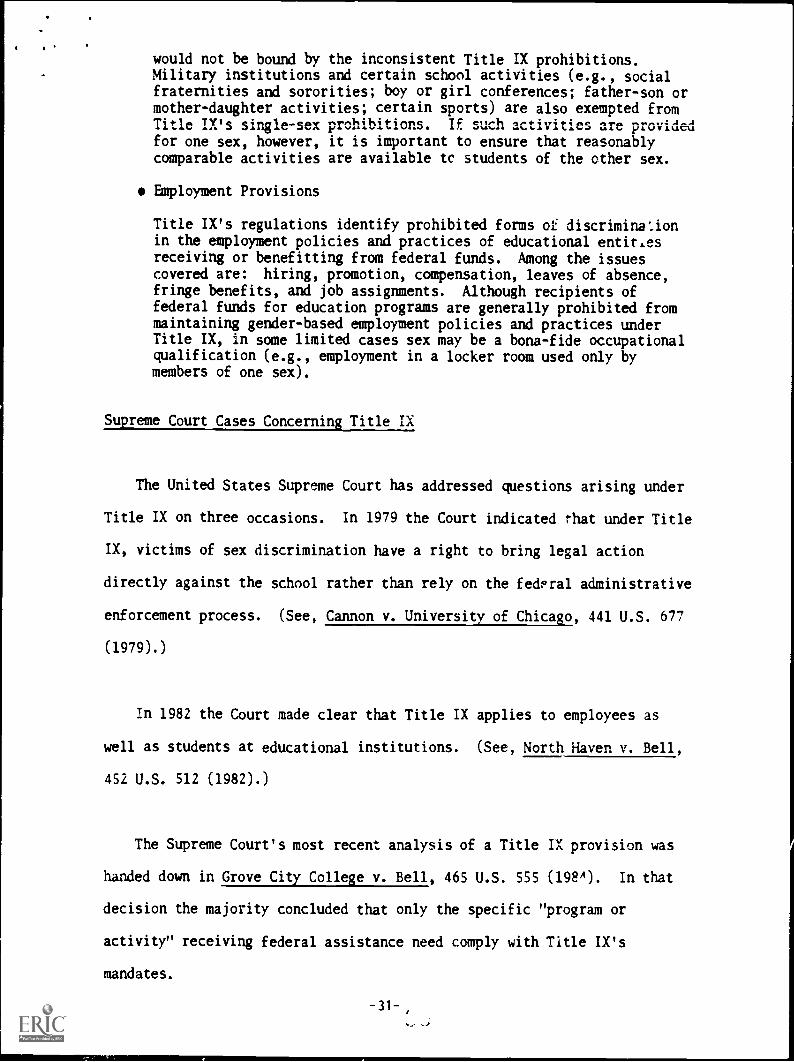
would not be bound by the inconsistent Title IX prohibitions.Military institutions and certain school activities (e.g., socialfraternities and sororities; boy or girl conferences; father-son ormother-daughter activities; certain sports) are also exempted fromTitle IX's sin
ta
singly prohibitions. If such activities are providedfor one sex, however, it is important to ensure that reasonablycomparable activities are available tc students of the other sex.
Employment Provisions
Title IX's regulations identify prohibited forms of discriminationin the employment policies and practices of educational entitiesreceiving or benefitting from federal funds. Among the issuescovered are: hiring, promotion, compensation, leaves of absence,fringe benefits, and job assignments. Although recipients offederal funds for education programs are generally prohibited frommaintaining gender-based employment policies and practices underTitle IX, in some limited cases sex may be a bona-fide occupationalqualification (e.g., employment in a locker room used only bymembers of one sex).
Supreme Court Cases Concerning Title IX
The United States Supreme Court has addressed questions arising under
Title IX on three occasions. In 1979 the Court indicated that under Title
IX, victims of sex discrimination have a right to bring legal action
directly against the school rather than rely on the federal administrative
enforcement process. (See, Cannon v. University of Chicago, 441 U.S. 677
(1979).)
In 1982 the Court made clear that Title IX applies to employees as
well as students at educational institutions. (See, North Haven v. Bell,
452 U.S. 512 (1982).)
The Supreme Court's most recent analysis of a Title IX provision was
handed down in Grove City College v. Bell, 465 U.S. 555 (198"). In that
decision the majority concluded that only the specific "program or
activity" receiving federal assistance need comply with Title IX's
mandates.
-31-,

TITLE VI OF THE CIVIL RIGHTS ACT OF 1964 (Title VI)
In spite of the 1954 U. S. Court de,-ision in Brown V. Board of
Education declaring segregated schools unconstitutional, federal funds
continued to flow into segregated schools well into the 1960's. To ensure
that federal monies would no longer be used to support such discriminatory
practices, Congress enacted Title VI of the Civil Rights Act. Title VI
provides:
No person in the United States shall, on the ground of race, color, ornational origin be excluded from participation in, be denied thebenefits of, or be subjected to discrimination under any program oractivity receiving Federal financial assistance.
The Title VI regulations describe the types of discriminatory
practices that are prohibited, set forth requirements concerning written
assurances of compliance, and describe federal enforcement procedures. If
recipients of federal assistance do not voluntarily comply with Title VI,
their federal funds can be terminated.
Title VI has been used to challenge such practices as separate
hospital facilities and services for black patients, race-based student
assignments, and the denial of appropriate educational services for
limited English proficient students.
Title IX of the Education Amendments of 1972, Section 504 of the
Rehabilitation Act of 1973, and the Age Discrimination Act of 1975 were
all moeeled after Title VI. The impact of each of these laws has been
reduced as a result of the U. S. Supreme Court's Grove City College v.
Bell decision.

THE EDUCATION OF ALL HANDICAPPED CHILDREN ACT OF 1975 (P.L. 94-142)
Federal involvement in the education of disabled children increased
significantly in 1975 with the enactment of amendments to the Education of
the Handicapped Act (EHA). These amendments are commonly referred to as
*P.L. 94-142" or "The Education for All Handicapped Children Act of
1975". This legislation provides federal financial assistance to states
for the education of 3 through 21 year old individuals who by virtue of
physical or mental disabilities ranging from learning disabilities to
severely disabling conditions require special education and related
services. The amount of federal assistance provided to each state is
based on the number of disabled children being served and is intended to
pay a percentage of the excess costs associated with educating disabled
children.
The law and its implementing regulations contain several key
provisions addressing these concerns which must be followed by the
states. The following discussion provides a summary of some key
components of the law.
A freP1 appropriate, public education must be made available forft
each disabled child. That is, special education programs andrelated services meeting each child's needs must be made availableat public expense and under public supervision. "Related services"means services needed in order for the child to benefit from specialeducation (e.g., physical therapy, speech pathology, andtransportation). The U. S. Supreme Court has indicated that an"appropriate" education is one that is developed following theprocedural requirements of P.L. 94-i42 and is "reasonablycalculated" to provide educational benefits for the disabled child.(See Board of Education of the Hendrick Hudson Central SchoolDistrict v. Rowley, 458 U.S. 176 (1982).)
In order to ensure that the educational program and services beingprovided are appropriate for each particular child, anindividualized education program (IEP) must be developed for eachchild needing special education. The IEP, developed with theassistance of the child's parents, includes descriptions of thechild's present performance level, educational goals to be achieved,
-337,

services to be provided, r i evaluation procedures to be employed.Each child's IEP must be reviewed at least annually and, whennecessary, updated in order to meet the child's changing needs.
Disabled children must be educated in the least restrictiveenvironment possible. That is, the law requires that to the maximumextent appropriate, disabled children should be taught withnondisabled children. Only when the nature or severity of thedisability is such that education in the regular classroom cannot beachieved satisfactorily, even with supplementary aids and services,should the child be removed from the regular classroom.
process procedures designed to safeguard the rights of thechild's parents or guardians as well as the interests of the childmust be in place. These procedural safeguards protect the parents'rights in matters relating to the identification, placement, andevaluation of their children. In addition, they provide a meaus fordisputing decisions by school officials concerning their children.
The law and its regulation,. , can be found at 20 U.S.C. Sec. 1401, et seq.
and 34 C.F.R. Part 300, respectively.
-34-
SECTION 504 OF THE REHABILITATION ACT OF 1973
Although it is brief in actual language, Section 504 of the
Rehabilitation Act of 1973 as amended has far-reaching implications. It
provides in part:
No otherwise qualified handicapped individual in the UnitedStates....shall, solely by reason of his handicap, be excluded fromparticipation in, be denied the benefits of, or be subjected todiscrimination under any program or activity receiving Federalfinancial assistance or under any program or activity conducted by anExecutive agency or by the United States Postal Service....
Like Title IX, therefore, Section 504 is a civil rights law; it
assures access for disabled individuals to federally-funded programs and
facilities. Unlike Title IX, however, Section 504 is not limited in its
application to the education field. Rather, it extends to !LI program
receiving federal financial assistance (e.g., health and social
services). Section 504 requires different treatment of a disabled person
where different treatment is necessary to accommodate the disabling
condition (e.g., structural changes or classroom reassignments to allow
disabled individuals access to courses).
With respect to the special education field, Section 504 and ERA have
"overlapping jurisdiction". That is, both require that a free,
appropriate public education be provided for disabled children. Section
504's regulations, in fact, provide that compliance with ERA's mandates is
one means for school systems to comply with Section 504's requirements
concerning the development of individualized education programs,
procedures for re-evaluating students, and establishment of procedural
safeguards.
-35-
Section 504 and EHA are, however, not identical. Section 504, for
example, addresses issues and populations not covered by ERA (e.g.,
postsecondary and adult education). In addition, while EHA defines a
handicapped child in terms of the child's need for special education and
related services, Section 504's definition speaks in broader terms,
covering people with physical or mental impairments which substantially
limit their major life activities. Unlike FHA, no funds are available
under Section 504 to carry out its mandates.
For a thorough understanding of Section 504, see the Rehabilitation
Act of 1973 as amended (29 U.S.C. Section 794) and its implementing
regulations (34 C.F.R. Part 104).

TITLE IV OF THE CIVIL RIGHTS ACT OF 1964 (TITLE IV)
Title IV was originally enacted to provide technical assistance and
training services to school districts needing h _p in their desegregation
efforts. The program was subsequently expanded to include assistance
related to national origin and sex discrimination.
Title IV provides federal funding for: 1) education agency staff "to
render technical assistance...regarding effective methods of coping with
special educational problems occasioned by desegregation"; 2) training
institutes at universIties for teachers and other school personnel; and
3) local proLIcts providing inservice training for teachers :-nd other
school personnel to advise on desegregation-related issues.
In six of its seven budget requests, the Reagan Administration has
proposed zero funding for Title IV. Congress, however, has disagreed with
these budget recommendations and has funded the program at low but
minimally adequate levels. Congress appropriated $24 million in FY '82
through FY '86.

WOMEN'S MUCATIONAL EQUITY ACT (WEEA)
The Wolez,a's Educational Equity Act was enacted by Congress in 1974 to
help remedy discrimination against women and girls in the educational
system. Unlike Title IX, WEEA is not a civil rights statute; it is a
funding program. Under WEEA, grants and contracts are awarded each year
for the development, demonstration, and dissemination of model educational
equity products and programs. Public agencies, private nonprofit
agencies, organizations and institutions as well as individuals are
eligible for WEEA funding.
In 1981 the Reagan Administration rccommended that WEEA be
incorporated with other education programs in a block grant. Congress,
however, elected to maintain WEEA as a separate federal program. Since
that time, the Administration has proposed zero funding for WEEA and, in
ome years, has recommended a rescission of existing appropriations.
Congress has continued to appropriate funds for the program, although at
minimal levels
WEEA is currently authorized through FY '89 at authorization levels
ranging from $10 million in FY '85 to $20 million sn FY '89.
-38-

THE CARL D. PERKINS VOCATIONAL EDUCATION ACT
In 1976 Congress directed that federally-funded vocational education
programs eliminate sex bias and stereotyping. It also created a sex
equity coordinator position in each state to oversee state efforts to
reduce barriers for women and girls in vocational education programs. In
1984, Congress strengthened provisions for women and girls with the
enactment of The Carl D. Perkins Vocational Education Act. Every title of
the Act encourages states to support programs and strategies dealing with
sex equity issues. The Act also strengthens the sex equity coordinator
position and authorizes millions of dollars to be spent for training,
research, demonstration programs, and other services for homemakers,
single parents, and women seeking nontraditional jobs.
The fallowing setasides of funds for sex equity and programs with
specific provisions concerning women are included:
sex equity coordinator;
single parents and homemakers;
sex bias and stereotyping in nontraditional fields;
adult training, retraining, and employment development; and
career guidance and counseling.
There are also five "special programs" each with relevance to women
and girls which require separate annual appropriations by Congress. They
include the community-based organization program, consumer and homemaking
education, adult training/retraining, career guidance and counseling, and
the high tech industry partnership.

CRAFTER 1 OF THE EDUCATION CONSOLIDATION AND IMPROVEMENT ACT
Chapter 1 of the Education Consolidation and Improvement Act (formerly
Title I of the Elementary and Secondary Education Act) was enacted by
Congress to meet the needs of economically and educationally disadvantaged
students. It is the largest federal aid program for elementary and
secondary schools. Chapter 1 funds are directed to schools with the
highest concentration of students from low-income families. These funds
can be used for such purposes as salaries for teachers and aides working
with disadvantaged students, the purchase of special materials and
equipment to assist disadvantaged students, and training programs to
better prepare teachers serving students needing special assistance.
Chapter 1 funds are intended to provide extra help for children whose
academic performance is below that_of other children their age. These
funds should, therefore, not be used to supplant regular education funds.
Chapter 1 also includes funding for programs serving institutionalized
disabled children, neglected or delinquent children, and children of
migratory workers.

BILINGUAL EDUCATION ACT
In October 1984, Congress authorized the Bilingual Education Act as
Title II of the Education Amendments of 1984. The Act authorizes grants
for the following new types of rrograms:
Programs of Academic Excellence;
Developmental Bilingual Education (to help English proficient andlimited English proficient [LEP] students learn English awl a secondlanguage while mastering subject matter skills);
Family English Literacy (to help parents and adult relatives of LEPstudents learn English); and
Bilingual preschool, special education, and gifted and talentededucation.
The new law also allows set-asides for "Special Alternative Instructional
Programs" in which LEP students need not be given instruc*ion in their
native language.
Funds are awarded on a competitive rather than an entitlement basis.
The Act is administered by the U. S. Department of Education's Office of
Bilingual Education and Minority Language Affairs.
-40-

Who aforces/Administers
Federal Equity- Within U. S. Type ofRelated Law Purpose Dept. of bd. Statute Where Can It Be Found?
Title IX of theEducation Amendmentsof 1972
eliminatesex dis-crimina-tion ineduca-tion
Office for civilCivil Rights rights(OCR)
Title VI of the Civil eliminate OCRRights Act of 1964 race/na-
tionalorigindiscrim-ination
Section 504 of theRehabilitation Actof 1973
eliminate OCRdisabili-ty dis-crimina-tion
Education for All to ensureHandicapped Children appro-Act (PA. 94-142) priate
specialeducation& relatedservices
Title IV of theCivil Rights Actof 1964
encouragetechnicalassistance& trainingre: race,nationalorigin,sex equityissues
Women's Educational encourageEquity Act educa-
tionalequityfor women& girls
civilrights
civilrights
20 U.S.C. Sec. 1681-86
42 U.S.C. Sec. 2000d
29 U.S.C. Sec. 794
Office of quasi-arist- U.S.C. Sec. 1401,Special
il
Education rights/Rehabili- funding
tativeServices
Equity funding 42 U.S.C. Sec. 2000c,Training & et seq.TechnicalAssistanceOffice
Women's Ed- funding 20 U.S.C. Sec. 3341,ucationalEquity r_
Program
-42-
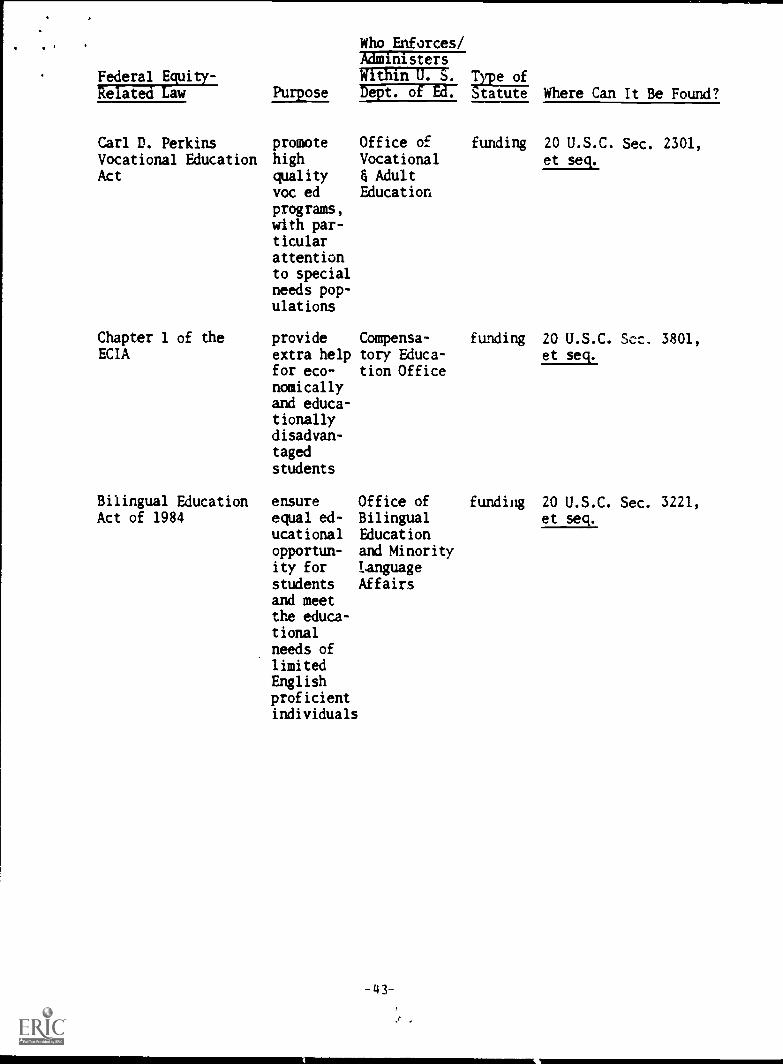
Federal Equity -
Related Law
Carl D. PerkinsVocational EducationAct
Who Enforces/AdministersWithin U. S. Type of
Purpose Dept. of Ed. Statute Where Can It Be Found?
promotehigh
qualityvoc edprograms,with par-ticularattentionto specialneeds pop-ulations
Office of funding 20 U.S.C. Sec. 2301,Vocational et seq.& AdultEducation
Chapter 1 of the provide Compensa- funding 20 U.S.C. Sec. 3801,ECIA extra help tory Educa- et seq.
for eco- tion Officenomicallyand educa-tionallydisadvan-taged
students
Bilingual Education ensureAct of 1984 equal ed-
ucationalopportun-ity forstudentsand meetthe educa-tionalneeds oflimitedEnglishproficientindividuals
Office of funding 20 U.S.C. Sec. 3221,Bilingual et seq.Educationand MinorityLanguageAffairs
-43-
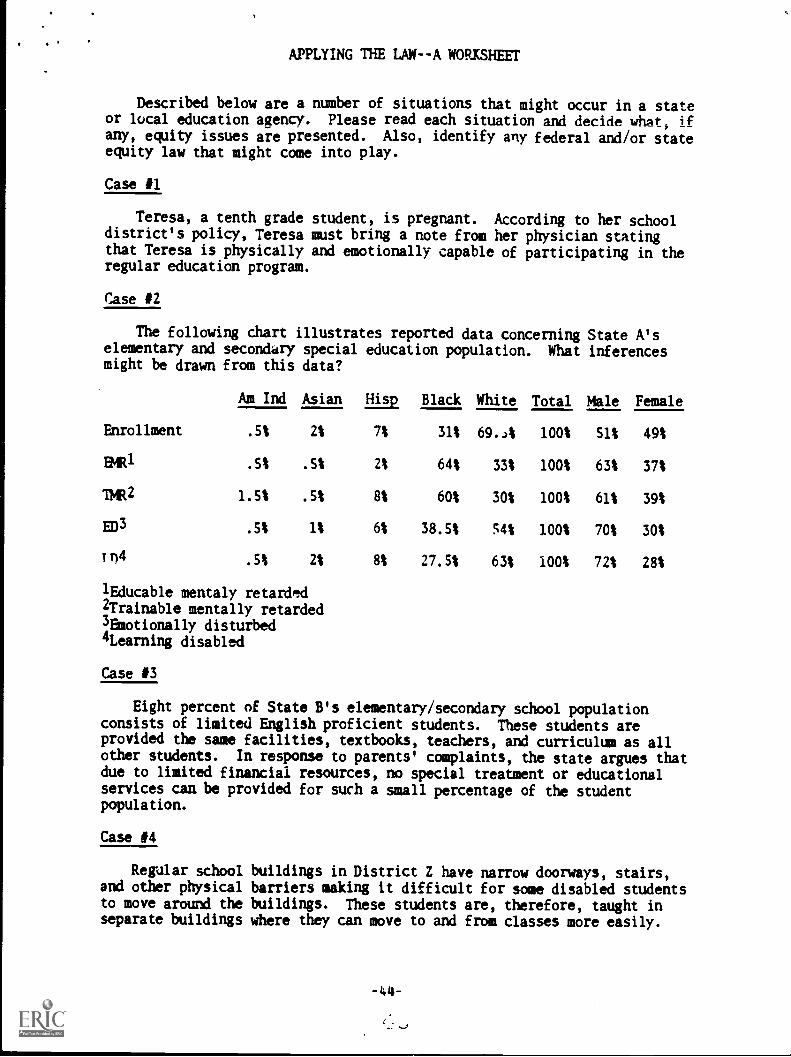
APPLYING THE LAW--A WORKSHEET
Described below are a number of situations that might occur in a stateor local education agency. Please read each situation and decide what, ifany, equity issues are presented. Also, identify any federal and/or stateequity law that might come into play.
Case #1
Teresa, a tenth grade student, is pregnant. According to her schooldistrict's policy, Teresa must bring a note from her physician statingthat Teresa is physically and emotionally capable of participating in theregular education program.
Case #2
The following chart illustrates reported data concerning State A'selementary and secondary special education population. What inferencesmight be drawn from this data?
Am Ind Asian Hasp Black White Total Male Female
Enrollment .5% 2% 7% 31% 69.J% 100% 51% 49%
EMR1 .5% .5% 2% 64% 33% 100% 63% 37%
TMR2 1.5% .5% 60% 30% 100% 61% 39%
ED3 .5% 1% 6% 38.5% 54% 100% 701 30%
.5% 2% 8% 27.5t 63% 100% 72% 28%
lEducable mentaly retarded2Trainable mentally retarded3Emotionally disturbed4Learning disabled
Case #3
Eight percent of State B's elementary/secondary school populationconsists of limited English proficient students. These students areprovided the same facilities, textbooks, teachers, and curriculum as allother students. In response to parents' complaints, the state argues thatdue to limited financial resources, no special treatment or educationalservices can be provided for such a small percentage of the studentpopulation.
Case #4
Regular school buildings in District Z have narrow doorways, stairs,and other physical barriers making it difficult for some disabled studentsto move around the buildings. These students are, therefore, taught inseparate buildings where they can move to and from classes more easily.
Case IS
Ms. Anderson believes she was illegally denied a promotion within theSEA. When she requests information concerning the SFAS' procedure forfiling a grievance, Ms. Anderson is told no such procedure exists.
Case 16
Susan, a fourteen-year-old, is adjudicated delinquent and sent to ajuvenile correctional facility for six months. Although she had receivedspecial education services prior to her adjudication, Susan has receivedno such services since entering the correctional facility. When Susan'sparents complain, they are told that due to a lack of resources, thefacility is unable to provide special education services for juvenilesconfined for less than one year.
APPLYING THE LAW--DISCUSSION GUIDE
The following issues should be addressed in discussing thehypothetical fact situations presented. Participants should al.;,_; Seencouraged to identify other issues as well as state laws and policiesthey believe are relevant to the hypotheticals.
Case #1
Under Title IX's regulations, such a physician's approval would beacceptable only if such approval is required of all students for otherphysical or emotional conditions requiring the attention of a physician.
Casein
In reviewing special education data, one should note whether anygroups are overrepresented or underrepresented in special educationcategories relative to their enrollment in the student populationoverall. For example, in the hypothetical data presented, blacks make up64% of EMR classes but only 31% of the overall student population. On theother hand, while females make up 49% of the overall student population,they are only 28% of LD classes. SEA staff reviewing this data shouldexplore why these discrepancies exist. Have biases, discrimination,and/or different expectations of teachers and other professionals whoidentify students as disabled resulted in the overrepresentation of somegroups and the underrepresentation of other groups in special education?
Case #3
The same basic issue was raised in the 1974 U. S. Supreme Courtdecision, Lau v. Nichols. The Court concluded:
Under these state-imposed standards there is no equality of treatmentmerely by providing students with the same facilities, textbooks,teachers, and curriculum; for students who do not understand Englishare effectively foreclosed from any meaningful education.
While the Court found that some type of special instruction fornon-English speaking students was required, it did not mandate a specificinstructional approach.
At the federal level, limited English proficient students' rights arecurrently protected by Title VI of the Civil Rights Act and the EqualEducational Opportunity Act.
Case #4
Section 504 of the Rehabilitation Act prohibits the placement ofdisabled students in separate facilities simply because the regular schoolbuilding has architectural barriers making it difficult for students tomove about easily. Accommodations (e.g., ramps; reassignment ofclassrooms) should be made to make the regular school building accessibleto all students. Section SO4 applies to prugrams and activities receivingfederal financial assistance.
46-
r

Case IS
The Title IX regulations require that recipients of federal financialassistance adopt and publish a grievance procedure providing for "theprompt and equitable resolution of student hnd employee complaintsalleging [violations of Title IX]". Each recipient must also designate atleast one employee to investigate complaints alleging noncompliance.Students and employees must be notified of the name, office, and telephonenumber of the employee(s) handling the complaint process.
Section 504's regulations also require recipients of federalassistance employing fifteen or more persons to establish a grievanceprocedure for resolving alleged violations of Section 504.
Case 16
The 1975 amendments to the Education of the Handicapped Act (P.L.94-142) were enacted to ensure all disabled children the right to "a free,appropriate public education". The reach of this legislative mandate doesnot stop at the correctional facility door. Rather, its regulationsspecifically state that the mandate applies to all political subdivisionsof the state that are involved in the education of disabled children,including state correctional facilitie_ Juveniles housed in correctionalfacilities are, therefore, entitled to the same special educationprotections guaranteed to other disabled youth served by state and localeducation agencies.
The regulations further provide that the state education agency isresponsible for ensuring the availability of special education servicesfor disabled youth, regardless of which agency actually provides theservices.

PERSISTENT INEQUITIES
-48--
r
PERSISTENT INEQUITIES.
Objectives:
1) To have carticipants cite examples of inequities in student (aridemployee) access to, treatment within, or benefits fromeducational institutions based on characteristics of race,ethnicity, sex, and disabling condition;
2) To have participants develop an awareness of present and emergingequity issues and concerns characteristic of fembles, racial andethnic minorities, and the disabled outside their respectiveequity area; and
3) To have participants identify inequities experienced by one ormore student groups in their state and propose a cooperativeapproach reflective of multiple equity areas (e.g., sex, race,national origin, disability) for addressing these inequities.
Procedure for Trainer:
In this chapter national data reflecting inequities in our nation's
schools are presented. Where appropriate, research is also presented to
provide a framework for the data and suggest directions for
interventions. Question inserts Lre provided to generate discussion and
help participants translate the general information presented to the
particular issues of their own state and equity area(s).
Where possible, data presented should be augmented with state and
local oaLa to create a more accurate picture of the discrimination and
inequities which persist. Also, where possible, data should be
disaggregated by sex within race, ethnicity, and disability in order to
illustrate within group disparities (e.g., court enrollment patterns for
white and nonwhite girls). Participants should be encouraged to identify
inequities common to the respective student groups and coapare and
contrast the respective strategies (including sources of funds) and
interventions used by equity specialists to address these inequities.
Finally, where persistent inequities exist, there is need to assess the
-49-

problem in light of the differential and compounding effect of
simultaneous group memberships. This term arises from the reality that
all people are members of one or more status groups.
Throughout, targeted and integrative approaches among equity
specialists should be promoted, The overall goal of the chapter is to
increase awareness of inter- and intra-group similarities and differences
and bring to bear the collective knowledge of equity specialists and
programs targeting students with extra educational needs.
Materials for Participant Activities:
These materials have been placed at the end of this chapter.
o Small Group Activity
Tables/Figures for Handouts or Projected Visuals
Table ... Labor Force Participation Rates of Women by Presence andAge of Children, Race, and Hispanic Origin, March 1985
Figure 1. Percent of Poor Children from Different FamilyBackgrounds
Table 2. Growth in Families Maintained by Women, 1970, 1980, and1984
Table 3. Medi,- Weekly Eari.1 ,,s of Fami' ds by Type, 1984 and 1980
Table 4. Educational Attainment of Householders in Families, March1984
Table 5. Average Weekly Laining, Fuli-Time, /t,..-Round Workers,Fourth Quarter, 1985
Table 6. Median Years of Schooling of Women in the Population andLabor Force, 1960-80
Table 7. Unemployment Rates, 1984
Table 8. Unemployment Rates by Race and Educational Attainment,1983
Table 9. Poverty Rates of Families by Race, 1983
-50-
r
PEFSISTENT INEQUITIES
Introduction
Over the past two decades great progress has been made in opening
access to and increasing equity in public education. Still, not everyone
gets the same chance to receive an adequate education. Dramatic
disparities continue to exist among students and employees because of
their race, ethnicity, sex, at..1 disabling condition in access to,
treatment within, and benefits from educational institutions.
Some of these disparities are the result of discriminatory practices,
either i-itentional or unintentional. Other inequities result from
nondiscriminatory factors or for unknown reasons. Whether the inequities
are illegal or not, they are probltns which urgently need to be addressed.
As important as education is for its own sake, the consequences of
inadequate education for adults and society as a whole are even greater.
While poor education cannot be held entirely responsible for the poverty,
underemployment, ill health, imprisonment, or unstable family situations
in which some adults find themselves, the facts show that groups suffering
most from inadequate eduutioh are more likely to suffer these conditions
as adults.
In this chapter, two types information are presented: 1) selected
social and economic background data on the status of women; and 2) data
which indicate inequities in our nation's public schools. Where possible,
effort is made to:
1) compare and contrast the relative status among women of differingracial, ethnic, And disability groups; and

2) assess the inequities experienced by different groups from theperspective of "simultaneous group membership."
(The litter term arises from the reality that all people are members of
one or more groups based on characteristics of race, sex, ethnicity,
disability, etc.) The data are presented to give equity specialists a
perspective on equity issues outside their own area of expertise and to
help identify areas and issues of common concern among equity areas.
Much of the education data comes from the Office for Civil Rights
(OCR) Elementary and Secondary School Civil Rights Survey. Since the
1976-77 school year, OCR has conducted this survey biannually in October,
although it was delayed beyond October in fall 1984. With the help of an
outside contractor, OCR made national projections using its 1980-81 and
1984-85 survey da.a. Since it has not made national projections with the
1982-83 survey data, the 1980-81 data remains a primary source. National
projections for some 1984-85 data became available shortly before this
manual went to press. Consequently, both 1980-81 and 1984-85 OCR data are
used.
A. Social and Economic Inequities Facing Women
In recent years, women have made advances in labor force
participation, educational attainment, and entry into a variety of careers
and occupations. Between 1947 and 1980, the number of women in the labor
force increased by 173% from 16.7 million to 45.6 million. By 1980,
greater than half of adult women worked compared to about one-third in
1950. The g'eatest increases in labor force participation have been among
women with preschool age children. (Bianchi and Spain, 1983)
-52--
Black mothers continue to be more likely than white mothers to be in
the labor force, but the gap has narrowed significantly and there is
little or no difference in labor force rates of black and white mother's
with school age children. The participation rates for Hispanic mothers
retrained well below those of whites and blacks. In 1985, the labor force
participation rates were 54%, 56%, and 50% for white, black, and Hispanic
women, respectively. (U. S. De-artment of Labor, Bureau of Labor
Statistics, September 19, 1985) (See Table 1, "Labor Force Participation
Rates of Women by Presence and Age of Children, Race, and Hispanic Origin,
March 1985.)
In 1984, the educational attainment of female workers (12.7 median
years of school) rivaled that of male workers (12.8). And although more
women workers (25 to 64 years old) have completed high school than men
workers, a greater proportion of men than women have college experience.
(U. S. Department of Labor, Women's Bureau, July 1985)
Finally, women in larger numbers than ever before are training and
working in vocations and professions which were largely all male a few
years before.
These accomplishments, however, have not been uniform for all women.
These accomplishments also suffer in comparison to the status of men on a
number of indicators. Also, where inroads have been made in minimizing
some of the longstanding inequities experienced by women, other inequities
have surfaced.
For example, female poverty is on the rise. Two out of three poor
adults are women as are 75% of the elderly poor. (League of Women Voters,
-53-

1984) Child poverty especially among female-headed households and ethnic
minorities is widespread. (Congressional Research service/Congressiona.
Budget Office, 1984) (See Figure 1, "Percelt of Poor Children From
Different Family Backgrounds.")
Though showing signs of decline since 1981, the rate of teenage
pregnancy in the United States is the highest rate in the developed
world. Adolescent parenting, especially for poor and minority girls, is
almost tantamount to poverty and limited educational attainment. Of the
1.1 million teen mothers in the U. S., over 670,000 have not finished high
school. (Teen Pregnancy, 1981) Pregnancy and/or marriage are major
reasons for dropping out of school among girls. In 1982, 52% of parenting
adolescents were single mothers and three out of four single mothers under
the age of 25 lived in poverty. Teenagers from low-income families, who
lark basic skills and have poor employment potential are espec.ally at
risk of single parenthood hence perpetuating the cycle of poverty and
limited educational attainment among their own children.
Because of the increased divorce rate, women have become more
dependent on their incomes, and their share of financial responsibilities
for children has risen. Between 1970 and 1984, the number of families
maintained by women increased 84%. Female-headed households, representing
10.3 million families accounted for 16% of all families. (See Table 2,
"Growth in Families Maintained by Women, 1970, 1980, and 1984.")
Among families maintained by women, 36% had incomes which placed them
below the U. S. poverty level. These families were three times more
likely than all families and five times more likely than married couple
families to be in poverty. (U. S. Department of Labor, July 1985) (See
-54-
Table 3, 'Nedian Weekly Earnings of Families by Type, 1984 and 1980.")
Characteristics of women workers who head families explain in part the
high incidehce of poverty in female-headed households. These
characteristics include: higher unemployment, lower educational
attainment, more dependent children, and lower earnings when compared with
other labor force groups. (U. S. Department of Labor, Women's Bureau,
July 1985) (See Table 4, "Educational Attainment of Householders in
Families, March 1984.") In 1983, black and Hispanic female heads of
household showed lower median earnings, lower median ages, lower labor
force participation rates, and higher II_ nployment rates than white vomen.
Although failure to attain a secondary education has negative economic
benefits for the individual and society, females who fail to attain a
secondary level education are more greatly impacted than similarly
situated males.
In 1982-83, 50% of all children in single female-headed familieslived in poverty when the mother had graduated high school. If themother had not completed high school, the proportion of children insingle female-headed households living in poverty was 81%.(Congressional Research Service, 1985)
In 1983, females who had completed four years of school earned anaverage 25% less than males with one to three years of high school($18,061 vs. $13,413). In fact, females with four or more years ofpostsecondary education had lower average earnings than the averageearnings of males who had only completed high school ($20,535 vs.$20,869). (U. S. Department of Commerce, 1983)
Among females 25-64 years of age, 61% of high school graduates, butonly 44% of nongraduates (i.e., with one to three years of highschool) were employed as of March 1985. For males, the differencesin employment status were less dramatic: 84% of male high schoolgraduates and 73% of male nongraduates were employed. ( U. S.Department of Labor, 1985)
For females, attainment of a high school diploma does not guarantee
equitable opportunities for success and employment. With less than a high
55-

. school degree, their chances are further diminished.
In spite of efforts to integrate the work place, women continue to be
concentrated in a narrow range of low-paying occupations. Among the top
ten jobs held by women--secretary, cashier, bookkeeper, registered nurse,
waitress, elementary school teacher, nursing aide, sales worker, sales
supervisor/proprietor, and typist--almost all are relatively low- paying.
In 1981, approximately 99% of all secretaries, 97% of registered
nurses, 84% of elementary school teachers, and 86% of librarians were
female. (Employment and Earnings, January 1984) In 1984, women continued
to be underrepresented in the higher paying professions and skilled
-rades, accounting for 161 of lawyers and physicians, 6% of engineers, S%
of machinists, 3% of mechanics and repairers, and 1% of plumbers. (U. S.
Department of Labor, Women's Bureau, 1985)
A recent study by Stanford University economist Victor Fchs
(Washington Post, April 18, 1986) notes that despite antidiscrimination
legislation and some gains in the labor market, women are no better off
economically than they were 25 years ago. According to the U. S.
Department of Labor, in 1984 women who worked full-time, year-round,
earned, on average, less than two-thirds of what men earned--a wage gap
that has not changed significantly over the last SO years. (A comparison
of the average weekly earnings of men and women by selected race for 1985
is Shown in Table S.)
Access to "nontraditional" jobs has been viewed as one method of
narrowing the wage gap between women and men, but data show that even when
men and women have similar occupations, women still receive lower wages.
-56-

Despite the present and historical realities of the wage gap and the
continued segregation of women in a narrow range of careers, recent
studies indicate that many college-going females do not acknowledge or
fully understand the barriers to their success in the world of work.
According to a study by Kansas State Professor Evelyn Hausmann of women
who have been in the work force for at least 10 years, "nost women
initially think they will be rewarded mainly on the basis of merit, but
many of them realize later on this is not true." Forty percent of college
women surveyed in a study by Anne Machung at the University of
'alifornia-Berkeley expected to earn as much as their partners, with 13%
expecting to earn more. (College Press Service, April 17, 1986)
Occupation segregation, gender, and wage discrimination continue as
barriers to economic independence for women and their families. For
minority and/or disabled women, racism and other biases further compound
these barriers.
Black Women. Although the median years of schooling for black women
has increased dramatically from 8.6 years in 1960 to over 12 years by
1984, black women have made only modest occupational gains. For them,
education has not necessarily proved to be an effective shield against
unemployment; a guarantor of access to the more preferred, high-paying
professions; or enhanced their employment position relative to white
women. (See "Comparison of Median Years of Schooling for Black and White
Women, 1960-80", Table 6.)
In 1984, the unemployment rate for adult black women was more than
twice as great as the unemployment rate for white women. For black female
teenagers, it was almost three times as great as for white female
57_
teenagers. Except for periods of recession in the early 1980s, the
unemployment rate for white women has declined since 1975, but the
unemployment rate for black females has continued to rise. (See Table 7.)
The greatest employment differences between black and white women are
found in the age groups with the smallest differences in educational
attainment. Moreover, the ratio of black to white unemployment rates
increases as education increases. Jones (1986) found that white women are
generally able to move into more desirable jobs with newer yea of
schooling than black women, and that black women with increased education
have more trouble moving out of undesirable ones. (See Table 8,
"Unemployment Rates by Race and Educational Attainment.")
Although the median income level for black women working full-time,
year-round in 1983 was almost comparable to that of similar white women
($13,000 compared to $14,677), great disparities persist in the incomes of
black families ($14,506) and white families ($25,757). This is in part
due to the disproportionately large number of female-headed households
among black families. (See Table 9, "Poverty Rates by Families, by
Race.")
Almost 43% of black families are maintained by women. Greater than
half (54%) of these families live in poverty and 47% of black children are
poor. (U. S. Department of Labor, Women's Bureau, July 1985) Elack women
who maintain families are less likely than whites to be in the labor force
and twice as likely to be unemployed. (U. S. Department of Labor, Bureau
of Labor Statistics, 1986)
Hispanic Women. As a group, Hispanic women in the United States are
-58-

. young, diverse, and many are economically at-risk. Their median age in
1980 was 23.8 compared to 32.9 for white women, 26.1 for black women, and
27.3 for other minority women. The Hispanic population is not
homogeneous. In 1980, the female Hispanic population in the U. S. was
comprised of Mexican Americans (59%), Puerto Ricans (14%), Cubans (6%),
and Hispanic women from the Caribbean, Central, and South America (22%).
(DeNavos and Fernandez, 1984)
According to Perez (1984), each subgroup has its unique
characteristics:
Cuban women tend to be older than other Hispanic women, bettereducated, and likelier to be employed.
Puerto Rican women are the youngest, the least likely to have aspouse present, the most likely to be the head of household, and themost likely to be unemployed or underemployed.
Mexican American women are slightly older than Puerto Rican women,less metropolitanized, and less educated.
Central American women are likely to be recent immigrants from ruralareas of war-torn countries, live alone or in non-family units, tobe undocumented, to have less education than the above mentionedgroups, and less likely to ask for assistance from government linkedprograms.
South Americans are more proficient in English, nave attained higherlevels of education, are likely to have entered the United Statesthrough immigration channels, and have greater representation in theskilled labor force than the above mentioned groups.
About 50% of Hispanic women were in the labor force in 1984 compared
to 54% for all women. (U. S. Department of Labor, Women's Bureau, 1985)
Conversely, unemployment rates for Hispanic women were almost 4% above
rates for all women. Labor force participation rates differed by ethnic
groups: Puerto Rican women had the lowest rate at 38%; Mexican American
women, 51%; and Cuban women, 55%. Although Hispanic women have lower
median years of school completed (11.4 years) than all women (12.6 years),
59-
the gap is closing due to higher attainment levels of young Hispanic
women. (Ibid.)
About 23% of Hispanic families are headed by women -more than half of
these families (54%) have incomes below the U. S. poverty level. The 1983
median income of Hispanic women with full-time, year-round jobs ($11,874)
was significantly lower than that of similar white women. However,
Hispanic women in professional occupations (likely to be Cuban) have
median incomes comparable to that of white women. (Ibid.)
Other Minoritylomen. American Indians and Asian and Pacific
Islanders represent a small but growing part of the female labor force.
Data are limited on these groups due to the relatively small size of their
numbers. They are very diverse and it is difficult to summarily
characterize each group.
For example, Japanese American women have high educational attainment
rates (almost 80% have completed at least high school) and low
unemployment rates. Approximately 40% were in the labor force in 1983.
Approximately 12% of Japanese American families are maintained by women.
Of this group less than 10% have incomes below the poverty level. Chinese
American women also have high education attainment rates--more than 67% of
women 25 years and older have completed high school. Although the
majority work, fewr than one-fourth are in the full-time, year-round
labor force. Fewer than 10% of Chinese American families are maintained
by women. (U. S. Department of Labor, Women's Bureau, July 1985) A 1980
U. S. Civil Service Commission report (Federal Women's Programs) found
that Asian and white women earned the highest wages compared to other
groups of women.
-60-
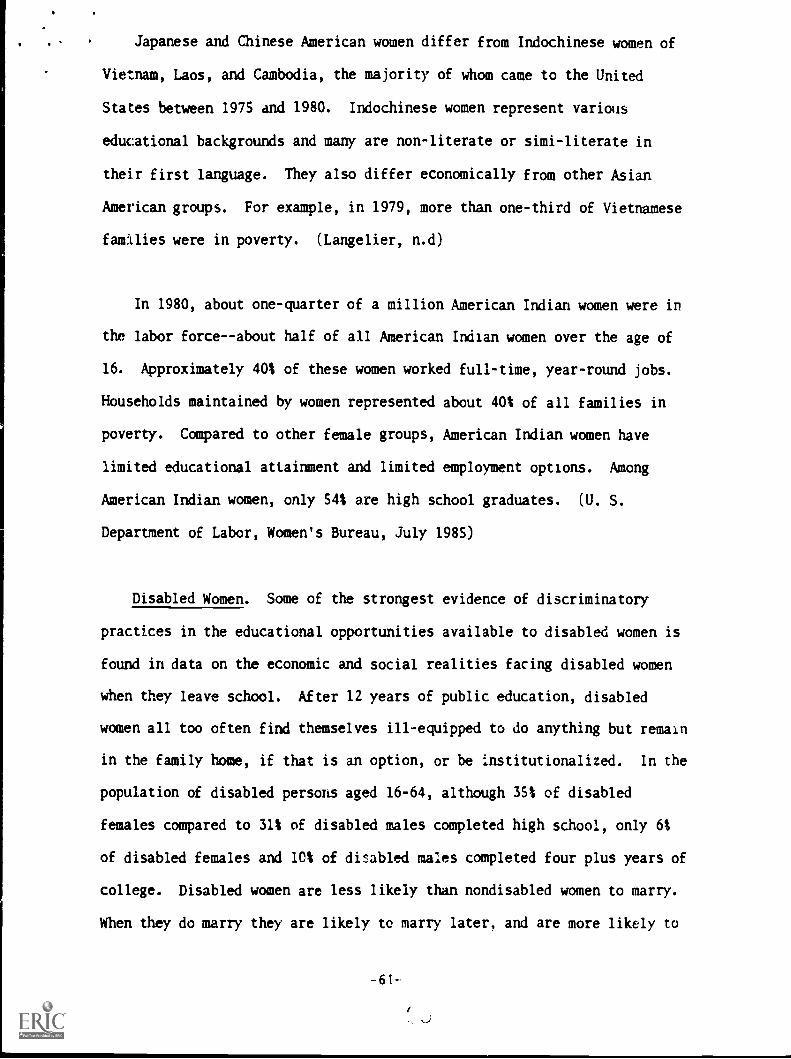
. . Japanese and Chinese American women differ from Indochinese women of
Vietnam, Laos, and Cambodia, the majority of whom came to the United
States between 1975 and 1980. Indochinese women represent various
educational backgrounds and many are non-literate or simi-literate in
their first language. They also differ economically from other Asian
American groups. For example, in 1979, more than one-third of Vietnamese
families were in poverty. (Langelier, n.d)
In 1980, about one-quarter of a million American Indian women were in
the labor force--about half of all American Indian women over the age of
16. Approximately 40% of these women worked full-time, year-round jobs.
Households maintained by women represented about 40% of all families in
poverty. Compared to other female groups, American Indian women have
limited educational attainment and limited employment options. Among
American Indian women, only 54% are high school graduates. (U. S.
Department of Labor, Women's Bureau, July 1985)
Disabled Women. Some of the strongest evidence of discriminatory
practices in the educational opportunities available to disabled women is
found in data on the economic and social realities facing disabled women
when they leave school. After 12 years of public education, disabled
women all too often find themselves ill-equipped to do anything but remain
in the family home, if that is an option, or be institutionalized. In the
population of disabled persons aged 16-64, although 35% of disabled
females compared to 31% of disabled males completed high school, only 6%
of disabled females and 10% of disabled males completed four plus years of
college. Disabled women are less likely than nondisabled women to marry.
When they do marry they are likely to marry later, and are more likely to
-61-

become divorced. (Bowe, 1983) Yet, little is done to enable them to
live, by choice or necessity, self-fulfilled, independent lives.
While disabled men and women both face discouraging employment
prospects, if the disabled individual is a woman, the prospects for
economic self-sufficiency are particularly grim. Wage discrimination
based on gender is further compounded by disability. Bureau of the Census
statistics for 1982 show the mean earnings for all workers in 1981 as
follows: nondisabled men, $17,481; disabled men, $13,863; and disabled
women, $5,835. (U. S. Department of Commerce, 1982) Women of color with
disabilities have even more distressing levels of unemployment and low
income. Most disabled persons, however, do not have jobs in the paid
labor force. In 1981, the percentage of work disabled men in the paid
labor force employed year-round, full-time was only 22.3%. This
proportion is three times that for work disabled women--a meager 7.4%.
(U. S. Department of Commerce, 1982) The plight of the disabled woman,
striving to realize her maximum potential as a productive, self-sufficient
individual, results in large part from a widespread attitude that although
the disabled man must become self-supporting, the disabled women will
somehow be cared for and protected. The statistics reveal a very
different reality for the disabled woman.
estion insert:
Given the persistent inequities detailed above, what strategies orinterventions can equity specialists employ to off-set theseinequities?
Identify a particular at-risk student population of femalestudents. How are their needs presently being addressed to avoidthe potential inequities they may face as adults?

B. Discrimination and Inequity in Elementary and Secondary Schools
1. Enrollment
In 1982, there were almost 45 million students enrolled in elementary
and secondary schools in the United States,
About 90% of these students were enrolled in public schools. (U. S.Department of Education, 1984)
In 1984, 29% of the public school students were minority--16t wereblack, 9% Hispanic, 3% Asian, 1% American Indian -and 71% werewhite.
Males were 51% of the students and females 49%.
Handicapped students were about 10% of the total. (OCR, 1986)
Among the major demographic trends impacting public education are
increases in minority student enrollment, particularly in large city
schools. Between 1970 and 1980, minority enrollment nationwide increased
from 21% to 27% of total enrollment. In 25 of the largest city school
systems, these increases were ever more dramatic: Boston, Denver,
Portland, San Diego, and Seattle doubled their proportion of minority
students; Atlanta, the District of Columbia, Newark, and San Antonio have
enrollments greater than 90% minority. (U. S. Department of Education,
1985) At present, half of the states have school populations which are
greater than one-fourth non-white. It has been projected that within the
next decade the public schools of as many as ten states will have
"minority majority" enrollments. (Hodgkinson, 1985)
School populations will show greater diversity. This diversity will
be reflective c,f the higher birth rates associated with Hispanics and
blacks and the wave of recent immigrants, most of Asian and Pacific Island
as well as Hispanic origin.
-63-

estion insert:
Is increasing racial and ethnic diversity in the schools a factor inyour state?
How will the increasing diversity affect your present sex, race,national origin, and/or disability equity program?
2. Racial and Ethnic Isolation
The push for school desegregation in the courts and ultimately by the
Executive Branch has continued through much of this century. However,
outside the south, progress has been modest. In parts of the country
racial and ethnic isolation is growing.
Most minority students in 1980 attended schools in which over half the
other students were also minorities.
In 1980, 65% of minority students--63% of blacks, and 68% ofHispanics--were enrolled in predominantly minority schools.
33% of minority studehcs, including 33% of blacks, and 29% ofHispanics were enrolled in schools that were at least 90-100%minority. (OCR, 1982)
However, many minority students--621--are in school districts whichare themselves predominantly minority. (OCR, 1982a)
Minority students are less isolated in some regions of the country
than in others.
Blacks are more likely to attend school with whites in the south.
Hispanic students are more likely to attend school with non-minoritystudents in the west and midwest. (Orfield, 1983)
Isolation of black students is decreasing in all regions of the
country except in the northeast.
-64-

In the south, the percentage of black students in schools with90-100% minority enrollments decreased a dramatic 55% between 1968and 1980.
In the border states, there was a 24% decrease; in the west, a 17%decrease; and in the midwest, a decrease of 14%.
In the northeast, the percentage of black students in schools with90-100% minority enrollments actually increased by 61 (Orfield,1983)
Isolation of Hispanic students is increasing in every region.
Over two-thirds of all Hispanics now attend school where over 50%of the students are minority.
In the country as a whole, the percentage of Hispania studentsattending schools with 90-100% minority enrollments increased almost6% between 1968 and 1980. This increase ranged from in thenortheast to 7% in the west, and 13% in the midwest. (Orfield,1983;
Question insert:
In your state approximately what percent of minority students attendpredominantly minority schools? Attend schools in districts whichare predominantly minority?
Is racial isolation increasing or decreasing in districts of yourstate? for which groups?
3. Enrollment and Experience in Programs and Courses in Elementaryand Secondary Schools
a. Mathematics and Science Courses
All students are taught .oath and science courses in the earlier years
of their schooling. In high school they have options about enrolling in
math and science courses. In these grades, differences in enrollment
patterns emerge which often affect postsecondary education options. In
1980, with the exception of Asian males, females and minorities were less
likely than white males to have - ompleted four years of math and two years
of physical science courses in high school.
-65-
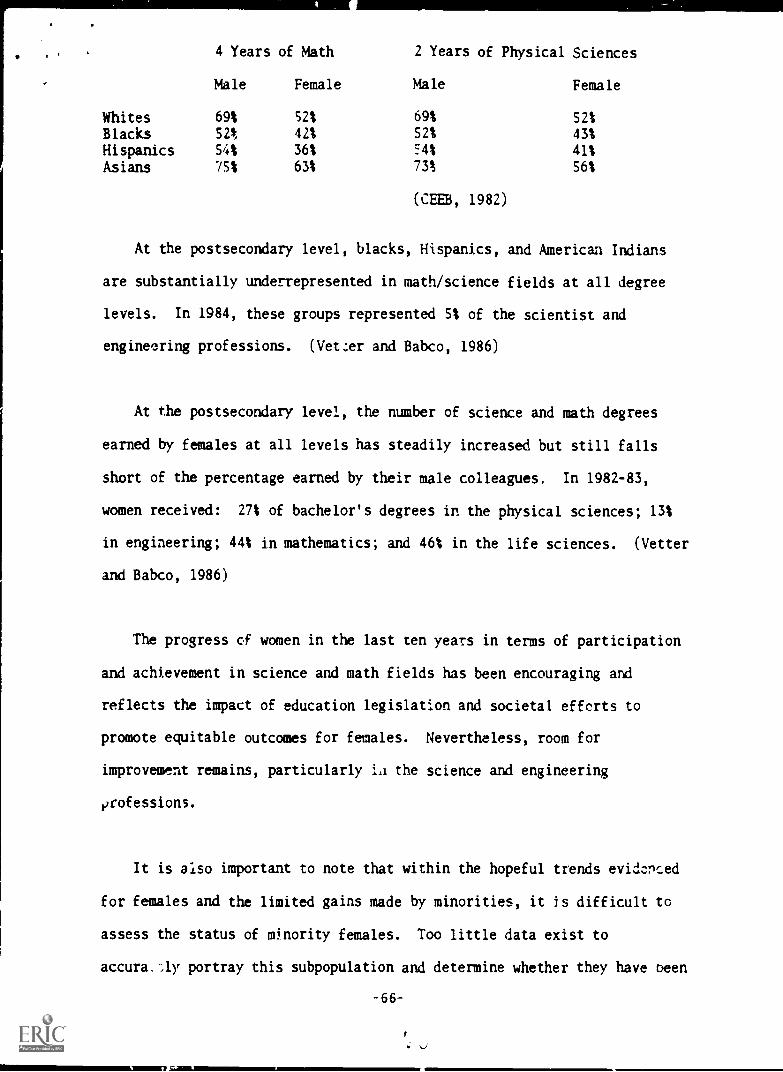
4 Years of Math 2 Years of Physical Sciences
Male Female Male Female
Whites 69% 52% 69% 52%
Blacks 52% 42% 52% 43%
Hispanics 54% 36% E4% 41%
Asians 75% 63% 73% 56%
(CEEB, 1982)
At the postsecondary level, blacks, Hispanics, and American Indians
are substantially underrepresented in math/science fields at all degree
levels. In 1984, these groups represented 5% of the scientist and
engineering professions. ( Vetter and Babco, 1986)
At the postsecondary level, the number of science and math degrees
earned by females at all levels has steadily increased but still falls
short of the percentage earned by their male colleagues, In 1982-83,
women received: 27% of bachelor's degrees in the physical sciences; 13%
in engineering; 44% in mathematics; and 46% in the life sciences. (Vetter
and Babco, 1986)
The progress of women in the last ten years in terms of participation
and achievement in science and math fields has been encouraging and
reflects the impact of education legislation and societal efforts to
promote equitable outcomes for females. Nevertheless, room for
improvement remains, particularly LI the science and engineering
grofessions.
It is also important to note that within the hopeful trends evil:,' ed
for females and the limited gains made by minorities, it is difficult to
assess the status of minority females. Too little data exist to
accura.:ly portray this subpopulation and determine whether they have Peen
-66-

' , propelled along with the general gains made by females or whether they
suffer from an interaction of sex and race which may severely inhibit
their access and achievement.
Research has shown a strong link between math courses taken and math
achievement, suggesting the necessity to participate in order to excell.
Efforts to impact low participation rates for females and minorities in
courses leading to technical and quantitative based careers should first
identify and eliminate barriers to participation.
The three most commonly identified factors influencing female and
minority participation rates in math and science are: 1) cultural
stereotyping of mathematics and science as "masculine" and as "white";
2) lack of student understanding, particularly among young women, of the
importance of mathematical training for postsecondary career options; and
3) sex and race stereotyped patterns of advice and guidance found in both
the school and the home. (Fox, et.al., 1980)
Further analysis shows the causes for underrepresentation to differ
for females and minorities. The key for females appears to be associated
with motivational and counseling factors which shift interests away from
sex atypical careers and the math sequences necessary for postsecondary
training in quantitative fields. According to Berryman (1983, p. 8), The
high schnnl tradition of offering more advanced mathematics as electives
interacts with women's lesser interests in mathematically-related
activities to foreclose these options to .hem."
For minorities, the causes of underrepresentation are ever more
varied. In addition to parental and student influencr!s, school-related
-67-
ri
. variables such as inadequate and segregated facilities, teacher quality,
high rates of placement in nonacademic tracks, and high suspension rates
factor into overall negative school experiences affecting not only course
taking patterns but the rete-tion in school. (Matthews, 1984; Valverde,
1984) For language minorities, linguistic and cultural differences are
additional barriers to participation in math and science courses and
ultimate success in school.
Clearly, if the national need for an increase in the number of
technically-trained workers and scientifically literate citizens is to be
met, specific efforts must be made to address the factors contributing to
the underrepresentation of females and minority males in scientific and
mathematical fields. It is an issue of demographics as well as a question
of equity; females are one-half of the population and minorities comprise
a disproportionate share of the nation's youth.
----WeFi=1 insert:
Are efforts underway in your state tc increase the participation offemales and minority males in upper level math and science courses?If efforts exist, describe.
Most elementary and secondary schools operate special programs for
children with extra educational needs. Such special programs exist for
limited English proficient students, students who are physically or
mentally disabled or otherwise eriucationally disadvantaged, and gifted and
talented students. Enrollment in these programs often follows patterns
based on race, ethnicity, and gender.

b. Bilingual Education Programs
In 1984, approximately 1,200,000 students in public elementary and
secondar schools were enrolled In language assistanc-, programs.
94% of these students were from minurity groups- -70% were Hispanic,19% Asian, 2% American Indian, and 1% black.
7% of these students were white. (OCR, 1986)
In 1980, approximately 935,000 students in public elementary and
secondary schools were identified by their school systems, in reports to
the federal Office for Civil Rights, as having limited English
proficiency.
Of these, more than 11% did not receive needed bilingual education.
Black students with limited English proficiency were less likelythan other such students to receive bilingual education assistance.(OCR, 1982)
However, reports to the Office far Civil Rights may under estimate the
number of limited English proficient children. Other recent U. S.
Department of Education studies indicate that more than 3.6 million school
age children cannot speak, understand, read, or write English
proficiently, because their native or home language is other than
English. Most demographic projections expect that number to continue to
increase throughout the rest of this century--by as much as 35%. (Evans,
1984)
The largest single group of limited English proficient (LEP) students
(approximately two-thirds), are Spanish speakers. Hispanics are the
fastest growing population in America with a birth rate higher than the
national avera.,e and a lower median age. Hispanic immigra-ion, illegal
and legal, continues at a high rate. All this will contribute to a likely
-69-

doubling of the Hispanic population in the United States by the year
2000. This dramatic Hispanic population growth will contribute to the
continued growth of the LEP student population. Indeed, 92% of the
Laril 2000 - .projected LILLcazc .is students by 4VVV Is projected LO be
Spanish-speakers. (CRS, p. 3)
Even without this explosive growth in LEP students, our nation's
public schools have been 'enable to meet the educational needs of language
minority LEP students. A Congressional Research Service (Evans, 1984)
report concluded that about two-thirds of limited English proficient
students appear to receive no special language services in their schools.
Consequently, it is not surprising that limited English proficient
students, in general, and Spanish speaking LEP students. in particular,
fall behind their peers academically early in school and remain behind.
Ultimately, they leave school without a high school diploma at a
disproportionately high rate and disproportionately suffer joblessness or
low-wage employment.
The problems of limited English proficient students are as complex as
they are serious. The LEP student population is not a homogenous group
sharing similar problems and requiring similar solutions. LEP students
enter school in this country at different ages. In addition to not
speaking English, recent immigrant students bring a wide range of levels
of previous education from their native countries. Disabilities requiring
special education programs are found at least as frequently among LEP as
non-LEP students. Students possess differences stemming from different
social, economic, aod cultural backgrounds. For example, an LEP student
from a middle lass family with professional parents and an adequate
education by the standard of his or her native country who enters the
-70-
. United States at age sixteen faces a very different set of problems than a
native-born six-year-old from a low-income family whose parents themselves
speak little if any English and who hears little English spoken by adults
iii ..4.UU...U...3A& us., vicLissauvassivuu.
The problems of LEP students do not begin and end with the need to
learn English. Special language services tailored to different needs are
necessary for LEP students. Additionally, LEP students are served in
programs targeted specifically to their language needs as well as in
compensatory, special, migrant, and vocational education programs designed
for a variety of students at-risk of school failure.
Question insert:
How are multiple educational needs of LEP students addressed inyour state?
Do SEA staff responsible for compensatory education, specialeducation, bilingual education, and/or English-as-a-second-language(ESL), vocational education, etc., col!abo:ate in servicing LEPstudents?
c. Special Education Programs
According to the Office for Civil Rights (19S6) there were an
estimated 3,944,000 disabled students enrolled in public elementary and
secondary schools in 1984--10% of the total public school Pnr,Illment.*
Approximately 3,708,000 of these public school students were enrolled
in special education programs for the disabled. Of these students in
special e'qcation:
* Another U. S. Department of Education office, the Office of SpecialEducation and Rehabilitative Services, reports several hundred thousandmore disabled students or 11% of the public school enrollment.
-71-

45% were enrolled in programs for students with a specific learningdisability;
27% were in programs for the speech impaired;
14% were in programs for the educable mentally retarded;
6% in programs for the seriously emotionally disturbed;
3% in programs for the trainable mentally retarded;
Males were greatly overrepresented in special education programs.
In 1984, for example, males accounted for 78% of the totalenrollment in programs for the seriously emotionally disturbed and71% of the total enrollment in programs for children with specificlearning disabilities.
Males were also mere likely than females to be enrolled in programsfor the educable mentally retarded, trainable mentally retarded, andspeech impaired.
The disproportionate representation of males is an indication of
possible sex bias in identification of handicapped students. Boys who
have been incorrectly "labeled" as in need of special services, may suffer
limitations in their educational development and carry the burden of a
incorrect label all their lives.
Bias in identification, however, may also limit the educational
opportunities of disabled women and girls who are, in fact, in need of
specialized services but do not receive them.
The educational opportunities of both male and female disabled
students are further limited by heavy sex role stereotyping in curriculum,
textbook3, and access to vocational education.
Inequities related to race and national origin are also at work in
both regular and special classrooms. Some groups of students appear to be

overrepresented in special education classrooms while other groups are
identified as in need of special services much less frequently than their
representation in the total school population would indicate. Minorities
were very in some special education programs.
In 1984, blacks were three times as likely as whites to be enrolledin programs for tne educable mentally retarded.
In 1984, minorities were more likely than whites to be classified aseducable mentally retarded (EMR) in al' regions of the country.However, the disparity was greater in some regions than in others.They were three or more times as likely to be placed in EMR classesin:
-- 9 of 11 southern states;
-- 2 of 7 border states;
-- 1 of 13 western states; and
-- 2 of northeastern states. (OCR, 1986)
Children with limited English proficiency (LEP) and migrant students
also appear less likely to be appropriately identified than are majority
students. Nationally, students classified as LEP repr'sent less than 2%
of placements in special education programs. (OCR, 198b) For migrant
students, access to services is further hampered by their mobility as well
as compounded by cultural an' linguistic differences.
Question insert:
In your state, are data on special education program enrcllmentsavailable for disability categories (e.g., educable mentallyretarded, traillable mentally retarded, speech impaired, learningdisabled) by race/ethnicity and sex within race?
From the available data on special education populations in yourstate, can you identify disproportionate representation of certaincategories of students?
-73-
4

d. Programs for the Gifted and Talented
In 1984, approximately 1,637,700 students in public elementary and
secondary schools were enrolled in programs for the gifted and talented.
Minority students nationwide were much less likely to participate in
programs for gifted and talented students than were honminorit) students.
For every 1,000 minority students enrolled in public schools in1984, 27 participated in gifted and talented programs, compared with48 participants per 1,000 white students.
Among minorities, American Indians participated at the lowest rate,20 per 1,000 enrolled, while Hispanics participated at the nextlowest, 21 per 1,000 enrolled. Blacks participated at a rate of 22per 1,000. (OCR, 1986)
In 1980, the greatest disparity in the participation rates occurredin desegregated schools which were 40-60% minority. In thoseschools, 19 per 1,000 minority students enrolled participated ingifted and talented programs compared with 51 per 1,000 whitestudents enrolled.
Regionally, the northeast had the greatest and most equitableparticipation rates at the school district level for minoritystudents in gifted and talented programs, followed by the west; thesmallest and least equitable participation rates were in the south.(OCR, 1982)
Nationally, in 1984, 521 of the students who participated in gifted
and talented programs were female. (OCR, 1986)
4. Educational Services, Benefits, and Treatment in Elementary and
Access to specific instructional as well as noninstructional services
and procedures can profoundly affect education outcomes for all students.
While additional study is being done on access to curriculum content and
teacher interaction with students, little comprehensive data are
available. New data are available about access to microcomputers.
Additional data below come from OCR surveys.
74-
a. Schools with Microcomputers
A majority of schools (53%) had a microcomputer by January 1983.
While 46% of public elementary schools had one or more computers, only 34%
of those in which minority students were a majority had computers, and
only 31% of low socioeconomic status (SES) schools had computers. Among
elementary schools with low SES:
those which were predominantly white used computers more often to doprogramming activities;
and those which were predominantly minority used computers moreoften for drill and practice activities;
predominantly minority schools report intensive use of computers bybelow-average students and predominantly white schools reportintensive use by above-average students;
predominantly white schools are more likely than predominantlyminority schools to have a teacher on their staff personallyknowledgeable about computers. (Center for Social Organization ofSchools, 1983)
Course enrollment patterns are also found to affect confuter access.
Female and minority students enroll in fewer %umbers than white male
students in upper-level elective programming courses--courses critical to
certain postsecondary training and technical careers. Computer access is
further complicated by peer pressures, stereotyped cultural norms, and
limited female and minority role models available in textbooks, magazines,
and advertisements. ("A Concern About Computer Equity," June 1984)
Access to computer technology provides opportunities for developing
both critical thinking and problemsolving skills associated with computer
use and computer related job skills which may be required in the future.
Inequities based on disparities in economic resources available to schools
and districts, differential access to computers by students within
-75-

. schools, or differential use of computers by diverse school populations is
an equity issue affecting educational outcomes for students.
Web 61U11
How do differential access and use of microcomputers affect studentoutcomes?
If differential access and use are problems in your state, what isbeing done to address this problem?
In your state does the distribution or use of microcomputers favorany particular groups?
b. Physical Accessibility to Schools and Classrooms
In 1980, 70% of all public elementary and secondary schools had
entrances accessible to the disabled. An estimated 34,400 students in
public elementary and secondary schools were confined to wheelchairs.
51% of ali public schools had at least one handicapped-accessiblerestroom for each sex.
Only 21% of public schools had at least one accessible science labfer each science course offered. (OCR, 1982)
c. Treatment of Students Who are Disobedient or Disrtrtive
Maintenance of discipline and order in schools is an important element
in providing quality education. However, substantial disparities exist in
the treatment of students who are disobedient or disruptive. The
consequences are especially severe if exclusionary discipline--suspension
or expulsion--is used, because the denial of education is the punishment.
Boys are more likely to be disciplined thaAL
76-
In public elementary and secondary schools, in 1984, boys were morethan twice as likely to be expelled or suspended from school asgirls.
They were almost four times as likely as girls to be corporallypLmished (nCR, 1986)
Blacks are more likely to be disciplined than whites.
In 1984, blacks were suspended from public schools at more thantwice the rate of whites.
Blacks were also more likely to receive corporal punishment thanwhites or other minority students. Fifty-nine per 1,000 blackstudents enrolled were corporally punished in 1984, compared with 30per 1,000 white students enrolled. (OCR, 1986)
Other minority groups are punished less frequently than blacks.
American Indians and Hispanics are punished at roughly the same rateas whites.
Asians were the least likely group to be disciplined in any way.(OCR, 1986)
Disparities in discipline vary by region which can be seen in Officefor Civil Rights data for 1980.
Susprnsion:
In the northeast, 104 black students were suspended per 1,000enrolled in public elementary and secondary schools in 1980; in thewest, the suspension rate for blacks was 110; while in the midwest,the rate was 117. In the south, 76 black students per 1,000 blackstudents enrolled were suspended.
Forty-three white students per 1,000 were suspended from publicelementary and secondary schools in the midwest in 1980; thesuspension rate for whit in the west in 1980 was 44; in the south,45; and in the northeast, 51. (OCR, 1982)
Corporal Punishment:
Of all regions in t: country, the south evidenced the greatestcorporal punishment rate for black students in 1980; however, italso had the greatest corporal punishment rate for whitestudents--97 black students per 1,000 black students, and 73 whitestudents per 1,000.
The largest proportional disparity in the corporal punishment rate,as with the largest proportional disparity in the suspension rate,was found in the midwest. The least disparity, and the smallestcorporal punishment rates overall, were found in the northeast. Thecorporal punishment rate for black students in the midwest was 36.5,almost twice the rate of 18.8 for white students. In the west, therate for blacks was 13.5, compared to 8.5 for whites. In thenortheast, the black rate of 2.9 was very close to the white rate of3.7.

Minority suspension rates are generally higher in desegregated
schools. In 1980, the number of minority students suspended per 1,000
minority students enrolled in public schools was:
102 in schools 20-40% minority;
95 in schools 40-60% minority; and
89 in schools 60-80% minority.
as compared with:
74 in scnools 0-20% minority; and
62 in schools 80-100% minority. (OCR, 1982)
Question insert:
Has your state documented disparities in suspension or expulsionrates by sex, race, or ethnicity?
If yes, how has this issue been addressed?
d. Extracurricular Activities and Participation in SchoolSports Activities
Extracurricular activities are widely recognized as important elements
in the educational experiences of most students. Participation rates by
sex in many extracurricular activities are roughly similar, with the
exception of activities such as cheerleading, dance, and chorus which are
dominated by females and sports activities which are dominated by males.
The extracurricular activity in which the greatest number of students
participate is athletics. Significant differences occur by sex in
participation in athletics.
Among 1980 high school seniors, a much greater percentage of boys(471) than girls (24%) participated in varsity sports. (NCES 1981)
In 1982-83, 35% of the more Lhan 5.1 million high school athleteswere women. (NFSHSA, 1983)
-78-

S. Vocational Education Programs
a. General Enrollment
Secondary Schools. In 1979, over 10 mill n students were enrolled in
secondary school vocational e'hication programs, representing approximately
60% of the enrollment in vocational education at all levels across the
country. Secondary school vocational programs were offered at
comprel,nsive high schools, junior and community colleges, and area
vocational centers. Enrollment in these schools was broken down by race,
nacional origin, sex as follows:
AmericanWhite Black Hispanic Asian Indian Total
Male 34% 8% 3% 1% 1% 47%Female 38% 10% 4% It 1% 54%
Total 72% 18% 7% 2% 2% 101%
(OCR, 1982b)
Disabled stuaents were 3% of the enrollment. (OCR, 1982b)
Postsecondary Schools. Over two million students in 1979 were
earolled in postsecondary vocational education programs offered at junior
and community colleges, area vocational centers, and a few comprehensive
high schools. Most of these Ildents were enrolled in vocational programs
at junior or community colleges. Of these students, approxii...Lzly:
79% were white - -40% male, 39% female;
11% were black - -5% male, 6% female;
6% were Hispanic--3% each, male and female:
3% were Asian--2% male, 1% female; ALA
7 9-
t

1% were American Indian--divided equally between males and females.(OCR, 1982b)
Thirty percent of minority students in vocational education programs
at juninl nr rnmminity rnllpgpc were in inctititinns 14"*. were 601 or more
minority. (OCR, 1982b)
Area Vocational Education Centers. Over one-half million. students
were enrolled in secondary or postsecondary career vocational centers in
1979. Of these students, approximately:
84% were white--51t male, and only 33% female;
10% were black -- ,squally divided between male and female students;
4% wr Hispanic--also equally divided sex; and
1% each were Asian or American Inaian. (OCR, 1982b)
Males accounted for 60% of the total enrollment in area vocational
education centers. Disabled students were 5% of the enrollment in these
schools. (OCR, 1982b)
b. Course Enrollment
White males, in 1979, were enrolled in disproportionatley higher
numbers of those vocational education programs that lead to higher paying
jobs. Minorities and women were enrolled in such programs much less
frequently. Few disabled students were in vocational educatioh programs
at all.
Females were a slight majority--actually 50.4%--of the enrollment in
all secondary and postsecondary vocational educatiot programs. However,
women constituted 851 of all students enrolled in healthcxxupations, 82% of stufts in home economics, and 74% of studentsin "office" programs;
women were only 191 of all students enrolled in "technical"secondary and postsecondary vocational education programs (and only6% of thnce in technical apprentice training programs);
only 18% of the students enrolled in all "trade and industrial"vocational education programs were women. (OCR, 1982b)
Minority students made up 241 of the vocational education enrollment
at all levels in 1979. They were:
311 of the enrollment in home economics courses taught as secondaryor postsecondary programs;
only 19% of the enrollment in technical programs at the secondary orpostsecondary level. (OCR, 1982b)
Some disporportional enrollment patterns occurred by rare and sex.
While black males were 7% of the total secondary and postsecondaryvocational education enrollment, they made up 44% of the enrollmentin masonry.
Black females were 81 of vocational education enrollment but made up27% of the enrollment in clothing unnagement; 18% in all homeeconomics courses (including clothing management); 15% of filing andgeneral office programs; and ls% of cosmetology. (OCR, 1982b)
c. Work-Study, Cooperativ^ Education and Apprentice TrainingPrograms
Minority participation, in 1979, was relatively low in apprentice
training and cooperative education programs offered at comprehensive high
schools and area vc,ational education centers. Minorities were equitably
represented in these programs in junior and community colleges.
Minority students were overrepresented at all levels in work-study
programs, which are wore associated with training leading to much lower
paying jobs than apprentice training or cooperative education programs.
Women were severel" underrepresented in apprentice training programs:
-8i-

At comprehensive high schools, though 53% of the total vocationalenrollment, women were only 1C.% of the enrollment in apprenticetraining programs.
In area vocational centers, where they comprised 40% of theenrollment, women were 4% of the enrollment in apprentice trainingprograms.
In junior or community colleges, women were SO% of vocationaleduc..tion enrollment and only 7% of the enrollment in apprenticetraining programs. (OCR, 1982b)
Many disab7ed students could and should benefit from appropriate
vocational education programs, but their enrollment in vocational
education remains very low. While access to vocational opportunities is
fairly restricted for disabled students in general, it appears to be
further restricted for disabled females. (CCSSO, 1986)
Information on disabled students in a work-study program was collected
for a 1978 study by Danker-Brown, et. al. on sex bias in vocational
programs. The program was 71% male and 29% female. All students received
about the same amount of inotruction, but it was "qualitatively different"
in a way consistent with traditional sex role stereotypes:
females were trained for jobs in service occupations;
males were prepared for a more diverse range of occupations; and
women were prepared for jobs with fewer working hours and lowerwages.
The authors of the study concluded that school personnel may guide
students into various training programs based on their own conceptions of
appropriate male or female career goals.
-82-

Question insert:
What patterns of vocational education course enrollment exist inyour state for females? minorities? the disabled?
What is being done to encourage participation of underrepresentedgroups in nontraditional vocational courses and apprenticeshipprograms?
6 School Dropouts
School cropition rates vary greatly among students from different
socioeconomic backgrounds, racial/ethaic groups, high school programs
levels of achievement, type of schocl attended, regions of the country and
communities. Among students who were sophomores in 1980, but left school
prior to graduation, the dropout rate was:
22% for students in the lowest socioeconomic status (SES) quartile,but only 7% for those in the highest quartile;
13%, 17%, and 19% for whites, blacks, and Hispanics, respectively;
lowest for students in academic high school programs (6%) and higherfor students in general (17%), and vocational programs (20%);
25% for students in the lowest test-score quartile compared to 4%for students in the highest quartile;
18%, 13%, and 14% in urban, suburban, and rural communities,respectively; and
roughly 12% in the Northeast and North Central regions, but almost17% in the South and West. (U. Department of Education, 1985)
Race and SES have bead found to be the most important predictors of
dropping out of school. For whites, the oropout rate decreased as SES
increased such that in the lowest SFS quartile, whites had significantly
higher dropout rates than blacks (2i% vs. 18%). (Ibid.)
For Hispanics, ethnicity apart from income level and language
background have been found to tie important factors. Among Hispanics,
-83-

. Puerto Ricans have a 23% dropout rate followed by Mexican-Americans (21%)
and Cubans (20t). Hispanics who were bilingual but spoke primarily
English in the home had lower dropout rates than those who spoke Spanish
in thee beme. (Ibid.)
Disabled students graduate at a far lower rate than nondisabled
students. In 1980, although constituting 8% of total public elementary
and secondary school enrollment, handicapped students represented only 2$
of those graduating from high school. (OCR, 1982)
Question insert:
Does your state collect dropoutlevel, and disability?
Have intervention programs beencategories of dropouts?
data by sex, race, ethnicity, income
develc,ped targeting specific
7. Role Models
The educational aspirations of students, in elementary and secondary
schools especially, are strongly affected by the role models students
perceive in the adults with whom they come in contact and in curriculum
materials. Elementary and secondary students--unless they are white
males--often lack effective role models within the public elementary and
secondary school system.
Maid educators are more likely to be higher paid administrators and
women to be lower paid teaches and tachers' aides.
In 1981, more than 76% of public elementary and secondary schoolofficials and administrators were male, as were 84% of schoolprincipals air assistant principals. (AASA, 1982)

Twice as many women as men, however, were employed as classroomteachers. (NCES, 1T83)
Minorities and women are especially underrepresented as school
cnnaintehrviante
In 1981, white males were 97% of all school superintendents.
White females, black males, and Hispanic males each accounted for 1%of the superintendents. (AASA, 1982)
Minorities and women are only somewhat less underrepresented as school
principals.
In 1981, white males were 75% of all school principals.
White females made up 11% of the principals.
Black males accounted for 5% of the principals.
Three percent of the principals were Hispanic males or blackfemales. (AASA, 1982)
In 1916, at. the state level there were six female chief slate school
officers among the SO states and the District of Columbia,
Question insert:
In your state what proportion of administrators are female? a
minority (male/female)?
Do you have data on the hiring, promotion, assignment, andcertification of female: and Minorities?
Note to Trainer: The Small Group Activity should be conducted at theconclusi( of this chapter.
-85-
Persistent Inequities--Small Group Activity
For this activity, divide the large group into several small units.Have each unit select one or two of the "Persistent Inequities" listed ontho. attached page. For each "inequity" cal,-,-teA.
1. cite one or more s ecific exam les of this inequity as it ismanifested in educations -'ttings;
2. identify a group for which the inequity has a disproportionatelynegative impact;
3. cite what, if anything, is being done to remedy the problem; isAd
4. develop a strategy for how equity specialists can work toeliminate this persisting inequity.
Appoint a recorder and someone to report back to the large group.Allow units 20-30 minutes to deliberate.
-86-
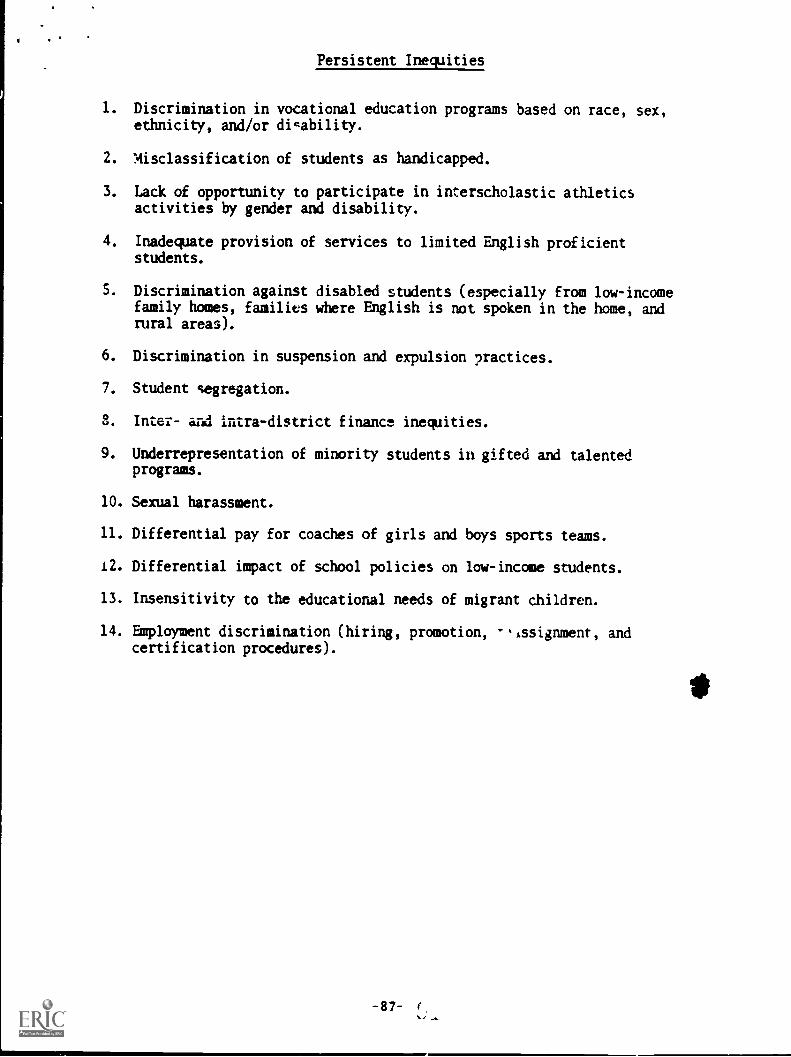
Persistent Inequities
1. Discrimination in vocational education programs based on race, sex,ethnicity, and/or disability.
2. Misclassification of students as handicapped.
3. Lack of opportunity to participate in interscholastic athleticsactivities by gender and disability.
4. Inadequate provision of services to limited English proficientstudents.
5. Discrimination against disabled students (especially from low-incomefamily homes, families where English is not spoken in the home, andrural areas).
6. Discrimination in suspension and expulsion practices.
7. Student segregation.
S. Inter- and intra-district finance inequities.
9. Underrepresentation of minority students in gifted and talentedprograms.
10. Sexual harassment.
11. Differential pay for coaches of girls and boys sports teams.
12. Differential impact of school policies on low-income students.
13. Insensitivity to the educational needs of migrant children.
14. Employment discrimination (hiring, promotion, assignment, andcertification procedures).

TABLES

Table 1Labor Force Participation Rates of Womeh uy Presence and Age of
Children, Race, and Hispanic Origin, March 1985
Presence and Age of Children 1985Race ane. Hispanic Origin
TOTAL
Total 54.5No children under 18 years old 50.4With children under 18 years old 62.1
Children 6 to 17 years old, none younger 69.9Children under 6 years old 53.5
Children 3 to 5 years, none younger 59.5Children under 3 years old 49.5
WHITE
Total 54.2
No children under 18 years old 50.3With children under 18 years old 61.8
Children 6 to 17 years old, none younger 69.8Children under 6 years old 52.8
Children 3 to 5 years, none younger 58.4Children under 3 years old 49.2
BLACK
Total 56.1
No children under 18 years old 50.4With children under 18 years old 64.2Children 6 to 17 years old, none younger-- 70.9Children under 6 years old 57.6
Children 3 to 5 years, none younger. 64.1Children under 3 years old 52.2
hISPANIC ORIGIN
Total 50,4
`o children under 18 years old 50.2With children under 18 years old 50.6
Children 6 to 17 years old, none younger 58.5
Children under 6 years old . 44.2Children 3 to 5 years, none younger 46.6
Children under 3 -:cars old 42.7
TEdiTer U. S. Department of Labor, Bureau of Statistics, News, 85-381,September 19, 1985.

Figure 1
PERCENT OF POOR CHILDREN FROM DIFFERENT FAMILY BACKGROUNDS
PERCENT OFPOOR CHILDREN
80
70
60
50
10
30 27.323 8
20
11 9
10
0
Male- PresentHouseholds
FAMILYRACE / ETHNICITY
WHITE
BLACK
HISPANIC
45.1
Female HeadedHouseholds
TYPE OF HOUSEHOLD
Al Households
FIGURE READS. 'Among all Whits children Irving in households with an adult mala present, 11.9 peliens ampoor. Among ail Black children living in households with an adult male preset'', 23 8 percentare poor
Congressional Research Service/ Congressional Budget Office, Chkiten an Pcverty. Commoico onWays and Means, U S Rouse of Reprobentalives, 1985. Page 31.

Table 2Growth in Families Maintained by Women, 1970, 1980, and 1984
(Numbers in Thousands)
WhiteNumber Percent
of of allYear families families
BlackNumber -Percent
of of all
families families
His anic*Number Percent
of of all
families families
1970 4,185 9.1 1,349 28.3 ** **
1980 6,302 11.6 2,495 40.3 637 21.81984 6,779 12.6 2,889 43.3 816 23.0
**Persons OrflisiiiREF7R7577grEFOTNo data available.
any race.
out . epartment of bor, omen s ureau, Facts on . . or.trig
Women, Women Who Maintain Families, Fact Sheet N. n-2, July1985.

tTable 3
Median Weekly Earnings of Families, by Type(Quarterly Averages)
Type of Family
FourthQuarter1984
FourthQuarter1980
Total families with earners $513 $417Married-couple famAies 568 445
Families maintained by women 290 225
Families maintained by men 450 380
Source: 1J. S. Department of Labor, Women's Bureau, "Women Who MaintainFamilies," Fact Sheet No. 85-2, July 1985.
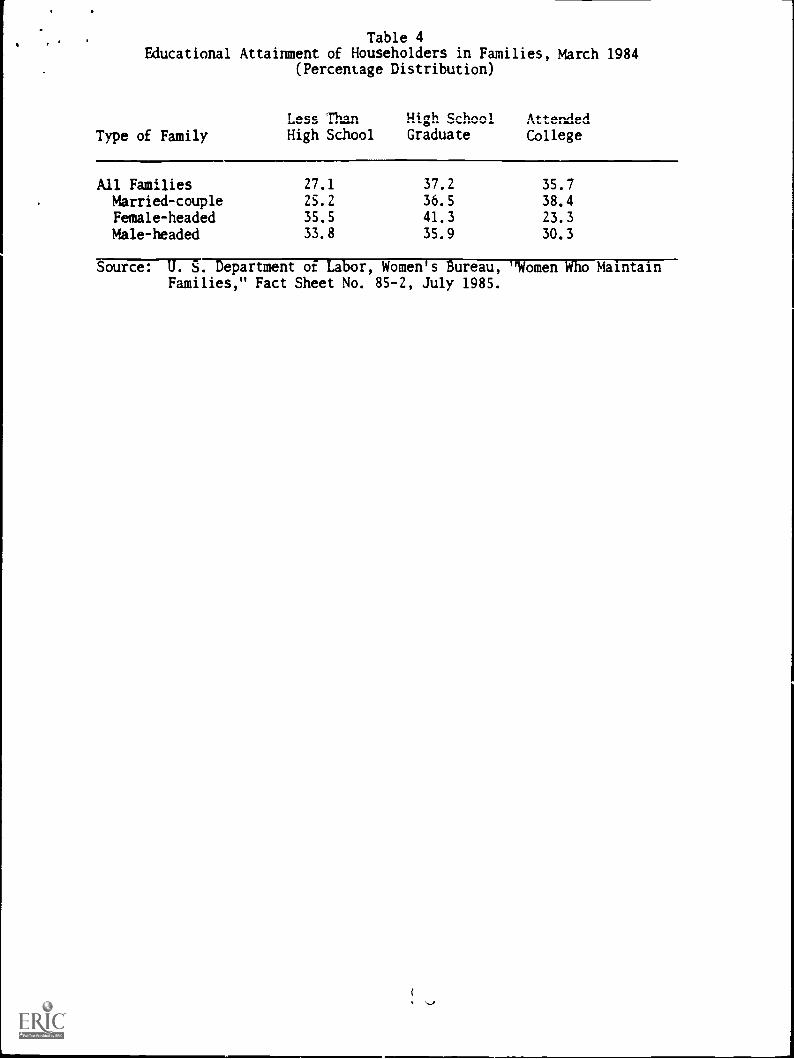
Table 4Educational Attainment of Householders in Families, March 1984
(Percentage Distribution)
Less Tha n High qch^^1 AttendedType of Family High School Graduate College
All Families 27.1 37.2 35.7
Married-couple 25.2 36.5 38.4Female-headed 35.5 41.3 23.3
Male-headed 33.8 35.9 30.3
source: U77. Department of Labor, Women's Bureau, "Women Who MaintainFamilies," Fact Sheet No. 85-2, July 1985.

Table 5Average Weekly Earning, Full-Time, Year-Round Workers
Fourth Quarter, 1985
All
Races White Black Hispanic
MenWomen
$413 $424 $307 $299$283 $287 $255 $231
source: I. 5. Department o r, Bureau $% Labor tatistics, in eagueof Women Voters Education Fund, "Women in Job Training," January1986.

Table 6Median Years of Schooling of Women in the Population
and Labor Force, 1960-80
PAp, 12t i AnBlack White
Lahnr Fnrre
Black White
1960 8.6 11.2 9.4 12.2
1970 10.2 12.2 12.1 12.:
1975 11.1 12.3 12.8 12.5
1980 12.0 12.5 12.4 12.7
Source: U. S. PPpartment of Commerce, Bureau of the Census, StatisticalAbstract of the United States (1981), p. 42; U. S. Department ofLa r, Handbook of Labor Statistics, (June 1985), pp. 166-168.

Teenagers* Rate
Table 7Unemployment Rates,
Adults**
1984
Rate
Black men 42.7 Black men 14.3
Black women 42.6 Black women 13.5
White men 16.8 White men 5.7
White women 15.2 White women 5.8
* lo-i9 years of age** 20 years of age and over
Source: U. S. Department of Labor, Fact Sheet No. 85-6, July 1985.

Table 8Unemployment Rates by Race and Educational Attainment
Black
198311/w
RatioWhite
ElementaryLess than 5 (b) 13.5 --
5 to 7 years 16.2 16.1 1.008 years 17.0 15.4 1.10
High School1-3 years 27.6 18.0 1.534 years 20.8 8.1 2.56
College1 to 3 years 16.0 5.4 2.964 years 9.4 3.8 2.475 years or more 2.9 3.2 .90
(b) Data not shown where base is less than 75,000.
MTF ucationa Attainment of Workers,"various issues, 1972-1981.
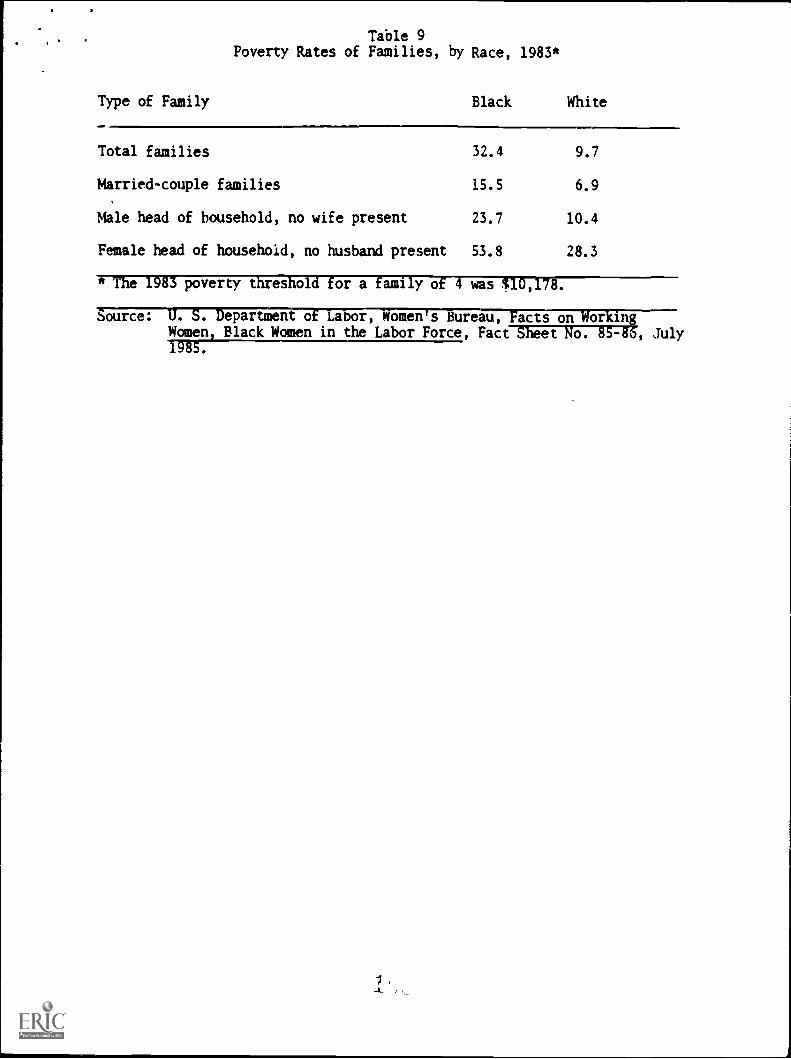
Table 9Poverty Rates of Families, by Race, 1983*
Type of Family Black White
Total families 32.4 9.7
Married-couple families 15.5 6.9
Male head of household, no wife present 23.7 10.4
Female head of household, no husband present 53.8 28.3
ne poverty tares o or a ami y was 78.
source: . Iepartment o a or women s ureau, Facts on ^or mgW2menillacklomen in the Labor Force, Fact Sheet No. 85-86, July1313---------

INTEGRATING EQUITY CONCERNS: A COLLABORATIVE APPROACH
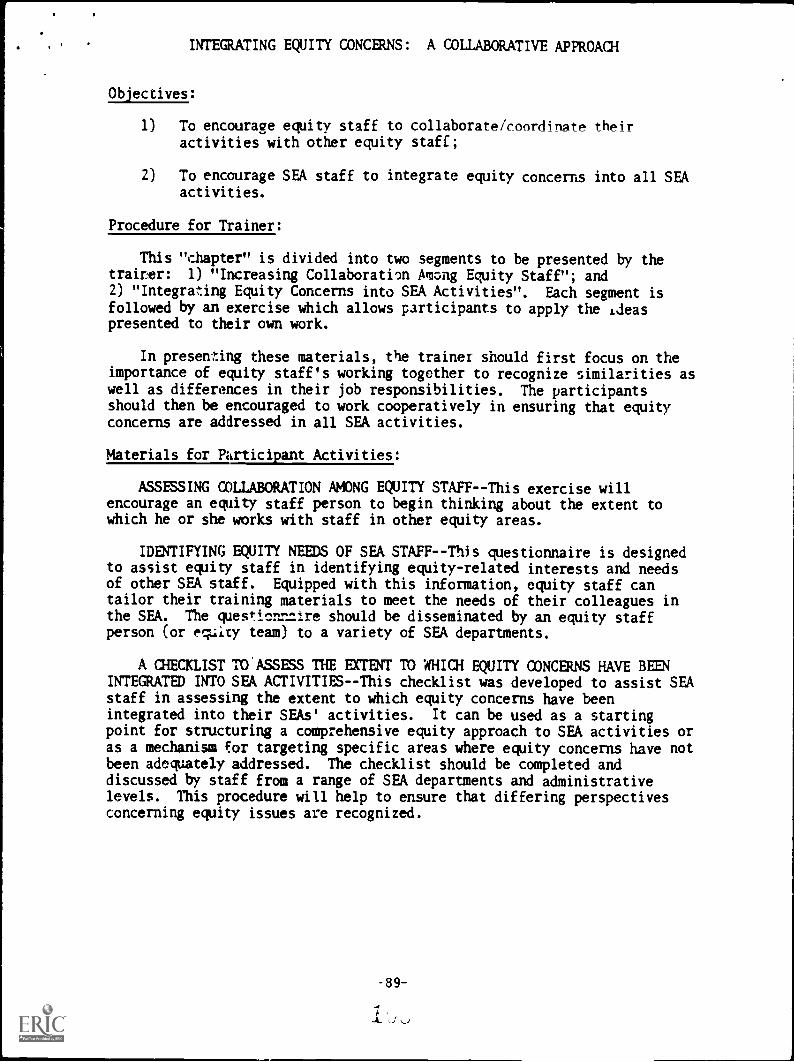
INTEGRATING EQUITY CONCERNS: A COLLABORATIVE APPROACH
Objectives:
1) To encourage equity staff to collaborate/coordinate theiractivities with other equity staff;
2) To encourage SEA staff to integrate equity concerns into all SEAactivities.
Procedure for Trainer:
This "chapter" is divided into two segments to be presented by thetrairer: 1) "Increasing Collaboration Among Equity Staff"; and2) "Integrating Equity Concerns into SEA Activities". Each segment isfollowed by an exercise which allows participants to apply the ideaspresented to their own work.
In presenting these materials, the trainer should first focus on theimportance of equity staff's working together to recognize similarities aswell as differences in their job responsibilities. The participantsshould then be encouraged to work cooperatively in ensuring that equityconcerns are addressed in all SEA activities.
Materials for Participant Activities:
ASSESSING COLLABORATION AMONG EQUITY STAFF--This exercise willencourage an equity staff person to begin thinking about the extent towhich he or she works with staff in other equity areas.
IDENTIFYING EQUITY NEEDS OF SEA STAFF - -This questionnaire is designedto assist equity staff in identifying equity - related interests and needsof other SEA staff. Equipped with this information, equity staff cantailor their training materials to meet the needs of their colleagues inthe SEA. The ques±icnnzire should be disseminated by an equity staffperson (or equity team) to a variety of SEA departments.
A CHECKLIST TO.ASSESS THE EXTENT TO WHICH EQUITY CONCERNS HAVE BEENINTEGRATED INTO SEA ACTIVITIES--This checklist was developed to assist SEAstaff in assessing the extent to which equity concerns have beenintegrated into their SEAs' activities. It can be used as a startingpoint for structuring a comprehensive equity approach to SEA activities oras a mechanism for targeting specific areas where equity concerns have notbeen adequately addressed. The checklist should be completed anddiscussed by staff from a range of SEA departments and administrativelevels. This procedure will help to ensure that differing perspectivesconcerning equity issues are recognized.
INTEGRATING EQUITY CONCERNS: A COLLABORATIVE APPROACH
A) Increasing Collaboration Among Equity Staff
Inequities based on race, sex, national origin, and disability are
evident throughout our educational system as well as the U. S. labor
force. Yet, despite these persistent inequities, the federal role in
promoting equity has been steadily decreasing during recent years.
Reduced federal funding, deregulation, and less stringent civil rights
enforcement at the federal level have all contributed to this steady
decline. If civil rights achievements of the 1960's and 1970's are to be
preserved and if further steps towards educational equity are to be taken,
leadership must now originate at the state level.
To date, many states have risen to the challenge of addressing
inequities in education. These efforts have resulted in the
implementation of equity laws, constitutional provisions, and programs
which, in some cases, are more far-reaching than existing federal
mandates. Additionally, every state funds some programs for children with
extra educational needs. Building on this foundation, energies must now
be directed towards developing and expanding comprehensive apr )aches to
eliminating inequities. That is, rather than addressing race, sex,
national origin, and disability issues independently, efforts should be
made to: 1) increase collaboration and coordination among specialists
from diverse equity areas; and 2) integrate equity concerns into all SEA
activities.
-90-
1'

Why Collaborate/Coordinate?
Females frequently encounter multiple types of bias and
discrimination. For example, a disabled female risks discrimination based
on her gender as well as her disabling condition. A black disabled female
risks discrimination based on her race, gender, and disabling condition.
In such cases, race, sex, national origin, and disability are no longer
discrete issues which should be addressed independently. Rather, they
present overlapping concerns requiring the attention and expertise of
professionals from diverse equity areas with knowledge and sensitivity to
these overlapping concerns. A cooperative, collaborative approach to
addressing these multiple inequities is justified by the following
factors.
Collaboration/coordination can increase equity staffs' understandingof each others' roles and responsibilities. At the same time,"turfism" or other friction between equity personnel and programscan be reduced.
Sexism, racism, and handicapism have much in common. For example,all present obstacles to educational equity. Similarly, victims ofeach "ism" are frequently subjected to economic exploitation,paternalistic attitudes, and segregation/isolation. Consequently,initiatives which have successfully addressed one type of bias canbe shared with other equity staff, thereby providing the staff anopportunity to benefit from each others' experiences.
Collaboration/coordination is cost-effective and reduces duplicationof effort amtng equity staff. This economic benefit is particularlyimportant where fiscal and staff resources for equity initiativesare limited.
Collaboration/coordination avoids a "divide and conquer" strategy byequity opponents which can be detrimental to everyone.
Collaboration/coordination results in greater visibility and broaderaudiences for equity workshops, technical assistance materials, andmonitoring programs both inside and outside the SEA.
Collaboration/coordination can aid in institutionalizing equityprograms and avoid their being isolated, one-time efforts.
-91-

How to Collaborate/Coordinate
Agency configurations, financial considerations, staffing patterns,
and other factors relating to SEAS vary from state-to-state.
Consequently, vehicles which facilitate collaboration among equity
specialists in one state may prove futile in a neighboring state. SEA
staff must, therefore, decide which mechanisms most effectively meet their
needs. Slime suggested strategies for encouraging collaboration across
equity lines might include:
Sex equity personnel periodically attend staff meetings in otherequity areas, and vice versa (e.g., se:: equity staff attend raceequity meetings);
Sex equity personnel provide inservice training for equity personnelfrom other areas, and vice versa;
Sex equity staff participate in interviewing applicants for staffpositions in other equity areas, and vice versa;
Sex equity staff perform monitoring activities in conjunction withthe monitoring activities of other equity areas;
Sex equity staff coordinate their data collection activities withthose of other equity staff;
Sex equity staff co-sponsor technical assistance workshops withother equity areas;
If appropriate, sex equity and other equity staff co-sponsorincentive grants for LEAs.
Sex equity personnel co-author public information materials (e.g.,brochures) highlighting a range of equity i:-,sues;
Sex equity staff meet informally (e.g., lunch) with other equitystaff to identify additional ways of collaborating and coordinatingtheir activities.
Through such joint activities, equity staff will acquire a better
understanding of each others' responsibilities. In addition, an equity
"team" can be established. Through this team, equity specialists can take
-92--

steps to ensure that equity concerns are integrated into all SEA
activities.
Adapted from Anderson, T. "Racism, Sexism and Handicapism: A Common Bond/ARational for Cooperation and Coordination Between Equity Programs," 1986.
B) Inteaating_Equity Concerns Into SEA Activities
"Educational equity" should not coasist of a finite set of discrete
programs and people operating under Title IV of the Civil Rights Act or
comparable civil rights funding. Rather, the promotion of educational
equity should be a priority in every activity at every level of the
educational system.
The following discussion examines the role of state education agencies
(SEAs) in the achievement of educational equity. It describes typical SEA
functions and identifies the kinds of equity activities which might be
associated with those SEA functions. These descriptions are followed by a
checklist which will assist participants in assessing the degree to which
equity concerns have been integrated into their SEAs' activities.
1. Regulation of state education programs--State boards and
departments oz education are authorized to establish and enforce rules and
regulations which: provide for the establishment and maintenance .if
education programs of high quality throughout the state; guarantee
appropriate educational opportunities for all students; and establish
state requirements for local programs funded by federal laws and operated
under the supervision of the state department of education. These
regulations can take the form of either minimum standards or quality
incentives. Educational equity can be promoted by establishing equity
criteria in these .standards and incentives. Education reform initiatives
should also reflect the state's concern for equity as well as excellence
in education.
-94-
ICJ'
2. Administration of state education programs--Pursuant to their
responsibilities for the administration of state education programs, state
education agencies formulate for the governor and the legislature budgets
for the support of education programs within the state; recommend to the
governor and the state legislature desirable legislation related to
education programs within the state; prescribe systems for collecting and
reporting educational data for the evaluation and assessment of
educational progress in he state; and accept and distribute to local
education agencies funds, goods, and services which are made available
from the state or federal governments.
3. Leadership for state and local programs--State education agencies
assume responsibility for many activities which provide leadership for the
improvement of education at the state and local levels. Included among
these activities are:
Planning--Most state agencieslong-range education needs atdelineating alternative meansat least for the state level,meet these needs.
are responsible for identifyingthe local and state levels,to address these needs, and selecting,those means which shall be used to
Research and evaluation--Many state agencies make provisions fordirecting and financing needed educational research throughcooperative arrangements with local education agencies, col,eges anduniversities, and other organizations. Demonstration programs anddissemination of research results are one means used by stateeducation agencies to influence the quality of education serviceswithin the state.
Experimentation and innovation--Increasing numbers of stateeducation agencies are accepting responsibility for conducting andsupporting experimentation and innovation in an attempt to developnew programs that promise improvement of education.
Consultative services--Most state education agencies make servicesavailable to local agencies which are directed toward the solutionof particular problems in local education programs. Consultativeservices are a prime method for accelerating the dissemination ofmethods, procedures, and practices essential for successful localefforts.
-95-

Cooperative programming--State education agencies sp.nsorcooperative programs with colleges and universit'es, local educationagencies, associations of schools and school districts, and taskforces organized to implement new programs. Thcse cooperativerelationships provide anoti.er means of state support for innovationand dissemination of successful programs.
Inservice education- -The state education agency in most statesprovides not only resources for the inservice education of its ownstaff, but also for inservice activities at the local and regionallevels and for the education of members of boards of ed'jcatinn.
4. Policy developmentThe written policies of a state education
agency can provide a direction and a statement of priorities for the work
of the agency. Policy development and dissemination are an important
means for communicating the focus of agency programs to employees as well
as constituent groups and others outside the agency. A formal state
policy stating the commitment of the state agency to achieving educational
equity in all its programs and activities can provide a significant
impetus for equity efforts at both the state and local levels. If it is
to be effective, however, it must be followed by program development and
concrete action.
5. Program development -- Program development is the planning process
which moves general policy directives to specific oals, objectives, and
activities. If equity is to be achieved in state agency programs, equity
goals should be developed for every bureau, division, or program in the
agency. Objectives, performance measures, and timelines should be
developed for each goal and communicated to staff. Steps should also be
taken to ensure that equity considerations are reflected in criteria
developed for local education programs.
6. Staff5mEffective human resources are essential to the
achievement of any agency program. State education agencies can ensure
that sufficient staff resources are ass,gned to equity programs and
-96
1
, activities and that all agency staff have received training regarding the
equity re5ponsibilities inherent in their own job functions.
7. Monitoring and evaluation--Monitoring and evaluation are
necessary to ensure the optimal effectiveness of any state or local
education agency program. Once equity programs, goals, and objectives
have been developed, evaluation and monitoring can determine their
successes and problems as well as identify emerging needs. Evaluation and
monitoring are an important means for directing staff performance,
anticipating and resolving problems, and reporting progress to persons
inside and outside the agency.
8. Budgeting--The values and priorities of a state education agency
are often expressed in the allocation of available financial resources
among various agency programs. Effective equity programs require the
procurement, allocation, and wise use of budgetary resources. As federal
education funds are reduced, it is important that adequate state funds be
allocated to maintain equity programs.
Adapted from McCune, S. and Matthews, M., "Achieving Sex Equity inEducation: A Rosource Collection for Technical Assistance Personnel inState Education Agencies", January 1980.

ASSESSING COLLABORATION AMONG EQUITY STAFF
The following questions are intended to help you, as an SEA equitystaff member, ascpcc the extent to which you currently collaborate With
other equity staff.
1. I know, by name, the person(s) in the SEA with the followingtitles/responsibilities:
Title IX Coordinator..._
Special Education DirectorSection 504 CoordinatorVocational Education Sex Equity CoordinatorRace Equity CoordinatorNational Origin CoordinatorBilingual Education DirectorCompensatory Education Director
(Please check all that apply and strike through titles that fallwithin your responsibilities.)
2. What mechanisms currently exist in my SEA to f:cilitate the routineexchange of information among equity staff?
3. I have worked with the following person(s) during the last year on aspeciffE-FiTject:
Title IX CoordinatorSpecial Education DirectorSection 504 CoordinatorVocational Education Sex Equity CoordinatorRace Equity CoordinatorNational Origin CoordinatorOMIBilingual Education DirectorCompensatory Education Director
4. I plan to work with the following person(s) on a specific projectduring the next six months:
,11=11MTitle IX CoordinatorSpecial Education DirectorSection 504 CoordinatorVocational Education Sex Equity CoordinatorRace Equity CoordinatorNational Origin CoordinatorBilingual Education DirectorCompensatory Education Director
5. I understand and can describe the roles/responsibilities of SEA staffworking on race, sex, national origin, and disability issues.
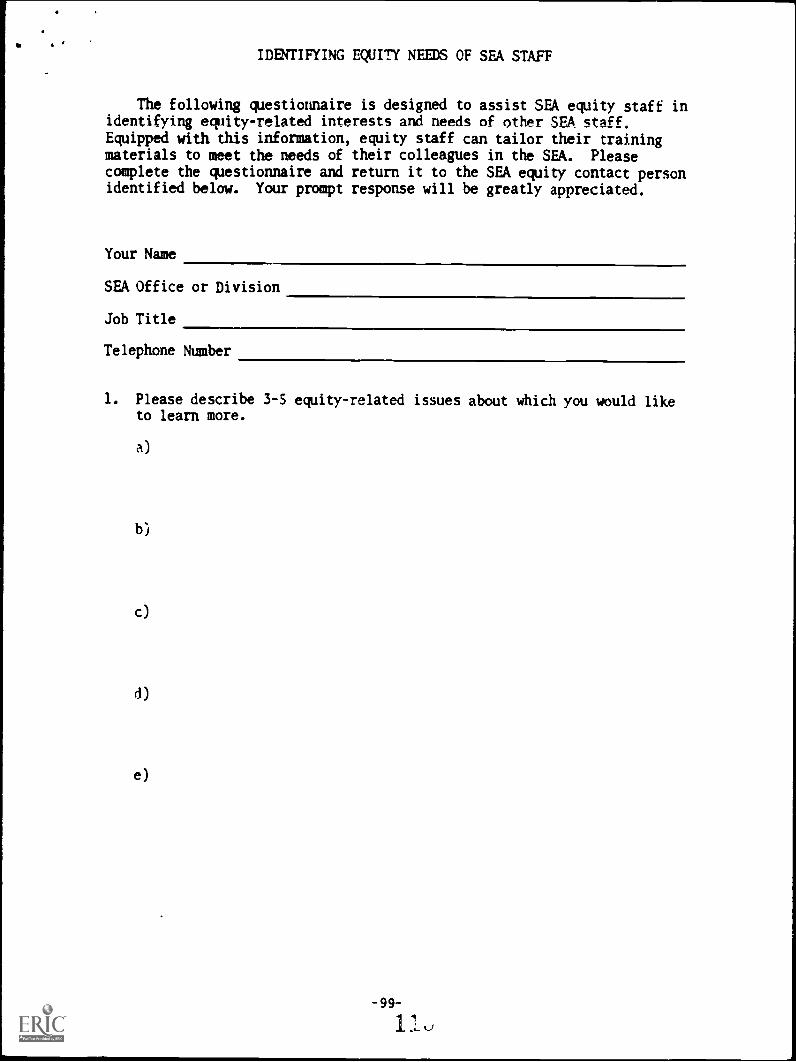
IDENTIFYING EQUITY NEEDS OF SEA STAFF
The following questionnaire is designed to assist SEA equity staff inidentifying equity - related interests and needs of other SEA staff.
Equipped with this information, equity staff can tailor their trainingmaterials to meet the needs of their colleagues in the SEA. Pleasecomplete the questionnaire and return it to the SEA equity contact personidentified below. Your prompt response will be greatly appreciated.
Your Name
SEA Office or Division
Job Title
Telephone Number
1. Please describe 3-5 equity-related issues about which you would liketo learn more.
a)
bi
c)
d)
e)
-99
1 1_Lk)

2. In what form would you like this information presented (e.g., factsheets; inservice workshops; training manual)?
3. Ideally, when would you like these materials developed?
Please return your completed questionnaire to:[Insert name and address of SEA equity contact person.]
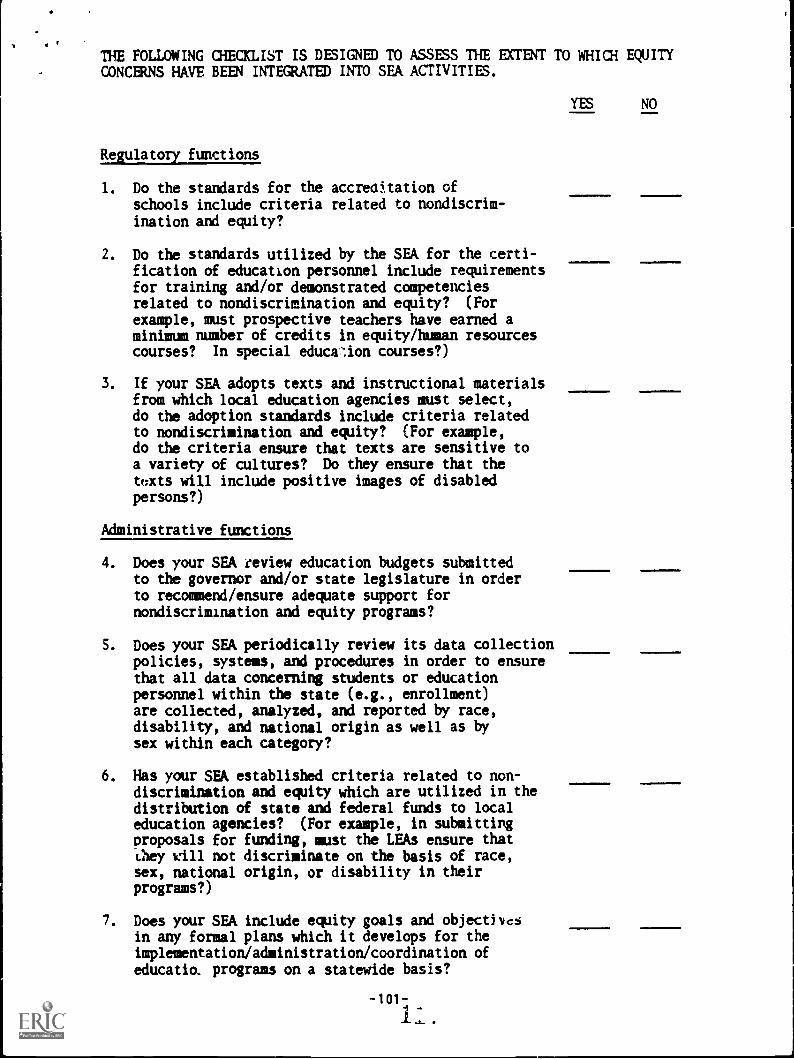
e
THE FOLLOWING CHECKLIST IS DESIGNED TO ASSESS THE EXTENT TO WHICH EQUITYCONCERNS HAVE BEEN INTEGRATED INTO SEA ACTIVITIES.
Regulatory functions
1. Do the standards for the accreditation ofschools include criteria related to nondiscrim-ination and equity?
2. Do the standards utilized by the SEA for the certi-fication of education personnel include requirementsfor training and/or demonstrated competenciesrelated to nondiscrimination and equity? (Forexample, must prospective teachers have earned aminimum number of credits in equity/human resourcescourses? In special education courses?)
3. If your SEA adopts texts and instructional materialsfrom which local education agencies must select,do the adoption standards include criteria relatedto nondiscrimination and equity? (For example,do the criteria ensure that texts are sensitive toa variety of cultures? Do they ensure that thetexts will include positive images of disabledpersons?)
Administrative functions
4. Does your SEA review education budgets submittedto the governor and/or state legislature in orderto recommend/ensure adequate support fornondiscrimination and equity programs?
S. Does your SEA periodically review its data collectionpolicies, systems, and procedures in order to ensurethat all data concerning students or educationpersonnel within the state (e.g., enrollment)are collected, analyzed, and reported by race,disability, and national origin as well as bysex within each category?
6. Has your SEA established criteria related to non-discrimination and equity which are utilized in thedistribution of state and federal funds to localeducation agencies? (For example, in submittingproposals for funding, must the LEAs ensure thatthey will not discriminate on the basis of race,sex, national origin, or disability in theirprograms?)
7. Does your SEA include equity goals and objectivesin any formal plans which it develops for theimplementation/administration/coordination ofeducatio. programs on a statewide basis?
-101-
YES NO

Leadership functions
8. Does your SEA offer incentives which can encourageLEAs to plan and implement programs related to theachievement of educational equity? (For example,does your SEA offer incentive grants for programsto increase awareness of sex and race bias inproaramc for the dicahipd?)
9. Does your SEA support research, demonstration, anddissemination programs related to equity ineducation? (For example, does your SEAdisseminate information/curriculum materialsconcerning the role of women in your state'shistory?)
10. Does your SEA develop and disseminate models andmaterials which can be used by LEAs in complyingwith state and federal nondiscriminationrequirements? (For example, does your SEAdisseminate self- assessment materials to assist"LEAs in monitoring their compliance with federaland state equity mandates?)
11. Does your SEA make available to LEAs consultantservices related to compliance with state andfederal nondiscrimination requirements, thedevelopment and implementatiou of equity programs,and/or the resolution of equity problems? tForexample, are consultant services available toaddress the underrepresentation of disabled femalesin nontraditional vocational education classes?)
12. Does your SEA sponsor activities/programs related toequity in cooperation with institutions of highereducation, professional associations, LEAs, andcommunity organizatiqns within the state? (For_example, does your StIA work with higher educationto encourage minority students to enter theteaching field?)
13. Does yawn* SEA provide to education personnel withinthe state inservice programs/activities related tonondiscrimination and equity? (For example, doesyour SEA provide workshops to increase theparticipation of females and minority males inmath and science courses?)
14. Does your SEA maintain public relations initiativesrelating to equity in education? (For example,do SEA equity staff and policymakers addresseducational equity issues at PTA and other parent/community meetings?)
-102-
YES NO
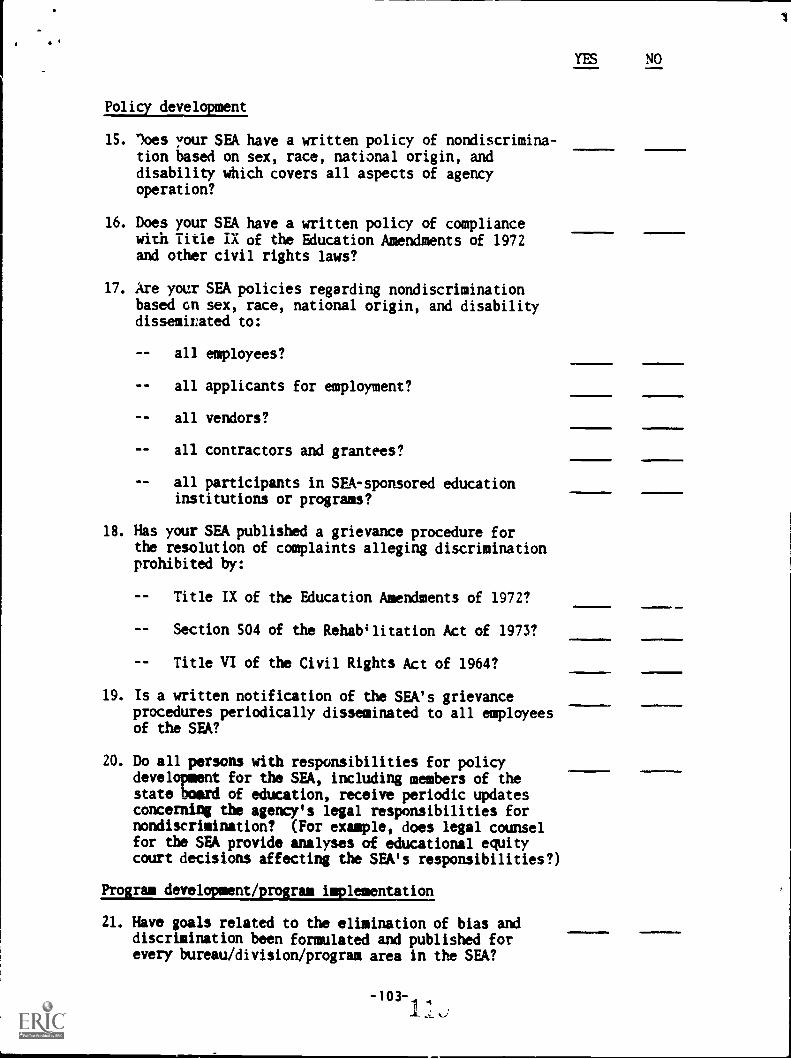
Policy development
15. loes your SEA have a written policy of nondiscrimina-tion based on sex, race, national origin, anddisability which covers all aspects of agencyoperation?
16. Does your SEA have a written policy of compliancewith Title IX of the Education Amendments of 1972and other civil rights laws?
17. Are your SEA policies regarding nondiscriminationbased on sex, race, national origin, and disabilitydisseminated to:
YES NO
all employees?
all applicants for employment?
all vendors?
all contractors and grantees?
all participants in SEA-sponsored educationinstitutions or programs?
18. Has your SEA published a grievance procedure forthe resolution of complaints alleging discriminationprohibited by:
- - Title IX of the Education Amendments of 1972?
- - Section 504 of the Rehabgitation Act of 1973?
-- Title VI of the Civil Rights Act of 1964?
19. Is a written notification of the SEA's grievanceprocedures periodically disseminated to all employeesof the SEA?
20. Do all persons with responsibilities for policydevelopment for the SEA, including members of thestate board of education, receive periodic updatesconcerning the agency's legal responsibilities fornondiscrimination? (For example, does legal counselfor the SEA provide analyses of educational equitycourt decisions affecting the SEA's responsibilities?)
Pro implementation
21. Have goals related to the elimination of bias anddiscrimination been formulated and published forevery bureau/division/program area in the SEA?
-103-I

22. Have timelines and performance measures for theachievement of all equity goals and objectivesbeen specified in writing and communicated toappropriate staff members?
23. Has a mechanism been developed to ensure thatequity goals and objectives are developed for eachnew program undertaken by the SEA?
24. Are existing SEA programs routinely monitoredto ensure that equity objectives are beingachieved?
25. Do equity personnel routinely collaborate withgeneral education and instructional personnel inorder to infuse equity concerns into the activitiesof these divisions? (For example, have equitypersonnel collaborated with instructionalpersonnel in developing guidelines to assist LEAsin identifying and counteracting biases ininstructional vAberials?)
26. Do SEA staff routinely perform on-site monitoringactivities in LEAs? (For example, do SEA staffvisit physical education classes to ensure thatthey are not illegally segregated by sex?)
Monitoring and evaluation
27. Are responsibilities for the periodic reporting ofSEA and LEA progress and problems in theimplementation of equity goals and objectives cl,:arlyspecified for all SEA staff?
28. Are reports of SEA and LEA equity progress andproblems periodically reviewed by an SEA staffmember with policy-level authority?
29. Are equity criteria included in every evaluation ofSEA programs (e.g., salary/compensation reviews,management effectiveness studies)?
30. Are reports of agency progress and problems in theimplementation of equity programs and activitiesperiodically disseminated to agency staff, tomembers of state and local government, and to thepublic?
Education reforms
31. Were equity concerns considered in developing yourstate's education reforms? (For example, haveprograms been implemented to assist educationallydisadvantaged students meet increased graduationrequirements?)

32. Has an accountability system been implementedby the SEA which will monitor the effects ofeducation reforms on student performance by race,sex, national origin, disability, and socioeconomicstatus?
33. Have reform initiatives been developed with theassistance of SEA staff who work in programstargeted on at-risk youth? (For example, haveprograms been developed with the assistance ofstaff who understand the educational needs oflimited English proficient students?)
34. Have reforms (e.g., teacher tests) been carefullydeveloped in order to avoid even unintentionalcultural biases?
35. Does the SEA provide special assistance inimplementing the reforms to LEAs with highpercentages of at-risk youth?
Staffing
36. Has your SEA reviewed all its employment policies,practices, and procedures in order to ensure thatthey do not discriminate based on sex, race, nationalorigin, or disability with regard to:
-
- -
recruitment?
selection?
compensation?
placement?
promotion?
training?
fringe benefits?
retirement?
any other terms and conditions of employment?
37. Has a review been completed of ali SEA positiondescriptions, position classifications, andcompensation systems to ensure that they do notresult in discrimination based on sex, race,national origin, or disability?
YES NO
AMMO. .-+NNINIMM

38. Has your SEA performed a work force utilizationanalysis in order to determine the numbers offemales and males of each racial-ethnic group employedin each job classification within the agency, as wellas the salary range of each classification, and theaverage years of education and employment within theagency for finales and males in each classification?
39. Does your SEA have a written affirmative action planfor ensuring nondiscrimination and achieving equityin its employment policies, procedures, and practices?
40. Have all individuals with responsibility for therecruitment, selection, and management of SEApersonnel received training with regard to state andfederal nondiscrimination and affirmative actionrequirements and strategies for their implementation?
41. Have personnel assigned specific equity
responsibilities been ensured sufficient authorityand access to other staff to enable them to performtheir assigned responsibilities?
42. Have all staff of the SEA been provided inservicetraining with regard to their responsibilities fornondiscrimination and equity? (For example, areinservice workshops provided periodically concerningequity laws, regulations, and policies?)
Budgeting
43. Does your SEA budget clearly allocate funds toequity programs/staff/activities?
44. Is state support sufficient to maintain equityprograms that have suffered federal budgetcutbacks? (For example, if federal Title IVfunds are further reduced, will your SEA's race,sex, and/or national origin programs continue tofunction?)
45. Are equity funds allocated in such a way as tosupport the infusion of sex equity activitiesthroughout all SEA programs?
46. Are persons knowledgeable about equity issues andresponsible for equity programs provided an opportuni-ty for input during the budget process?
YES NO
Adapted from McCune, S. and Matthews, M., "Achieving Sex Equity inEducation: A Resource Collection for Technical Assistance Persoiwei inState Education Agencies", January 195u.
-106- 1 ,
1

NEXT STEPS FOR SEA EQUITY STAFF
-107-
ti

, 2122ectLe:
To encourage SEA eqv'ty staff to take additional steps towardsintegrating equity concerns into all SEA activities.
Procedure for Trainer:
The trainer should review the list of "Next Steps" presented in themanual materials with participants. Based on their ideas and/or actualexperiences, participants should then be encouraged to identify additionalsteps equity staff can take to increase the integration of equity concernsinto SEA activities.
The trainer should point out that new equity staff should not expectto undertake all steps simultaneously. Rather, a more gradual and logicalapproach is likely to result in long-term equity gains.
Materials for Participant Activities)
NEXT STEPS FOR SEA EQUITY STAFF

NEXT STEPS FOR SEA EQUITY STAFF
The following is a preliminary list of steps equity staff can take toensure that equity concerns are integrated into SEA activities. While notall steps can be undertaken simultaneously, over a period of time equitystaff can be instrumental in structuring a comprehensive equity approachto SEA activities.
GET CONNECTED/NETWORK with SEA staff, LEA staff, community groups, andadvocacy groups. Ensure that these groups understand who you are and what"equity" is all about.
GET INVOLVED in all content areas and find ways of infusing equity, Forexample, work with instructional/curriculum staff in developing women'shistory resource materials to be disseminated statewide; assist indeveloping statewide plans for increasing Elaale and minority maleparticipation in math and science courses; implement strategies forincreasing awareness concerning the over- or underrepresentation ofcertain populations in special education classes.
BE VISIBLE WITHIN YOUR SEC Volunteer to serve on planning committees,staff development teams, and other task forces. Agree to assist withworkshops concerning a variety of issues and incorporate equity into thoseworkshops. Offer to review SEA publications for bias and stereotyping.Develop strategies for ensuring that newly-hired SEA staff are sensitiveto equity issues. Be instrumental in developing and implementing equityobjectives for every division within your SEA.
BE VISIBLE OUTSIDE YOUR SEA. Share your knowledge and materials with LEAstaff, community groups, and advocacy groups. Be willing to serve onadvisory boards and task forces as well as conduct equity workshops.These activities can go a long way towards establishing credibility foryou and your equity goals.
BE CREATIVE. Present new ideas as well as longstanding equity concepts increative ways. Avoid having your audience think they've "heard it allbefore".
SHOW INITIATIVE. Look for ways to infuse equity throughout your SEA'sactivities. Offer your assistance without waiting to be asked.
BE GENEROUS with your knowledge and materials. Disseminate your materialsto a wide audience and be prepared to provide technical assistance whenneeded.
MEET AND COLLABORATE with colleagues in other equity areas when developingproposals for new programs. Particularly when fiscal resources arelimited, it is important that equity staff cooperatively try to ensurethat no equity issue/program is overlooked or unfunded.
FIND OUT what legislative initiatives your SEA is supporting and identifyways of assisting in these efforts.
-109-
12,0

BE RELIABLE. Provide accurate and complete information. Follow-up withadditional materials when you say you will.
The foregoing segment-o concerning the integration of equity concerns werebased, in part, on presentations made at the CCSSO Resource Center'sSecond Annual Equity Conference, April 1986. The presentations were madeby Tom Andersen, I "wa State Department of Education; Woody Grant, MarylandState Department of Education, and Mike Moon, New York Department ofEducation. Our thanks to these equity specialists.
-110-

EVALUATION/FEEDBACK
127

EVALUATION
Objective:
To provide CCSSO Resource Center staff with information concerning theusefulness of the training materials and training strategies.
Procedure for Trainer:
Following the implementation of the workshop, the CCSSO ResourceCenter would appreciate the trainer's completing and returning theEvaluation to the following address:
CCSSO Resource Center on Educational Equity400 North Capitol Street, N. W., Suite 379Washington, D. C. 20001

JOB TITLE
EVALUATION
1. Were the topics covered in the manual relevant to the workshopparticipants' professional job responsibilities?
2. What materials were most useful?
3.a) What materials were least useful?
b) How could these be imprcied?
4. Were the participant activities useful?
-113-
12

S. Should more participant activities be included?
6. Is the manual format appropriate? If not, how could it be improved?
7. Were topics omitted that you believe should have been included in themanual? If so, please describe.
8. Additional comments.

APPENDIX A
131

REFERENCES
A Children's Defense Budget: An Analysis of the FY 1987 Federal Budgetand Children, WaSbington, D. C. Children's Defense Fund, 1986.
"A Concern About Computer Equity", CONCERNS, June 1984, p. 1.
American Association of School Administrators. Recent Trends in theRepresentation of Women and Minorities in School Administration andProblems in Documentation, Washington, D. C.: American Association ofSchool Administrators, 1982.
Berryman, S. E. Who Will Do Science?, New York: The RockefellerFoundation, 1983.
Bianchi, S. M. and Spain, D. American Women: Three Decades of Change,Special Demographic Analyses, IL S. Department of Commerce, Bureau ofCensus, August 1983.
Bowe, F. Disabled Adults in America, a statistical portrait drawn fromCensus Bureau Data, President's Committee on Employment of theHandicapped, Washington, D. C.: 1983.
Brown, C. G. and Reid, J. E., "Twenty Years On: Equity in Education andCivil Rights Enforcement", Unpublished paper, May 1996.
Center for Social Organization of Schools, Johns Hopkins University,"School Uses of Microcomputers", Reports from a National Survey No. 3,October 1983, pp. 1-8.
College Entrance Examination Board, Profiles College -Bound Seniors, 1981,New York: College Entrance ExaminatUilIbii.aTign.
College Press Service, April 17, 1986.
Congressional Budget Office. "Poverty Among Children", December 3, 1984.
Congressional Research Service/Congressional Budget Office. Children inPoverty, Committee on Ways and Means, U. S. House of Representatives,
Council of Chief State School Officers. Disabled Students Beyond School:A Review of the Issues, Washington, D. C.: CCSSO, March 1986.
Danker-Brown, P., Sigelman, C., and Fleyer, R., "Sex Bias in VocationalProgramming for Handicapped Students, Journal of Special Education, Vol.12, No. 4, Winter 1978.
DeNavas, C. and Fernandez, E. "Condition of Hispanic Women in AmericaToday", (unpublished), U. S. Department of Commerce, Bureau of the Census,July 27, 1984.
Employment and Earnings, U. S. Department of Labor, Bureau of LaborStatistics, March 1982, January 1984.
132
Evans, A. M. "Federal Education Programs Serving Students with LimitedProficiency in the English Language", Congressional Reference Service,Library of Congress, Washington, D. C., 1984.
Federal Women's Program. The Status of Women ' Selective SocialIndicators, U. S. Civil Service mission, ac ington, . ., 80.
Fox, L. H., Brody, L., and Tobin, D. (eds.), Women and the MathematicsMystique, Baltimore: The Johns Hopkins University Press, 1980.
Hendersen, A., Agything Goes: A SummaryEsport on Chapter...2, TheEducation Block Brant, National Committee for Citizens in Eaucation, 1985.
Hodgkinson, H. L., All One System, Washington, D. C.: The Institute forEducational Leadership, Inc., 1985.
"Injustice Under the Law: The Impact of the Grove City Decision on CivilRights in America", Project on Equal Education Rights, NOW Legal Defenseand Education Fund, et., al., 1985.
"Investigation of Civil Rights Enforcement by the Office for Civil Rightsat the Department of Education", H.R. REP. 458, 99th Cong., 1st Sess.,1985.
Jones, B. A. P., "Black Women and Labor Force Participation: An Analysisof Sluggish Growth Rates", in Simms, M. C. and Malveaux, J. (eds.),Slipping Through the Cracks: The Status of Black Women, New Brunswick:Transaction Books, 1986.
Langelier, J., "Indochinese Women", unpublished report, no date.
League of Women Voters Education Fund. Meeting the Employment Needs ofWomen. A Path Out of Poverty?, 1984, Washington, D. C.: League of Women'Voters of the United States,
Matthews, W., "Coloring the Equation: Minorities and Mathematics",Journal for Research in Mathematics, Janury 1983, Vol. 14, No. 1, pp.70-72.
McCune, S. and Matthews, M. "Achieving Sex Equity in Education: AResource Collection for Technical Assistance Personnel in State EducationAgencies", January 1980.
Orfield, Gary, School Desegregation Patterns in the States, Large Citiesand Metropolita. Areas 1968-1980, Washington, D. C.: Joint Center forPolitical Studies, 1983.
Perez, M., "Report on Hispanic Adolescent Pregnancy and Parenting: a
Framework for Analysis", unpublished report, Washington, D. C.: CCSSOResource Center on Educational Equity, 1984.
Teenage Pregnancy: The Problem That Hasn't Gone Away, New York: The AlanGuttmacher institute, 1981.
U. S. Department of Commerce, Bureau of the Census. "Labor Force Statusand Other Characteristics of Persons with Work Disability: 1982".
/33

. "Money Income of the Household Families, and Persons in theUnited States: 1983", Current Population T sorts, Consumer Income SeriesP-60, No. 146.
Statistical Abstract of the United States: 1982-83,
5, D. C.: U. S. Government Printing Office, 1982.
. Statistical Abstract of the United States: 1984, Washington,D. C.: U. S. Government Printing Office, 1983.
U. S. Department of Education, National Center for Educational Statistics,The Condition of Education, 1983, Washington, D. C.: U. S. GovernmentPrinting Office, 1983.
. TheConditionofEducation1984, Washington, D. C.: U. S.Government Priicaffurru6i;-ww------------
. The Condition of Education, 1985, Washington, D. C.: U. S.Government Printing Office, 1985.
U. S. Department of Commerce, Bureau of the Census, Digest of EducationStatistics, 1981-82, Washington, D. C.: U. S. Government Printing Office,1981.
. Digest of Education Statistics 1983-84, Washington, D. C.:107-37-(rnment Printing Office, 1983.
U. S. Department of Education, Office for Bilingual Education and MinorityLanguage Affairs, Condition of Bilingual Education in the Nation, 1984,Washington, D. C.: U. S. Department of Education, 1984.
U. S. Department of Education, Office for Civil Rights, 1980 Elementaryand Secondary School Civil Rights Survey: National Summaries, Arlington,Virginia: DBS Corporation, 1982.
1984 Elementary and Secondary School Civil Rights Survey:National Summaires, Arlington, Virginia: DBS Corporation, 1986.
. "Total Minority Enrollment for Districts with 50 PercentMinority Enrollment," special computer run using data from the 1980Elementary and Seconda Schools Civil Ri:hts Surve WashingtoE75. C.:
rev 2a)ice or Livi Kignts, IJecem er
. Fall 1979 Vocational Education Civil Rights Stud : NationalAr ington, Virginia: DBS orporation, 9: 0M'
. Second Annual Report: Fiscal Years 1981 and 1982,Wiallgton, D. C.: Office for Civil Rights, March 1983.
. "Survey Data Summary of Public Elementary and SecondarySchools in Selected Districts: School Year 1982-1983", Washington,D. C.: Office for Civil Rights, 1984.
. 'Total Minority Enrollment for Districts with 50 PercentMinority Enrollment", Special computer run using data from the 1980Elements and Secondary Schools Civil Rights Survey, Washington, E. C.:u ice or Civil Rights, December 3, 1982.
13

1979 Vocational E__.7.._ch13watimavnEna ry : RerrtsforPublic mistrinution, Ar ington, virginia: corporation, 9 .
U. S. Department of Labor, Bureau of Labor Statistics.by Sex, March 1985: Persons 25-64 Years Old".
. "Labor Force Activity of Mothers of Youngat Record Pace", News, September 19, 1985.
. "Employment Perspective: Women in the Labor Force", Report730, Second Quarter, 1986.
. "Facts on U. S. Working Women", Fact Sheet No. 85-a, July
"Employment Status
Children Continues
1985.
U. S. Department of Labor, Women's Bureau. United Nations Decade forWomen, 1976-85: Employment in the U. S., Report for the Warld Conferenceon the United Nations i Decade for Women, July 1985.
1985.. "Black Women in the Labor Force," Fact Sheet No. 85-6, July
. "Women Who Maintain Families," Fact Sheet No. 85-2, July
Valverde, L. A., "Hispanic Students and Mathematics", in Handbook forConducting Equity Activities in Mathematics Education, H.K-Zheek (ed.),Washington, D. C.: National Council of Teachers of Mathematics, 1984.
Vetter, B. M. and Babco, E. L., Professional Women and Minorities, SixthEdition, Commission on Professionals in Science and Technology,Washington, D. C., 1986.
Ziegler, J., "Women Found No Better Off Economically Than in 1959",Washington Post, April 18, 1986, p. C11.
135