Institute of Ag Professionals - University of Minnesota · than 130 fruits and vegetables. . ......
55
Institute of Ag Professionals Proceedings of the 2014 Crop Pest Management Shortcourse & Minnesota Crop Production Retailers Association Trade Show www.extension.umn.edu/AgProfessionals Do not reproduce or redistribute without the written consent of author(s).
Transcript of Institute of Ag Professionals - University of Minnesota · than 130 fruits and vegetables. . ......
Institute of Ag Professionals
Proceedings of the
2014 Crop Pest Management Shortcourse &
Minnesota Crop Production Retailers Association Trade Show
www.extension.umn.edu/AgProfessionals
Do not reproduce or redistribute without the written consent of author(s).
Causal Factors of Honey Bee Colony Declines
Are neonicotinoids involved?
Galen Dively, Emeritus Professor
Department of Entomology
University of Maryland
College Park, MD
Are neonicotinoids involved?
Stress factors affecting colony health
Routes of pesticide exposure to bees
Residue levels in pollen and nectar
Fate of residues in honey bee colonies
Summary of lab and field colony studies
End with what is really involved
http://www.nap.edu/catalog/11761.html
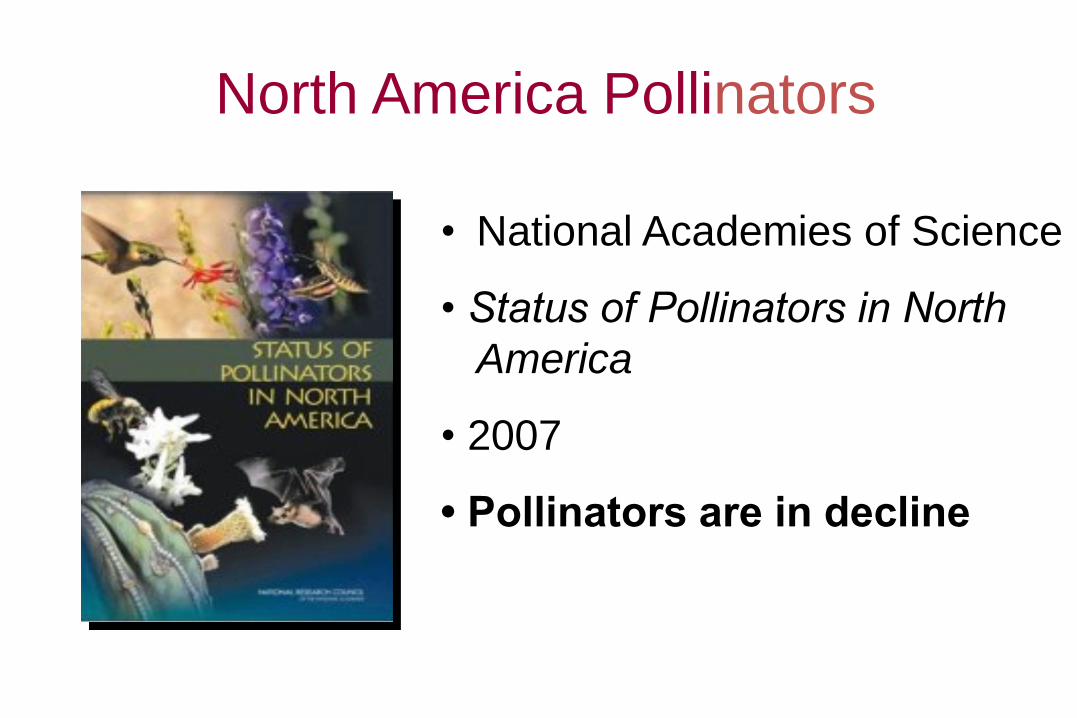
North America Pollinators
• National Academies of Science
• Status of Pollinators in North
America
• 2007
• Pollinators are in decline
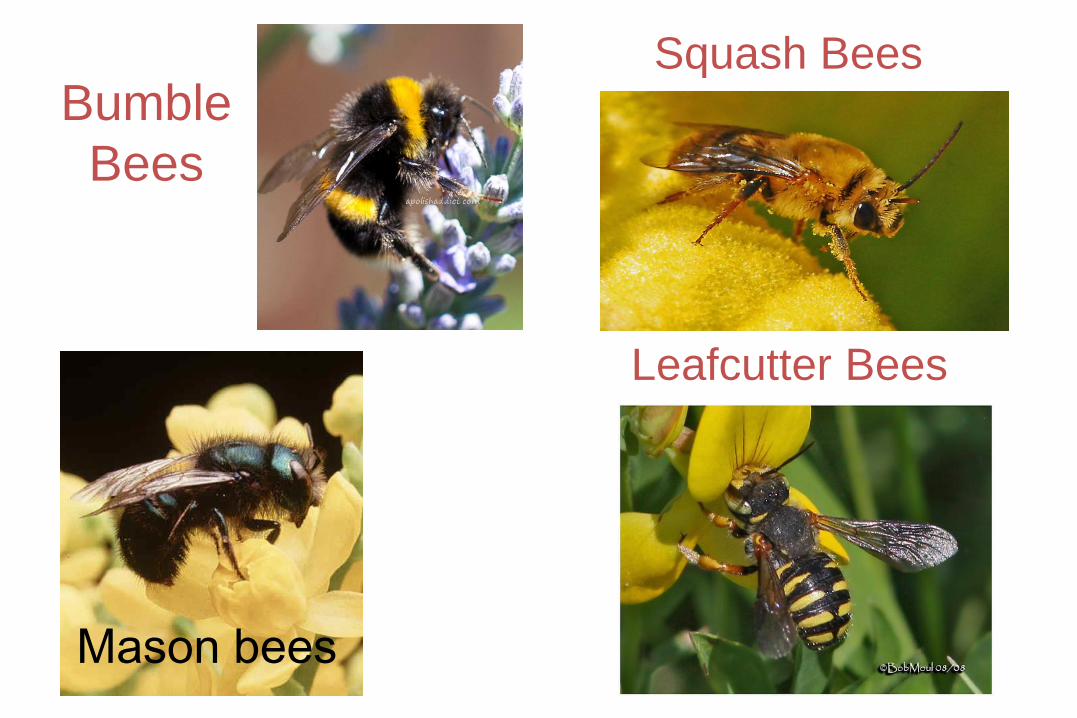
Bumble
Bees
Leafcutter Bees
Mason bees
Squash Bees
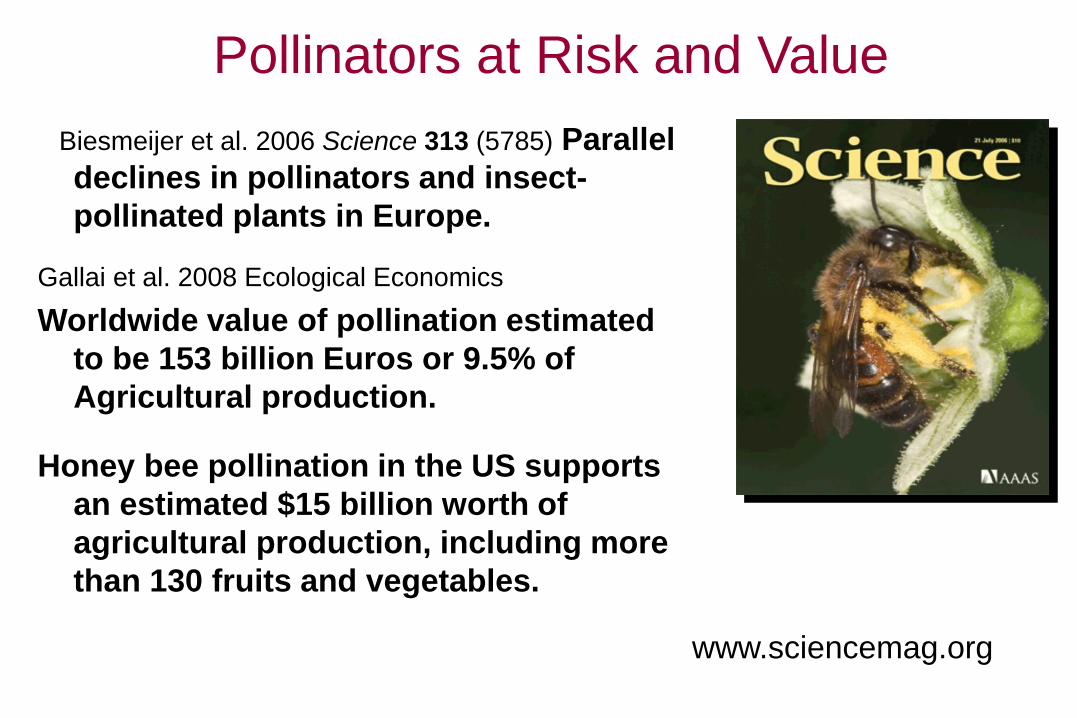
Pollinators at Risk and Value
• Biesmeijer et al. 2006 Science 313 (5785) Parallel
declines in pollinators and insect-
pollinated plants in Europe.
Gallai et al. 2008 Ecological Economics
Worldwide value of pollination estimated
to be 153 billion Euros or 9.5% of
Agricultural production.
Honey bee pollination in the US supports
an estimated $15 billion worth of
agricultural production, including more
than 130 fruits and vegetables.
www.sciencemag.org
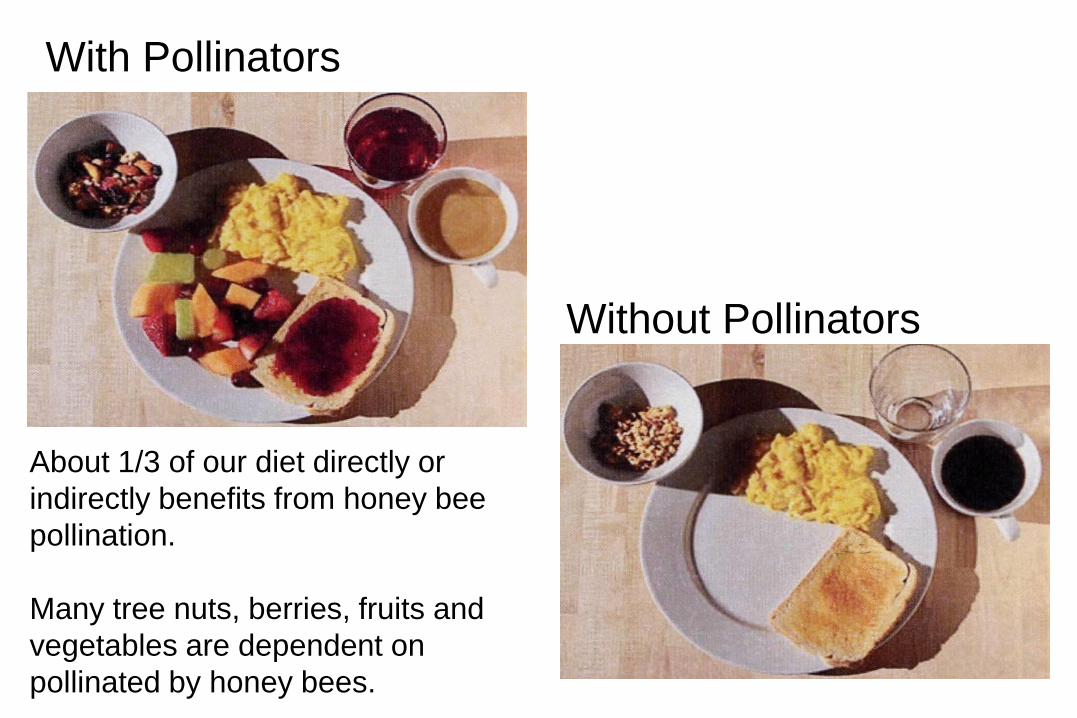
With Pollinators
Without Pollinators
About 1/3 of our diet directly or
indirectly benefits from honey bee
pollination.
Many tree nuts, berries, fruits and
vegetables are dependent on
pollinated by honey bees.
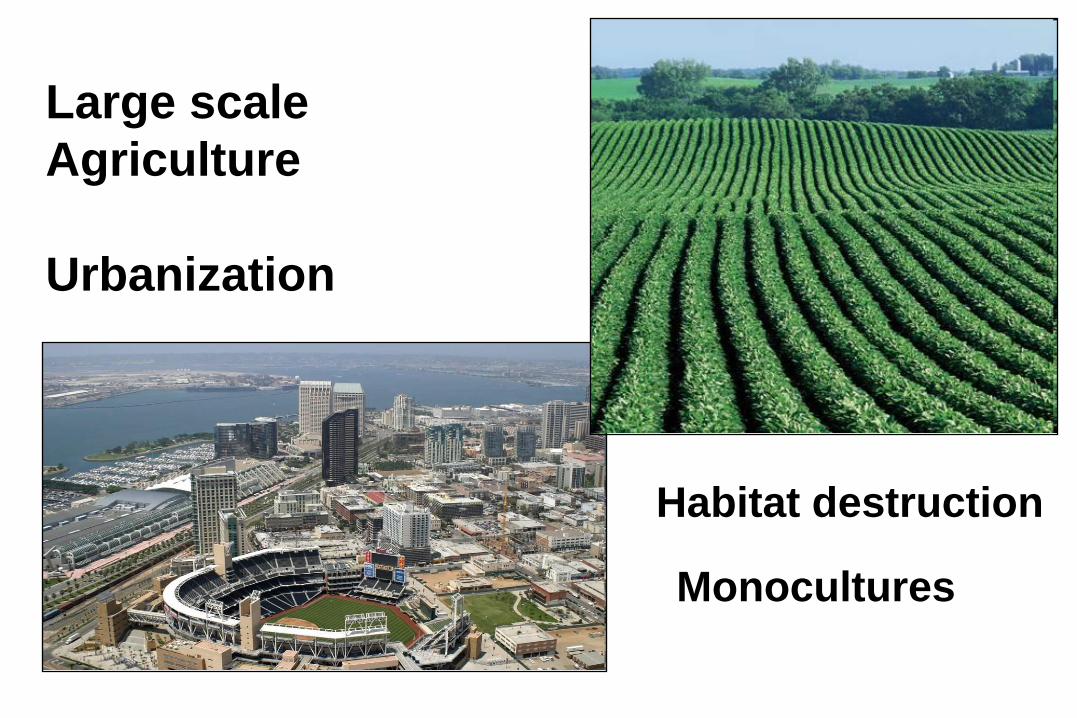
Large scale
Agriculture
Urbanization
Habitat destruction
Monocultures
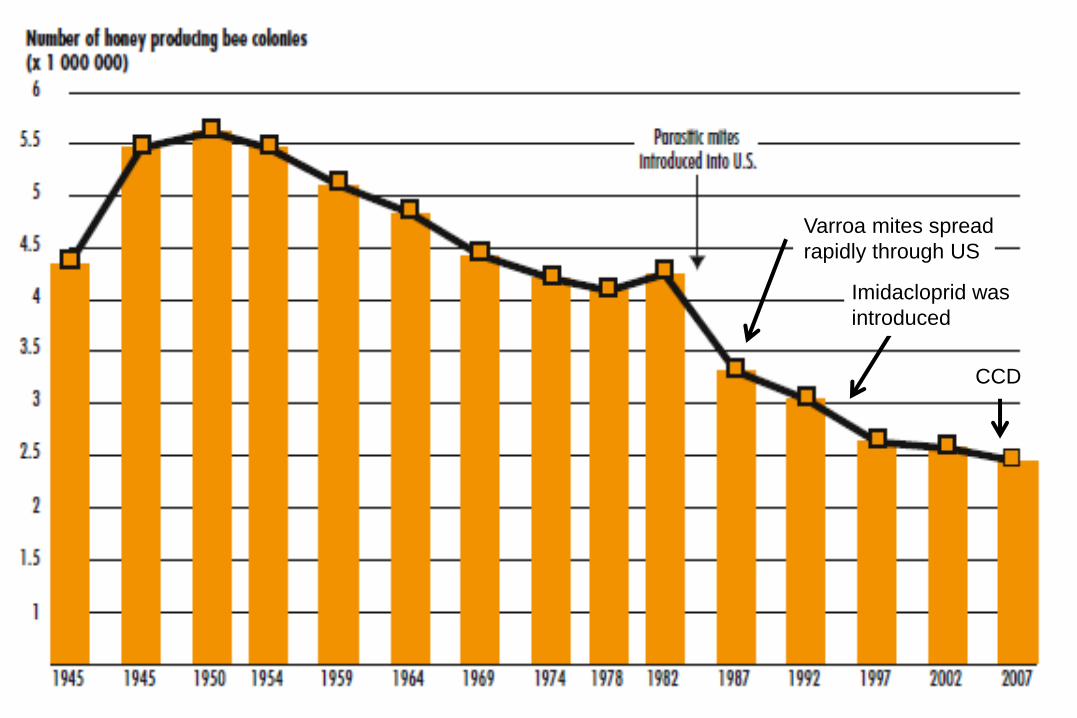
Varroa mites spread
rapidly through US
Imidacloprid was
introduced
CCD
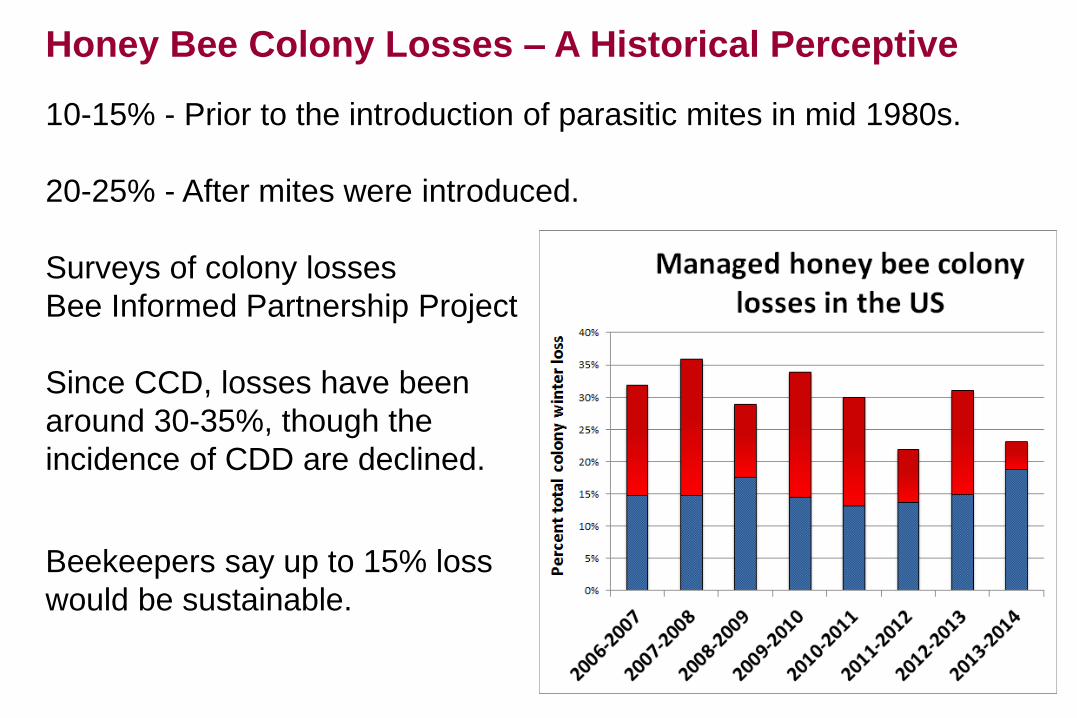
Honey Bee Colony Losses – A Historical Perceptive
10-15% - Prior to the introduction of parasitic mites in mid 1980s.
20-25% - After mites were introduced.
Surveys of colony losses
Bee Informed Partnership Project
Since CCD, losses have been
around 30-35%, though the
incidence of CDD are declined.
Beekeepers say up to 15% loss
would be sustainable.
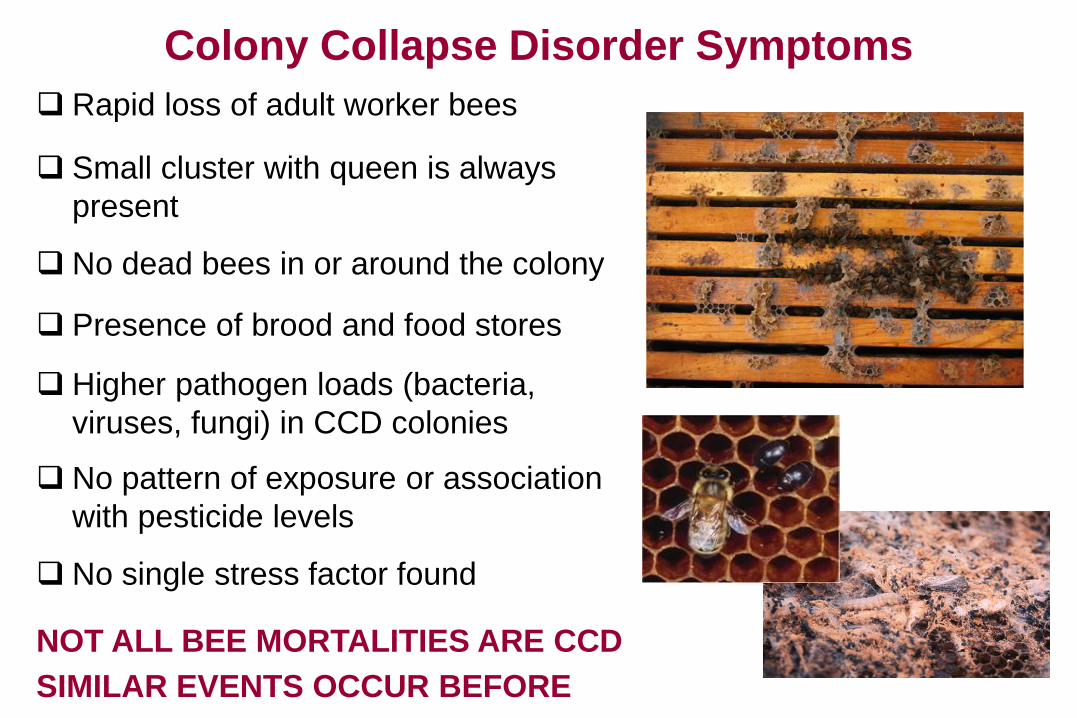
Colony Collapse Disorder Symptoms
Rapid loss of adult worker bees
Small cluster with queen is always
present
No dead bees in or around the colony
Presence of brood and food stores
Higher pathogen loads (bacteria,
viruses, fungi) in CCD colonies
No pattern of exposure or association
with pesticide levels
No single stress factor found
NOT ALL BEE MORTALITIES ARE CCD
SIMILAR EVENTS OCCUR BEFORE
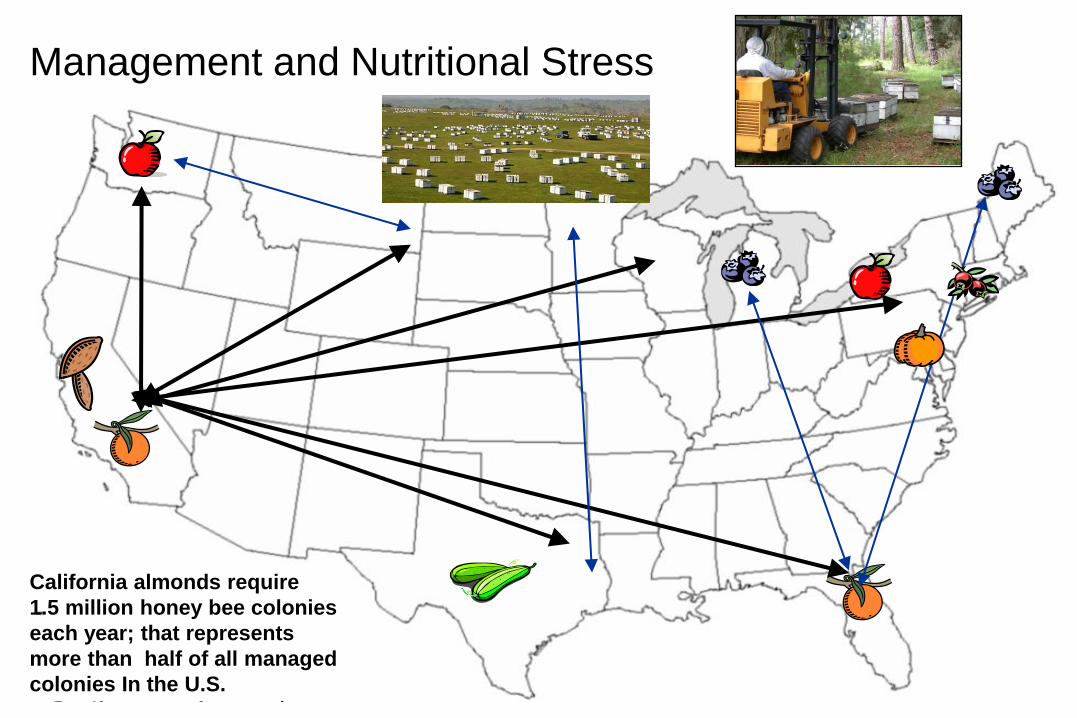
Major Migratory Routes of Honey Bee Colonies
California almonds require
1.5 million honey bee colonies
each year; that represents
more than half of all managed
colonies In the U.S.
Management and Nutritional Stress
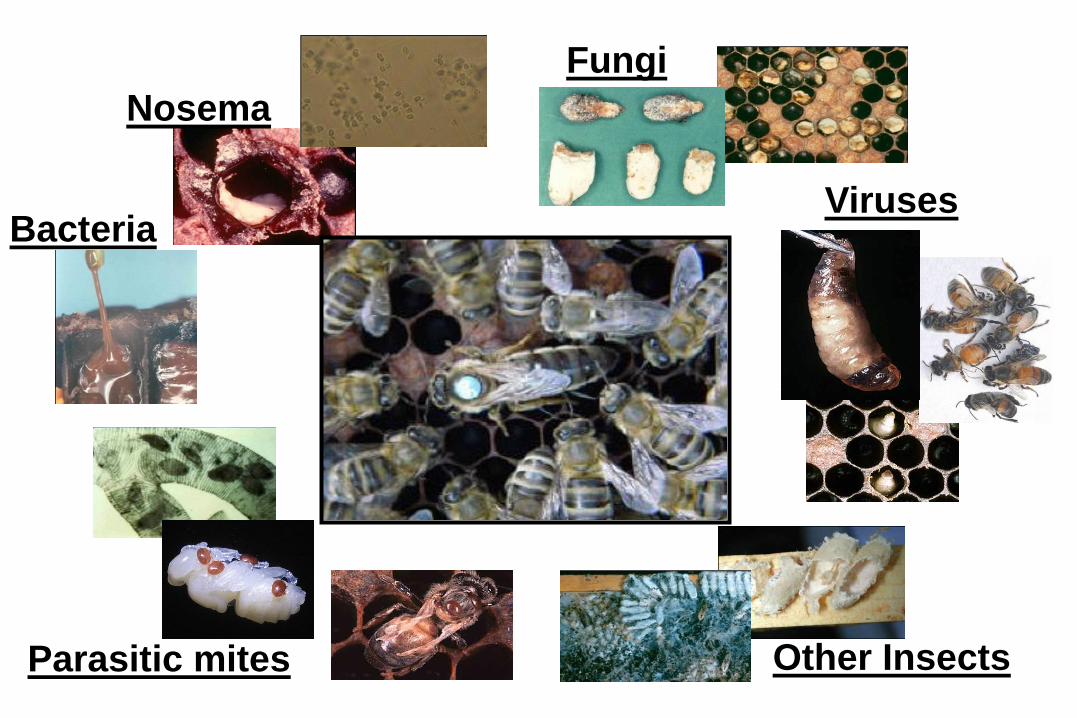
Bacteria
Parasitic mites Other Insects
Fungi
Nosema
Viruses
Fungi
Nosema Viruses
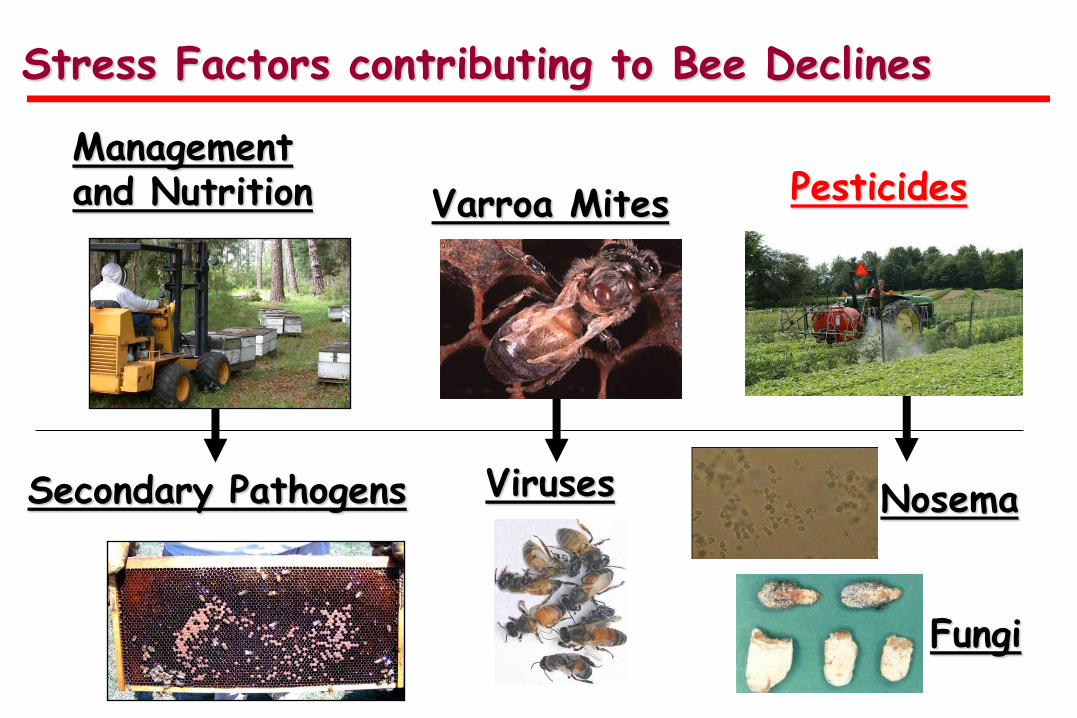
Management and Nutrition
Secondary Pathogens
Stress Factors contributing to Bee Declines
Pesticides Varroa Mites
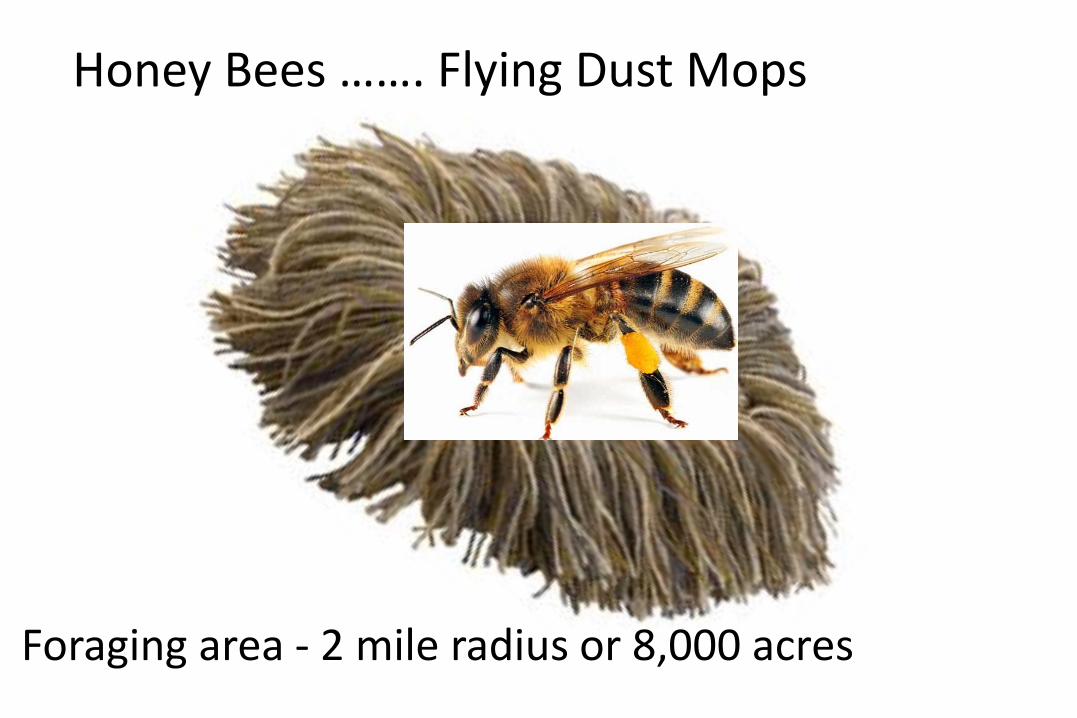
Honey Bees ……. Flying Dust Mops
Foraging area - 2 mile radius or 8,000 acres
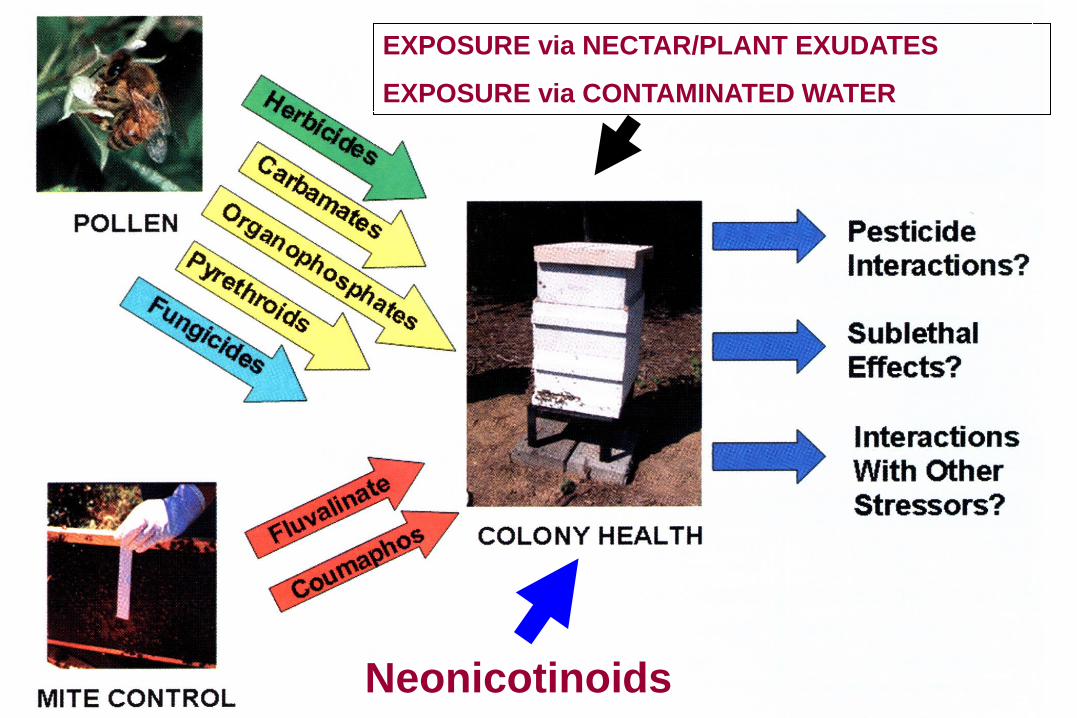
Exposure via nectar EXPOSURE via NECTAR/PLANT EXUDATES
EXPOSURE via CONTAMINATED WATER
Neonicotinoids
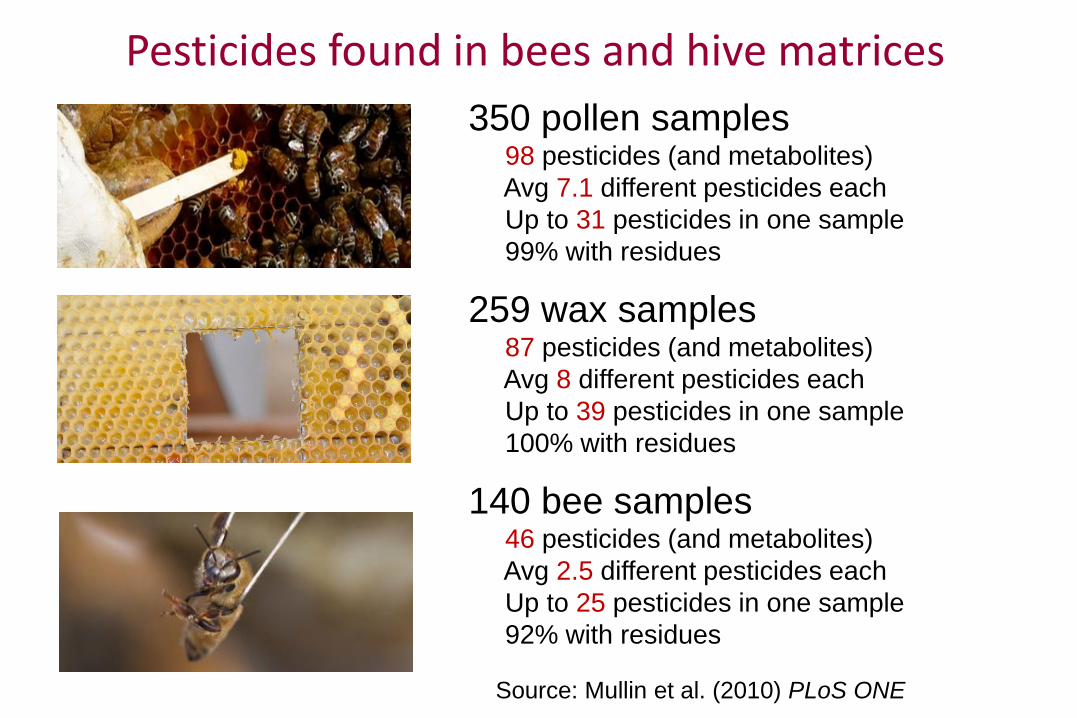
Pesticides found in bees and hive matrices
Source: Mullin et al. (2010) PLoS ONE
350 pollen samples 98 pesticides (and metabolites)
Avg 7.1 different pesticides each
Up to 31 pesticides in one sample
99% with residues
259 wax samples 87 pesticides (and metabolites)
Avg 8 different pesticides each
Up to 39 pesticides in one sample
100% with residues
140 bee samples 46 pesticides (and metabolites)
Avg 2.5 different pesticides each
Up to 25 pesticides in one sample
92% with residues
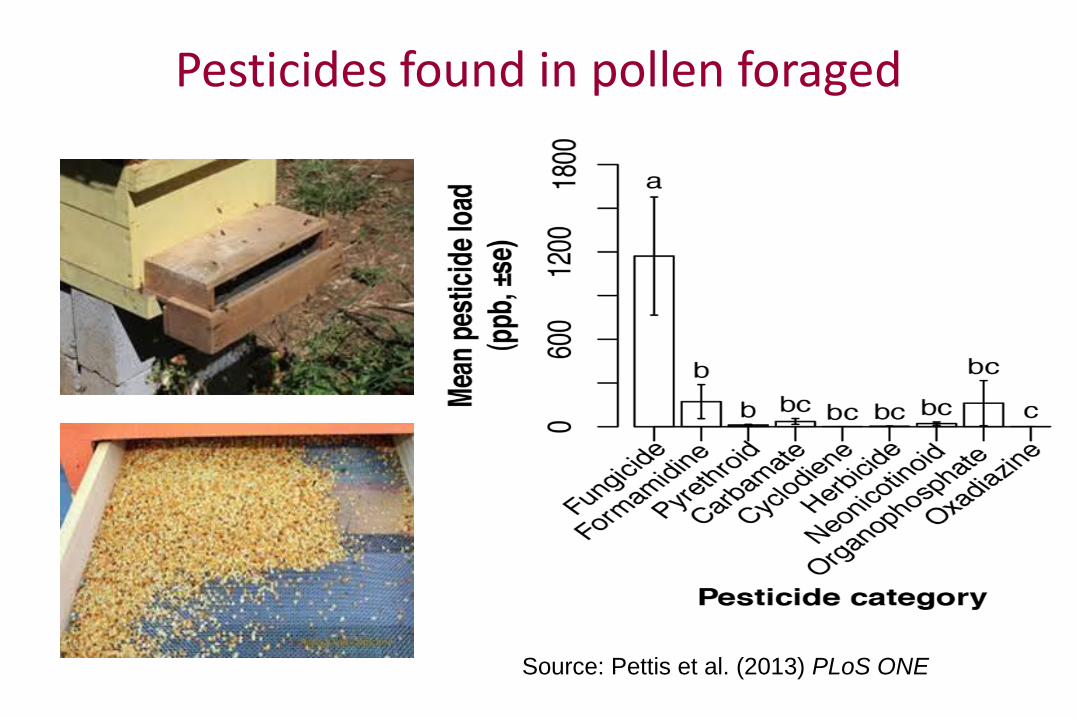
Pesticides found in pollen foraged
Source: Pettis et al. (2013) PLoS ONE
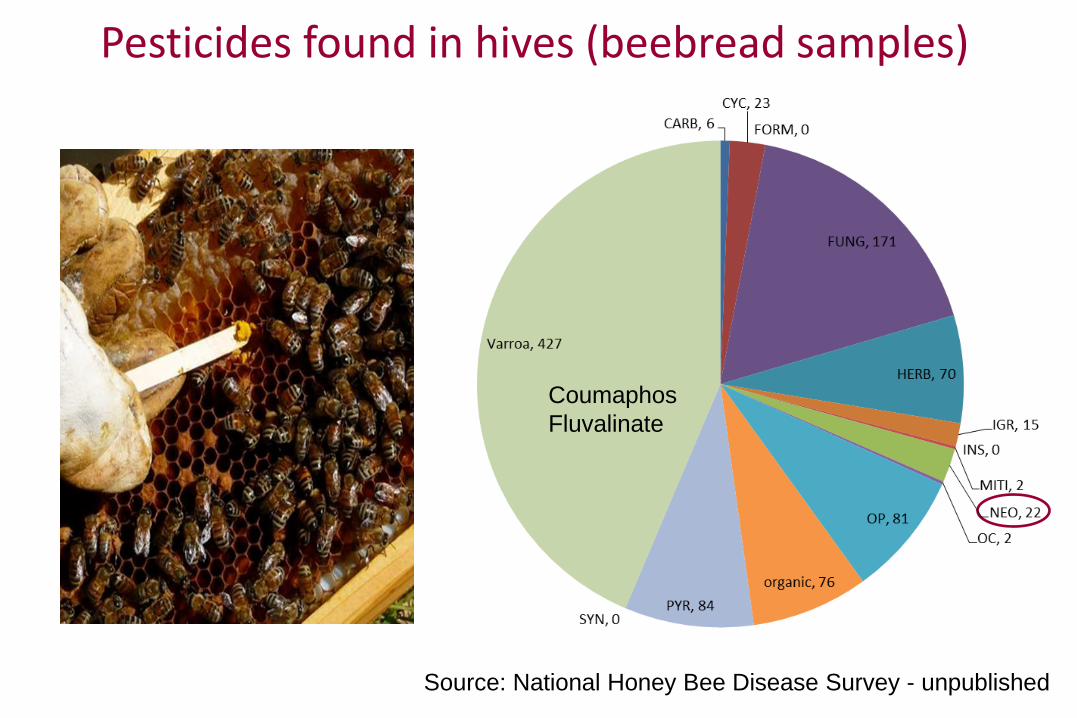
Pesticides found in hives (beebread samples)
Source: National Honey Bee Disease Survey - unpublished
Coumaphos
Fluvalinate
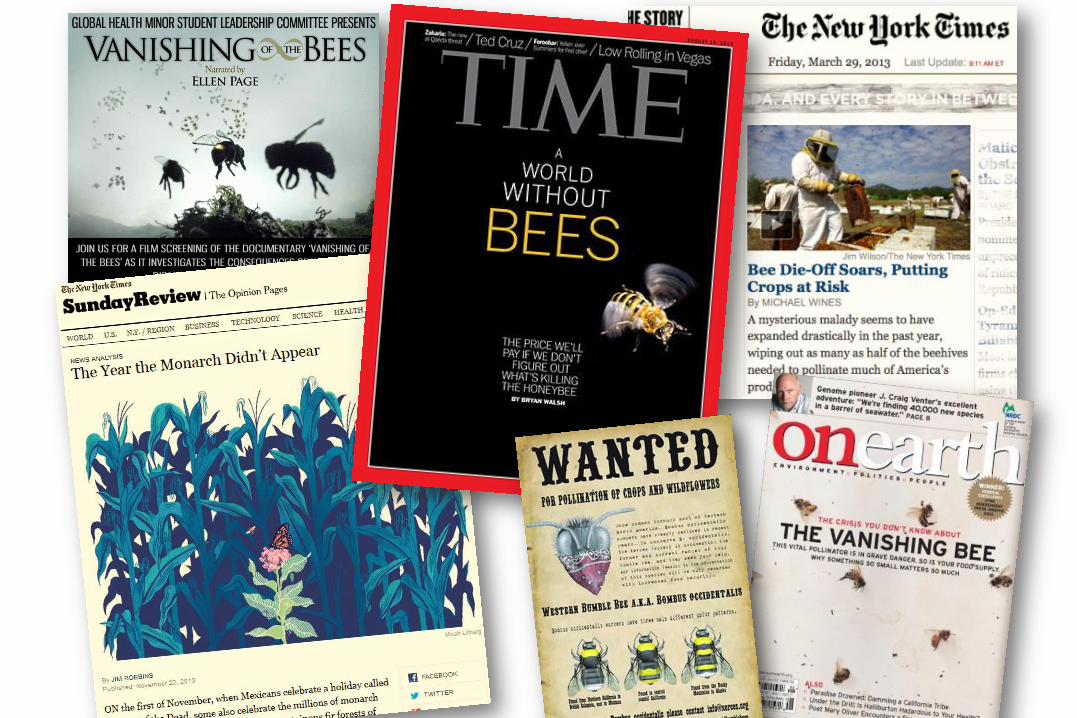
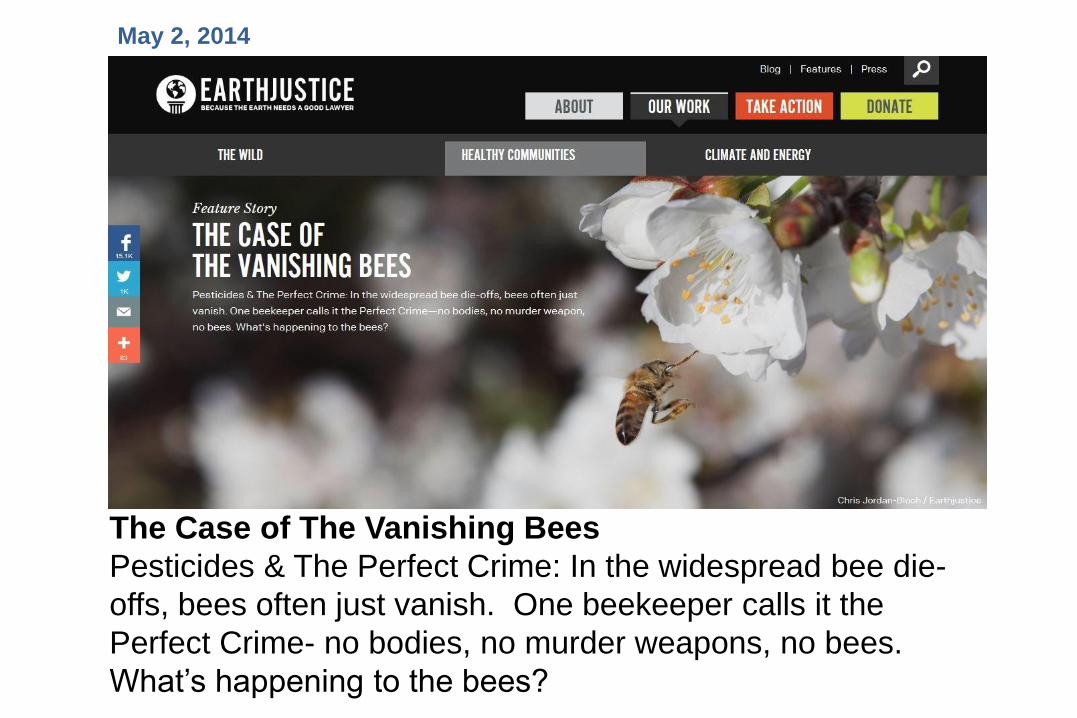
The Case of The Vanishing Bees
Pesticides & The Perfect Crime: In the widespread bee die-
offs, bees often just vanish. One beekeeper calls it the
Perfect Crime- no bodies, no murder weapons, no bees.
What’s happening to the bees?
May 2, 2014
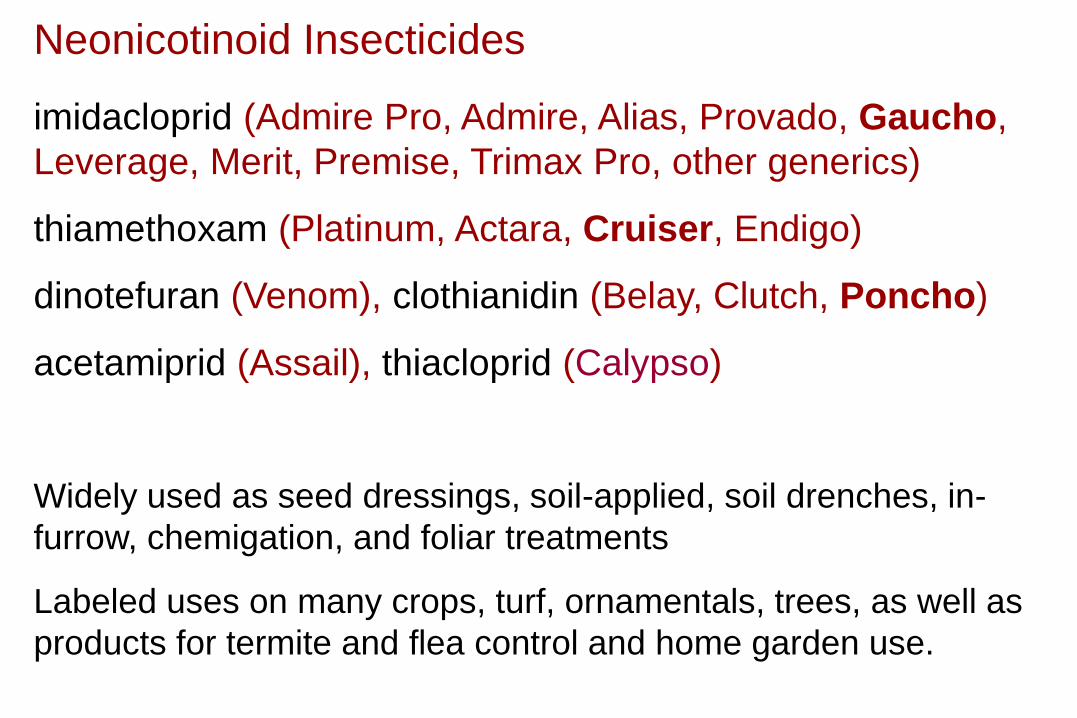
Neonicotinoid Insecticides
imidacloprid (Admire Pro, Admire, Alias, Provado, Gaucho,
Leverage, Merit, Premise, Trimax Pro, other generics)
thiamethoxam (Platinum, Actara, Cruiser, Endigo)
dinotefuran (Venom), clothianidin (Belay, Clutch, Poncho)
acetamiprid (Assail), thiacloprid (Calypso)
Widely used as seed dressings, soil-applied, soil drenches, in-
furrow, chemigation, and foliar treatments
Labeled uses on many crops, turf, ornamentals, trees, as well as
products for termite and flea control and home garden use.
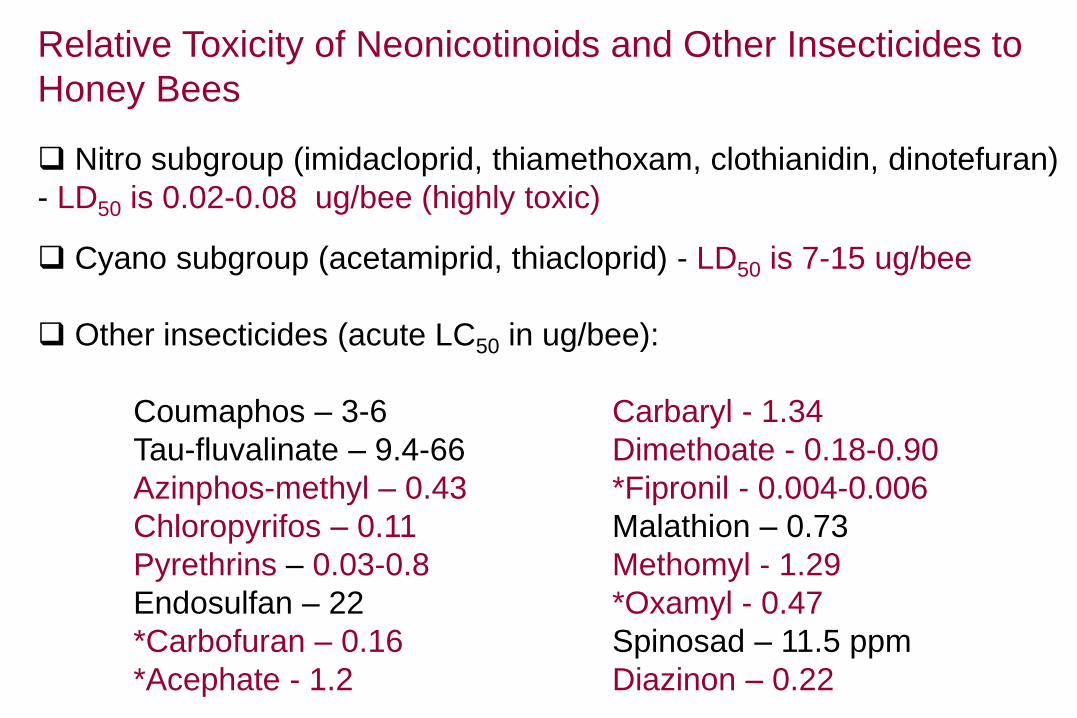
Relative Toxicity of Neonicotinoids and Other Insecticides to
Honey Bees
Nitro subgroup (imidacloprid, thiamethoxam, clothianidin, dinotefuran)
- LD50 is 0.02-0.08 ug/bee (highly toxic)
Cyano subgroup (acetamiprid, thiacloprid) - LD50 is 7-15 ug/bee
Other insecticides (acute LC50 in ug/bee):
Coumaphos – 3-6 Carbaryl - 1.34
Tau-fluvalinate – 9.4-66 Dimethoate - 0.18-0.90
Azinphos-methyl – 0.43 *Fipronil - 0.004-0.006
Chloropyrifos – 0.11 Malathion – 0.73
Pyrethrins – 0.03-0.8 Methomyl - 1.29
Endosulfan – 22 *Oxamyl - 0.47
*Carbofuran – 0.16 Spinosad – 11.5 ppm
*Acephate - 1.2 Diazinon – 0.22
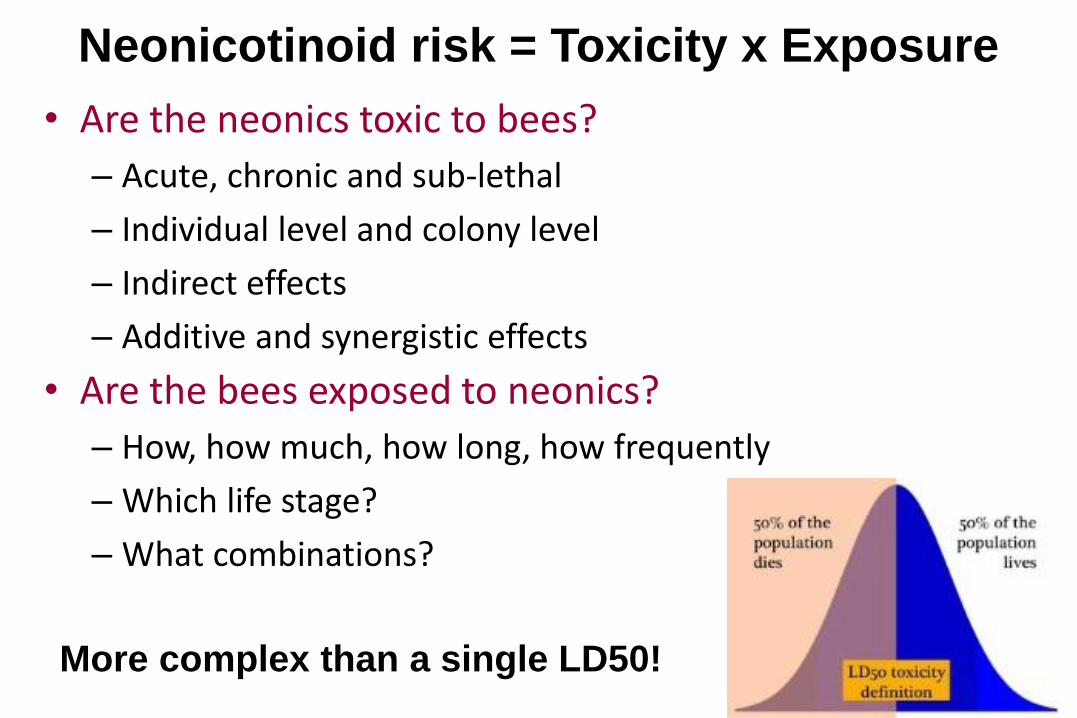
• Are the bees exposed to neonics?
– How, how much, how long, how frequently
– Which life stage?
– What combinations?
Neonicotinoid risk = Toxicity x Exposure
More complex than a single LD50!
• Are the neonics toxic to bees?
– Acute, chronic and sub-lethal
– Individual level and colony level
– Indirect effects
– Additive and synergistic effects
Results of laboratory studies on neonicotinoid effects
on individual honey bees:
Many studies show that exposure levels above 20 ppb of imidacloprid
can cause subtle physiological and behavioral abnormalities in honey
bees, including reductions in associative learning, queen fecundity and
foraging activity, as well as increased susceptibility to other stresses.
Many lab tests have investigated effects at doses above the field-
realistic range, results are conflicting, and some disagreed with the
effects observed in field studies.
Measure sublethal effects on individual bees by exposing them to
single doses in sucrose water or contaminated pollen. Hard to
extrapolate lab results to the health of a functional colony which can
compensate for many stresses.
Primary routes of neonicotinoid exposure to bees:
direct exposure from pesticide applications.
- direct contact while foraging during bloom
- exposure to residues after heavy dew
- drift on non-crop flowering vegetation
Synergistic interactions between neonics and medications increase
toxicity and potential sublethal effects to bees (Johnson et al. 2009,
Hawthorne and Dively 2011).
Certain azole fungicides can synergize neonics and increase their
toxicity to honey bees by over 1,000 fold (Iwasa et al 2004).
Some fungicides alter honey bee foraging behavior and their
susceptibity to Nosema infections (Pettis et al. 2013).
Mounting evidence that fungicides may interfere with the conversion
of pollen into bee bread.
Accumulation of coumaphos in hive wax may alter certain metabolic
pathways in bee larvae and pupae (USDA Bee Lab, Beltsville, MD)
Direct exposure from neonicotinoid applications
Direct exposure from neonicotinoid applications
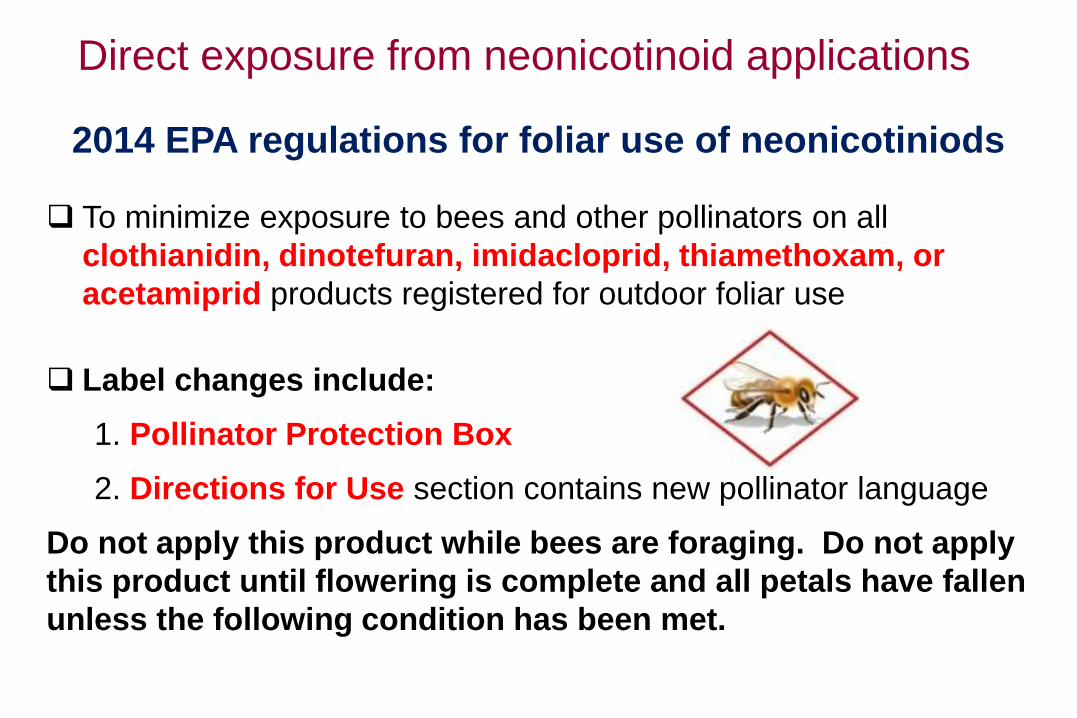
2014 EPA regulations for foliar use of neonicotiniods
To minimize exposure to bees and other pollinators on all
clothianidin, dinotefuran, imidacloprid, thiamethoxam, or
acetamiprid products registered for outdoor foliar use
Label changes include:
1. Pollinator Protection Box
2. Directions for Use section contains new pollinator language
Do not apply this product while bees are foraging. Do not apply
this product until flowering is complete and all petals have fallen
unless the following condition has been met.
Secondary routes of neonicotinoid exposure to bees:
residues in plant fluids released by guttation droplets.
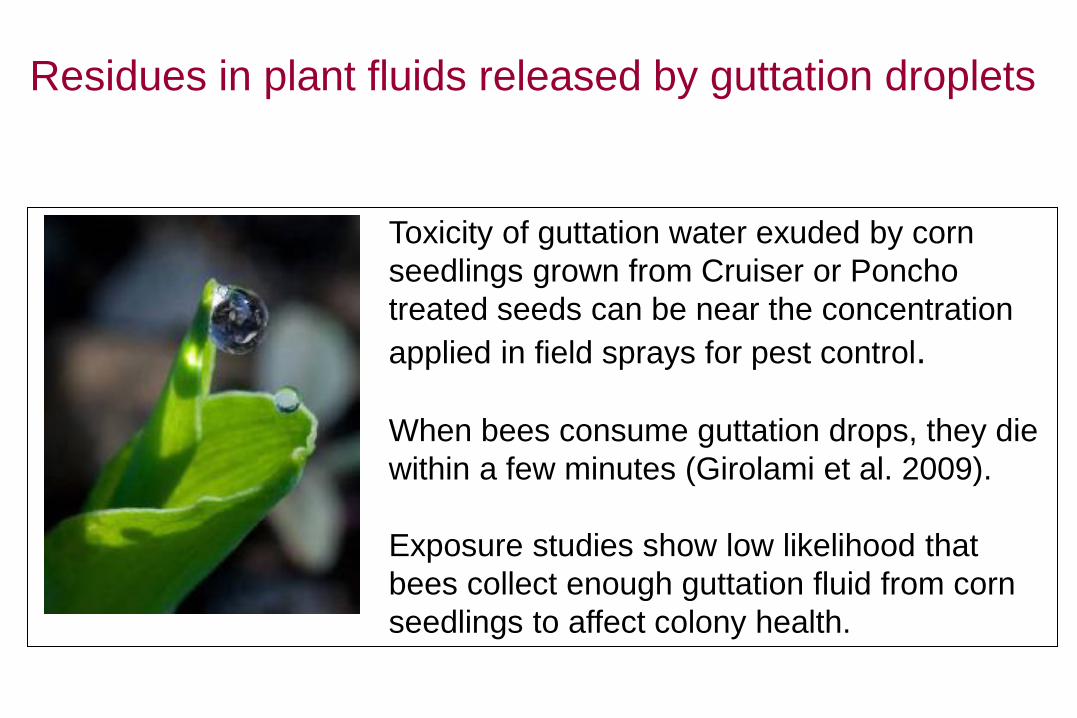
Residues in plant fluids released by guttation droplets
Toxicity of guttation water exuded by corn
seedlings grown from Cruiser or Poncho
treated seeds can be near the concentration
applied in field sprays for pest control.
When bees consume guttation drops, they die
within a few minutes (Girolami et al. 2009).
Exposure studies show low likelihood that
bees collect enough guttation fluid from corn
seedlings to affect colony health.

Secondary routes of neonicotinoid exposure to bees:
residues in contaminated water (i.e. spills, irrigation).
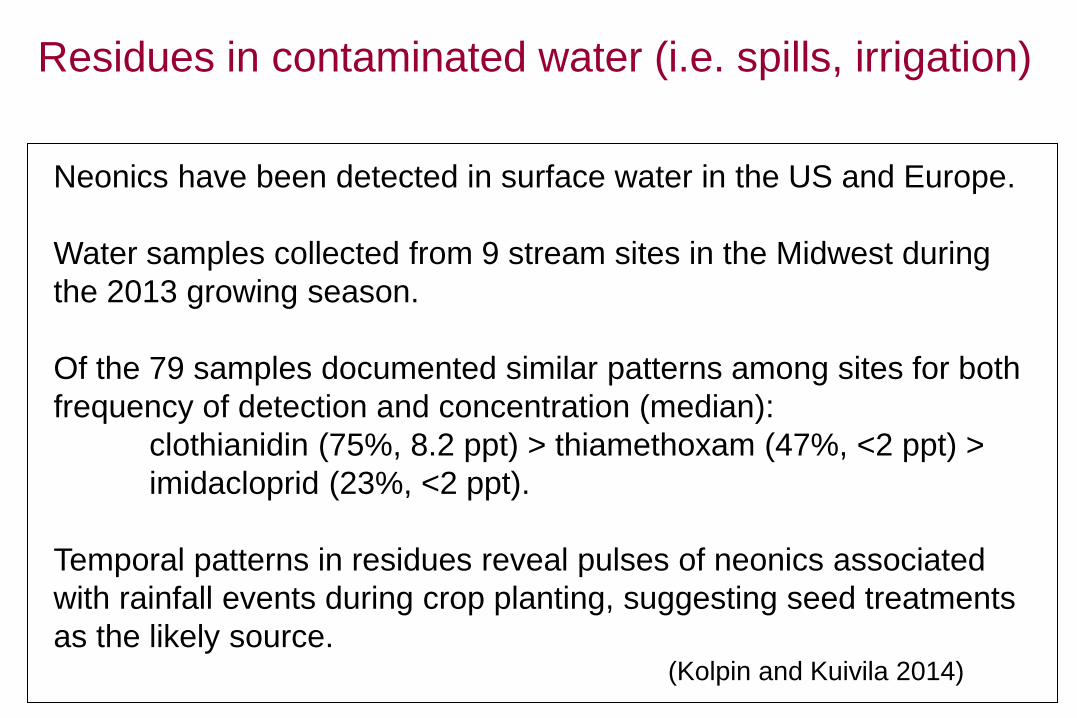
Residues in contaminated water (i.e. spills, irrigation)
Neonics have been detected in surface water in the US and Europe.
Water samples collected from 9 stream sites in the Midwest during
the 2013 growing season.
Of the 79 samples documented similar patterns among sites for both
frequency of detection and concentration (median):
clothianidin (75%, 8.2 ppt) > thiamethoxam (47%, <2 ppt) >
imidacloprid (23%, <2 ppt).
Temporal patterns in residues reveal pulses of neonics associated
with rainfall events during crop planting, suggesting seed treatments
as the likely source. (Kolpin and Kuivila 2014)
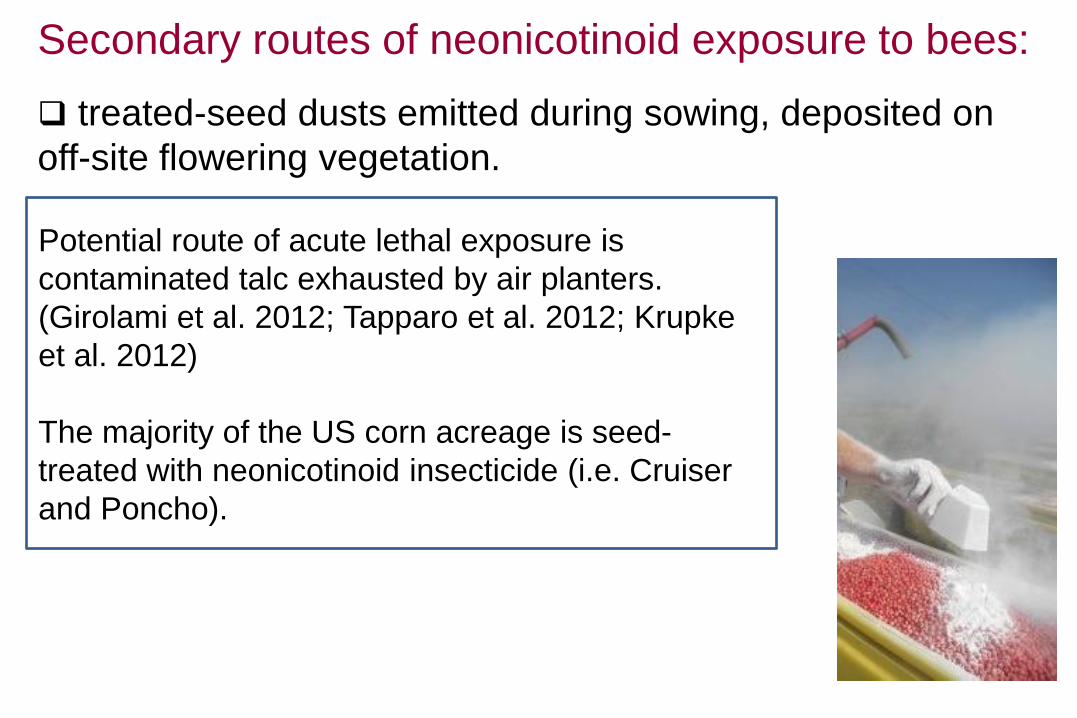
Secondary routes of neonicotinoid exposure to bees:
treated-seed dusts emitted during sowing, deposited on
off-site flowering vegetation.
Potential route of acute lethal exposure is
contaminated talc exhausted by air planters.
(Girolami et al. 2012; Tapparo et al. 2012; Krupke
et al. 2012)
The majority of the US corn acreage is seed-
treated with neonicotinoid insecticide (i.e. Cruiser
and Poncho).
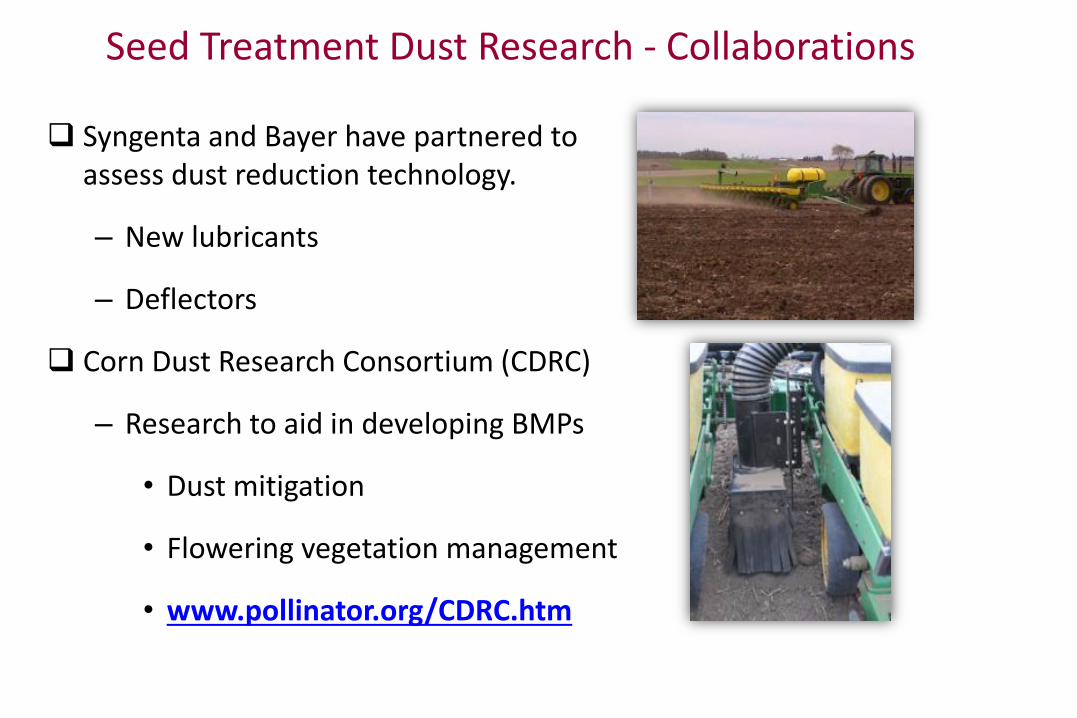
Seed Treatment Dust Research - Collaborations
Syngenta and Bayer have partnered to assess dust reduction technology.
– New lubricants
– Deflectors
Corn Dust Research Consortium (CDRC)
– Research to aid in developing BMPs
• Dust mitigation
• Flowering vegetation management
• www.pollinator.org/CDRC.htm

Residues in nectar and pollen
represent the major route of
neonicotinoid exposure to bees
Major focus on seed treatments
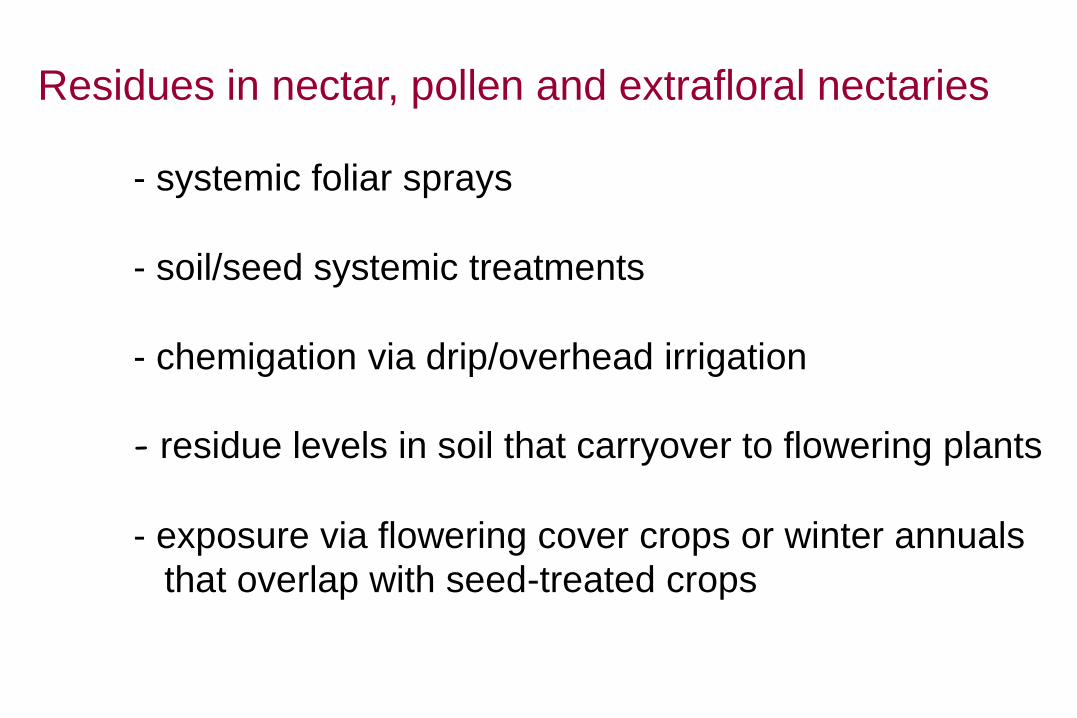
Residues in nectar, pollen and extrafloral nectaries
- systemic foliar sprays
- soil/seed systemic treatments
- chemigation via drip/overhead irrigation
- residue levels in soil that carryover to flowering plants
- exposure via flowering cover crops or winter annuals
that overlap with seed-treated crops
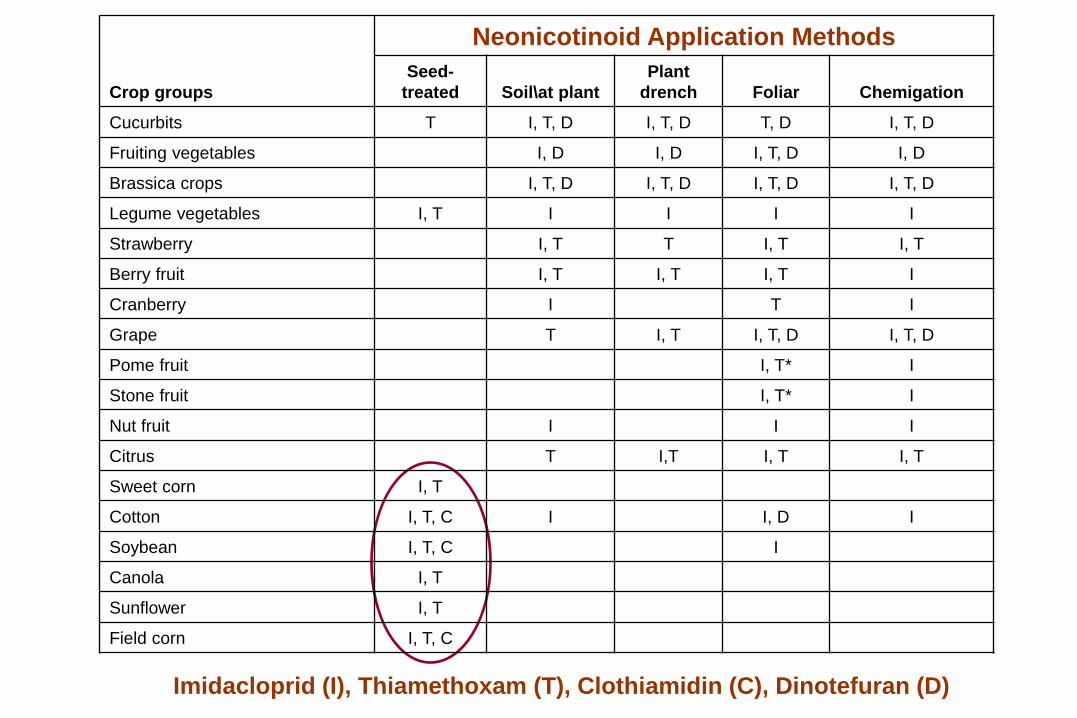
Crop groups
Neonicotinoid Application Methods
Seed-
treated Soil\at plant
Plant
drench Foliar Chemigation
Cucurbits T I, T, D I, T, D T, D I, T, D
Fruiting vegetables I, D I, D I, T, D I, D
Brassica crops I, T, D I, T, D I, T, D I, T, D
Legume vegetables I, T I I I I
Strawberry I, T T I, T I, T
Berry fruit I, T I, T I, T I
Cranberry I T I
Grape T I, T I, T, D I, T, D
Pome fruit I, T* I
Stone fruit I, T* I
Nut fruit I I I
Citrus T I,T I, T I, T
Sweet corn I, T
Cotton I, T, C I I, D I
Soybean I, T, C I
Canola I, T
Sunflower I, T
Field corn I, T, C
Imidacloprid (I), Thiamethoxam (T), Clothiamidin (C), Dinotefuran (D)
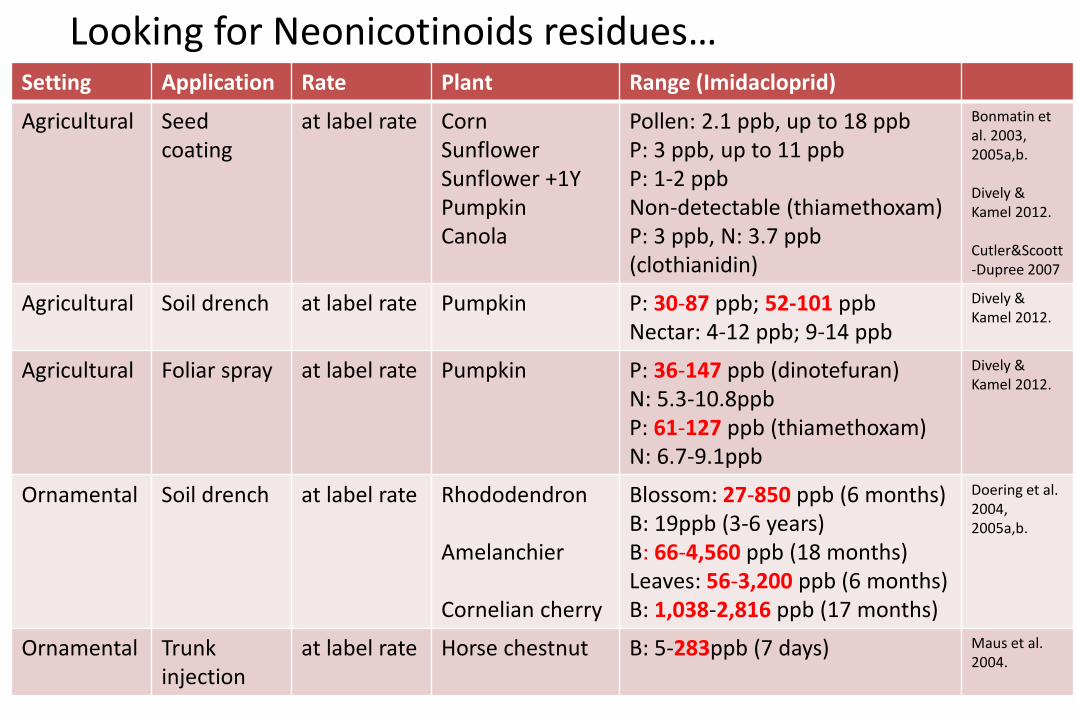
Looking for Neonicotinoids residues…
Setting Application Rate Plant Range (Imidacloprid)
Agricultural Seed coating
at label rate Corn Sunflower Sunflower +1Y Pumpkin Canola
Pollen: 2.1 ppb, up to 18 ppb P: 3 ppb, up to 11 ppb P: 1-2 ppb Non-detectable (thiamethoxam) P: 3 ppb, N: 3.7 ppb (clothianidin)
Bonmatin et al. 2003, 2005a,b. Dively & Kamel 2012. Cutler&Scoott-Dupree 2007
Agricultural Soil drench at label rate Pumpkin P: 30-87 ppb; 52-101 ppb Nectar: 4-12 ppb; 9-14 ppb
Dively & Kamel 2012.
Agricultural Foliar spray at label rate Pumpkin P: 36-147 ppb (dinotefuran) N: 5.3-10.8ppb P: 61-127 ppb (thiamethoxam) N: 6.7-9.1ppb
Dively & Kamel 2012.
Ornamental Soil drench at label rate Rhododendron Amelanchier Cornelian cherry
Blossom: 27-850 ppb (6 months) B: 19ppb (3-6 years) B: 66-4,560 ppb (18 months) Leaves: 56-3,200 ppb (6 months) B: 1,038-2,816 ppb (17 months)
Doering et al. 2004, 2005a,b.
Ornamental Trunk injection
at label rate Horse chestnut B: 5-283ppb (7 days) Maus et al. 2004.
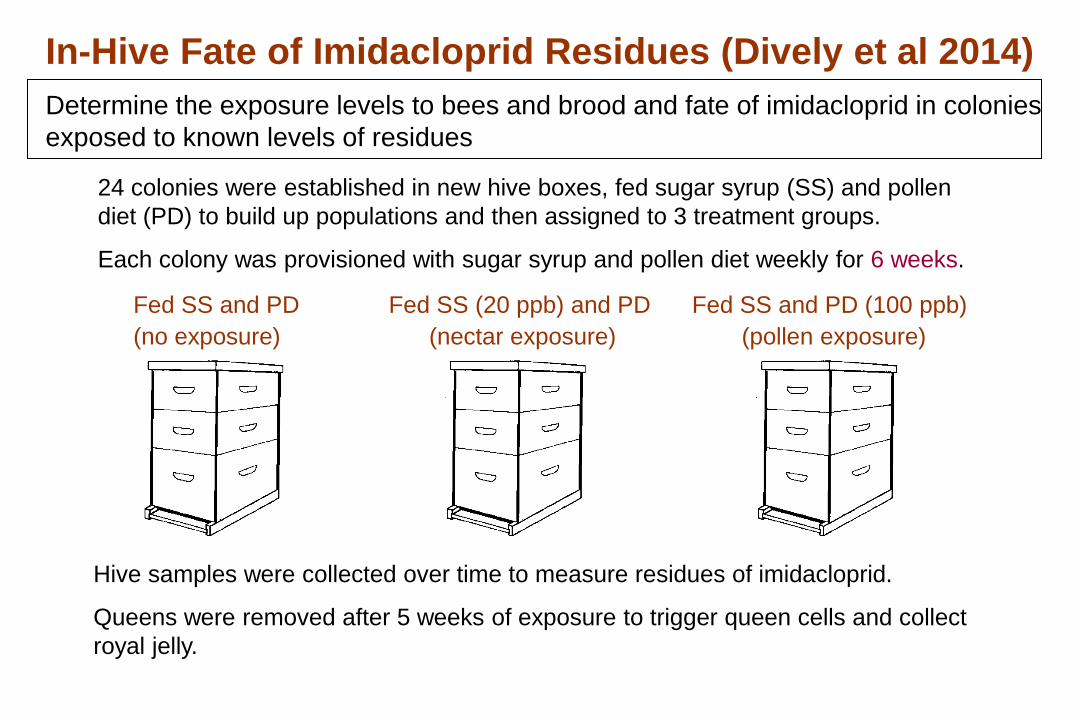
In-Hive Fate of Imidacloprid Residues (Dively et al 2014)
Determine the exposure levels to bees and brood and fate of imidacloprid in colonies
exposed to known levels of residues
Fed SS and PD
(no exposure)
24 colonies were established in new hive boxes, fed sugar syrup (SS) and pollen
diet (PD) to build up populations and then assigned to 3 treatment groups.
Each colony was provisioned with sugar syrup and pollen diet weekly for 6 weeks.
Fed SS (20 ppb) and PD
(nectar exposure)
Fed SS and PD (100 ppb)
(pollen exposure)
Hive samples were collected over time to measure residues of imidacloprid.
Queens were removed after 5 weeks of exposure to trigger queen cells and collect
royal jelly.
Treatment
Samples
taken at
Number of positive detections in 8 colonies
Range of residue levels (ppb)
Bees Beebread
Bee
larvae Honey
Royal
jelly Pollen diet
(100 ppb)
400 g
per week
(40 ug ai)
2 wks
exposure
6
0.2 - 1.4
8
0.5 – 1.7
1
0.4
7
4.7 – 13.4 -
6 wks
exposure
5
0.5 – 1.9
8
0.6 – 1.2
0
ND
7
2.8 - 10.8
8
0.3 – 1.0
6 wks after
exposure
8
0.3 – 0.5
8
0.8 – 1.4
0
ND
8
2.3 – 11.7 - Sugar syrup
(20 ppb)
2000 g
per week
(40 ug ai)
2 wks
exposure
3
0.2 – 0.5
2
0.7 – 1.0
1
0.5
4
0.2 – 3.7 -
6 wks
exposure
0
ND
3
0.2 – 0.9
0
ND
2
0.2 – 0.9
0
ND
6 wks after
exposure
0
ND
2
0.2 – 0.3
0
ND
2
0.2 – 0.5 -
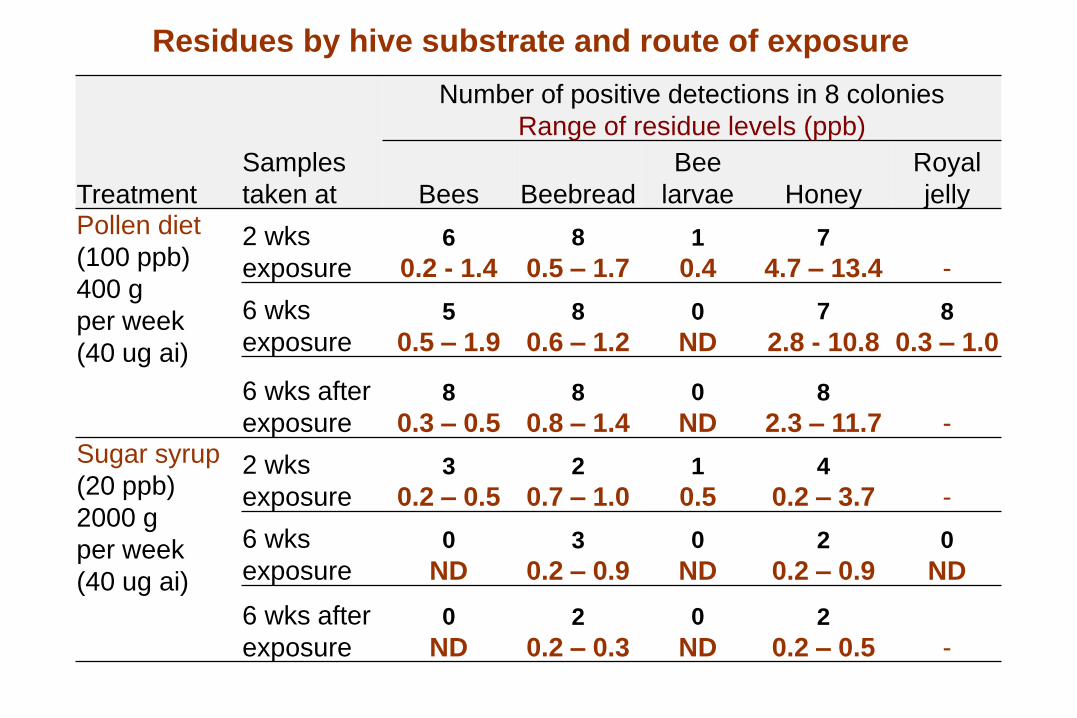
Residues by hive substrate and route of exposure
Treatment
Samples
taken at
Number of positive detections in 8 colonies
Range of residue levels (ppb)
Bees Beebread
Bee
larvae Honey
Royal
jelly
Pollen diet
(100 ppb) Fed 400 g
per week
2 wks
exposure
6
0.2 - 1.4
8
0.5 – 1.7
1
0.4
7
4.7 – 13.4 -
6 wks
exposure
5
0.5 – 1.9
8
0.6 – 1.2
0
ND
7
2.8 - 10.8
8
0.3 – 1.0
6 wks after
exposure
8
0.3 – 0.5
8
0.8 – 1.4
0
ND
8
2.3 – 11.7 - Sugar syrup
(20 ppb)
Fed 2000 g
per week
2 wks
exposure
3
0.2 – 0.5
2
0.7 – 1.0
1
0.5
4
0.2 – 3.7 -
6 wks
exposure
0
ND
3
0.2 – 0.9
0
ND
2
0.2 – 0.9
0
ND
6 wks after
exposure
0
ND
2
0.2 – 0.3
0
ND
2
0.2 – 0.5 -
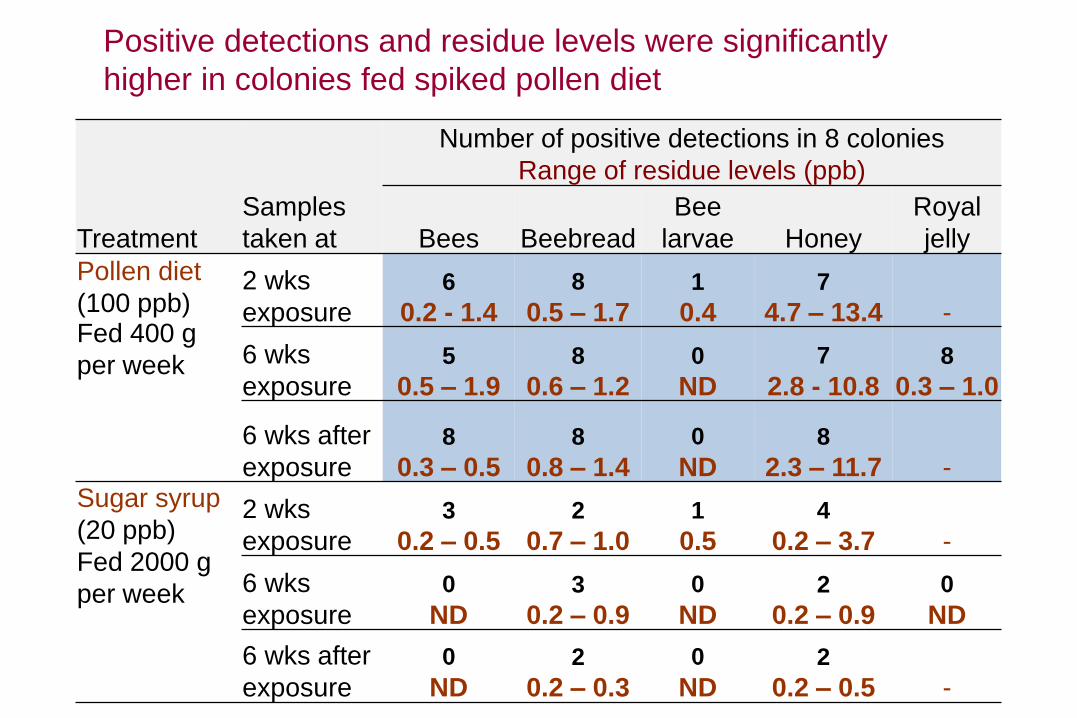
Positive detections and residue levels were significantly
higher in colonies fed spiked pollen diet
Treatment
Samples
taken at
Number of positive detections in 8 colonies
Range of residue levels (ppb)
Bees Beebread
Bee
larvae Honey
Royal
jelly
Pollen diet (100 ppb)
Fed 400 g
per week
2 wks
exposure
6
0.2 - 1.4
8
0.5 – 1.7
1
0.4
7
4.7 – 13.4 -
6 wks
exposure
5
0.5 – 1.9
8
0.6 – 1.2
0
ND
7
2.8 - 10.8
8
0.3 – 1.0
6 wks after
exposure
8
0.3 – 0.5
8
0.8 – 1.4
0
ND
8
2.3 – 11.7 - Sugar syrup
(20 ppb)
Fed 2000 g
per week
2 wks
exposure
3
0.2 – 0.5
2
0.7 – 1.0
1
0.5
4
0.6 – 3.7 -
6 wks
exposure
0
ND
3
0.2 – 0.9
0
ND
2
0.2 – 0.9
0
ND
6 wks after
exposure
0
ND
2
0.2 – 0.3
0
ND
2
0.2 – 0.5 -
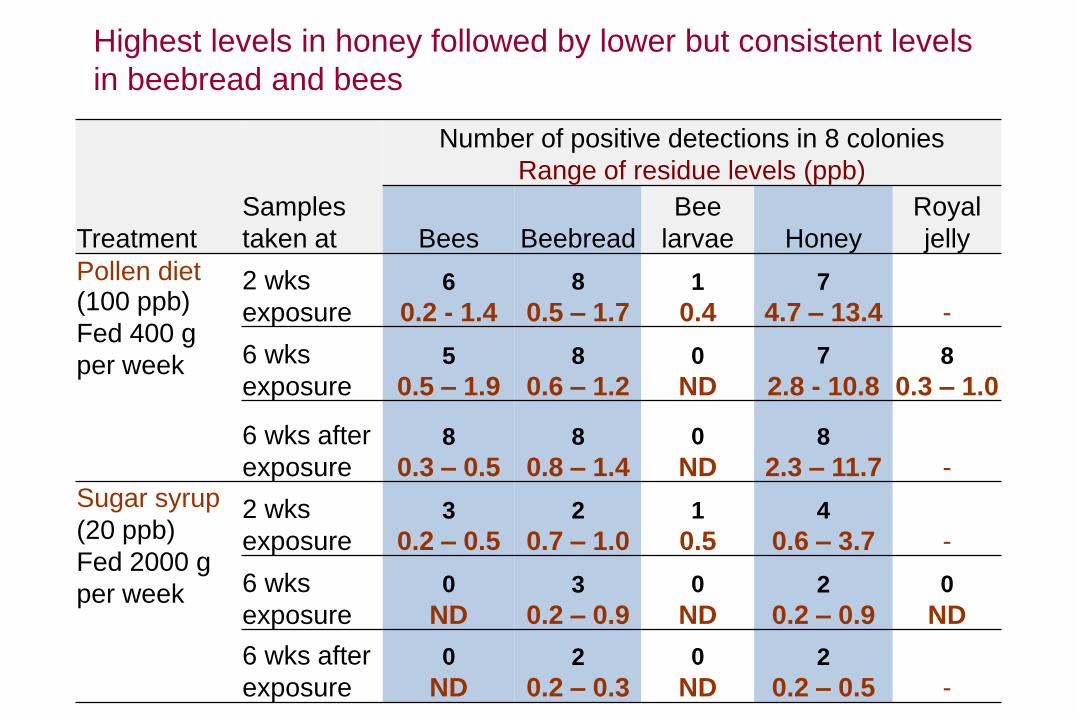
Highest levels in honey followed by lower but consistent levels
in beebread and bees

Treatment
Samples
taken at
Number of positive detections in 8 colonies
Range of residue levels (ppb)
Bees Beebread
Bee
larvae Honey
Royal
jelly
Pollen diet (100 ppb)
Fed 400 g
per week
2 wks
exposure
6
0.2 - 1.4
8
0.5 – 1.7
1
0.4
7
4.7 – 13.4 -
6 wks
exposure
5
0.5 – 1.9
8
0.6 – 1.2
0
ND
7
2.8 - 10.8
8
0.3 – 1.0
6 wks after
exposure
8
0.3 – 0.5
8
0.8 – 1.4
0
ND
8
2.3 – 11.7 - Sugar syrup
(20 ppb)
Fed 2000 g
per week
2 wks
exposure
3
0.2 – 0.5
2
0.7 – 1.0
1
0.5
4
0.6 – 3.7 -
6 wks
exposure
0
ND
3
0.2 – 0.9
0
ND
2
0.2 – 0.9
0
ND
6 wks after
exposure
0
ND
2
0.2 – 0.3
0
ND
2
0.2 – 0.5 -
Residues in larvae were non-detectable, except for several
samples collected at 2 weeks exposure
Treatment
Samples
taken at
Number of positive detections in 8 colonies
Range of residue levels (ppb)
Bees Beebread
Bee
larvae Honey
Royal
jelly
Pollen diet (100 ppb)
Fed 400 g
per week
2 wks
exposure
6
0.2 - 1.4
8
0.5 – 1.7
1
0.4
7
4.7 – 13.4 -
6 wks
exposure
5
0.5 – 1.9
8
0.6 – 1.2
0
ND
7
2.8 - 10.8
8
0.3 – 1.0
6 wks after
exposure
8
0.3 – 0.5
8
0.8 – 1.4
0
ND
8
2.3 – 11.7 - Sugar syrup
(20 ppb)
Fed 2000 g
per week
2 wks
exposure
3
0.2 – 0.5
2
0.7 – 1.0
1
0.5
4
0.6 – 3.7 -
6 wks
exposure
0
ND
3
0.2 – 0.9
0
ND
2
0.2 – 0.9
0
ND
6 wks after
exposure
0
ND
2
0.2 – 0.3
0
ND
2
0.2 – 0.5 -
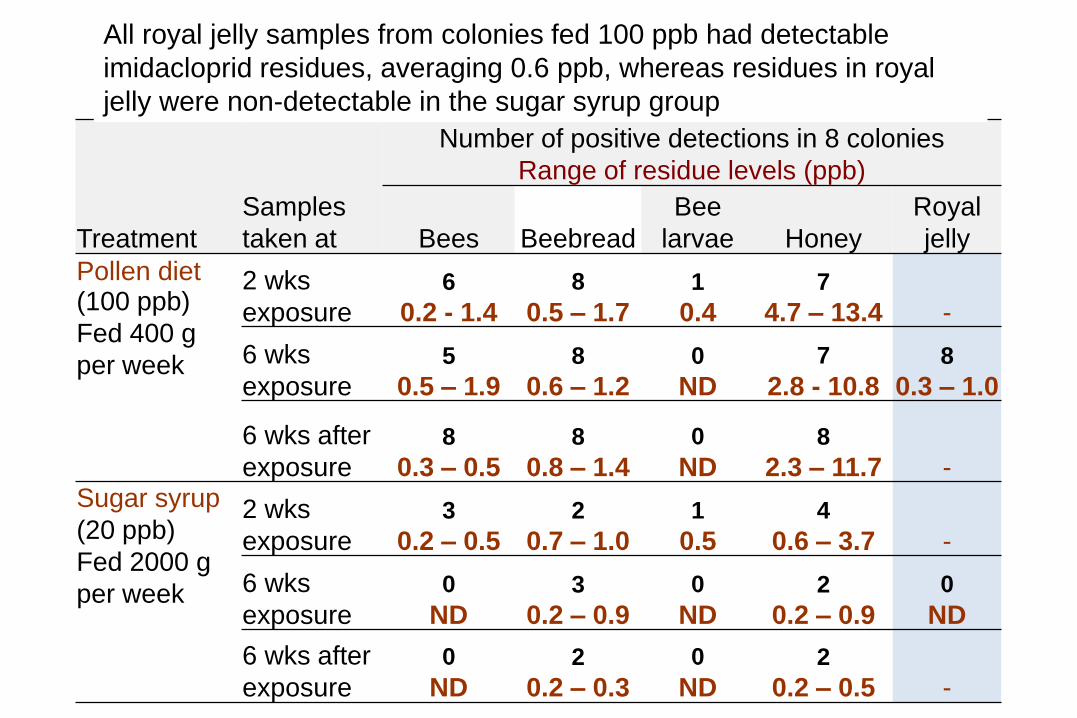
All royal jelly samples from colonies fed 100 ppb had detectable
imidacloprid residues, averaging 0.6 ppb, whereas residues in royal
jelly were non-detectable in the sugar syrup group
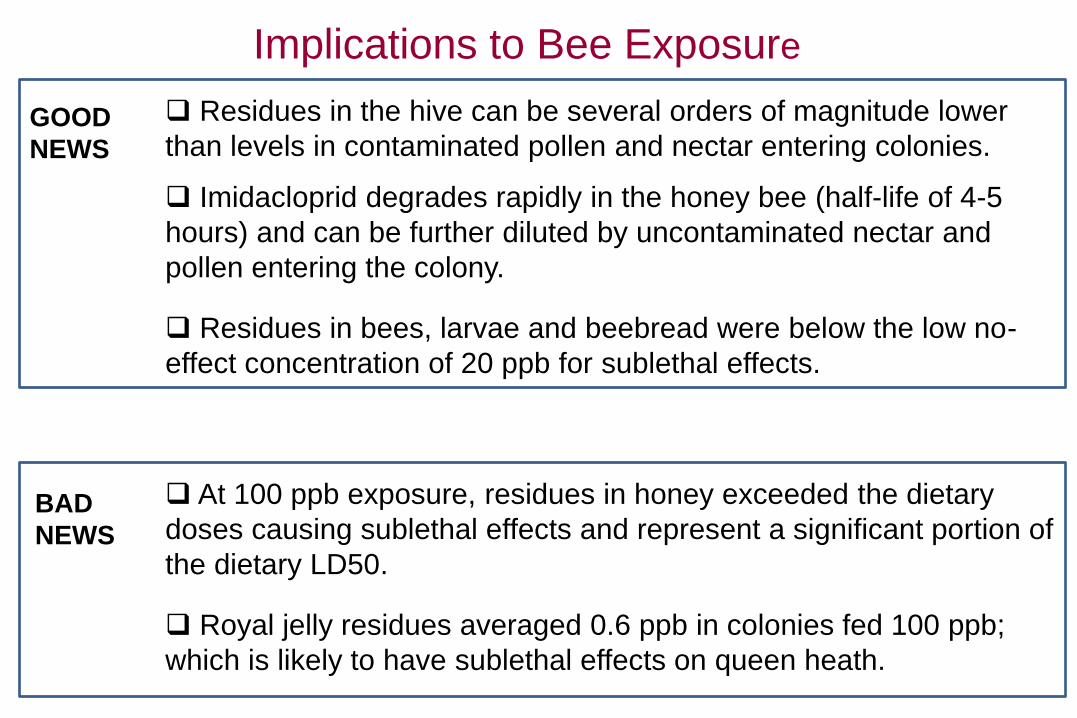
Implications to Bee Exposure
Residues in the hive can be several orders of magnitude lower
than levels in contaminated pollen and nectar entering colonies.
Imidacloprid degrades rapidly in the honey bee (half-life of 4-5
hours) and can be further diluted by uncontaminated nectar and
pollen entering the colony.
Residues in bees, larvae and beebread were below the low no-
effect concentration of 20 ppb for sublethal effects.
At 100 ppb exposure, residues in honey exceeded the dietary
doses causing sublethal effects and represent a significant portion of
the dietary LD50.
Royal jelly residues averaged 0.6 ppb in colonies fed 100 ppb;
which is likely to have sublethal effects on queen heath.
GOOD
NEWS
BAD
NEWS
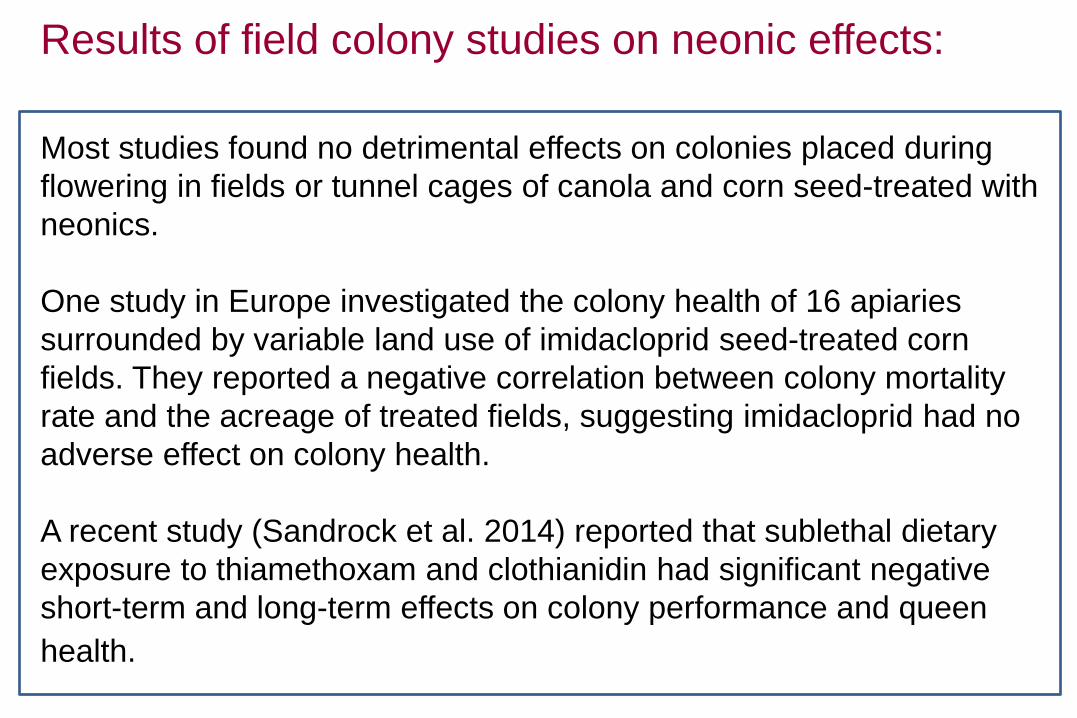
Results of field colony studies on neonic effects:
Most studies found no detrimental effects on colonies placed during
flowering in fields or tunnel cages of canola and corn seed-treated with
neonics.
One study in Europe investigated the colony health of 16 apiaries
surrounded by variable land use of imidacloprid seed-treated corn
fields. They reported a negative correlation between colony mortality
rate and the acreage of treated fields, suggesting imidacloprid had no
adverse effect on colony health.
A recent study (Sandrock et al. 2014) reported that sublethal dietary
exposure to thiamethoxam and clothianidin had significant negative
short-term and long-term effects on colony performance and queen
health.
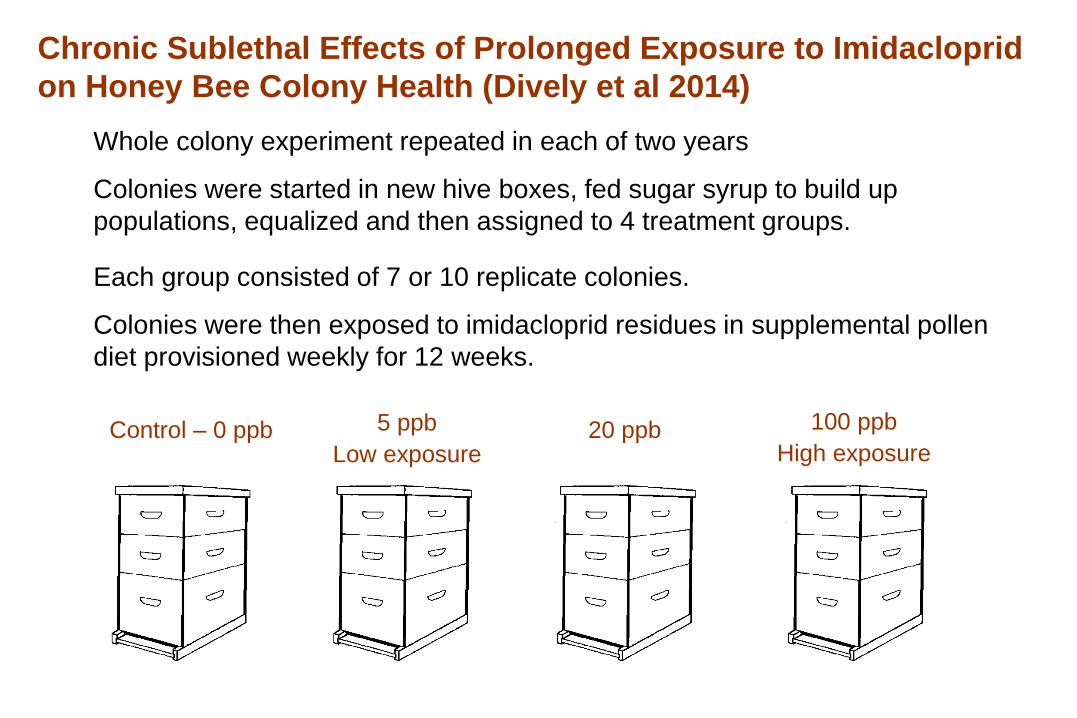
Chronic Sublethal Effects of Prolonged Exposure to Imidacloprid
on Honey Bee Colony Health (Dively et al 2014)
Control – 0 ppb
Whole colony experiment repeated in each of two years
Colonies were started in new hive boxes, fed sugar syrup to build up
populations, equalized and then assigned to 4 treatment groups.
5 ppb
Low exposure
Each group consisted of 7 or 10 replicate colonies.
Colonies were then exposed to imidacloprid residues in supplemental pollen
diet provisioned weekly for 12 weeks.
20 ppb 100 ppb
High exposure
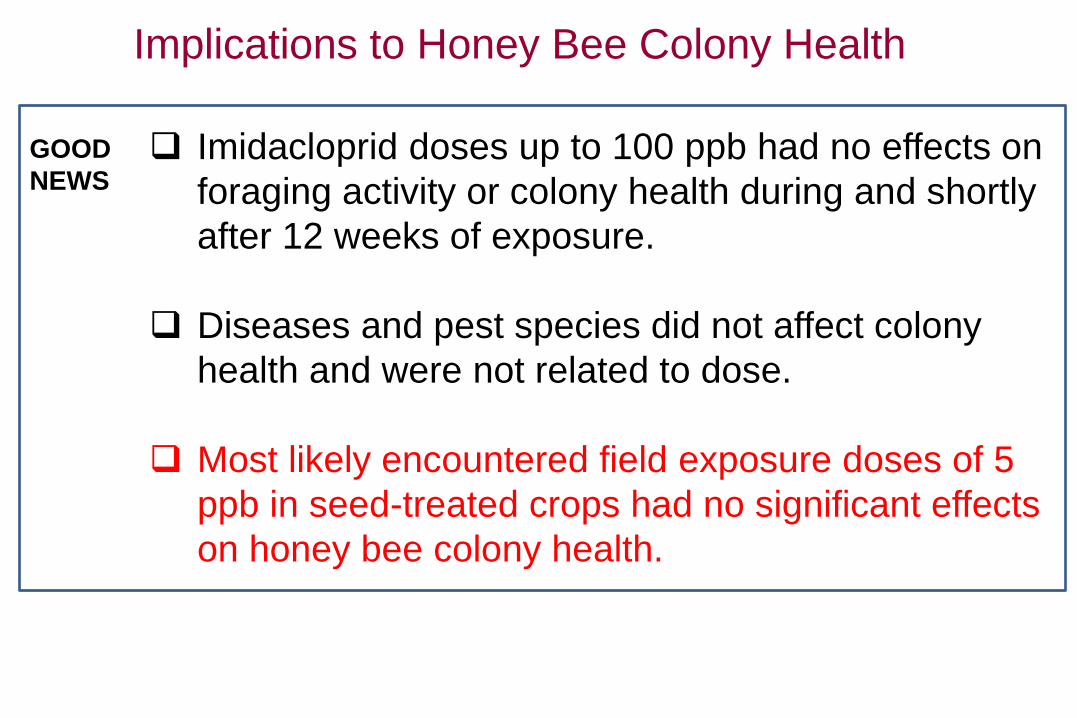
GOOD
NEWS Imidacloprid doses up to 100 ppb had no effects on
foraging activity or colony health during and shortly
after 12 weeks of exposure.
Diseases and pest species did not affect colony
health and were not related to dose.
Most likely encountered field exposure doses of 5
ppb in seed-treated crops had no significant effects
on honey bee colony health.
Implications to Honey Bee Colony Health
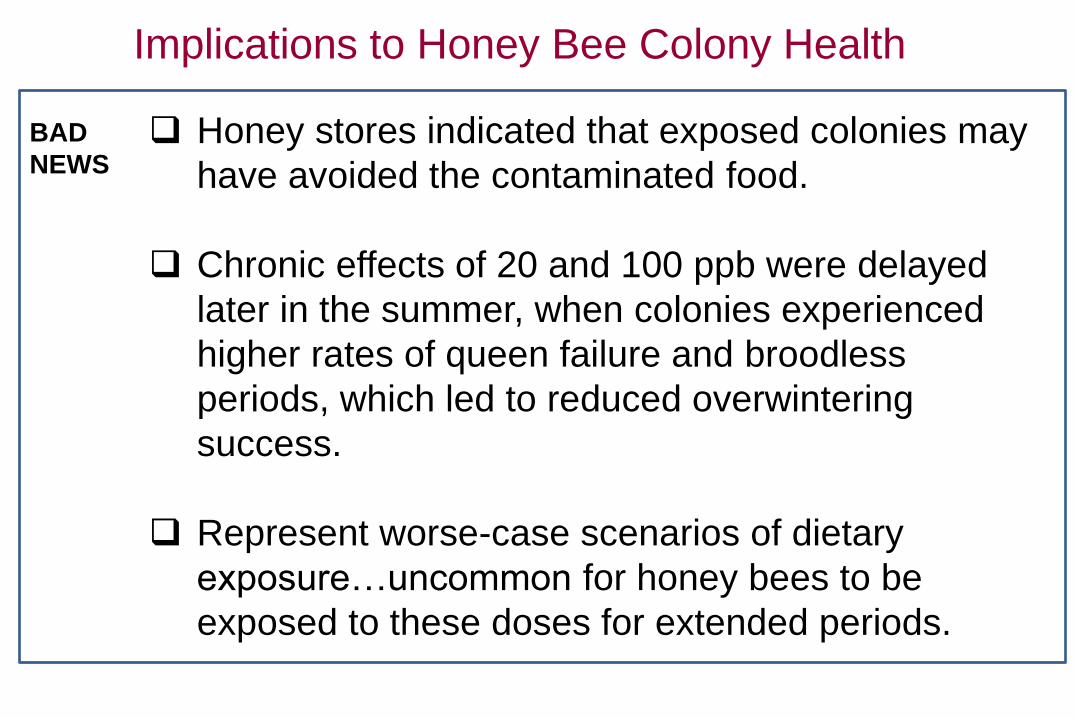
BAD
NEWS Honey stores indicated that exposed colonies may
have avoided the contaminated food.
Chronic effects of 20 and 100 ppb were delayed
later in the summer, when colonies experienced
higher rates of queen failure and broodless
periods, which led to reduced overwintering
success.
Represent worse-case scenarios of dietary
exposure…uncommon for honey bees to be
exposed to these doses for extended periods.
Implications to Honey Bee Colony Health
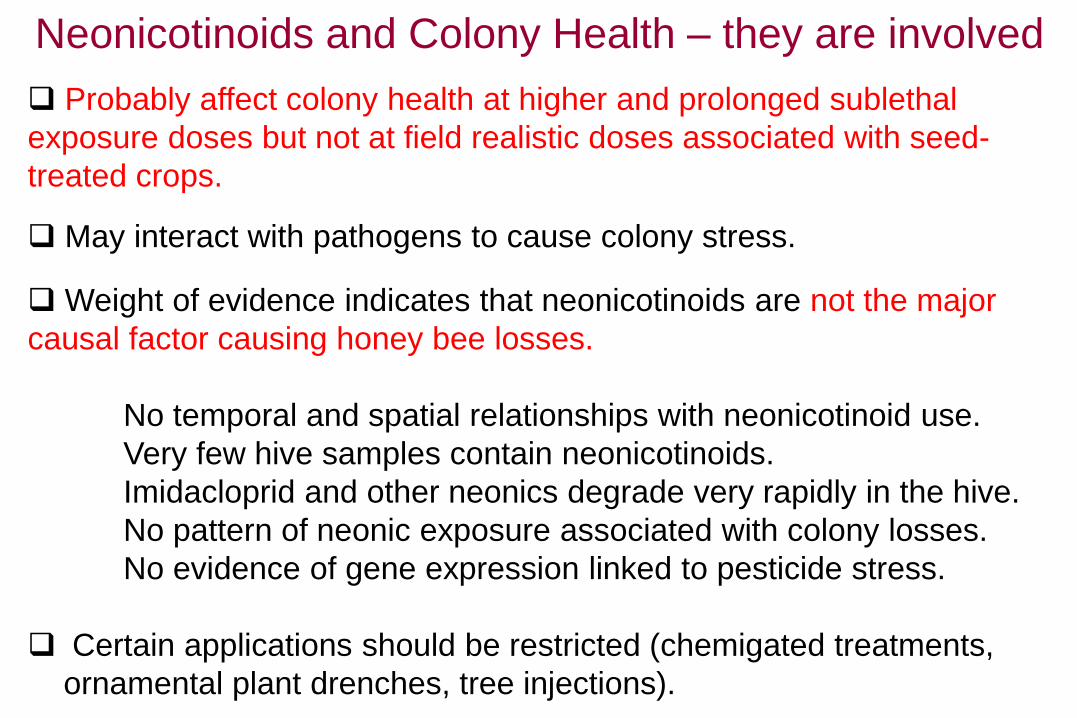
Neonicotinoids and Colony Health – they are involved
Probably affect colony health at higher and prolonged sublethal
exposure doses but not at field realistic doses associated with seed-
treated crops.
May interact with pathogens to cause colony stress.
Weight of evidence indicates that neonicotinoids are not the major
causal factor causing honey bee losses.
No temporal and spatial relationships with neonicotinoid use.
Very few hive samples contain neonicotinoids.
Imidacloprid and other neonics degrade very rapidly in the hive.
No pattern of neonic exposure associated with colony losses.
No evidence of gene expression linked to pesticide stress.
Certain applications should be restricted (chemigated treatments,
ornamental plant drenches, tree injections).
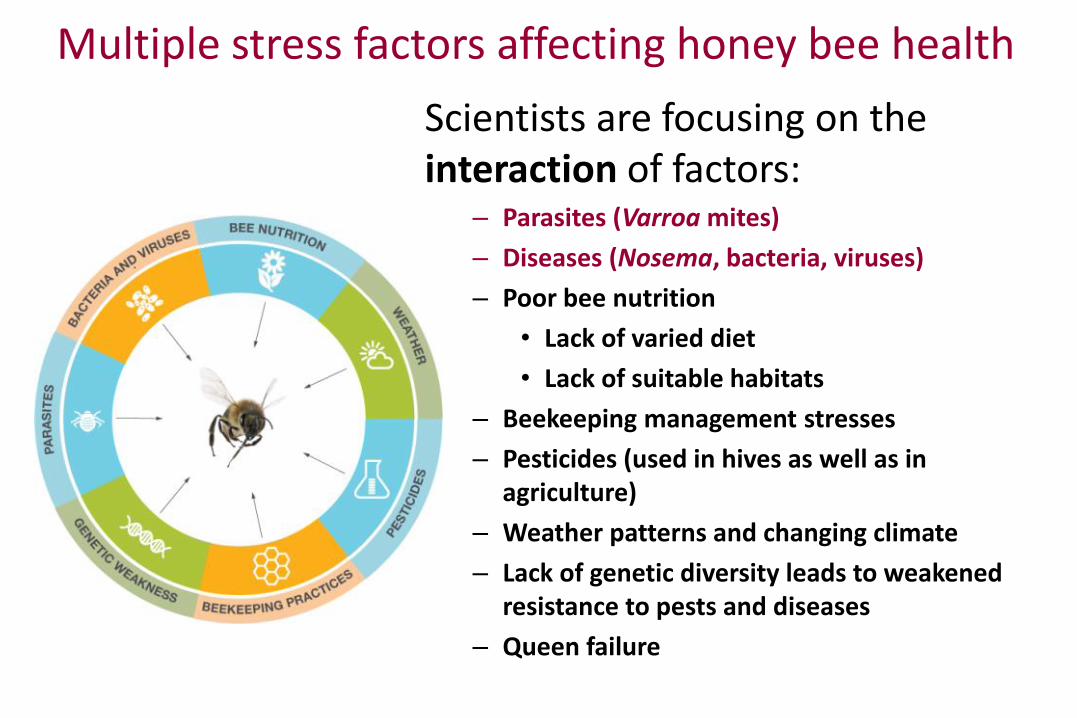
Multiple stress factors affecting honey bee health
Scientists are focusing on the interaction of factors:
– Parasites (Varroa mites)
– Diseases (Nosema, bacteria, viruses)
– Poor bee nutrition
• Lack of varied diet
• Lack of suitable habitats
– Beekeeping management stresses
– Pesticides (used in hives as well as in agriculture)
– Weather patterns and changing climate
– Lack of genetic diversity leads to weakened resistance to pests and diseases
– Queen failure
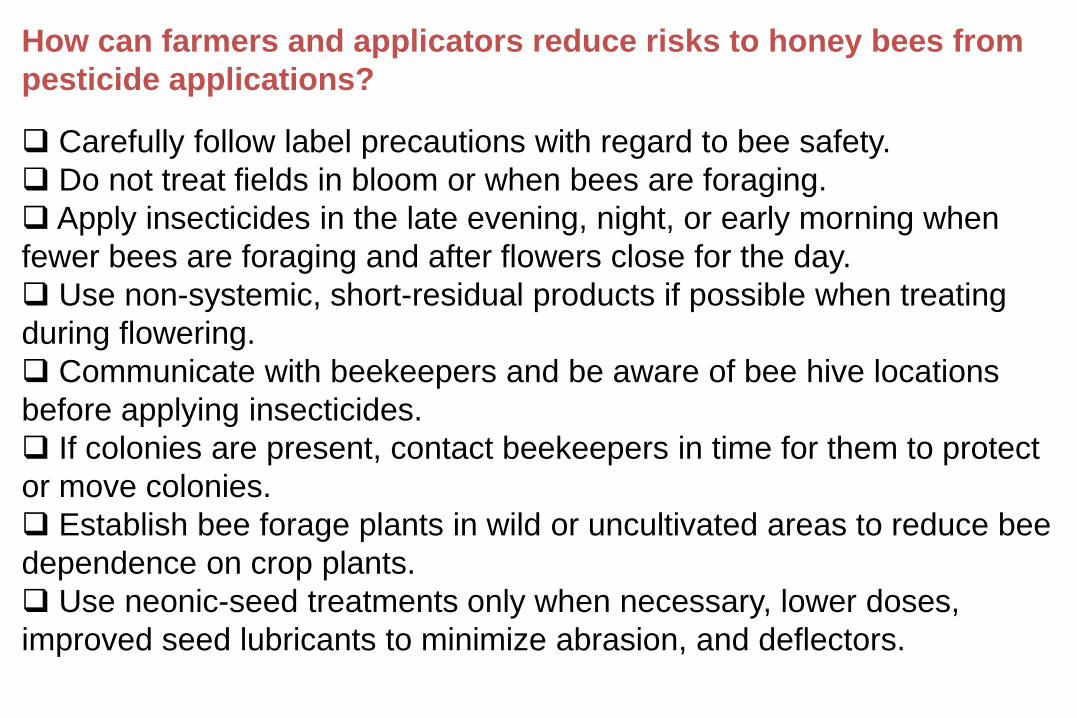
How can farmers and applicators reduce risks to honey bees from
pesticide applications?
Carefully follow label precautions with regard to bee safety.
Do not treat fields in bloom or when bees are foraging.
Apply insecticides in the late evening, night, or early morning when
fewer bees are foraging and after flowers close for the day.
Use non-systemic, short-residual products if possible when treating
during flowering.
Communicate with beekeepers and be aware of bee hive locations
before applying insecticides.
If colonies are present, contact beekeepers in time for them to protect
or move colonies.
Establish bee forage plants in wild or uncultivated areas to reduce bee
dependence on crop plants.
Use neonic-seed treatments only when necessary, lower doses,
improved seed lubricants to minimize abrasion, and deflectors.
Still Lots of Knowledge Gaps

Thank you …. Questions
Thanks to the USDA-ARS Bee Lab and EPA for funding