
INSTITUTE FOR TELECOMMUNICATION SCIENCES OF THE …
142
INSTITUTE FOR TELECOMMUNICATION SCIENCES OF THE NATIONAL TELECOMMUNICATIONS AND INFORMATION ADMINISTRATION ANNUAL TECHNICAL PROGRESS REPORT 1981 For the period from Oct. 1, 1980 through Sept. 30, 1981
Transcript of INSTITUTE FOR TELECOMMUNICATION SCIENCES OF THE …

INSTITUTE FOR TELECOMMUNICATION SCIENCES OF THE
NATIONAL TELECOMMUNICATIONS AND INFORMATION ADMINISTRATION
ANNUAL TECHNICAL PROGRESS REPORT 1981 For the period from Oct. 1, 1980 through Sept. 30, 1981

Office of the
Chief Counsel
Office of Telecommunications
Applications
U.S. DEPARTMENT OF COMMERCE
N ational Telecommunications and Information Administration
ADMIN ISTRAT OR
Deputy Administrator
Office of
International Affairs
Office of Federal Systems &
Spectrum Management
Office of Planning
& Policy Coordination
Office of
Administration
Institute for
Telecommunication Sciences
I Office of
Congressional Affairs
I Office of
Policy Analysis & Development

ITS ANNUAL TECHNICAL PROGRESS REPORT 1981
For the period
October 1, 1980 through Sept. 30, 1981
U.S. DEPARTMENT OF COMMERCE Malcolm Baldrige, Secretary
Bernard J. Wunder, Jr., Assistant Secretary for Communications and Information


TABLE OF CONTENTS
L I ST OF F IGURES
L I ST OF TABLES
INTRODUCTION
C HAPTER 1 . EFFICIENT USE OF THE SPECTRUM
SECT ION 1 . 1 . SPECTRUM ENGINEERING TECHNIQUES
SECT ION 1 . 2 . SPECTRUM ENGINEERING FOR EFF ICI ENT SPECTRUM USE
SECT ION 1 . 3 . ADVANCED INSTRUMENTATION AND SPECTRUM MEASUREMENTS
CHAPTER 2 . S YSTEMS ENGINEERING AND EVALUAT ION
SECT I ON 2 . 1 . COMMUN ICATION SYSTEMS AND SERVICES ENGINEERING
SECT ION 2 . 2 . TERRESTRIAL RAD IO SYSTEM PERFORMANCE AND MONITORING STUDIES
SECT ION 2 . 3 . STANDARDS
CHAPTER 3 . EM WAVE TRANSMI S S ION
SECT ION 3 . 1 . WAVE TRANSMI S S ION C HARACTERISTICS
SECT ION 3 . 2 . C HARACTERISTICS OF THE TRANSMI S S ION MEDIA
3 . 2 . 1. Atmo spher ic Characte r i s t i c s
3 .2 . 2 . Ionospheric Character i s t ic s and Effec t s
SECT ION 3 . 3, DEVELOPMENT AND IMPLEMENTATION OF EM WAVE TRANSMI S S ION MODELS
3 . 3 . 1 . Atmo spheric Transmi s s ion Models
3 . 3 . 2 . Ionospher ic Transmiss ion Models
SECT ION 3 . 4 . PREDI CT ION OF TRANSMI S S ION PARAMETERS AND SYSTEM PERFORMANCE
3 . 4 . 1 . Long-Term Iono spheric Predictions
3 . 4 . 2 . Medium Frequency Transmi s s ion Studie s
SECT ION 3 . 5 . APPLICA'riONS
3 . 5 . 1 . Antennas and Radiat ion
3 . 5 . 2 . Transmis s ion Through the Atmo sphere : App l icat ions
CHAPTER 4 . ADVANCED COMMUN ICAT I ON NETWORKS
SECT ION 4 . 1 . COMMUN ICATIONS P ROTECTION
4 . 1 . 1 . Re ference Microwave Propagation Loss Mod e l
4 . 1 . 2 . D E S and F ederal Standards Efforts
4 . 1 . 3 . Terminal Eva l uation Pro j ec t
4 . 4 . 1 . 4. Ana log v s . Dig ital L i n k Analy s i s
4 . 1 . 5 . Pub l i c Key Cryptography and i t s Implementation
4 . 1 . 6 . MITRE Pub lic Key
4 . 1 . 7 . Rive s t , S hami r , and Ad leman ( RSA ) Publ ic Key
SECT ION 4 . 2. SWITCHED NETWORKS
i i i
PAGE
v
vii
1
3
3
1 5
1 8
3 9
3 9
4 7
5 5
5 7
5 7
5 9
5 9
7 1
7 4
7 5
8 4
9 0
9 0
9 3
9 3
9 3
9 5
9 7
9 7
9 7
9 9
1 0 1
1 0 1
1 0 2
1 0 3
1 0 3
1 0 4

SECTION 4,3, SATELLITE COMMUNICATION SYSTEMS
4 . 3 . 1.
4,3 . 2 .
4,3,3 .
4,3,4 .
Frequency/Orbit Resource Study
Broadcasting-Satellite Service Policy Studies
Direct Broadcast Satellite Fixed Services Sharing Studies
Voice Circuit Multiplier Techniques Study
4 . 3 . 5 . Support to the AID Rural Satellite Program
ANNEX I, ORGANIZATIONAL DIRECTORY
ANNEX I I .
ANNEX I I I .
ANN�X IV .
ITS PROJECTS ORGANI ZED BY DEPARTMENT AND AGENCY
PROJECT INDEX
ITS PUBLICATIONS FOR FISCAL YEAR 1 981
ANNEX V, GENERAL AND HISTORICAL INFORMATION OF ITS
iv
PAGE
112
11 3
1 1 3
115
119
119
123
125
127
129
131

F IGURE
1-1
1-2
1-3
1-4
1-5
1-6
1-7
1-8
1-9
1 - 1 0
1 - 1 1
1-12
1-13
1-14
1-15
1- 1 6
1-17
1-18
1-19
1-20
1-21
2-1
2-2
2- 3
2- 4
2- 5
2-6
2-7
2-8
LIST OF F IGURES
T ITLE
Perc entage increase in required number of channels ( P ) as a function o f adj acent-channel s eparation di stance to cochannel s eparation d i s tance ( R ) .
S amp le output from TV taboo search program around reference s ite at 4 2 . 3 6 1 6 7 deg . N and 72.0 5833 deg. E.
A sample output from ·the signal-to-interference calculation program .
All avai lable IEEE method r f protection ratio measur ement data , taken on FM broadcast receiver s, for monophonic des ired (D) and undes ired ( U ) s ignals and receiver ( R ) set for monophonic operation .
All avai lable CCIR method rf protection ratio measurement data for monophonic des ired ( D ) and undesired ( U ) s ig na l s and receiver ( R ) set for monophonic operat ion, CCIR method , 30 dB protection ratio .
Block diagram o f program for comput ing the probabil ity of interference in a congested environment .
Ba s i c transm i s s ion lo s s at 5 1 0 0 MHz for time avai labil ities of 0 . 5 , 0 . 5 0 , and 0.95.
Proposed functional s tructure of GNCM.
Radi o Spectrum Measur ement System ( RSMS ) .
RSMS spectrum meas urement equipment.
Example of Quick S earch data .
Statistical amp l i tude graph, average detector data .
Statistical occupancy summary, average detector data .
S ingle measurement o f peak amplitude versus frequency .
S ing l e measurement o f nmnber of pulses versus frequency .
Statistics o f peak amplitude ver sus frequency .
Stat i st i c s of number of pul ses exceeding -- 7 0 dBm .
Propagation measur ement receiver bloc k diagram for the Southern California Propagation S tudy .
Block diagram of the receiver contro l/data col lection system ( RCDC S ) for the Southern C a l ifornia Propagation Study .
The Automatic Propagation Measurement System for the S outhern Cali fornia Propagation S tudy .
Front panel of t he DM-4 .
Data extract ion subsys tem functional des ign .
Performance a s s e s sment computer program and I /O files .
Aggregate user concept .
Telecommunications taxonomy.
F low chart of the land/mobile needs a s s e s smen t proces s .
Notched s pread spec trum over lay .
An exampl e o f the spectrum of the received digital s ignal over the PMTC l i nk witl! no mult ipath degradation.
A s equence of s ignal spectra and power impul s e functions measured over the PMTC l ink with a tmo spher ic mul tipath .
v
PAGE
4
7
9
1 0
1 1
1 3
1 4
16
20
22
23
24
25
27
28
29
3 0
32
3 3
34
37
4 1
4 2
4 3
44
46
49
53
54

FIGURE
2 - 9
3 - 1
3 - 2
3 - 3
3-4
3 -5
3 - 6
3 - 7
3 - 8
3 - 9
3 - 1 0
3 - 1 1
3 - 1 2
3- 1 3
3-14
3 - 15
3 - 1 6
3 - 1 7
3 - 1 8
3 - 1 9
3-2 0
3 - 2 1
3 - 2 2
3 - 2 3
3-24
3-25
TITLE PAGE
The rece ived s ignal spectrum and the corresponding power impulse response 54 in the PMTC channel with a strong mul tipath component .
He ight-gain measurement - - s ignal amplitude relative to free space recorded 58 over two 23 km paths on June 2 0 , 1 9 8 0 .
S ignal ampl itude s recorded over a 2 3 km path o n 4/1 9 / 8 1 . 6 0
S ignal amplitude s recorded over a 2 3 km path o n 3/10/ 8 1 . 6 0
Attenuation a i n dB/km o f typical examples for moi s t a i r a t sea level over 6 2 the frequency range 3 0 to 500 GHz including fog with 0 . 5 g/m3 l iquid water c ontent .
Zeeman attenuation patterns of the oxygen microwave l ine K = 3+ for 6 3 altitudes h=30 t o 100 km .
Zenith attenuation A through the U . S . Standard Atmo sphere 1 9 7 6 for dry 6 4 (RH=5% ) , moderate ( 5 0% ) , and humid ( 100% ) a i r over the f requency range , 10 GHz to 3 00 GHz (EHF ) .
Fabry-Perot resonator s imul ating a 1 6 5 m radio path at 1 4 0 GHz and mounted 65 ins ide a temperatur e-controlled humidity simul ator .
S ignal ampl i tude as a func t ion o f height for a cottonwood grove (HH polari - 6 7 zat ion and VV polar i zation) .
S ignal amplitude as a func tion of height for a cottonwood tree grove , with 6 7 and without foliage ( HH polarizat ion ) .
S ignal ampl itude re lative to transmitter antenna hor i z ontal d i spl acement . 6 8
Time series records of rece ived signal ampl itude during windy condition s . 6 8
Meas ured attenuation through falling snow . 7 0
Model i ng attenuation a ( dB/km) for moist air ( abso lute humidity p = 1 0 g/m3 ) 7 2 a t el evated temperatures 3 00 t o l O O OOK over the frequency range 1 0 to 5 0 GH z .
S ignal strength ( in volt s ) a s a function of frequency obs erved by the DMSP 7 3 HF receiver above a locat ion o f 40 . 4 °N and 2 6 5 . 8 °E on July 2 7 , 1 9 7 7 , at 1 2 3 6 ( UT ) .
Average global behavior in the topside ionosphere of the HF radio environment 7 3 at local dusk for 1 1 . 8 MHz during Apr il 1 9 7 8 .
A refractivity pro file obs erved us ing a refractometer over Lake Ontario 7 6 showing the presence o f an elevated layer .
Mea surement location area showing Lookout Mountain TV s ite and route 7 7 taken by the mobile mea surement van.
Televis ion Channel 9 spectrum measured at intersection of 6 th Avenue and I - 70 . 7 8
Telev i s ion Channel 3 1 s pec trum mea sured at intersection o f 6th Avenue and I - 7 0 . 7 9
Televi s ion Channel 5 7 spec trum measured at intersection of 6 th Avenue and I - 7 0 . 8 0
The Weibul l distr ibution exponent obtained for the Channel 9 video signal 8 1 (1 8 7 . 2 4 MHz ) along the measurement route o n 3 0 September 1 9 8 0 .
The Weibu ll distr ibution exponent obtained for the Channel 3 1 video signal 8 2 (57 3 . 25 MHz ) along the measurement route on 3 0 September 1 9 8 0 .
The Weibu l l distr ibution exponent obtained for the Channel 5 7 video signal 8 3 ( 7 2 9 . 2 5 MHz ) o n 4 December 1 9 80 .
Predicted ver sus observed attenuation distr ibut ion using the Dutton- 85 Dougherty model to 0 . 001% .
The co-phase and quadrature pha se components o f an impul s e response after 8 9 the wave has traveled into a fore st .
vi

F IGURE
3 - 2 6
3 - 2 7
4 - 1
4 - 2
4 - 3
4 - 4
4 - 5
4 - 6
4 - 7
4 - 8
4 - 9
4 - 1 0
4 - 1 1
4 - 1 2
TABLE
1-1
1-2
1 - 3
1-4
2 - 1
2 - 2
2 - 3
2-4
3 - 1
3 - 2
4 - 1
TITLE
The spectral response corre sponding to the above pul s e response .
Requ ired power for 6 0 dBu ; all c ircuits , P > 5 0 % , P>9 0 % .
Geometry for a line-of- s ight ( LOS ) path .
Geometry for a s ingle hor i z on ( SH ) path .
Geometry for a double hor i z on (DH ) path .
E-COM service operat io n .
AUTOVON acce s s area/po lyg r id concepts .
Potential s tage s for implementing acce s s area networks.
Subscr iber locations homing on AUTOVON switch at Cedar Brook , New Jersey .
'.rypical home receiver d i s h for DBS .
F ixed terrestrial microwave paths at 1 2 . 2 - 1 2 . 7 GH z in the greater Lo s Angeles area .
Block diagram o f instrumentation for carrier-to-inte r ference ratio me asurements at 4 GHz.
Sat e l l i te power required v s . number of te lephone channel s , parametr ic in G/T of the rece iving earth terminal.
Earth terminal G/T as a function of low noise amp l i f ier temperature , parametric with antenna aperture diameter .
L I ST OF TABLES
TITLE
UHF-TV Taboos
Compar i son o f Median r f Protection Ratios for 1 9 4 7 -Era and Contemporary FM Broadca s t Receivers
GMF and NGMF As s ignments in the 5 6 5 0 - 5 9 2 5 MHz Band
Rece iver S ite Measurement Frequenc ies
Transatlantic Cable System
Compari son of F iber Cable and SG ( Wes tern Electric S i z e Des ignation ) Coaxial Cable
TAT-6 Costs
Mul tipat.h De lay Spread
Elevated Duct Total Uccurrence s and Worst Month Occurences at Washington , D . C .
Mon i toring Summary for the Puerto Rico S i te
Satell ite Power Required to Provide F i f ty Duplex Telephone C ircuits Us ing D igital Voice Encoding at 9 . 6 kb/s and QPSK Modulation , an INTELSAT S tandard B Centra l Earth Station , Remote Earth Station s with G/T Ranging from 1 7 . 5 to 3 00dB/ K , and One-Quarter T ransponder on an INTELSAT S ate l l i te with Hemispher ic Beam Coverage
vii
PAGE
8 9
9 2
9 8
1 0 0
1 0 0
1 0 6
1 0 9
l l O
1 1 1
l l 6
l l 7
l l 8
1 2 1
1 2 2
PAGE
5
1 2
1 9
3 6
4 8
4 8
4 9
5 3
7 5
9 4
1 2 2

IN'l'RODUCTION
This annual report reviews the activities and accomplishments of the Institute for Telecommunication Sciences for the fiscal year ending September 3 0 , 1981. It is intended to serve as a reporting mechanism to the agency management, to our other agency sponsors, and to interested members of the public.
The Institute for Telecommunication Sciences (ITS} is the chief research and engineering
arm of the National Telecommunications and Information Administration (NTIA), u.s. Department of Commerce. Its mission may be divided into two major elements: 1) to provide direct support to the NTIA Administrator and the Secretary of Commerce and 2 ) to serve as a central Federal resource to assist other agencies of the Government in the planning, design, maintenance, and improvement of their telecommunications activities. The work performed in carrying out the latter responsibility is reimbursable, is relevant to national goals and commitments, cannot be readily performed by the private sector, and contributes to NTIA's goals.
In order to meet the responsibilities assigned to it by NTIA and the Department of Commerce and to meet requests placed upon it by other Federal agencies, the program carried out by the Institute falls under two broad categories: Spectrum Research and Analysis and Systems and Networks Research and Analysis.
The program of Spectrum Research and Analysis includes research directed toward development of models of radio-wave transmission applicable to optimization of spectrum use and communication system performance prediction. It also includes research directed toward developing spectrum use concepts and models which can lead to more efficient use of the spectrum resource; this is primarily related to the interactions between radio systems and the electromagnetic environment.
Since radio waves are strongly influenced by the environment in which they propagate, the transmission models, depending upon radio frequency, account for the effects of terrain electrical properties, shape, and surface cover; the non-ionized lower atmospheric gases, meterology, and spatial structure; and the highly variable time and spatial properties of the ionized region of the upper atmosphere. These models then provide statistical estimates of signal attenuation, dispersion, multipath, and other factors which determine the rate of information transmission and quality of performance systems provide. With additional information obtained from measurement and evaluation of the spectrum-consuming properties of antennas, receivers, and transmitters and from measurement of spectrum occupancy, development of spectrum planning techniques and ways of more intensively sharing the spectrum have resulted from work in this program. These efforts relate to NTIA and FCC roles in spectrum management.
The Systems and Networks Research and Analysis program conducts studies directed toward
assessing and developing domestic and international technical performance standards to facilitate competition in the provision of enhanced telecommunication products and services and to expand u.s. industry opportunities to compete in international markets. Also, technology alternatives for the development of competitive, lower cost, communication networks are investigated; and research and analysis of advanced networks for future application are done.
In both program categories, significant involvement in the activities of the International Telecommunication Union (ITU) and, especially, its major subdivisions, the International Consultative Committees on Radio ( CCIR) and Telephone and Telegraph (CCITT),
has been essential and continues a long history of active involvement by Institute staff in such activities. Work in support of these international commitments is reported within the succeeding chapters at relevant places.
In total, the work summarized in this report is intended to assist in maximizing the efficient use of the national spectrum resource, the efficient use of Government telecommunication systems, and new technology toward achieving national goals. It is directed toward incorporating technical, economic, market, regulatory, and other factors in an integrated manner into policy development and toward translating Administration policy for use in national and international arenas.


CHAPTER 1. EFFIC I ENT USE OF THE SPECTRUM
The radio, or e l ectromagnetic , spectrum has s een dramatic growth in demand and use s inc e the beginning of World War I I . A g reat range of new spectr um-dependent s ervices ha s evolved . American industry, government , and private citizens have put the spectrum to work i n such profusion tha t now s aturation appears imminent and, in s ome case s , has a l ready occurred . To provide fo r new and expanded u s e , two major alternatives exist . One is t o e xploit new regions o f the spectrum a t progre s s ive ly higher frequencies . The s econd i s to provide physical pr inc ipl e s upon wh ich spectrum use depends and, compl ementing thi s u nderstanding , provide for more e ffective means of managing spectrum us e .
Spectrum use by the u.s. Government alone i s growing nine percent annual ly in thos e frequency regions where equipment i s readi ly ava i lable . Embryonic e f fort s are being mad e to use the even higher frequencies above 10 GHz for many appl ications where equ ipmen t s ti l l remains to be deve loped .
The Nationa l Telecommunications and I nforma ·tion Administration, Inst itute for Te l ecommunication Science s (NTIA/ITS ) , conducts a program of res earch and deve lopment which addre s s e s bot.h o f these alternat ive s . Much o f the work being done to extend the u s e of the spectrum to higher frequencies is discus sed i n Chapter 3 o f this report, Electromagnetic Wave Transmis sion. That chapter also provide s b rie f mention of some of the work being done to improve our under standing of propagation p robl ems in those regions of the radio spectrum that are already extensive ly u s ed .
I n this chapter , some highl ights of the NTIA/ ITS program directly concerned with spectrum engineering are reviewed . Many of thes e spectrum engineering pro j ects draw heavi ly o n experience from other programs i n ITS , inc luding antenna de sign and measurement , channe l characterization and system per formanc e , and the many propagation re lated e f fort s .
SECTION 1.1. SPECTRUM ENGINEERING TECHNIQUES
We are concerned here with those technique s which c an b e used b y pol i cy maker s , frequency managers , system designers and planners , and others concerned with the use o f spectrum d ependent system s in the increas ing ly conge sted real world . The s e are techniqu e s tha t de fine the extent to which rea l i stic shar ing of fr equencie s , time , and space is pos s ible . They also add ress problems in optimum cho ice o f frequencies and rational trad e-o f fs betwe e n l imits o n broad c l a s s e s of equ ipment ( l imits on factors s uch as antenna he ight or powe r ) , the abi l ity o f a system to provide a requ ired s ervic e , and the e f fic iency with which avai l a b l e spectrum i s us ed. Techniqu e s o f thi s kind are e xt reme ly varied and mus t addre s s a wide range o f prob l ems from the very spe c i f i c ( for the designer o f a spe c i fic system at a particular location ) to the very general ( for the pol i cy maker and regulator who mu st consider national or reg ional consequences in a s ing le action ) ,
3
Traditiona l l y , spec trum engineer ing techniqu e s have b e e n developed t o eva luate a specific s i tuation, usua l ly wi th a series of " sa fe " or " cons ervative " ass umptions . Cons ervati sm a l l owed for some s imp l i c ity in the se techniqu e s , but even s o , they were arcane enough so that r e lative ly few p eop l e used them, and even fewer understood them .
Our goals in thi s part of the program are to develop a family of such techniques that i s based o n a sound knowl edge o f the physical characteri stics o f the problem, the technica l p ropertie s of equipment involved, the practical way in which that equipment is used, and the influence o f the natural environment . I f w e a r e succes s fu l i n developing s uch techniq ue s , they are nece s sarily complex and , in their initial form, difficult to u s e and u nderstand . We are aggressively work ing to overcome the s e barriers to e ffect ive u s e by c arefu l documentation and by developing computer methods that are easily used and provide r esults in the user ' s c0ntext .
Conservatism in many cases equates to wa sted s pectrum . We addr e s s thi s problem by building technique s which incorporate a comprehensive s tatistical analysis of the many variables ( and the i r complex interactions ) which a f fect the results . By so doing, we allow the users to be as liberal or cons ervative a s they choose .
For over a decade, government, academic, and indus tria l 'groups have advocated deve lopmen t o f methods for improving the overall e ffectivene s s of spectrum use ( as oppos ed to the o pt imization o f individual system per formanc e ) . Thi s concern para l l eled and even pred ated similar real izations that ideal common use of environmental re source s such as a ir and water may not coincide with economic maximizat ion of an individual user ' s profits .
The deve lopments reported here are discussed with current appl ications in mind . But the i r t rue value l ie s in the ir general character . In most cas e s , these methods can be adapted t o meet many new requirements involving a broad range of tel ecommunications needs and serv ic e s . The presentation of summary results in graphic form ( particular ly as maps and map over lays ) , the development of demographic results , and the des ign of interactive computer programs that make it easy to ask "what i f?" que stions are indicat ive o f our continu ing effort to bridge the gap between technology and the planners and pol icy makers .
The Broadcast Frequency As s ignment Strategies project has deve loped computerized methods fo r a s signing frequencies to transmi tters so that all applicants can be satis fied in the sma ll es t-possible bandwidth .
Frequency-di stance ( F*D ) s eparation rules are a part o f the frequency management process in many service s . In a channeli zed s ervice , the s e take the form : cochannel transmitters mus t be s eparated by at least d0 km, adja.c.s":t channel transmitters mu st be separated by at least d 1 km, transmitters s eparated by two channels mus t be at least d2 km apart , e-l�c.

VHF and UHF television broadcasting and FM radio broadcasting are governed by such rules. Despite the common use of such rul es, no one has kn own h ow to ass ign individual frequenc ie s to arbitrarily-located transmitters so as to get the max imum number of users in a spec i f i e d bandwidth, nor how much additional spectrum is required to satisfy each addit ional F*D separation rul e for a f i x ed number of transmitters.
The problem can be stated as foll ows: g iven a set of F*D rules for a channel i zed band, and a set of desired transmitter l ocations ( arb it rary), assign channels to the transmitters so that the F*D rul es are satis fied wh i l e min im i z i ng the total bandwidth required.
A computer algorithm that solves this problem e ff i c i ently can be used in several ways. First, it can be used as an all ocation tool. For exampl e, given a characterization of a proposed service, it can accurate ly determin e the amount of spectrum required ( the al location) together with an ass ignment of spec i fi c freque nc ies to spec i fic l ocations {a tab l e o f allotments). Second, it can serve as a very fast automated tool for routine frequency assignments. Third, it can be used as a re search tool for discovering general princ ipl es of spectrum management.
As an examp l e of this last appl ication, consider the problem of establ ishing an ad j ac entchannel frequency-distanc e rul e in a n ew chann e l i zed servic e. The required separation wil l depend on the kind and quality o f service desired, the propagat.ion characteristics in th e frequency band, and on emission and equipment characteristi cs. In particular, it depends o n the transmitter emission spectrum and the ad j ac ent-channel r e j ection capabil ity o f th e receivers . Within rather broad l imits, these equipment characteristics can be control l ed by the designer. I f greater adj acent�channe l re j ections are required, then ad jac ent-channe l d istanc e separations can be small er, but the rece ivers wi l l cost more. A spectrum manage r would like to trade-o f f the equipment costs and the spectrum costs wh en establ ishing th e separation rul es. A general curve for the spectrum costs of an adj acent channe l separat io n rul e was determined using the computer algorithms developed in the pro j ect, and th e procedure described in the n ext paragraph .
The cochannel separation distance, d0, was
taken as the unit o f distance . A g iven density of random transmitter l ocations was gene rated. The ad jacent chann e l separation distance was set, and there were no other F*D rules . Then the computer program produced a table of ass ignments min imi z ing the tota l bandwidth required . Another set o f transmitter locations was generated and a tab le o f assignments for these l ocations were found . Ten test probl ems with the same spe c i f i cations e x cept for the locations of the transmitters were sol ved, and the average min imum bandwidth required for these ten samp l es was rec orded. Then the distance d1 was changed, and the pro-
c ess was repeated for the same number of transmitters. The ad j acent-channel separat io n d istance was varied from 0 to do for four
dif ferent densities of transmitters.
4
The percentag e increase in total number o f channels needed t o satisfy al l appl icants i s shown in Figure 1-1 as a function of R = d0/d1. The shaded area i n Figure 1-1
c overs al l the computed po ints.
p
R
Figure 1-1 . Percentage increase in require d number o f channels ( P) as a function of ad j ac ent-channel separat ion distance to cochannel separat ion distance ( R) .
I f d1 i s smal l compared to d0, only a few more
channels are required than i f there were n o adj acent-channel distance separation required. As long as d1/d0 is l ess than about 0.4, the
n umber of channels required increases slowly with d1 . I n th is region, a spectrum manager
would probably allow rece iver costs to determine the separation distance . But in the n e ighborhood of d1/d0=0.45, a threshold is
reached, and for larger separat ions, small i n c reases in the adj ac ent- chann e l separation distance, d1, greatly increase the total band-
w idth required to provide the servi c e .
The methodol ogy can be appl i ed to analyze more c ompl icated real istic probl ems, as it was in "Spectrum Effici ency as a Function of Frequency-distance Ru l es: An Appl ication to UHF-TV," by W . K . Hal e ( to be publ ished as a n IEEE Proceedings Letter Report). The UHF "taboos" are the most compl icated set of F*D rul es, as shown in Tab l e 1-1 . In recent years, the Federal Commun i cations Commission has sponsored research aimed at reduc ing or el iminating some of these taboos. Hale anal yzed the e ffect of changing th e taboos on the total bandwidth required to provide various l evels of servi ce. For exampl e, if all the

non-cochannel taboos were e l iminated , the same n umbe r of stations could be assigned in 7 0 % o f the bandwidth required by the taboo s . This can be analyzed by comparing Tabl e 1-1 with Figure 1-1 . Only one separation distance is g reater than 0 . 4 5 o f the cochann e l separation d istance - - the one for a separation of 1 5 channel s . Figure 1 - 1 shows that thi s tabooo a lone would increase the spectrum required by about 1 5 % . The taboos for channel s eparation s 14, 7 , and 1 contr ibute most of the rest of the r equired increas e .
On the other hand , increasing the separation distance s on the s e 4 channe l s wou ld consume
'much more spectrum becau s e then the distances would be above the knee of the curve i n Figure 1-1 . For examp l e , i f a l l the taboo s eparation d i stances were doubled, it would take 2.4 t imes as much spectrum to provide the service .
Channe l S eparation
Tab l e 1-1 . UHF-TV Taboos
Require d Distance Separation
0 ( cochanne l ) 1
15 5 mile s 5 5 miles 20 mile s 2 0 miles 20 mi l e s 2 0 miles 6 0 mile s 20 miles 6 0 mile s 7 5 miles
2 3 4 5 7 8 14 1 5
The computer a lgorithm which solves the frequency a s s i gnment problem is d e scribed in a technical report , " New Spectrum Management Tool s : Automated Frequency Al location and As s ignment Algorithms , " by W . K . Hal e and D . H . Cronin ( to be pub l i shed as an NT IA report ) .
I n 1 980 , the I nternational Radio Consul tative Committee ( CC I R ) o f the I nternat iona l Te lecommunications Un ion ( ITU ) adopted Recommendation 506 , which def ines inter ference , and s uggests that the defi nition wi l l be used in the I nternat iona l Radio Regulations for der iving shari ng cri te r ia . Because of the var iabil ities o f equ ipment characteristics , tran smission los s , and ( for s ome services ) location and traffic intens ity , on ly probab i l i s t ic e s t imates o f i nter fe rence are rea l i s t i c . A formul a for calculating the probab i l ity of interfer ence developed in the Tradeoffs for E f ficient Use o f the Spectrum proj ect has been pr esented to C C I R Study Group 1 , and probably wi l l b e a pproved at the final meetings i n October o f 1 98 1 .
Recommentation 506 defines inte r fe rence as " the e f fect o f unwanted energy . . • upon recept ion in a radio commun ication system, manife sted by any per formance degradation , misrepr e s entation, or loss of information wh ich could be e x tracted in the absence of s uch u nwanted energy . " Let
A denote " The desi red transmitter is transmitting . "
5
B d enote
C denot e
D denot e
" The wanted s ignal i s satis factori ly received in the absence o f u nwanted energy . "
" Another equipment is producing unwanted ene rgy . "
" The wanted s ignal i s satis factorily received in the presence of the unwanted energy . "
A l l of the se statements re fer to the same sma l l t ime period . Then accord ing to Recomm endation 5 0 6 , interference means "A and B and C and D* , " where D* is the negation or oppos i te of D . Let P ( x ) denote the " probabil ity o f x , " and P ( xly ) denote the " probabil ity o f x , g iven y . " Then, the probab i l ity o f interference dur ing the sma l l t ime per iod i s
P ( I ) = P ( A and B and C and D* )
which can be expres sed in terms o f known o r computab l e quaniti es :
( 1 )
P ( I ) = [P ( BIA ) - P ( DIA and C ) ] P ( A and C ) ( 2 )
I t may be preferable to cons ider the probab i l i ty of interference dur ing only the time that the wanted transmitter i s transmitting . Thi s p robab i l ity i s
P '( I ) = P ( B and C and D*IA ) ( 3 )
which can be reduced to
P ' ( I ) = [P ( BIA ) - P ( DIA and C ) ] P ( CIA ) (4)
Fir s t , cons ider the differ ence between ( 2 ) and (4). The probabil ity of interference can be interpreted as the fraction of t ime tha t i nterfer ence exi sts . In Equation ·( 2 ) , this fraction is the number of s econds of interf e r ence dur ing a time per iod d ivided by the number o f s econds in the t ime per iod . I n Equation (4), the fraction is the number of s econds of inter ference d ivided by the numbe r o f s econds the wanted transmitter is transmitt ing during the t ime per iod . This s econd f raction is l arger than the first unless the wanted transmitter is on a l l the t ime .
P ( BIA ) is j u s t the probab i l ity that a wanted s ignal wi l l be correctly received when ther e i s no interference , o ften expre s s ed as the probab i l ity that S/N � R, where S is the s ignal powe r , N i s the no ise power , and R i s the s igna l-to-noise ratio required for sati s f actory s ervice . I n some service s , this p robab i l ity i s ca l l ed the rel iab i l ity , and is o ften comput ed when the sys tem is des igned . I t can be computed i f s ystem parame ter s ( fo r e xampl e , transmitter and receiver location, power , required S /N ) are known us ing stati s t ical data o n radio no i s e .
Many systems , such a s sat e l l ite o r microwave r e l ay po int-to-point systems , are des igned so that P ( BIA ) :::: 1 . In other s ervice s , s uch a s l ong-distance, ionospheric, po int-to-point s ervice s , or mobile s ervice s near the edge o f the cove rage area, P ( BIA ) may be quite smal l . I n thi s latter cas e , the probabil ity of inte rf e rence wi l l be sma l l regardless of the other p robab i l ities .

P ( DIA and C ) i s the probab i l ity ·that the wanted s ignal wi l l be correct ly rece ived eve n when the unwanted energy i s present . It can be computed i f there i s s u f ficient informat ion about the l ocation, frequency , powe r , etc . , of the source of unwanted energy .
P ( A and C ) i s the probabil ity that the wanted tran smitter and the source of unwanted energy are on s imultaneou sly . In some s ituations, the wanted transmitter and source o f unwanted energy may be operated independently . For examp l e , they may be on ad j a cent channe l s , o r b eyond a coordination distance . In thi s case, P ( A and C ) = P ( A ) P ( C ) , where P ( A ) i s the frac t ion of t ime that the wanted transmitter is emitting , and P ( C ) is the fract ion o f t ime that the unwanted source is on .
In other s ituations , the operation may b e h ighly dependent . For exampl e , the transmitters may be cochanne l stations in a discip l ined mobile service . In thi s cas e , P ( A and C ) i s very smal l ( perhaps not zero , b ecause a station can be located so that it caus e s inter ference even when it cannot hea r the other tran smitter ) .
The two transmitters might both operate con t inuous l y . For exampl e , one might be part of a microwave point-to point s ervic e , and the other a satel l ite sharing the same frequency band . In thi s case, P ( A and C ) = 1, and the p robabil ity of interference depends entirely on the factor in square brackets in Equation ( 2 ) .
S imi larly , P (CIA ) = P ( C ) i f the transmitters operate independent ly ; P ( CIA ) i s very small i f the two transmitters are cochanne l stations in a dis cipl ined land mobile s ervice ; and P ( CIA ) = 1 i f the unwanted transmitter is on a l l the t ime .
I n general , a l l the terms in Equations ( 2 ) and ( 4 ) a ffect the probabi l ity of inter ference , a lthough thei r relative importanc e i s d i fferent in dif ferent service s .
Equations ( 2 ) and ( 4 ) give the probab i l ity that inter ference wi l l occur at an instant o f t ime . A more conservative view i s that interference oc curs if any part of a transmi s s ion i s l ost ; that i s , if the unwanted energy causes loss of in formation any t ime dur ing th e wanted trasnm i s s ion . This i s particul arly applicable to digita l transmi s s ion s ystems . In thi s case , we repl ace the factor P ( CIA ) in Equation ( 4 ) with the probabi l ity that th e wanted and unwanted transmi s s ions ove rlap .
I f both the wanted transmi s s ion and the unwant e d energy are pre sent a l l the time , thi s probabi l ity is one . The interesting case is when one o r both transmit intermittentl y . Let
N
the length of a tran smi s s ion by th e wanted transmitter ;
the average number of unwanted emi s s ions per unit time ; and
the average l ength of an unwanted emi s s ion .
6
As s ume that the beginning time of the unwanted emi s s ion i s Poisson distributed , and th e l ength of the quiet t imes i s exponentia l ly distributed . Then the probab i l ity that the wanted and unwanted transmi s s ions overl ap i s :
P ( over lap ) = 1 - ( 1 -NTua> exp[-T�/ ( l -NTua ) ] . ( 5 )
S ubst ituting ( 5 ) into ( 2 ) , yields the probab i l ity of inter ference at some t ime during a t ransmi s s ion o f l ength Tw :
P ( inter ferenceiTw) = [P ( BIA - P ( DIA and C ) ]
x [1 - ( 1 -NTua ) exp [-TWN/ ( 1 -NTua ) J ( 6 )
Not ice that NTua i s the fract ion o f t ime that the unwanted energy i s present . I f NTua = 1 , then P ( overlap ) = 1 . I f NTw and NTua are both much sma l l er than 1 ( both operations are very intermittent ) then P ( overlap ) �NTw + NTua'
I n addit ion, thi s proj ect subcontracted a study o f the interference from s evera l c ochannel FM transmi s s ions to FM recept ion . D r . David Middl eton is conducting thi s study . Fundamental formu l as for the inte�ference have been der ived , and will b e pub l i shed .
The UHF Comparabil ity proj ect has provided method s for improving the a s s ignment o f UHF TV channel s . ·In the past , a s s ignments have been bas ed upon a s impl i fied method to min imize admini strative burden . However , with many of the a l l ocat ions f i l l ed , and the rec ent prospect s of low-power drop- in station s , a much more complex method was needed that could i nclude terrain e ffects on the propagation, antenna patterns , and the actual system para m eters of both the ex ist ing stations and the applicant stations . In addition, each a s s ignm ent has to consider the potential inter ference caused by intermodulation, image frequenc ies , etc . ( commonly cal l ed taboos ) . I n o rder to add a new station to a particular market , whether it be a ful l powe r station or a lowpower d rop- in station , r equ ires searching th e e x i sting ass ignments for potential inter ference probl ems . A computer program was written to a cc e s s a copy of the FCC TV data base , s e l ect the stat ions in the area that might have i nter ferenc e , and print out data in o rder to determine potent ial channe l s in the a rea . A s ampl e of the output i s shown in Figure 1 - 2 for Boston, MA . In order to put a station i nto an area a s crowded as Boston, all of the station parameters wil l have to be engineered . That i s , und er the current rules j ust us ing d i stance s eparat ions , no new stations could be p laced in Boston . Howeve r , by scann ing the. output o f this program , it is pos s ible to f1nd channe l s where, with some power restr ictions and direct ional antenna s , it may be pos s ibl e t o put in some low-powe r stations . For . instanc e , in the example, a Channe l 50 a s s 1gnment would confl ict with Chann e l s 36 and 64 ( in violation o f the sound image taboos by 2 7 % a nd 4 0% ) . We can determine the powe r restrict ions on a new Channe l 5 0 that would not ex ceed e stabl ished signal-to- interference ratios within the coverage areas o f Channe l s 3 6

Vacant Channel Number Taboo
Taboo Distance Azimuth Call Channel from from Sign Number Reference Reference
Latitude Longitude (Deg.N) (Deg.E)
��···- ····�· -�---35 ADJACENT CHANNEL WSBETV 36 43.93 MI 209.09 41.8050 71.4733 35 LOCAL OSCILLATOR 28 50.50 MI 172.35 41.6369 70.9281 35 LOCAL OSCILLATOR NEW 28 54.38 MI 186.97 41.5800 71.1861 35 VIDIO IMAGE 50 48.05 MI 334 :.2) 42.9911 71.4614 36"·----cO-CH'AN ___ WsBETv -36-- Jf3.'§3M'I ___
2o9.09--4T.So50 71":-"4733 36 CO-CHAN WSBETV 36 43.93 MI 209.09 41.8050 71.4733 36 IF BEAT WGBXTV 44 9.80 MI 248.83 42.3103 71.2372 36 IF BEAT WGBXTV 44 9.80 MI 248.83 42.3103 71.2372 36 INTER MODULE WSBKTV 38 9.13 MI 243.87 42.3033 71.2189 36 INTER MODULE WSBKTV 38 9.13 MI 243.87 42.3033 71.2189 .�6 ____ .§�N.Qd.M!fl.L _______ 5.Q __ i§Jl.5.J1l.-- _l3�CU.- .J�9.21L-71.·�.1.i 36 VIDIO IMAGE 21 63.23 MI 337.44 43.2061 71.5403 36 VIDIO IMAGE NEW 21 64.95 MI 334.97 43.2125 71.6042 37 ADJACENT CHANNEL WSBETV 36 43.93 MI 209.09 41.8050 71.4733
63 VIDIO. IMAGE NEW-T 48 41 .63 HI 206 .69 41 .8225 71 .4217 64 CO-CHAN WNET 64 36.06 MI 199.85 41 .8703 71 .2964 64 CO-CHAN WNET 64 36.06 HI 199.85 41.8703 71.2964 64 IF BEAT 56 .00 MI 30.59 42.3617 71.0583 64 IF BEAT WLVITV 56 9.13 MI 243.87 42.3033 71.2189 64 INTER MODULE NEW-T 62 1.61 MI 231.69 42.3472 71.0831 64 INTER MODULE WQTV 68 1.61 MI 231.69 42.3472 71.0831
-��. ___ S.QQ@.,lf;1!G.!, _ _ -- __ 29 __ 1§_ • .Q.5.J-1!_ __ 3.J.4.:.2L -�·�1J__71.;4�1�.
65 CO-CHAN WEDY 65 118.90 MI 233.74 41.3283 72.9070 65 CO-CHAN W65AM 65 108.93 MI 325.43 43.6539 72.2953 65 INTER MODULE NEW-T 62 1.61 MI 231.69 42.3472 71.0831 65 INTER MODULE WQTV 68 1.61 MI 231.69 42.3472 71.0831 65 ADJACENT CHANNEL WNET 64 36.06 MI 199.85 41.8703 71.2964
F igure 1-2. Samp le output f rom TV taboo search program around re ference s ite at 42.36167 deg . N and 72.058 3 3 deg . E .
7

and 6 4 . The next step i s to use another program to calculate what s ignal leve l s one can tol erate in the directions of thos e two conflict s, and l imit the power from the new stat ion in those d irect ions . Both of the se confl icts are relat ive ly close in bearing, 200" a nd 2 1 0" from the new station . A sampl e output from the s igna l-to- interference calcu l ation program i s shown in Figure 1-3 .
The current FM broadcast rules do not a l low s econd- and third-ad jacent-channel transmitters to be any closer to e x i sting tran smitter s than the distance to the exi sting transmitter's protected contour ( i . e . , 1 5 mi les for C l a s s A, 40 miles for Class B, and 65 miles for Class C transmitters) . However, i f th e FCC ma inta ins its requ irement to provide an audio s igna l-to- interference ratio o f 3 0 dB and it s po l icy to deve lop rul e s based on good qual ity rece ivers, then we be l ieve there may b e good reason to reduce the second- and third-ad j acent-channel min imum mi leage separat ion requ irements, based on the per formance of today's median FM broadcast rece iver. Th e E xpanded FM Spe ctrum Capacity pro j ect provided for the review of e x i sting meas urements of FM r eceiver properties and the laboratory meas urement of additional rece ivers to e stabl ish the ba s i s for these conc lus ions.
A set of interference-r e j ect ion meas urement s made by the FCC in 1947 on eight FM broad cast rece ivers e stabl i shed the rece iver spe c i f i cations wh ich defined the FM broadcast transmitter s eparation requ irements that s t i l l ar e u s ed today . The measuremen-ts were based on an audio de s ired-to-unde s ired s ignal ratio o f 3 0 dB . At th i s ratio, the unde s ired s ignal i s perceptible; at a ratio o f 2 0 d B the undes ire d s ignal is annoying; wh i l e at a ratio of 50 dB, the undes ired s ignal is bare ly percept ibl e . The 3 0 dB ratio rema ins as the pres ent FCC audio-frequency protection ratio standard . A s d e fined by the CCIR, "the aud io- frequency protection ratio is the agreed min imum va lue o f the aud io-frequency s ignal-to-interferenc e ratio cons idered neces sary to achi eve a s ubj ect ively def ined reception qual ity . " Corresponding to the audio protection ratio, th e CCIR state s "the radio-frequency protection ratio i s the va lue of the radio-frequency wanted-to-interfering s ignal ratio that enables, under spec i fied conditions, the audio frequency protection ratio to be obta ined at the output o f a rece iver . " Obviou s ly ·the r f protection ratio wi l l be different wh ether the desired and interfer ing s igna ls are cochannel, f irst-ad jacent channel, second-ad j acent channel, etc. The FCC has stated that the rf pro tection ratios should be 20 dB for cochannel, 6 dB for first-ad jac ent-channel, - 2 0 dB for s e cond-ad jacent-channel, and -40 dB for thirdad j acent-channel interference . Note that the se rf protection ratios are establ i shed regardless of whether the des ired s ignal and the unwa nted s ignal are broadcast ing stereo or mono transmi s s ions .
Nationally, the IEEE has e stabli shed a standard for mak ing FM broadcast rece iver measurements; international ly, the CCIR has recommended a standard that d i f fers from the IEEE standard .
8
The IEEE standard method for making FM rece iver protection ratio meas urements ut i l i ze s tones to measure the interference betwe en a des ired s ignal and an interfering one . Th e measurement i s de fined only for measur ing the e f fects o f a monophon i c inter fering s ignal to a monophonic desired s ignal . Protection ratios for stereophonic operation are undef i ned . The original FCC Laboratory protection ratio measurement method is very s imi l ar to that defined by the current IEEE proc edure as both use tones to s et l eve l s and measur e i nterferenc e .
The CCIR protection ratio measurement method uti l i ze s noise shaped to s imulate program material as the source of modulation for the inter fering s igna l . CCIR a l so assume s the i nterfering s ignal to be monophonic wh i l e the de s ired s igna l is stereophonic; they contend that th i s presents the worst case interference s ituation .
The IEEE method employs standard laboratory equipment and i s rather s imple to perform, whereas the CCIR method requ ires specialpurpose equipment and i s somewhat crit ical t o s et-up and per form .
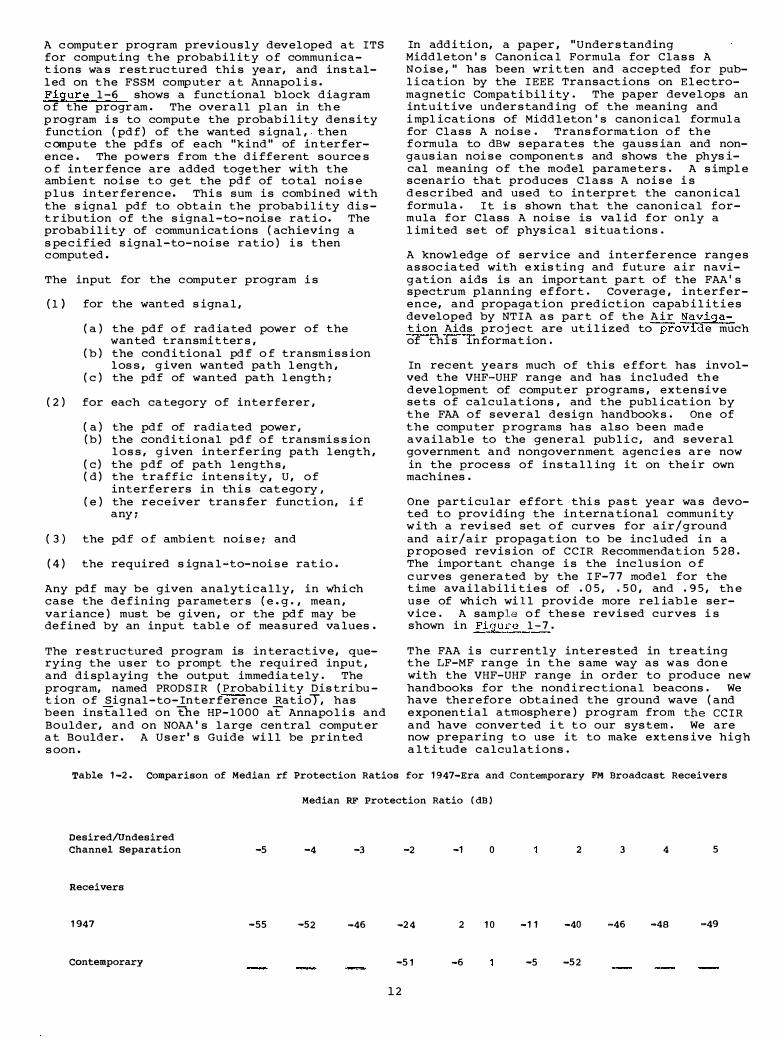
I n Figures 1 -4 and 1-5 we have combined a l l IEE E and CCI R method protection ratio mea s urem ent data that we have col l ected on contemporary receivers . The s e results show a s ign i f ic ant improvement in rece iver per formance over the rece ivers ava i l able when the FCC's me as urement s were made . There is very l itt l e meas urement data o n contemporary rece iver s beyond second-ad jac ent-channel ( 4 00 kHz) carrier separations of the desired and undes ired s ignal s . However , it i s interesting to compare the med ian rf protection ratio per formance of contemporary receivers with that o f the 1 947-era receivers ( se e Table 1-2) . Not e that the median contemporary rec e iver has an r f protection ratio at second-adjacent-channe l spacing ( and beyond) that is as good as the median 1 94 7 rece iver had at fourth-adjacent channel spac ing ( and beyond) .
The Spectrum Engineerin� Deve lopment Support pro j ect provides analy s 1 s s upport to the Spectrum Eng ineering and Ana l ys i s Divi s ion o f NTIA .
In many congested spe ctrum-u s e environments, there is s igni f icant variab i l ity in a lmost e very factor infl uenc ing commun ications succes s . Transmitters may be mob i l e or their l ocations may be unknown, e ither because data are not available or becau s e the s ystems have not yet been deployed . Antenna he ight s may depend on ava ilabil ity o f favorabl e locat ion s or on des ired coverage o f i ndividual systems . Transmitter powers may vary by specification or because of aging and d i fferent ma intenance proc edure s . Transmi s s ion loss varies with d etails of the transmis s ion path and often with time becau s e o f weather or other geo phys ical events . Message tra ffic or channel u s age may vary with th e requ irements of the u s ers. Therefore, any r ea l i stic e stimate o f communications succ e s s mu st be probabil istic . It should be based on cons ideration of the statistical di stribution of a l l s ignif icant factors .

CHANNEL HAAT ERP DELTA-H --------- --------- --------- ---------
(FT) (KW) (M) EXISTING 64 522 1480.00 51 .38 VACANT 50 500 1.00 51 .38 SEPARATION DISTANCE= 36 .06
SIGNAL INTERFERENCE SII -------------- -------------- ------------
DISTANCE FCC LR-AREA FCC LR-AREA FCC LR-AREA ( S MI) (DBU) (DBU) (DBU) (DBU) (DB) (DB)
1 132.9 132.3 39.5 61.5 93.5 70.9 2 124.1 126 ·3 40.3 62.4 83.7 64.0 3 118.2 122.8 41.2 63.3 77 .o 59.5 4 113.9 120.3 42.1 64.2 71.8 56 .1 5 11 0. 1 118.4 43.0 65.1 67.0 53 .2 6 106 .8 116.8 43.9 66 .1 62.9 50.7 7 104.0 115.4 44.8 67.0 59.2 48.4 8 101 .6 114.3 45.7 68.0 55.9 46.3 9 99.7 113.3 46.6 6 9 .o 53.0 44.3
10 98.1 111 • 7 47.6 70.0 50.5 41.7 11 96.7 110.0 48.5 71.0 48.2 39.0 12 95.3 108.4 49.4 72.0 45.9 36.3 13 94.0 106 .8 50.4 7 3.1 43.6 33.7 14 92.6 105.3 51.3 7 4.1 41.3 31.2 15 91.3 103.8 52.3 75.0 39.0 28.8 16 90 .0 102.4 53.3 75-7 36.7 26.7 17 88.7 1 01 .o 54.4 76.1 34.4 24.9 18 87.5 99.6 55.4 76.5 32.1 23.2 19 86.3 98.3 56.5 76.9 29.7 21.4 20 85 .1 97.0 57.7 77.3 27.4 19.6 21 83.9 95-7 58.9 77.8 25.1 17.9 22 82.8 94.4 60.1 78-3 22.7 16. 1 23 81.6 93.1 61.3 7 8. 9 20.3 14.2 24 80.4 91.9 62.6 79.5 17.8 12.4 25 79.3 90.7 63.9 80.2 15.4 10.5 26 7 8.1 89.5 65.2 81.0 12.9 8.5 27 77 .o 88.3 66.5 81.8 10.5 6.4 28 75.8 87.1 67.8 82 .8 8.0 4.3 29 7 4.6 85.9 69.4 83.9 5.3 2.0 30 73.5 84.8 71.1 85 .2 2.4 -.4 31 72.3 83.7 73.1 86.8 -.8 -3.1 32 71.2 82.5 75.5 88.7 -4.3 -6 .1 33 70.0 81.4 78.4 91.1 -8.4 -9.7 34 68.9 80.3 82.1 94.6 -13.3 -14.4 35 67.7 79.2 87.4 100.6 -19.7 -21 .5 36 66.6 7 8.1 96.4 160.6 -29.9 -82.6
F igure 1-3 . A sample output from the signal-to-interference calculation program . HAAT i s the height above average computed terrain irregularly .
9

OFFSET RF PROTECTION RATIO (DB)
FROM STD EXCEEDED BY THE GIVEN CARRIER MAX MIN MEAN DEV PERCENT OF THE MEASUREMENTS ------- ----- ----- ---------- -------
(KHZ) (DB) (DB) (DB) (DB) 10\ SO\ 90\
-400. -81.0 -12.0 -51.7 18.2 -71.0 -51.7 -25.4
-300. -68.3 3.5 -34.1 21.0 -65.7 -29.0 -2.0
-200. -28.5 21.5 -4.5 8.8 -13.0 -5.9 6.7 -150. -8.9 23.2 -.4 7.2 -8.0 -1.5 8.6
-100. -7.0 22.7 1..6 6.7 -6.1 .a 11.4
o . -18.8 24.7 3.6 7.2 o .o 1.4 20.0 100. -18.8 22.5 1.6 6.7 -2.1 .s 8.8
150. -10.9 23.7 .3 6.8 -6.9 -.5 6.8 200. -28.0 22.7 -4.4 9.2 -14.8 -5.2 4.4 300. -66.0 -1.0 -26.9 17.5 -52.3 -23.1 -5.4 400. -81.0 -13.9 -49.1 17.3 -67.0 -52.6 -24.1
-�:: � " m \)
0 ..... -1> 0 '-s:: 0 ..... � 0 • -1> 0 'a..
LL. a:::
-50.
-25.
0 .
25.
50.
t 10% 50%
'� 90% . ,. ' .. ··'/ � ··. .· ., ""-- ----=��·······.:·······.:·······�·� �
--- .----
mono
mono
R= mono
No. of reoeiverea 54
Method= IEEE
Audio Protection
Rot.io = 30. dB
75.��--�--�--�--��--�--�--�--��--�--�--�--��
-400. -200. 0. 400.
Carrier Offset.. kHz
Figure 1 - 4 . All ava ilable I EEE method rf protection rat io mea surement data, taken on FM broadc a st receivers , for monophonic des i red ( D) and undes ired ( U) s ignal s and receiver (R) set for monophonic operat ion. The table provides the stat i stics for the protection ratio mea surement dat a . The graph shows the mea sured protection ratio for at least 10, 50, and 90 percent of the FM broadca st receivers ver sus carrier off set between the desired and undes ired FM broadca st s ignals .
lO

r:n -u
0 ..... ..., 0 {,. s::: 0 .....
-?> 0 � � t. (1_
lJ.. 0:::
OFFSET RF PROTECTION RATIO (DB)
FROM STD EXCEEDED BY THE GIVEN
CARRIER MAX MIN MEAN DEV PERCENT OF THE MEASUREMENTS
------- --- -------- ----------------
(KHZ) (DB) (DB) (DB) (DB) 10% 50% 90%
-400. -77 .0 o .o -49 .a 21 .2 -72 .9 -52 .0 -1a .o
-300. -5a.o -a .o -29 .6 14.0 -49 .7 -26 .0 -10 .3
-200. -25 .0 7.0 -a . 1 7 .7 -1a .8 -7 .5 1 .0
-150 . -13.0 8.0 -1 .8 4.9 -7 .0 -1 .0 4.9
-100 . -3.0 9.0 1.4 2.9 -2 .0 1 .0 6.a
0. 5 .0 33.0 15 .2 6.5 6.3 15 .0 26 .0
100. -3.0 9 .0 1.4 2.9 -2.0 1 .0 6.a
1 50 . -13 .0 a .o -1 .a 4.9 -7 .0 -1 .0 4.9
200. -25.0 7 .0 -a . 1 7 .7 -1a .8 -7.5 1 .0
300. - s s . o -8.0 -29.6 14.0 -49.7 -26.0 -10.3
400. -77 .o -16.0 -5 .i .4 19 .2 -72 .9 -52 .0 -18.4
·- 100.
-75
. � 10% -50. K . 50%
-25 .
0.
25.
50.
'� 90% .
0=
U=
R=
'
· . . .
· · / ---- � • 0 •
• •
• --
---
-.....__ ... � .. . . .... � ----....___
- -...:..:._ . . . . . ·-- - -----
mono
mono
mono
---..... � • • • • 0 • • • ; .........-.....---""'�� No. of receivers=
� / Method=CCIR
Audio Protection
Ratio = 30. dB
32
75. L-�---L--�--�--��---L--�--J---L-�--�--�--�--L-� -400. -200. 0. 200. 400.
Carrier Offset. kHz
Figure 1-5 . A l l ava i lable CCIR method rf protection ratio measurement data for monophonic des ired (D) and undes ired ( U ) s ignals and receiver ( R ) set for monophonic operation , C C I R method , 30 dB protection ratio . The table prov ides the stat i s t ic s for the protection ratio mea surement da· ta . The graph shows the measured pro tection ratio for at least 10 , 50 , and 90 percent of the FM broadcast receivers versus carrier o f f set between the des ired and undes ired FM broadcast s igna l s .
A c ompute r program previou s l y developed at ITS for comput ing the probab i l it y o f communicat ions wa s restructured thi s ye ar, and install ed on the FSSM computer at Annapol i s . Figure 1 -6 shows a functional block d iag ram o f the progr am. The overall pl an in th e p r�gram i s to compute the probab i l ity dens ity function ( pd f ) of the wanted s ignal , the n c ompute the pd fs of each "kind " of interference . The powers f rom the di fferent source s o f inter fence are added together with the ambient noise to get the pd f of total noi s e p l u s inter ferenc e . Thi s sum i s combined with the s ignal pdf to obtain the probabil ity di s t r ibution of the s ignal-to-noise rat i o . The probab i l ity of communicat ions ( achieving a s pe c i fi ed s ignal-to-noise ratio ) i s then computed .
The input for the computer program i s
(1 ) for the wanted s igna l ,
( a ) the pd f o f rad iated powe r of the wanted transmitter s ,
( b ) the cond itional pd f o f transm i s s ion los s , g iven wanted path l ength ,
( c ) the pd f of wanted path l ength;
( 2 ) for each category of interferer ,
( a ) the pd f of radiated powe r , ( b ) the cond itional pd f o f transmi s s io n
l os s , g iven inte rfer ing path l ength , ( c ) the pdf of path l ength s , ( d ) the traffic intens ity , U , o f
interferers in th i s catego ry , ( e ) the receiver tran s fe r function, i f
any ;
( 3) the pd f o f ambient noi s e ; and
( 4 ) the required s igna l -to-noi s e rat io .
Any pd f may be given analytically, in whi ch case the de fining parameter s ( e . g. , mean , var iance ) must be g iven , or the pd f may be de fined by an input tabl e of measured va lues .
The restructured program is interactiv e , querying the u s er to prompt the requ ired input , and di spl aying the output immediate ly. The program, named PRODS I R ( Probab i l ity Distribu t ion o f Signal-to-Inter ference RatioT, has been instal l ed on the HP-1 000 at Annapo l i s and Boulder, and on NOAA ' s l arge central comput er at Boulder . A User' s Guide wi l l be pr inted s oon .
In add ition, a paper , "Under standing Midd leton ' s Canonica l Formula for Clas s A Noise , " has been written and accepted for publ i cation by the I EEE Transact ions on E l ectromagnetic Compatibil ity. The paper deve l ops an intuitive under stand ing of the meaning and i mpl ications of Midd l eton's canon ical formul a for Class A noise. Trans formation o f th e formula to dBw s eparates the gauss ian and nongaus ian noi s e component s and shows the phys ical meaning of the model parameter s. A s impl e scenario that produces Class A noi s e i s d escribed and used to interpret the canon ical formula. It i s shown that the canonical formula for Class A noi s e is val id for only a l imited set of phys ical s ituations.
A knowl edge of service and interference ranges as soc iated with existing and future air navig ation aids is an important part of the FAA ' s spectrum planning e f fort. Coverage , interference, and propagat ion pred iction capab i l it i e s developed by NT IA a s part of th e A i r Navigat ion Aids proj ect are ut i l ized to provide much of thi s 1n format ion.
In rec ent years much of thi s e ffort has involved the VHF-UHF range and has included th e d eve lopment of comput er programs , extensive sets o f calculations , and the publ i cat ion by the FAA of s everal design handbook s. One of the computer p rograms has also been mad e available to the general pub l i c , and s everal government and nongover nment agenc i e s are now in the proc ess of insta l l ing it on the i r own machines.
One particular effort thi s past year wa s devoted to prov iding the international community w ith a revi sed set o f curves for air/ground and air/air propagat ion to be inc l ud ed in a p ropo sed revis ion of CCIR Recommendat ion 5 2 8. The important change i s the inc lus ion o f c urves generated by the I F-7 7 model for the time availabilities of . 0 5 , . 5 0 , and . 9 5 , th e u s e of wh ich wi l l provide more rel iable service. A sample o f the s e revised curves i s shown in Figure 1-7.
The FAA i s curr ently interested in treating the LF-MF range in the s ame way as was don e with the VHF-UHF range in order to produce new handbooks for the nond i rectiona l beacons. We have therefore obtained the ground wave ( and exponential atmosphere ) program from the CC I R and have converted i t t o our system. We are now preparing to use it to make extens ive high a ltitude calculations.
Table 1 -2 . Comparison of Median rf Protection Ratios for 1 947-Era and Contemporary FM Broadcast Receivers
Desired/Undesired
Channel Separation
Receivers
1 947
Contemporary
-5
-55
Median RF Protection Ratio ( dB )
-4 -3 -2 -1 0
-52 -46 -2 4 2 1 0
-5 1 -6
12
2 3 4 5
-1 1 -40 -46 -48 -49
-5 -5 2

SPAT I A L D I ST R I BUTION O F STATI ONS T I M E AND F R EQUE NCY D I ST R I BUTION O F T RANSM ISSIONS
E QU I PM E N T A N D P ROPAGAT I O N CHARACTE R ISTICS
I
rr
COMPUTE PROBAB I LITY D I STR I BUTION O F
WANTED SIGNAL POW E R AVA I LAB LE AT A
RANDOM R ECE I V E R S, dBW COMPUTE PROBAB I LI T Y
D ISTR I BUTION O F CO-CHAN N E L I NTE R F E R E NC E
Ic , d BW m ��
TI '
SUM TO G ET D I STR I BUTION OF TOTAL I NT E R F E R E N C E ,
I lc Io N m1o = to,o + 1 01o + to,o
COMPUTE PROBAB I L I T Y D I STR I B UT I O N OF S I G N AL-TO- I NT E R F E R E N C E R AT I O
AT R E C E I V E R I N PUT
S - I dBW
COMPUTE P ROBAB I LI TY D IST R I BUTION O F NO N-CO-CHAN N E L
I NT E R F E R E NCE
I0 , dBW
ASS U M E D ISTR I B UT I O N OF R AD I O F R EQU E NCY N O I SE
N , d BW
OUTPUT TABLE OF PROBAB I LITY T HAT
S/I � Tn F O R S E LECTED SET O F T H R ESHO LDS, T n
Figure 1-6. Block diagram of program for computing the probability of inter ference in a congested environment .
13

� ·�
zoo
ll�
..._ IX\ '0 l�O 5 1 0 0 MH Z !I) Lb ( 0 . 0 5 )
, ,� !I) (l 200 400 600 1100 100
0 ..:I
J:: 0
·r-l
!I) 1 7� -� . .. .•. · · · · · · · .. . · ·· · · . . . . . . . . .... .
!I) ·r-l
200 s !I) J:: Zl�
ro � z�o 5 1 0 0 HH z 8
() ·r-l !I) ro IX\
Lb (0 . 5 0 )
1�0 5 1 0 0 MH .z Lb ( 0 . 9 5 )
zoo
400 600
•oo 1600
P a t h D i s t a n c e ( k m )
Code for Antenna He i ghts
Code H1
(m) H2
(m)
A 1 5 1 0 0 0 B 1 0 0 0 1 0 0 0 c 1 5 1 0 0 0 0 D 1 0 0 0 1 0 0 0 0 E 1 5 2 0 0 0 0 F 1 0 0 0 2 0 0 0 0 G 1 0 0 0 0 1 0 0 0 0 H 1 0"0 0 0 2 0 0 0 0 I 2 0 0 0 0 2 0 0 0 0
Figure 1-7. Basic transmission loss at 5 1 0 0 MHz for time avai labil ities of 0 . 5 , 0 . 5 0 , and 0 . 9 5 . The dotted-line curve is that for free- space .
14

Two further tasks are currently under way :
1 . Production of computer g enerate d propagation and inter ference predictions as reque sted by the FAA. Part of thi s work involves the study o f spec ial cases that have pres ented particular prob l ems .
2 . Ongoing compa r isons of pr ed ic tions with e xperimental. data and with other mode l s .
A project has been started thi s year to develop a Ground Network Communication Model. Thi s is a mode l of a large network o f up to 300 g round-based transce ivers in an area up to 5 0 km on a side . The model wi l l calculate and display the communication rel iab l i l i ty of each l ink , and al low the user to modi fiy the network to ana lyze s it ing , equi pment characteri s t ic s , and other parameters a ffec ting the l ink communication rel iab i l ity. The program wil l use the point-to-point path- loss model to calculate rel iabl i l ity for each l i nk o f the net. Ther e are several data bas e s as sociated with the model to store s uch items as terrain data , map data, plot data , etc .
The Figure 1-8 shows a planned s tructur e d iag ram of the mode l .
SECTION 1 . 2 . SPECTRUM ENGINEERIN G FOR EFFIC IENT SPECTRUM USE
In addition to the development of new ana ly t ical and measur ement technique s , ITS appl ies the results of s uch work to spe c i fic problem s o f concern to various agencies. One impo rtant factor in planning for new d eve l opments i s ou r e xperience with such pro j ects where the pract ical needs of operational agenc ies mu st be r ecognized.
The u . s . Coast Guard Consult ing pro j ect provides " quick reaction" propagat ion pred ict ion s a nd short- term stud i e s as needed by the Coast Gua rd in the operation o f the i r large network o f MF and VHF communication sys tems. In addition, sea sonal propagat ion predict ions ar e suppl ied to support the AMVE R ( Automated Mutual-ass istanc e VEs s e l Re s cu e ) system. The s e p e r iodic predic tions a r e distr ibuted t o the many AMVER partic ipants to a id them in choo s i ng the best frequency and Coa s t Guard communication station with whi ch to l og the i r AMVER r eports .
One of the studies compl eted thi s year was to determine how we l l the U . S. -ba sed AMVER stat ions coul d cover the Indian Oc ean. The anal ysis here involved the predict ion o f the communication ( or c i rcu i t ) r e l iabi l i ty between e ight U . S . -based s tations and an array o f 4 9 s imulated ship pos itions for a variety o f conditions that account for d i urna l , s easona l , a nd solar activity e ffects. The results of the study indicate that it i s d i fficult, bu t c ertainly not impo s s ib l e , to communicate with the ships in the Indian Ocean . The communi c a tion stations a t Portsmouth and San Franc i s co are good choice s . The best frequenc ies to u s e a re i n the 8 , 1 2 , and 1 6 MHz mar itime bands . other choices include the c ommunication stat ions at Guam, Honolul u , and San Juan.
Another study begun thi s year involves cove r a g e problems along the Tenne s s e e River i n the
1 5
Second u . s . Coa st Guard D i str ict. Several of the VHF s ites u s ed for c ommun icat ion with ve s s e l s o n the r iver d o not per form as we l l as expected. In fac t , there are s everal s ection s o f the r iver that are not covered by any of the VHF s i tes. ITS provides a s s i stance in the f orm of propag ation and coverage pr edictions for the s ites a s they are now, as wel l as for s ome alternatives , whi ch include new s ites and d irectional antennas for exi s ting s ites.
S PS EMC As s e s sment. Thi s is a continu ing program sponsored by the Department of Energy to s tudy the potential RFI / EMI e ffects of a propo sed Solar Power Station ( S PS ) . The se sate l l ites would convert solar energy into d e voltage which wou ld d r ive high power microwave s ources to produce a high energy microwave beam at 2 . 4 5 GHz . The satel lite in geostat ionary orbit woul d beam the energy to a given rece iving antenna ( rectenna ) on earth where the mic rowave energy wou ld be converted to e l ectrical energy for cons umer u s e. One sate l l ite is capable of produc ing 5000 MW of el ectrical power on the earth.
The EMC study covers a broad spectrum of EM and el ectronic systems studies to de termine e f fects of an SPS . The EMC evaluation program included asses sments through analy s i s and mea s urement of the per formance degradation of s u sceptible e l ectron ic systems , the uti lity e ffects of mitigation technique s relative to system appl icat ions. The eva luation included the development of investment and mitigation cost s ummaries for the affected systems. Reported here i s the cost factor area � rel ating systems and appl icat ions to current inve stment, est imate s regard ing future expenditures for capabil ity or service area enhancement , a nd functional mitigation incremental costs. These data are pres ented for s ix cont inenta l U n ited States ( CONUS ) geographic areas. Al so reported here is a s ummary of a study dealing with al ternate frequency considerat ion for the power and p i l ot beams. The alternate frequency cons i_deration wa s requ i red to ind icate the charactJr of functional and environmenta l e ffects for alternate frequency ranges as one input to future engineer ing trade-o f f inve s t i g ations .
Cost factors and investment summary : These cost factors and the di str ibut ion throughou t C ONUS provide one indicator of the economic impac ts of the SPS inter ference to nationa l s ervice s , ident i fy in the mitigation element a cost directly attributable to SPS implementat ion, and one economic factor for future rectenna s ite ana lyses. Redeployment costs wer e n ot addre s sed, s ince the se wou ld be unique to spec i fic areas and widely variant. Rectenna s it ing requ i r ing movement of a group of microwave relays in i solated areas or the relocat ion of ma j or fac i l ities such as rad io astronomy and support ing equipments are extr eme examples of a redeployment effort.
Co st e s t imates for mod i f icat ion of exi s ting c ategor ies of susceptibil ity equ ipment were developed with the cooperation of manu factur e r s , particularly relative t o eng ineer ing and l aboratory expenses related to c i rcuit de s ig n a n d integ ration, and the laboratory sus ceptib i l ity test ing o f s ignal channel r e j ection and shield effectivenes s .

i-' "'
QUE S T I ON
A . VE RBO S E
B . S UCCINCT
NODE /OUTPUT PARAMET E R
DATA BASE
I 1 I I
I HELP I
E D I T S UMMARY
L I NE
PRINTER OR
TERMI NAL
P LOT
DATA BASE
PLOT
CALCULATE A . AREA
B . L I NK
MAP
DATA BASE
GRAPH ICS
F igure 1 - 8 . Proposed functional s truc ture o f GNCM .
QUIT
S Y S TEM
LOG-OFF
TOPOGRAPH I C
DATA BASE

Based on the estimated number o f equipments operationa l in CONUS that are e xpected to b e i n u s e for a fi fteen t o twenty year per iod , and the curr ent ly expected expan s ion in s e r v ic e s requ i r ing the s e systems , the po s s ible mit igation cost range for these equipment s i s i n the $ 8 6 , 000 , 000 to $ 94 , 000 , 000 range . Th i s a s s ume s that a l l equipments would b e modi fied a nd te sted .
S e l ective mitigation may be viable when specific rectenna s i tes are sel ected and spacetenn a s patial and spectral emi s s ion control e ffect ivene s s has been demonstrated in laboratory a nd l imited space tests .
Alternate frequ ency st udy : Cons ideration s s ummarized her e in rel ate to the EMC impact , SPS system e l ementa l costs ( e . g . , space compon ents , rectenna components and area , power source devices ) , and SPS power del ivery pe r formance and contro l compl exit i e s .
Frequenc ies l ower than 2 . 4 5 GHz are not cons idered usab l e by SPS for the fo l l owing rea sons :
1 . Increased spacetenna and rectenna areas for be amwidths comparable to the re ferenc e d e s i g n .
2 . Inc reas ed ionosphere interaction .
3 . I ncrea sed EMC sus ceptib i l i t ie s ; larger r f receiver popul ations , increased SPS power beam c oupl ing e f f ic i enc ies for el ectron i c c ircui try and devices ( e . g . , computers and control sys tems , s ensor s ) .
Thi s task was one e l ement in the EMC evaluat ion �f the proposed SPS Re ferenc e Des ign . The alternate frequency cons ideration wa s required to indicate the character of functiona l a nd environmental effects for alte rnate powe r beam frequency ranges as one input to future eng ineer ing tradeoff inve s t ig ations . The ba s ic conc lus ions from thi s task are l i sted a s follows :
1 . One po s i t ive attr ibute for frequenc ies higher than 2 . 45 GHz conc erns the reduc e d i onos phere interact ion, a s s uming the inver s e frequency relationship for heat ing thre sho ld . Th i s reduced inte raction wou ld a l l ow cons ideration in des ign and per formance tradeo f f exerc i s e s of spacetenna and rectenna area . As c i ted prev iou s ly , the s e r ectenna areas wi l l be larger than the plots of troposphere interaction s .
2 . For the bands cons id ered higher than 2 . 4 5 GHz , the increased troposphere inter a ctions would significant l y r educe the system average e f fic i ency and increase th e power beam fluc tua tions dur ing storm cond i t ion s . The increa sed media modulation e ffects would greatly compl icate the spacetenna control func tion s , including the stab i l ity of the ma in beam a im-po int and s idelobe ampl itude control loops .
3 . The EMC impact on r f rec e ivers wi l l be reduced for the higher frequency band s becau s e of the general u s e of h igher gain antennas and increased proc e s s ing gains a nd lowe r coupl ing e ff i c i ency to c ircuits
17
and component s . Commun ications and radars operating in the se h igher bands wil l employ more adapt ive antenna and high proc e s s ing gain techniques than systems ope ra ting at lower frequenc ies . These cons iderat ions are favorable for SPS h igher frequency a lternatives .
4 . Spacetenna and rectenna areas can be s ig n i f i cantly reduced a t the higher S P S frequenc ies . The power beam width can be r e d uc ed by increas ing the spacetenna area , general ly to the D2 / � diameter with r e sulting reduc tion of the rectenna area, a s s uming a benign troposphere environment . Spatial beam modulation by refractive anoma l i e s and rain ( particularly i n K b and ) wou l d , howeve r , tend to negate the advantages o f a larger spacetenna .
The recommendat ions der ived from thi s study are as fo l l ows :
1 . Operation of the SPS in the frequency range of 5 - 3 0 GHz should not be cons idered b ecause of troposphere effects on per formance and system economic s , and compl e x i nter ference s ituations with future satell i te and earth communicatiaons where larg e r ec e iver popu lations are expec ted .
2 . Operat ion o f the SPS at lower frequenc i e s than the 2 . 4 5 GHz Re ference Design frequency shou ld not be cons idered because o f the greatly increased inter ference probl ems , the l arger orbit stat ion and rect enna areas requ i red for powe r beam and col lect ion e f fic ienc ies comparable to th e Re ference System , and the increased ionosphere interactions .
3 . I f fo r rea sons not now evident, future SPS des igns must ser iou s ly cons ider the X or K b and reg ions , an extended scintil lation and scatter ing mea s urement program wou l d b e requ i r ed . Mea surements in the No rthea s t , North Centra l , Northwe s t , Southeast , a nd Southwe st CONUS areas over a 9 - 1 2 month per iod would be required to i ndicate meteorolog ical var iations . Data shou ld inc l ude ampl it ude and pha se magn i t ud e and spectra ( short and medium time windows ) , and spat ial and temporal corre l a tion would b e requ ired for each s i t e to prov ide s u f fic ient data for beam cont ro l f unction spec i fications and sensor citing for ma in beam and s ide lobe meas urement s .
S PECTRUM RESOURCE ASSES SMENT ( S RA ) OF THE 5 6 5 0 -5 9 2 5 MHz FREQUENCY BAND . �s�a� e xamines the 5 6 5 0 - 5 9 2 5 MHz band to assess current and future spectrum use by both Gove rnment and non-Government servi ces ; to ident i fy present or future compatibil ity problems between ma j or users ; to evaluate technical ly the fea s ib i l ity of sharing between Government a nd/or non-Government services ; and to recommend , where appropr iat e , changes to improve s pectrum management procedure s .
In the Uni ted S tate s , 5 6 5 0 - 5 9 2 5 MHz has been a shared band with the pr imary a l l ocation ass igned to the Government radiolocation servic e w i th an industria l , sc ienti fic and medical ( I SM ) al location at 5800 + 75 MHz . There i s a

s e condary al l ocation for the amateur servic e . T o dat e , no u s e by the amateur service in thi s b and has been documented , but an e ffo rt wi l l continue t o find present u se s , i f any, and an y p l anned future use . Government a l location i s for mi l i tary radiolocation and i s u s ed fo r a ir-s urve i l l ance radar , tran sponder tracking and pos i t ive a i rcraft guidanc e , mi s s i l e and r ocket rad io , and rad ar equ ipment . Out o f the 240 a s s ignments in this band , o n ly 7 are nonG overnment and 6 of t.h e s e are ass ig ned to developers of sys t ems which s upport t.h e Gove r nment e ffo rt in thi s band for test and eva luation of equ i pment and syst ems .
At the 1 9 7 9 World Administrative Radio Conference ( WARC ) , the por t ion of thi s band from 5 85 0 to 5 9 2 5 MHz wa s real located to the fixed , f i x ed satel l i t e ( earth-to-spac e ) , and mob i l e s ervices o n a primary bas i s with rad iolocation and amateur s e rvices on a s econdary bas i s for Region 2 . Interdepa rtment Radio Advi sory Committee ( I RAC ) Ad Ho c 1 7 2 has recommended addi ng onl y non-Governmen t f i x ed sat e l l ite service s ( FSS ) ( earth-to- space ) in the 5 8 5 0 to 5 92 5 MHz band on a pr imary bas i s in the u . s . Ad Hoc 1 7 2 has also proposed u . s . Footnote YYl l wh ich stat.es that the FSS i s l imited to international systems and s ub j ect to cas e-by- case e l ectromagnetic compa t. ibil i ty analys i s . The impl ementa·t.:ion of the WARC recommendat ion i s s t i l l in prog ress and impl i c ations al ong the northern border with Canad a , and the southern b order with Mex ico, are not yet de fined but w i l l be a part of th i s a s s e s sment . The I S M b and at 5 8 0 0 + 7 5 MHz shows l i t t l e use and nothing new :rs· pl anned for the near future a s v e r i fied t:hrough the FCC .
To a s s i s t. NT IA in f u l f i l l ing i t s mi s s ion, th e Appl .i .. <�d E l ec tromaqnetic S c i ences Divis ion at ITS wil l :
1 . Review and document the characteristics of e x i sting and proposed Government and nonG overnment Systems within the 5 65 0 - 5 9 2 5 MHz band , inc lud ing t.ho s e which could b e e xpec ted i n re sponse to the results o f the 1 9 7 9 WARC and ot.her internat ional o r n ational agreements .
2 . Review previous compatib i l ity ana lys i s o f sys tems wi thin t:hi s band .
3 . Identify and document the potent ial prob l em areas ( including band edge problems with systems in ad jacent band s ) wh ich ma y h ave an impact on the e f f i c ient u s e of the spectrum, and eva luate the fea s ib i l ity o f shar ing betwe en e x i s t ing and propo sed service s .
4 . Review e x i sting techn ical standards and channel ing plans and determine the impac t o f s tate-of-the-art technol ogy on band u s age .
5 . Identi fy and out l ine spe c i fi c probl em areas requ i r ing add i t iona l ana lys i s , i f a ny .
6 . Rec ommend spe c i fic change s to the exi sting rule s , regulation s , and frequ ency management practices wh i ch wou l d improve overa l l management of the band .
1 8
7 . Me asure frequency usage of the 5 6 5 0 - 5 9 2 5 MHz band with the Radio Spe c tr um Mea s ur e m en t Sys tem ( RSMS ) Van at. a s many l ocat:i. ons as practical . The analysis o f the se measur ements wi l l be incorporated i n the fina l SRA report .
The ma j ority of the systems currently be ing u s ed in the 5 6 5 0 - 5 92 5 MHz band can be cla s s e d a s radars o r radar activated tran sponders . There are a few ass ignment s u s ed for exper i m ental development of new syst ems and antenna testing . The pre sent. a s s ignments in the band a r e summer ized in Tab l e l-3 from the Government Master File ( GM F ) and non-Government Mas t. e r Fi l e ( NGMF ) according to agency and stat ion c l a s s .
Many o f the transponder transmitters operate at peak powers betwe e n 5 0 and 40 0 watt.s with e s sential ly i sotropic antennas . Mo st of the ground based radars are u s ed for inst.rument apion at the various mi s s l e test ranges . One of the mos t trouble some features of the s e r adars .i s that. o f the high peak power ( 1 MW ) and high ant.enna gain (�4 5 dB ) combined with the po inting ang l e during a tr ack i ng exerci s e r there i s some probabi l i ty that. t.here may be i nt e r ference betwe en the s e l arge radars and c ommunications sat.e l l it.es whi ch w i l l operate i n the upper portion o f the band i n the futur e . EMC ana lys i s i s now underway to st udy the pos s ib l e problems wi thin the band .
S ECTION 1 . 3 . ADVANCED INSTRUMENTAT I ON AN D SPEC'l'RUM MEASUREMENTS
Many forms of system d e s ig n , spec trum eng i n eering , and even tact i c a l u s e of e l ectronic systems depend on a real i s t i c u nderstanding o f the e l ectromagnetic env i ronment i n wh ich the systems will be operating . Unfort unately , e nvironmental me asurements o f spectrum usage cannot often be made s impl y , beca u s e o f req u i r ements for l arge amounts o f data needed for a r e l iable statistical mode l and becau s e o f the very d ' ::. a i l ed me asurement:o1 need ed to d e s c r ibe tecl; .. li.cal system interact:ions . Som e o f the s e problems can be overcome wi th the aid o f comput e r-cont rol l ed mea s ur ement sys tems . Th e s e computer- contro l l ed mea s u r ement sys tems can provide s everal advantages over earl i e r manual systems including economical measurement of ma s s ive amounts of data , r e a l - t ime m ea s urement and analys i s of high- speed phenomena , and soph i s t icated proce s s i ng of data to p rovide a rel atively untrained ope rator with answers that are not otherwi s e obvious .
I n FY-81 the Radio SJ?ec trum Meas'-;!_r emer!.t Syst em ( RSMS ) ( fig . l-9 ) continued to make mea s ure
ments o f spec trum occupancy fo r NT IA . Unl ik e p a s t year s , however , when measurements were mad e ch ie fly for the frequency a s s ig nment proc e s s , the measurements made thi s year we re ma inly in support of NT IA ' s spe c tr um pl ann i n g p roces s . Th i s work wa s centered about provid ing spectrum u s age data to be i ncorporated i n to the Spec trum Resource As s e s sments ( SRA ' s ) being done by NT IA ' s Spectrum Engine ering and Ana l ys i s Divis ion in Annapo l i s , TI1ese SRA ' s are concentrated stud i e s o f the current and a n t i c ipated use of a given frequency band , intended to ident i fy particular probl ems or opportun i t i e s in band crowd ing , s ys t em incompat-· ib i l i te s , etc . When thi s f unc t ion i s done

t-' 1.0
Table 1�3 . GMF AND NGMF ASSIGNMENTS IN THE 5650-5925 MHz BAND
AGENCY/SERVICE
LR MR. RO MOB
AIR FORCE 17 81 11
ARMY 1 3 14 16
DOE 11
NAVY 2 18 1
NASA 2
NON-GOVERNMENT
NUMBER OF ASSIGNMENTS 34 124 16 12 PERCENTAGE OF ASS IGNMENTS 14 51 . 6 6 . 7 5
- _L-,.___ - ----- - -- -
LR - Rad iolocation Land S tation MR. - Mobile Radiolo cat ion S tation RO - Radionavigation Mobile S tation
MOB - Radio Beacon Mobile Station
STATION CLASS
MOD MOEA RLS XC XD XR
1 1 1
3 2
1
5
1 6 2
1 1 3 3 6 9
0 . 4 0 . 4 1 . 2 1 . 2 2 . 5 3 . 7 --- ------ - ---- �---- -------
MOD - Telecommand Mobile Station MOEA - Aeronaut ical Telemetering
Mobile S tation RLS - Surveillance Radar S tation
XC - Experimental Contract Dev .
XT CF
11
4
4
1 2
1
31 1
12 . 9 0 . 4
NUMBER PERCENTAGE OF OF
ASSIGNMENTS ASSIGNMENTS
123 51 . 2
52 21 . 6
15 6 . 2
34 14
7 2 . 9
10 4 . 1
TOTAL 240
XD - Experimental Dev . S tation XR - Exp . Research S tation XT - Exp . Tes t ing Station CF - Point to Point Microwave

F igu:r e 1� 9 . Eadi.o Sp ectrum Mea surement S y s tem ( RSMS ) .
2 0

proper ly , frequency al location chang e s can often avoid many e xpens ive " fi xe s " later and can s ti l l find the requ ired spectrum needed for many new systems . FY 8 1 was a particular l y busy year for SRA ' s bec ause of the large number of international frequency band al locatio n change s wh ich came from the 1 9 7 9 WARC .
Measurements were made in the Los Angeles are a a nd in the San Diego area in FY 81 . These measurements included spectrum occupancy surv eys in the fo l lowing bands :
1 6 2 - 1 7 4 MHz 1 6 6 0 - 1 7 1 0 MH z 2 1 6-2 2 5 MHZ 1 7 10-1 8 5 0 Mt!z 2 2 5 -400 MHZ 2 2 0 0 - 2 4 5 0 MH z 4 06 -4 2 0 MHz 2 7 00-3 7 0 0 MHZ 420-450 MHz 4400 -499 0 MHz 9 0 2 - 9 2 8 MHZ 5 6 5 0 - 5 9 2 5 MHZ
1 2 1 5 -1400 MHz 8 500-1 0 50 0 MHz
About hal f of the s e bands had not been meas ured by the RSM S be fore , nece s s i tating a c ons iderable amount of hardware and so ftwa re development . In addition, s ome of the band measur ements r equired better sensi tivity than was current ly available with the RSM S , wh ich was partially solved by us ing bandpas s filters and preampl i f iers at the top of the antenna t owe r . I n other case s , the need for s t i l l more sensi tivity r equ ired the use o f h igh-gain , direct ional antennas plus preampl i fier s .
The largest amount of development , howeve r , h a s been i n the computer so ftware measuremen t a nd analy s i s programs . The RSMS i s a computercontro l l ed mea s urement system ( f ig . 1 -1 0 ) des igned especial ly to effic iently measure the l arge amount of data needed to characteri ze s pectrum occupancy . Whi l e the RSMS is e ss ential ly a radio rece iver which can tune to any frequency between 1 MHz and 1 8 GHz and wh ich can proce s s the rece ived s ignal l evel in a number o f ways , the actual function i s determined mos t ly by the computer programs which a re developed to control the receiving syst em . To better gather data for the SRA stu d ie s , a number of existing RSMS measur ement programs were mod i fied to add the fol l owing s et of capab i l i t ie s :
1 .
2 .
3 .
automatic measurement .and recording of data without the presence o f an operator , a l l owing 2 4 hour a day ope ration :
automatic switching between s ub-bands t o a l l ow a large frequency range to be meas ur ed in s everal s ub-bands : and
ope rator interaction pe rmitted dur ing meas urements to g ive more complete control o f the measurement system for identi fication of s igna l s .
I n addition, a series o f corre sponding analysis programs were produced which a l l owed a r apid inventorying of data f i l e s on mag netic tap e , fol l owed by accumulat ion of stat i stica l d ata from a l l files meeting certain s e l ection criteria . Anothe r g roup o f programs a l l ows the data stat i etics to be d i spl ayed in var ious ways .
Figure 1 - 1 1 shows an examp l e of the output of a meas urement program cal l ed "Quick Search , "
2 1
whi ch i s typical o f the rec ent measurement program developments . This program wa s d es igned to look for occas ional signa l s in a band , ignoring measurements wh ich do not cont a in signa l s . Measurements are made rapidly across a frequency band u s ing s imultaneous peak and average detectors ( so l id and dashed l ine s , respect ive ly ) . The measurements are t e sted against a peak and average threshold ( indicated by the two " t i c " marks on the r ight-hand edge of the g raph ) . If neither threshold is exceeded by the set of meas ur e ment points , the program assumes that n o s ignal is pre s ent and d i s cards the measurement d ata . The program then proceeds to measure the next frequency band on its l i st . If no s ignals are detecte d , the measurements r equire about 3 s econds per band .
I f signa l s are s een , as in Fi�ure 1 -1 1 , the measurement system re sponds w1th s everal opt ions . An automatic d irection- finding rout ine is employed to find the approx imate beari ng from whi ch the s ignal came . This i s done by rapidly switching between four f ixed antennas in di fferent directions and compar ing the ampl itude of the s ignal rece ived on each o f them . In Figure 1 - 1 1 , a bearing of 1 3 6 ° was obtained from average measurements , and a b ear ing of 1 36 . 9 ° was calculated from peak measurements . Bear i ng c an typically be me a s ur ed t o wi thin 1 0 ° . Once the direction-ofarr ival of the s ignal has been determined , al l d ata are recorded on magnetic tape and with paper hardcopy .
Th i s type o f scanning does a fa irly e ffic ient j ob of detect ing the occas ional unknown s ignal . One probl em i s that a large amount of data is potentially ava i labl e , pos s ibly mor e than is practical to consider before additional data r eduction is accompl i shed . Editing p rograms are ava i lable which combine data from a l l data fields mea s ured in identicial frequency bands , g iving maximum, averag e , and minimum s ignal amplitudes on a s ing l e plot .
Figur e s l�l 2 and 1 - 1 3 are examples of some of the statistical occupancy s ummaries which are p roduced by the data ed iting progams . Figure 1 -1 2 shows the statistics of averag e d etector measured ampl itudes . These data were col lected from a total of 981 4 scans acros s the frequency range and show the highest meas ured values ( so l id l i n e ) and the average of t he measured values ( dotted line ) . The average of the meas ured values include s only thos e d ata sets wh ich conta ined s igna l s above analys i s thresholds . Figure 1-1 3 shows the s ame d ata proc e s sed di ffe rentl y . This graph shows the percentage of t ime that s igna l s above the a nalys i s thr eshold were obs erved . In this ca s e , radiosonde s ignal s near 1 6 8 0 MHz wer e obse rved about 1 % o f the time . Similar sets o f statistics are produced from the peak det ector measur ements .
Th i s yea r , the RSMS has per formed work for other government agencies on a re imbur s ed b a s i s . In one cas e , the FAA wanted mea surements made of spectrum occupancy in the 2 7 0 0 -3 1 00 MHz band in the Lo s Angeles area . These measurements were made to provide informatio n o n the inte r fe rence environment wh ich would be encountered by NEXRAD . NEXRAD is a doppler w eather radar being developed j ointly by FAA,

2 2

- 2 (1
R C V D
P O ld E R
I H D B t·1
S O L I D
F' E f=I K
=
D � :S: H E D =
� V E R � G E
- E: '3 . 2
- ::: 1 . :::: D F
S C � H 1
P T . t·1 U G U S: E f=I F.: C H
Il f:I T E :
T i t·1 E :
:E: t..I D T H
8 (1 1 1 1 1
5 0 4 5 6
= 1 �3 �ZU:3
T f=I P E 2 7 0 . 1 0 1 - 8
S: C I'=l t·� # 2 E. ::: t:: :3
t·1 CI D E # 1
- ' - " I - -· -
I I - - - - � - - - - r - - - - ·- - - - -. - - - -
- . - " I -
I ... - - - - r - - - - - - . - - - -
I - - ... - - - - r - - -1 - '- � -
I I
..... 1 I I I
.,. ..� , ... ,_ !,. _ ... ... .... .. .,r:..r ... _ .... �
. l_ .�� .. -... � .... - - "' - . - .. . .. .. . ..
I I � - - - - r - - - - ·- - - - -. - -
- ' - " I - -· -
- ' - " I - .J -
I I - - - - ... - - - - r - - - - ·- - - - -. - - - -
- . - " I - .J -
I I - - - - .1. - r - - - - ·- - - - -. - - - -
- ' - " I - -· -
... - ... ... -. -"' " .. , _. , "" .r:._ ... _ , , .,..� .. , .. I �- '\. .. .... - , ... ,..
- . - " I -
... - - - - r
- ' - " I -
.I .. .. .. .. .. ..
I - - - - ·- - - - - . - - - -
1 7 (H3 1 7 5 0
* * * F R E Q U E N C Y I N M H Z * * *
D I R ( (:1 ) = 1 �: E. D I R ( p ) =
- 7 5 . E. - 7 5 . 1 +
- 9 2 . 4 - 7 2 4 - 7 1 t:"
- ::: :;: . . •J
F.: C F.: D - B t·l D + B tHI D I S: H 1 0 t·1 t·l I J P � R f:l I F.: E T U F.: t·ll �: S: T O R EJ T U t-l E 1 0 �-:; �3 . 1 >::
F igure 1-11 . Example of Quick Search data .
2 3
+

- 4 0
P C '..·' D
P O I.d [ f.::
..... ::::: 1;:'1
S P E C T R U M R E S O U R C E R S S E S S M E N T S T R T I S T I C S
r� C C I.J I···I U L I=I 'l' E D ( n '•/ G ) n �:i T A
N O . O F S C R N S � 9 8 1 4 1:· T , t·I I.J G U , C R L I F •
------�:-T1 __ _ 1 "J
" I r "
·----,
.-·
· ' · . , " : : !11: :
r ...
... - I-· \ . .. - - .. , - - .. - . - - - - �
I : ����� - - r
" . .. .. ; .. - � .. : .1. . .. .. r . ' . " I •
c u t·1 F I L E :
N O V E t•1 B E R
·' -
- · - - - ... - , -
·' .
I;'·' : ,J ,L • ·1 1. , I I
l 1 I I � I I I (r I '•
·
•'
·
' � 1
• • ll ll:'r 'll... ... r ... ... - ... '·· ! .. I .. .. .. - ... .. ... ... - - - - � - - - - r - - - - ·- - - - - ' - - - - -
I I' •, I I I I I I I I '·r r
!l,,,.,, _ .. .
� .. .
. - ..... ·- _ � ·- ) , � ,"' -· ..... :_ .. .. ..... ..... .. . ..... ..... _ ·- ...: _ _ ·- ·- -�· __ _ _ _ � _ ·- _ _ ;, _ _ _ _ . 1"1..1'1r 1 "'rilL rJ....t'11 1 ...._r-.
. "'- 1 � 1 '•t•.v"..l 'J.&.,.r--..t'* �- I �..r-�o.�...l"'""*-t.,,..-• ,r.sr"..l��� ""-t_�'t\,_ ..-.......__ I __....._ I
I I , -....· --·� -�� .. . .. .. , "
·' " . ' · .. , .
·' .
F' E f::l l<
( :S: (J I.... I IJ ) I r - , _ .
.. , ...
- - - - - � - � L -, _
-, -
n '·/ G " ' ·
..
, "
.. .. .. .. .. .. .. " .. 1 ,. . , .
. ·'
_, 1 2 121 "" .... . _ , ............. J ______ _:__ ........ ____ ,_,_._, ____ �.-·-·-""-""- ·-··-----'----·-"'""�--·----'----·�--------""""" 1 6 5 0 1 7 0 0 1 7 5 0
F' F:: E G! U E t··I C \'
r::o r:: r:1 1< :: ..... ·? �:::;
( t·1 1 .. ·1 z )
F igure 1-12 . Statist ical amp litude graph , average detector dat� .
24

1 :.�
. p�
S P E C T R U t1
P E F.: C E H T O F
R E S O U R C E A S S E S S M E N T S T R T I S T i t S T i t·1 E ( R 1·l G ) T H R E S H O L D I S E X C E E D E D
t··I O
P T .
:/r . .
O F S C R H :S: : •::,. ::: 1 4
t'1 t1 G U , C R L I F .
. I . • I •
·'
� r -
-�� .
' · " I • . • I
-1 -
I
• I • . , .
I ,
... - - - - r -
,. I
• I • . , .
C U t1 F I L E : 3
H O V E t1 B E R 1 9 8 0
.J •
I - - - �- - - - -, - -
.J •
• �3 1 :·: i-Jil.!l......__,_ ____ t.___.. _ _._ ____ � __ ...._ _____ _... _____ __, 1 6 5 �j 1 7 0 0
F F.: E G'i U E t·l C ''I' ( M H Z )
R H R L Y S I S T H R E S H O L D S
r::o r:: 1 : 1 1< :
1 7 5 0
F igure 1-1 3 . Stat istical occupancy summary , average detector data .
2 5

the Air Forc e , and NWS , and is expected to bring greatly improved r e l iab i l ity for warning of severe storms . The expe cted interference environment may determine the feasab i l ity o f p utting NEXRAD i n these frequency bands and w i l l certa inly a f fect the amount o f signa l p rocessing incorporated in the NEXRAD design.
To provide a suf f i c i ent l evel of deta i l i n these spectrum occupancy measur ements , i t was dec ided to make several types of measurements f rom two sites in the Los Ange l es area . The two sites were mountaintop l ocations near Sa n P edro and Whitt i e r , both of wh ich we r e se l ected as poss ibl e NEXRAD sites e xperienc ing h igh l evels of potential inter fe r ence from other radars in the frequency band . At each site , m easurements we re mad e for several days on a 24-hour basis, which i nc l uded substantial p e r iods of unattended operation . When operators were present, radars could be ident i f i ed by the i r pulse character ist i cs and by the apparent s ignal d irection of arrival . Measurement d ata were recorded on paper hardcopy for immed iate ana lysis and on magnetic tape fo r l ater statistical analysis.
The measurements consisted o f two ma j or types. Peak ampl itud e data was measured ac ross the frequency band, as shown in Fi�ure 1 --�. Thi s m easur emetit is sim i l a r to measurements o f band occupancy made e a r l i e r by the RSMS . It plot.s p e ak power received in a 5 second per iod vs. frequency. A 5 second dwe l l t ime is spent a t e ach frequency t o a l l ow a typical radar in the band time to rotate onc e . I f the dwe l l p e r io d i s chosen t o b e a t l e ast a s l ong a s a radar antenna rotation period, the radar wi l l po int d i r ectl y at the RSMS at least once dur ing the measurement period . When the dwe l l period ha s b een finished at one frequency , the measurement system tunes to the next higher frequency a nd continues . When the entire frequency band has been measured, the g raph is copied, data is recorded on magnetic tape , and the program continues measurements at the next port.ion o f t.he frequency band.
I n addit.i.on to the peak ampl itud e measurement.s descr ibed above , the number of pulses e xc eedi ng three ampl itude l evels were counted . The three ampl itude l evels a r e graphed as short " ti c " marks at the r ight hand edge of Figure 1-·1 4 . This a l l ows the operator to manu al ly adTust the thr esholds , watching the position o f the tic marks, un·ti.l he has th e d esired setting . Figur e 1-15 shows a graph o f the number of pulses measured simultaneous ly w i th the data in Figure 1-1!: The counts g raphed are the c ounts measured over a 5 second dwe l l pe riod at each fequency r the c ounts must be divided by 5 to get the averag e n umber of pulses per second . The graph is generated, c opied , and r ecorded on magneti c tape immed iately fol l owing the copying of the ampl itude graph . For this ser ies of measurements , the thresholds wer e nomina l l y set at -9 0 dBm , - 7 0 dBm, and -50 dBm . The count data f rom each of those thr e e thr esho l ds we re pl otted using a dotted, sol id, and dashed l ine fo r e ach count l eve l , respectively .
The measurement p rogram described above was r un more or l ess continuous l y , g iving approximate ly 500 sets of amplitude and count data i n about 1 65 hours o f measurements d ivided be-
2 6
tween two sites i n a 2 �week per iod. After the measurements were f i n i shed , the data on magn etic tape we re analyzed to g ive statistical summaries o f the da ta measured at each site . Figu� __ l-·1§_ is a. sta tist ical summary of a l l the amplitude data recorded o n tape a t the S a n P edro site . On thi s plot, the ma x imum ampl itudes and the min imum ampl itudes from the i nd iv idual graphs for each frequency are pl otted with a sol id l ine ; the average ampl itude i s p l otted wi th a dashed l ine . Note that many more radars than norma l show up on the statist i cal ampl itude ana lysis because many radars are operated intermittently, but only a port ion of the inte rmittant radars are l ikely to be operating at a g iven time . A set o f 3 pulse count graphs a r e produced by the statistical ana lysis programs , one for e ach thresh o l d leve l . Figure 1- 1 7 shows the corresponding graph for threshold l evel B ( -7 0 dBm) . Again , t.he max imum and min imum levels are plotted with a sol id l ine and the averag e l evel is pl otted with a dashed l ine.
This work was partic u l arly valuabl e to us i n s everal respect.s . The work provided a techn i que for obta ining substantial ly more deta i l e d da ta o n spectrum occupancy , appl icab l e to other measurements and expected to be uti l i z e d h e avily for other RSMS measur ements . These mor e deta i l ed measun�ments were made with simp l e threshold detectors and counters , assembl ed quickly for this t.est . In spite of th e s imp l i c ity o f the added equ ipment, it is ful ly automatic a\ld integrated compl etely into syst em measuremeni: and cal ib ration routines .
MSR-·Tl MULTI PLE RECEI VER SYSTEM AND SD- 2 R EC M R ECEIV.Efff: The ·1\.NJMSR"::\T isatransportable-;
auton1atTc multiple rece iver system that is t o b e employed by the Air Fo rce a t various e l ectron i c war fare ( EW) ranges for determining th e o pe rational read iness o f f l e e t aircraft and a i rcrews to per form e l e ctronic countermeasur e s ( ECM) dur ing strategic and tactical miss ions . Th e I n s t i t i te Fo r T e l ec ommunication Sciences was tasked by the Air I!,o rce Systems Command ( AFSC ) to deve l op , design and test a prototyp e model of the AN/MSR- ( ) '"h :i.ch would serve as a basic for the production procurement of simi l ar mod e l s . 'I'hi s t::.ask was compl eted in 1980 , and Al;'SC requested that I T S provide fol l ow-on t e chn ical m:ippo rt dur ing the production-procurement cycl e .
I n support o f thi s program , ITS prepared detailed technical spe c i f ications which include d h ardwa r e/softwa r e per forman c e c r i t e r ia and . functional requirements for the Air Force t o u s e a s a Requ e s t fo r Proposa l from industry . Five responses we re rece ived and I T S played a k ey ro l e in the ir techn i c a l evaluation. A contract award, ba g ed on techn ical conside r a tions, wa. s made t o 1'1a r tin-Mar i etta Aerospac e , Denver Division, i n Apri l 1981, for the prod uction of 7 system s .
The AN/�iJSR-· ( ) un it. s c onsist of 0 . 0 3 - 1 8 GHz mul tiple rece ivers , antennas, and s ignal pro c essors wh i ch are inter faced to and contro l l ed by a c entral compu t.er un i t and , whi l e conceptu a l l y simi lar to the prototype mod e l , are l ess compl e x , more versat. i l e , and have i ncreased c apab i l ities . wa s reduced by the usa of real-t ime data a cquisition and analys i s s chemes wh i ch l ess hardwa r e ( re c e i-

T I M E 1 4 1 3 1 2
R D C: I t� . :3 UH
T I t1 E 1 4 3 6 1 ��1
D R T E ::: 1 13 7 13 4
0 .
·, . . I . - . I . - ;
i i -
. .' - . I • . • I • - '.
- - .- - .!. - -. - - !. - -. -
I . ·' - - I " . L - " I - . ._
- ... - - - - .. - -. -'
. . . - -I I
' - - -+ 5 . 0 0 0
,... D I v . . ,
Y o =
- 9 9 9 (1
-. - - !. - -. -
I . - I " . . " I . . '·
- - - - ... - - - - .. - - -' '
- . - - . I I
- + - - .. -
. � . - I .
- 1 0 (1 . 0
+
T R R P i
l=l tH S 2 2 5 5 1 f.Z1 P O R T S 2 1 1
D t�J E L L 5 S: T E P S 2 0 �3
tH I R / I T :S:
F F.: E G! 2 9 1�1 (1 l=l t·1 P L T - 7 6 6
:S: R H P E D F.: O H I L L C R
. ... . . . L . . - ... - - . L . . . .. ' ' ' '
-I - - -
I - - - I -
-I
- - -1
' ' ' . .. . • - - . . - .. - . - - • . . . . ..
- I - - - - I - - - - - I - - - -I - - - _I T r T r
- "I . . · - . . ' . . . "I - ' . . . . ' - r
- 1- - 7 - -I - - ;- - - - 1- - 7 - -I - - ;- - ...
-I . -I i . i
:.. - - - 1 - - .!. -
. ' . . - .' . . , .
.. - - - 1- - ... -
... . . . '
. ..
I r - -
. "I . ' . . -I . . ' · - r . . ' . . ,.
- 1- - -I - - - - 1- - -1 - - ...
.I - .
I . i i
- 1- - -· - - - - 1- - ! - -· - -
.' . ' . .. , .. .. - .' . ' . .. � .. ,. I .. .. 1,.
2 :::: 0 0
* * * F R E O U E H C 'l I t·4 t·1 H Z * * *
-
-
-
B l1J D T H 1 0 0 0
G R I t·� �3
0 t·1 t·� I R t� T
T R P E 2 '31 1 . 13 �1 5
. -,
- .' .
- .-
J -
- -'
.
. . J -
- -'
.. ... -
. I •
i . I •
- .!. -
- I "
- ... -
. . I
I . .
- T -
. I •
- i
. I "
- ... -
. . I
- + -
• I •
- . I .
- i -
. . • I . .
-. - - !. -
. L - " I . .
- .. -
. . . I
- - .. -
I . r . . . .
I r -
. . I . .
- i -
.
- - - .. -'
. . . . I
- .. -
• r • _ I •
2 '3 (1 (1
.Figure 1-14 . Single measurement of peak ampl itude versus frequency .
27

T I f•1 E 1 4 1 3 1 2 � t� T S: 2 2 5 5 1 0 P O R T S: 2 1 1 B W D T H 1 0 0 0
� D C I H . 3 1 �) 1 D l.o.I E L L .,. ._1 S: T E P S: 2 �) (1 G 1=1 I t� J;:J P U L :S: E C O U t·l T S: \l :-::;. F F.: E G! U E t·l C 'l
D R T E 8 1 [1 7 (1 4
1 0 0 0 0
1 (H) t1 r . ., . . ' I . , I '
. ', •
. . .
.
.
.
. . , . .
, I , I ' •
. I , . ,.
.
. ' - . . . I
·' • ' . ' I
. .
. . ' •
1., ' • I .
.
.
.
.
.
.
.
.
.
. . . I I
I . I . . . I I .. I I , I I . . k .
. . ; I ' I I I I I
. " I ' . I I I I I I I I I I
. . . .
' .
.
1 (1 (1 - -
-ft: -
YN -\)\ � I •
�� I '1. I . I I fij I ' I I I I
I . r I
I I I . I I I . I I I . - - . " - , - � . , - - -
I I I . I I I I ' I I I ,
. I I I
I r J I ·It' I I I I I '
I I I I I I ' I I ' I ' I I
I ' I ' I I I I I ' I ,
I I ........
1 0
1 2 7 0 0
+
T H P E :S: H O L D :s:
I
S: R H P E D R O H I L L , C R T R P E 2 9 1 . 0 0 5
.. I I, ' . \ I I I I . . . I I
. , '.' l o I , I I ,
I ' I I I
I o
I . I
. - . r I � I � \ I I ' I , , , , , , I I I I , . I I I � · - - f.. I -I
I I • I 1 I I I • I I I
"·� I I r I •
I I I I I,
I I I �
, , I � : I I • I I , I lo I I , r , , I I ' I I , , I I , t ' · r I , I
r . j. . . .I .1 r I L I I , L I I I I I L I ' • L I l I
� I I ' I
II
I � I I
I � I I I
I � I I I ' I � I
I I 1 I I I J , . I I I I
. . I o l ' I J . I I I . . . I I \ . .
. . ' '• . . I . . ' • . I
I I I ' . . . ' • . I . . . I I . . .
I . . . . . I I . . . . . . . I I
' I . . . h I .
' I . . . . I . . . . I I . .
. . .. . . . . . . . . . . . . I . . I ' . .
I . I I . . ,\ . I J I . . .. I . .. .,
, . . . I ll I • .. '\ • . '
, . • . . .
- - -� - - - - J. - -
.
.
. . . . . - . . - . - . . . . . . .
, . . I I . I . I . I
. I . I
. I . I ' I I rl . . I J l
I ' I I p I . .
• II
I . . . II . . ' I I ' . . I I I ' . . , . I
. .· . . •. . . . . , . -� . . r' • . I
I l -I I I � I I I I I I
II I , ,
, I I �
, I I I I I
I � I J · I I r II - -� -1 •
I I , . I I I I I I • I' I I I • I I I I I • I I I I I •
. , I I I I • ' I 1,1 I I •
. , I I I ' I I •
. , I l l I • I I I I ll I I •
' I I l l I I •
' I t 1'-- , i i L•
I I l l I • ' I I ll I I • ' I , , 1 I l o , ,
I I I I , , , ,
I I , , , , , , t I I ' · ' I t I I l o , , f , , ' · , , r , , \, • r I , I I ' I � � J:: ' I
. I . · ' . . . . ., I . .
- - -
JJ . -
I
• ' . I . , . : I t. . · . . . . . . I .
I I I I I I I -I
I I I
�: , , l lr I l l , , 1
I • 1 : I , I l , , ' I , ,
I
-
.
l
- -
. -
* * * F R E G! U E H C Y I H M H Z * * *
------ - 6 ·;.r •
·;. - 4 '3 .
9
F'igure l-1 5 . S ingle measurement o f number o f pul ses versus frequency .
28

0
F.: c v D p 0 ll.l E F.:
I t·� d B t-1
M R ::-� t·1 I t·�
R v r· .:0
- )
R R D R R P U L S E D E N S I T Y S T A T I S T I C S
t·� O . :S: C t=I �� :S: : :;: 7
B l.o.I D T H : 1 0 ��1 �:3 S R N P E D R O C R L I F .
.. .. .. . .. .. .. 1 .. ..
i - i - - 1-
-· • I • .. .. . .. ·- ... .
- - - .!. - - - !. - - - I - -. - -. -. T
I - -· - - I " - • I - - ·- "I - - · -
- - - - .L - - - - L - - - - 1- - -' '
- I - - I - -I
- - - - .L - - - - L - - - - 1- -';" ' '
. I - - I - .I
- - ··- - + - -' - - ·- - !
D t.J E L L 5
... - -
- � - - - - -I
. . . ... . .
I I - - - - r - - - - -
I - ' - - -. -
- -I - - ;- - - - 1 - -
- i - -I
-I
- -· - - - ·- -
- -. .. ' .. .. r _ I • . - _I - .. , .. .. . , . _.
I
-'
' - .
T -
' - -
- ' -
L . . . . '
- - -I
' • . - . .
I - - - r -
- - ' - -
-I - - ;- -I
-
C U t·1 F I L E : 1 S T E P S 2 (1 (1 D R T E ::: 1 0 7 �3 4
.. . ·,
. I . . . I . .
I. -I - i - i -
.. . -· . . I • . • I .
_. - - . - - .!. - -. - - !. -
I" - -· - I " - L " I -
.... - - - - .L - - - - L -' '
i - - - - - -I I
i . - - I -I
-· - - � - -1 - + - - .. -
. ' . I_
I I
-. . I • • r -
�-
MI•M·------1---··--·M!M .. _M•H-.. - 1 0 0 ·--·-'------'---
2 7 121 0 ( l"•"j f- 1 z ___ ...._ _____ ...._ ___ .... ______ , ____ .....
;2 ::;: 0 0 ( to"! H z R E C E I V E D P O W E R V S F R E Q U E N C Y
+
F igure 1-1 6 . Statistics of peak amp litude ver sus frequency.
2 9

2 0 0 0
1 0 0 0
5 (1
t:' ·-'
1
+
R R D R R P U L S E D E N S I T Y S T R T I S T I C S
t··I O . :S: C R H :S:
:S: R t·l P E D R O
:3 7 C R L I F .
C U t·1 F I L E : 1
D R T E : 8 1 0 7 (1 4
' I
.,
' , , ' '
_ , _ _ {k- - · r I I
t T.- -I -I ' 1 I
{ _: _\, .. -t l p I I ' Jj , , I ' I ' I � I I I I I
1 1 I I - •- 4 L - - -�� - -, , , , f
' "t; - -· -INr . . - - - - - _ , _ - - - - -' '
- , _ " I " _,
..!. - - - - - - - - � - - - -
I - - - - - - - - - -
- - +'· - ... ... -, , , , J . - : �ij·�", '· i - - .
I I �· � .,
I I I ' I
I , , ' I ' ' I 1 ! 1 t1 I t 1 - + -I L .I j i..J I .. I 1 t l 1 1 1 t t 1 I f I 1 t 1 1
1 1 I i I r \ 1 I
'
J.
I I
I " I " .. .. .. .J
I - - - - � - - - - - - - - -, - - - - - - - - - - - - - - - -, I I I
' ' - - - - - - _ ,_ - - - - - - - - � - - - -
- - - _ , _ - - - -' ' I II ' : I
_ _ _ _ ..!. _ _ _ _
II I I
' I I
I 't I
"I I
I - i I
......... ,_ ..... _._, ____ _ ·----. .1..-----· ··· \._ ... J ..... I:. ... .l ___ ......... ---'
( i'I H z )
F U L.. :s: E :�: F: E·C E I 1·..' [ D I 1 ··1
( D ) C O U I I T E I<:
1:,-:· •,) :s: E C
( , ... , , .. , :z: )
1•,•' :S: r:· r::: E O U E I··l C 'r'
F igure 1-17. Stat i stics of number of pulses exceeding -70 dBm .
3 0
t·1 I H
( -- )
( - - - · )

vers / s ignal proce s sors ) . Ve rsatil ity wa s increased via so ftware/ firmware improvements and the u s e o f t ime sharing schemes from " l e s sons learn e d " in depl oyment and u s e of the prototype model . The c apabil ity i s increased with the addition of an autonomou s automatic IFF targ e t tracking sub sys tem ( a l s o added to the prototype ) and automatic pulse blanking with a v ar iab l e range gate tr acking window around the a i rborne target of interes t . The s e capab i l i t i e s we r e added t o improve compatib i l ity o f operat ions when the sys�em i s located at or near the high powe r groundbased thr eat r adars and reduce mul tipath inter ference dur ing a irborne ECM emi s s ion reception and analys i s .
Features o f the prototype des ign which proved ope rational ly e f fective wer e r etained . For example, the automatic antenna s witching and s ignal condition ing matrix which provides for the s imultaneous reception of mul tiple rf s ignals and the automatic system per formance veri ficat ion s ubsys tem were retained with des ig n improvements and incorporated in the production unit s . Operator interaction has been r educ ed to e s s ential ly a mon itor ing function, but intervention is pe rmitted v ia s impl i f ied k eyboard entr ies if unusua l events occur that require special tai lor ing o f the equipment res our c e s and so ftware control functions .
As fol l ow-on s upport dur ing the Air Force procur ement-production cyc l e , ITS has provided technica l guidance dur ing Prel iminary and C r itical De sign Revi ews at the Contractor ' s fac i l ity . Thi s i nvolved two principa l task s : ( a ) review and ( b ) prepare and d ocument d etail ed techn ical descriptions o f al l Air Force operational a i rborne ECM syst.ems and g roundbased threat radar sys tems . The latter information establ ishe s the data base used by the AN/MSR- ( ) to ver i fy operat ional read ine s s o f the ECM systems t o perfo rm the i r intended j amming/dec eption func tions during the conduct o f EW t e s t s and exerc i s e s .
A typical EW test or exerc i s e may on ly l a s t f o r a few minut e s ( 3 -·8) o f t ime wh i l e a strategic or tactical mi s s ion is underway and wil l n ormal ly involve 8 to 1 0 d i fferent g round based threat radar s operating a t various frequenc i e s over a broad rf spectrum . Each r adar s ignal is a potential threat to the aircraft ' s m i s s ion, and its on-board ECM system ( or mul tiple systems ) wi l l respond with a ccuntermeas ur e s ig nal to deceive o r d i s rupt the radars ' acqu i s t ion or tracking c ircuit s . Thu s , the AN/MSR- ( ) mus t r eact to thi s chang ing and dynamic e l ectromagnetic environment and c o l lect , analyze , and output spe c i fi c characteristics/ parameters o f all countermeasurer responses t o a s s e s s ope rational readines s . I d enti fication and diagno s i s o f a i rborn e , i n fl ight ma l functi on ing ECM s ys tems are the pr imary functional requ i rments o f the AN/MSR- ( ) .
Phas e I I I o f the Southern Ca l i fornia Propagation Study was completed th� s year . The pro j e c t ob j ectiv e s a r e to deve l op p lans for the mea s urement o f �iF and UHF propagation loss , particul arly under ducting cond itions a nd to des ign, fabricate , and insta l l automated spec ia l purpos e propagation measurement and data acqu i s i t ion equipment . De s ig n was comp leted a nd four automati c propagation measurement systems were bui l t and three were depl oyed in
31
the San Diego area . Each o f the s ys tems wi l l measure ten s igna l s in the frequency range o f 6 0 t o 9 0 0 MHz for about one and one-hal f years . The systems , being microproces sor cont ro l l ed , proceed through an hour ly cyc l e o f s e l f- calibra tion , sequential data col lection , a nd data analys i s and storag e . Data summaries are pr inted loca l ly , and a l l raw data a long w i th the summaries and overhead info rmation are recorded on magnetic tape . The Federa l Commun ications Commiss ion wi l l col lect the data tapes once per month for further analys is . The ultimate goal of the pro j ect i s to deve lop s tat i s t ic s on the incidence o f ducting propag ation c ond itions at VHF and UHF in the Southern Cal i fornia environment .
Pha s e I o f thi s pro j ect provided the FCC with an overview o f the propagation phenomena involved , r ecommendations as to the type and amount of data needed to accomp l i sh the overa l l pro j ect ob j ective s , and descriptions and co s t e stimates of the equipment needed . In c onsul tation wi th the FCC staff, the I n stitute for Telecommunication Sc ienc e s has provided the FCC wi th ·the fol lowing spe c i fic i terns of in format ion :
( 1 ) a r ev iew of the propagation phenomena involved that is based on avai labl e theoret ical and empirical stud ies and inter ference reports ;
( 2 ) recommendations as to path s , recording s i te s , and transmitting s ites required to obtain ·needed data ;
( 3 ) recommendations as to s igna l source s ;
( 4 ) recommendations as to des irable data sampl ing rate s , amount of on- s i te data reduction, and stati stical parameter s to be recorded for reduced data : and
( 5 ) recommendations as to meterological data needed and source s .
Th i s in form, _tion wa s presented in an informal report to the FCC , entitled " Pl anning for th e Measur ement o f Propagation Phenomena in Land Mob i l e Frequecy Bands in Southern Cali fornia , " d ated June 2 , 1 98 0 .
The ob j ec tive o f Phase I I was t o d�ve lop the de s ign o f both the receiver and the receiver c ontrol/ data c o l lection system ( RCDC S ) to the point where the procurement o f s upplies and equipment c ould begin and then to procure some o f thos e s upp l i e s and equipment .
Figu r e s l -l 8 and 1 - 1 9 are b lock diag rams of the receiver and the RCDC S , respectively . Figure 1 -2 0 is a photograph of the entire propagation measurement system .
The receiver i s c ompos ed o f a ma in frame wi th five modu l e s , a long with peripheral components , the antennas , and l ocal oscil lato r .
The receiver de s ign phi losophy included very r el iab l e operation over a l ong per iod of time and a s su rance of the qual ity of the measured d ata . According ly , s everal departures were made from conventional rec e iver des ign . Mechanical swi tches we re avoided whenever pos s ible : very l arge instantaneous dynamic rang e

S I G N A L C O N D ITIO N I N G
�- S W 1 I L?_? ___ _ j
R E C E I V E R
\ I N T E R F A C E
Optional
Manual C o ntrols
I � C A LIBRATION
1 50MHz
X tal
O s c .
r- -�oadband: 1 Overload To R C D C S . S . Detector 1------ --------------
_ 1 0- 1 OOOMHz Signal
2 1 .4 MHz
F igure 1- 1 8 . Propagation measurement receiver block diagram for the S outhern California Propagation S tudy .
3 2

w w
To Receiver Control
� I I I I I I I I I I
CPU
RS-232
Computer Terminal
Keyboard and
Printer
Receiver Analog
Output I 1
Receiver Overload Detector
Analog-toDigital
Converter
Hi-Speed Math
To Receiver Frequency
Control
� IEEE Bus
Bus Translator
M u ltibus
Clock and
Calendar
Tape Recorder
9 -Track
Tape Controller
RAM
F igure 1-19. B lock d iagram of the receiver control/data collec tion system ( RCDC S ) for the Southern California Propagation Study .
1 Bubble
Memory

F igure 1·- 2 0 o The Au toma t i c Propagat ion Measurement System for the Southern C a l i fornia Propagation S tudy o
3 4

( about 9 5 d B ) avoids the need fo.r swi tched attenuators and provides cons iderable tolerance to large s ignal s . High level mix ing and s ens ing o f very large s igna l s helps to avoid th e p o s s ibil ity of spur ious intermodulat ion products produc ing incorrect measurement results . Fina l l y , hour ly cal ibration wi l l correct any minor changes in the receiver characteri stics .
The propagation mea surement receiver i s mostly contained in five module s , plugged into a mainframe with powe r suppl i e s and interconnection s , as shown in Figure 1 - 2 0 . The s igna l c onditioning module contains two signal distribution switches and up to s ev en bandpas s f ilters and preampl i fiers . One antenna connection c an be switched to as many as five b andpa s s f i lter channels via SW 1, a mercurywetted four-po s i tion relay . Thi s switch offer s a very l ong ope rational l i fetime and i s immune to inte rmodulation products which might b e c aused by high ampl itude s ignals . A s econd switch, SW 2 , uti l i ze s P IN-d iode s to provid e e l ectonic switching . The function of thi s module i s t o s e lect the s igna l s t o b e recove red , whi l e i so l ating the receiver from large out-o f-band s ignal s .
The receiver modul e mixes the s e l ected r f s ignal down t o 2 1 . 4 MHz in a 3 kHz bandwidth . Very high� l evel mix ing is emp l oyed ( +2 2 dBm local o s c i l l ator ) to minimi z e spurious respons e s . The 2 kHz I F bandwidth further r educes responses from clos e- in s igna l s and permit s g ood receiver sensitivity . Final ly, a broadband detector measures any large s igna l in th e bandpas s and prevents data from be ing proce ss ed i f there i s the l ik e l ihood o f spuriou s i ntermodul ation produc t s being mi staken for the intended s ignal . The ampl i fied output o f a l aboratory frequency synthe s i z e r i s used to t une the local o s c i l l ator to exactly the corr ect frequency .
The log ampl i fier modul e converts the 2 1 . 4 MHz I F s ignal to a de va lue ove r a 9 5 dB r ange of i nput s ig na l . Thi s modul e also contains an audio ampl i f i er and l oudspeaker for aural moni to ring of the receiver s ig na l .
During the r ece iver cal ibration cycl e , two c al ibration sources are emp l oyed . A c al ibration module in the ma inframe provide s a 1 50 MHz cal ibration s ig nal used to l inearize the logarithmic ampl i fier respon s e . A broad band noi s e d iode i s used to provide an absolute cal ibration of rece ived s ignal in 1 0 dB s teps between - 1 40 dBm and - 2 0 dBm . Th i s cal ibration s ignal is used to l inear i z e the l ogarithmic ampl i fier respons e . A b roadband noi s e d iode is used to provide an absolut e c a l ibration o f rec e ived s ignal ampl itude . S ince the noi s e d iode cal ibration s ignal i s i ns e rted into the system at the top o f the antenna towe r , the proce s s cal ibrates the entir e receiv ing sys tem , inc lud ing any tran smi s s ion l ine losses betwe en the antenn a s and the rec e iv.er .
The inte r face module acts as an inte r face between the microproces s or and the receiver, a s we l l a s permitting manua l control o f the rece iver . Beca·u s e of the importance o f knowing when the rec eiver is not entirely unde r automatic control , log i c bu ilt into the system permits manua l control only whe n " pe rmi s s ion"
3 5
i s given by the microprocessor . In add ition, the microproc e s sor i s noti fied if any module i s unplugged from the ma in frame or if the tower c a libra tion box i s disconnected from the mainframe .
The two purpo s e s of the RCDS are evident in its name : ( 1 ) to control the r ece iver by prov id ing signals to switch antennas , fi lters , and o s c i l lators and ( 2 ) to digitize the rec e iver output and to manipulate and record the data .
The b lock d iag ram in Figure 1 - 1 9 shows the ma j or hardware components and the i r relat ionships to each other and the receiver . The system communicates interna l ly by way of th e multibu s . The system as configured is tail ored to the des ired measurements but is e xtemely f lexib l e and is easy to modi fy for other requirement s . With the exception of the advanc ed analog-to-digital ( A/D ) converter and the termina l , we have e xperienced exce l l ent rel i abil ity with s imilar systems and configurations . The A/D and terminal , moreover , ar e i mprovements of s imil·ar devices that we have u sed in the past and to add to r e l iability .
Re fe r r ing to the block diag ram of Figure 1 -1 9 , the c entra l proce s sor ( CPU ) i s contained on one board . I t contro l s the mul t ibu s , performs or d irects c a lculations , and control s a l l peripher 1 equipment . The 2 1 transi stor tran s i stor logic l ines u s ed to control the rece iver d irectly from the CPU c onsist o f 7 for cal ibration control and 1 6 for antenna and pres e l ector control .
The computer terminal permit s commmunication with the CP U and provide s any neces s ary hard c opy pr intout i n the field . It i s capable of 1 20 0 baud printing speed .
The hardware math board wi l l per fo rm most o f the calculations . Th is wi l l speed up the ope ration of the system as a who l e and allows more memory to be used for user programs .
The c lock/calendar board is used to provide the t ime and date along with the data being r ecorded .
There are two memory boards in the system . The RAM board has 4 8 k bytes of h igh-speed RAM that together with the 1 6 k byte s on the CPU board provide s 64 k bytes of RAM for the syst em . The bubbl e memory board has 1 2 5 k bytes o f no n-volati l e memory which i s u s ed pr imar i l y f o r program storag e .
The A/D board wi l l accept the anal og in formation from the receive r ' s log-ampl i fier and over l oad detector c ircuit, then dig itize the se for proces s ing and record ing .
The last two boards are bus tran s l ator and tape contro l l er boards . The se provide an i nterface to two peripheral s . The former converts multibus codes into IEEE bus code s . The I EEE bus is needed to properly commun icate with the synthe s i zer , which contro l s the frequency o f the r ec eiver . The l atter supplies formatting and inter face s igna l s to the digital tape recorder . Th is interface board is capable o f d irect memory acce s s and al lows rec ord lengths up to 4 09 6 byte s .

Another ma j or portion of Phase I I I i nvolved the examination of the pos s ible rece iver sites and a s s i stance to the FCC in choosing receiver sites and s ources for measur emen t . The three s i tes chosen for the propagation measurement system are :
S i te 1 . Po int Lorna on Naval Ocean Systems Center property , 3 2 ° 4 0 ' 0 3 " N, l l 7 ° l 4 ' 3 6 " W , 1 5 m/ms l ( above mean sea l evel ) , very c lose ( 1 0 0-2 00 m ) to the Paci fic shore.
S i te 2 . La Me sa on the pr emi ses of the F�C field office in La Mes a , 3 2 . 4 6 ' 0 8 "N, l l 7 ° 0 l ' 43 "W, 1 5 0 m/ms l , about 1 5 km inl and from the shore .
Site 3 . Cowl e s Mountain at the "head- end " of a cabl e TV company , 3 2 ° 48 ' 4 5 " N, l l 7 ° 0 l ' 50 "W, 4 7 5 m/ms l , about 2 0 km inland from the shore .
The cho ice of signal s to be monitored at each locat ion took into account a variety of path characteristics and , of cour s e , the availability o f s ignal source s . Table 1-4, below , g ives only the frequencies o f the sources to be r ece ived at each of the three rece ive r s ites . These sources are o f two types : t e l evis ion s igna l s ( on ly the video carrier is meas ured ) and te st signa l s insta l l ed for thi s exper imen t . The last three s ources l i sted i n the Tab l e are the test sour c e s . Nearly a l l o f the s ou rces are located i n th e Los Angele s area.
Tab l e 1 -4 . Rec e iver S i t e Measur ement Frequenc ies
S it e 1 Site2 S i te 3 ( MHz) ( MHz ) ( MHz )
6 1 . 2 5 741 . 2 5 6 1 . 2 5 1 7 5 . 2 5 1 75 / 2 5 1 7 5 . 2 5 49 7 . 25 5 1 9 . 2 5 51 9 . 2 5 7 3 5 . 2 5 7 3 5 . 25 7 3 5 : 2 5 5 3 1 . 2 5 5 3 1 . 2 5 5 3 1 . 2 5 6 8 7 . 25 6 8 7 . 2 5 * 6 8 7 . 2 5 7 4 1 . 2 5 687 . 2 5* 487 . 2 5 41 8 . 00 41 8 . 00 41 8 . 0.0 8 6 9 . 0 0 86 9 . 00 86 9 . 00 86 9 . 50 86 9 . 50 86 9 . 5 0
*Th i s s ignal wi l l be received us ing both horizontal and vertical polari zation .
The other important path parameters a s sociated with thi s s e l ection of sources and rece ive r s ites are : terrain type , source he ight, and path l ength . Of the paths chosen, some are a lmos t entirely over water o r l and ( several each ) : most are a combination of land and water . The sourc e he ight ranges from 2 0 m/ms l to over 1800 m/ms l . The path l ength range s from as low a s 1 5 km ( one c a se ) , to a typical value o f about 1 5 0 km, to as h igh as 3 3 0 km .
The DM-4 i s a n instrument d eveloped a t I T S to measure impuls ive noi s e and other wid e-dynami c rang e s tati stical events . I t measure s the amplitude probability d i stribution o f noi s e by determining the percentage of t ime that the noi s e exceeds the l evel o f 3 1 threshold ampli-
36
tudes . The original DM-4 i s shown in Figure 1 - 2 1 . Other features of the DM- 4 inc lude internal microproc e s s or control and an I EEE 488 instrument interface , sampl ing rate s b etween 1 k Hz and 2 0 MHz , v ideo bandwidths up t o 1 0 MHz , and a number of d iagnostic aids to a s s i s t the operator in ver i fying the qua l ity of the noi s e measurements .
The DM-4 Operational Devel opment pro j ect cont inued at I TS thi s year . Several change s to the orig inal DM-4 design are currently underway , inc l ud ing the abi l ity to operate with i nput signals at 4 5 5 k Hz and 2 1 . 4 MHz IF frequenc ies ( as wel l as the logarithmically comp r es s ed video s igna l s used in the orig inal ver s i on ) . Cal ibration , measurement , and data analys i s softwar e are now being adapted a desktop calculator . The change wa s made to a l l ow easy previewing of measured data on the g raphics tube of the calculator be fore recording data on magnetic tape cartridge s .
The ob j ective o f the Earth Termina l Antenna Measur ements pro j ec t is the measurement o f the magnitude of s ide-lobes produced by a speci fic 4 0 foot d iameter antenna .
Thi s antenna i s to be install ed at the Tabl e Mountain te st s i te where an a i rc ra ft wi l l be used to provide the nec e s s ary el evation angl e s f o r pattern measurement s above the horizontal plan e .
The s chedul ed antenna insta l lation date i s Septembe r 3 0 , 1 98 1 , and during FY 8 2 w e e xpect to make the r equired measurements .
The Federa l Av iation Admin i s tration ' s flight i n spection aircraft c an be equipped for a variety of mis s ions � among the se i s the a i rborne meas urement o f r adio signal s . The purpo s e of the curren t FAA Aircraft Cal ibration proj ect at ITS i s to dev e l op the cal ibration cons tant for a particular antenna mounted o n th i s p l ane a t the spe c i fic frequency o f 1 0 0 kHz .
The ai rcraft c a l ibration i s a par t o f a larger s tudy be ing conducted by the FAA - an evalua tion of the e f fects o f power l ine carrier ( PLC ) systems on airborne Loran-e r eceivers . The Loran-e navigation system is be ing conside red as a suppl ement to and a pos s ible rep lacement for the VORTAC n av igation system . Loran-e s ignal s are c entered on 1 0 0 kHz with 9 9 % o f the energy confined between 9 0 and 1 1 0 kHz .
The PLC s ystems , wh ich are operated by the e l ectric power uti l ities for teleprotection , t e l econtro l , and other te l ecommun ications , typically operate in the frequency range from 1 0 to 5 3 5 k Hz . The PLC s ignals are not intended to rad iate s ince they propagate along the powe r l ines a s guided waves . I n practice, because real power l ines conta in various departure s from an ideal geometry , s ome of the guided s igna l s can be l aunched as s ome othe r mode o f propagation . The r e i s some controversy as to how, or even i f , thi s happens . At a ny rate , radio- frequency s ignals appear to e x i s t in the a irspace above the power l ine s that carry PLC s ignals .

3 7
.-f N I
.-f (!) H :;j 0'1 ·rl r:r..

Since the FAA a ircra ft i s being � s ed in s everal exper iments des igned to measure the e f fect s o f PLC s igna l s on a variety o f Loran-e r e ceiver s , it is nece s s ary to know the cal ibration constant ( or antenna facto r ) of the a i rc raft antenna . Thi s i s s o that the rece ived s ignal l evel ( in volt s ) at the aircraft antenna terminal s can be related to the field strength ( in volts/mete r ) external to the airc raft . Knowing the actual field strength o f the Loran and/or PLC s ignals makes it pos s ib l e to compare the pl anned measurements with thos e mad e by others .
The measurement a ircra ft wi th i t s receiving antenna mu st be cal ibrated a s a uni t , becaus e at Loran-e frequencies ( 90 -1 1 0 kHz ) even the aircraft i s quite sma l l relative to a wavel ength ( about 3 km) . I n order to per form the calibration, the pl ane must be immersed in a known field; the refore, the field must originate from a cal ibrated sourc e .
Since thi s a ircra ft cal ibration mus t be done at 1 0 0 kHz , it is not pos s ible to use a tes t s ource because it c ould interfere wi th Loran-e navigation equipment in us e . A Loran-e trans mi tter i s the most l ikely and practical sourc e . The e f fect ive radiated power ( E RP ) or the field strength at some distance mu st be accurate ly determined, and the pul sed natur e o f the signal format mus t be asses s ed . Another requirement of the cal ibrat ion meas ur ements is that they mus t be made over a smooth , homogeneous s ur face so that rel iabl e predictions o f field strength can be made . n1e use o f an actua l Loran-e transmitter locat ed very near the sea woul d sat i s fy this r equiremen t .
The u.s . Coast Guard , wh ich i s r e sponsib l e for the operation of the Loran-e navigation system in the Un ited State s , operate s the Loran Receiver Test Complex ( LRTC ) in Wi l dwood , NJ . The most important part o f the LRTC i s a cal ibrated Loran-e tran smitting station which can be put on the air whenever it is needed . I t i s the fi fth s econdary in the Northeast u.s . chain wh en it i s o n . Thi s means that i t transmits a g roup o f e i ght p u l s e s i n the standard Loran-e format, wi th a g roup r epetition interva l ( GRI ) of 9 9 , 600 M S ·
The radiated powe r o f the �RTC t ransmi tter can be calculated from the antenna base curren t and the rad iation r e s i s-tance , both o f which can be mea sured . The Coas t Guard u s e s a loop to sense the current in the antenna ' s g round return ; thi s is the antenna bas e curr ent . The method used to determine the rad iation r e s i stance i nvolves a s tandard procedure o f measuri ng fi eld strength .
The s imul taneous record of a i rc ra ft po s i tion uses triangulat ion techniques based on three existing or tempo rary r ad io beacons . Thi s pos it ioning system could be inter faced t o the s ignal l evel recording sys tem so that a l l data would be stored on the s ame medi um . Thi s i s not neces sary , however, and for s impl ic ity wil l not be done . Instead, the pos itioning s ys tem wi l l r ecord on its own medium both the aircraft pos ition and the t ime . So, i f the c l ocks on both the signal l evel r ecording system and the pos itioning system are synchron ized , the need ed information i s obtained .
3 8
The FAA wi l l provide the aircraft pos it ion informat ion as a function of time on magneti c t ape . The instrumentation described in the remainder o f thi s s ection wi l l provide the rec eived s ignal l evel a s a function o f t ime on magnet i c tap e .
Dur ing thi s year, the test plan ( an info rmal report to the FAA ) and data record ing instru mentation have been deve l oped . P l anned for next year are the cal ibration fl ights and a determination o f the cal ibration constant, which wi l l be presented in a final report to the FAA . I n the paragraph s that fol l ow, the instrumentation and the cal ibration f l ight path s are b riefly described .
The cal ibration instrumentation needed t o r ecord the received s ignal l evel and the time is bas ed on a microproces sor . Othe r compon ents include a spectrum analyzer , a d ig ital magnetic tape deck , a clock , a compute r term inal , a pr e-amp , and an rf bandpa s s filter .
Within a day or two o f the s ource cal ibratio n b y the u . s . Coast Guard, the a i rc ra ft cal ibrat ion fl ights mu st be made . The s e fl ights can b e made at one altitud e , 2 km/MSL . The fl ight paths over which received s ignal l evel data are to be collected a r e :
outbound o n a 9 0 ° T radial beginning d i rectly over the source t o beyond 1 00 km ,
inbound on a 1 3 5 ° T rad ial beginning beyond 1 00 km to d ir ectly over the sourc e ,
one pas s o n a 2 0 km radius a r c that crosses each rad ia l ,
one pas s o n a 1 00 km radius arc that cross e s each radia l , and
two pa s s e s on a 9 km orbit , one in each direction.

CHAPTER 2 . SYSTEMS ENGINEERING AND EVALUAT ION
The obj ective of th is program sube lement is to provide system oriented stud ies that are u ser-oriented where the user is a F ederal m i s s ion agency . The studies are generally oriented toward defining sys tem requirements , system des ign and evaluation , cost trad e -o f f , development of performance cr iteria or s tand ards , and user-acceptanc e criter ia . The eng ineering work needed to carry out these s tudies take s the form o f analy se s , measurements , and per formanc e evaluations with the results pub l i shed in NTIA reports or , when appl icabl e , in technical j ournal s . F ederal agenc ies use the results in plann ing , designing , spec ifying , procuring , l ea s ing , and operating te lecommunicat ion systems .
Section 2 . 1 addr e s ses tho se pro j ec t s which are categor i zed a s communication sys tems and s ervices eng ineer ing , Section 2 . 2 presents tho se pro j ec t s or iented toward terre str i a l radio sys tem per formance and mon itoring , and Section 2 . 3 de a l s with standard s activi ties .
SECT ION 2 . 1 COMMUN ICATION SYSTEMS AND SERV ICES ENGINEERING
T he f o l lowing systems te chnology pro j ec ts relate to establ i shed or planned c ommun icat ion service s . The serv ices are e i ther procured or leased by mi s s ion agencie s , and the engineer ing de scr ibed here relates to the evaluation , per formance criter ia , mea surement methods , or new technology requi red for e f f icient , cost-ef fect ive procuring , leasing , or e s tabl i shing o f these servi c e s . The pro j ects descr ibed here are : Data Communi cation s , Montana Telecommun icat ion s Arch i tec ture , NOAA-Weather Servic e Telecommunication S tudy , and E s t imated Cost o f a S ubmar ine F iber C able System .
Data Commun ication s . New app l ications for data communication service s and the trend towards competition and deregulation in the telecommunications indus try have created an urgent need for uniform methods of spec i fying and mea suring the performance of data commun i cation servi ces a s seen b y the end user . Over the past 5 year s , s tandards groups in the Federal government and indus try have been working together to meet that need through t he development of user-oriented , sys temindependent per formance parame ters and measurement method s . Re s u l t s are be ing promulgated within the Federal governmen t in the form of F ederal Tel ecommun ication/Federal I n forma t ion Proce s s ing S tandard s , and in indus try in the form of Amer ican National S tandard s . The Institute for Te l ecommunic ation S c ience s has p layed a leading role in the deve l opment and promulgation of the se standard s .
Two related data communication per forman ce s tandard s have been deve loped . The first spec i f i e s a set of u ser-oriented performance parameter s . That standard wa s initia l l y approved , in 1 9 7 9 , as Interim F edera l S tandard 103 3 . It ha s s ince been applied suc c e s sfu l l y in a number of trial Federal procur emen ts , and a s imilar indu stry standard ha s been developed by a task group of the American
National S tandards Ins titute . The latter standard is currently undergoing review and formal balloting within the American National S tandards I n s t i tute (ANS I ) . I t will u l timately replace I nterim F ederal Standard 1 0 3 3 as a j o int F ederal Telecommunications/Federal I nformation P rocess ing Standard .
Federal S tandard 103 3 and its AN SI counterpart are unique in providing a set of per formance descr iptors that c an be appl ied to any digital communication s ervice , irre spect ive of sys tem design features such a s topo logy and control protocol . This property of sys tem independence makes the parameter s useful as a " common l anguage " for relating the performance needs of data communications users with the capabilities of o f fered systems and servic e s . Serious de ficiencies in commun ications management and increas ing emphas i s on competi tive procurement demonstrate that s uch a capabi l i ty is urgently needed in the F ederal government . S imilar needs exist in many non-Federal user organization s .
The second s tandard , propo sed Federal Standard 104 3 , defines uni form mea s urement methods which enab l e users to obtain representative numerical values for the FS 1 0 3 3 parameter s . I t was developed by the NTIA/ITS in 1 9 80 , and is c urrently be ing reviewed in government and indus try as a first step towards approval as an Interim Federal Standard . It is anticipated that FS 104 3 will fol low an implementation path s imilar to that being followed by FS 103 3 ; i . e . , ( 1 ) trial appl ication a s an interim (optional ) federal s tandard , ( 2 ) adaptation and approval by ANS I , and ( 3 ) F ederal adoption o f the ANS I ver sion as a j o in t FTS /FIPS .
F ederal S tandard 104 3 and its ANS I counterpart will promote innovation and fair competition in the data commu nications indu s try by providing users w i th a prac tical method of mea suring delivered performance . Improved abi l i ty to meas ure performance will enab le u sers to make more inte l l igent choices among se rvic e and equipment a l ternatives , and to define more economical , re ali stic communicat ion requ ire men ts . T he succe s s of procompe tit ive/deregulatory F ederal pol icy initi at ive s like the Second Computer Inquiry dec is ion and Commun i cations A c t Rewr ite wil l depend critically on such u s er ab i l i ties .
3 9
The I n s titute ' s F Y 8 1 Data Communications pro j ect has focu sed on three major obj ectives :
l . Comple ting a set of experimental measurements d emonstra ting appl ication of FS 1 0 4 3 to the Advanced Re search Proj ects Ag ency ( ARPA ) network .
2 . Coord inat ing ada ptat ion and approv a l of FS 1 0 3 3 wit hin ANSI , and F S 1 0 4 3 within the F ede ra l Telecommun icati ons Standards Comm i ttee ( FTSC ) .
3 . Contribu t i ng to the work o f int ernational s t a ndard s org a n i z a t ions d eve lopin g useroriented per formance descr iptors .

F i gure 2 - 1 i l lu strates the fun ctional des ign of the data extraction system which is being u sed in the ARPA network measurements . I n this f igure , the various partic ipating entities are identified by vertical boundar ies and time proceeds down . The source and de stination user s are ITS-developed appl ication programs executing under real- time operat ing sys tems in two remote ARPA network ho st computers : one at NTIA/ITS in Boulder , CO , and one at the National Bureau of Standard ' s I n stitute for Computer Sc iences and Technology in Gaithers burg , MD . The end- to-end commun ication system i s repre sented as two " hal f - system" entities , one a s sociated with each end user . Source and des tinat ion test operators are also shown . Normal program and control tran s fers are indicated by heavy line s , while exception proce s s ing , operator mon itoring , and status me ssages are indicated by thin line s .
To generate a "batch " o f me asurement data , the source and des tination user programs par ticipate in a normal ARPA network f i le tran s fer , but also record the performance signifi cance and t ime of oc currence of each user/sys tem i nter face event . These interface events con s i st of sys tem cal l s ( Open , Close , Read , and Wr ite) between the appl ication programs and their associated operating systems . Measurement data are col l ected independently at each interface , and are then consolidated at one computer site for o f f - l ine analysis by a per formance assessment program . S ate l l i te c l ock rece ivers slaved to an NBS -generated time reference ensure milli second accuracy in the determination of event t imes .
Recorded performance data sets are reduced to FS 1 0 3 3 per formance parameter va lues by an ITS-developed FORTRAN computer program . The per formance assessment program and its input/ output files are independent of measurement app li cation , which allows them to be completely s tandardi zed . To enhance its tran sportab i l i ty , the program i s written in the 1 9 6 6 ANSI standard FORTRAN .
The p er formance asse s smen t software con s i s t s of a main driver program (ASSE S S ) and a set of s ubroutine s that per form the var ious data proc e s s ing procedures required to produce calcul ated parameter value s . These program subroutines , along with the input/output f iles they re ference , are shown in F igure 2 - 2 . I n thi s diagram , each subroutine a t a given level is connected by a heavy l ine to a program element at the next higher leve l . The in tended relation is that the higher level program element cal l s the subroutine . The le ft-tor ight arrangement of subroutine s at a given level indicates the order in which they are called by a particular program element . A thin l ine from an I/O f i le to a subroutine implies that the subroutine reads data from the f i le ; a thin l ine in the oppos i te d irection impl ies that the subroutine writes to the f ile .
former three programs in calculating values for the ancillary per formance parameters . Subroutine DATCOR matches transmi tted and rece ived bits and identi f i e s undelivered and extra bits to a s s i s t TRANSF in evaluating the user in formation transfer parameters . Subroutine SSTATE determine s (a posterior i ) the secondary ( ava ilab i l i ty ) s tate of the monitored service during a particular measurement period by comparing the measured value s for certain " supported " user information transfer parameters with spec i f i ed outage thresholds . Subroutine PROLOG and the subroutines under it prepare extracted performance data batche s for proces sing . Subroutine E P I LOG and the subroutines under it print and s tore the program outputs .
Resul t s o f the ARPA network mea sur ements will be publ i shed in an NTIA report which wi l l be ava i l able early in FY 8 2 . It is expected that this demonstration measurements program will a s s i s t initial users of FS 1 0 4 3 in character i z ing the performance of other s imi l ar data communication networks .
There were s everal s ignif i cant events during FY 81 with re spect to the formal review and approval of these standards . I n January of 1 9 8 1 , ANS I ' s Data Communications Subcommi ttee , X 3S 3 , voted to d i s tribute the AN SI ver s ion of F S 1 0 3 3 ( X 3 S 3 5/1 2 5 ) to its ful l member ship for formal balloting as an American National S tandard . Task Group X 3 S 3 5 is c urrently incorporating revi sions s ugge s ted by the X 3 S 3 reviewers . I t i s expected that a revi sed draft i ncorporating sugge s ted revi sions wi l l b e re turned to X 3 S 3 f o r further processing early in FY 8 2 . I n March o f 1 9 8 1 the National Bureau of S tandards announced its intention to adopt the approved ANS I X 3 S 3 5/ 1 2 5 standard as a F ederal I nformation Proce s s ing S tandard (FIPS ) . The Bureau ' s announcement solicited
comments on the s tandard f rom Federal agencies and indus try organi zation s , and i t is expected that comments rece ived will be incorporated in the s tandard along with tho se of the X 3 S 3 reviewers . Earlier in March , the Federal Telecommun ications Standard s C ommittee voted to d i s tr ibute proposed FS 1 0 4 3 to indus try and government reviewers as a first step toward s i t s adoption as an Interim Federal Standard . A revised ver s ion of that standard wi l l be s ubmitted for formal FTSC bal loting early in FY 8 2 . As noted earlier , ANS I Ta s k Group X 3 S 3 5 i s currently workin g t o adapt F S 1 0 4 3 f o r eventual propo sal a s an Amer ican National S tandard .
The Insti tute contributed inputs to two international s tandard organi z ation s dur ing FY 8 1 : the I nternational S tandards Organization ( I SO ) and the International Te lephone and Telegraph Consultative Commi ttee ( CC ITT ) . Both organ i zations are developing per formance measures for descr ibing quality of service in the Open Sys tems Interconnection ( OS I ) reference mode l , and CCITT S tudy Groups V I I ( Publ i c Networks ) and XVI I (Data Transmi s s ion) are
A detailed description of each ASSESS sub- ad�r e s s ing a number of techn ical que stions r outine is provided in the measurement standard . wh1ch deal speci fically with performance Briefly , subroutines ACCESS , TRANSF , D I SENG , specifi cation and me asurement . and SECOND calculate values for the acce s s , user in formation tran s fer , d i sengagemen t , and secondary FS 1 0 3 3 performance parameter s , respectively . Subroutine ANCI LL supports the
4 0
Federal S tandard 1 0 3 3 i s part icularly appro priate for use in the O S I context because o f its pro perty of sys tem independence . S ince

-" OPEAATOR
F igure 2-1 .
"''""" HALF-SYSTE�
DESTINATION "'"
Data extraction subsys tem functional de s ign .
4 1

Fi gure 2- 2 . Pe rformance asses sment c omputer p rogram and I /O f i le s .
the s tandard can be appl ied at any pair of dig ital interfaces , it can be used to des cr ibe the services provided by any layer in the OSI hierarchy to the next higher layer , v iewed as a user of those service s . This broad applicability makes the standard useful in al locating end-to-end performance obj ectives ·to purchasable subsystems , and conver sely , in determining the impac t of subsys tem per formance on the end-to-end quality observed by the end u ser . F igure 2 -3 i l lustrates one po s s ible subsystem application . In this app l ication , the subsys tem inter face is placed between the S e s s ion and Transport layer s of a typical Open Systems Interconnection protocol hierarchy ; the App l ication Proce s s and the Appl icat ion , Presentation , and Ses sion layers are regarded as an " aggregated u ser " of the Transport Subsystem .
The I n s titute made two primary international s tandards contributions during FY 8 1 . T he f ir s t was submi tted to ISO TC 9 7/SC 1 6/l'lorking Group 6 , which is respons ible for defining the Transport and S e s s ion layer s o f the O S I reference mode l . That contribution recommended that a sub set of the FS 1 0 3 3 parameters be used i n specifying the quality o f service reque sted of the Transport layer d ur ing a particular data commun icat ion s e s s ion . The NTIA/ITS approach wa s accepted by WG 6 and wi l l be incorporated in a subsequent revision of the Transport S ervice
4 2
Spec i f icatio n . I n a companion contr ibution , NTIA/ITS def ined a set o f service per formance clas se s , based on ranges of value s for the FS 1 0 3 3 parameter s , which can be used to quant i fy available service per formance option s . S ub sequent contr ibutions will relate qual i ty of service with the various Tran s port protocol option s .
The second NTIA/ ITS contr ibution was submi tted to CCITT S tudy Group XV I I , which deve lops recommendat ions to fac i l i tate tran smi s s ion of digital data over vo ice telephone networks . That contribution pro vided a s imple procedure for relating statistical prec i s ion with the number of bits tran smi tted during a bit or block error rate test .
I t i s expected that the FY 8 2 Data Communications program will focus s trongly o n promot ing effec tive competition i n the provi sion of pub l i c data communication services . The I n s t i tute plan s to procure or develop a microproces sor-based test set capable o f extrac ting and recording the measurement data needed to calculate FS 1 0 3 3 parameter values at a carr ier/cus tomer interface . This device will then be u sed in me asuring the ac tual performance of a number of competing common carrier services . Extracted data w i l l be reduced by the NTIA/ ITS FORTRAN per formance a s se s sment program , and the results will be pub l i shed in an NTIA

Transport Subsystem User
r ransport Subsystem
"Computer/ Communications"
I nterface
(TrasmiSSIOn -- and
Sw1tchmg Elements)
Application Process and Application, Presentation, and Session Layers as an "Aggregate User" of the Transport Subsystem.
F igure 2 - 3 . Aggregate user concept .
repor t and one or more trade j ournal publications . This publi shed data will a s s i s t users in comparing alternative service o f fe r ing s o n a performance bas i s .
The I n s t i tute a l so expects to p lay a more substantial role in the development of international s tandards during FY 8 2 . P lanned activitie s include c hairmanship and support o f the U . S . partic ipation in CCITT S tudy Groups V I I , XVI I , and XVI I I as we l l as additional contr ibutions to ISO . The se activi ties will enhance international market opportuni ties for the u . s . telecommunications industry through the development of appropriate technical s tandard s , and will ensure that u.s. technical recommendations for internationa l s tandards fairly represent the interes t s of competing U . S . industry o rganization s .
Montana Te lecommunications Architecture . The p rimary goal of thi s pro j ect was to deve lop an integrated telecommunications concept and operational methodology for a s s e s s ing the telecommunications needs of rural s tate and local government . A central part o f this concept was to provide a mechani sm for nontechnical admin i s trators to deve lop inte l l igent short and long range integrated , te lecommunication po l ic i e s . In add itio n , the pro c e s s encouraged shared technological resources with Federal agenc i e s without impo s ing operat ional constraints and contro l s on the rural telecommunication providers and users . The integrated model incorporate s methodo l ogie s designed to deve lop procedures by which
o the needs o f a l l public telecommunications u se r s and provider s in a selected pol itical j urisdic tion ( i . e . , s ta te , county , c i ty , special d i stric t , • . ) may be routinely monitore d , and
43
0 developments in telecommunications technology with pos s ible appl ication to the needs of that j urisdic tion ( de f ined system ) may be regularly a s se s sed and evaluated .
The use of an integrated telecommunications model for the a s se s sment of rural telecommunication needs and pol icy was intended to provide inte l l igent alternatives for rural economic deve lopment .
Initial attempts to advance the concept o f integrated .elecommunications p lanning met with some confus ion due , in part , to the de fini tion of " te lecommunications . " Each user group had a d i f ferent perception o f telecommunications based on the ir needs and identification with a particular aspect of the technology ( i . e . , te lephony , data , land/mobi le , video , . . ) . Related pro fess ional associ-ations and trade j ournal s tended to reinforce tho se narrow defin i tions . To clar i fy the concept of telecommunication s , from an integrated planning per spec tive , a telecommunication taxonomy was deve loped as illustrated in Figure 2 - 4 . Thi s integrative approach provided a more sy stematic method of analy z ing the merits of integrating the various technologie s at the operational and technical leve l . The ITS pro j ect team focused pr imarily on data and land/mobile radio methodologie s .
ITS prepared " draft" data col lection methodologie s for the Montana telcommunications staf f . The se methodo logies were des igned to assess user 9perational needs and existing phy s ical hardware inventory . This approach a s sumed that val id data was a prerequisite to intelligent dec i s ion-making . The methodologies were tes ted by a s tate s ubcontractor in selected areas and mod i f ie d to be s t serve local needs .

""' ""'
T E L ECOMM U N ICAT IONS
I r - - - - - - - - - - - - , - - - - - - - - - - - - l
I I I J J I I LAN D / MOB I LE DATA TELE PHONY NONCOM M E R C I AL I RAD I O COM M U N IC ATIONS BROADCAST
I ( AU DIO/ VIDEO) I L _ - - - - - - - - - - - . - - - - - - - - - - - - J
I I
I NTEGRATED TECHNOLOGY
MODEL
F igure 2 - 4 . Telecommunications taxonomy .

The unde rlying proces s o f the telecommun ications needs asses sment included data which would test the adequacy o f the agency ' s exi sting overall telecommun ications policy ( i . e . , degree o f centra l i z ation/decentralization , lease/buy , common procurement , oper-ational/technical s tandard s , . . ) . Thi s in turn would s ur face i s s ue s and que s tions concerning the telecommunications goa ls and o b j e c tive s of the agency . A f low chart of the land/mobile needs a s s e s smen t proce s s is shown in Figure 2 - 5 .
Some s hort- term outcome s and comp le ted tasks as sociated with the pro j ec t are summari zed be low :
o S ubstantially higher telecommunications visab i l i ty in the Governor ' s Of fice , State Leg i s la ture , and Pub l i c Service Commi s s ion ( P S C ) .
0
1 . The Executive Branch i s currently developing s hort and long- range telecommunication po l i c ie s .
2 . The Leg i s lative Branch has j us t authori zed approximate ly $ 3 0 0 , 0 0 0 for detai led s tatewide telecommunications p lanning .
3 . The PSC has reque s ted increased input from the s tate user agencies and completed initial telecommunications training for selected staff per sonne l .
I n i tial S tate telecommunications pl anning funded by NTIA has deve loped an important overview o f Montana S tate telecommunications needs , using an integrated approach .
0 Telecommunications data col lec tion methodologies have been tested and mod i f ied .
o Potential Federal and State te lecommunications sharing pro j ects were i dentifie d .
NOAA-Weather Service Telecommunication Study . The obj ective o f the fea s ibi l i ty study was to a s s e s s the technical and economic feasibil ity of us ing commun ication sate l l ites to mee t part of NOAA telecommunications requi rement.s .
NOAA provided I TS with in formation on their current telecon®unications c ircuits and systems . ITS reviewed this in formation and iden t i f ie d the requirements which be st fit with the use o f communication sate l l i te s . Many o f NOAA ' s telecommunications user requirements are low to medium bit rate s . The relative s i gni f icant number of low- s peed users are widely di spersed geographically . The following l i s t i s a sample o f dedicated terre strial type s o f ci rcuits in the u . s . that se rve NOAA .
o Circuits that move wea the r information produc ts be tween the National Me teoro logical Center (NMC ) in Sui tland , MD . and 50 Weather Service Forecast Offices (WSFO ) in the u . s .
o C i rcuits that move weather data from we ather sensor location s , Weather Service Offices ( WS O ) , and WSFO ' s to the NMC .
4 5
o Weather facsimile circuits , such as NAFAX , and DIFAX .
o Circuits that move satell ite weather imagery photos from Wallops I s land/ Suitland , MD . to Sate l l ite Field Service Stations and then to WSFO ' s .
o Circuits ( voice and data ) that move command and contro l , raw spacecraft data , and other information be tween Suitland , MD . and the Command and Data Acquis ition stations at Wallops , VA . , and Gi lmore Creek , AK .
o Circuits that move weather forecast products and warnings to the media , general publ ic , special users , and others .
The ITS l i s ted pos s ible candidate alternative sate l l ite concepts and se lec ted three for detailed ana lys i s and pre sentation in the study report . The selec tion of mo st l ikely system alternatives were based on a coste f fectivene s s comparison be tween the selected alternative and the pre sent telecommunications cost-effec tivene s s .
We considered present and future commercial common-carrier te lecommunications s ate l l ite o f ferings and inc luded in the study anticipated future NOAA tele communication requirements .
The cost-ef fec tivene s s and technical feasib i l i ty o f small ground stations that can be placed o n NOAA premi ses was examined . Other communications concepts were also cons idered , such as a NOAA-owned sate l l i te system and a cost analy s i s for this alternative was prepared . A f inal report is in the publication proce s s .
E s t imated Cost of a Submarine F iber Cable System . Transatlantic communications capacity demands are L urrently growing at a rate of 2 0 % t o 2 5 % per y ear . This rate o f growth requires the doubl ing of transmi s s ion capac ity each 3 1/2 years . Because of the high quality of s ubmarine cable circuits and ease and convenience of International Direct Dial ing , the continued rapid growth in demand will likely continue . The introduc tion of sate ll ite service between the United State s and Europe has had a de laying e f fect on cable demand , but the growth trend for cable continue s . Table 2 - 1 shows the growth in capac ity of transatlantic cable systems in 20 years as we l l a s pro j ected requirements for 1 9 8 5 and 1 9 9 0 , based on a 2 2 % annual growth rate . The trend as observed in Table 2 - l i s clear : ever increas ing cable s i ze is required to accommodate ever increas ing tra f f ic demands . This is a basic characteristic of metallic coaxial transmi s s ion line s . Opt ical fiber waveguide s o f fer a striking contrast in th is regard . The s i z e of the optical fiber has l i ttle inf luence on its capac i ty .
A study was carried out based on engineering j udgment to pro j ect the per voice-channe l/k ilometer savings o f a fiber sy stem over the cost o f the Transatlantic ( TAT ) Cable Sy stem 6 ( TAT-6 ) for which cost f i gure s were read ily
available . The se fi gures ( 1 9 8 0 World ' s

� 0"\
i FORM 1 N 1 FORM 2N i : FORM 3N 1 L __ @R!:!_4_!1 _ _j
I I
LAND/MOBILE NEEDS ASSESSMENT METHODOLOGY· PHASE IT
TELEPHONE AND COMPLAINT
SYSTEM DATA FORMS 6N/7N
P4.0 PS.O
- - - - , {TOTAL L/M I � 1 SYSTEMS L STOP 1 NEEDS I L ANALY�j - - 1 r----7 /pRf.liMiNAiiq 1
t DATA FROM 1 _1 ANALYSIS OF t- - - J I OTHER / - - / OTHER LAND/ I iL/M SYSTEMS I l}IOBILE SYSTE!fu L - - - - ....1 - - - -
F igure 2 - 5 . Flow chart o f the land/mobile needs assessment proc es s .

Submarine Te lephone Cable Systems , NTIA Contractor Report 8 0 -6 by R . J . O ' Rorke , Jr . ) were : total cost = $ 1 9 7M , d i s tr ibuted in the fol lowing way - cable 5 2 . 3 % , instal lation 5 . 1 % , and submerged electroni c s 3 9 . 6 % . A f iber cable was a s sumed to contain 6 f ibers , each of which would carry the traffic now carried by the TAT-6 system . A summary o f the status and pro j ec ted rel iabi l i ty o f fiber components required for a sys tem operating at 1 3 0 0 nanomete r wave length was presented . A repeater spacing o f 3 0 km was as sumed ( compared with the 9 . 5 km spacing of the TAT - 6 ) . Comparisons o f a pro j ected coaxial vs fiber optic cable for a 6 3 0 0 km span ( corresponding to TAT- 6 ) may be obtained from Table 2 - 2 .
To e s timate the total f iber cable cost , the fol lowing equation was proposed :
c ( f iber ) = a • Cc+ B • Ce+ y • Ct+ o · C ;
where a , B , y , and o are terms who se values were e stimated on the basis o f the tradeo f f s deve loped i n the report . The value s o f C , C , and c . were based on pub l i shed costs 8f tEe TAT-6 1
system as shown in Table 2 - 3 . Ct i s the terminal station and the terminal and power feed , Ct = $ 6 M .
The e s t imate s o f a , B , y , and o are deve loped i n the report . The s e are :
There fore ,
1 . 5 < a < 2 . 0
1 . 5 < B < 2 . 0
y 1
0 . 4 < 0 < 0 . 7 .
$ 2 82M < C ( f iber ) < $ 3 7 5M
and the corresponding norma l i zed cost i s :
$ 3 . 5 5 /Ch • km � C ( f iber ) � $ 4 . 7 0/Ch · km
where a channel i s unders tood to mean 6 4 kb/s vo i ce channel or equivalent . The corre sponding cost of the TAT-6 system was
C ( TAT- 6 ) = $ 7 . 4 5/Ch • km .
Thus , based on the e s t imate s used i n thi s study , cost savings range from 3 7 % to 5 2 % . The resultant f iber cable would contain 6 fibers providing 1 pair for two-way tran s miss ion , thus increasing the capac i ty o f TAT-6 by threefo ld . The s avings are accrued because o f the three fold i ncrease o f capac i ty with only a s l i ght i ncrease in the cost of cable , elec tron ic s , laying , and powering o f the system .
SECTION 2 . 2 TERRESTRIAL RAD IO SYSTEM PERFOru1ANCE AND MON ITORING STUDIES
This activity is directed toward the des ign , evaluation , acceptance , operatio n , and upgrading of e x i s ting or proposed rad io systems operated by the Federal Government . The p ro j ects generally result in recommendations for system des ign changes and/or sys tem upgrading or for new moni toring and control methods . The pro j ec t s de scribed are : MARAD As s i stance , Advanced DEB IV EFAS , U . S . Army Tactical Communications Systems - Digital Me s sage Device Group Tests , Mea s urement o f Performance o f Mobi l e Radio i n the Presence o f
4 7
Ign i tion noi se , Automated Performance Pred ict.ions for i lixed t1ode Links , Techn ical Support to the dEECN Sy s tem , Mul tip ath I nduced Spectrum Di stortion , PMTC Wideband System Performance , and I nterope rab i l i ty Parameter Hie rarchy .
HARAD Assis tance . The Institute cont 1nued to provide a range of techn ical service s to the u . s . 1:1aritime Adminis tration ( HARAD ) . For F i scal Year 1 9 8 1 the mo st s ignif icant e f forts were in the fol lowing areas .
1 . Spread Spec trum technique s . I n FY 8 0 ITS performed an analytical s tudy into the feas i b i l i ty of an overlay spread- spectrum ( S S ) commun ication system in the VHF band ( 1 5 6 - 1 6 2 �Til z ) in the New Or leans , LA , area . The re sults of the study showed that s imple ove rlay is not feasible princ ipally because of interference with mob i l e reception between the base stations o f the SS sys tem and the exist ing FM sys tems (An Analy s i s of the Compatib i l ity of Spread Spec trum and Narrmvband F/:1 Mob ile Radio Systems in the 1 5 6 to 1 6 2 MH z Band , de Haas and \'ifatterson , Apr i l 1 9 8 1 ) . Fol lowing a suggestion from MARAD , ITS is presently conducting a laboratory experiment to determine what can be gained by combfi lter notching of the spread- spectrum transmi tted energy in such a way that the nu lls would fall on the centers o f the FM channe l s ( see Figure 2 - 6 ) . The advantages o f s uch a scheme would be twofold :
2 .
( a ) the notche s in the S S spectrum would reduce the inter ference to the FM sy stem ; and
( b ) corresponding notchi ng a t the S S receivers ( particularly at the base station) could s ignif icantly reduce the F/:1 to SS inter ference .
In practice the actual gains will depend on the characteristics of present day FM equipments and the degree of compl ication and costs incurred in des igning a notched SS system . The ITS study addre s se s spec i f ically the s s t o FM interference problem and the results of the study will be pub l i shed in early FY 8 2 .
The I n s t i tute provided the technical exper t i se in preparation for , and at , the Interim and Final 1:1eetings of CC IR Study Group 8 in the areas of Direct Pr inti ng , Dig ital Selec tive Call ing , and Automated VHF/UHF Telephony , all in the Mar it ime 1:1obi le Service . This inc luded u . s . representation in I nterim Working Partie s 8/5 , Automated VHF/UHF Te lephony , and 8/8 , Operational Procedure s for Digital Selective Ca l l i ng . Both of the se IWP ' s comp le ted the ir work and submitted draft Recommendations to the Final Mee ting of Study Group 8 . 'l'he popularity of Direct Printing in accordance with CCIR Recommendation 4 7 6 is rapidly increa s ing . Thi s technique is mo stly used for telex connec tions with ships , but is also increas ingly important for transmi s s ion of ship ' s operational data ; e . g . , payroll , requirements for provision s , etc . Due to the large increase in traffic ,

"" (X)
Table 2 - 1 . Transatlantic Cab l e Sys tems* *
Total Voice Voice System Cable Repeater
Circuits C ircuit Nomenclature S i ze Spacing Year ( Cummulative ) Added ( added system) ( em) ( km)
1 9 5 6 3 6. 3 6 TAT - 1 1 . 5 7 7 0 . 5 1 9 5 9 7 2 3 6 TAT-2 1 . 5 7 7 0 . 5 1 9 6 3 2 1 2 1 4 0 TAT- 3 2 . 5 4 3 7 . 1 1 9 6 5 3 5 2 1 4 0 TAT - 4 2 . 54 1 3 7 . 1 1 9 7 0 1 1 7 2 8 2 0 TAT- S 3 . 8 1 1 1 8 . 6 1 9 7 6 5 3 72 4 2 0 0 TAT- 6 4 . 3 2 9 . 5 1 9 8 5 3 2 1 6 5 * * * 2 6 7 9 0 * * * 1 9 9 0 8 6 9 3 0 * * * 8 1 5 5 8 * * *
* * Source : 1 9 8 0 World ' s S ubmarine Telephone Cable S ys tems , NTIA Contractor Report 8 0 - 6 b y R . J . O ' Rorke , Jr .
O ' Ro rke ( 1 9 8 0 ) . * * * E s t imated , based on 2 2 % annual growth .
1Thes e reported values ( from O ' Rorke , 1 9 8 0 ) are the ins ide diameter of the outer copper conductor . Outside cable d iameter i s 4 . 4 5 e m for TAT- S and 5 . 2 6 e m f o r TAT - 6 . The outs ide diameter i s the dimens ion o f interest in later calculations .
Parameter
Cable Weight
Cable s i ze
Cable Volume ( 6 3 0 0 km)
Repeater S pacing
Table 2 - 2 . Comparison of F iber Cable and SG (Western Electric S i ze Designation) Coaxial Cable
Value for f iber cable
5 5 0 0 lbs/km
2 . 1 em
2 2 0 0 m3
3 0 km
Value for coaxial cable
6 9 0 0 lbs/km
5 . 2 6 em
1 3 7 0 0
9 . 5 km
3 m
Ratio Coax : F iber
1 . 2 5 : 1
2 . 5 0 : 1
6 . 2 7 : 1
3 . 1 6 : 1
Comments
F iber weight i s es timated and based on the elimination of outer coaxial conductor only .
Variations on f iber cable s i z e are effected as refinements in system p l an evolve . Values used here are based on " S ingle -mode Digital Transmi s s ion Technology , " by T . Kimura , Proc . IEEE , 6 8 , 1 2 6 3 -1 2 6 8 ( 1 9 8 0 ) .
-
Fiber repeater spac ing a s sumes that l o s s i s the l imiter .
*Values for the SG cable are taken from O ' Rorke , 1 9 8 0 and " In s tal lation and Maintenance of the Undersea System , " BSTJ 5 7 , 2 5 2 3 - 2 54 6 , ( 1 9 7 8 ) by J . E . H . Cosier , et al .
-

Table 2-3 . TAT-6 Costs
Component
Cable ( Cc }
Submerged electronics (Ce }
Terminal & power feed (Ct }
Terminal Stations (Ct }
Insta l lation ( Ci }
TOTAL
Norma l i zed Total Cos t : $ 7 . 4 5 /ch · km* .
*TAT-6 is 6 3 00 km , 4 20 0 voice c hannels .
Cost ($ Mil lion s }
$ 1 0 3
7 8
5
1
10
$ 1 9 7 mil lion
NOTCHED SS ENVELOPE
/ NARROW BAND FM CHANNELS � ' t "
FREQUENCY
Figure 2-6 . Notched spread spectrum overlay .
interference has also become an increasing problem and the need has arisen for automatic identification of the ends of the radio circuit (as opposed to the end users } when setting up a connection . The Institute has provided the technical expertise in this area , inc luding preparation of u . s . proposals to the Final Meeting o f Study Group 8 .
Radio Technical Commis s ion for Harine Services ( RTCM} Sub-Committee 74 was e stabli shed to coordinate u . s . e fforts on Digital Selective Calling . An operational at sea tes t , p lanned by SC- 7 4 ,
4 9
unfortunately was not very successful -because of unexpected equipment problems both on ship and at participating coast stations . New te sts , if funding can be found , wil l place much increased emphasis on the preparatory e f forts and pre-test check outs .
Funding for the ITS efforts in the CCIR preparatory work and meeting partic ipation was partially supplied from NTIA in-house funds .
Advanced DEB IV EFAS . The obj ec tive o f this progra� 1 s to des1gn and develop an intelligent second generation transmission monitoring

and control system . The system i s to be used to monitor several digital microwave termina ls and relays within a network . The monitoring system i s intended to provide the sys tem operators with sufficient al arm and parameter data to i solate degraded conditions and faults at remote locations . Interactive di splays are the core of the system that wi l l a s sure efficient commun ication sys tem operation .
Progre s s to date has included the defini tion of the sys tem approach and obj ectives . The se are now in di stribution among the user agenc ies in anticipation of a users forum to be establi shed late in the fall of 1 9 8 1 to refine system requi rements . Several management and techn ical working group meetings have been called to provide the neces sary directions for thi s program .
This entire system i s a second evolutionary step for a sys tem first developed at ITS as the Enhanced Fault Alarm sy stem .
U . S . Army Tac·tical Communication Sys tems Digital Me s sage Device Group Te sts . The purpo se of thi s pro j ec t i s to ( a ) determine spec i f i c per formance capabi l i ties of a Digital Me s sage Device Group ( DMDG ) frequency- shiftkeyed ( FS K ) , burst-communication s , HF modem us ing the ITS Ionospheric Channe l S imulator , and ( b ) to prepare a final report on the re sul t s of the channel s imulator measurements .
A first set of measurements wa s completed on the I<Y- 8 7 9 /P modem and a report wri tten . The purpo se of the laboratory experiments was to determine the error-probability per formance of the modem with respect to var ious type s of s ignal d i s tortion impo sed by HF channel s and the modems themselve s . The results of the experiments are to be used to determine if the modem mee t s five specified performance requirements .
A second set of measurements i s be ing made as a result of several des ign mod i f ications made to the I<Y- 8 7 9/P after the completion of the f i r s t set of channel-s imulator exper imen ts .
Each channe l-s imulator exper iment on the KY-8 7 9 /P modem consi sted o f a set o f e rrorprobability experiments . Each mea surement required the repeated transmi s s ion of the same me s s age . To allow any keyed and stored me ssage to be automatically repeated , and transmi tted , a PROM (progranu'nable read-only memory) in the KY- 8 7 9/P transmitter wa s modified by the modem ' s manufacturer especially for the ITS channe l - s imulator experiments . Quiescent time between transmitted me s s age s could also be entered from the keyboard .
A computer program was prepared , te sted , and then used in the experiments to automatically obtain , proce s s , and display the des ired data during the cour se of each measurement . During each measurement , the computer counted the numbe r of Tx-On ( transmitter o n ) pulses to obtain the number of me s sages transmitted , Mt , and it counted the number o f Rx-On ( receiver on ) pul se s to obtain the numbe r of me s sage s received , M . The computer u sed the beginning of each Rx-On pulse to look for and read the AS C I I characters del ivered by the receiver for
5 0
the speci fied number o f blocks . When a me s sage wa s del ivered and read , i t wa s p roces sed by the compute r , which compared it with the stored correct me s sage , character by character , and added suitable counts to s tored val ue s for the measurement . The se value s were : M , number o f me s s age s proce s se d ; C , number o� characte rs proces sed ; C , numberPof . ( e proce ssed charac ters 1n error one or more bits in error ) ; B , number o f p roc e s sed blocks in error ( one or �ore charac ters in error ) ; and b ( n ) , number o f blocks with n character error s , for n = 0 , 1 , 2 , . . . , 1 3 .
For each transmitted me s s age , the computer used six of 21 current stored counts to compute updated e stimates of three error probabilitie s : probabi l i ty o f a mi s sed me s sage ,
M - M t r Mt
probabil ity o f character error , given that a me s s age i s rece ived ,
P ' c c e c
P
probability o f a block €rror , g iven that a me s sage i s rece ived ,
P ' B
B e
i3 p
A total o f nine channe l - s imulator experiments were performed on the KY- 8 7 9 /P modem . The exper iments are divided into two maj or type s : nonfading experiments us ing a channel with a single specular ( non fadin g ) path , and fading exper iments us ing a channel with one or two Gau s s ian- sc at�er ( Rayleigh- fading ) paths . Whi le the fading experiments all used reali stic s imulations o f HF ionosphe ric ( sky-wave ) channel s , the nonfading e xperiments did not because HF ionospheric channel s always exhibit Rayleigh fading . The nonfading exper iments were very des irable , however , because they provide use ful per formance capabilities information . The channel - s imulator experiments performed were as fol lows :
A . Nonfading
1 . Demodulator add it ive and nonl inear distortion s .
2 . Demodulator Doppler d i s tortion . 3 . Channel thermal-noise d i s tortion .
B . Fading
1 . Channe l fading d i s tortion . 2 . Demodulator Doppler d i s tortion with
fading . 3 . Channel thermal-no i se distortion
with fading . 4 . Channel d i f ferential -delay d i s tor-
tion with fadin g .
Heasurement o f Per formance o f Mobile Radio in the Pre sence of Ignition Noise . A te st program , sponsored by the Motor Vehicle Hanufac ture r s Association , wa s undertaken at the General Motors proving ground for the purpose

o f determining the e f fects o f venicle ignition noise on land-mobile voice communication sys tems . Ten d i f ferent te s t conf igurations i nvolving up to 12 vehicles were used . The test results inc lude both s ub j ective scoring ( l i s tener pane l ) of phonetically balanced word
groups and objective scorin g . A report inc luding the se results has been sent to the sponsor for review .
Automated Per formance Pred ictions for Mixed Mode Links . In the operation of near-line-ofs ight and beyond - the - hori zon microwave l ink s , per formance may be determined by more then one mode of radio wave p ropagation . This may come about as the re sult of a complete change from one mode to another or from two or more modes existing s imul taneou s ly . The obj ec tive of this pro j ect i s to use the dis tr ibution o f the apparent earth ' s radii for a g iven area as the data base for the algorithms used to cal culate l ink performance . The algorithms and data base will be used in a second phase of work to p repare computer programs and document them for conveniently using these algorithms . Thi s pro j ect i s sponsored by the U . S . Army Communi c ations Elec troni c s Engineering Installation Agency .
Technical Suppo rt to the MEECN System . This is a continuing program whi ch s upports the MEECN ( Minimum E s sential Emergency Communications Network ) System Engineer , at the Defense Communications Agency ( DCA ) . A draft te s t plan has been complete d and submitted to DCA for approval . Testing , which will be conducted at NOSC , San Diego , CA , will be directed by ITS and wi l l addre s s the interoperability ( compatib i l i ty ) i s sues o f the updated and modi f ied U . S . Air Force and Navy components of the HEECN System under var ious detrimental channel cond i tion s , both natural and manmade .
Testing has been de layed by sev8ral months because of equipment shortfal l . In the meantime , several new i s s ue s have been added by DCA , inc luding synchroni zation tes ting of the late s t operational program for the current Navy equipment presently in the field .
Mul tipath Induced Spec trum D i s tortion . Multipath fading in LOS l inks i s known to cause s hort term outages when the s ignal s from both the primary and d ivers ity radios fade below the bit-error-rate threshold dur ing flat fading . In add i tion , outages have been observed which oc cur at relatively high signal leve l s . The se outages are o ften attributable to in-band ( se lective ) fading .
To obtain s tati stics on selective fading and relate them to flat- fading in formation , the Defense Communication Engineering Center provided ITS with funds to inve stigate this problem . The p ro j ec t con s i s te d of a 2-month te st by ITS to a s s i s t in determining the e f fect of selec tive mul tipath fading on digital line - o f - s ight microwave link s . Data were co l le c te d within the Digital European Backbone Stage I ( DEB I ) on three LOS links on which ITS had ins trumentation instal led for another te s t program . Data collecte d on thi s selective - fading pro j ect were analyzed at the ITS laboratory . A number o f intere sting re sults were observed from the data analys i s .
5 1
Large values o f distortion , greater than l dB/MR z , were obse rved during multipath fading events due to null s in the path frequency response . Diversity reception looks very promising for counteracting these large magnitude distortion e f fects . Multipath rece ived- signal-leve l s tatistics can be used to pred ict the frequency and severity of inband- fading distortion on line-of-s ight paths . Frequency-selective fading deve lops and subsides at low rate s , of ten over a period longer than one minute . The se results are needed for improving performance and des ign criteria for digital LOS l ink s . An NTIA report on this work wi l l be publi shed in the near future .
Digital Microwave Radio Evaluation . In 1 9 7 8 , the ITS conducted measurements over a microwave l ink at the Pac i f ic Mi s s i le Test Center ( U . S . Navy ) at Point Mugu , CA . The obj ectives
o f the program were to characterize the multipath propagation due to atmo spheric layering , and to assess its e f fect on a proposed digital transmis s ion sys tem . The meteorological struc ture D f f the coast of southern Cal ifornia i s u sually dominated by a marine layer o f air that persists during the summer and fall months of the year . Strong temperature inversions deve lop , which in turn create superrefractive conditions for the radio s ignal s . The refractive layers may be surface based and extend up to a few thousand fee t , or they may develop as e levated laye rs at varying heights above the surface . Both conditions give rise to mul tipath . The results of the above measurements and the recommendations for implementing a digital microwave system over the test l ink were presented in NTIA Report 7 9 - 2 4 , " I nve st igation of Digital Microwave Communications in a S trong Meteorological Duc ting Environment , " by R . \"i . Hubbard .
The particular l ink at PMTC is over a 6 5 mile ( 1 0 4 . 6 km) path from Laguna Peak ( LP ) near
the Naval Base , to San Nicholas I s land ( SN I ) in the Channe l I s lands off shore . The e levation of LP is approximate ly 1 4 0 0 ft ( 4 2 6 . 7 m) above msl . The SNI te rminal i s approximately 9 0 0 ft ( 2 7 4 . 3 m) above ms l . The entire path is over water with the exception of the steep terrain at each end that drops toward the ocean . The geometry o f the link and the 1 0 ft ( 3 m ) parabolic antennas used at each terminal , minimi ze the potential of surface reflec tion . Thus , the fact that the link i s over water is ins ignif icant t o the propagation . The ma j or concern is the meteorological conditions . Because the conditions do pers i s t , and are we l l documented with radiosonde mea surements , the LP-SNI l ink make s an ideal te s t bed for study ing and evaluating atmosphe ric mu ltipath .
Subsequent to the expe riments conducted in 1 9 7 8 , the PMTC ha s purchased and instal led a dig ital mic rowave radio for use over the LP -SNI link . The system is presently being used for exper imentation only , and has been ins trumented by PMTC and ITS for a comprehens ive exper iment to measure and correl ate propagation conditions and digital system per formance . The digital radio is a 4 4 . 7 Mb/s system , operating in an 8 -PSK modulation mode . The te s t used for performance monitoring

i s a DS- te s t signal generated from a PN binary sequence . Two monitor ins truments are used . The first is a synchronous error- second instrument , which is followed by a bur st-error analyze r . The bit-error data from the errorsecond ins trument is fed directly to the second ins trument , which provides a d i s tribution of the error data wi thin a de f ined bur st period . The se data are being accumulated in a digital data acquisi tion system , for later proce s s ing and analy s i s at PMTC . At thi s writing , the performance data have not been proce s sed to any extent .
The equipment configuration for the LP-SNI link is outl ined be low :
1 . The mon i tored transmiss ion i s in s implex mode , with the transmitter located at SNI and the receiver located at LP .
2 . A s ingle transmitting antenna i s used at SNI for all analog and digital s ignal s .
3 . The PN Probe i s duplexed into the PMTC operating system at both termina l s , so that the impulse response measurements are performed over precisely the same transmi s s i on channe l s as the operating sys tems .
4 . Space diversity wi th approximately 1 2 5 f t ( 3 8 m) vertical spacing is provided at the LP receiving termina l .
5 . Transmi s s ion s ignals and frequencie s are as fol lows :
Analog r'DM Sys tem
Digital Sys tem
PN Probe Sys tem
7 1 7 0 and 7 4 7 0 MH z
7 3 5 0 rm z
8 6 0 0 rm z .
6 . Two 4 - f t ( 1 . 2 m ) parabo lic antennas are mounted at the LP terminal for angle diver s i ty measurements . The se antennas are at a he i ght of approximate ly 4 0 ft ( 1 2 . 2 m) , j us t above the 1 0 ft ( 3 m)
antenna used as the lower dive r s i ty antenna .
Multipath conditions in the more recent measurements are e s sentially the same a s tho se observed i n 1 9 7 8 . A summary o f the mul tipath data for the PMTC l ink is presented in Table 2 - 4 . It can be noted that the maximum delay time s for the 1 9 8 0 data are considerably longer than any regi stered i n 1 9 7 8 . One explanati�n for thi s result is that the ducting layers .ln the atmosphere during 1 9 8 0 were generally higher than tho se obse rved in 1 9 7 8 . S ince the atmo spheric mul tipath is due to re frac�ed energy from the elevated layer s , the delay spread would be greater . It has not been poss ible to analyze a great deal of the mor� recent data , but the examples presented ln Table 2 - 4 are qui te typical of the measurements to date .
�he important aspect o f atmo spheric mul tipath 1 s , of course , its dynamic e f fect on sys tem per formance . To i l lustrate the effec t , we present an example o f data that corre sponds to a measured error event a s received on the PMTC digital radio . Thi s particular radio uses a digital scrambler ( internal ) wi th the purpo se of creating a s i gnal spec trum that ma intain s a uniform power density regardle s s of the actual data s tream . In addi tion the IF ampl i f iers in the receivers are de s i�ned
5 2
for uni form gain acro s s the s i gnal spectra . The se two de s i gn features produce a stable , flat spectrum for the s i gnal as i l l ustrated in Fi gure 2 - 7 , where there is no tran smi s s ion degradation . S ince the normal spec trum i s quite flat acro s s the band , i t i s ideal for evaluating the e f fects of frequency selec tive fading ; both the " ti l t " and " notch . " A series o f spectra are shown in F i gure 2 - 8 , measured at the time s indi cated . Each sample corre sponds to an error event observed on the digital radio . For thi s particular sequence , the rece iver was taken out of its dive r s i tyswitching mode , and la tched to rece ive data on the upper-antenna channel only . The adaptive equal i zer on the channe l was active , however , so that i t s full compensation for both spectral tilt and center nul l s would be real i zed . The impulse response assoc iated with each spectral plot is shown in F igure 2 -�- The multipath component in the se functions i s nearly the s ame magnitude as the more direct component , and fairly con s i stent . The delayed component can be readily seen in the response o f part ( b ) in F igure 2 - 8 , as two di s t inct peaks are vis ible , wi th a s l ight notch between them . The re spons e s of part ( a ) and ( c ) are broadened by the mul tipath ,
and the strong de layed component i s confirmed only by the broadening of the re spon se compared to a 1 3 . 3 ns width of a clear channel response . The delay time of the component i s approximately 6 n s , a s seen i n the response of ( b ) .
The tilt on the spectral func tions in ( a ) and ( c ) are on the order of 1 0 dB or le s s acro s s
the 2 0 MH z bandwidth ( 0 . 5 dB/MH z ) . The d i s tortion appears s l i ght but it i s of the same order of magni tude that has been found to produce unacceptable level of performance due to error rate . Each of the func tions i n F igure 2 - 8 were obse rved s imultaneously with a bur st error event in the PHTC performance data . The responses shown in part ( b ) we re part of a continuing distortion that began a few seconds earlier with the re spon ses shown in part ( a ) of the f igure . The system returned to error- free performance fol lowing the notch that impinged on the spec trum in ( b ) until the response seen i n ( c ) wa s ob
served approximate ly 2 minute s late r . This activity continued with s imi lar results for several minute s until a strong notch was seen to move through the spe ctrum at 1 9 2 0 : 5 9 . The responses at thi s time are shown in Figure 2 -9 .
Bur st-error per formance characterized the entire period when the above mul tipath activity was dominant . On occas ion , a bur st o f errors was sufficient in length to cause a complete loss o f synchroni z ation in the rece ived bit stream , which compounds the performance problems . It should be kept in mind that the se measurements we re made wi thout bene fit of space diversity , but with full compensation o f the adaptive equali zer in the receive r . Channel A , the lower antenna path , was subj ect to the s ame type o f distortion during the period , but less f requently .
All o f the data are being proces sed at Point Mugu Te st Center to e s tabl i s h the corre lation properties between the multipath envi ronment and the sys tem performance . A NTIA report i s expected to be pub l i shed i n FY 8 2 .

Table 2 - 4 . Multipath Delay Spread
Lower Antenna Delay (ns)
High Date Time Hax Prob .
2 2 Aug . 7 8 1 5 5 0 17 3 5 1 4 2
* 2 2 Aug . 7 8 1 7 4 0 1 7 5 0 5
* 2 4 Aug . 7 8 0 9 0 7 0 9 3 0 1 2 . 5 0 * 2 4 Aug . 7 8 1 5 1 5 16 4 5 1 0
* 2 5 Aug . 7 8 0 9 0 0 0 9 5 0 2 * *
3 1 Aug . 7 8 1 1 1 2 1 2 0 0 8 . 7 5
1 Sept . 7 8 1 0 0 5 10 5 5 1 2 8
* 1 S ep t . 7 8 1 1 5 5 14 3 5 8 6 * 5 S ept . 7 8 1 7 0 5 2 3 0 0 7 5
6 Sept . 7 8 1 6 3 5 19 1 0 8 5
6 Sept . 7 8 1 9 5 7 2 1 5 5 9 5
8 S ep t . 7 8 0 0 3 0 0 2 0 7 1 2 6
8 Sept . 7 8 0 4 4 5 0 6 4 9 1 4 7 - 1 3
1 0 Sept . 7 8 0 5 5 0 0 7 4 0 5 3 . 5
1 1 Sept . 7 8 0 9 4 7 1 1 0 0 5 3 . 5
1 3 Sep t . 7 8 1 6 3 0 1 6 5 4 9 2 -5 * 1 4 S ept . 7 8 1 1 0 0 1 2 0 0 2 0
1 2 Sept . 8 0 1 8 0 0 1 9 0 0 11 7
1 8 Sept . 8 0 2 2 4 0 2 4 0 0 1 9 8
Antenna Spac ing :0::: 1 2 5 I
* * = L e s s than clear channel respon s e , indicating phase inter ference fading .
* Mea surement @ 5 0 MHz PN Clock Rate .
I
j i j (
I \ \ t
\
\ ,..., .... ..,._ _____ 20 MH Z ----------��
Upper Antenna Delay
High Max Prob .
8 2 * *
2 * *
* * * *
* * * *
8 . 7 5
1 2 1 0
8 6 * * 1 . 2
8 4
1 0 7
1 1 1
1 1 6
8 4 - 6
9 4
1 1 5
2 0
4 0 2 0
4 0 9 - 1 4
Figure 2- 7 . An exampl e o f the spectrum o f the received digital signal ove r the PMTC l ink with no multipath degradation .
5 3

! I \
� 2 0 MH z --tllloi S I GNAL S P E CTRUM
( a ) 1 902 : 1 7 Z 1 2 02 : 1 7 P DT A i \ / \
/ I
j \ ; '
J ' \ �
( b ) 1 902 : 24 z 1 2 02 : 24 P DT
( c ) 1 904 : 37 Z 1 2 04 : 37 P DT
2 0 ns ... ,,...,_ __
POWER I MP U L S E
Figure 2 - 8 . A sequence of s i gnal s pectra and powe r impulse functions mea sure d o ve r the PMTC li nk with atmo spheric mul tipath . E ach response corre sponds to a time when burs t- e rror data were observe d in the digital radio per formance .
..,..._ 20 t�H z �
S I GNAL SPE CTRut�
I '
,v\ ' I i \
\ I
\ c=5 ns
/
_) L -.j 2 0 n s
POWER I MPULSE
F igure 2- 9 . The received s i gnal spectrum and the corre sponding power impul se response in the PMTC channel with a strong multipath component .
5 4

Inte roperability Parameter Hierarchy . Mi l i tary interoperabi l i ty i s sue s bridge all tactical and s trategic command level s . The i s sue s include interface with h o s t country commerc ial and national networks . This p ro j ect was an initial phase of a mul tipha se e f fort address ing gateway interoperability evaluat ion . The work concentrated on the development of a methodology to evaluate interoperabil ity . Several primary i s sue s were identifie d and the hierarchy o f elements and parameters required to c haracterize each i s sue was spe c i fied . The inte roperability i s s ue s were organized a s f unctional-parameter tree s that repre sent s tatus s napshots in time and space . A l i fe cycle management system was propo sed . Recommenda tion s for further data collection , organ i zation o f interoperab i l i ty eva luation methods into a facil ity , and the integration of this fac i l i ty into the l i fe cycle management system were made .
SECTION 2 . 3 STANDARDS
The speci fic pro j ects describe d here represent deve lopment o f , contributions to , or spec i f ic applications o f Federal , Inte rnational , and indus try standards . The pro j ects are : Videotex S tandards and Recommendation s , Automated Digital System Engineering Mode l s , and Automated Digital System Engineering Mode l s .
Videotex S tandards and Recommendations . NTIA/ ITS , during the past two ye ars , has addre s sed a large number o f technical i s sues regarding the inter facing requiremen t s and s tandards for decoders and systems des igned to work with TV receivers as di splay terminals . A program within ITS was e s tabli s hed to examine and comment upon the evolving National and Inte rnational S tandards and technical i s s ue s relating t o Videotex service s a n d the interworking o f Videotex wi th other service s . To keep current on standards and recommendation s a n d t o contribute t o the U . S . standards activitie s , ITS has partic ipated in a numbe r o f the Elec tronics Industries As soc iation ( E I A ) , and U . S . CCITT S tudy Group meetings and
a l so technical symposia dea ling with the se technologies . TV manufacturer s , broadcaster s , and information provider industries are all seeking entry into what may become an important and pro f i table service indus try within the next couple o f years . Trade maga zine artic les have indicated that 1 9 8 1 development costs for tele text/video text may exceed $ 1 0 0 , 0 0 0 , 0 0 0 ( Busine s s Week , June 2 9 , 1 9 8 1 , p . 7 6 ) .
--
FY 8 1 activi ties in an ITS pro j ect , " TVRece iver- Interface S tandards for Information Service s " was focused on ( 1 ) s upport of the s tandards activitie s of the E IA and CC ITT/CCIR organi zations in the i r endeavo rs to deve lop and promulgate standards and recommendations fo r Videotex and ( 2 ) preparat ion of a techn ical data base for NTIA in suppor t o f Comments and Rep l ie s by NTIA to the FCC i n connection with NOI ' s , Rulemaking s , Petition s , etc .
I n the Inte rnational CCITT S tudy Group VI I I , the matter o f interactive Videotex has been a sub j e c t o f debate for the past two years and has led to a number of recommendations at the September 1 9 8 0 Plenary ( P lenary Document No . 8 8 E ) . Recommendations have been made to
5 5
partic ipating Admin i s trations relating to transponder interoperabil ity and terminal compatibil ity . The se recommendations are mindful of the multiplic ity of Videotex systems in operation or in f ie ld trial s , in Europe and other parts of the world . The recommendations consider the following :
Interactive Videotex as an international service in accordance with CCITT recommendations .
Interworking o f Videotex with Teletext and other text communication services such as Teletex , Telex , e tc .
Early implementation of Videotex as a public service .
Common lang,uage , code s , and protocols to be accepted where po s s ible to al low for min imum trans lation or character reworking .
It i s agreed within the CCITT Working Groups that the various Administration ( and not the CC ITT or CCIR) should determine the ( technical and special feature ) bas i s for the country ' s own Videotex Systems , but at the same time , to move toward methods for suitable interconnectabi l i ty to al low for interaction with Videotex Systems in o ther countries .
I n the u . s . , focus within the EIA and the TV/Cable indus tries appe ars to be directed toward broadcast videotex (Te letext) and much of the ITS e f fort has been toward participation in the te letext s tandards areas .
A summary of teletext standards status in the u . s . i s l i sted below .
The E IA Teletext Subcommittee has actively sought to obtain concensus on a large number o f technical standards needed to get thi s technology into the marketp l ace .
Page format and upper and lower bounds have been identif ied to enable the establi shment of an acceptable page character matrix and di splay matrix for tex t and graphic pre sentation on a TV screen .
Bit rates for U . S . NTSC te letext operation s , al though not yet e s tabli shed . will e ither be at the 5 . 7 3 or the 4 . 5 8 Mb/s rate s . The highe s t rate of 6 . 2 Mb/s appears unsuitable for u . s . standards due to the lower bandwidth and number of scan l ines for the North Ame rican TV , the NTSC-H standard .
Forward error correction , probably us ing a form of Hamming Code in sertion , appears to offer good low error rate teletext reception except under very low signal leve l s or extreme noise envi ronment s . Bit rate s of 4 . 5 3 Mb/s would extend the acceptable viewing distances from tran s mi tter t o receiver and would probably give better teletext reception in noisy environments .
The asychronous (variable format)

approach of Telidon/Antiope appears to be the leading contender for a common North American Te letext System Standard . { This does rai se the question o f softwar e compatibi l i ty for the United Kingdom generated software a s we l l as that for mo s t European teletext systems which operate wi th the same format at the British . ]
A collection o f papers , reports , and meeting notes have been a s sembled into Notebooks in ITS covering the topics o f videotex and teletext standard s . The notebooks a l so inc lude entries from various national and international standards commi ttee s . A " Table of Contents " l i s ting the re ference material contained in the notebooks has been prepared and i s available on reque s t from ITS .
A more extensive Techn ical Memorandum i s in proce s s covering the Videotex Standard s and recommendations .
Automated Digital System Engineering Mode l s . The obj ect ive of this project i s to expand the utility of a desk-top , computer-based set o f programs previous ly developed b y I T S f o r the U . S . Army Communications E lectronic Engineering In stallation Agency (USA CEEIA ) , F t . Huachuca , AZ . Sui table additional programs and program modi fications were prepared and te s ted with required documentation .
The program modi fications are des igned to reflect changes in LOS system s tandards based on work done at the Defense Communications Engineering Cente r at Res ton , VA . The pro j ect i s sponsored by USA CEE IA .
Guided Wave Communication s . The work in this proj ect was des igned to 1 ) keep abreas t of technol ogical developments , 2 ) revise and update the Optical Communication s Gloss ary , and 3 ) to provide a status report on the progress of fiber optic communication s . The se pro j ect obj ectives were met through attendance at technical meetings , the chairing and fol lowup of a U . S . and Canadian glos sary committee o f experts , and the preparation o f a report based on publi shed information and personal contacts .
The first vers ion o f the Optical Wave guide Communications Glos sary is in the reivew process to be accepted by both IEEE and EIA s tandards commi ttee s . A re�ised and expanded ve rsion wi l l be sub s ti tuted for the first ed ition when i t i s publi shed ( pr ior to the end of FY 8 1 ) . The revised ver sion i s al so expec ted to be submitted by IEEE to the IEC as a U . S . contribution to that international standards e f fort .
A revi sed and e xpanded vers ion of an earlier report , " A user ' s Manual for Optical Waveguide Communications , " by R . L . Gallawa , has been developed and will be publi she d .
5 6

CHAPTER 3 . EM NAVE TRANSHISSION
The ground , the atmosphere , and the ionosphere degrade radio waves in varying degrees , depending on circumstances . It is �he purpose of the EM Wave Transmission �rogram to s tudy these effects and provide models to the system designer that ,.,i ll aid him in providing more cost e f fective and spectrum e f f i cient designs . The phenomena which cause these detrimental e f fects on radio and optical systems are , in general , frequency dependent ; therefore , specific studies and tests are required for spec i fic frequency ranges and applic ations .
Some o f the phenomena which affect radio s ignals and are studied in this program are :
1 . Attenuation by atmospheric gases , hydrometeors ( rain , snow , hail , c louds , etc . ) , or ionization .
2 . Scattering by hydrometeors or irregularities in the re fractive index of the lower atmosphere or ionosphere .
3 . Re fraction , ducting , and multipath resulting from atmo spheric or ionospheric l ayers .
4 . Dispersion resulting from frequency dependent properties of the atmosphere , ionosphere , and earth .
5 . Scintil l ation o f amplitude , phase , polar ization , and angle o f arrival resulting from turbulence and irregular structure in the atmosphere and ionosphere .
6 . Re flection , scattering multipath , and lower atmosphere perturbations resulting from terrain and man-made structures .
The e f fect upon any speci fic sys tem o f the above phenomena is not only high ly frequency dependent , but is also dependent upon the type of service required for the spe c i f ic application .
One driving force behind the EM Wave Transmis sion Program i s the need for more spectrum space . Therefore , this program provides models , techniques , and information to aid the system des igper and frequency manager in their decisions for better spectrum use .
Experimental or theoretical determinations of radio wave transmission characteristic s , or the channel trans fer function , are reported in Section 3 . 1 . Heasurements o f transmiss ion media properties and analyses of collections of such data are included in section 3 . 2 . Section 3 . 3 describes the development and testing of model s ,.,hich incorporate the transmission information in engineering too l s . Predictions o f transmis s ion characteristic s and system performance a r e discussed i n S�ction 3 . 4 . Section 3 . 5 reports o n a,ppl icat1ons o f the knowledge and tools to speci f ic problems o f other goverqment agenc ies , such as mine and forest service communications .
57
SECTION 3 . 1 . WAVE TRANSMISSION CHARACTERISTICS
Experimental determinations of the effect of the transmis s ion media on electromagnetic wave transmission are reported in this section , in particular those e f fects produced by the atmosphere .
Multipath Fading �echani sms and Link Reliability . The study o f multipath fade mechanisms and resultant communications link re liability i s based principally on experimental measurements obtained from propagation over two 2 3 km paths . A common transmitter i s located a t the Boulder Atmospheric Observatory ( BAO) and the receivers are respectively located at Department of Commerce Radio Bui lding and at the ITS Table Mountain f ield site north o f Boulder . The transmitters are mounted on an elevator on the 3 0 0 meter BAO tower , which permits height-gain measurements in addition to fixed- level measurements . This provides a unique facility for the study o f atmospherically induced multipath effects .
Operating frequencies at 9 . 6 , 1 1 . 4 , and 2 8 . 8 GHz were used in these experiments . Refractivity pro f i les were obtained at the transmitter terminal ( BAO tower ) during most heicrhtgain runs us ing a device to record dry bulb
J
and wet bulb temperatures and pressure , or a m�cro�ave ref�actometer . These profi les proV1de 1nformat1on on the presence and magnitude o f variations in the refractivity index.
Observations were made for two years from June 1 9 7 9 to June 1 9 8 1 . During this period approximately 2 0 0 height-gain observations were nade , mostly in the early morning hours and on days when forecasts indicated promise of inversion layers . Figure 3-1 · shows a height-gain measurement during a period on 2 0 June 1 9 8 0 when substantial atmospheric layering occurred . One or both o f the links were operated at fixed heights when heightgain observations were not being made .
The purpose of the fading studies is to determine the qual ity and reliabi lity of terrestrial l ine o f s ight (LOS ) channels for c lear air conditions in the SHF and EHF ( 3 to 3 0 0 GHz ) bands . T\oro mechanisms account for clear air fades : reflections of t�ansmitted energy from terrain surfaces ( ground) and obstacles ( buildings , trees , etc . ) and refraction through inhomogeneities of the atmosphere between the LOS terminal s . These mechanisms are discussed and some of refractive fade observations are i llustrated .
Ref lected s ignal levels in a wel l des igned l ink seldom produce fades of greater than 6 dB because o f reduced reflection coe f f icients at low incidence angles and the reduced illumination of reflecting surfaces due to na�row antenna beamwidths obtainable in the upper portion of this frequency spectrum. Even though deep fades are generally not produced by surface multipath , they are particularly damaging to a channel used for wide band transmi s s ions . Because of the usually long delay time ( tens o f nanosecond s ) between the direct s ignal and the surface reflection , severe distortion occurs in the s ignal pass-

..... E -...;
I-I <..9 H w I
(J1 co
3 0 0 I I I ' ;:;=4 i I ' I - I ' i i l ' "5 I , , I ' I � ' I ' I I 1 :> I i I I
2 5 0
2 0 0
1 5 0
1 00
5 0
0 I I :tt I I I I I =:-t I I I I I I { A ( II { I l I ( I ( { I I ,; I II ( I { I I I { (I ( l ( II It I I
1 0 0 - 1 0 - 2 0 0 - 1 0 - 2 0 0 - 1 0 - 2 0 0 - 1 0 - 2 0 0 - 1 0 - 2 0 2 2 5 2 5 0 2 ? 5 3 00
S I GNAL AMPL I TUDE C d B ) REFRACT I V I T Y C N )
F igure 3 - 1 . Height-gain measurement- - s ignal ampl i tude relative to free space recorded over two 2 3 km paths on June 2 0 , 1 9 8 0 .

band . Th i s i s particularly apparent in high data rate digital sys tems where intersymbol interference produce s high error rates . The problem is enhanced when other f ades reduce the direct ray , increasing the r elative contribution of the long delay surface reflection .
When re frac tion or the bending o f rays by the atmo sphere occur s , several types o f fades result . This refractivity produced fading i s n o t we l l understood at S HF-EHF , and the identification of fade characteristics and e f fects o n the channel performance was a pr imary goal .
A type of refractivity induced fade ve ri f ied experimentally is an atmospheric mul tipath fade . This type of fade becomes more prevalent with increased frequency and occur s when two nearly equal rays form a path dif ference at the rece iver , one-half wave length out o f phas e . Atmo spheric multipath i s characterized by deep fades ( > 4 0 dB) when o ther fade mechani sms are not present and i s frequency dependent , as illustrated in F igure 3 - 2 . Commencing at abou·t 0 4 0 5 ( MST ) , a fade , enhancement , fade , and second enhancement occur on the 1 1 . 4 GHz channel s ending at 0 4 2 5 ( MST) . Dur ing this s ame time period , a much more rapid pattern of fades and enhancements occur o n the 2 8 . 8 GHz channel s . Atmo spheric fades not only reduce channel s i gnal to noise ratio ( S/N ) , but can also produce d i s tortion .
Fade s def ined as radio hol e s result when rays are bent away from the rece iver or d iverge . Anti-holes are the convergence o f rays to produce a more concentrated f ie l d intens ity . Radio holes are independent o f channe l frequency because the re fract ive bending i s the s ame for all frequencies . Rad io -hole fades reduce channel S/N , but do not cause d i s tortion . The s i gnal leve l s in F i gure 3 - 3 , show e xamp les o f radio holes and anti-holes . The fade on all four channe l s commencing at 0 4 2 8 ( MS T ) i s caused by a radio ho le and the
enhancement , peaking at approximately 0 5 0 5 , resulted from a radio anti-ho l e .
Compar ing fades on the channe l s us ing widebeam antennas ( 5 and 10 degrees ) with tho se u s ing narrow-beam antennas ( 0 . 6 and 1 . 0 degrees ) permits detec tion o f a beam wander or a beam decoupl ing type of fade . Beam wander is a frequency independent type of fade , caused by ray bending away f rom the receiver , however , this mechan i sm doe s not produce channel d i s tortion . No beam wander fades were observed over the path with the 0 . 3 degree reso lution over a 2 year period as was true even when a 0 . 1 degree resolution was instrumented for 6 weeks by us ing the antenna lobe patterns and s ignal process ing technique to obtain the reso lution .
Scintillation i s a refractive f ading produced by sma l l scale inhomogeneitie s . These fade s , wh ich occur o f ten , se ldom exceed 2 to 3 dB .
A full-wave type model for computing radio fields was used to predict height-gain observations from the as soc iated refractivity pro f i le s . The mode l i s c lo s e l y related to the geometrical theory o f d i f f raction and was derived by ITS ( Huf ford e t a l . ) Only
5 9
qua l i tative agreement was found between the mode l predictions and the observations . This was attr ibuted to the unreal i s tic assumption in the model that the re fractivity profile was uni form along the path . During times of height-gain observations an acoustic sounder was operated to monitor atmo spheric layer he ights while the refractometer traveled through the layer . Both ins truments showed rapid changes in the re fract ive layer height and gradient , however , a cons tant short period ( 1 0 minutes ) gravity wave was apparent on the sounder indicat ing limited hori zontal stratification .
Al though strong refractivity gradients were observed at the BAO tower during many of the height-gain runs and during o ther observation periods us ing the tower ins trumentation , the general absence of deep fades is attributed to the lack of sus tained layer lng along the entire path . Of the 3 0 days , sele cted as having highest probability of inver s ion layers , for which heig·ht-gain measurements were taken , only on July 2 6 , 1 9 7 9 and June 2 0 , 1 9 8 0 were multipath fading and intense fading obse rved . On both of these days , mo i s t air was present at the lower tower leve l s , covered by dry air above .
Other t�han the two brief periods when atmospheric multipath fades exceed 2 0 dB , refract ive induced fades se ldom exceed 10 dB . Only the long delay , but small in amplitude , ground mul tipath s i gnal s will produce distortion to a wide band channe l . To evaluate the extent of this distortion a l _ Gb/ s phase modulated system ( 1 . 5 GH z bandwidth ) will be added to me asure dis crete mu ltipath components and record the resulting bit error rates .
During th i s s ame s tudy period , no l ink outages were observed due to fades caused by pre cipitation . A typical and average distr ibution o f rain and snowfall occurred .
The se ob servations indicate that commun ications l inks not af fected by mu ltipath si gnal de lays would have per formed with a very low outage time .
S ECTION 3 . 2 . CHARACTE RISTICS OF THE TRANSMISS ION MEDIA
This section is concerned with the s tudy of transmi s s ion media to help tho se who des ign , cons truc t , or use telecommunication sys tems to better unders tand the characteris tics of the media and the ir e f fects on radio signal s . We f irst discuss the nonioni zed atmosphere and then the ionosphere .
3 . 2 . 1 . Atmo spheric Characterist ics
MM Wave Attenuatio n . Moi s t air i s characteri zed for the frequency range of 1 to 1 0 0 0 GHz a s a nonturbulent propagation medium described by meteorological parameters . An adequate spec troscopic data base for air cons ists o f three terms : ( i ) resonance information for 29 H2 0 l ines up to 1 0 9 7 GH z and 4 4 0 2 l ines up to 8 3 4 GHz in the form of inten s i ty coe f f ic ients and center frequency for each l ine ; ( i i ) an empirical water vapor

..-; u 0 (/) ... � .g ... >
·.;: 0 � ct) " Lu 0 :::> r----' "-::;:: <( ---' <( z "' Vl
..-; 0 0 (/) ... � Q ... > •t � C!l " LW 0 :::> r----' "-::;:: <( ---' <( z "'
· � Vl
5 1 1 • 4 GHz (narrow beam , 0.6°) BAO-to-T22 4-1 9-81
0 1 1 . 4 GHz (wi de beam, 4°)
0
-5
2 8 . 8 GHz (wi de beam, !0°)
0256 0356
TIME (MST)
F igure 3 - 2 . S ignal amp l i tudes recorded over a 2 3 km path on 4/1 9/ 8 1 .
-5
-5
- 5
0348
1 1 . 4 GHz ( narrow beam, 0.6°)
1 1 . 4 GHz (wide beam , 4°)
28 . 8 GHz (narrow beam, 1°)
28 . 8 GHz (wi de beam , 10°)
0448 TIME (MST)
BAO-to-T22 3-1 0-81
F igure 3- 3 . Signal ampl i tudes recorded over a 2 3 km path on 3/1 0/8 1 .
6 0
0456
0548

continuum spec trum; and ( i i i ) a l iquid water attenuation term for haze and c ioud conditions . This data base is the. heart of a dual computer program which calculates and plots attenuation rates ( dB/km) and re frac tive di spers ion ( ppm) .
The first p art covers the troposphere and requires pressure , temperature , relative humidity , and c loud l iquid water concentration as input data . Figure 3 - 4 gives four example s , which are representative-0f conditions in a mid- latitude c l imate .
Part two addre sses isolated l ine behavior in the mesosphere wherein the geomagnetic f ield s trength H i s an addi tional input parameter due to the Zeeman e ffect of the 0 2 mo lecules . Each oxygen line sp l i ts proportionally with H into numerous sub- l ine s , which are j uxtapo sed to form a Zeeman pattern spread over a megahertz scale . Patterns of three main polariz at ion cases are cons idered . Various typical examples for a model atmosphere ( F igure 3 - 5 ) demons trate the utility of the approach and provide new i nformation on Zeeman attenuation in the me sosphere by oxygen .
Cumu lative Behavior : A s tandard example for an inhomogeneous medium is the one-way zenith response through the u . s . Standard Atmosphere 1 9 7 6 . Figure 3 - 6 d i splays the cumulative attenuation A for which 6 0 he ight l eve l s up to h - 1 0 0 km are summed . Three humidity prof i les p ( h ) were used to model RH = 5 , 5 0 , and 1 0 0 % i n each o f 2 6 height layers between h = 0 and 8 km . The RH drops rapidly below 1 % above h = 8 km . The frequency range 5 5 to 6 5 GHz i s opaque (A> 3 0 dB ) for any sys tem attempting to look through . The transmittance i s measurable when the atmosphere i s somewhat transparent (A< 3 0 dB ) , and it c an be determined e i ther by
the absorption o f a s ignal coming from the outside ( sun emi s s ion , sate l l i te beacon ) or by thermal emi s s ion from the air ma ss .
We cooperated with N . Feldman ( formerly RAND) to model he ight-dependent atmospheric attenuation for the frequency range 5 0 - 7 0 GHz and a paper w i l l be presented at the Ins t . Te lemetering Conference , Oct . 1 3 - 1 5 , 1 9 8 1 in S an Diego . An NTIA report is in preparation to present more than 1 4 0 0 examples of attenuation/di spers ion curves exhibi ted by various model atmo spheres ( h= 0 - 1 0 0 km , f=l - 1 0 0 0 GHz , RH=0- 1 0 0 % , H=0 - 1 Gaus s ) .
The problem o f excess water vapor absorption ( EWA ) in the mill imeter wave window ranges
was reviewed i n detai l . A summary of the f indings was presented to the XXth General Assembly of URS I ( August 1 0 - 1 9 , washington , D . C . ) by P ro f . P . DeLogne , chairman of URS I-F �iorking Party on EWA . A report authored by P . DeLogne· and H. L iebe , enti tled " Attenuat ion by oxygen and water vapor in the atmosphere at mill imeter wave length s " , wa s produce d .
P ro f . M . Mizushima , consultant , introduced some new theoretical ideas in predictinl e lectric d ipole tran s i t ions in the species 6 o l 8 o and 1 4Nl 5N . S tronger absorption l ines for 1 6 ol 8 o are predicted at 7 8 . 9 , 9 8 . 3 , 1 3 5 . 7 , 1 6 2 . 8 , 2 1 7 . 1 , 2 1 9 . 6 , 2 4 4 . 2 , etc . GHz and for 1 4Nl 5N at 1 1 5 . 3 and 2 3 0 . 7 GHz . The correct
6 1
magni tude o f the dipole moment i s not known ; however the se l ines have the potential to explain some observed , but yet unidentif ied , line features in the mm-wave 'I'Tindows .
Experimental E f for t : The spec trometer cell , aimulating a 0 . 2 km radio path at 1 4 0 GHz , was completed and tested for its humidity behavior .
Based upon the results of Humidity Test I the initial apparatus had to be redes igned . ilso , a stronger pump ( 7 0 0 vs . 2 5 0 qrams/hr ) water remova l ) and a 4 -probe internal temperature scanner were added . Measurements at RH> 9 5 % general ly require a stability o f better than � 0 . 0 0 5 ° C . The precise control of temperature proved to be mos t important . A Hamidity Test II is in progress yielding des ired results .
The Fabry-Perot re sonator was tested at 1 4 0 GHz . The loaded Q-value is quite h igh ( 4 8 5 0 0 ) yielding an e f fective path length o f 1 6 5 meters , which as sures exce llent detection sens itivity . The resonator is mounted inside the humidity c hamber ( F igure 3 - 7 ) and the spectrometer was optimi zed (+ 0 . 2 dB/km detection sens itivity) for operation at 1 4 0 GHz . The output signal i s captured and displayed with a digital waveform processor ; up to 4 0 waveform data can be analyzed and s tored inde f i nitely for compar i son . Attenuation and refraction ( frequency shi f t ) measurements o f up to 5 1 2 data pairs are made under program contro l .
The first high humidity data were obtained . The result of 9 + 2 dB/km average of over 1 0 0 individual data points i n saturdated air ( RH � 1 0 0 % ) at 1 4 0 GHz i s quite high . The
prediction model yields only 2 . 6 dB/km . A square law was a s s umed for the detector . The work continue s .
M�ll imeter Wave : Propagation through vegetatlon � Colorado ' s east slope . Measurements of millimeter wave propagation in vegetation were made for the U . S . Army Communications Electronics Command . The obj ective of the pro j ec t ·was to obtain information on s ignal lo ss , spatial , depo lar iz ation , and scattering c haracte r i s tics for propagation through both dec iduous and coni fer aroves for a variety of foliage dens ity �nd mo isture content at three frequenc ies in or near the mi l l imeter wave band . One o f the important needs for this information is in the assessment o f the feasibil ity o f using trees for camouflage of one or both terminal s of a communications l ink .
The instrumentation for this measurement program was mounted in four-wheel-drive vans for mobi l ity in rough terrain . The rf components are supported on erectable trackmounted c arr iages to permit ready adj ustment of height above ground . In addit ion , the transmitter mounting permi ts two me ters of hori zontal travel to al low variabi l i ty along this axi s .
The directional antennas scan in e levation and a z imuth angle by a remote-contro l led po sitioner at the rece iver terminal to provide data on the intens i ty of off-angle scatter from foliage and ground reflection e f fects .

m tv
s� h : 0 km
L: � "" CD 0 I I z_ D O ......... .......... E---t cr:: :::) z w E---t
l ir
0
w
"cl g/m3 2 1 7.79 0
2 1 1 2 3 1 0
8.00 9.28
4 1 10 1 9.28
0 0
0.5
%.
43 76 1 100 ! 100
0 1 1 1 1 1 I I I 1 /IJI I ill I I I I I i I 1f/l1 ,t;{, I I I I I I I I I I I I I I I I I I I I I I I I I I I I I I j i I I I I I I I I I I I I I I I I I I j l I i I I i I I I i I i i I I I i I I i .......... 0 . 0 1 00 . 0 200 . 0 300 . 0
FREOUENC Y - - GHZ 400 . 0 500 . 0
F igure 3 - 4 . Attenuation a in dB/km o f typical examples for moi st air at sea level over the frequency
range 3 0 to 5 0 0 GHz including fog with 0 . 5 g/m3 l iquid water content .

0.3 GAuss 0.6 2 0 1 s 1 s 3�+ 1 .�" , 1.865 h=ao l � i ,o r-: i so l ·� &o , \ km j 1 .261 I . <OO !l I I 1 .190
./ lA ;o 0;3 "0 j � ::J �
n 2 a = 1 . 866 j 1 . 528 d 0 . , . c: -40:' o -�o -8 � � .. o ·· ·· .. s -4 - ··· · · o ·· ·· - 4 -2 .. o · · 2 � 1: 0 ·8�o �"��·25l0 �0·�6 90 1 o.1o1 100 c: .m
::::J ) cu 671 :l;: .197 I I .0076
� < , � 1 1 1 1 • J i· 1 1 1 , ,M r� Jl n �
./ i ,w_ 1 . o31
-2 '' 0 2 -2 0 2 -2 0 Frequency Deviation Av , MHz
F igure 3 - 5 . Zeeman attenuation patterns of the oxygen microwave line K = 3+ for altitudes h=3 0 to 1 0 0 krn . Each frame displays n (a1 ) , a+ ( a2 ) , and cr- ( a 3 ) patterns for the magnetic f i e ld s trengths ,
H=0 . 3 ( left hand ) and a= 0 . 6 Gau s s ( r ight hand ) . The max imum attenuation rate �0 i s that o f
the i solated unsplit l ine ( H= O ) . The values o f a1 ( v 0 ) in dB/km are f o r 0 . 3 and 0 . 6 Gau s s .

m "0
<( z 0 1-<( ::::> 1 0 z w 1-1-<( ::c !::: z w N
1 .0 -9
' • . . lu . . :t=;=-#�� -��
L �-��� - - [- _ - t ·:· : - -t� -- - 1 - - -J---�-_-:--� -��t�--� -1-:-=--- < � 1-� -_; _ _ =c; �- t _ j - r - -1 70 ·j----'- ��� - � i --t -�- i
I l I I I
\ .. 91
. r:�J�-�I �10�t�f��;f�:+�
1 00
FREQUENCY
���- - --. -r--
y� ---- �-� -
---,3<>-.�5 ; ---�
I ! .
_ ! -.J --1
i +-+----:--�--i---- �-i-,.....,;�hf-..-..-+��-i
= - -r- 1 _5t�:=:-::�-- - - " l -
200 300
GHz
Figure 3 - 6 . Zenith attenuation A through the u . s . Standard Atmosphere 1 9 7 6 for dry ( RH=5% ) , moderate ( 5 0 % ) , and humid ( 1 0 0 % ) air over the f requency range , 1 0 GHz to 3 0 0 GHz ( EHF ) . The relative humidity RH was a s sumed to be constant for h= O km to 8 km . 'l'he total precipitable water vapor is given by w .
6 4

0'1 U1
IN- ' > > > > > > > > > > > E�
! ..... E E �
II I > > > > > > > >
140 GHz Q = 485,000 L = 165 m
I 185 X �/2 ------•
30 :1 (17 dB)
WR 8
T1 CONTROL
TABLE TOP
0 5 ID em I I I I I
I T " 300 ±0.005 K
'
I WATER SUPPLY
T2 = 275-300 ±0.003K
T2 CONTROL
F igure 3 - 7 . Fabry-Perot resonator s imulating a 1 6 5 m radio path at 1 4 0 GHz and mounted i n side a t emperature-control led humidity s imulator .

Three frequenc ies , name ly 9 . 6 , 2 8 . 8 , and 5 7 . 6 GHz , were used s imultaneous ly to obtain frequency dependent data to aid in developing transmi s s ion loss model s for speci fic type s of vegetation . Both vertical and hori zontal antenna polarization are mechanically selectable at each terminal , which permits measurements for each case , inc luding cro s s pol ari z at ion .
The data recorded from these measurements consist of rece ived s i gnal amplitude s from both a z imuthal and elevation scans at tran s mitter and receiver heights from 1 t o 9 me ters above ground . The transmitter antennas were normally fixed at a zero angle ( on-path ) pointing and the receiving antennas were s canned at + 2 0 ° in the a z imuthal plane and + 1 5 ° i n the elevation plane .
The s i gni ficant results and observations from this s tudy are l i s ted in the fol lowing summary s tatements with speci fic i l lustrations shown in F igures 3 - 8 through 3 - 1�:
1 . The measured s i gnal loss ( dB/m) through trees in fol iage exceeds predic ted loss obtained from extrapolat ion of data from numerous sources at frequencies between 1 0 0 and 9 0 0 0 MH z . These extrapolated values indicate only 1/3 to 1/lOth the dB/m loss measured in the frequency range of 1 0 to 6 0 GHz . The term dB/m means dB loss per meter of measured fol iage depth on a path , independent of the total path length . The se s tudies have indicated a need to establ i s h a method for determining depth o f foliage . This aspect mus t be examined when comparing resul t s .
2 . D i f fraction theory has a /f dependence which sometimes is used to pred ict vegetation loss ( dB/m) at higher frequencie s . Although our results show that vegetation losses clearly
-increased ( on the average ) at �hese
frequenc ies , the ratio was less than /f over the 10 to 6 0 GHz frequency range . Normal i z ed losses due to vegetation ( dB/m) show a trend to decrease as the fol iage path is lengthened , which appears con s i stent with measurements at lower frequenc ies .
3 . The measured vegetation loss in nearly all cases , a s observed in Figure 3- 8 , was less at the 1 and 2 meter heights than at heights greater than 2 mGter s . This is the result of no leaves or sparse leave s at the 1 and 2 meter height and the general absence o f underbrush on the sites used for the se tests . Al so , vegetation loss difference a s a
function of antenna polar i z ation was very s l ight through trees , whereas for tall gras s ,
hori zontal polar i z at ion clearly provides l e s s
lo s s . When comparisons o f vegetation loss
were made o f deciduous groves , with and wi thout
fol iage , the groves in s ummer fol iage produced
about 3 times as much loss in dB/m as the same
groves in their de foliated state . F igure 3 - 9
shows an example o f thes e observation s .
4 . An important factor is the depend
ence of received s ignal on spatial variance .
S i gnal ampl itude variat ions as l arge as 4 2 dB ,
see F igure 3 - 1 0 , and typically 3 0 dB were
observed for small d i sp lacements ( � 2 5 em) of
6 6
the transmitter antenna s in either the horizontal or vertical pl ane . There i s con s iderable evidence that the se deep fades are results o f two relatively s trong mul t ipath s i gnal s adding destr uct ively . Expo sed ( free o f leaf cove r ) trunks and branches appeared to be the source of the mul tipath .
5 , Observations during windy periods ( 1 5 to 20 km/h) on a path with 10 or more
meters of fol iage depth produced s ignal vari ations ( scintil lation s ) o f u p t o 1 5 d B with periods o f less than 5 s econds . In addi tion , 8 dB fades of longer per iods ( 1 to 5 minutes ) were noted in gusting winds . The time series record s in Figure 3 - 1 1 i l lustrate typ ical scintil lation s .
---
6 , An increase in vegetation loss was noted during a rain on a s ingle obs ervation when water covered , or droplets formed on , leaves and branches of a wil low tree . The s i gnal loss increase was 3 to 5 dB at 9 . 6 GHz and 15 to 2 0 dB at 2 8 . 8 GHz ; howeve r , the se maximum losses occurred s everal minutes after the shower started , indicating perhaps a delay in wett ing of leave s and branches contr ibuting to propagation in sheltered regions . Mo isture condens ation prevented a measurement at 5 7 . 6 GH z . A wet s now fell during a coni f e r path observation and much of i t s tayed on the branches ; however , no detectable s i gnal change \vas noted .
7 . Depolar i z ation of s i gnals propagated through expos ed tree trunks showed les s change than through leafy fo liage where depolari zed s ignal l evel increased by as much as 2 0 dB .
8 . Lateral wave propagation . and tree top dif fraction enhancements were not detec ted ; however , measurements were not conc lus ive due to uncertainties in canopy height , canopy roughne s s , and path geometry .
9 . For a path with high loss due to fol iage , a stronger rece ived s ignal was observed when a common o f f - path volume ( clear of tal l tree s ) wa s i l l uminated . In the observed case , a common s catterer , perhaps a bush or terrain feature in a c learing , produced a s ide- s catter s ignal level higher than the direct-path s i gnal .
1 0 . Direct backs catter measurements from a wil low and a pine grove produced an equivalent spher ical radar cross section range of 0 . 0 0 8 and 0 . 5 square meters , depending �n frequency .
1 1 . On a defoliated path , a comparison of narrow-beam to wide-beam il lumination showed a sl ight decrease in vegetation los s and much reduced o f f-angle s cattering components . In which cas e , also , on a defol iated path , no detectable d i f ference was mea sured when siti�g a narrow-beam terminal near foliage and a wide-beam terminal in the clear compa·red to the reverse o f the se terminal location s .
Mill imeter Wave : Urban Propa�ation Study . A measurement of mi l l imeter wave propagation characteristics in areas s urrounded by bui ldings in a city envi ronment with principal

(!) (.) 0 Q. (/) (!) (!) ,_
'<--
0 +-
(!) -� +-0
� OJ �
(!) -o .-E Q. E c:l: 0 c 01 (])
-70 -
0
e 9.6 G Hz • 2 8.8 G Hz • 57.6 G Hz
- H H - - - v v
Marsha l l Road MR 02/0 1 Path I eng th = 172 m Tree depth ( ma x. ) = 30 m
F igure 3- 8 . S ignal amplitude a s a function of height for a cottonwood grove (HH polar i z at ion and VV polari z ation) •
+-0 � OJ �
(!) -o ::l
+-
Ci. E c:l:
0
- -....... ..... - -_
__ _.
...... 'x _._ _ _ _ ..,._ _ _ ::: = - -::::.&- - - ... / ......... -- /
/ --- - -.- -- / / -� /
- - ---- - ......... ___ ..._ __ ,., '
• 9.6 G Hz • 28.8 GHz • 57.6 GHz
-- W i t h leaves - - - W i t hout leaves
--- .......... ......
Marsha l l Road MR 02/0 1 Pat h le ngth = 172 m Tree d e pth (max . ) = 30 m
F igure 3 - 9 . S ignal ampl itude a s a function o f height for a cottonwood tree g rove , with and without fol iage ( HH polari zation ) .
6 7

F igure 3 - 1 0 .
<V (.) g_ -54 (/)
� -66
42 dB 1 � r-------r-------+-------�------�------�-------+-------+--� Q - 1 8 � 28. 8 G H z
.... 0 Q3 ...
(]) -42 "0
<V "0
- 54 .2 -66 Ci � -18
0 c: o> U5
5 7. 6 GHz
0 .2 0.4 0.6 0.8 Tra nsm i tter Posit ion O ffset ( mete rs)
S ignal amplitude rela tive to transmitter antenna horizontal d isplacement . (MROl/ 0 1 , 'path length = 1 5 2 m , height = 1 m , tree depth = 4 0 m , polar i z ation
Q) (.)
- 6 - 1 8
- 30
g_ -42 <f)
� - 54
9.6 GH z
.... � r-----r-----+-----+-----+-----;-----4------r----�----�-----4 Q - 6 Q) > 0 - 1 8 Q) ....
(]) "0
0.. E <( - 6 g - 1 8 o>
(/) - 30 -42 -54
0
28.8 G Hz
57. 6 G H z
2 3 4 5 T i me ( m i n )
F igure 3 - 1 1 . Time series records of rece ived s ignal amplitude dur ing windy condi tion s .
6 8
W) .

emphas i s on the evaluation o f voice intel l igibil ity and usable bandwidth or digital data rate c apab i l i ty as a function of pos i t ion o f terminal s i s i n progre s s f o r the U . S . Army Communications-Electronics Command .
The probe frequenc i e s for this s tudy are the same as for the propagation through vegetation work : 9 . 6 , 2 8 . 8 , and 5 7 . 6 GHz . A van will house the receiver terminal and a portable do l ly will be used to transport and pos i t ion the transmitter .
Scans o f both a narrow-beam rece iver and a 1 0 ° beam-width transmitter will be performed to record a l l s ignal paths with levels within 3 0 dB o f the direct path s ignal leve l . The rece iver will perform a rapid continuous scan and the transmi tter scan will be s tepped in 10° increments . Al s o , measurements wi l l be conducted on non- l ine-o f - s i ght paths to leve l s o f the order o f - 7 0 d B relative to the f ree space s ignal leve l to determine covertnes s characteristics in an urban environment .
The data obtained from the scan s indicated above will provide values for coefficient o f ref lection from various surfaces o f buildings , s uch as concrete aggregate , glas s , metal siding , etc . The s e reflection coe f f icients , in addition to antenna patterns and mol ecular absorption data , wi l l be used in a mul t ipath propagation equation to calculate a family o f plots showing predicted s ignal intensity . The s e s ignal i ntens i ty curves will be c alculated and plotted , u s ing a desk top computer , as a function o f antenna beam width , frequency , dis tance between terminal s , and terminal pos i tion .
It i s then propos ed that U . S . Army 3 8 and 6 0 GHz handheld communicators b e u sed to measure spe c i f i c paths and compare the s e results to the values predicted in the computer plots u s ing propagation equations der ived for the same paths . Non- l i ne-o f - s i ght paths w i l l a l so be measured and compared , noting ref lec ted s ignals from f lat surfaces as wel l as d i ffraction from edges o f obstruction s , s uch as corners o f buildings . I n the l atter case , the measured l evel s w i l l be compared to kni feedge diffraction pattern models in the shadow regions .
Also with the handheld communicator s , voice intell igib i l i ty tests will be conducted wher7 readabil i ty is que s t ionable . For known mul t�path delay and signal amp l i tude conditions , s tandard word l i s t s will be used to score the intelligib i l i ty . It is bel ieved doppler f lutter from moving vehicles will b e a ma j o r source o f uninte l l igibil i ty a n d wi l l provide a comp l ication in measurements independent o f flutter . However , measurements w i l l b e made at periods of l i ttle or no traf f ic , such a s predawn , o r i n areas where vehicular traf f ic i s not permitted . When mea surements can not avo id traffic s i tuation s , the e f fe c ts c an be separated , resulting i n information of f lutter characteristics due to mot ion o f vehicle s . This information w i l l be u s e f u l in scenarios with vehic le s in combat .
6 9
MM-Wave Propagation Review . At the speci f i c reques t o f and funding b y the Electro-optical D ivi s ion , Atmospheric Sc iences Laboratory , Whi te Sands Mi s s i l e Range , NM , a comprehens ive review was undertaken on the e f fect of solid and melting hydrometeors on terrestrial SHF radio propagation . Thi s s tudy was augmented by an excellent computeri zed database search conducted by the Boulder Laboratories L ibrary staf f . Hydrometeors are the var ious forms o f precipi tated water natural ly present in the atmosphere . To date , non- liquid forms of atmospheric water have been inc luded in papers on rain , the mos t prevalent form o f hydrometeors , and a separate study of this type was neces s ary for cold weather measurements being conducted in New England .
The results of thi s pro j ect were publi shed as U . S . Army ERADCOM R&D Technical Report ASLTR- 0 0 9 2 , July 1 9 8 1 , " E f fect of Hai l , Snow , and Me lting Hydrome teors on Mill imeter Radio Wave s . " This report i s a companion to the earlier ASL-TR- 0 0 4 9 , January 1 9 8 0 , "Atmospheric E f fects on Mill imeter Radio Wave s , " by the same author dealing mos tly with rain , which i s of primary importance because of its ubiquity and high dielectric constant at mi l l imeter wave lengths .
In examining 5 2 se lected paper s which are re ferenced in the techn ical report , hail and s leet were found to be more amenable to theoretical calcul ations and laboratory experimentation of attenuation and backscatter than snow and graupel due to their s impler approximations o f particle shape and dielectric constan t . However , field measurements on hail and s leet are virtua l ly nonexistent , whereas data on the behavior o f mi l l imeter waves through falling snow -notably attenuation - has been charac terized for various frequencie s , snow condition , and snowfall expres sed in equivalent rain rate or l iquid water conten t .
These measurements by several authors are shown as regre s s ion curve s in Figure 3 - 1 2 o f attenuation in d B p e r km vs . snowfall a s equivalent r a i n rate in mrn p e r hour . For compar i son , rain attenuation for four selected frequencies at 1 rom per hour i s shown as dots . According to the figure , the open l i terature tends to reveal that snow attenuation at mi l l imeter wave lengths increases with frequency , snow fa l l rate , and snowf lake l iquid water content .
In retrospect , we see that a l ack o f field data on the shape , s i z e , dielectric condition , and number per uni t volume o f nonl iquid hydrometeor particles as a function of space and time makes comparison between theoretical c al culation and experimental measurement d i f f icul t . This i s not the case for rain at the longer mi l l imeter wavel engths as s een from the earlier technical repor t .
Mel ting snow has been shown to affect mi llimeter waves to the same extent as rain , and the report recommends that prior i ty be given to measurements in thi s area over hydrometeors of lesser l iquid water conten t . Along thes e l i ne s , comparative treatment o f melting snow a n d r a i n during the same event

10 * * OOMORI, et a1
- - - - NISHITSUJI E • RICHARD, et al
..:#! ....... CD ""0 -
� z (/) (,!) z 1 _J ...J � I g 0 0:: I ....... z 0 !:i ::> z 0.1 w ....... � 0 w a::: ::> (/) <( w �
0.1 10 SNOWFALL - EQUIVALENT RAIN RATE (mm/hr)
F igure 3- 1 2 . Measured attenuation through fal l ing snow .
7 0

at the same frequency and along the same path are especially valuable because the e f fec t of rain is relatively well unders tood up to about 1 4 0 GHz .
The r e sults o f this pro j ect and technical report have been incorporated into the plann ing and execution of U . S . Army ERADCOM ' s SNOW I measurements in Vermont during January 1 9 8 1 .
Trace Gas Attenuation o f Ai r . The use o f systems operating a t 3 5 GHz i s antic ipated for a low altitude mi s s i l e defense . Such systems mus t operate in environments that could be d i s turbed by nuclear bur sts . O f particular concern i s the disturbed chemi s try exterior to the f irebal l . The molecules H 2 o 2 ( hydrogen peroxide ) , HN0
3 ( ni tric acid) , and
HN02 ( n itrous acid) have been identified as hav1ng increas ed concentrations ( > 1 0 0 ppm/v) fol lowing the s e events , which could l ead to s ubstantial absorption ( > 0 . 2 5 dB/km) near 3 5 GHz , in addition t o that c aused b y H2 0 and o 2 . A laboratory experiment has been prepared to measure , at room temperatures , absolute attenuat ion-versus -pre ssure rates of the identif ied mo l ecular spec ies . The d i f f iculties with the experiment l ie in the corros ive , absorptive , and hazardous nature of the test vapors and in achieving ( i ) a h igh detection sens i tivi ty ( < 0 . 1 dB/km) with absolute calibration and ( i i ) a ver i f ied concentration ins ide the test cell .
Measurements o f attenuation and re fract ion were performed on fairly pure vapors at low pressures ( < 3 torr ) and on mixtures at atmo spheric pressures ( > 6 0 0 torr ) u s ing N2 as the i nert , loss- free host gas . The performance o f the spectrometer was adequate to obtain the desired result s . The mo lecules H2 0 , N02 , H 0 2 , N 0 , and HNO produced insign i f ic ant attenuation ( < 0 . 1 dB/km) up to concentrations o f 5 0 0 ppm/vo l in 1 atm o f air .
Model calculations of attenuation for sea l evel air were performed over the frequency range 20 to 5 0 GHz : ( i ) for the temperature range - 2 0 ° to 4 0 ° C and relative humidi ties RH = 0 , 1 0 , 5 0 , 1 0 0 % , and ( i i ) for 27 to 7 2 7 ° C ( 3 0 0 - 1 0 0 0 ° K ) s imulating air heated by an
explosion . Examples o f the l atter are depicted in Figure 3 - 1 3 .
3 . 2 . 2 . Ionospheric Characteristics and E f fects
Defense Me teorological Sate l l it e HF Observation s . In the late spring o f 1 9 7 7 ( a s p art o f the De fense Meteorological Sate l l i te Program ( DMSP ) ) , the Air Force l aunched a s atell ite that was equipped with an HF radio-noise rece ive r . The satel l ite was l aunched into an almo s t sun-synchronous dawn/dusk orbit at about 5 0 0 n mi ( 8 6 0 km) . I n mid- summer o f 1 9 7 9 , a s econd DMSP sate l l ite containing a n H F radio-noi s e receiver w a s l aunched . This sate l l ite was launched into a s un- synchronous noon/midnight orbit , also at about 5 0 0 n mi . Both sate l l ites were equipped w i th instrumentation that provided observations o f HF s ignals between the frequency range o f 1 . 2 to 1 3 . 9 MHz . The receiver continuously sweeps through this f requency range i n 1 0 0 kHz s teps
7 1
in a total t ime of 3 2 seconds . Each satell ite moves approximately 7 km per second , which means that a value o f s ignal s trength can be obtained about every 2 0 0 km along each s atellite orbi t . Both the dawn/dusk and noon/midn ight sate l l ites were equipped with tape recording systems , making it pos s ible to obtain observations continuously throughout the orbit .
The e l ectromagnetic environment with the sate l l i te is rather noisy for an experiment des igned to provide detailed information about the HF envi ronment at the sate l l i te he ight . Also , operational cons iderations prohibited obtaining a knowledge of the performance characteristics of the antenna in the tops ide ionosphere . I t is for this reason that the results discus sed herein will be pre sented in terms o f the receiver terminal voltage as opposed to the more conventional field s trength of noise temperature . In a later s ec t ion , the relationship between the measured receiver terminal vol tage and the actual s i gnal power dens ity at the satell i te heigh t will be given .
Figure 3 - 1 4 provides an indication o f the type of data obtained from the DMSP HF rece iver . Shown in the f i gure is the receiver output vo ltage as a function of frequency during a full scan o f the rece iver . I t is apparent that , at the h i gher end of the frequency scal e , the data are more erratic and have higher values than at the lower end . This feature is attributed to electromagnetic energy being received at the satell ite from various sources on the earth ' s surface at frequencies above the s ubsate l l i te critical frequency . For frequenc ies below foF 2 , the ionosphere e f fective ly shields the receiver from ground-based transmi s s ion s .
Data o f the type shown in Figure 3 - 1 4 have been combined and used to generate maps of rece iver output voltage as a f unction of sate l l i te location . For each sate l l i te , observations were grouped according to month , time o f day ( noon , midn igh t , dawn , or dus k ) , and frequency . F igure 3 - 1 5 shows smoothed contours of the HF noi s e observed at 1 1 . 8 MHz dur ing the month of Apri l 1 9 7 8 during the period of local dus k . The frequency 1 1 . 8 is allocated to the HF broadcasting s ervices . It is found that the h ighes t values of the contours are as sociated , in general , with the area o f the ionosphere i l luminated by highpowered , ground-based international broadcasting emi tters .
The results presented by Rush et a l . ( 1 9 8 0 , Sate l l ite Mea surements of the HF Radio Environment in the Tops ide Ionosphere , Radio Sci . 1 5 ) s ugge s t that the source of the HF s ignal s observed b y t h e DMSP sate l l ite was discrete ground-based transmitters . Contours of receiver output voltage tend to be centered apove areas of the globe where emi tters a s s igned to spec i fic telecommunication services ( maritime , f ixed , and broadcasting) are e xpected to be located . Thi s being the case , i t should be pos s ible to use the observations f rom the DMSP sate l l i tes to s tudy seasonal and diurnal va+i ations in the global repre s entation of rece iver output voltage and relate these variations to corresponding

L: � ........... CD 0 I
N 0
C)
I Z o D O
I 0
N I
h = 0 km p = 1 01 0 mb p = 1 0 g/m3 p = 0
-
... ,
,.
,
/ /
/
, ,
, ,
,
, ,
/
,
/ ,
I I
;
0 ������������������������� .... � ........ ., 1 0
F igure 3 - 1 3 .
20 30 4 0 50 fREOUENCY - - GHZ
Model ing attenuation a ( dB/km) for moi s t air (abso lute humidity p = 1 0 g/m3 ) at elevated temperatures 3 0 0 to 1 0 0 0 ° K over the frequency range 1 0 to 5 0 GHz .
7 2

Figure 3 - 1 4 .
Frequency ( MHz )
S ignal strength ( in vo lts) as a function o f frequency observed by the DMSP HF receiver above a location of 4 0 . 4 °N and 2 6 5 . 8 °E on July 2 7 , 1 9 7 7 , at 1 2 3 6 (UT) .
Figure 3- 1 5 . Average g lobal behavior in the tops ide ionosphere o f the HF radio environment
at local dusk for 1 1 . 8 MHz during Apri l 1 9 7 8 . Contours are receiver output
voltage (mil livo lts x l 0- 3 ) •
7 3

seasonal and diurnal var iations ip the operation of ground-based telecommunication sys tems .
Global maps such as i l lustrated in Figure 3 - 1 5 have been produced for a number of frequencies for the months o f April 1 9 7 8 , September 1 9 7 9 , and December 1 9 7 9 . In addition , for September 1 9 7 9 and December 1 9 7 9 , maps were developed for local times surrounding dawn , dusk , noon , and midnight , s ince two DMSP sate l l ites containing HF receivers were orbiting dur ing tho se months . Frequencies o f 6 . 1 , 8 . 5 , 9 . 6 , 1 1 . 8 , and 1 2 . 5 MHz were s elected for s tudy . The frequenc ies o f 6 . 1 , 9 . 6 , and 1 1 . 8 MHz are al located to the broadcast service , and the frequenc ies of 8 . 5 and 1 2 . 5 MHz are al located to the mar itime mobi le service . In all instances , there was l i ttle or no sea sonal dependence that could be discerned for the results obtained above North America , Europe , and As i a . For a given month , the maps obtained for the four local time periods of dawn , dus k , noon , and midnight tend to reflect the influence of the ionosphere upon the satell ite obs ervations . Frequencies o f 9 . 6 MHz and lower tend to show an absence o f s ignal s during the noon period . Thi s is consistent with the observation that , during September and December 1 9 7 9 , the critical frequency of the F 2 layer , for foF 2 , wa s greater than 9 . 6 MHz during local noon for mo st locations around the globe . Radio waves inc ident upon the ionosphere from below can only be observed at a satel l i te located above the he ight of the F2 region peak if the frequency of the radio wave is greater than the subsate l l ite critical frequency .
HF Antenna S imulation . The Institute undertakes s tudies of the ionosphere in order to predict ionospheric propagation e f fects . . The. basic prediction program used for a s s e s s 1ng ionospheric propagation conditions ( IONCAP ) i s intended to provide the neces sary data for the de s ign o f HF communication systems and for
selec tion o f frequency complements for such systems . A substantial e ffort has been devoted to the deve lopment o f antenna mode l s and
a program code to be used with the IONCAP program . The ma j or intent is to create an antenna
package to be used with the HF sky-wave predictions .
Radio waves under cons iderat ion here have been reflected from the ionosphere and thus have traveled a cons iderable distance . This al lows the problem to be viewed as two parts : � 1 ) . the local e f fect of the ground at the transm1tt1ng s i te on the antenna , and ( 2 ) the local e f fect o f the ground at the receiving site on the antenna . Further , the assumption of p lane-wave reflection is j usti fied for thi s s ky-wave case .
1'he analy s i s of the antenna mode ls wa s broken into two logical subdivi s ion s :
( a )
( b )
The exterior ( radiation ) problem , which de als with the interac tion o f the antenna with the propagation medium; and
the interior ( c ircuit) problem , which dea l s with the interaction of current s , voltage , etc . within the antenna sys tem itsel f .
7 4
The solution to the interior problem i s implemented as precalcul ated curves or a s meas ured curves where available . The exterior problem is implemented us ins the equations a s deve l oped b y ITS . F o r arrays o f dipoles , the practice of expre s s ing the array equations as that of the re sonant dipole element and a reduced array factor is used . Thi s procedure results in a computer code which i s quite s table and fast in running time . There are no ma trix inversion routines nor any use o f the complex arithmetic routine s .
The model s for the log-periodic dipole arrays (hori zontal and vert ica l ) have been redone . The basic method u sed was to incorporate measured curves of the variation of the parameters entering into the solution of the interior problem. vJhere gaps exi s ted in the measured parame ters , theoretical values were used to complete the model . The result is a quite fast ( in computer time ) and reasonably accurate procedure when used within the de signed frequency range of a log-periodic antenna array .
The accuracy of the various antenna subprograms were checked by comparing the computed patterns , where po s s ible , with those publ i shed by Ma ( Theory and Application o f Antenna Arrays , John Wiley and Son s , 1 9 7 4 ) . The basic d i f fe rences in the Ma mode l s i s the use of 3 - te rm theory for the current d i s tr i bution , and f u l l complex matrix theory f o r the so lut ion of the interior problem .
The full IONCAP prediction program h a s been s implif ied to two smaller version s . One , MUFLUF ver s ion 8 0 . 0 1 , i s a s impler version which will sti l l per form a full system per formance calculation . The other , LIL2 5 2 vers ion 8 1 . 0 1 , i s a smal ler ver sion which i s for the calculat ion o f field s trength only . Thi s program can be u sed with a newly developed method of eval uating the ionospheric parameters , foF2 and M ( 3 0 0 0 ) factor , wh ich i s much s impler and faster than the ful l Fourier series normally used . A study of the accuracy of the LIL2 5 2 method as we l l as the s impl i f ied method o f calculating the ionospheric parameters was per formed . Various data banks of meas ured field s trength were used . The results are in a report under editorial review for publ ication .
In the course of us ing the measured data , i t wa s found neces sary t o d o a s tudy o f the relationships between various methods used in the past a s wel l as currently to norma l i z e field strength . This includes de f ini tions o f power transmitted , re ference fields , and antenna gain . The results o f thi s s tudy in re ference to s ky-way antenna patterns , groundwave antenna patterns , and the system loss o f a radio circuit have been added to the antenna report .
SECTION 3 . 3 . DEVELOPMENT AND IMPLEMENTATION OF EM WAVE
TRANSMISS ION MODELS
Mode l s and Data Bas e . As part o f a continuing e f fort to determine areas where propagation mode l s and data base s are needed , the Ins titute has conducted a s urvey o f users of the telecommunications spectrum . Thi s s urvey was intended to provide information that can

be used to dec ide on which portions o f the frequency spectrum further s tudy needs to be conducted . The results of the se e f forts have been s ummari zed in a Nat ional Telecommun ications and I n formation Administration Technical Memorandum [ NT IA-TM- 8 1 - 5 6 ] entitle<,). " Pre sent and Future Needs for Propagation Mode l s and Data in Telecommuni cations " . The i nvestigat ion has shown that propagation models and data bases are needed throughout the spec trum from VLF through EHF . It is necessary that methods be made avai lable to a very diverse user communi ty to s imulate the performance of telecommunication sys tems operating throughout the entire spec trum . Transmis s ion mode l s f o r those sys tems that depend upon t h e atmosphere and the iono sphere are needed . Because of the large potential pay-o f f i n improved spectrum e f f i c iency that will r e sult by operations at high microwave and mi l l imeter wave frequencies , the transmi s s ion model s tudies undertaken wit� NTIA s upport tend to emphas i z e the mi crowave and mi l l imeter wave portion o f the spectrum .
3 . 3 . 1 . Atmo spheric Transmi s s ion Mode l s
As part o f NTIA ' s e f fort t o s tudy interference f ields , descriptions of enhanced fi elds due to the presence of elevated ducts have been developed at ITS during the last few year s . A s part o f this e f fort , existing data bases from which to obtain the statistics o f many o f the d u c t characteristics mus t be improved . Improvement can occur both in the area of correcting for the response (or lag ) , t ime of duct measur ing ins trumentat ion ( v i z . , radiosondes ) , and in the area o f s upp lementation of thes e d ata bases in locations where measurements are lack ing ( v i z . , over l arge bodies of water ) . To te s t the e f fect o f the s e improvements in a given locatio n , radio sonde lag-time correc t ions were made on f ive years of data at Wa shington , DC ( 1 9 7 4 through 1 9 7 8 ) , and some over-water data from the Great Lakes , taken by re fractome ter , were analy zed .
The fol lowing table shows the e nhanced occurrence of e l evated ducts when an ins trument lag- correct ion procedure is appl ied to the 5 -year wa shington , DC , data tape .
Table 3 - 1 E levated Duct Total Occurrences and Wo rst Month Occurrences at Washington , DC
To'tal Wor s t Month (Augu s t )
Total Observations 3 7 6 4
Raw-data 9 9 9 E l evated Duct Occurrence s
Lag-corrected 1 2 8 0 Elevated Duc t Occurrence s
3 4 6
1 5 6
1 7 1
This table imp l i e s a more than 2 5 % increase in e l evated duct activity than i s indicated by the raw radiosonde data .
F igure 3 - 1 6 s hows a s ample of refrac tometer data s howing an e levated layer at about 1 km height over Lake Ontario on a day when a nearby radiosonde s tation ( Bu f falo , NY ) did not indicate any l ayer presence . Unfortunate ly , there is so l ittle such refractometer data
7 5
that its overall usefulness in s upplementing existing data bases i s still uncertain . It i s hoped that both the sample-lag correction results and the sample refractometer data supplement will l ead to methods whereby the elevated- layer data base for the entire USA can be co st-effective ly improved .
VHF/UHF Measurements . The primary obj ective of this pro j ect is to make mobile measurements of the s ignal strengths and fading characteristics o f VHF/UHF broadcasts in an urban area which can be used as a bas i s for providing improved techniques for predicting the coverage of UHF-TV and mobile radio systems . During FY 80 and FY 8 1 , mobi le measurements o f the UHF transmis s ions o f Channel 3 1 ( 5 7 2 - 5 7 8 MH Z ) , and Channel 5 7 { 7 2 8 - 7 3 4 MH Z )
were made and compared with the VHF Channel 9 ( 1 8 6 - 1 9 2 MH z ) data . Measurement o f thes e
three s ignals were obtained along the same measurement route [ 6 th Avenue to Valley Highway ( I- 2 5 ) to ( I - 7 0 ) ] in the Denve r , co:orado , metropo l i tan area ( F igure 3 - 1 7 ) . The tran s mitters a r e a l l located in the same general area atop Lookout Mountain with both the Channel 31 and 59 antennas mounted on the Channel 2 tower . Typ ical samples o f the instantaneous s i gnal strengths o f these TV transmis s ions recorded at the intersection of 6 th avenue and I - 7 0 ( s tart point for mobile runs ) are shown in F igures 3 - 1 8 through 3- 2 0 .
Statistical analysis of the new UHF mul tipath data taken in FY 81 has con firmed the earlier conc lusions arrived at from the analy s i s of the FY 80 VHF data . The UHF data also does not always fol low a Rayleigh probabi l i ty dens ity distr ibution { PDF ) and the actual cumulative distribution function ( CDF ) for mob i le reception of UHF can be better characterized by a Weibull exponential probability distribution mode l . The Weibull model gives the degree of deviation from the Rayle igh random multipath e f f ect . Whenever there are s trong specular ref �ections or the main beam of the transmittin� antenna is present , the CDF will deviate from the Rayle igh pDF and becomes an approximation to a We ibull model with a PDF given by
p ( R ; o , n ) = � ( �) n-l exp [ - ( �) n ] 0 0 0
where o is the scale parame ter , R i s the s i gnal envelope , and the Weibull CDF is found directly a s
00 ( f R n P R ; o , n ) = p ( R ; o , n ) dR = exp [ - {�) ] .
R The exponent , n , can be obtained from the measurements u s ing a s traight line approximation to the CDF . When the exponent n = 2 , the above equation becomes the Rayle igh distribution . F igures 3 - 2 1 through 3 - 2 3 show the var iation of the Weibull dis tribution exponent obtained for three video s ignals along the measurement route of Figure 3 - 1 7 . The Val ley H ighway ( I - 2 5 ) portion of the path is represented approximately by run numbers 7 5 th!ough 1 2 5 . It is apparent that for the Channel 5 7 video data the dis tribution i s very nearly Rayle igh ( n = 2 ) along I- 2 5 and departs markedly f rom Rayle igh along the 6th avenue and I - 7 0 portions o f the measurement route . Figures 3 - 2 1 and 3 - 2 2 compare the

....--.. E
.:::t:. ..._...
r-I <.!) w I
3..----------..,.--------,---------, 10
2
20 JUNE 1972 t453-1502 Z
LAKE ONTARIO
8
6
4
2
0�------�--------�--------� 0 100 200 300 400
REFRACTIVITY ( N - UNITS)
--�
,(f) 0 0 0 --
r-I <.!) w I
Figure 3 - 1 6 . A refractivity pro f i le observed us ing a refrac tometer over Lake Ontario showing the presence of an e levated laye r .
7 6

7 7

- 4 0 . 0 0
1 0 . 0 0 0 / D I V
I N S T R t1 P L d B m
- 1 1 0 . 0
F i gure 3-1 8 .
. ,.
r
I I
.. ,.
,·
I - -I
• I �
1 8 6 . 0 0
· ·- -
.
-
N ::r:: � � N r:-: .. ....
00 ....
-
,
-
· , ·
.
- •.
- ·-
, .
CHANNEL 9 .. - . ... - - . ..
. .
I "I , f'
I '\ T - r
·. ; :' !
! - • .. . �
. 6 0 0 0 .I' D I V
f R E Q U E N C Y , M H Z
- ·- P, �
• r . . .
• . .
• - ,- -. -
· I I
• ! . I
I ! .
-· -
.. .. _ .. - '
., .
• , -
·,
I I
.. I
�I •
-�r .... .
.
.·
1 9 2 .. 0 0
Television Channel 9 spectrum measured at intersec tion o f 6 th Avenue and I -7 0 .
7 8

- 4 0 . 0 0
1 0 . 0 0 0 / D I V
I N S T R M P L d B m
1 1 0 . 0
F igure 3 - 1 9 .
N ::r: � U'\ N I tt'i r I r:-ll"'
� I - ,.
,·
'- . -�- -
!� . I I I f
. 5 7 2 . 0 0
- - - ..
" I - ...
I -� - ;
- I - -.
I .: I
. \ . -
:� \:
CHANNEL 31 "' - - - . ,. - ·-
I . . . . ,. - I"
I I I T .- - ,-
: . I -
I . I I
I 1� ... - '·
� � � I � :v . 6 0 0 0 / D I V
F R E Q U E N C Y , M H Z
-· - .. - - � - . ::r: � "' r:-
I . r:-. , . ., r:- - '\ U'\
n . ,
- - -I -. .
. I I
I � • -� A ' �� I I � � .
� - - - - .
5 7 8 . 0 0
T e levis ion Channel 3 1 spectrum measured at intersection o f 6 th Avenue and I - 7 0 .
7 9

- 5 0 . 0 0
1 0 . 0 0 0 / D I V
I N S T R M P L d B m
. ,.
I r
I · r
.I I
,·
. ... I I
- 1 2 0 . 0 7 2 8 . 0 0
- ..
N ::r: � an ,. . . N
. 0' N 1'-
'
- ·-
. •.
- -
CHA NNEL 5 7 . .. - - . ,.
I " I " " , ,.
•
I I •
-� - "I ' • r
I • I
· � · . 1 ; I
I
-· - . ..
. 6 0 0 0 / D I V
F R E Q U E N C Y , M H Z
. ...
.. .. I
- �-
• I"
I I
, .. I
- - -
. .
.. .
-. -
• . . •
-·
.. . - .. . -.
• .. . " I •
N ::X::
I � • , •an ,.. \
1'-('1'\
I ('1'\ .- r-
• t • • . . •
: •
. •
.. _ _ _ _ . I
7 3 4 . 0 0
F i gure 3 - 2 0 . Television Channel 5 7 spectrum measured at intersect ion o f 6 th Avenue and I - 7 0 .
8 0

CHANNEL 9 V I DEO 9 /3 0/80 2 5 �--�----�----�---T----�--��--�--�
2 0 t-z w z 0 a. X w z 1 5 � 0 H t-:::J Ill H [t: t-Ul H 1 0 c:l _J _J :::J Ill H I w
v 3:
\ � 5
� N � � 0 I
0 2 5 5 0 7 5 1 00 1 2 5 1 5 0 1 7 5 2 00
RUN NUMBER
Figure 3 - 2 1 . The Weibu l l distribution exponent obtained for the Channel 9 video signal ( 1 8 7 . 2 4 MHz ) along the measurement route. on 30 September 1 9 8 0 .
81

CHANNEL 3 1 V I DEO 9 /3 0/ 8 0
2 0 1-z w z 0 a. X w z 1 5 0 H 1-:J co H � 1-U') H 1 0 Q -' J N J -' :J co H w 3:
5 � v
w WJ 0 _.L
0 2 5 5 0 7 5 1 00 1 2 5 1 5 0 1 7 5 2 00
RUN NUMBER
F igure 3 - 2 2 . The Weibul l dis tr ibut ion exponent obta ined for the Channel 3 1 video s i gnal ( 5 7 3 . 2 5 MH z ) along the mea surement route on 3 0 S eptember 1 9 8 0 .
8 2

CHANNEL 5 7 V I DEO 2 5�--�----�--�----�--------�----�--�
2 0 1-z w z 0 a. X w z 1 5 0 H 1-::J Pl H a:: 1-Ul H 1 0 .
l:l ..J ..J ::J Pl H w � �
5
\11 �.AJ� � 0 I
0 2 5 5 0 7 5 1 00 1 2 5 1 5 0 1 7 5 2 00
RUN NUMBER
Figure 3- 2 3 . The Weibu l l distr ibution exponent obtained for the Channel 5 7 video s ignal ( 7 2 9 . 2 5 MH z ) on 4 December 1 9 8 0 .
8 3

high degree o f variabil ity o f the exponent for both a UHF and a VHF s i gnal recorded on the same day along the same measurement route . The phys ical interpretation o f the var iation in the We ibull dis tribution exponent is that the deviation from a Rayleigh distribution gives a measurement of the compo site rece ived signal envelope from a random multipath fading characteristic ; thus , as the value of n increases above 2 ( Rayleigh value ) , the more the random component o f the signal envelope i s reduced .
The natural evo lution o f demand for mobile radio telephone s ervice leads to the ultimate obj ective of providing it for everyone ( that the demand exists is wel l evidenced by the wide use of CB radio in private vehicle s ) . There are , however , problems in achieving thi s goal . The most serious problem in mobile communications is the high degree of amplitude and phase fluctuations introduced by the movement of the vehicle . The primary cause of these large si gnal fluctuations i s multipath propagation , and the maj or obj ective of this UHF/VHF measurement pro j ect has been to measure and s tudy angular multipath at UHF and VHF in the urban env ironment us ing a mobile computer-contro l led receiver sys tem recently deve loped by ITS . The early results o f these new measurements ( in the frequency range o f 5 0 to 8 0 0 MHz ) have shown that the " local stati s tic s " may n o t b e Rayle igh , and that We ibull distribution may be a better description of the statistical properties o f the rece ived field . Much of the mathemati cal mode l ing that has been done for microwave mobile communications i s based on l imited measure�ents made during 1 9 5 0 - 6 0 , which indicated that the envelope of the mobile radio s i gnal is Rayle igh distributed in the frequency range from 50 td 1 1 , 2 0 0 MH z . The assumption o f the Rayle igh model led to results which have been extens ively used to s tudy modulation and divers ity in the design of mobi le communication sys tems . Whether or not the results o f the se new measurements will have an impact on ·the design of mobile communication systems in the future rema ins to be seen . Also there is the que stion of the extent to wh ich the data collected in the Denver metropolitan are a , and the results of the analys i s per formed thereon , can be extrapolated to other metropol itan areas . Nevertheles s , the results obtained from th is measurement program are s igni ficant and could af fect the mathematical mode� ing for multipath interference as we l l as other aspects of mobile communication theory , if they can be shown to be universally appl icable for all metropo l i tan areas .
NASA Propagation Studies . E f forts to de � cribe the distr ibution o f atmo spher ic attenuat 1on in the presence of rain in the SHF region ( 3 to 3 0 GH z ) have been an ongoing e f fort at ITS for several years . A hi atus of a few years in this e f fort , however , and the deve lopment of s imilar mode l s by other laboratories led to a renewed ef fort to refurb i sh the " DuttonDougherty " ( DD ) model , to extend its range o f prediction f rom 0 . 0 1 % ( corre sponding t o system availabil ity requirements of 9 9 . 9 9 % ) to 0 . 0 0 1 % ( c orre sponding t o system availability require
ments of 9 9 . 9 9 9 % ) of an average year , and to compare i ·t with these o ther models .
8 4
The extens ion o f the model for Washington , DC , and compar ison with two years ' worth of data taken from the Communications Technology Sate l lite (CTS ) , operating at 1 1 . 7 GHz and at an elevation angle o f 29 degree s , i s shown in Fi gure 3- 2 4 . The s o l id center curve o f F i gure 3 - 2 4 , marked " 1 , " represents ave rage year attenuation d i s tribution prediction s . The two sets o f solid curve s s urrounding the center curve represent 9 0 % and 9 9 % confidence interval predictions of the year-to-year variabil i ty in the distr ibution . The das hed- line curve , marked " 2 , " represents the two years o f data from Washington , DC . The relative ly good agreement between data and prediction s , as well as the improvement over the ear l ier DD model ( to 0 . 0 1 % ) is encouraging , but many more years of data would be required before the val id ity of the model is really known . In a realistic environment , however , the model w i l l probably have t o b e accepted or re j ected based on limited data . A survey o f a number o f recently developed drop s i z e distribution and attenuation coe f f icient assumptions did not produce predictions apparently as good as that of Figure 3 - 2 4 with respect to comparison o f predic ted and observed di stributions at Wa shington , DC . Two models for the extens ion to 0 . 0 0 1 % have been derived . One of these was based on a heur i s tic extrapo lation of the model ' s assumption for path rain fall inhomogeneity from the 0 . 0 1 % level to the 0 . 0 0 1 % leve l . The second mode l , which was used to obtain Figure 3- 2 4 , is based on a more r igorous , theoretical mode l . Both models , however , gave very comparable predictions i n the Washington , DC , 1 1 . 7 GHz case .
The goal o f Engineering Mode l s (VHF/UHF for Broadcast and Mobile ) i s to deve lop , cri tique , and dis seminate useful mode ls o f radio propagation . This year ' s model concerns a generali zed context for the treatment o f propagation variability and propo ses a new way to compute the statistics a de s i gner require s . We have used the term s i tuation to de scribe where , when , and how equipment is to be deployed ; an l to the well estab lished time variability and location var iabil ity we have added a s ituation variabi lity . This is the variabil ity observed when one changes from one s ituation to other " s imi lar" situation s . Previously , th is third vari abi l i ty has been called " prediction error " and " conf idence , " terms which we beli eve are confusing and not entirely descriptive of the proces s . I n addition , w e have sugges ted definite mean ings for the terms " conf idence " and " reliability " s o that we would speak o f the confidence with wh ich a proposed new sys tem will enj oy a spec i f ied reliabil ity .
3 . 3 . 2 . Ionospheriq Transmi s s ion Models
Polar Ionospheric Mode l ing . The polar ionospheric mode ling e f fort i s based upon updating an average or , more accurately , a median spec ifi cation of the polar ionosphere . This median specif ication follows largely from the numerical coe f f icients given by the CCIR ( C C I R Report 3 4 0 , 1 9 7 8 ) that also form a ma j or part of the HF propagation prediction program given by Barghausen et al . ( E S SA Tech . Rept . ERL 1 1 0 - ITS 7 8 ) . The polar model contain s parameters that characterize the ion i z ation distribution in the various height regions of the

0 w 0 w w � w (f) <( (f) (f)
1 0
(_) (f) 0 . 1 m <( w � I-I-z w 2i 0 . 01 w Q_
WASHINGTON, DC EL. ANGL E 29° F R EQUENCY 1 1 . 7 GHz
G) AVE R AGE Y E A R PREDI C T ION
@ OBSERV E D D I S T R I BU TION
O . OO l 'L------L--�--�-----L��--�--���--�
0 1 6 32 48 ATMOSPH ER IC AT TENUAT ION, dB
F igure 3 - 2 4 . Predicted ver sus observed attenuation d i s tr ibution u s ing the DuttonDougherty model to 0 . 0 0 1 % . Curve 1 is the average annual distr ibution prediction , with other curves predicting 9 0 % and 9 9 % conf idence bands of year-to-year d i s tr ibution var iability as indicated . Curve 2 r epresents two year s ' worth of data observed f rom the CTS sate llite .
8 5

ionosphere . The parameters are spec i f ied in 1 . 5 ° degree increments between 12 and 7 6 . 5 ° N latitude and 0 . 5 to 1 2 0 . 5 ° W longitude .
The critical frequency o f the E regio n , foE , is determined from the coeffi cientp developed by Leftin ( OT Report 7 6 - 8 8 ) . For a given month , median values of foE are generated at any universal time by spec i fying the Z urich sunspot number .
The height o f the E region maximum density i s given b y a formulation that a l lows the height to di splay a smooth transition from day to ni ght conditions . The daytime values o f the he ight of the E region maximum is 1 1 0 km and the nighttime value is 1 2 0 km .
The semi-thickness o f the E region is determined by dividing the he ight of the E region maximum dens ity by 5 . 5 .
The critical frequency o f the F l region i s given b y the model o f Ro sich and Jones ( OT Rept . 7 3 - 2 2 ) . Values o f foFl are determined for a l imited range of solar zenith angles so as to be in accord with observations .
The height o f the Fl maximum density and the semi-thickness is given by
hmF l YmFl
1 6 5 + . 6 4 2 8 X , x is solar z enith angle hm/4 .
These parame ters are in accord with those given in the IONCAP HF propagation prediction program .
The F2 region critical frequency , foF 2 , i s determined us ing the coef fic ients d eveloped by Jones and Obi tts ( OT Rep t . ITS RR3 ) . Va lues o f foF2 are obtained for any month , universal time , and sunspot number .
The height o f the F2 region i s determined using the relationship developed by Bradley and Dudeney ( 1. 9 7 3 , J. Atmos . Terr . Phys . , 3 5 ) . The semi-thickness o f the F 2 regio n is determined by subtracting the value of the F region virtual he ight from the value of the F 2 region maximum he ight .
Values o f foE , foFl , and f oF 2 scaled f rom ionograms are used to ad j us t the median values of the critical frequenc ies . S imple additions or subtractions to the median data f ields are made in order to minimi ze the d i f ference between monthly median values for a given hour and the observed values for that hour .
There are a number o f features in the polar ionosphere that characterize it and distinguish i t from o ther regions of the ionosphere . It
are obtained from the World Data Center A .
I t i s assumed that , during ni ghttime hours immed iately to the south of the auroral ov�l there exists a trough o f ion i z ation . The northern boundary of the trough is taken to coincide with the southern boundary of the oval . The southern boundary o f the trough i s set at a variable number o f degrees south o f the northern boundary . The location o f the southern boundary and the depth o f the trough can be vari ed so that the values o f foFe in the trough and the latitudinal extent of the trough can be made to agree with avai lable observation s .
The model o f the auroral E region follows closely the work of Gas sman ( 1 9 7 3 AFCRL Tech . Rpt . TR- 7 3 - 0 1 5 1 ) . The critical frequency of the auroral E region i s determined in terms o f a maximum value o f the critical frequency foEa max according to the Q index . The Q index not only specifies the maximum value of foEa it also spec i fies the location of the bound�ries o f the auroral E region . Observations o f foEa obtained from vertical �ncidence sounding data can be used to corroborate the values of , and locations o f , foEa determined f rom the model . S ince the model o f foEa i s specif ied in terms of Q only , any large dif ferences between model and obs ervation can be minimi zed by using a value o f Q in the model that yields results agreeing with observation . I n other words , the value o f Q can be adj us ted in order that the foEa model yields results that agree with observation . In the absence of any vertical inc idence data , the value o f Q provided by the World Data Center A drives the auroral E region mode l .
A given value o f Q spec i f ied the location o f the auroral E region which i s tied t o the location of the auroral oval . The location o f the auroral oval is determined in corrected geomagnetic coordinates which are converted to the appropriate geographic coordinates in order to effect the calculations .
The formulation for the auroral E reg ion is given as fol lows :
1 .
2 .
foE a max
foE a max 2 . 5 + Q O < Q < 2 . 7 9 7 Q 1 2 . 7 < 0.::_4 . 2 5 5 Q > 4 . 2 .
foE a at any point , <I> A greater than
foEa = foEa max - . 4 foE max
( <J>N - <l>m]
<Pm
3 . Lati tude o f northern boundary <PN ' i s equal t o o n e half the d i f fe rence between the northern and southern boundary of the oval plus the southern oval boundary .
is the characterization o f the se features that form the maj or e f forts undertaken in this e f fort . Many , if not all o f the f eatures of the polar ionosphere c an be specif ied in terms o f spec ific shapes or ovals . The pr imary shape tha t is used in thi s e f fort is the oval shape that characterizes the s tati stical occurrence of the v i s ible aurora . The auroral oval as characteri z ed by Feldstein and S tarkov 5 . ( 1. 9 6 7 , Planet . Space S c i . , 1 5 ) i s used to set
4 . Latitude o f southern boundary <P i s equa l to the southern boundary o f the oval�
the principle features o f the polar ionosphere . Spec ific values of oval activity o r Q values
Latitude of foEa max
Q > 3 . 0
Q < 3 . 0
8 6

a . If � = � ( Q > 3 . 0 ) , there �re no values o f foEW to tfle south o f �m · I f � = � + 1 , the value o f foEa one degree s�uth 5f � i s taken as 0 . 6 foE max. m
6 . hmEa max
hmEa max 1 8 5 - [ foEa max - 2 ] X 3 5 ,
2 . 5 < foEa max < 3 . 5
1 4 5 - [ foEa max - 3 ] X 1 0
foEa max > 3 . 5 .
7 . hmEa a t any point �A greater than �m
hmEa = hmEa max + l O [ �A - �m]
[ �N - �m]
a . When Q < 3 . 0 , there is a value of foEa occurring to the south of foEa max . At that point ( equal in latitude to � s ) , the value o f hmEa i s s e t equal to hmEa max + 1 0 .
8 . ymEa = hmEa/ 3 .
The absorption mode l developed b y Foppiano ( CC I R Supplement to Report 2 5 2 - 2 , 1 9 7 8 ) has
been incorporated into the computer code and is u sed as the basis of the auroral absorption mode l .
The absorption mode l developed by George and Bradley ( 1 9 7 4 , ITU Telecomm . J . , 4 1 ) is used a s the basis for the normal absorption o f HF radio waves .
The E region irregularity mode l developed by Gas sman ( 1 9 7 3 , AFCRL Tec h . Rept . TR- 7 3 - 0 1 5 1 ) forms the basis o f the initial E region irregular i ty mode l .
A program o f polar ionospheric modeling s upport has been undertaken . The e f fort c enters around updating median models o f the po l ar ionosphe�e with actual observations . The parameter s that character i z e the polar ionosphere are :
foE hmE YmE foFl hmFl YmFl foF2 hmF 2 YmF 2 E region irregularity indicator F region irregularity indicator Northern aurora l oval boundary Southern auroral oval boundary Northern trough boundary Southern trough boundary .
Prediction techniques for area c o�erage of HF Communication Systems . I t l.S often useful to have ionosperic propagation pre
dictions pres ented i n a form to a s s i s t i n the
e s timation of geographic coverage of a g iven
frequency at a given t ime and with a spe�i f ic
antenna . Predictions such as the MUF , Cl.r
cuit reliab i l i ty , s ignal- to-no i s e ratio , and
median f ield s trength could aid HF broad
casters and o thers if presented in a geographic latitude- longi tude matrix di splay for
87
spec i f ied areas of the world . The model ing e f fort reported here i s the resu�t o f a task to develop s uch a geographic latitudelongitude display of ionospheri c propagation predictions .
The task consists o f deve lopment o f a procedure to generate a geographic area cbverage representation of ionospheric characteristics g iven a spec ific area . The area i s identif ied by e i ther a code v1hich targets a predefined geographic area or by speci fication o f the latitude and longitude boundar ies o f the area . The ionsopheric propagation predictions are computed at the boundary locations o f the grid and at incremental locations within the grid . The area coverage representation consists o f the display o f the se predictions on a matrix grid for each frequency and each hour for a spec i fied month and antenna . The area coverage representation , therefore , consists of the predictions o f several point-to-point communication paths on a rectangular grid .
The implementation al lows the f lexibil ity to ident i fy the construction of rectangular grids where : ( 1 } a spec i fic transmitter location is used to commun icate with each receiver location on the grid , ( 2 ) each location on the grid is cons idered a transmitter and i s used to communicate with a spec i f i c receiver location .
The Ionosperic Communications Analys i s and Prediction Program ( IONCAP ) i s
-used to
compute the ionospheric propagation predictions for this e f fort . The procedure consists of development of a processor to generate the input to the IONCAP program based on the specific grid to be constructed and a processor to generate the geographic grid from the IONCAP prediction s . There are distinct advantages to this procedure . The IONCAP program is a point-to-point communicat ions program and does not directly construct area coverage grids . The input proce s sor generates the geographical area as a set o f point-to-point communication paths that IONCAP can use wi thout ma j o r mod i fication to the IONCAP program . The IONCAP program is utili zed more e f fectively by evaluating a particular point- to-po int path at all specif ied hours and frequencies rather than all point-to-point paths at a s ingle hour and frequency . It is also more e f fic ient to compute all de sired propagation predictions ( i . e . Maximum U sable Frequency , (MUF ) , f ie lds trength and s ignal-to-noise ratio) for a particular path rather than the prediction o f e a c h parameter f o r all paths . That i s to say , the IONCAP program does not compute the prediction s in the same order as is needed by the geographical area coverage model . The output proce ssor , therefore , reads the IONCAP predictions and generates the des ired area coverage grid .
The u . s . Army Communications Research and D,evelopment Command ( CORADCOM) is concerned with ' estimating channel characteri s tics for the des ign of ground-to-ground mobile spreadspectrum communication systems . Potential deployments inc l ude varied terrain and foliage .

In support o f this concern , the Wideband Measurements pro j ec t has acquired a set of data and i s presently developing techniques to analyze them . The data were measured during October 1 9 7 9 in south central Tenne s see where a fores t management program provided an exce llent test environment . The measurements obtained were a digiti za tion of a direct repre sentation o f the impulse response function derived from a pseudo-noise channel probe with a 3 0 0 MHz bandwidth . The center frequencies were at 6 0 0 , 1 2 0 0 , and 1 8 0 0 MH z .
In F i gure 3 - 2 5 we have reproduced a s i ngle recorded impulse response . The propagation path began with a transmitting antenna bur ied in the fores t and ended at a receiving antenna on a tower about 8 m above the fore s t top and about 1 6 0 m away . The figure shows both the co-phase and quadrature phase components and has been norma l i zed so that ( 1 ) the onset o f the function i s at a f ixed point and a long noise record in the tail has been dele ted , and ( 2 ) the total apparent energy o f the response has been f ixed . If one measures from the time when 5% of the response energy has been recorded to the time when 9 5 % has been recorded one f inds a delay spread of 1 8 0 . 4 n s . S imilar values were obtained on other fore s t penetration paths .
F igure 3- 2 6 i s the spectral respon se function corres
-ponding to t.he impulse response func·tion
of Figure 3 - 2 5 . I t has been normali zed by subtracting- out the e f fective pulse of the pseudo noise probe . We seem to have measured frequency selective fading over a band that i s about 2 0 0 MH z wide , and we have done that in a fraction of a second .
The Use of Theoretical Model s to Improve Global �� �� foF 2 . Maps of monthly median ionospheric parameters valid for the entire globe form the bas is for a number of emp irical and s tatistic al model s of the ionospheric electron d ens i ty . The accuracy of such models is therefore tied directly to the accuracy of the maps of the ionospher ic parameters . Map s of the critical frequency o f the E region , foE , the critical frequency o f the Fl region , foF l , and the critical frequency o f the F 2 region , foF2 have been employed in one form or another to determine ionospheric s tructure , HF propagation condition s , and transionospher ic propagation factor s . S tud ies have been reported describing how the global maps of monthly median ionospheric parameters can be modif ied wi t.h daily ionospheric observations in order to more reali stically repre sent the daily variations in ionospher ic s tructure .
The global maps o f iono spheric parame ters are generated from numerical coeff icients obtained by per forming a spher ical harmonic analysis on observed monthly median values of foE , FoFl , and FoF 2 . The resul tant accuracy of the maps is dependent upon the geographical d i s tr ibution of the data that were used in the generation of the coef f ic ients . The data, foE , foE l , and for foF 2 , that were used in deve lop ing the global maps were obtained from between 1 0 0 and 1 5 0 ver tical inc idence ionosonde s tations that operated throughout the world . These s tations provided observations that permit a reasonably accurate map of the ionospheric parame ters at
8 8
the se locations for which data were ava i lable . At locations for which data were non-exis tent , such as for o cean areas , the accuracy o f the maps is que stionable .
It has long been appre ciated that the uncertainties in the maps of foF2 are the larges t source o f potential error in any ionospheric model that uti l i ze s global maps of median ionospheric parameters . This i s due principally to the fact that the F 2 region i s the mo st variable of the ionospher ic regions displ aying large changes on both temporal and spatial scale s . The var iations in the F 2 region are the manifestation o f complex interactions between neutral and ioni zed cons tituents at ionospheric heights , the dependence of F 2 region phenomena upon the geomagnetic field , and the inf luence o f the magnetosphere on the ionosphere . The var iability o f the F 2 region renders it diff icult to extrapolate observations o f foF2 at one location to another location with a degree o f accuracy that is commens urate with extrapo lation procedures employed for the E and Fl region s . In order to rectify thi s s i tuation s omewhat , it was decided to employ a theore tical model of the ionosphere to generate value s of the F2 region criti cal frequency in low and midlatitude parts of the world where obs ervations of foF2 are unavailable . The values o f FoF2 determined from the theoretical model were then combined with actual observations of foF2 and , in some instances , with values o f foF2 determined from the existing sets o f coef f icients . 'I'he se data then formed the basis for re-generating ·the numerical coe f f i ci ents that y i e l d global maps o f the F 2 region critical frequency for spec i f i c months . The resultant maps provide a means to speci fy foF 2 on a global bas i s that i s cons i s tent with obs ervation and with the phy s ical understanding about the s tructures o f the low and mid- latitude F 2 region and the causes of its large- scale var iations .
Wideband Radio Over-the-Horizon Link Des ign . In order to improve the e f f ic iency o f designing beyond-the-hori z on radio l ink s , ITS w i l l provide a n automated , interact ive set o f de sk-top- computer programs which wil l permi t workers with moderate skill leve l s to perform the calculations nece s s ary for the des ign o f beyond-the-hor i zon microwave l inks for both FM/FDM and PCM/TDM systems . The programs are to be provided with documentation which will permit them to be easily operated , understood , modi fied , and updated .
The models used will cover over-the-hori zon l inks operating between 40 MHz and 1 0 GHz . The model s will not cover any of the ionospheric modes which occasionally are opera-tive at the lower end of this f requency range . The programs will not cover mixed modes of radio propagation such as are obs erved in cases where dif fraction and tropospheric s catter modes occur alternately or at the s ame time . The pro j ect i s sponsored by USA CEE IA .

RUN 008
FRAW£ 3 791 1 0 1 1 1 . TEST S I TE 0 1
1 5 . 46 . 48 .
600 t.t-iz
- 59 . 7 dBW
1�----�------�------�------�----��----�------�------�----�
0 1 00 200
Nanos econds 300 400
F igure 3 - 2 5 . The co-phase and quadrature pha s e components o f an impulse respons e after t h e wave h a s traveled into a forest .
20
"' 0
- 20
� �
.-'�
\i ( tvv
520 540
�
\ / v � ('""
� �
580
A £" /'!_
I V\ I!\ I � J vv v � �
N v I v
620 640 680 700
F igure 3 - 2 6 . The spectral response corre sponding to the above impulse re sponse .
8 9

SECTION 3 . 4 . PREDICTION OF TRANSMISS ION PARAMETERS AND SYSTEM PERFORMANCE
Completed engineering model s for EM wave transmi s s ion calculations are delivered to sponsoring and requesting agenc ies for their use . Fol lowing are repres entative uses o f these services .
3 . 4 . 1 . Long-Term Ionospher ic Predictions
Propagation Predictions for the WARC on HF Broadcast ing . The World Admin i s trative Radio Conference ( WARC ) , Geneva 1 9 7 9 , reques ted the CCIR " to adapt the pre sent method of propagation predictions in order to make it more s ui table for use in planning broadcast ing . " S tudy Group 6 of the CCIR has set up an Interim Working Party ( IWP ) 6 / 1 2 in response to this reque s t . The u . s . has accepted the chairmanship of this IWP with fol lowing obj ectives :
( 1 ) to s tudy the requirements for propagation prediction methods for use at the HF Broadcasting Planning Conference ;
( 2 ) to cons ider the available methods of propagation prediction at HF , and to cons ider relevant information now being s tudied by Interim Working Party 6/1 and Interim Working Party 6/3 which are suitable for planning purposes ;
( 3 ) to propose and evaluate the most suitable propagation prediction method for use at the planning conference ; and
( 4 ) to recommend the mos t suitable values o f solar activity index for use with the proposed prediction method .
Under u . s . chairmanship ( Donald L . Lucas ) , the IWP has conducted three meetings--Estes Park , Colorado , January 1 9 - 2 1 , 1 9 8 1 ; Darms tadt , Germany , May 18- 2 0 , 1 9 8 1 ; and Geneva , Switzer land , August 2 0 - 2 1 , 1 9 8 1 . Thirty- three Adminis trations and operating organi z ations are partic ipating in the work of IWP 6/12 , and more than 2 0 have attended the meetings . The ITS e f fort has been in the preparation of material for cons ideration at the meeting s , conducting the meetings , the inves tigation o f contr ibutions between mee tings , and the preparation o f a report for consideration by S tudy Group 6 . In response to the obj ective s , the fol lowing deci s ions have been reached :
( 1 ) Requirements for prediction methods : The basic requirement i s for a f a s t field-s trength prediction method . The prediction o f the monthly median o f hourly median field s trengths is e s sentia l . The accurate prediction o f nighttime fields require s spec ial cons ideration ; and the prediction of Maximum Usable Frequenc i e s , e ither as part of the field- s trength prediction method or as a part o f cull procedures , i s nece s sary .
9 0
( 2 ) Avai lable Method s : Mo s t Administrations have s kywave propagation prediction methods , either unique or some adaptation o f the methods of other Administration s . Methods of international acceptance ( CCIR) are those o f CCIR Report 2 5 2 - 2 and Sup . 2 5 2 - 2 . Another method of e s tabli shed usage is that o f the Federal Republic o f Germany .
( 3 ) Mos t Sui table Method for the P lanning Conference : Considerable e ffort was devoted by ITS to adapt the CCIR 2 5 2 - 2 method to assure rapid , e f fic ient use on computers . IWP 6/12 has accepted this e f fort for circuits out to 7 0 0 0 km and has recommended the use o f the highly empirical FTZ method at the greater distance s .
( 4 ) Solar Activity I ndex : Values o f 1 2 -month , moving average Zurich sunspot number are recommended as a suitable solar activity inde x . The actual value s are dependent upon the number of solar activity epochs used in planning the use o f the high frequency bands allocated to the broadcast service .
The Voice of America requires regular predictions o f "circuit " performance as an aid in planning appropriately for the continuation of i ts worldwide HF broadcasts .
The Radio Propagation P redictions pro j ect provides the VOA every second month with HF circuit per formance predictions for about 1 8 0 broadcast circuits e ight months in advance . For about 1 5 0 of these circuits ( from Tinang , Kavala , Greenville , Woo ferton , Monrovia , Munich , and Tangier ) , the prediction s inc lude selec tion of optimum transmi tting antenna .
Computer fi les have been maintained for local batch processing and for use by VOA from a remote terminal . !nteractive preparation o f data f o r the predi ction programs i s po s s ible .
During f i scal 1 9 8 1 , HF radio propagation predictions were provided routinely to ITT World Commun ications , the Ame ri can Radio Re lay League ( for publ ication in QST ) , TRT Telecommun ications Corp . , and NOAA ( SEL) . Predict ion s were also made for Crawford International ( to' be a monthly sub s criber in FY 1 9 8 2 ) ; Canadian Marcon i ; BR Communication's ; Dr . W . A . Kissick o f ITS ; Page Commun i cation s ; S ander s Associates ; Magnavox ; General Dynamic s ; Smith Electron ic s ; Morri son-Knud sen ; Hughes Aircraft .
VOA HF Propagation S tudie s . The Institute has provided s upport to the Vo ice of America [VOA] in the areas o f HF propagation predic
tions and operational s tud ies for a number of years . · This s upport has continued through thi s · year . The Institute has provided circuit performance predictions for over 1 8 0 VOA broadcast c ircuits . These prediction s are used by the Voice o f America i n the scheduling of frequencies for broadcasts . In addition the Institute has provided VOA with a remote access to its computer programs that

are used to determine HF propagation condit ion s .
Spec i f i c studies have been undertaken by the Institute in support of Voice of America preparation for the 1 9 8 4 HF Broadcasting WARC . A study to determine the optimum duration o f a broadcast schedule h a s s hown that the curr ent schedu l ing practices of the VOA - changing f requencies four t ime s a year - are about idea l . A s tudy has also been undertaken to determine the power needed by a broadcast transmitter to provide a s ignal level o f 6 0 dBu t o a specif ied d i s tance away from the transmi tte r . The results of this study have been contained in a document prepared by the Vo ice of America and s ubmi tted to the CCIR for its S tudy Group 1 0 meeting . F igure 3 - 2 7 prov ides a summary o f the results of this study . S hown on the f igure is the power necessary to provide a 6 0 dBu as a function of distance f rom a 1 kW transmitter for at least 5 0 % of the t ime (which i s typical of a n ighttime operation ) and for 9 0 % of the t ime . The se results are being used by the Vo ice o f America to a s s i s t in determining their position on the transmitter power that is neces sary in order to p rovide good l i s tener qual ity service .
The Ionospher ic Communications Analysis P redict ion P rogram ( IONCAP ) is the mos t recent o f t h e H F prediction programs deve loped at the Institute for Telecommunicat ion Sc iences ( ITS ) . The computer program i s a n integrated sys tem o f subrou�ines des igned to predict high- frequency ( HF ) sky-wave sys tem performance and analyze ionospheric parameter s . These computer-aided predictions may be used i n the planning and operation o f h igh-frequency communication sys tems u s in g sky-wave s .
I n the initial planning or i n the mod i f i c at ion o + many commun ication sys tems there may be an appreciable delay between the c ircuit p lanning and the actual circuit construction or modif ication . This i s of p articular impor tance for high-f requency ( HF ) circuits which have marked time and
geographic variations in optimum frequency , required power , and system performance .
P redictions of iono spheric characteristics and techniques for u s ing the s e c haracteristics are avai l able and may be u s ed to anticipate the performance o� HF communic at ion circuits and thereby provide the l ead time for necessary equipment select ion , f requency selection , and frequency and time- sharing arrangement s .
Specif ic mode l ing e f forts included i n the IONCAP program are :
1 . A comp le te exp l i c i t e l ec tron dens i ty p ro f i l e . Wh i l e this f unction i s not mea s urable , the i ntegration of the pro f i l e to g ive an ionogram i s . These prediction ionograms have been checked against measurements .
9 1
2 .
3 .
4 .
For oblique ray paths , Martyn ' s theorem has been corrected for a curved ionosphere . The correction wa s derived to as sure agreement with full ray tracing us ing the same electron dens ity profile .
Expl icit sporadic E modes have been added to the program . The model is composed of s ubparts which have been der ived f rom and tes ted against measurements over the past 3 0 year s .
A revised median loss mode l has been created . The s ame basic equation is u sed , but an additional term i s added for E mode s , and a revis ion of the col l i s ion frequency term for modes with reflection he ights within the absorbing region added . Also , a deviative loss term is added to high angle modes ( these are also an addition to the program) . The revision as wel l as the total loss equation was compared to f ield strength measurement s .
5 . An MUF model has been added \vhich directly calculates the values rather than searching for the correct value . The complete e lectron density pro f i le is used . The distr ibution of the MUF over a specif ied month for each po s s ible layer is now inc luded .
6 . The distribut ion o f transmi s s ion loss has been extended to vary with each operating frequency and with each type of mode . This allows the extens ion o f statistical sys tem per formance upward in frequency .
7 . Some mod i f ications to the antenna models :1ave been made , the most sign i f icant be ing for vertical antennas which are e lec trically short .
8 . The complete set o f mode l s for long path s , as des cr ibed above , have been added .
A ma j or e ffort is currently in progre s s to rep lace all o f the antenna models used in the IONCAP program .
The IONCAP program or calcul ations using the program are avai lable f rom the Propagation Predictions and Model Deve lopment Group of the App l ied Electromagnetic S c i ence Divis ion of ITS . The program has been s upplied to several foreign and domestic government agencies and to the private sector .
Ground-Air Propagation . The Ins titute has developed numerous HF propagation prediction codes over the years . For the mos t part these codes have been somewhat complex in keeping with the complex nature o f the propagation medium itsel f . Recently an e f fort was initiated to deve lop a rapid method to s imulate the performance o f

� IV
1 40..----�---r------.---�-�--.,---,-----r-----r-----,
3: .:X: .....-
w 6 100 (!) <( -(!) '"'0 -0:::: w 3: � 60 0 w 0:::: � 0 w 0::::
20 I I 1 000 3000
250 kW, 15 d B ANTENNA --
50 kW, 8 d B ANTE NNA
5000 DISTANCE ( km)
7000
F igure 3 - 2 7 . Required power for 60 dBu ; all circuits , P> 5 0 % , P > 9 0 % .
10000

ground-to-ground and ground- to- air HF systems . The obj ective of the s tudy is to provide a computer code that can be used as part o f more sophi st icated codes to undertake system design studies and operational trade-o f f analyses .
3 . 4 . 2 . Medium Frequency Transmis s ion S tudies
MF S ky-wave Propagation . The h i gher powered AM S tations south of the U . S . border have caused interference to some u . s . AM broadcast s tations . Current accepted prediction models tend to undere stimate field s trengths in the We s tern Hemi sphere . To remedy this the Institute in cooperation with the Federal Communi cations Commi s s ion e s tabl i shed an MF sky-wave monitoring f ield s i te at Cabo Roj a , Puerto Rico to actually observe s ignals from the more souther ly South American s tations . This capab i l i ty provides data with sky-wave ref lection points below 3 0 ° north geomagnetic lati tude whic h , in the long term , wi l l yield i nformation so that the e f fects o f f requency , geomagnetic latitude , ionospher i c loss , and solar activity on the performance of long distance MF s i gnals can be properly evaluated . This in turn would l ead to a real i s ti c MF sky-wave prediction mode l .
At the Puerto Rican s i te sky-wave s ignals were observed from several South American AM s tations on h ighly directional antennas . I n some c a s e s s ingle s tations were audible o n g iven channe l s . Those ident i f ied appear i n Tabl e 3 - 2 . In addition , frequenc ie s on which there were known high powered s tations from Europe and Africa were moni tored . Carriers were observed on s everal European channels but no heterodyne s were observed when tuned to local broadcast s .
FCC MF Measurement s . I n support o f a program of analys i s des igned t o provide quantitative predictions of trans-equatorial interference from South Amer ican MF broadc ast s tation s , equipment was designed and developed with which actual s igna l s from representative s tations could be recorded . This fully automatic equipment has been in operation i n Puerto Rico since spring o f 1 9 8 1 , and i s expected t o b e maintained for approximately one year . S i gnal s trength data for several identif ied s tations in South America are recorded on digital tape . P�riodic audio recordings are also made to provide a continuing conf i rmat ion o f each s tation by call s ign and to provide as surance that s ignal s trength from records are for c lear c hannel reception , i . e . , from a s ingle s tation who se location and operating parame ters are unambiguous .
The Puerto Rican s i ting was se lected to provide a southerly ( Northern Hemi spher e ) location to avoid s ignal s of marginal s trength . The automatic receiving and recording equipment was f ir s t s i tuated at the Roos eve l t Roads Naval S tation in eastern Puerto Rico as a convenient government s i te , adequate ly protec ted and wi th available base services for changing and mai l ing the data tapes . S ince no direct ional antenna was ava i lab l e - - nor could be provided within the s cope of the proj e c t - - a loop antenna was u s ed . The data
9 3
thus acquired suf fered from some ambiguity , both in c lear iden t i fication of the broadcast s tations rece ived and in the reception of more than one s tation on one frequency . A resolution to the se d i fficulties was accompli shed with the discovery of ( and subsequent redeployment to ) an existing farm of Beverage directional antennas located at the National Wild L i fe Re fuge in the Cabo Ro j a Sec tor o f southwe s tern Puerto Rico .
Add itional equipment e lements were designed and cons truc ted with which the automatic recording rece iver could be matched to and switched among the Beverage e lements . These antennas had been installed by another government agency at an earlier date and later abandoned . I n setting up at the C abo Ro j a s ite , four o f s even 1 , 8 0 0 foot long Beverage antennas were determined to be in s ervicable condi tion for use as receiving antennas . These were checked , repaired , and connected to the automatic receiving and data recording system.
Trial operat ional tests were conducted to check out the entire sys tem and to select c andidate s tations for rout ine monitor ing . The Beverage antennas provided good reception from many South American s tations , and the final selec tion inc luded four s tations from south o f the magnetic equator .
Local interpreters were employed to help in the s tation s e lec tion and an operator was trained to c hange the recording tapes . Before departure f rom the Cabo Ro j a s ite , the system was placed in i ts automatic run mode to moni tor 1 0 s tations for one minute each at 10 minute interval s between the hours o f 2 3 0 0 and 0 6 0 0 local t ime .
The recording equipment consist o f a highquality , programmable MF receiver ; a minicomputer ; and digital and vo ice cas sette recorders as noted above . Various functions are control led by the computer inc luding frequency select ion , timing , and antenna selection . The t ime i s maintained by a batterys upported power source so that nominal power outages do not perturb future recordings .
SECTION 3 . 5 . APPLICATIONS
The constant s tudy of EM wave transmis s ion characteristic s , the development of up-todate theoretical and empirical mode ls , and the study o f real-world telecommun ication problems lead to s tate-of-the -art applications for telecommunication uses . This section deals with a variety o f programs which show the broad spectrum of applied electromagnetic s ciences .
3 . 5 . 1 . Antennas and Radiation
HF Radar Transponder Communicat ion . Inve stigations o f s emi-pass ive commun ication at HF . frequencies by means o f modu lation of backscattered radar returns were undertaken for the Naval Re s earch Laboratory CHURCH EYE program . This program was terminated before completion , and the various e lements o f the work at ITS proceeded no further than initial s tart-up .

"' "'"
f ( kH z ) T ime ( Local )
8 7 0
1 2 2 0
9 8 0 8 7 0
9 8 0 1 1 3 0
6 8 0 7 3 8
Table 3 - 2 Mon i toring S ummary for the Puerto Rico S i te
MONITORING OF MF SKY WAVES AT CABO ROJA , PUERTO RICO
Antenn a *
3
3
3 3
2 4 2 1
Audible AM S i gn a l s
YES
YES
YES YES
YES YES YES
( CARRIE R )
Recorded AGC/AM Audio
YES
YES
YES YES
YES YES YES YES
Mos t Likely S ta tion
LRA , BUENOS AIRES , ARGENTINA
ZYJ4 5 8 , RIO de JANE I RO , BRAZ IL
ZYH 7 0 7 , BRAS ILIA , BRAZ I L RAD I O CRES TOL GUAYAQUIL , ECUADOR Z YH 7 0 7 , BRAS I L IA BOGOTA , COLOMB IA HJBO ZAMBRANO , COLOMBIA BARCELONA , SPAIN
* ALL BEVERAGE ANTENNAS : 1 :::::: 9 5 ° T ; 2 :::::: 1 4 0 ° T ; 3 � 1 6 5 ° T ; 4 � 1 8 0 ° T
Power ( kW)
1 0 0
1 5 0
3 0 0 2 0
3 0 0 2 0
1 0 0 2 5 0

The obj ec tive s of CHURCH EYE were to uti l i z e sophi sticated digital process ing techniques in conj unction with a high-power USAF over-thehorizon radar to provide automatic target acqui s it ion and tracking for surface ships at ranges o f up to 1 5 0 0 nmi . An es sential element o f the program , as de f ined , was to demonstrate the sys tem facility in a s imulated , tactical environment , where the actual tracking data were to be passed in real time to Navy f ighting units in the surve il lance area by covert modulation of the radar transmitted s i gna l . The work by ITS was to provide resources for two coroll ary functions assoc i ated with this data transmi s s ion . These were to provide a unique iden t i f ication--at the radar data output--of each of several fr iendly forces in the area , and s econdly , to provide an incon spi cuous data return capability from these forces to the radar . Both o f these functions were to be provided by a ship-borne radar scatterer who se e f fective radar cros s section was to be modulated . The proce ss ing c haracteristics o f the coherent radar sys tem are such that the return me s s age data rate is nece s s ari ly quite slow ; the information content , however , wh i le vital is not overly complex in format .
The ITS e f forts i n this abbreviated program included overal l sys tem des ign , spec i f ication of the transponders to be cons tructed by an outs ide vendor , and initi ation of des ign work on a ship-borne broadband antenna . The ITS also conducted preliminary long- range tests o f a prototype system op erating between the Erie ( Colorado ) test s ite and the Naval Re search Laboratory MADRE over- the-hori zon radar at the Che sapeake Bay . Des ign and con s truction of a mu lti- frequency , very- lowfrequency modulator for use in the code generation o f modulation o f the transponder was also started .
Since the radar operates in a coherent mode , digital Doppler s ignal processing us ing fast Fourier tran s form techniques ident i f ie s targets in parame ters o f radar cross sec tion ( s ignal amp l i tude ) and Doppler frequency ( radial target velocity) . By p roviding a near
resonant antenna on the target ship whose contribut ion to the overall target radar cross section i s discernible , and by providing a mechanism for modulating the antenna cross sect ion , a s ignal c an be produced at the radar data output wh ich has the characteristic of an ident i f iable ps eudo target with a unique Doppler veloc ity . The Dopp ler width of th i s s ignal will b e determined b y t h e parameters o f the Four ier transform b e i n g u s e d and b y ionospheric propagation perturbations . The information data rate po s s ible with such a sys tem is determined by the Four ier recyc le per iod- typically , 1 0 to 5 0 second interva ls- -and by the number o f reso lvab le Doppler frequency " s lots , " wh ich in turn are determined by the factors noted above . ( C learly , an increase in the number of ident i f iable Doppler s lots increases the in formation content of a multipos ition code . )
The objective o f this work was to implement and eva luate the concept of this passive commun ication system under reali stic mi l i tary operating conditions .
9 5
Radio Interference Survey For A GOES Sate l l ite Receiving Terminal .
-The p urpose
o f this pro j ect was to make a radio interference survey at the Federal Of fice Bui lding in Kansas Ci ty , MO , for the Space Sc ience and Engineer ing Center . The terminal will eventually rece ive s ignals from GOES sate l l i tes located at longitudes o f 7 5 °W and 1 3 5 ° W . The s urvey wa s needed to provide assurance that the receiving sys tem would work at this site and not be seriously interferred with by o ther elec tromagnetic s ignals .
The equipment was assembled and tes ted at Boulder and transported to Kansas City , MO , and instal led on the top of the 1 9 - story Federal O f f ice Building during Apr i l 1 9 8 1 . The measurement equipment con s i s ted of the fol lowing items :
Spec trum Analyzer Synthes i zed Signal Generator X-Y P lotter Scope C amera Antenna Pos i tioner 5 ' Parabolic Antenna Helical-Conical Antenna .
Observations were first made with the broadband , wide beam width antenna and , when an interes ting s ignal was observed , the 5 ' parabo lic antenna with h igher gain and narrow beam width was used to locate the s ignal source to within 1 ° . Measurements were made and recorded with the X-Y p lo tter and scope came ra from 0 - 2 GHz to record all the s ignals present . The frequency range from 1 6 7 0 MH z to 1 7 0 0 MH z was of the mo st interest because the s ignal from the sate l l i te would be at 1 6 9 0 MHZ .
Recordings were made for a 5 -day per iod in Ap r i l 1 9 8 1 , and the measurements were scheduled such as to cover a per iod of the four daily 6 - hour time block s .
The frequency range from 1 6 7 0 - 1 7 0 0 MH z was free of s ig 1als except for three s i tings . Two of the s itings were from radiosonde s released from Monett , MO and Topeka , KS . The third s i ting was a local s ignal coming from an antenna located at the Kansas City Light and Power Company and appeared to be a harmon i c of the ir transmitted frequency . The direc tion of arrival and s i ze of the s ignals were such as not to interfere with the GOES reception . Data results and conclus ions were submi tted as a letter report to the sponsor .
3 . 5 . 2 . Transmi s s ion Through the Atmosphere : App l ications
HF Broadcasting WARC Studi es . The HF Broadcast ing WARC will be concerned with the deve lopment of pl ans to e f fective ly uti lize the HF spec trum that i s al loc ated for broadcasting service s . The Institute has undertaken a number of proj ects to assist in the preparation of the Uni ted States pos itions for the Broadcasting WARC . This particular pro j ec t is concerned primarily with the development of an improved HF propagation pred iction program for radio c ircuits traver s ing the high latitude s ; i . e . , the latitude s north o f 5 0 ° geographic . Many international broadc ast circuits with transmi tters

in northern European and desired rec eption areas in the Un ited S tates and Canada involve propagation of HF waves within and through the polar ionosphere . Physical processes that characterize the polar ionosphere can give r i se to enhanced fading and enhanced absorption o f s ignal s passing through the polar ionosphere . This can lead to a reduc tion in the quality o f service that i s provided on the c ircuits out o f Europe into North Americ a . Simi lar reductions o f service quality can occur on circuits from the 'To ice of America transmi tters in Greenvil le , �C , directed toward Europe .
In order to properly plan the use o f the frequenci�s al located to the HF Broadcasting Service , it is necessary to develop methods whereby the mani fes tations of polar ionospheric processes and the polar ionospheric s tructure can be taken into account . Th i s pro j ect h a s been direc ted toward incorporating sel ected features o f the high latitude ionospheric s tructure into the Ionospher ic Compat ibility and Analysis Program [ IONCAP ] . The IONCAP program
-can be used to determine
the predicted average performance o f a HF radio circuit in terms o f s igna l-to-noi s e ratio and circuit rel iabil ity . A method to spec ify the high latitude trough in F-region ion i z ation has been incorporated into IONCAP . This permits a more real is tic e stimate o f the decrease in maximum usable fr�quency that i s assoc iated wi.th the trough t o b.e calcul ated . In addi tion , a method to determine the enhanced absorption that i s characteristic of auroral activity along a high-latitude c i rcuit has been added into the IONCAP program . These additions enable IONCAP to be used i� planning future HF broacast circuits as well as assessing in a real i s tic manner the per formance o f existing broadcasting circuits .
Region � MF Broadcasting Conference . The Ins titute has been ins trumental in helping to prepare · the U . S . po s i tion in preparation for the Region 2 MF Broadcasting Conference . Institute members partic ipated in meetings in Wa shington , D . C . , Ottawa , Canada and Fortal e z a , Bra z i l to advise the International Frequency Registration Board concerning plans to test the compatibil ity and comparabi li ty of proposed changes to AM broadcast channe l ing .
The Institute participated directly in the development of versatile software components wh ich would predict interregional interference at s i te s wi thin the We s tern Hemisphere from high power transmitters loc ated in other parts o f the wor ld . Inc luded in this are routines to compute excess polar i zation coupling los s , sea ga in , and diurnal periods of total darknes s along a given path on the earth ' s surface . This entailed creating random acce s s data bases o f the h igh power stations in Europe , Africa and Asia , and We stern Hemisphere coastl ine in formation . A diagnostic computer program was also converted to the Institute ' s batch proce ssor . This program allows the Institute the capability o f evaluating dif ferent channel spacing scenarios , inclus ion of new stations in the free channels , and determining any interferences generated therefrom .
9 6

CHAPTER 4 . ADVANCED COMMUNICATION NETWORKS
Thi s Div i s ion c onduc ts a broad program of applied re search and analysis of advanced commun icat ion networks . Div i s ion programs inve s t igate technology options for develop ing compet i tive , lower cost communications networks to provide improved services and better resource u t i l i zation . Th i s r es earch incorporates techn ica l , economic , marke t , r egulatory , and po licy fac tors in an in tegrated fashion . The se s tudies , designed to a s s i st NTIA pol ic y , appl ications and spectrum programs , and the te lecommunicat ions research and app l ication s needs of other Federal agenc ies , are focused on three categor ie s :
Communication Protection ,
Switched Network s , and
Spec ial i z ed Networks .
E�c h of the sections below d i scusses tho se pro j ec t s that r e late to one of the above categor ie s , and a summary of progress and resu lts is g iven for each pro j ec t .
SECTION 4 . 1 . COMMUNICATIONS PROTECTION
The Communications Pro tec tion program wa s in itiated by NTIA in f i scal year 1 9 7 9 a f ter Pre s idential Direct ive PD- 2 4 designated the Secretary of Commerce as one of two Executive Agents . The Secretary delegated r esponsibility to the Admin i s trator , NTIA . The program is d ir ec ted by the NTIA Spec ial Pro j ec t s Off ice ( SPO) , a unit within the Of f ice o f Federal Systems and Spec trum Management in Washington . The SPO develops pol icy recommendations and conduc t s telecommun ication surveys o f the f ederal agenc ie s . Techn ical support func tions o f the program , inc luding sy s tem analyses , policy support , and survey suppor t , are performed by ITS in Boulder .
Pr e s idential D irec t ive PD- 2 4 provided c er ta in po l icy gu idel ines t hat inc luded :
1 . Government c l a s s i f ied information relating to national defense and foreign r e lations s hall be transmitted only by s ecure mean s .
2 . Unc l a s s i f ied i nformat ion tran smitted by a nd between government ag�nc ies and c ontracto r s that would be u seful to an adver sary should be protec ted .
3 . Nongovernmental information t ha t would be useful to an adversary s ha l l be identif ied and the pr ivate s.ector informed of the problem and encouraged to take appropr iate protective measures .
The Secretary o f De f ense , the o ther PD- 2 4 executive agent , has a s s igned the Nat iona l Security Agency (NSA) the respon s ibil i ty for pro tect ion of c la s s i f ied informa t ion , as we l l a s national s ecurity related unc la s s i f ied inf orma tion . The Department o f Commerce (NTIA and ITS ) is addre s s ing the protec tion o f nonnational security related , unc l a s s i f ied informat ion . Examp les o f this type o f information are a s follows :
9 7
o F inanc ial In forma tion
o P lanned c hanges in prime interest rates o Support of the dol lar in foreign ex
change markets
o Commodity Mar ket Forecasts
o Supply of Critical Mater ials
o S trateg ies for International Negotiation s
o Selec ted H igh-Tec hnology In formation .
The pr incipal threat to telecommunications information is the vulnerabil ity of both terrestrial and sate l l i te microwave radio to eavesdropping by foreign adversar ie s .
Although many a spects of the Communication s Protect ion program are classif ied , the following unclas s i f ied spec ifics ar� provided to offer an in s ight into FY- 8 1 efforts . The topic s descr ibed below fall into general work categor ies e stabl i shed within the program :
1 . Ref erence Microwave Propagation Loss Model
2 . DES and Federal Standards Efforts -Communication Protection Standards Pro j ec t
3 . Terminal Eva luation Pro j ect
4 . Ana log vs . Dig i tal Link Ana ly s i s - Common Carrier Networks Pro j ec t
5 . Public Key Cryptography and its Implementation - Public Key Pro j ect .
4 . 1 . 1 . Re f er ence Microwave Propagation Los s Model
In order to predict the propagat ion loss over po int-to-point paths in the 2 to 11 GHz frequency range , a refer ence microwave propagation loss model ha s been developed . This model i s u sed to compute the biased med ian estimate for the propagation los s . At microwave frequen c ie s , sign i f icant terrain feature s may b e treated as s harp knif e-edge obstac les . Any number of knife-edges may be found along any par ticular propagation path , but only a few of thes e knife-edges may be of signific ance in calculating the path attenuation .
All paths can be characteri z ed as one of three type s :
1 . radio l ine-of - s ight (LOS ) ,
2 . single hor i zon ( SH ) , or
3 . double hor i z on ( DH ) .
In the LOS case ( se e Figure 4-1 ) , t he transmitter and receiver are withrn-radio l ine-ofs ight of each other , yet the tops o f intervening kni f e-edges may approach c lose to the direct .ray . I n certa in situations this could c ause the signal to attenuate we l l below the freespace value . For examp le , with an LOS path having 4 knife -edges near the direct ray , it is pos s ible for the theoretical attenuat ion to be a lmo s t 14 dB greater than the free-

T T - Tra n smitter R - Rece iver
F igure 4-1 . Geometry for a l ine-of - s ight { LO S ) path .
9 8

space l o s s . '!'h i s phenomenon may account for some of the " unusual " LOS s ignal measurement s occas iona l ly obtained .
In a s ingle hor izon path ( s ee F igure 4 - 2 ) , one obsta c le or knife-edge serves as a common hor i z on f or both t he tran sm itter and receiver . Again , the tops of interven ing kni fe-edges may approach t he tran smitter- to-hor izon d irect ray and/or the hor i zon-to-rece iver d irect ray causing s ign i f icant e f fect on t he rad io signal . I f the intervening kn i f e- edges are all we l l be low the d irect ray s , the a ttenuation i s g iven by the s tandard s i ngle kni f e-edge d i ffrac t ion theory .
A double hor izon path ( s ee Figure 4 - 3 ) ha s separate hor izons for the tran sm 1tter and for the receiver . Of cour se , intervening knife-edges can occur anywhere a long the path , but it is apparent that t ho se in the m idd l e sec t ion ( f rom hor i zon to hor izon ) can have a n e spec ially s ignif icant e f fec t on the s igna l . These knife-edge s , if t hey occur , c an not only approach t he hor izon-to -hor izon direct ray f rom below� but can a c tually r i se above the ray reduc ing the s ignal even fur ther .
A mul tiple knife-edge d i f f raction theory ha s been der ived recently and a computer program wr itten to c alculate a ttenuat ion value s . The program w i l l accept up to 1 0 knife-edges and computes the resulting magni tude of the attenuation relative to freespac e . From the terrain pro f i l e o f t he path , the a n tenna height s , knife -edge obstac le he ights , and s eparation d i s ta nc e s are read in as input parameters together with the radio frequenc y . The program then selec t s t hose kni fe-edg e s which are sign i f ic an t and g ives the resulting attenuation as outpu t .
The referenc e l o s s model , based on mu ltiple knife-edge theory , s hould provide better e s t imat e s o f propagation l o s s t han t h e previou sly u sed inter im loss mode l , For many paths the results will be the same , but , e spec ially in t he case o f double hor i z on paths , the referen c e mod e l w i l l g ive more accurate results .
4 . 1 . 2 . DES and Federal Standards Efforts
On January 1 5 , 1 9 7 7 , the National Bureau of S tandard s t hrough i ts Federal I n formation P roc e s s ing S tandards Publ icatiQn ( P IPS PUB) 4 6 , announced the "Data Encryption Standard " ( DES ) . The DES spec i f i e s an a l gor ithm to be
implemented in e l ectronic hardware d evices and u sed for t he cryptographic protect ion of sen s i t ive , but uncla s s i f ied , informa tion .
Data to be c ryptographica l l y protec ted i s c a l l ed plain t ext . Encryption i s the proc e s s of trans forming p l a i n text i nto c ipher text ( or unintel l igible tex t ) . Decrypt ion i s the inverse of encrypt ion ; i . e . , transforming c ipher text into plain tex t . The DES i s a bloc k c ipher , or one which operates on f ixed s i z e bloc ks of symbo l s . Dur ing encryption it maps ( trans forms ) 6 4 -bit plain t ext input blocks into
5g4 -bit c ipher text output bloc k s .
There are 2 po s s ible mapping s . Each i s unique and invert ible . The spec i f ic mapping uti l i zed is d etermined by a 5 6 -bit keying var iabl e , which i s entered by t he u ser . In order
9 9
t o succe�sfully decrypt , one mu s t know whic h o f the 2 6 po s s ible keying var iables ( o r keys ) wa s u sed to encrypt the information . Thi s in formation is normally known only to the orig inator and the intended receiver of the encrypted message . In add it ion , with a properly des igned a lgor ithm , such as the DES , there are no known shortcut methods of determining the correct keying var iable , exc ept for exhau stive search of all po s s ible keys .
The I n s ti tute has been ac t ively involved in the development of standards related to use of the DES for telecommunications protect ion . Federal and Amer ican National S tandard s , as we l l as PIPS PUB ' s , are being generated which apply the DES . NTIA is supporting on-going efforts by other agenc ies , and ini tiating ef fort in areas not addres sed e l sewhere . As NTIA ' s tec hn ical arm for protect ion standard s , ITS has worked closely with the National Communications Sys tem (NCS ) , the Federal Telecommuni cations S tandards Committee ( FTSC ) , the National Bureau of Standards (NBS ) , the General S erv ic e s Admin i stration ( GSA) , and the Nat iona l Security Agency (NSA) .
The I n stitute was a strong supporter of NBS ' s PIPS PUB 8 1 , " DES Modes o f Operat ion . " This P IPS def ines the authorized modes under which DES devices can operate ; i . e . , electronic codebook , c ipher-block c hain ing , c ipherf eedback , and output feedbac k . It was approved by the Secretary o f Commerc e on October 3 0 , 1 9 8 0 .
Proposed Federal S tandards ( pFS ) 1 0 2 5 and 1 0 2 6 refer t o PIPS PUB ' s 4 6 and 8 1 and s tandardi z e interoperabil ity requ irement s for use of the DES in data communication s . pFS 1 0 2 5 s pec i f ie s the requ irements for the Network and Transport layers of the I nternational Organiz a t ion of Standardization ' s ( I S O ) Open Systems Interconnection Reference Model , whi le pF S 1 0 2 6 spec i f ie s the requirements for the Physical and Data L in k layer s of the ISO model . The Institute cooperated with the pr inc ipals of the FTSC to br ing the se proposed s tandards to the s tage where they have now been offered to the publ ic for comment through the Federal Reg i s ter . Approval of the s tandards is expec ted in FY 8 2 .
Federa l S tandard 1 0 2 7 dictates the physical secur i ty requ irements for devices employing the DES in a telecommun ication s environmen t . Approved b y the FTSC in May 1 9 8 1 , thi s standard brought to fruition years of work by ITS , NSA , GSA , and the NCS . Becau se of the spec.ial role the Department of Commerce plays in PD - 2 4 , Federal S tandard 1 0 2 7 s tates that all Federa l departments and agenc ies planning to use DES cryptographic equ ipment to cryptographica l ly protect non-national secur ity related informat ion shall coordinate the ir plans with NTIA . S uch coord ination is requ ired to insure that the secur ity provided by the Standard i s not degraded by improper implementation or use . The Institute prov ides the technical expert i se to al low other Government agencies to protect themselve s , and adhere to FS 1 0 2 7 .
Besides the support that ITS has provided for the S tandard s e f forts descr ibed above , work wa s initiated at the Ins titute to provide

H
F igure 4-2 .
F igure 4 - 3 .
'1' - Tran smitter R - Rec eiver H Common Hor i zon
Geometry for a s ingle hor i zon (SH) path .
T - 'l'r an smi t t er R - Rec e iver H
T - Tran�mitter
Hor 1. zon H - Receiver Hor i z on
R
Geometry for a double hor i z on (DH) path .
1 0 0

guidance for DES users in the areas of key generation and key d i str ibut ion . Ever since the original certif icat ion of the DES by NBS , the proper generation of keys f or sy stems usin g DES has been an important requ irement . De spite the substantial protect ion that the DES a lgorithm o f f er s , it i s r ecogni z ed that certain keys are l e s s d e s irable than other s , and c ould c once ivably cause a n undes irable impact on the e ffect iveness o f the DES based device ( i . e . , d ouble encryption o f p lain text usin g cer ta in keys will yield plain text , thereby compromi sing the entire cryptographic system ) . Proper key generation , then , i s e s sential . Saf e , convenient d i stribut ion o f k eying mater ial i s a l so a very real concern in e stabli sh ing an e f fective protect ion sy stem .
A proposed s tandard on key generat ion has been wr itten by the Institute . Th i s document i s v iewed as a good f irst draft f or a Federal S tandard and for an Amer ican Nat iona l S tandard . A proposed NTIA r eport w i l l d e scr ibe in detai l the s tandard ' s underlying foundation . Al though the r eport d emonstrates that the techn ical con s id eration s . o f the s tandard are pres ented in sound mathematical terms , t here i s a heavy empha s i s p laced o n observing engi neering principle s . Consequentl y , the standard is one wh ich can be easily implemented in o f f the-she l f hardware . In fac t , I T S has designed , constructed , and te sted an engineering model o f the standard i z ed key generator .
A follow-on to the key generat ion system development wa s a key d i str ibut ion system . A propo sed standard on c ryptovar iable d i s tr ibu t ion was wri tten , and w i l l be explained in a future NTIA report . Like the key generation s tandard , this s tandard wa s des igned to a l low relative ease of hardware formulation . Two prototype s were des igned and con structed by ITS , and wer e succ e s sfully te sted us ing basic , unconditioned telephone l ines . The d i str ibut ion system wa s integrated with the key generat ion system , then , to a l low a new key f or a communication l ink to be d i str ibuted e lec t ron ica l ly using a publ ic-key d i str ibution scheme .
4 . 1 . 3 . Terminal Eva luat ion Proj ect
One o f NTIA ' s r e spon s i bi l ities under PD- 2 4 i s to coordinate with a n d advise Federal agencies plann ing to cryptographically protect sen s i t ive non -national s ecur ity re lated informat ion to in sure that systems employing c ryptographic e quipment are correctly implemented . This ef fort i s e spec ially important in view of the fact that a complete s e t of Federal standards relating to the encryption of various type s o f informa t ion has yet to be adopted .
Numerous devices are currently be ing marketed for use in the protect ion of var ious forms of elec tron ic c ommunication s . Thi s equipment ranges from devices for the protection of vo ice and data communications to anc i llary e quipment con s ist ing o f cryptovariabl e gener a t ion devices and d evices des igned for the transport of keying variable s . A government agency which may wish to implement protect ion has a large variety of equ ipment to c hoose from and , in the absence o f Federa l St andard s , l ittle guidanc e . Many such u sers may be un-
famil iar with the techn ical and performance c haracter istics of thi s equ ipment . They must r e ly solely on in formation which may be provided by the vendors of suc h equ ipment for making dec i s ion s on its appl ication and use .
The obj ective of thi s Terminal Evaluation Pro j ect is to examine several ba sic que stions from a user ' s viewpoint . The se are :
o Does the equ ipment conform to applicable FCC rules and regulation s and indu stry standard s for communications equ ipment?
o Wha t communicat ion s system performance advantages/d isadvantages does use of the equipment provide the user?
o What Federal standards , or portions thereof , app l icabl e to sue� equipment , does the equ ipment meet?
o Are there certain installation and/or operational con figurations which should be avo ided by the user?
No attempt i s being made by NTIA/ ITS to eva l uate the level-of -protect ion provided b y a particular item of equipment . The study inc ludes DES based encryption equ ipment des i gned for protect ion o f data , and both analog voice scramblers and digital vo ice encryption equipment . Certain other re lated techniques will also be stud ied .
A total of 1 8 separate i tems of equ ipment from s ix ma j or manu facturer s has been procured to da te . Thi s equipment compr i ses seven d i f ferent protect ion systems . The procurement of this in itial group o f equipment was compl eted during FY 8 1 . A general plan for the study of the se protection termina l s wa s also comp leted during the past year . In add it ion , s tudies of two DES ba sed data encryption sy stems were comp leted . The se stud ies involved not only the enc ryption equipment but spec ial devices developed to aid in key management as we l l .
4 . 1 . 4 . Analog vs . Digital Link Analysis
There are severa l basic approaches under cons ideration for protect ion of common carrier telecommunications information . This is be cause common carriers ( l ike AT& T , MC I , etc . ) employ analog FDM-FM techno logy for the vast ma j or ity of terre strial and satell ite microwave radio links , but are also us ing a l l d igital l inks t o some extent , and are seriously considering the u se o f analog SSB-AM . The use of d i f ferent modu lat ion techniques add s a degree of d if f iculty to the search for proper protection approac he s . Because of thi s , the Communications Protect ion Program ha s des igned a two -s tage study ef fort to en sure that all s ignif icant factors are cons idered before protec tion schemes are recommended as part of a compr ehensive National Strategy Plan for protect ion . The f irst stage involves strictly a theoretical compari son of a nalog and d igital techn iques which could be used for common carr ier terrestrial and satell i te microwave systems . The second stage involves the prac tical comparisons of implementat ion , performanc e , and cost of such systems .
1 0 1

Stage l - Theoretical Compar i sons : A number of techniques have been proposed to upgrade microwave telecommunication systems from analog to d ig ita l , Some theoretical work ha s been publ ished in the l iteratur e , but t he analysis i s incomplete and fragmented . Substantial technical i s sues have not been ad dres sed fully , inc lud ing total l ink/system performanc e , spectrum utilization , and levels of complexity between var iou s system schemes . A complete study mu st present all appl icable d igital systems . The Institute is pursu ing this study e f fort through internal ITS research supplemented by information der ived from a private consulting f irm .
The contract work compared standard analog FDM/FM l inks against d igital systems using suc h modulat ion t echniques a s biphase , quadrature , and m-ary PSK ; binary and m-ary FSK ; quadrature AM ; quadrature partial response AM ; and min imum- shift-keying . Data formats were studied (NRZ , duobinary , etc . ) as we l l as voice d igitization techniques ( companded PCM , ADM ) , channel sharing ( time a s s ignment speech interpolation ) , d iversity, error-control cod ing , and mu ltiplex ing ( TDM , DAM , CDM , and FDM) . The systems studied were compared on the ba sis o f qua l ity of transmission and e f f i c iency of spec trum util ization in the presence of t.hermal no i se , interference , fad ing , and o ther germane factor s . The consult ing f irm conc luded that , with a l l factor s cons idered , min imum- shift -keying should be the choice digital modulation techn ique for the present state-of-the -art radios in the 4 , 6 , and ll GH z band s . The Inst itute i s continuing its research in this area .
Stage 2 - Practical Con s iderations : Protec t ion provided to common carrier microwave l inks should be at the least cost , and cause no l ink per formance degradation . The se cr iteria are important both to the carriers and t heir customer s . It is not yet c lear , however , what the inve stment ( c ost ) and performance tradeo f f s are for implementing protec t ion t o existing analog l inks , analog l inks mod i f ied for d igital transmi s s ion , or complete l y dif ferent new l ink s . A study contract to another consult ing f irm will provide many of the facts nece s sary to form a logical approach toward protect ion implementation .
'l'his " r eal -wor ld " s tudy e f fort primarily invo lve s three related tasks :
( l ) Formulat ion o f techn ical descriptions for existing common-carr ier analog l ink s , and eva luat ion o f the relative performanc e o f the l inks .
Eight d if f er ent terrestrial and sate l l ite analog l i nk s , inc luding Be l l System and CCITT type s , w i l l be spec if ied . Ba seband and radio-frequency information , mul t ip lexing , and antenna character istics w i l l a l l be descr ibed . Block d iagrams ( s chematic s ) will i llustrate equ ipment in each sy stem , manufac turer ' s par t/model number s , equ ipment cost , interfac e character i stic s , input/ output leve l s , etc . A rela tive level of performance wi l l be computed for each of the analog l ink s . That is , ba sed on the link conf igurat ion , equ ipment used ,
modulation techn ique , etc . , the performance the l ink could potentially have wi l l be determined . Then this potential wi l l be compared against carrier publ i shed performanc e . The Grade of Service concept will be used to determine min imum acceptable vo ice c hannel obj ectives . And the normal mix of voice , data , and facsimile traffic found on common carrier links wi l l be determined .
( 2 ) Theoretical transformation of the analog links descr ibed in Ta sk ( l ) to dig ita l links using var iou s modulation techniques , and compar i son of analog and digital l inks :
Task ( 2 ) treats the links of Task ( l ) as reference l ink s and subst itute s
d i f ferent modulat ion techn ique s i n the l inks . The intent is to eva luate l ink performance , and cost impact , if some common-carrier , analog , broadband channel s are converted to digita l , broadband channe l s (wh ile analog channels stil l operate adj acent to the digital channel s ) ; if some analog FDM-FM l inks are converted to single-sideband AM links ; and i f entire analog links a r e converted t o digital l inks . The modu lation techniques l i sted in the " S tage l " e f fort above apply here a l so .
( 3 ) Design of optimal analog and dig ital l inks to replace the l inks descr ibed in Task ( l ) :
The exi s t ing common-carrier links descr ibed in Task ( l ) are reviewed to determine the min imum operational requirements of each l ink ; then an FDM-FM ana log and a dig ital system are des igned to replac e each one . The intent here is to conceptua l l y deve lop l inks wh ich will deliver opt imum per formance for mixed voice/data/fac simile traff ic . On ly equipment which is commerc ially ava i l abl e , o:�:· i s under deve lopment and wi l l be commerc ia l l y avai lable within three year s , wi l l be considered for the " opt i mum l inks . " Optimi zation i s as sumed t o b e as fol lows . F o r analog sy stems , the number of baseband channels in t he broad band channe l s sha l l be optimized while ma inta ining a s igna l-to-noise ratio at least as good as t he re ferenced l ink . For the d igital sy stem , t he bandwidth e f f ic iency sha l l be optimized .
The Stage 2 e f forts wi l l be compl eted by December 1 9 8 1 .
4 . 1 . 5 . Public Key Cryptography and its Implementa t ion
One of the mo st exc it ing results from public cryptographic research i s the public key cryptographic system ( PKCS ) . Generically , a PKCS is a method by which two part ies can derive a common secret numbe r quantity ( e . g . , a number or str ing of bi t s ) without previou sly agreeing on anything in secret ; i . e . , all o f the transact ions are publicly di sclosed . A PKCS depends upon asymmetric complexi t ie s in computat ion of mutually inverting operation s . Thi s curious aspect has been dubbed a crypto-
1 0 2

graphic ' trapdoor . ' I n e s sence it means tha t , f o r some computations , o n e may prbceed forward on a one-to-one mapping with r e lative ease and attendant sma l l computational expen se , but one is apparently fac ed with an enormous work fac tor to e f fect the inverse mapping in genera l , even t hough t he unique inver se mapping exist s .
I t i s bel ieved that t he var ious PKC S ' s des erve study as c andidate vehicles f or protected Data Encrypt ion Standard ( DES ) cryptovar iable t ran smi s sion .
4 . 1 . 6 . MITRE Publ ic Key
The MITRE Public Key Cryptographic Sy stem ( MPKC S ) i s ideally suited to the ever expand ing wor ld of d igital commun icat ions .
T he MPKCS requ ires both parties to derive secret numbe r s , x , and y , which serve as exponents of a publicly d i sc lo sed element , a , o f a f inite f ield o f 2 n e l ements . Exponent iation is performed modulo a GF ( 2 ) primitive po lynomial ( al so p�blicly d i sclosed ) of d egree n . The f ir st party calculates ax and s ends it to the second party . It is a s sumed t hat publ ic d i sc losure a l so takes place . The second party computes aY and s end s it to t he f ir st party . Here it i s a l so a s sumed that public d i sc lo sure takes p l ac e . The f ir st party then exponentiates aY to t he x power and the second party exponentiate s ax to the y power . Both parties t hen obta in aXY An eavesdropper c annot compute aXY without having x or y and x or y can on ly be obta ined by solving for x or y g iven ax or a Y . The asymmetric complexity is that g iven a and x one can easily compute ax , but g iven ax and a one cannot , apparently , easily recover x .
The Insti tute ' s work in public c ryptography during the last year cont inued with exten s ive study of the MITRE Pub l i c Key Cryptographic Sy stem (MPKCS ) . The MPKC S a ppear s to be an exce llent cryptographic vehicle for protecting the transmi s s ion o f Data Encrypt ion Standard ( DES ) cryptovar iabl e s , i . e . , keying var i abl e s and init ia l i z at ion vector s . Pr imar i ly , ITS has been carefully examining the strengths and weakn e s se s of the MPKC S under the threat a s s e s smen t appropriate to NTIA ' s role in PD- 2 4 activitie s . W e have implemented the MPKC S in microproc e s.sor sof tware and succ e s s fully exper imented with t he system over uncondit ioned telephone l ines at a moderate s ignal ing rate . The s e exper iments have provided valuabl e ins ight into t he t ime c r it ic a l aspects of u s i ng the MPKC S . Elements which I T S i s presently resolving are : ( a ) r e f inement o f the cryptographic protocol and ( b ) the selection of the spec i f i c polynomial modulus of the sy stem . The f ir st i tem conc ern s t he functional procedure to be implemented to d e feat relevant attac k s . The second i s guided by t he threat scenario and a l so by eng ineer ing con s iderat ion s regarding ease of implementation .
The Inst itute has deve loped and publ ished ( J . Her s hey , see Publ ications Annex ) a method through which the initial exponent iat ions required by the MPKCS can be accomp l i s hed quf��ly if a part icular po lynomial modu lus (x +x+l ) i s selected . Because of the pos
s ibi lity that this particu lar modulu s may be
d i scarded after further analys i s , we are working on new implementation s for the system t hat can be executed quickly , if not in software , at least in hardware .
we have completed a dra ft report on the MPKCS which wi l l be pub l ished in the near future . The report is a pr imer on the system and inc ludes a study of the u nder lying mathe mati c s . I t also inc lude s a security analysis and architectural aids that will prove useful no matter what particular implementation is f inally selec ted . This report i s currently undergoing the prepublication rev iew process .
4 . 1 . 7 . Rivest , Shamir , and Adleman ( RSA) Public Key
The Publ ication of "New Directions in Cryptography " by D i f f ie and Hel lman has generated an increas ing amount of research on publ ic key cryptosystems . The system in troduced by Rives t , S hamir , and Ad leman i s the sub j ect o f thi s pro j ect .
Briefly , the RSA scheme requ ires c hoo s ing two large pr imes , p and q , each about 1 0 0 digits long , and an encryption exponent E . Let n = pq . Then , to encrypt a message P , raise P to the power E and f ind the rema inder upon divis ion by n , or in symbo lic form , the c ipher text C is g iven by
C - PE mod n . ( 1 )
Decryption d epends on f inding a number D such that
CD
_ P mod n . ( 2 )
The number s E and n are made publ ic , while t he member s p, q, and D are kept secret . Anyone knowing D can f ind p and q . Thus , the ba sic security of the algorithm relies on the knowledge that factoring a number n which is a product of two larger primes i s presently a very d i f f icult problem .
One of the obj ectives of this pro j ect is to examine factor ing methods to see if improvements are po s s ible , and to look at other potential cryptographic weaknesses in the RSA algor ithm . To date , no ser ious shortcomings have been found .
Two add i t ional goa l s are to identify areas o f applicat ion of the RSA cryptosystem and to d e s ig n e f f i c ient implementation s of the algorithm . One of the promi s ing app l ications is for d i stribution of keys for conventiona l cryptosystems suc h as DES .
An e f f i c ient multiple precis ion ari thme tic package has been developed u nder contract and instal l ed on I TS ' s CDC 7 5 0 computer . T he software enables computations to be per formed on the CDC 7 5 0 us ing number s of the s i z e required to invest igate and implement the variou s publ i c key cryptosystems .
An NTIA report entit led "A Critique of Some Pub l ic Key Crypto systems " wi l l be publ ished by ITS . Thi s report presents a detai led overview of the RSA public key system ( RSA-PKS ) and another public key system ba sed on the " knapsac k " problem . The report a l so g ives detai led
1 0 3

information on a computer implementat ion of the RSA-PKC which uses t he mul t iple prec i s ion ar ithmetic package descr ibed earl ier . Thi s implementation inc lude s a routine f o r f inding pr ime s P such that
p 2p ' + 1 ,
with p ' a prime , and with p + 1 having a large pr ime factor . A review of s ome fac tor ing technique s i s a l so g iven .
A second paper i s being prepared which wi ll discuss results of an inve st igat ion o f the potential of "Monte-Carlo" fac toring s chemes for the spec ial case of number s of the form
N � ( 2p ' + 1 ) ( 2 q ' + 1 )
wi·th p ' and q ' pr imes wa s also wr itten . The conc lu s ion i s reached that the special form of N does not offer an advantage f or "MonteCarlo " fac toring .
An e f fort i s a l so underway to invest igate ideas g iven by Adleman for f ind ing d i screte logarithm s . This rs part o f a c ont inuing study of the applicabil ity of u s ing the MPKCS to encrypt cryptovar iables f or e lectronic d i s t r ibut.ion .
SECT ION 4 . 2 . SWITCHED NETWORKS
The Switched Networks group of the Advanced Communication Networks Divi sion i s involved with a number of programs which relate to corrunon carr ier i s sues . The se programs inc lude work for other agenc ies such as the Department of the Army and the u . s . Po stal Service , as we l l as the Dome stic Common Carrier Program within NTIA. The NTIA common carr ier pol icy is or iented towards increas ing c ompet ition , decreasing r egulation , and stimu lating innovative telecorr@unication service s and produc t. ivity , As the telecommunications indu stry move s in these d irection s , there is an incr·easin g need in NTIA for t he capability to 1 ) addre s s tho se techn ical i s sues who se under standing i s integral to the f ormulation of sound pol icy , and 2 ) resolve those techn ical i s su e s wh ich impede the implementation of such pol icy .
As the central f ederal re source for telecommun ications research and engineer ing , ITS i s i n a unique position to s at i sfy these need s . Increa sed c ompet ition implies both present and new serv ice offer ings will be suppl ied l e s s by a s ingle network which is under centralized planning and management and more by compet ing network s which are under dif fer-ent owner ship . Decrea sed regulation impl ies that the se network s will funct ion in an environment wh ich i s under less government oversight and c ontrol .
Given this background , the obj ec tive s o f thi s ac t ivity to provide techn ical s upport to common carr ier i s sues are twofold : f irst to understand the interactions between competing network s , and second to fac i l itate the inter operability of c ompet ing network s . Pursuant to these obj ectives , f our types of work can be def ined . These are : 1 ) under standing the underlying technologies and methodologie s , 2 ) mode l in g composite networks , 3 ) r ecommend-
ing policy changes and modi f ication s , and 4 ) dev i s ing minimal remed ies con s i s·tent with pol icy .
The Switched Networks Group i s d irectly involved in the f irst two items , with the ma j or support f rom agencies in the Department of Defen se . Many of the problems encountered in the military environment are s imilar or iden t ical to tho se found in the pr iva te se ctor . Understanding the advanced network te chnologies currently be ing developed by the mil itary departments provides important in s ight to advanced network alternat ive s with commerc ial po s s ibi l i ties and to the potential pol icy i s sues which may require reso lution in the future .
In the fol lowing paragraphs we describe the program elements be ing conduc ted by the group to support this activity .
FCC Code and P rotocol I nquiry. A ma j or part of the ITS FY 8 1 Common Carrier Techn ical Support program wa s d irected towards interpreting and refining the Federal Communication ' s Commi s s ion ' s Final Dec i s io n in the S econd Computer Inquiry . In that dec i s ion , the Commis sion d ivided common carrier communi cation services into two categories : ba sic service s , which provide e s sentially tran s parent transmi s s ion of subscr iber in f ormat ion between des ignated po int s ; and enhanced service s , which act on the subs cribe r informa t ion , provide add itional , d i f f eren t , or restructured information , or involve subscriber interaction with stored informat ion . The Commis s ion ruled that basic services are regulated under Title II of the C ommunications Act of 1 9 3 4 , whereas enhanc ed services are not . The Commiss ion also e s tabli shed a struc tural separation po licy under wh ich carr ier s with potential monopoly power are allowed to provide enhanced services only through a fully separate , unregulated c orporate subs idiary . This FCC pol icy i s intended to minimi z e government regulation of commun ications and to promote the uevelopment of e f f ic ient , innovat ive enhanced services through market compet ition .
In its Final Dec i s ion in the Second Computer Inquiry , the FCC di scus sed , but d id not resolve , the i s sue o f whether certain " low level " c ode and protocol conver s ions should be al lowed in conj unc t ion with ba sic service s . In Dec ember o f 1 9 8 0 , the Commis sion in sti tuted a new inquiry (Dig ital Communications Protoco l s , Gen eral Docket 8 0 - 7 5 6 ) intended to address that is sue . Thi s inquiry i s s ignif icant because it wi l l determine the permi s s ible scope of ba sic service offerings and , ultimate ly , the partitioning of carr iers subj ect to the separation requirement .
The Institute submitted two f i lings to the FCC in connection with the code and protocol in qu iry . The f irst stated three bas i c conclusions (NTIA f il ing on FCC Genera l Docket No . 8 0 - 7 5 6 , March 3 1 , 1 9 8 1 by S e i t z and Linfield ) . The Inst itute concluded , first , that a total prohibit ion on code and protocol conver sion in conj unc t ion with regulated basic service s is a prac t ical impo s sibility : exc ept ions are required even to al low AT&T ' s exi s t in g public telephone network to functio n . The f i ling
1 0 4

pre sented severa l s pec i f ic examples of existing voice network func tion s which involve code and protocol conver s ion . The Institute conc luded , second , t hat no d e f initional method of identifying a l lowable conver s ions would be both reasonable and enduring . The f i l ing evaluated e ight propo sed d e f initional c r iteria on t he basis of t he FCC ' s r egulatory obj ect ive s , and d emons trated seriou s defic ienc ies in each . On the ba s i s o f these d i f f icultie s , NT IA conc luded , f inally , t hat a waiver proc e s s descr ibed in the Comm i s s ion ' s Recons ideration Order in t he Second Computer inquiry s hould be the primary mechani sm for con s id ering except ions to the conver s ion prohibit ion . The Inst itute a l so proposed speci fic definit ions for a number o f important techn ica l terms which were not c learl y d e f ined in the Second Computer Inquiry : e . g . , " subscriber informat ion " and " communication s protoco l . "
The second l� TIA/ I TS f i l ing in the code and protocol inquiry (NTIA f i l ing on FCC General Doc ket No . 8 0 - 7 5 6 , July 1 , 1 9 8 1 by S e it z ) summar i z ed t he p o s itions of a l l other r espondents on the t hree_conc lus ion s s tated in NTIA ' s f irst f i l in g , c ommented in detail on AT&T ' s initial f i ling , and made procedural suggestions for advancing the inqu iry toward s a succes sful conc lus ion .
The Inst itute ' s summary of o ther r espondent po si t ions reinforced t he v iew that substantial reliance on the waiver proc e s s is unavoidabl e . The summary demon strated , f ir st , that mo st ce spondents accept the need for at least some " ba s ic " conver sion s ; second , that no satisfactory method o f iden t i fying a l lowable convers ion s has been suggested ; and third , that mo st respondent s favor s pec i f ic wa iver s over general def initiona l c r i teria to t he extent that exceptions to the c onver s ion prohibit ion are needed .
In commenting on the AT & T f il ing , NTIA showed that a defin itional cr iter ion based on the d i s t inction between " u ser-to-u ser " and " network contro l " information would not suffic iently restrict a l lowable conver sions and would not a l low neces sary exc ept ion s . 'rhe NTIA f i l ing a l s o p o in ted out t hat no definit ion for the key term "conversion " ha s been establ i shed , and proposed a s imple mathematical de f in i tion for that term .
The Institute ' s second f i l in g made two proce dural sugge stions for advancing the code and protoc ol inqu iry towards a suc c e s s ful conc lus ion . The Institute sugges ted , f irst , that the ana lys i s of po s s ible exception s s hould be induc t ive rather t han deduc t ive ; i . e . , par t icipant s shou ld first deve lop a c omprehe n s ive understanding o f spec i f ic c a s e s in whic h " ba s i c " code a n d protocol c onver sion s may be requ ired , and then deve lop general exc eption criteria if experience s hows t hat suc h genera l i z at ion s are p o s s ible and u seful . An induct ive approach has been f o l lowed in the inquiry to date . The I nstitute a l so sugge s ted a poss ible method o f exped i t in g the inquiry : an ad hoc Techn ical Adv i sory Committee , comprised of r ecogn i z ed exper t s from industry and government , c harged with deve loping a compend ium of existing network conver sions .
USPS Electron ic Me s sage Service System . The N TIA/ITS ha s for the pa st several year s been supporting the development of Electron ic Ma i l Sy stems . Under the second pha se of a mul tiyear agreement be tween the USPS and the NTIA , the ITS ha s cont inued to provide techn ical support and system analysi s to formulate concepts and to select candidate systems from a number of alternatives which be st meet the overall USPS obj ectives . The current agreement supports c ertain requirement s for the short and long term deve lopment. of Interconnection S tandard s , supports the current USPS E lec tronic Computer Orig inated Ma i l ( E-COM) , and provides for engineer ing assi stance with quick reaction t ime to the USPS Off ice of Elec tron ic Mai l Systems Development .
Guide lines and s tandards concerning interconnection to serv ing post o f f ices ( S PO ' s ) are descr ibed below . The deve lopm�nt and demonstration of interconnection s tandards for services are also covered . In the fol lowing paragraphs the engineering assi stance pro j ect accompli shed to date for the E-COM pro j ect o f f ice i s described .
The USPS p lans to imp lement E -COM service for 2 5 SPO ' s early in 1 9 8 2 . The E-COM sy stem is expected to handle approximately 70 million messages per year by the third year of operat ion . (A me s sage con s i sts of one to two pages of text with 1 2 0 0 character s per page ) . Me ssage s may be d e l ivered to the system via U . S . domestic common carr iers or on magnetic tape pending Postal Rate Comm i s sion approva l . The customer wi l l send me s sages to the destination c ity SPO through the common carrier of his c hoice where the me s sages will be stored on magnetic tape pr ior to printing . After proc e s s ing , sorting , and printing , the me s sages are delivered physically a s conventiona l f irst class ma il no later than the second day after acceptance ( F igure 4 -4 ) .
Although telecommun icat ion fac il ities have not been author i z ed for u se in carrying me ss ages between SPO ' s it is still of interest to examine the cost o f avai lable communication alternatives and to compare the se costs with the current cost of Expr e s s Mai l .
F ive ba sic common carriers have been con s idered for compar ing me s sage costs . They are dial-up line s , lea sed l ine s , value -added networks and sate l l ite systems . In add ition certain hybrid combinations of the se have been examined . The results are summari zed in the table below which indicates the tota l estimat ed cost in cents/me s sage for the various sy stems cons idered .
Of cour se , a number of cr itical as sumpt ion s were made to der ive the se costs . For exampLe , one a s sumpt ion i s the me s s age vo lume to be transf erred on the average day between c ity pairs and the transfer rate . The sensi tivity of the var iou s a s sumptions ha s been evaluated and in many cases parametric curves developed to ind icate cost var iations with change s in tra f f ic volume and other critical parameter s .
Work such a s this i s continuing on an as needed ' ba s i s a long with other program ef forts descr ibed be low .
1 0 5

...., 0 0'>
( 1 )
e - · r -·-
S E RV I NG POST O F F I C E ( S PO - 1 ) I +- .1 -. LOCAL D E L I VERY I A . "
USER I I .. B . c . I D . TERm NAL r I ..., CHECK MAG . ... P ROCESS CUSTOt�ER OR I G I NATE I TAP E : r , DESTI NATE
T -v I .,.
L 1...--L
- - - - _j 1 ST CLASS r- - f-, - - - -
D IAL-UP AND . EASE D L I NES I I I MA I L DEL I VERY
VIA COMt·10N I I I ....._ CARRI ERS � I I 0
� ) I I 0
I I 0 OTHER MANAGEMENT SPO ' S OPERATI ONS
0 CENTER ( MOC ) I I I I 0
f- DI G I TAL C I RCU I TS I I I
e- I I I � - - .J I I 1 ST CLASS
r -1-MA IL DEL I V ERY
I - - - -
I _J,._ - - - - : 1 I
L l -=i A . B . 1.! �1AG . -" 0 . USER IT TAP E , c . TERM I NAL I C HE CK P ROCESS CUSTOME R
I DEST I NATE O R I G I NATE I LOCAL DEL I VERY -.. f L S E RV I NG POST O F F I C E ( S PO - N ) - _j
NOTE : (1 ) Ma gne t i c tape and pri vate l i nes i n put to E - C0t4 wi l l be i mpl emen ted pend i ng PRC approval .
F igure 4 - 4 . E-COM service operation .

Alternative Ne twork Configuration
Total Estimate C o st in
Cent s /Me s sage
Dial-UJ2 L in e s
0 Dayt ime ( 8
0 Even ing ( 5
0 N ight and
AM to 5
PM to 1 1
Weekend s
PM)
PM)
2 . 6
1 . 7
1 . 0
Leased L i n e s
0
0
0
0
0
0
Fully Connected
Loop
Structured
Star
Me sh
Tree
1 0 . 4
1 . 5
1 . 3
0 . 9
0 . 9
0 . 8
Value-Added Network
o Packet Switched 1 . 6
Sate l l ite Systems
Hybr id Networks
1 6 . 3
o Leased Acc e s s and Sate l l ite Backbone 3 . 7
Work wa s undertaken last year i n re sponse to a Federal Admini stration Po l icy Statement ( July 1 9 , 1 9 7 8 ) and an USPS Board of Governor s
Re solution ( Re s o lut ion 8 0 - 5 ) .
One admin i s tration condition r equire s , " To ensure that interconnec t io n with the ma i l del ivery s ystem i s ava ilable to a l l companie s , techn ic a l i nterconnec t io n s tandard s s hould be deve loped through a c ooperative e f fort by the Ame r ican National S tandards Ins t i tu t e , the USPS , the pr ivate carrier s , and an impartial arbiter , if needed . "
The Board o f Governor s r e so lut ion adheres to that guidel ine by s tatin g that the USPS will :
1 . I s su e s tandards for the t echn ical interconnect ions ( speed s , c ode s , protocol s ) between c ar r ie r s and S PO ' s .
2 .
3 .
Negotiate s tandard s o n qua l it y , scope , and dura t ion o f c ar r ie r s tran sm i s s ion service as par t o f its i nterconnect ion c ontrac t s .
Requ ire any c ommon carrier to c onnect with a l l SPO ' s i f c arr ier meet s other s tandard s and is able to d o s o .
4 . Contract for the transm i s s ion services of o n e or more c arrier s i f t here is a demonstrated need for the service under terms and c onditions which pre serve free and open competition in the transm i s sion pha se o f the E -COM s y stem .
The I n stitute ' s response s t o these guidel ines have empha s i z e d the preparatio n o f documents which will be u sed for t he adoption o f inter -
connection and performance standards for the USPS E-COM service .
The applicable coding , s ignaling , and transm i s s io n s tandards for the E-COM service at this t ime are :
1 .
2 .
3 .
Asynchronous input over dial-up acce s s l in e s w i l l use :
a .
b .
c .
the American National S tandard Code for Inf ormation Interchange (ASCII ) , ANS I X3 . 4 - 1 9 7 7 ,
operating ful l-duplex mode , at
3 0 0 or 12 0 0 b/s signal in g rate and entering in formation from an on-l ine storage device .
Binary s ynchronous communication ( BSC ) over dial -up acc e s s lines will use :
a .
b .
c .
the Extended Binary Coded Decima l Interchange Code ( EBCD I C ) ,
operating at hal f -duplex , at
2 4 0 0 or 4 8 0 0 b/ s s i gnaling rate .
Dig ital data communications me s sage protocol will use dedicated l ines with :
a . the ASC I I code ,
b . operate full -duplex mode , at
c . 5 6 , 0 0 0 b/ s .
A number o f repor ts and technical action statement s have been prepared which identify telec ommunicatio n interconnection standard s applic abl e to the E-COM system ; recommendation of values , test procedures and equ ipment for transmis s ion per formance eva luation ; a review of dome stic common carriers ; mean s and sources o f implement ing CCITT Recommendation X . 2 5 to a packet- switched network ; an eva luation of the tradeo f f s o f avai lable inter faces at the physical layer of the Internat ion a l Organizat ion for Standard ization ' s ( I SO) Open Sy stems Interconnection ( O S I ) re ference mode l . Some of the paper s that have been delivered to the USPS during the past year inc lude :
Need for Telecommunication Standards for I nterconnection with the U . S . Po stal Service EMSS , by D . V . Glen and R. E . Thomp son , NTIA Report 8 1 - 6 2 .
Guidelines to Telecommunications Interconnect ion Req uirements for Me s sage Input to the USPS E -COM System , by D . V . Glen , NTIA Report 8 1 - 7 3 .
Other ac t ivities are the participation in Amer ican Nationa l Standards Institute (ANS I ) ac tiviti e s . Thi s ha s inc luded member ship in ANS I Task Group X 3 S 3 7 ( Publ ic Data Networks ) , attendance at meetings during al ternate months , ho stin� a meeting of X 3 S 3 7 in Boulder , and c ontr ibuting a paper which wa s submitted to the ISO . The paper by D . V . Glen wa s the f irst attempt at showing a relationship between the ISO OSI ref erence model network layer service
1 0 7

pr imitive s and r eference even t s of the UserOriented Data Communication s Performance Parameter s ( FS 1 0 3 3 , now be ing con s idered a s ANS X 3 S 3 5/1 2 5 ) .
A new task wa s undertaken f or the USPS dur ing the past year . Its purpose i s to plan for the front -end proc e s sor s ( FE P ) for the electronic ma il system and develop a protocol/inter face demon stration and test .
The ITS i s developing func tional requirements for an electronic ma il system FEP . The se requirements inc lude sys·tem capac ity and network interfac e s . 'rhe amount of system c apac ity needed wi l l determine if the FEP is min icomputer or m icroproces sor ba sed and what per iphera l s are n ece s sary . Common types of networks that may be inter fac ed are switched terrestr ia l , pr ivate l ea sed l ine s . va lue-added network s , and sate l l i te s .
·
The hardware and software neces sary f or implement ing the FEP functional requirements is a l so being examined . The hardwar e/sof tware mix to interface the var iou s common carriers and to support anticipated protoc o l s mu st be determined . Commerc ially ava il abl e hardware and software that meet t he func t iona l requiremen t s o f the FEP are to be identif ied .
Alternative FEP con figuration s will be eva l uated with re spect t o protoco l support , data throughput , and cost . FEP conf igurations usin g of f-the - she l f equ ipment and software package s are preferred .
The second part of this task i s the planning and imp lementation o f a protocol/interface demon stration and test , The purpo s e i s to deve l op , demon strate , and test many of the concept s and funct iona l requ irement s deve loped under the f irst part of this ta s k . Protocol s to be te sted will be determined within ·the framework of the OSI re f erence model .
The ITS i s developing a demon stration test plan outl ining the type o f telecommunic ation l ink to be u sed , the inter fac e parameter s , the protoco l s to be eva luated , tests to be conducted , and the test s chedu l e . The telecommunica tion l in k may be a c ommercial packetswi tching network or common c arrier d ia l -up fac i l it ie s . A min imum o f the bi synchronou s protoco l and packet- switching ba sed on the CCI'I"I' Rec ommendation X . 2 5 wi l l be tested . Consideration will a l so be g iven to tes ting the async hronous type protoco l . Commun icat ion parame ter s such as bit- and block-error rate s and da ta throughput wi l l be determined as a part of the tests .
�cc e s s �ea Dig ital Switching System (AADSS ) . The U . S . Army ' s Communication s Sy stems Agency ( C SA) at I:'t . Monmouth , New Jer sey , is eva luating c oncepts and a l ternative s for prov iding an e f f ic i ent interface between the future De fen se Corrununications Systems ( DC S ) AUTOVON network and contiguous m i l itary base environment s cal led acc e s s area s . The acc e s s area concept is il lu stra ted in Fi gure 4 - 5 . The AUTOVON network con s i s tf o f 5 9 sw1tc hing centers that are interconnected in a pol ygrid backbone n etwork . Each switch i s conn ected with several other switche s . The acc e s s area
con s i s t s o f a clu ster ing o f military in stallations in the vicinity o f an AUTOVON switc h . Trunks carry conc entrated traf f i c from the mi l i tary installations to the AUTOVON switching c enter s . The tra f f ic is then routed throughout the AUTOVON backbone network to the dest ination . Some ba ses hav ing a high strateg ic value are multiple-horned on more than one switc h .
The Communications Sys tems Agency ha s been ta s ked by the Defense Communications Agency to make recommendations regarding new acc e s s area topologies and implementa tion s . 'rhe motivating factor s for this inve st igation are : 1 ) rapid l y inc reasing tar i f f s which are causing acce s s area costs as we l l as the eosts for the entire AUTOVON ne·twork to inc rease dramatica l l y ; 2 ) the need for enhanc ed survivabi l ity throuqh the u s e of more endurabl e topo loq ies : 3 ) new telecommunication s services which
-are
becoming available through the use of advanced technology . In support o f the C SA , the Institute has conducted numerou s stud ie s related to AAD S S program . Previou s I TS e f forts have inc luded stud ies on ( 1 ) parametric cost alternatives for local digital d i s tribution systems , ( 2 ) prel iminary eva luation o f hub alternatives , ( 3 ) an exampl e o f the des ign for a digital t ime d iv i s ion switch with stored program control , ( 4 ) trad itiona l signa ling techn iques for control l ing the switc h , ( 5 ) a study of new and compl ex s igna ling i s sues which ar i s e in integrated (vo ice/data) communications networks , ( 6 ) an evalua tion o f switch e l ement capac itie s i n acc e s s area digital switching system s , and ( 7 ) regional mode l ing for applying AADS S concepts to an acc e s s area in New Jersey . Item 7 above has recently been completed and wi l l be summar i z ed in the f o l l owing paragraph s .
1 0 8
Figure 4 - 6 depicts , in a simp l i f ied way , several d 1 f ferent po s s ible topologies for the ac c e s s area . The star topology is the topology currently implemented . The tree topology attempt s to reduce c ircuit-miles ( and hence cost s ) throuqh concentrat ion o f tra f f ic from l imbs onto maj or branche s . The loop and po lygrid topo log ies as seen in F igure 4 - 6 are other feasible implementations for the acc e s s area . F inally there is the AADS S type loop in which the exi sting AUTOVON switch ha s been e l iminated . 'rhe AAD S S switc h , shown as a shaded block , i s e ither coloc ated with a ba se switch or becomes an integra l part o f the ba se switch . The AADSS switc h in this case mu st be capabl e of performing other func t ions norma l l y hand l ed b y the AUTOVON node such a s rout ing control and network management func tion s . I f sate l l ite l inks are used between such switche s , then the AADSS may also per form sate l l ite terminal proc e s s ing func tions as we l l . The advanced loop topology of Figure 4 - 6 ( e )
'
i l lu strate s for long-term goa l topology env i s ioned by the CSA .
Figur e 4 - 7 depicts the C edar Brook , New Jersey , access area . Shown in the f igure are a l l o f the ba ses that home on Cedar Brook . The number s in parenthe s e s indicate the number of trunks between the mil itary insta l lations and the Cedar Brook switch . The I TS ha s recently completed a study wh ich pr esent s a methodo logy for eva luating alternative s for

� 0 \D
Acces s Area A
As of June 1980 :
• M i l l to ry bases
Access Area B
Access Area c
Access Area D Access Area E
59 Nodes
1� 060 Subsc r i be r Locat i ons < Ave rage 18 Locat i ons per Node>
15� 595 Trunks < Average 260 Trunks per Node >
• AUTOVON sw i tch i ng centers
F igure 4- 5 . AUTOVON acce s s area/polygrid concepts .

BAC KBONE SW I TCH
a ) STAR
BACKBONE SW I TCH
c) LOOP
e ) AADSS TY PE LOOP
BACKBONE SWI TCH
b ) TREE
BACKBONE SW I TCH
d ) POLYGR I D
F igure 4 - 6 . Potent ial stages for implement ing acce s s area networks .
11 0

- -- -- -- -
- - -
-- - --- .. ....-..
...... .. --- ·
- - -
• .rJ· ·--� .r . :"-. t---..., ' '·.J' . ' ' " "'-/ .
/
C 3 )
- -
- · -- - --- ... '
I -I - � - · "T · \--- -..v · \ ' I
\
F T. MONMOTH l96l
MC GUIRE l55) LAKEHURST l28l FT. DIX l35 l E A R L E l9l CEDAR BROOK
(505)
\ I
ASCEN SION I S . ( t )
F igure 4 - 7 . Subscr iber locations homing on AUTOVON switch at Cedar Broo k , New Jersey .
1 1 1

ac c e s s area s . As an example of the methodology a thorough anal y s i s of the Cedar Brook ac c e s s area wa s made . Di f f erent topologies ( star , loop , and tree) were invest igated as
we l l a s d i f ferent technologies ( f iber optic s and mic rowave ) and d i f ferent owner ship schemes ( pr ivate ownership ver su s l ea sed ) . It wa s found that the choice of the access area conf igurat ion for the Cedar Brook access area wa s h ighly sensitive to c o s t a s sumptions for l eased l ine tar i f f s , f iber optic s technology , etc . Under certain a s sumptions , the current s tar topology with l ea sed trunks was found to be the least expens ive . For a d i f ferent set o f a s sumpt ions the use of f iber optic tran smi s s ion l inks in a loop topology wa s found to be the most cost ef fec tive .
The important results presented in thi s s tudy are that a methodology was d eveloped that provide s l i fe-cycle costing techniques for both f iber optic and microwave tel ecommunications systems . Inc luded in the analysis were economic concepts such a s the present worth of money , deprec ia tion , amor tization , salvage va lue , and that nemes i s to economic s tabi l ity known as inflation .
Requ irements Analysis for the European Defense Commun1.cation s Sy stem . --TheiTS has recently in itiated a study f or the U . S . Army Communications Systems Agency which consists of a requirements analY.s i s and network concept development for the European Defen s e Communications Sys tem . An improved European Defense Commun ications Sys tem is required for the following reason s : ( l ) the need for improved communications survivabi l i ty in a nucl ear environment , ( 2 ) the need for i ncreased resistance to enemy sabotage and elec tronic countermeasure s , ( 3 ) the need for a better grade-ofservice for administrative , logi stic s , and command -and-control traf f ic , ( 4 ) the need to provide enhanced telecommunication s servic es to meet new c la s s-of- service r equirements such a s increased u sage of fac s imi le , increa sed data requirements , and pos s ibly video , and ( 5 ) the need for n ew or enhanced service f eatures some of which are unique to mi l i tary telecommunications sys tems such as secur ity , hot-line , and pr iority pre-emption .
The design and development o f a mili tary communications network ( s ) that meet the needs delineated above involves many c omplex i ties . The predominate problem i s that o f interoperab i l i ty of numerous military and c ivil networks . In general , the more interoperabil ity that can be achieved between networks the higher the probab il ity there is that , in a nuc lear environment , there will be an operable l ink between users . It is espec ially impor tant that connec tivity be mainta ined between critical command -and-control u s er s . Ther efore , it i s des irable that the Un i ted States European Defen se Communication s Sys tem in teroperate not only with the mi l i tary communications systems of the NATO Al l iance , but a l so with the military and c ivil c ommunications sys tems of each country in We s tern Europe . To thi s compl ex i ty , we add the add i tional problem o f interoperability with U . S . tactical communications equipment s . Al l of the s e sys tems have feature s and sys tem parame ters that are unique to that par ticular sy stem .
The goal of the ITS s tudy is to f ir s t identify and then addre s s all of the problems related to the interoperabi l i ty of u . s . and all ied communications networks , both mil itary and c ivil , in Europe . I s sues such as digital transm i s s ion formats , companding techniques , synchron i zation , number ing plan s , grade-ofservice , s ignal ing techn ique s , rad io/multiplexer capabi l i ties , recons t i tution in a po stattack environment , secure voice techn ique s , and user requiremen ts for voice , data , and fac simile are be ing addressed in this s tudy .
SECTION 4 . 3 . SATELLI TE COMMUNICATION SYS TEMS
The Federal Government has long been commit ted to sate l l i te communications and to the growth of a vigorou s commercial satell ite industry for both point-to-point conununications and broadcast services . Tha t indu s try ha s benef itted greatly from Government- funded R & D e f for t s , such as tho se o f the Department of Defen s e ( DoD) and the Na tional Aeronautic s and Space Admini stration (NASA ) , so that today there are we ll establ i shed services for dome stic and interna tional large vo lume , geographically centrali zed servic es . However , the services for low volume , geographically disper sed communication have been much slowe r to develop , and broadca s t services are only now be ing proposed .
Ef f ic i en t and ef fective u t i l i za tion of satell i te technology by d i sper sed , low-vo lume users ( rural area s ) can only be rea l i z ed when signif icantly lower-cost ground termina ls are avai labl e . A j o intly supported s tudy with the Agency for International Development (AI D ) to d e f ine and encourage indu s try development of a low-co s t , ground terminal sys tem suitable for rural areas and other thin -route sa tel lite communications applications has been ini tia ted . The empha si s of thi s study ha s been to def ine earth s tation designs and service capabil ities through applica tion of a matrix of option s for components of the earth s tation such as the antenna size , the low noi se ampl if ier character i s ti c s , and the high power amplif ier character istics as well a s the technology tha t could be used suc h as single channel per carrier frequency modu lation ( SCPC-FM ) , voice encod ing with a digital mod� lation , and
.phase
shift-keying such as cont1nuou s ly var l�ble s l ope delta modulation ( CVSD ) or adaptlve delta modu lation (ADM ) with quadrature pha seshift-keying ( QPSK) , or voice synthe s i s such a s l inear pred ictive cod ing ( LPC ) with QPS K .
The 1 9 7 9 Wor ld Administrative Radio Con ference (WARC ) of the International Te lecommunicat ion
Union ( I TU ) establ i shed fr equency al locations for broadcasting-sate llite service ( BSS ) and resolved that a Reg ional Admin i s trative Radlo conference ( RARC ) be convened in 1 9 8 3 for planning broadcasting-satellite service in I TU Reg ion 2 (North , Central , and South Amer 1ca and Greenland ) . The 1 9 8 3 RARC for Region 2 mu s t resolve the i s sues of shar ing the Direct Broadcast Satellite ( DBS ) orbit and radio spec trum between 1 2 . 1 and 1 2 . 7 GHz . This conference will address the orbit and spec trum sharing i s sues and requirements of the countr ies in Region 2 . The conf erence output can produc e a very negative environment for the Un ited State s ( U . S . ) DBS indu s try unl e s s
1 1 2

favorable plann ing i s accompl i shed . Thi s can only be done i f a s trong c a se for the U . S . p o s i t ion is prepared i n advanc e . Techn ical s tudies have been c onduc ted ( and will cont inue) to a s s i s t in determining the orbitspec trum c apac ity and how i t m ight 'be shared w i th the other countr ies in Reg ion 2 .
On December 1 7 , 1 9 8 0 , COMSAT ' s Satellite Televis ion Corporation ( S TC ) f il ed the first appl ication with the Federa l Communications Comm i s sion ( FC C ) requesting a permit to c ons truct the f ir s t phase o f an exper imental DBS system for delivery o f subscr iption telev i s ion to home s . By July 1 6 , 1 9 8 1 , when the FCC clo sed the inter im DBS period , fourteen applications had been subm itted which presented , in varying deta i l , a wide r ange of service c onc ept s . Dur ing the past year , ITS gave technical s tudy to the S TC application and s imilar s tudy o f o ther appl ica tions is expected to continue . It is important to formulate a U . S . posi tion p r ior to the 1 9 8 3 RARC with r egard to DBS s ervice i n the Un ited State s .
The 1 9 7 9 WARC a l s o resolved to c onvene ano ther WARC in 1 9 8 4 to dec ide which frequency band s for space services (primar ily the f ixedsate l l ite service , F S S ) s hould be p lanned and to draw up a detai l ed plan for each of the se frequency band s . 'l'he outcome f rom the 1 9 8 3 RARC and the 1 9 8 4 WARC w i l l have ma j or impac ts on e f f icient u s e of the f r equency and orbit re sources by the Un ited State s .
The ITS Sate l l i te Commun ications System Program was c ompr i sed o f f our , NTIA- sponsored pro j ec t s plus a c omplementary pro j ect spanspored by the Agenc y for Internationa l Development , Department of State , mentioned ear l i er . The se f ive pro j ec t s , e s tablished for management trac tabil i ty wer e : 1 ) " Frequency/ Orbit Resource Study , " 2 ) " Broadcast ingSatell ite Service Pol icy Stud i e s , " 3 ) " Direct Broadcast Sate l l i te and F ixed Service Sharing Studie s , " 4 ) " Voice Circuit JViul t ip l ier Techn iques Study , " and 5 ) " Suppor t to the AID Rura l Sate l l ite Program . "
4 . 3 . 1 . Fr equency/Orbit Re source Study
As noted ear l i er , the 1 9 7 9 WARC r esolved that a Regional Admini strative Rad io Conferenc e for the planning o f t he broadca sting- sate ll ite service ( RARC-BS ) o f the I TU Reg ion 2 be c onvened in 1 9 8 3 . At this c on f erence , a deta i l ed f requency a l l o tment and orbital po sitions plan will be drawn up for Reg ion 2 . The 1 9 7 9 WARC al so resolved to c onvene another WARC in 1 9 8 4 t o dec ide which frequenc y band s for space services shoul d be planned and to draw up a deta i led p lan for each of the f requency band s . The outcome f rom these two conferenc e s will have ma j or impac ts on e f f ic ient u s e of the f requency-orbit resourc e s by the Un i ted State s .
I n this f i scal year , e f forts have been made toward s preparation of the U . S . pos ition for the 1 9 8 3 RARC-BS of Reg ion 2 . The ITS ef forts have been made through partic ipation in and c on tr ibution to the U . S . National Committee for CCIR ( International Rad io Consultative Comm ittee ) ( Jo int Working Group 1 0/ l lS and Interim Working Party 1 0 - 1 1 / 2 , in particular ) ,
I RAC ( Interdepartmental Rad io Advi sory Comm i tte e ) Ad Hoc 1 7 7 , and FCC Advi sory Commi ttee on the 1 9 8 3 RARC-BS establi shed under the FCC General Docket No . 8 0 - 3 9 8 .
The SOUP ( Spec trum-Orbit Utili zation Program) of ORI , Inc . , improved under the I TS contrac t l a s t f i scal year , ha s been further improved by the ITS in this f i scal year . The improvement inc ludes conver sion to the ANS I (American National Standards Ins titute ) Standard Fortran for por tabi l i ty , reduction of storage area , e l imination of dupl icated ca lculations for c ommon upl ink s , adaptation to the 1 9 7 7 WARC-BS spec i f ication of a sate l l ite antenna , etc . Documentation of SOUP with samp le runs i s under way .
The 1 9 7 7 WARC-BS dec ided to use e l l iptical beam s for sate l l i te transmitt ing antenna s in the broadca sting - satell ite service for the p lanning purpo se s . A method for minimiz ing the area (or solid angle ) of the e l l ipse for a g iven service area and an orbital po sition ha s been developed and implemented in a computer program . Thi s method is about ten t imes faster than the other method used so far e l sewhere in the United State s .
4 . 3 . 2 . Broadca sting-Satel l ite Service Policy S tudie s
The ITS provided comments and summariz ations o f other respondents ' comments to FCC Notice of I nquiry ( NOI ) Doc ket No . 8 0 - 3 9 8 and Docket No . 8 0 - 6 0 3 . The NO I Docket No . 8 0 - 3 9 8 i s a n inquiry relating t o preparat ions for the 1 9 8 3 Reg ion 2 RARC for plann ing of the broadc a sting - sate l l i te service in North , Central and South America and Greenland in the band 1 2 . 1 and 1 2 . 7 GHz and a s soc iated uplink s . Thi s preparation mus t include con s ideration of cr iteria for shar ing between the BSS and the terre� tr ial mic rowave Fixed Service ( F S ) u ser s .
Comments requested by the Commis sion in the NOI inc luded the following i tems :
ba sic service requirements ,
d iv i s ion and a l loc ation of the 1 2 . 1 - 1 2 . 3 GHz band s ,
technical spec if ications and sharing criter ia and plann ing pr inc iples , i . e . , orbital placement s , frequency and channel allocation s , etc . , and
a U . s . Adv i sory Committee .
Re spon s e s by the ITS to Doc ket No . 8 0 - 3 9 8 were bo th in direct reply to the Inqu iry and summar ie s of the large number of comments and rep ly comments that came from interes ted parties -- terrestr ial microwave operators who f e l t a potential threat to their use of the 1 2 GHz band , the networks who felt that DBS would be a threat to services alr eady being provided by the broadca ster s , and , of course , tho se who viewed DBS as a potentially attrac t ive sate l l i te service to meet the ir own requiremen ts as servic e prov ider s or as service u ser s .
1 1 3

Three document s were prepared in I TS r ev iewing comments and r eply c omment s . The f ir s t two document s were made part of the agenda o f I RAC 1 7 7 - 1 .
"A Synops i s o f Comments to FCC-NOI Docket No . 8 0 - 3 9 8 , P lanning for 1 9 8 3 RARC for 12 GHz Broadcast Satellite Service s , February , 1 9 8 1 .
"Memorandum - I s sues Relating to u . s . Pos itions on 8 3 RARC , " February 2 6 , 1 9 8 1 .
" A Syno p s i s o f Reply Comments to the FCC NOI Docket No . 8 0 -3 9 8 , Planning f or the 1 9 8 3 RARC for 12 GHz Broadcast Satellite Service s , " Marc h , 1 9 8 1 .
A set o f matr ices c it ing organ i zation s ' reactions to the NOI wa s prepared and pre sented in the Synops e s of Comments . It is to be noted t hat at the t ime of the Inqu iry ( Re lea sed July 2 5 , 1 9 8 0 ) and into the f all and winter , 1 9 8 0 , there were almo st no organ i z ations other than the Sate l l i te Te lecommun ications Corporat ion , a sub sid iar� of COMSAT , who felt DBS a service worth pur su ing . Only STC had appl ied by the spr ing of 1 9 8 1 for a DBS satell ite service . However , a total o f 14 appl icati on s had been f i led with the FCC by t he dead l ine date , July 1 6 , 1 9 8 1 , reque sting inter im l icense s to operate or broadcast on DBS . Appl ications a l so inc luded f i l ings f rom a var iety of unknown organi za t ions e s tabl i s hed perhaps j u st for this serv ice a s we l l a s a number o f princ ipal s in the broadcast , equ ipment , or satell ite fields ; e . g . , CBS , We stern Un ion , RCA , STC , etc .
Sate l l i te Te lev i s ion Corporation , in their appl ication to prov ide DBS serv ices , o f f ered their proposal to operate a number of c hannels from each of f our satell ites strateg ically placed in orbital pos ition to cover approx imate ly each t ime z one throughout t he cont iguous 4 8 state s . Spot beams from the DBS satell ite wou ld be d irected toward Ala ska and Hawa i i to meet their service need s . S TC detai led an approach to orbital placement s of sate l l ites and offered a number of r ec ommendations for shaping t he rad iated power beam to achieve uni form s ignal dens ity in the r eception area s . S TC recommended a clear split of the 1 2 . 1 - 1 2 . 3 GHz sub-band rather than a shar ing of such frequenc ies with the FSS . The STC reaction to the que stion s o f potential interference of f ixed terrestrial services with DBS is that a shift of the FS f requencies within the band s hould , in mo st case s , alleviate the problems o f inter ferenc e .
Mo st respondent s to the NOI No . 8 0 - 3 9 8 may be grouped into c a tegor ies such a s commerc ial TV broadca ster s , public service organ i zation s , suppl ier s o f equ ipment and/or publ ic/pr ivate telecommun ication services via terrestrial microwaves or satell ite , and the u ser c ommunit i e s for the latter service s . A d igest of the reactions to DBS services by s ome of the spec ial interest groups follows .
The commercial TV broadcaster s , the broadca sting a s soc iation s , a nd the TV networks look upon broadca st sate l l i te services and , in particular , d irect-to-home sate l l ite TV e i ther
as an unnec e s sary add i t ional attempt to pro vide pay TV or as a potential threat to the commerc ial TV services already we l l e stabl i shed throughout the Un ited State s . DBS services would place , in the hand s of a sma l l number of (nat ional ) TV operator s , a T V broadca sting medium and service that would compete wi th locally operated TV s tation s on a time , service , and avai lable talent bas i s . The recommendations from the broadcasters are that the services or uses of BSS be non -competit ive with commerc ial TV and preferably d irected towards community publ ic service and educ at ional need s rather than entertainment .
Pr ivate u sers or suppl iers of the terrestrial microwave telecommun 1cat1on service s such a s the ut i l ities , petroleum companies , a n d railroads express in the ir comments to the Comm i s s ion a common concern - - " What wi l l be the ef fec t upon the ir fixed ( or in some c a ses , f ixed satel l i t e ) s ervices as the result o f an extensive BS S ? " They argue that t here are long-term requ irements for a highly v iable telecommunicat ion sy stem to meet the needs of the u . s . publ ic as we l l a s the ir own spec ial or pr ivate communication s .
The publ ic service a s soc iat ions and consortlums look upon broadcast satel l i te services as a means for e f f ic ient telecommunication d i s semination of e s sential educationa l , socia l , government , health , public interest , and information service s . They recommend community reception in preference to d irectto-home rec eption , and encourage a d iver s i ty of video services to al low for max imum d i s semination o f i nformation .
All parties who commented to the FCC NOI No . 8 0 - 3 9 8 were in favor of an Adv i sory Committee to help in the planning proc e s s for the establ i shment of a u . s . po s ition at the 1 9 8 3 RARC .
In add ition , the ITS cooperated with the Of f ice of Policy Analysis ( OPAD ) , another component of the NTIA , in preparin g the NTIA comments responding to FCC General Docket No . 8 0 - 6 0 3 , an inqu iry into the development o f regulatory po l ic y i n regard t o Direct Broadcast Satel l ites for the per iod fol lowing the 1 9 8 3 Reg ional Admini strative Radio Conference . The se comments were f i led with the FCC on Apr i l 1 5 , 1 9 8 1 . The NTIA f i l ing became one o f the main driving forces for the FCC ' s dec i s ion to accept appl ications for inter im DBS systems for f i l in g at thi s time ( i . e . , before the 1 9 8 3 RARC-BS for Reg ion 2 ) .
The 'l'echn ical Summary of the NTIA Comments urged the Comm i s s ion to con s ider the fol lowing techn ical rec ommendation s :
1 . Adopt interim proc edures for author i z ing DBS service s prior to the 1 9 8 3 Reg ional Admini strat ive Rad io Conference ( RARC ) to fac i litate U . S . preparations for RARC- 8 3 and to reduce service de lays in the po st- 1 9 8 3 per iod .
2 .
1 1 4
Grant appl ications in a t ime ly manner by i s su ing cond it ional construc t ion permi ts which will al low in itial procurement activitie s , but not launc h or operation ,

prior to RARC- 8 3 , However , do not a ss ign orbit positions and frequenc ies unt i l a f t e r RARC - 8 3 .
3 . Adopt t echnically f l ex ible orbit spec trum ut i l i z ation policies f or t he emerg ing dome s t ic DBS market , but do not implement the Staff Po licy Report* r ecommendat ion of c on tlguou s spectrum block a s s ignment s .
4 . Re s o lve t he FS and BSS s har ing problem in t he 1 2 . 2 - 1 2 . 7 GHz band by shar ing within the band , extending the FS band , encouraging an FS move to a higher band ( 1 8 GHz ) , or a combination thereo f .
5 . I f s har ing within t he band i s adopted a s a s hort -term solution t o FS -BSS interferenc e , e stab l i sh a policy of prior ( or incumbe n t ) spectrum u s e r ight s for all l icensees in t he 1 2 . 2 - 1 2 . 7 GHz band and a l low DBS operator s to compen sate FS u se r s for mod i f ication s .
4 . 3 . 3 . Direc t_ Broadcast Satell ite Fixed Services S har ing Stud ies
The broadcast band between 1 2 . 2 to 1 2 . 7 GHz within the United States is a l l oc ated for the transmi s s ion o f c o�nerc ial telev i s io n f rom a d irect broadca s t satell ite (DBS ) ; for pr ivat e , safety , indu str ial , and transportation ( P S I T ) f ixed terrestrial microwav e ; and f or c ommerc ial high r e s o lut ion telev i s io n . This program i s an expanded analysi s of the techn ic a l shar ing i s sues between t he D B S a n d t h e P S I T f ixed terre str ial microwave sy stems . This a s sumes that both system s w i l l operate within this band as oppo sed to moving e ither one or t he o ther system out to a d if f er ent fre quency band . There are two opt ion s for interf erence within this band between these two system s : the DBS s igna l s inter f er r ing with the terre s trial microwave and t he f ixed t errestrial m i crowave interf erring with t he r eception o f the DBS home rece iver s . The DBS home receiver s are a s sumed to use inexpen s ive parabol ic d i shes whic h are g enerally l e s s than 1 -meter in diameter .
F igure 4 - 8 s hows a typical home receiver mounted on a dwe l l ing .
I ·t was c onc luded early in t h i s s tudy t hat the inter ference i s basically f rom the f ix ed terrestrial microwave tra n smitter s to t he DBS home antenna and rec e iver system s . The foc u s , therefore , i s o n the pro l i f erated terre strial microwave transmitters i n t he u . s . which can potentially interfere with t he home r ec e iver s o f the DBS ,
There are approximately 1 5 0 0 operational m i crowave transm itter s in t h e U . S . w i t h another 8 7 0 known systems in var iou s stages of planning and installation . Almo s t all o f these microwave systems support local d i stribut ion a s oppo sed to long-haul use , This c ompound s the s har ing i s sue s ince the u s e o f the s e microwave sys tems are a lmo st proport ional to population c enters . One o f the wor st-case cente r s
*Sta f f Repor t o n P o l i c i e s for Regulation o f Direct Broadcast Sate l l ite s , F C C Of f ic e o f Plan s and P o l icy , S eptember , 1 9 8 0 , b y F . O . Setger , B . A . Franc a , and N . W . Corne l l .
i s Los Ang e l e s . A plot o f the fixed terres trial microwave systems in Los Angeles i s s hown i n F igure 4 - 9 . I t is c lear from such a map that the potential for interference from microwave transmitters to home receivers in the Los Angeles metropol itan area i s a tec hnical concern .
Thi s study ha s shown a "no control o f restr iction " approach i s techn ically absolute worst-case for all partie s . There are several option s . One is to split or interweave the bands of operation of both s ystems by compacting the PS I T microwave user s and inserting DBS into the remaining frequency band or band s . C ompact in g the P S I T microwave user techn ically requires combinations o f reduc ing transmitter power , increas ing the s i z e of se lected microwave d i s h diameter s , and reconfigur ing selected network s . Fortunately , the compaction problem currently manifests it self in only a ha l f do zen or so of the larger metropol itan area s . Technically , the relocation of microwave users in sma ller center s is greatly s impli f ied since there is suff ic ient una s s igned bandwidth i n 1 2 . 2 t o 1 2 . 7 GHz . Our analysis does indicate , however , that the total u se of P S I T microwave is increasing at an annual rate of 10 to 2 0 % compounded . The proc e s s of shar ing , therefore , becomes more technically e legant with each pass ing year .
Our study restr icted the s i z e o f the hometerminal receiver d i s h to 1 -meter or less . I ncrea s ing the d i s h s i z e causes ma j or increases to the c onsumer - - a boundary cond i t ion placed on the analys i s .
Some exploratory measurements of inter ference from FDM/FM common carr ier s igna l s to TV s ignals from SATCOM I in the 4 GHz band were made at f ive locations in the Boulder area . The se mea surement s were done to determine the nature of the interference environment in wh ich 4 GHz , receive-only , sate l l ite earth s t ations operate at present .
The mea surenent s were made u s ing a lea sed , receive-on ly , transportable sate l l ite ter minal to which a spectrum analyzer , strip recorder , and a TV monitor were added ( s ee F igure 4 - 1 0 ) . The leased terminal con s i sted of a 1 0 - foot antenna , polar ization selector , low no ise amp l i f ier , and ( r f ) rece iver .
Our mea surement s , which mu st be regarded as produc ing prel iminary results , show that ad j acent to a receive-only terminal used to f eed a local c able TV network , carrier-tointerference ratio s , C/I , of between 30 and 4 5 dB were mea sured which did result in de graded recept ion determined subj ectively by observation o f the TV mon itor , though there
'i s
n o t a one-to-one correspondence between C/I and p icture qua l ity .
Although the primary interest i s for in format ion relating to the planning of DBS services in the 1 1 - 1 2 GHz band , it wa s felt , in the absence of DBS s igna l s , that data obtained at 4 GHz would be re levant insofar as protection requirement s are c oncerned . It should be noted that S ec t ion 4 . 1 . 2 o f CCIR Doc . 1 0/l lS/8 7 Rev . 1 quote s the need for protection ratios of 35 and 32 dB for interf erence between NTSC-
1 1 5

F igure 4 - 8 . Typical home receiver dish for DBS .
1 1 6

F igure 4- 9 .
+ .....
+ .....
+ ......
+ ......
. � ...
F ixed terrestr ial microwave paths at 1 2 . 2 - 1 2 . 7 GHz i n the greater Los Angeles area .
1 1 7

f-' f-' 00
v I D
E 0
Limi t er/ Discriminator
2nd 1st Lo Lo
2nd Mix BP 1st BP Filter IF Amp �r--AGC/MGC
!-- Filter -
Filter 1---
Mix 1--
3 . 7-4 . 2
I ) I
I I
I AGC
I HP 8565 Strip
,___ Spectrum Chart Analyzer Recorder
-- - ------ ---
Figure 4 - 1 0 . Block diagram o f ins trumentation for carrier-tointerference ratio measurements at 4 GHz .
LNA 55 dB -
95° K � 0 foot perture iameter

TV and FDM/FM te l ephony s igna l s loaded at 6 0 and 9 7 0 c hannel s , r e spec tive ly .
4 . 3 . 4 . Vo ice Circuit Mu ltiplier Techn ique s S tudy
This study is being done for the NTIA Internat ional Affa irs Off ice . With the f ormation . of INTELSAT in 1 9 6 4 -6 5 , geosynchronou s sate l l ites have grown to be t he dominant , long-haul , transoceanic , t e lecommunications transm i s s io n med ium . S ince 1 9 7 3 , s imilar sate l l ites are be ing increas i ng l y employed for dome stic network s . Throughout a l l this per iod , the techno logy o f c ommunications and of sate l l ites ha s expanded enormou s l y and new techn ique s , inc luding components , modu latio n f ormats , spot beams , frequency reuse , and a host of c ircuit mul t i p l i e r idea s , have been brought forward . Because of inc reas ing f requency and geo sync hronous orbit c ongestion a nd the further growth in s i z e and scope of satellite systems , method s of improving t he spec trum e f f i c iency of the se systems are of great impor tance .
The obj ectives o f the study are to investigate var iou s s ignal formats and proce s s ing techn i ques f or improving the e f f ic iency of vo ice communication s by satell ite . I n part icul ar , a common base compar i son i s be ing deve loped between ana log and digita l , between FDMA and TDMA, and between modu·lation e f f ic ient sc hemes such as QASK and S ource Cod ing ( bit rate reduct ion ) , s c heme s such as Adaptive Delta Modu lation ( ADM) and Linear Pred ictive Coding ( LPC ) , etc . These c ompar i sons with baseline s y stems a l low a s se s sments o f the ir relative mer its for satel l it e u sage .
T hree baseline s ystems f or voice servic e based on the INTELSAT c hann e l iza tion and s igna l struc tur e have been se lected . The se are ( 1 ) the f requency d iv i s ion mul t ip lex , frequency modu lation , f r equency d iv i s ion-multiple acc e s s ( FDM/FM/FDMA ) analog f ormat c ommonly u sed by INTELSAT ; ( 2 ) the t ime d iv i s ion mult iplex , t ime d iv i s ion-mu l t iple acc e s s , d ig ital spee c h interpolation ( TDM/TDMA/DS I ) d igital format which is now being implemented by INTELSAT at earth stat ion s with very large volume s o f tra f f i c ; a n d ( 3 } t he pu lse c o d e modu lation , quadrature phase shift keyed , single c hanne l per carrier ( PCM/QPSK/SCPC ) format .
Techn ique s be ing eva luated r e lative to the se baseline systems inc lude.:
a ) analog c ompander s emp loying microc ircuit s ;
b ) d ig it i z a t ion s ource encod ing suc h as Delta Modu lat ion types (ADM and CVSD ) ; l inear pred ictive cod ing (LPC ) and adaptive/pred ictive c oding ;
c ) e f f ic ient ( a l ternative ) d ig ita l modulat ion t ec hn ique s such as QPSK , MSK , QPR, 1 6 -P S K , and 1 6 -ASK ;
d ) other c ircuit multiplier techniques suc h a s t ime averaged speech inter polation ( TASI ) , d ig ital speech in terpolation ( D S I ) , etc . ; and
e ) se lected c ombinations o f above technique s .
The need and e f fect o f e rror correction cod ing in the u se of d igital techn iques are a l so a
part of the study which i s expected to be completed early next f i scal year .
4 . 3 . 5 . Support to the AID Rural Satell ite Program
The Rural Satell ite Program , establ i s hed by t he Agency for I nternationa l Development , i s a five-year , cooperative ef fort between the United states and a number of developing nations to develop and demonstrate the value of communications technology , particular ly as rea l i z ed through u se of communication satell i tes , upon development efforts of le s s developed nation s . The e stabl i shment of rel iable communication s sy stems into rural areas of the developing nations provides an important and e s sential capabi lity which can be u sed to improve methods of produc ing and availabil ity of food , to improve health and family planning servic e s , to st imulate produc tive work , and to prov ide acc e s s to education .
This wa s the second year of technical support by the Institute to the Rural Sate l l ite Program . Support dur ing the past year provided a s se s smen t s of var ious propo sals made to the Agency for I nternational Development as useful to the Rural Satell ite Program .
One propo sal wa s for " inte l ligen t " earth stations employing t ime-divi s ion , mu ltipleacc e s s technology , and compatibl e , packet radio communication systems for terrestr ia l , local di str ibut ion o f service into an area surrounding an earth station . The earth terminal is des igned to provide multiple ac c e s s data transm i s s ion and digital voice c ommunications emp loying time-div i s ion mu ltiplex (TDM) and t ime -division , mu lt iple -acc e s s ( TDMA) with quadrature phase-shift keying (QPSK) for rf modu lation at rates from 2 6 8 . 8
kb/ s to 2 . 0 4 8 Mb/ s . Vo ice encoding i s accomp l i shed u s ing c ont inuously-variable s l ope delta modulation ( CVSD ) operating at 3 2 kb/ s . The s e terminal s could be networked a s ei ther star or me sh networks operat ing with an INTELSAT satell ite u s ing antennas with apertures of 7 to 10 m, depending upon the selected network conc ept and ava ilable space segment . Fol lowing a star network conc ept , a Rural Satel l ite Program app lication could rea l i z e service u s ing continuou s broadcast transmissio n and TOM techno logy for commun ication from a central location to a number of " remote " earth station s . Return commun ication from the remote s i te s c ould employ TDMA bursts . The techno logy for the se systems is near the leading edge for fielded , sate l lite communicat ion servic e , therefore quite expens ive -probably near or exceed ing $ 1 0 0 , 0 0 0 per earth terminal .
The second proposal was for earth stations prov id ing l imited voice communication capabi lity as a supplemental service to televis ion rec eive-only service . This service conc ept depend s upon an existing capabil ity for or iginating at least one c hannel of te levision programming which is d i stributed via satel lite . The concept d ic tate s a star network . Radiote lephone serv ice from the central station to remote termin a l s' would be provided as digit i z ed voice signals (maximum o f about 1 0 ) , modul ated as a subcarrier on the telev i s ion s ignal between the c hromatic subcarr ier and the
1 1 9

( TV ) aud io subcarr ier . Return cowaunication from the remote t ermina l s would occur as very low-power c arr iers ( up to about 10 maximum f or s imultaneous operation ) near the transponder band edge . Antennas with apertures of 4 . 5 m could be u sed for t he remote termina l s . Also , other cost-reduc ing techniques for fr equency translat ion from baseband to radio frequenc ies and back to baseband were proposed . Delta modulat ion was proposed for voice signa l encod ing . The proj ec ted earth terminal cost was about $ 3 5 , 0 0 0 to $ 5 0 , 0 0 0 ; however , many proposed techniques involved unproven tec hnology and produc tion method s . Furthermore , a capabil ity for radio telephone ( and l imited data transmi s s ion ) dependent upon exist ing or igination and d i str ibution by sate l l ite o f televis ion programming d o e s not c orre spond to the perce ived " typi cal appl icat ion " that wi l l b e made in t h e Rural Sate l l ite Program .
The third propo sal was for development of " low-pr iced " televi sion technolog y , with emphas i s direc ted to d evelopment of a lowpr iced televis ion r eceiver . Thi s is a proposal to provide s i�gle c hannel service u s ing special broadcast t echniques to r educ e the transmiss ion bandwidt h . These techniques would inc lude l ine averaging to reduc e the number of scan l ines per f rame , inter lace scanning , and antimat ion emphas i s . The rece iver would be su itable only for subdued l ight viewing and would incorporate f eatures which would al low manufactur ing o f the receiver s within a d evelop ing c ountry at a targeted cost o f about $ 5 . 0 0 u . s . Features of t he receiver includ e :
a ) A long , round - face ( 5 t o 7 inche s in diameter ) picture tube that could be manufactured u s ing incande scen t l ight bulb technology .
b ) An e l ectron gun a s sembly that would be produced separately on a glass button in a g l a s s neck that could be j oined to the p icture tube " bottle " using " sealex " machine s .
c ) Low beam acceleration voltage ( 1 0 0 0 t o 2 0 0 0 V rather than 2 5 , 0 0 0 v typical of current technology ) and electrostatic beam def lect ion rather than elec tromagnetic , thus avoid ing the expen se o f t he cooper wir e , beam deflection c oi l .
d ) Primary power would be provided by a r echargeable battery not inc luded in the e s t imated cost above .
The propo sal has mer it for he lping to rea l i z e Rural Sate l l ite Program obj ectives of prov iding educat ional informat ion and improved health and family plann ing service to rural areas of l e s s developed countr ies .
Fina l l y , we have taken a un ique approach to the problem of defining sy stem design char acteri stics and s ervice f eatures for a smal l , low-co st , earth terminal for Rura l Sate l l ite Program application s . Only general def in ition of service r equ irement s for " typica l " pilot pro j ect app l ication s have been provided . Therefore , we are fol lowing a parametr ic , ma trix plan in e stabli s hing service that can be
provided by severa l prospec t ive technologie s , mentioned in the introduc t ion for this section . The fol lowing as sumpt ions and component parameter values are being u sed in the des ign analys i s :
a ) Typical appl ications will be con s id ered in itially t o b e s tar networks of remote earth termina l s operating wi th a central earth termina l which is INTELSAT S tandard B or equ iva lent in G/T capabi lity . The number of remote earth terminals per network is a parameter of the ana ly s i s .
b ) Space segment s ervice for the network wi ll be provided by lea sed INTELSAT transponder with eithe r global or hemi spher ica l beam coverages , regional satellite (i . e . , PALAPA ) tran sponder , or dome stic sate l l ite ( i . e . , WESTAR or SATCOM) transponder ,
c ) Earth terminal antennas are a s sumed with aperture diameter s of 3 . 0 m , 4 . 5 m , 6 . 0 m , 8 , 0 m , and 1 0 . 0 m .
d ) Earth terminal receiving systems are as sumed to incorporate a low noise amplif ier with an operating temperature of 5 5 ° K , 9 0 ° K , 1 2 0 ° K , 1 5 0 ° K , or 2 0 0 ° K .
e ) The cond it ion s o f ( c ) and ( d ) above provide earth terminal s with G/T ranging from 1 6 . 3 dB/ ° K to 3 0 . 9 dB/ ° K .
f ) Telephony service will be provided us ing companded FM , SCPC techno logy , digitally encoded voice ( i . e . , CVSD or ADM) with QPSK modu lation technology , or synthe s i zed voice ( i . e . , LPC ) with QPSK modulat ion technology .
g ) Service capac ity that can be supported by a quarter tran sponder with combinations o f technologie s and earth termina l character i stics ident i f ied above is being determin ed .
As an example of the study results be ing developed and how these results wi l l be u sed , F igure 4 - 1 1 is a fami ly of curves , parametric in G/T , re lating number s of telephone channe l s that can be provided ver sus the amount of sate l l i te power that is requ ired . The assumed c ond ition s are 1 / 4 transponder of an INTELSAT sate l l ite operating with hemi spher ical beam coverage us ing digital tec2nology at 9 . 6 kb/ s with bit error rate of 1 0 - and QPSK modu la,tion . Operation would be in a star network with an INTELSAT Standard B central termina l . The f igure shows that max imum power avail able for l/ 4 transponder on an INTELSAT satellite u s ing hemi spher ical coverage is 14 dBW or about 2 5 w . If an app l icat ion requ ired 5 0 voice c ircuits , the remote-to-central channels would be provided by the c ombina tions of r emote terminal G/T capabil i ty and as soc iated satell ite power c on sumpt ion shown in Table 4 -l .
We see that it would be impo s s ible to provide the required service with a remote earth
1 2 0

(/) --' w z z 100 <( :I: (..) w z 0 :I: a. w --' w 1-LL 0 a:: w en 10 :E ::::> z
114 TRANSPONDER5 INTELSAT HEMISPHERIC COVERAGE ANTENNA STAR NET WORK WITH STANDARD "B" CENTRAL E��TH STAT ION 9.6 kbps BAUD RATE , BER = fO
REMOTE STAT ION TO CENTRAL STATION OPERAT ION �
.2 .5 1 2 5 10 20 50 100 PERCENT OF AVAILABLE SATEL L I T E POWER
F igure 4 - 1 1 . S atel l ite power required vs . number o f telephone channel s , parametri c in G/T of the receiving earth terminal .
1 2 1

terminal for which the G/T i s 1 7 . 5 dB/ ° K , s ince requ ired power exc eed s the ava il abl e sate ll ite power for 1/4 transponder . Several options r ema in , however , f rom which a select ion can be made which will be infLuenced by a var iety o f add itional consideration s . The information presented in Figure 4 -1 2 he lps in mak ing t hose dec i s i on s . Let • s-aBsume that we will provide the 5 0 duplex c ircuits u s ing a remote t erminal with G/T= 2 2 . 5 dB/ ° K . This option will consume about 5 6 . 5 % ( 5 0 . 1 % +6 . 4 % ) of the satell ite power available from t he
1/4 transponder of an INTELSAT satell ite operating for hemi spher ical coverage . Figure 4 - 1 2 then shows that the receivin g system c a n b e a 4 , 5 -m antenna and low-noi se amp l i f ier for operation at 9 0 ° K or a 6 . 0 -m antenna and low-no ise amp l i f ier for operation at about 1 9 5 ° K . The cost trade-o f f s o f these options will guide the selection .
Thi s study , publ i shed as a techn ical report , wi ll be completed early next f i sc a l year .
Table 4 - 1 . Satell ite Power Required to Provide F if ty Duplex Te lephone Circuits Using Dig ital voice Encoding at 9 . 6 kb/s and QPSK
Modulation , an INTELSAT Standard B Central Earth station , Remote Earth Station s with G/T Ranging from 1 7 . 5 to 3 0 dB/° K ,
and One-Quar·ter Transponder on an INTELSAT Sate l l ite with Hemispher ic Beam Coverage
G/T
Remote -to-Central Central -to-Remote Percent of Required Sate l l i te Power Requ ired Satel l ite Power Ava ilable Power ,
( dB/ ° K ) w dBW w dBW 1/4 Transponder
1 7 . 5 2 0 . 0 2 2 . 5 2 5 . 0 2 7 . 5 3 0 . 0 3 1 . 7
3 9 . 5 1 6 . 0 Doe s not apply . 2 2 . 3 1 3 . 5 Doe s not apply . 1 2 . 6 1 1 . 0 Does not apply .
7 . 1 8 . 5 Does not apply . 4 . 1 6 . 1 Doe s not apply . 2 . 3 3 . 7 Does not appl y .
( Std . B ) Does not apply . 1 . 6 2 . 6
30
20
50 60 10 80 90 100 120 150 200 L NA TEMP, °K
Figure 4 - 1 2 . Earth terminal G/T a s a function of l ow noise amp l i f ier temperature , parametric with antenna aperture diameter .
1 2 2
> 1 0 0 8 8 . 7 5 0 . 1 2 8 . 4 1 6 . 2
9 . 3 6 . 4

ANNEX I ORGANIZATIONAL DIRECTORY
INSTITUTE FOR TELECOMMUNICATION SCIENCES NATIONAL TELECOMMUNICATIONS AND INFORMATION ADMINISTRATION , DEPARTMENT OF COMMERCE
3 2 5 Broadway , Boulder , Colorado 8 0 3 0 3 ( 3 0 3 ) 4 9 7 + extension (FTS d ial 3 2 0 + extens i o n )
Name
DIRECTOR ' S OFFICE
UTLAUT , Wil l i am F . - Director
O ' DAY , Val M . - A s s i stant to the Director for Program Development
WALTERS , W i l l iam D . - Budget and Accounting O f f i cer
STONER , Rus se l l B. - Pub l ications and Technical Information Officer
DIVIS ION 1 - SPECTRUM UTILIZATION
MURRAY , John P. - Associate Director
Spectrum Analys i s , Mod e l i ng & Services ADAMS , Jean E .
EM Environment Characterization MATHESON , Robert J .
Spectrum Planning Methodology HUFFORD , George A .
DIVISION 2 - SYSTEMS TECHNOLOGY AND STANDARDS
HULL, Joseph A . - Assoc iate Director
Systems Requirements Definitions GATES , Harvey M. - Acting
Systems Per formance Criter i a GATES , Harv.ey M .
Communications & Information Technology SEITZ , Neal B .
DIVISION 3 - APPLIED ELECTROMAGNETIC SCIENCE
Associate Director
EM Propagation Research and Analys i s CARROLL, John C . - Acting
Advanced Communication Technology & Applications GRANT , Wi l l iam B .
Propagation Predictions & Model Deve lopment RUSH , Charl e s M .
DIVIS ION 4 - ADVANCED COMMUNICATION NETWORKS
McMANAMON , Peter M . - Assoc iate D i r ector
Communications Protection THOMPSON , Ray E .
Switched Networks LINF IELD , Robert F .
Special i z ed Networks McMANAMON , Peter M. - Acting
1 2 3
3 5 0 0
3 4 8 4
5 4 14
3 5 7 2
5 1 6 2
5 3 0 1
3 2 9 3
3 4 5 7
5 1 3 6
3 5 8 9
3 5 8 9
3 1 0 6
3 8 2 1
3 6 0 1
3 7 2 9
3 4 6 0
3 5 7 0
3 3 5 2
5 2 4 3
3 5 7 0
Room
3 0 2 0
3 0 2 3
3 0 1 9
3 0 0 9
4 5 2 7
4 5 1 7
3 4 2 0
4 5 2 3
2 0 3 0
2 2 1 3
2 2 1 3
2 2 1 9
3 4 2 1
3 4 4 5
3 4 4 7
3 4 1 1
2 2 4 5
2 2 3 8 A
2 2 4 1
2 2 4 5


ANNEX I I ITS PROJECTS FOR FY 8 1
ORGAN I Z ED B Y DEPARTMENT AND AG ENCY
P ro j e c t T i t l e Lead e r
COMMERC E , DEPARTMENT O F
9 1!) 2 4 19 Ma r i t ime Adm i n i s t r a t i o n ( MARAD) MARAD Ass i stance deHaas
N a t i o n a l Ocea n i c and Atmosph e r i c Adm i n i st ra t i o n (NOAA)
9 1 0 4 4 5 2 NOAA-Weather S e rv i ce T e l ecommun i ca t i o ns S tudy Fa r row
N a t i o n a l Telecommun i ca t i on s and I n fo rma t i o n
9 1 00 1 10 9 10 0 1 20 9 1 0 1 1 20 9 1 0 1 1 2 2
9 10 1 1 2 3
9 10 1 1 2 4 9 1 0 3 1 00
9 1 0 4 1 20
9 1 0 4 1 2 1 9 1 0 4 1 2 2
9 1 0 4 1 4 0
9 1 0 4 1 4 1 9 1 0 4 1 4 2 9 1 0 4 1 4 3
9 10 4 1 4 4 9 1 0 5 1 0 0 9 1 0 5 1 0 1 9 1 0 5 1 0 2 9 1 0 5 1 0 3 9 10 5 1 0 4 9 10 7 1 20
9 1 0 7 1 2 2 9 1 0 7 1 23 9 10 7 1 2 4 9 1 0 7 1 25 9 10 8 1 0 1 9 1 0 8 1 0 2 9 10 8 1 0 3 9 1 0 8 1 0 4 9 10 8 1 0 5 9 1 0 8 1 06 9 10 8 1 0 7
Adm i n i st ra t i o n (NTIA) Reg i o n 2 MF Confe rence HF B roadcast WARC UHF Compa rab i l i ty UHF F r equency
A s s i g nment Status T r a d eo f f s fo r E f f i c i e n t U s e
o f the Spe c t r um Expanded FM Capac i ty Und e rsea C a b le/Sa te l l i te
Trade-Offs Da t a Commun i c a t i o n Systems
Pe r f o rmance Standa rds G u i ded Wave Commun i c a t i o n s Mo n t ana/U tah Commun i c a t i o n s
Arch i te c t u re B r o a d c a s t i ng S a t e l l i te
System s 83 RARC Po l i c y Techn i c a l S uppo r t Di r e c t B r oadcast S a t e l l i te TV Rece i v e r - I n te r f a c e
S t a n d a r d s f o r I n f o rma t i on C i r cu i t Mul t i pl i e r S t udy Boundary S t ud i es Standa rds Te r m i n a l Eva l u a t i o n s Common Ca r r i e r Pub l i c K e y Spect rum Eng i ne e r i ng
Deve l o pment Suppo r t RSMS Ope r a t i ons RSMS Deve l o pment Spect rum Resou r c e Assessments 1982 Wo r l d Mob i l e Con f .
M F P r op ag a t i o n VHF/UHF Mea s u r ements Mi l l ime t e r Wave Models Mod e l s and Data Bank HF B roadcast WARC S t ud i e s Atmos ph e r i c E f fe c t s Eng i n ee r i ng Models
DEFEN S E , DEPARTMENT OF (DOD)
A i r 9 1 0 3 4 7 9 9 1 0 3 5 6 4 9 1 0 4 3 7 3 9 1 0 4 4 6 8
9 10 3 4 4 1 9 1 0 35 6 3 9 10 4 4 3 1
Fo r c e Sys tems Comma nd ( ES D ) EFAS/PEP I I P r o g r am Po l a r Ionosph e r i c P ro pa g a t i o n EFAS/PEP I I Prog r am A n a l y s i s Advanced D E B I V E FAS
A i r Fo rce M i s c e l l a neous MSR-Tl Mul t 1 Rece 1 v e r S y s tem Po l a r Ionosph e r i c P r e d i c t i ons AN/MSR- ( ) R e c e i v e r S y s t em
Wa shburn Luc a s Adams
Ha l e
Be r ry Adams
Hul l
S e i t z H u l l
G a t e s
Jenn i n g s Jen n i ng s Jen n i ng s
B l oo m J e n n i ng s Thompson P i e t r a s i e w i c z Pompe r P i et r a s i e w i c z Pompe r
Be r r y Matheson Matheson G r a n t deHaas wa shburn Ch i l ton V i o l e t t e Washburn Rush Dutton H u f f o r d
S k e r j anec Rush S k e r j a n e c S k e r j anec
B a rghausen Rush B a rghausen
Army Commun i c a t i o n Command ( USA/CC) 9 1 0 3 5 5 9
9 1 0 4 4 1 2
9 1 0 4 4 3 2 9 10 4 4 4 7
9 10 4 4 7 4
9 10 4 4 0 5
9 1 0 4 3 97
9 1 0 4 4 1 4 9 1 0 4 4 2 3
I n t e r o pe r a b i l i ty Pa rameter H i e r a rchy
Automated D i g i ta l Systems Eng i n e e r i ng Mo d e l s
HF Antenna S imul a t i o n Automated Troposc a t t e r
P a th Loss Mod e l Automated P re d i c t i o ns fo r
M i xed Mo de L i nk s
A rmy Research O f f i c e ( ARO ) M i l l ime t e r Wave Attenu a t i on
A r my M i s c e l l aneo u s Wide-Band Measurement D a t a
Analys is AADSS Reg i o n a l Mod e l s M i l l imeter Wave Vege t a t i o n
Mo r r i so n
Hause L l o yd
H a u s e
H a u s e
L i ebe
H u f f o r d L i n f i e l d V i o l e t t e
125
P r o j e c t
9 1 0 4 4 4 5
9 10 4 4 4 6 9 1 0 4 4 49
9 1 0 4 4 6 7
9 1 0 4 4 5 8
9 1 0 4 4 29
9 1 0 1 5 3 4 9 10 4 4 2 4
T i t l e
Arml M i sc e l l aneous ( c o n t i nued) M l l 1 m e t e r Wave P r o p ag a t 1 on
Lead e r
Rev i ew Kobayash i DMDG Channel S im u l a t i o n Aust i n La rge Ea r th Term i na l
Antenna Mea s u r ements N e two r k Commun i c a t i o n Model
Ca r r o l l Adams
Naval Research Labo r a to ry ( N R L ) HF Transponders Bog l e
Pa c i f ic M i s s i le Range D i g i ta l M i c r owave Rad i o
Eva l u a t i o n Hubba rd
Defense Commun i c a t i o ns Agency ( DCA) MEECN S im u l a t i o n Aus t i n Spectrum D i s tance Me a s u r ement Hause
ENERG Y , DEPARTMENT OF ( Do E )
9 1 0 4 4 2 2 SPS E l e c t romagn e t i c Compa t i b i l i ty Assessment G r ant
FEDERAL COMMUNICATIONS COMM I S S I ON ( FCC)
9 1 0 4 4 2 5 9 1 0 4 4 5 4
9 1 0 4 4 5 5
9 1 0 4 4 5 6
FCC M F Mea surements So . Ca l i fo r n i a P ropag a t i o n
S tudy , P H I I I So . Ca l i fo r n i a P ropag a t i on
Study, PH I I I So . Ca l i fo r n i a P ropag a t i o n
Stud y , PH I I I
Ca r ro l l
K i s s i c k
K i ss i c k
K i s s i c k
I NTERNATIONAL COMMUN ICATION AGENCY ( ICA)
9 1 0 4 4 3 6 9 10 4 4 7 3
Vo i ce o f Ame r i ca Suppo r t Vo i c e o f Ame r i c a H F
P ropag a t i o n S tud i e s
Agy
Rush
NATI ONAL AERONAUTICS & SPACE ADM I N I STRATION ( NASA)
9 1 0 4 4 57 NASA P ropag a t i o n Wo r k Dutton
TRANSPORTATI O N , DEPARTMENT OF ( Do T )
9 1 0 3 4 8 9
9 1 0 3 5 26 9 1 0 4 4 6 9 9 1 0 4 4 7 1
9 1 0 1 5 3 2
Fed e r a l Av i a t i o n Ad m i n i s t r a t i o n ( FAA) Tech n i ca l Suppo r t for Propag a t i on
a nd Spect rum Eng i nee r i ng Hubba rd A i r Nav i g a t i on A i ds Johnson FAA Rad a r S t ud i e s Ma theson FAA Ai r c r a ft Ca l i b r a t i o n
u . s . Coa s t G ua r d ( USCG ) Cons u l t i ng USCG
K i ss i c k
K i s s i c k
U . S . POSTAL S ERVICE
9 1 0 4 3 8 9 9 1 0 4 4 60
9 1 0 4 4 6 1
OTHER
9 1 0 2 5 8 6
9 1 0 3 56 7 9 1 0 4 3 7 2 9 1 0 4 4 0 1 9 1 0 4 4 1 1 9 1 0 4 4 20 9 1 0 4 4 28 9 1 0 4 4 6 2
9 1 0 4 4 6 3
9 1 0 4 4 7 0
Suppo r t t o ECOM Pro j . O f f . USPS I n t e r conne c t i on
Standa rds Deve lopme nt U S PS Protocol/Inter face Test
I ONCAP Requests
M i sce l l aneous Fede r a l Agen c i es
L i n f i e ld
G l e n Gamauf
teters
HF/VHF Area Coverage Tete rs Ionosph e r i c Ma p p i ng S t udy Rush H i g h A l t i tude Tops i d e No i s e Rush AID As s i s tance Jenn i ng s DM-4 Ope r a t i on a l Deve l o pment Spa u l d i ng T r a ce G a s At ten at 35 GHz Li ebe G ro und-Ai r Propa g a t i o n Rush
M i s c e l laneous Non-Fede r a l Agenc i e s Vo i c e P e r fo rmance
Measurements GOES S i te Survey
H a r tman Sm i th


ANN EX I I I PROJECT INDEX
T i t l e
A c c e s s A r e a D i g i t a l S w i tch i ng S y s t em Reg i o n a l Mo d e l s
Adv a n c e d D i g i ta l E u r o pe a n Bac kbone I V E n h a n c e d Fa u l t A l a rm S y s t em
Agency f o r I n t e r na t i o n a l Deve l o pment As s i s t a n c e
A i r Nav i g a t i o n A i d s AN/MSR- ( ) R e c e i v e r S y s t em Atmo s ph e r i c E f f e c t s Autom a t e d D i g i t a l S y s t em s Eng i ne e r i ng
Page
12
49
1 1 9 12 16 75
Mo d e l s 56 A u tom a t e d P r e d i c t i o n s fo r M i x e d Mode
L i n k s 5 1 A u toma ted T ro p o sc a t t e r P a th L o s s Mo d e l 88
* * * B o u nd a r y S t ud i e s 97 B ro a d c a s t i ng S a te l l i t e S ys t ems 8 3 Reg i o n a l
Ad m i n i s t r a t i v e Rad i o Co n f e r en c e 1 1 3 * * *
C i r c u i t Mul t i pl i e r S t udy 1 1 9 Common Ca r r i e r 1 0 1 C o n s u l t i ng u . s . Coa s t G ua r d 1 5
* * * D a ta Commun i ca t i on S y s t ems P e r fo rma n c e
S ta n d a r d s 3 9 D i g i ta l M i c r owave Rad i o Eva l ua t i on 51 D i r e c t B r o a d c a s t S a t e l l i t e 1 1 5 DM-4 Ope r a t i o na l Deve l o pm e n t 3 6 D i g i t a l M e s s ag e D ev i c e G r o u p C h a n n e l
S i m u l a t i on 50 * * *
E nh a n c ed F a u l t A l a rm S y s t em P E P I I P r og r am 49
Enhanced F a u l t A l a rm S y s t em P E P I I P r o g r am An a l ys i s 49
E ng i ne e r i ng Mo d e l s 8 4 E xp a n d e d F r equency Mod u l a t i o n Capac i ty 8
* * * F e d e r a l Av i a t i o n Adm i n i s t r a t i o n
A i r c r a f t Ca l i b r a t i o n 3 6 F e d e r a l Av i a t i on Adm i n i s t r a t i on
R a d a r S t ud i e s 21 F e d e r a l Commun i c a t i o n s Comm i s s i o n Med i um
F r eq u e n c y Me a s u r em e n t s 93 * * *
G eo s t a t i on a r y O r b i t i ng E n v i r o nmenta l S a t e l l i t e S i te S u r v e y 95
G ro un d -A i r P ro p ag a t i on 91 G u i de d Wave Commun i c a t i o n s 56
* * * H ig h F r equency Antenna S im u l a t i o n 7 4 H i gh F r equency B r o a d c a s t Wo r l d Adm i n i s-
t r a t iv e Rad i o Co n f e r e n c e 90 H i g h F r eq u e n c y B r o a d c a s t Wo r l d Admi n i s-
t r a t i v e Rad i o C o n f e r en c e S t ud i e s 95 H i gh F r equency T ra nspond e r s 93 H ig h F r eq uency/Ve ry H ig h F r eq u e n cy
A r e a Cove r a g e 8 7 H i g h A l t i t u d e Tops i d e N o i s e 7 1
* * * I n t e ro p e r a b i l i ty Pa rame t e r H i e r a r c h y ,
D e v e l o pm e n t o f I ONCAP Reque s t s I o n o s ph e r i c Mapp i ng S t ud y
* * * La r g e E a r th Te rm i na l Ante nna
Me a s u r em e n t s * * *
55 91 88
3 6
Jt
127
T i t l e Page * Ma r i t ime Admi n i s t r a t i o n As s i s ta nce 47 M i n imum E s s en t i a l Eme r g e n c y Commun i ca t i o n s
N e two r k S im u l a t i o n 51 Med i um F r equency P r opag a t i on 93 M i l l im e t e r Wa ve A t t e nu a t i o n 59 M i l l i me t e r Wave Mo d e l s 57 M i l l im e t e r Wa ve P r o p ag a t i o n R e v i ew 6 9 M i l l i me t e r Wav e Veg e t a t i on 6 1 Mo d e l s and D a t a Bank 74 Mon tana/Utah Commun i c a t i o ns A r c h i t e c t u r e 4 3 MSR-Tl Mul t i pl e Rece i v e r S y s t em 26
* * * N a t i o n a l A e r o n a u t i c s and Space Adm i n i s-
t r a t i o n P r opag a t i o n Wo r k 8 4 N e two r k Commun i ca t i o n s Mode l 15 1 982 Wo r ld Mo b i l e C o n f e r ence 47 N a t i o n a l Oce a n i c a nd A tm o s ph e r i c
Adm i n i s t r a t i o n - We a t h e r S e r v i c e Te l e commun i c a t i o n s S t udy 45
* " * * P o l a r I o no s phe r i c P r e d i c t i o n s Po l a r I o n o sph e r i c P r o pa g a t i o ns P o l i c y Tech n i c a l S u ppo r t P u b l i c Key
* * *
84 8 4
1 1 4 102
Reg i o n 2 Med i um F r equency C o n f e rence 96 Ra d i o S p e c t rum Me a s u r em e n t S y s t em
Deve l o pment 1 8 R a d i o S p e c t rum Me a s u r em e n t S y s t em
Ope r a t i on s 1 8 * * *
S o u t h e r n Ca l i fo r n i a P r opag a t i o n S tudy PH I I I 3 1
S pe c t r um D i s t a n c e Me a s u r ements 51 S p e c t rum E ng i n e e r i ng Deve l opme n t S uppo r t 8 S pe c t r um Reso u r c e As s e s sm e n t s 1 7 S o l a r Powe r S a t e l l i t e E l e c t romag n e t i c
Compa t i b i l i ty As s e s sment 1 5 S t a n d a rds 99 S u ppo r t to E l e c t r o n i c Compu t e r O r i g i na t ed
Ma i l P r o j e c t O f f i c e 105 * * *
T e c h n i c a l S uppo r t fo r P r o paga t i on and Spec t rum E ng i ne e r i ng 1 2
T e rm i n a l Eva l u a t i o ns 1 0 1 T r a c e G a s Attenu a t i o n a t 3 5 GHz 7 1 T r a d e o f fs f o r E f f i c i en t U s e o f the
S p e c t r um 5 TV Re c e i v e r - I n t e r f e r ence S ta n d a r d s fo r
I n fo rma t i o n S e r v i c e s 55 * * *
U l t r a H i g h F r eq u ency Compa r a b i l i ty 6 U l t ra H i g h F r equency F r equency As s i g nme�t
S t r a t eg i e s 3 Und e r s e a C a b l e/S a t e l l i te T r ade-o f f 45 U n i ted S t a te s P o s t a l S e r v i c e I nt e r -
connec t i o n S t a nd a r ds Deve l o pment ,
107 U n i ted S ta t e s P o s t a l S e r v i c e P r o to c o l /
I n t e r f a c e Te s t 1 0 4 * * *
Ve r y H i gh F r eq u e n c y/U l t ra H i gh F r equency Me a s u r em e n t s 7 5
Vo i c e o f Ame r i ca H i g h F r equency P r opag a t i o n S t ud i e s 90
Vo i ce o f Ame r i ca S uppo r t 90 Vo i c e P e r f o rm a n c e Me a s u r em e n t s 50
* * * W i de-Band Mea s u r em e n t D a ta Ana l y s i s 8 8

1 1 1 1 1 1 1 1 1 1 1 1 1 1 1 1 1 1 1 1 1 1 1 1 1 1 1 1 1 1 1 1

ANNEX IV ITS PUBLICATIONS - F I SCAL YEAR 1 9 8 1
Agy, V . L . , and c . M . Mellecker ( 1 9 8 1 ) , FY 8 0 progress report to International Communications Agency, Voice of America , Contract IA- 1 9 2 3 3 - 2 3 , NTIA Technical Memorandum 8 1- 5 3 , Apr i l , 1 2 pp .
Agy , V . L . , and c . M. Rush ( 1 9 8 1 ) , Required power to a s sure satis factory reception of high frequency broadcast s ignal s , NTIA Technical Memorandum 8 1- 5 7 , June , 6 0 pp .
Akima , H . ( 1 9 8 1 ) , Broadcasting-satell ite and fixedsatel lite service considerations after the 1 9 7 9 World Administrative Radio Conference , NTIA Report 8 1 - 7 0 , Apri l , 4 7 pp . (NTIS acc es s . no . not yet ava i labl e ) •
Bloom , L . R . , A . G . Hanson , R. F . Linfield , and D . R . Wortendyke ( 1 9 8 0 ) , VIDEOTEX systems and services , NTIA Report 8 0 - 5 0 , Octobe r , 1 5 9 PP • (NTIA Acces s . No . PB 8 1- 1 5 3 5 1 2 ) .
Chilton , c . J . ( 1 9 8 1 ) , Wave interaction observations o f ionospheric modification in the D-region , NTIA Report 8 1- 6 6 , March, 4 0 pp . (NTIS Acc e s s . No . PB 8 1- 1 9 4 2 7 6 ) .
Chilton , c . J . , A . H . Died e , w . M . Welch , R . A . McLean , and F . G . Stewart ( 1 9 8 1 ) , Transportable Automated E lectromagnetic Compatibility Measurement System ( TAEMS ) , NTIA Report 8 1- 5 8 , January , 1 3 8 pp . (NTIS Acce s s . No . PB 8 1 - 17 7 0 0 8 ) .
Chilto n , c . J· . , H . B . Janes , R . A . McLean , and D . Smith ( 1 9 8 1 ) , Some mobile VHF measurements i n an urban environment , NTIA Report 8 1- 6 0 , January , 4 2 pp . (NTIS Acce s s . N o . PB 8 1- 1 7 8 4 3 6 ) .
coll ins , J. T . ( 1 9 7 9 ) , Test procedures for measuring the performances of MF AM radio s with 9 a�d 10 kHz adj acent channel interferenc e , NTIA Techn�cal Memorandum 7 9 - 2 0 , October (printed in December 1 9 8 0 ) , 34 pp .
Crombie , D . D . ( 1 9 8 0 ) , Scanning the i s sue , Guest editorial for Special I s sue on E f f ici ent U s e of the Spectrum, Proc . IEEE �· No . 1 2 , Decembe r , p p . 1 4 5 7- 1 4 5 9 .
de Haa s , T . , and c . C . Watterson ( 1 9 8 1 ) , An ana lys i s o f the compatibil ity of spread-spectrum and narrowband FM mobile radio systems in the 1 5 6 to 1 6 2 MHz band , u . s . Dept . of Commerce , Mar i t ime Administration Report MA-RD- 9 4 0- 8 1 0 1 1 , Apr i l , 5 7 pp . , (NTIS Acce s s . No . PB 8 1 - 1 5 7 7 1 1 ) .
Dougherty , H . T . , and E . J . Dutton ( 1 9 8 1 ) , The role of elevated ducting for radio service and interference f i e ld s , NTIA Report 8 1- 6 9 , March , 60 PP • (NTIS Acces s . No . PB 8 1 - 2 0 6 1 3 8 ) .
Dutton , E . J . , and D . P . Anderson ( 1 9 8 1 ) , Common carrier microwave study ( U ) , Volume I I , NTIA Technical Memorandum 8 1- S SC , May , 1 2 2 pp . ( Cl a s s i f i ed ) .
Dutton , E . J . , and D . P . Anderson ( 1 9 8 1 ) , Common carrier microwave study ( U ) , Volume I I I , NTIA Technical Memorandum 8 1 - 6 2C , September ( C l a s s i f ie d ) .
Farrow , J . E . , and L . G . Hause ( 1 9 8 1 ) , Recommendations for digital radio common tactic a l / long-haul standard s , NTIA Report 8 1- 7 4 , May , 6 0 p p . (NTIS acce s s . no . not yet available ) .
Gallawa , R . L . ( 1 9 8 1 ) , E stimated cost of a submarine f iber cable system, NTIA Report 8 1 - 5 9 , January , 24 pp . (NTIS Acce s s . No . PB 8 1 - 1 8 1 9 7 6 ) .
Gamauf , K . J . ( 1 9 8 1 ) , Network development and simulation , NTIA Technical Memorandum 8 1 - 5 8 , Ju l y , 42 pp .
Glen, D . V . ( 1 9 8 1 ) , Guide l ine s to telecommun ications interconnection requirements for message input to the USPS E-COM system, NTIA Report 8 1 - 7 3 , Apr i l , 4 6 pp . (NTIS Acces s . No . PB 8 1 - 2 1 7 1 2 7 ) .
Glen , D . v . , and R . E . Thompson ( 1 9 8 1 ) , Need for telecommunication standards for interconnection with the u . s . Postal Service EMS S , NTIA Report 8 1 - 6 2 , February, 4 4 pp . (NT I S Acc e s s . No . PB 8 1 - 1 8 1 9 8 4 ) .
1 2 9
Grant , W . B . , E . L . Morrison, and J . R . Juroshek ( 1 9 8 1 ) , E f fects of the satell ite power sys tem on low earth orbit and geosynchronous sate l l ites , NTIA Report 8 1 - 7 5 , June , 8 6 pp . (NTIS Acces s . No . PB 8 1 - 2 3 2 0 1 9 ) .
Haakinson , E . J . ( 1 9 8 1 ) , Proposed techniques for adding FM broadcast stations in a maj or marke t , Part I I , NTIA Report 8 1- 7 7 , July , 2 8 pp . (NTIS acce s s . no . not yet available) .
Hal e , W . K . ( 1 9 8 0 ) , Frequency assignment methodology : An annotated bibl iography , NTIA Special Publication 8 0- 1 0 , November, 42 pp . (NTIS Acce s s . No . PB 8 1 - 1 5 3 4 2 1 ) .
Hanson , D . W . , P . M . McManamon, and w. J . Pomper ( 1 9 8 1 ) , Advanced WESTAR Ku-Band marketing study , NTIA Technical Memorandum 8 1 - 5 2 , March, 5 6 pp .
Hartman, W . J . ( 1 9 8 1 ) , A critique of some pub lic-key cryptosystems , NTIA Report 81- 7 9 , Augu s t , 46 pp . (NTIS acces s . no . not yet available ) .
Hau s e , L . G . ( 1 9 8 1 ) , Selective fading on a long 8 GHz line-of- sight path in Europe, NTIA Report 8 1 - 8 4 , September , 1 0 1 pp . (NTIS acce s s . no . not yet ava ilab l e ) .
Hershey , J . E . ( 1 9 8 0 ) , Implementation of Mitre public key cryptographic system, Electron . Letters 1 6 , No . 2 4 , November 2 0 , pp . 9 3 0- 9 3 1 .
Hershey, J . E . ( 1 9 8 0 ) , A spectrally preconditioned threshold logic uni t , Proc . of 5th International Conference on Pattern Recognition , Miami Beach , FL , December 2 , pp . 6 8 0 - 6 8 4 .
Hershey, J . E . ( 1 9 8 1 ) , The discrete logarithm public cryptographic system, NTIA Report 8 1 - 8 1 , September , 4 8 pp . (NTIS acces s . no . not yet available ) .
Hershey , J . E . , and W . F . Lawrence ( 1 9 8 1 ) , Counter synchron i zation using the Thue-Mor se sequence and PSK, IEEE Trans . Commun . COM- 2 9 , No . 1 , Januar y , pp . 7 9- 8 0 .
---
H i l l , D . A . , and J . R . Wait ( 1 9 8 0 ) , Electromagnetic character istics of a coaxial cable with periodic s lots , IEEE Trans . El ectromagnetic Compatibility EMC - 2 2 , N o . 4 , November , pp . 3 0 3 - 3 0 7 .
Hi l l , D . A . , and J . R. Wait ( 1 9 8 1 ) , HF ground wave propagation over sea ice for a spherical earth mode l , IEEE Trans . Ant . Prop . AP- 2 9 , N o . 3 , May , pp . 5 2 5- 5 2 7 .
-----
Jenning s , R . D . ( 1 9 8 1 ) , Television field strength and home receiving system gain measurements in northern I l linoi s , NTIA Report 8 1 - 6 8 , Marc h , 1 9 2 pp . (NTIS Acce s s . No. PB 8 1 - 2 0 7 9 4 6 ) .
Juroshek , J . R . ( 1 9 8 1 ) , Analy s i s of interference caused by the solar power sate l l ite to sate llite earth termina l s , NTIA Report 8 1- 6 4 , February, 43 pp . (NTIS Access . No . PB 8 1 - 1 9 4 2 6 8 ) .
Juroshek, J . R . , D . D . Crombie , and G . E . Wasson ( 1 9 8 0 ) , Measurements of interference between AM radios due to local o s c i l lator radiation, NTIA Report 8 0 - 5 6 , December , 2 6 pp . (NTIS Acce ss . No . PB 8 1 - 1 7 7 5 3 7 ) .
Juroshek , J . R . , and F . K . Steele ( 1 9 8 1 ) , Analysis of interference from the solar power sate l l ite to general electronics systems , NTIA Report 8 1- 6 5 , February , 4 0 pp . (NTIS Acces s . N o . PB 8 1 - 1 9 4 2 5 0 ) .
Juroshek , J . R . , and F . G . Stewart ( 1 9 8 1 ) , Analysis of a phase- locked loop to suppress interference from a solar power satellite , NTIA Report 8 1 - 6 3 , February, 23 pp . (NTIS Acces s . No . (PB 8 1- 1 9 3 7 8 1 ) .
K i s s ick , W . A . ( 1 9 8 0 ) , The coverages of the MF and VHF maritime d i s tress communication system s , NTIA Report 8 0 - 5 2 , October , 1 3 9 pp . (NTIS Acce s s . No . PB 8 1 - 1 5 5 1 2 9 ) .
Layton , D . H . ( 1 9 8 1 ) , A high-frequency broadband transmitter for mono static system s , NTIA Technical Memorandum 8 1 - 5 9 , July , 94 pp .

Liebe , H . J . ( 1 9 8 0 ) , Field maxima ins ide habitable structures exposed to 2 . 4 5 GHz plane wave radiation , NTIA Report 8 0 - 4 9 , October , 37 pp . (N'I'IS Acce s s . No . PB 8 1 - 1 551 3 7 ) .
Mathe son , R. J . ( 1 9 8 0 ) , DM- 4 operation and maintenance manual , NTIA Technical Memorandum 8 0 - 5 0 , November , 1 1 8 PP ·
Matheson , R. J . ( 1 9 8 0 ) , Measurements of electromagnetic noise radiated from automotive ignition sys tems , NTIA Report 8 0 - 5 4 , November , 33 pp . (NTIS Acces s . No . PB 8 1 - 1 5 3 6 1 1 ) .
Middleton , D . , and A . D . Spaulding ( 1 9 8 0 ) , Determini st i c signals and interference i n FM reception: The " instantaneou s " approac h , with undi storted input s , Proc . IEEE 6 8 , No . 1 2 , December , pp . 1 5 2 2 - 1 5 3 6 .
--
Mor r i son , E . L . , w . B . Grant , and E . J . Dutton ( 1 9 8 1 ) , Electromagnetic compatibi l i ty analysis for a Satell i te Power System receiving s i te i n the Moj ave Desert , NTIA Report 8 1- 7 6 , Jun e , 8 6 pp . (NTIS Acce s s . No . 8 2 - 1 0 0 7 1 0 ) .
Nesenbergs , M . , W. J . Hartman , and R . F . L inf i e ld ( 1 9 8 1 ) , Performance parameters for d igital and analog service modes , NTIA Report 8 1 - 5 7 , January , 2 9 4 pp . (NTIS Acce s s . No . PB 8 1 - 1 7 6 4 5 5 ) .
Nesenbergs , M . , and R. F . L infield ( 1 9 8 0 ) , Three typical blocking aspects of access area telatraf f i c , IEEE Trans . Commun . COM- 2 8 , No . 9 , September , pp . 1 6 6 2 - 1 6 6 7 .
------
Rus h , C . M . ( 1 9 8 1 ) , HF propagat ion : What we know and what we need to know , Proc . of Second International Conference on Antennas and Propagation , University of Yor k , Hesl ington , York , United Kingdom, April 1 3 - 1 6 , pp . 2 2 9 - 2 3 4 .
Ru s h , C . M . , C . M . Mellecke r , and G . H . Stonehocker ( 1 9 8 0 ) , A compar ison of the e f f ects of ionospher i c
gradients o n ground-based and transionospheric HF systems , NTIA Technical Memorandum 8 0- 5 1 , November , 4 4 pp .
Ru sh , C . M . , A. L . Snyder , E . Z i emba , V. Patterson , T . Tasc ione , and D . Nelson ( 1 9 8 0 ) , Satellite measurements of the HF radio environment i n the topside ionosphere , Radio S c i . 1 5 , No . 6 , November-December , pp . 1 1 2 7 - 1 13�
Ru s h , c. M . , E. J. Violette , R . H. Espeland , and J . c . Carro l l ( 1 9 8 1 ) , Performance o f VLF , LF , and MF telecommunication systems in a simulated Satellite Power System environment ascertained by experimental means , Radio Sc i . 1 6 , No . 2 , March-Apr i l , pp . 2 1 9 - 2 3 4 .
-
S e it z , N . B . ( 1 9 8 0 ) , Interim Federal Standard 1 0 3 3 reference manual , NTIA Report 8 0- 5 5 , December , 125 pp . (NTIS Acce s s . No . PB 8 1 - 1 7 4 8 9 8 ) .
Spaulding , A. D . ( 1 9 8 1 ) , Opt imum threshold s i gnal detect ion in broadband impu l s ive noise employing both time and spatial sampl ing , IEEE Trans . Commun . COM- 2 9 , No . 2 , February , pp . 1 4 7 - 1 5 2 .
Spaulding , A. D . ( 1 9 8 1 ) , El ectromagnetic noise and interference , Review of Radio S c ience , s . A . Bowh i l l ( Ed . ) , ( International Union o f Radio S c ienc e ,
Bru s se l s , Belgium ) , pp . E-1 - E- 1 3 .
Spaulding , A. D . ( 1 9 8 1 ) , Vo ice communication system performance i n the presence of automotive ignition no ise , Proc . of 4 th Sympos ium and Technical Exhibition on Electromagnetic Compat i b i l ity , Zurich , Switzerland, March 1 0- 1 2 , pp . 3 7 - 4 1 .
Spi e s , K . P . , and E . J . Haakinson ( 1 9 8 0 ) , Calculation of geostationary satel l i te footpr ints for certain ideal ized antenna s , NTIA Report 8 0- 5 1 , October , 5 6 pp . (NTIS Acce s s . No . PB 8 1- 1 6 8 3 7 9 ) .
Spie s , K . P . , and s . J . Paulson ( 1 9 8 1 ) , TOPOG : A compute r i zed worldwide terrain elevation data base generation and retrieval system, NTIA Report 8 1 - 6 1 , February , 2 1 4 pp . (NTIS Acce s s . No . PB 8 1 - 1 8 2 4 9 5 ) .
Stee l e , F . K . ( 1 9 8 1 ) , Present and future needs for propagation models and data i n telecommunications , NTIA Technical Memorandum 8 1 - 5 6 , May , 12 pp .
Utlaut , w . F . ( 1 9 81 ) , Guest editor i a l , Special Joint I s sue of IEEE Trans . on Spectrum Management after the 1 9 7 9 world Admi n i strative Radio Conference (WARC ) , August .
Violett e , E . J . , R . H . Espeland , A . R. Mit z , F . A. Goodknight , and F . Schwering ( 1 9 8 1 ) , SHF-EHF propagation through vegetation on Colorado East Slope , u . s . Army Communications-Electronics Command Research and Development Technical Report CECOM- 8 l -CS 0 2 0-F , (Fort Monmouth , NJ 0 7 7 0 3 ) , June , 1 0 6 pp .
Wait , J . R . , and D . A. H i l l ( 1 9 8 0 ) , F ie l ds of a horizontal loop of arbitrary shape buried in a two- layer earth , Radio S c i . 1 5 , No . 5 , September-October , pp . 9 0 3 - 9 1 2 .
--
Watter son, C . C . ( 1 9 8 1 ) , HF channe l - s imulator measurements on the KY- 8 7 9/P FSK burst-communication modem - Set 1 , NTIA Contractor Report 8 1 - 1 3 , Augu s t , 9 4 pp . {NTIS acc e s s . no . not yet available ) .
W i l l i ams , J . G . ( 1 9 8 1 ) , Dome stic interconnection arrangements for Datel service s , NTIA Report 8 1 - 6 7 , March , 94 pp . {NTIS Acces s . No . PB 8 1 - 1 9 3 7 7 3 ) .
1 3 0
AVAILABILITY OF PUBLICATIONS -
NTIA Reports , Spec ial Pub l ication s , and Contrac tor Reports are available from the National Technical Information service , 5 2 8 5 Port Royal Road , Spring field , VA 2 2 1 6 1 . Order by acce s s ion number shown in publications l i sting . Technical Memoranda are not generally ava i lable , but additional information may be secured by contacting the author . Reque sts for copies of j ournal articles should be addressed to the j ourna l .

ANNEX V
GENERAL AND HISTORICAL INFORMATION OF ITS
The Institute for Telecommunication Sciences ( ITS ) , l argest component of the Na�i�nal T7lecommunications and Information Adm�n�strat�on , i s located at the Boulder Laboratories of the Department o f Commerce and has ( a s of Sept . 3 0 , 1 9 8 1 ) a full-time permanent staff o f 9 0 and other staff of 22 . In FY 1 9 8 , its support con s isted of $ 4 . 1 million of direct funding from commerce and $ 5 . 0 mil l ion in work sponsored by other Federal agencies .
The Boulder Laboratories include research and engineering components of the National Bureau of Standards , the National Oceanic and Atmospheric Administration , and the National Telecommunications and Information Administration . Common administrative services are the rule in the Boulder Laboratories . The Radio Bui lding , which houses ITS , is on the u . s . Department of Commerce campus at 3 2 5 Broadway . In addition to ITS , the National Telecommunications and Information Administration also has its Boulder D ivi sion of the Office of Policy Analysis and Development located in the 3 0 th Street Building o ff Basel ine Road in Boulder .
The following brief history shows the Institute ' s beginnings . The Radio Section of the National Bureau of Standards was founded prior to Wor ld War I and p layed a maj or role in the evolution of our under standing of radio propagatiop . Dr . J . H. Dell inger , its d irector for most of the period up until World War I I , was strongly convinced of the importance of research and gave it practical appl ication as first chairman of the Study Group on Ionosphere Propagation in the CCIR .
During World War I I , the Interservice Radio Propagation Laboratory ( IRPL ) was organized at the National Bureau of Standards , under the direction of Dr . Del l inger . His group provided a common focus for military needs in propagation during the war . In 1 9 4 6 , the Central Radio Propagation Laboratory (CRPL) was established , and in its early years had direct ties with the Defense Department 1 for example , senior off ic ials of DoD would appear before Congress to defend the CRPL budget . In 1 9 4 9 , Congressional concern for the vulnerability of Goyernment laboratories located in Washington , DC , and the crowding of the NBS Connecticut Avenue campus made it advisable for the radio research work to be taken e lsewhere .
Three s ite s , one in California , one in Colorado , and one in I llino i s , were considered , and Boulder , Colorado , was selected . The f irst group from CRP L , which at that time included radio standards work , moved to Colorado in 1 9 5 1 , and the move was completed in 1 9 5 4 , during which year President E isenhower dedicated the NBS Radio Building . The Radio Standards program left CRPL at the time of the move to Boulde r , and has pursued a paral l e l existence at Boultier in NBS since that time .
1 3 1
I n 1 9 5 4 , CRPL consisted o f two research d ivisions : Radio Propagation Physic s · and Radio Propagation Engineering . The Radio Systems Division was formed in 1 9 5 9 . In 1 9 6 0 , the Upper Atmosphere and Space Physics D ivision and the Ionosphere Research and Propagation Division were formed from the Radio Propagation Physics Division . In 1 9 6 2 , CRPL received a full-time director , Dr . C . Gordon Little . In 1 9 6 5 , Dr . H . Herbert Hol loman , f irst Assistant Secretary for Science and Technology in Commerce , implemented a decision to unify geophysics in Commerce with the creation of the Environmental Science Services Administration (ESSA) , made up of the Weather Bureau , the Coast and Geodetic Survey , and the Central Radio Propagation Laboratory . At that time , the CRPL was renamed the Institute for Telecommunication Sciences and Aeronomy ( ITSA) . In 1 9 6 7 , the - Institute for Telecom
munication Sciences came into being . It con-tained the telecommunications-oriented activities of ITSA . Dr . E . K . Smith served as an interim director for one year and was fol lowed by R . c . Kirby who was director for the ensuing three year s .
Meanwhil e , i n Washington , maj or attention was being given to the organization of telecommunications in the Federal establishment , and the Department of Commerce established an Office of Telecommunications in 19 6 7 . Reorganization Plan No . 1 of 1 9 7 0 and Executive Order 1 1 5 5 6 established the Office of Telecommunications Policy (OTP ) in the Executive Office of the President , and assigned additional responsibilities to th� Secretary of Commerce in support of OTP . To meet the se responsibilities , the Off ice of Telecommunications (OT ) was g iven expanded responsibilities on September 2 0 , 1 97 0 , and ITS , along with its programs , property , personnel , and f i scal resources , was transferred to OT .
In 1 9 7 1 , Douglass D . Crombie became director of ITS . ITS has shifted from its strong emphasis on radio wave propagation and antennas s ince 1 9 7 0 in the d irection of applications in spectrum management and in telecommunication systems .
In March 1 97 8 , President Carter signed Executive Order 1 2 0 4 6 which established the National Telecommunications and Information Admini'stration and merged some of the functions of the Office of Telecommunications Policy with those of the Office of Telecommunications in the new agency . ITS was assigned the responsibilfty of managing the telecommunications technology research programs of NTIA and providing research support to other elements of NTIA as well a s other agencies o n a reimbursable basis . Among o ther assigned tasks, the Institute was to remain " • • • the central Federal Government laboratories for research on transmission o f radio waves . "

I n January 1 9 8 1 , D r . Wi l l iam F' . Utlaut a s sumed responsibi l i ty for the direction of the I n stitute . A maj or re-evaluation of programmatic and organ i z ation s tructure i s be ing carried out under his direction to re-define and a l ine the e fforts o f ITS to meet changing requirements and responsib i l itie s .
ITS and its predece s sor organi zations have always played a strong role in pertinent scientific ( URSI ) , profess ional ( IEEE ) , national ( IRAC ) , and international ( CCIR) telecommunications activitie s . The director of CCIR f rom 1 9 6 6 to 1 9 7 4 wa s Jack W . Herbstre i t , a former deputy director o f CRPL and ITSA, and the current CCIR Director i s Richard C . Kirby , formerly director o f ITS . At the present t ime , the U . S . preparatory work for two of the- e leven S tudy Groups o f CCIR i s chaired b y members o f I T S ( U . S . Study Groups 1 and 6 ) , and staff members o f ITS partic ipate i n many o f the other S tudy Group s . I':PS act ive ly support s the Interdepartment Radio Advi sory Committee ( I RAC ) , and the chairman o f i t s Standards Working Group ( J . A. Hul l ) is a member o f ITS management .
The work which ITS does for other agencies in the Government derives its l egal authorities f rom 15 U . S . C . 2 7 2 ( 3 ) " Advi sory Services to Government Agenc ies on Scientific and Technical Problem s " and 1 5 u . s . c . 2 7 2 ( f ) " Invention and Deve lopment of Devices to Serve Special Needs o f Government . " As a matter o f F ederal pol icy , NTIA doe s not accept work more appropr iately done by o ther nongovernment o r government organi z ation s . I t i s a l so a matter of policy that a l l sponsored work reinforce NTIA ' s overa l l program and that it be c l ear that other agencies , industries , or universities could not serve equal ly we l l or better .
Within these policy guide s , ITS aspires to being the Federal laboratory for research in telecommunication s . I t i s clear that the Government has a r e spons ibi l i ty to p ur s ue long-range s tudies i n telecommunications which are not economically prof i table for industry . It i s a l so clear that the Government must have i t s own , independent laborator ies to a s s e s s the s ignif icance o f research conducted e l sewhere . Towards these ends , ITS s tr ives to maintain a knowledgeable staff that is working on the frontiers o f technology and is in touch with the telecommunications problems of the Federa l Government . The Department o f Defense has long been the primary source of advanced technology . At the present time , the largest part o f the other agency sponsorship of ITS come s from needs of the Department o f Defense . ITS maintain s , however , a s ignificant portion of i t s other agency work in support o f civil ian Federal agenc i e s , where there i s a l so c lear need for Government expertise in high technology area s .
1 3 2

INSTITUTE for TELECOMMUNICATION SCIENCES
Director - Dr. William F. Utlaut
Secretary - Marcia L. Geissinger
Deputy Director -
PROGRAM DEVELOPMENT
Val M. O'Day
ADMINISTRATION
William D. Walters
J DIVISION 1
SPECTRUM UTILIZATION
Associate Director - John P. Murray
Secretary - Elizabeth L. McCoy
I-- SPECTRUM ANALYSIS, MODELING & SERVICES Jean E. Adams � EM ENVIRONMENT CHARACTERIZA liON Robert J. Matheson
'--- SPECTRUM PLANNING METHODOLOGY Dr. George A. Hullord
t DIVISION 2
SYSTEM TECHNOLOGY & STANDARDS
Associate Director - Joseph A. Hull
Secretary - Marylyn N. Olson
1-- COMMUNICA liONS & INFORMATION TECHNOLOGY Neal B. Seitz � SYSTEMS PERFORMANCE CRITERIA Dr. Harvey M. Gates
L._ SYSTEMS REOUIRMENTS DEFINITIONS Dr. Harvey M. Gates, Acting
PUBLIC & TECHNICAL INFORMATION OFFICE
Russell B. Stoner
DIVISION 3 APPLIED ELECTROMAGNETIC SCIENCE
Associate Director -
Secretary - Jean R. Mollard
I-- EM PROPAGATION RESEARCH & ANALYSIS John C. Carroll, Acting
I-- ADVANCED COMMUNICATION TECHNOLOGY & APPLICATIONS William B. Grant
L_ PROPAGATION PREDICTIONS & MODEL DEVELOPMENT Dr. Charles M. Rush
I DIVISION 4
ADVANCED COMMUNICATION NETWORKS
Associate Director - Dr. Peter M. McManamor
Secretary - Patricia Sanchez
f-- COMMUNICA liONS PROTECTION Ray E. Thompson
I-- SWITCHED NETWORKS Robert F. Linfield
L- SPECIALIZED NETWORKS Dr. Peter M. McManamon. Acting


