Institute for Security Studies Pardee Center for International Futures African Futures 2050.
46
Institute for Security Studies Pardee Center for International Futures African Futures 2050 African Futures 2050
-
date post
19-Dec-2015 -
Category
Documents
-
view
228 -
download
0
Transcript of Institute for Security Studies Pardee Center for International Futures African Futures 2050.
Institute for Security Studies
Pardee Center for International Futures
African Futures 2050African Futures 2050

African Futures Project 2050
Institute for Security Studies (Africa in the New World 2008)
Frederick S. Pardee Center for International Futures
The Founding The Founding PartnersPartners

African Futures 2050
Demographics and human development
Economics with strengths and challenges
Socio-political elements and choices
Sustainability
Elements of a Elements of a Story about Story about
Africa’s Future:Africa’s Future:

African Futures 2050
Global Transformations
Actions within Africa
Telling a Story Telling a Story about Africa’s about Africa’s Future (Key Future (Key
Uncertainties):Uncertainties):
A Tool for the Story: International Futures (IFs)
PopulationPopulation

PopulationPopulation
A Tool for the Story: International Futures (IFs)
EconomyEconomy
PopulationPopulation

A Tool for the Story: International Futures (IFs)
EducationEducation
HealthHealth
EconomyEconomy
PopulationPopulation
AgricultureAgriculture
EnergyEnergy
TechnologyTechnology
Environmental Resources and Quality
Environmental Resources and Quality
Socio-PoliticalSocio-
Political
InternationalPolitical
InternationalPolitical

The IFs Project
Free to anyone
www.ifs.du.edu
Non-commercial and open
Used by the UNEP’s GEO 4, US NIC, and EU projects
FreeFree++
OpenOpen

Slide 9
African Regions for the African Futures Project
Not identical to AU regions

Slide 10
Population: An Impending Global TransformationBy 2030 Africa will be larger than China or India
1960: <10 percent of world2010 ~15 percent of world2100 ~32 percent of world
A thread of the report story: Africa’s growing (positive) importance in the world
200
400
600
800
1000
1200
1400
1600
1800
2000
2200
Millio
n P
eople
Year1967 1975 1983 1991 1999 2007 2015 2023 2031 2039 2047
Africa China India USA EU27

Slide 11
African Population: Critical Regional Differences
1960 Eastern/Southern < 2
2050 Eastern/Southern ~ 3

Slide 12
African Population: The Past and Future of Fertility
2
3
4
5
6
7
Bir
ths
per
Wom
an
Year1967 1975 1983 1991 1999 2007 2015 2023 2031 2039 2047
AFP Central Africa AFP Eastern Africa AFP Northern Africa
AFP Southern Africa AFP Western Africa
Slide 13
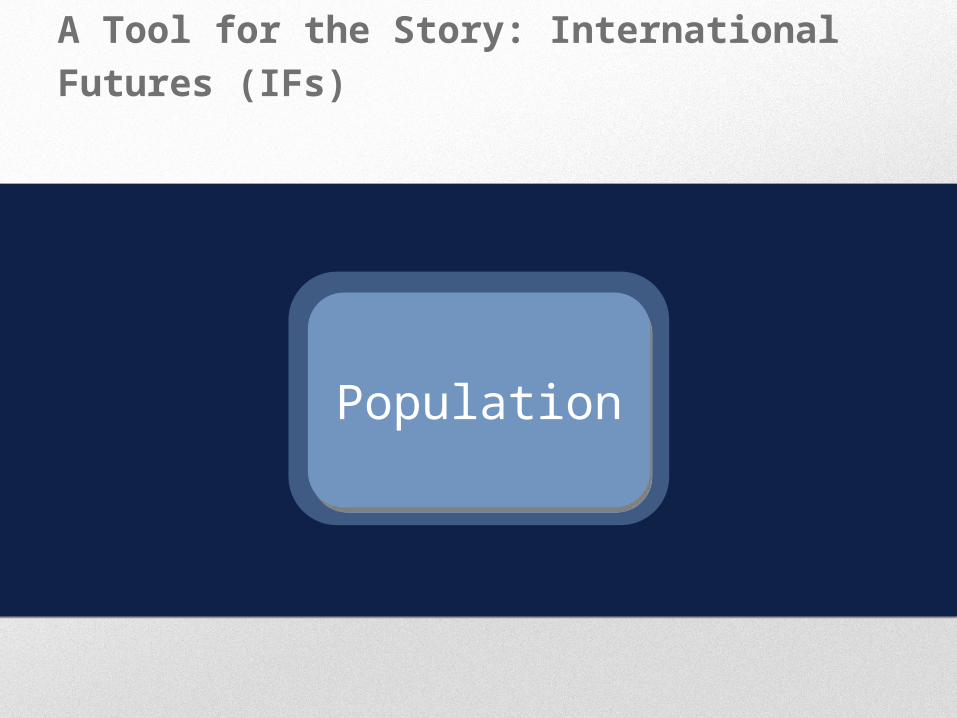
African Population: Growing Demographic Dividend in Global Context
56
58
60
62
64
66
68
70
72
Perc
ent of popuation b
etw
een 1
5-6
5 y
ears
of age
Year2008 2012 2016 2020 2024 2028 2032 2036 2040 2044 2048
Africa China India USA EU27

Slide 14
African Population: Urbanization in Global Context
1960 Africa 19 percent2010 Africa ~ 41 percent2050 Africa ~ 55 percent
A thread of the report story: Urbanization and economic dynamism
20
30
40
50
60
70
80
90
Urb
an p
opula
tion a
s perc
ent of to
tal
Year1967 1975 1983 1991 1999 2007 2015 2023 2031 2039 2047
Africa China India USA EU27

Slide 15
African Human Development: Global Context
0.40
0.45
0.50
0.55
0.60
0.65
0.70
0.75
0.80
0.85
0.90
0.95
1.00
Index
Year1980 1987 1994 2001 2008 2015 2022 2029 2036 2043 2050
Africa China India USA EU27

Slide 16
African Literacy: Global ContextIndia as a Model for African Development?
A thread of the report story: India as a model for Africa
65
70
75
80
85
90
95
100
Literacy Rates
Perc
ent
Year2008 2012 2016 2020 2024 2028 2032 2036 2040 2044 2048
Africa China India USA EU27

Slide 17
African Literacy: Regional Differences
50
55
60
65
70
75
80
85
90
95
100
Per
cent
Year2007 2011 2015 2019 2023 2027 2031 2035 2039 2043 2047
AFP Central Africa AFP Eastern Africa AFP Northern Africa
AFP Southern Africa AFP Western Africa

Slide 18
African Health and Life Expectancy: Regional Context
40
45
50
55
60
65
70
75
80
Years
Year1967 1975 1983 1991 1999 2007 2015 2023 2031 2039 2047
AFP Central Africa AFP Eastern Africa AFP Northern Africa
AFP Southern Africa AFP Western Africa
Slide 19
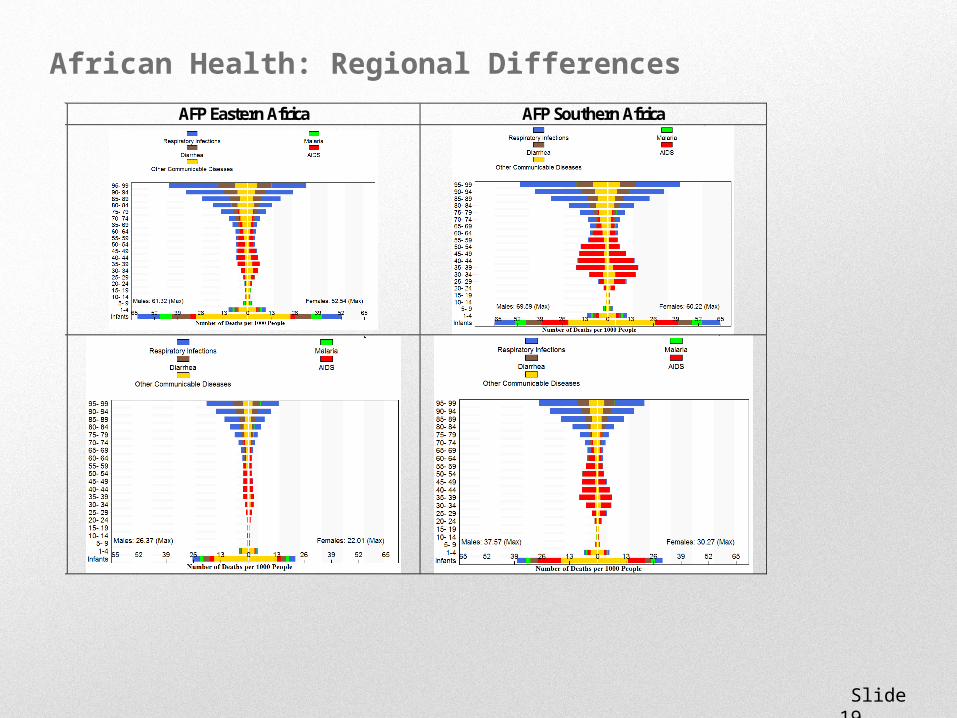
African Health: Regional Differences
AFP Eastern Africa AFP Southern Africa
2010
2030

Slide 20
African Health: An ImpendingTransition
Absolute numbers of deaths cross in 2025; in 2050 obesity rate will be near under-nutrition rate
20
40
60
80
100
120
140
160
180
200
220
240
Mill
ion
year
s
Year2008 2012 2016 2020 2024 2028 2032 2036 2040 2044 2048
Communicable disease Non-communicable disease Injuries and accidents

Slide 21
African Economy: Accelerating Growth?
Source: McKinsey Global Institute, Lions on the Move

Slide 22
Global Transformation: China-Africa Trade (Billion $)
Source: Simon Freemantle & Jeremy Stevens, Confronting some of the major criticisms of Sino-Africa ties, Economics: BRIC and Africa Standard Bank, 5 March 2010, p 5
Threads of the report story: Growing importance to Africa of ChinaGrowing South-South Linkages

Slide 23
African Economy: Regional Variation Historically
A thread of the report story: Great diversity within Africa
0.2
0.4
0.6
0.8
1.0
1.2
1.4
1.6
1.8
2.0
2.2
Thousa
nd 2
000 d
olla
rs p
er
capita
Year1960 1970 1980 1990 2000 2010
Central Africa Eastern Africa Northern Africa Southern Africa Western Africa
Slide 24
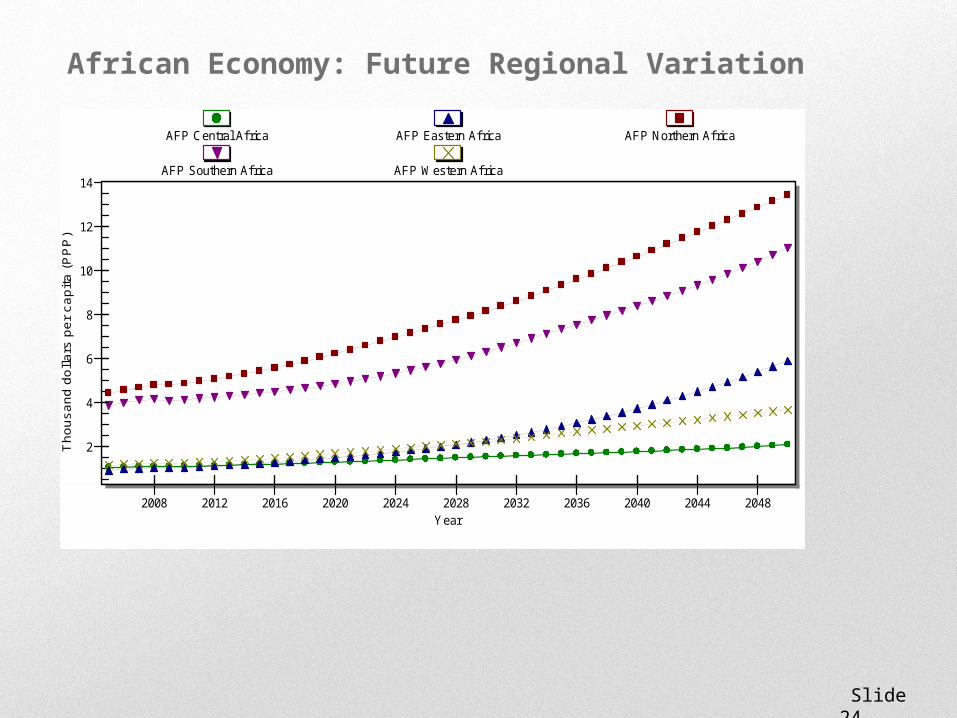
African Economy: Future Regional Variation
2
4
6
8
10
12
14
Tho
usan
d do
llars
per
cap
ita (
PP
P)
Year2008 2012 2016 2020 2024 2028 2032 2036 2040 2044 2048
AFP Central Africa AFP Eastern Africa AFP Northern Africa
AFP Southern Africa AFP Western Africa

Slide 25
African Economies: Persistent Extreme (<$1.25) Poverty
A thread of the report story: Persistent challenges
0
20
40
60
80
100
120
140
Mill
ion p
eople
Year2008 2012 2016 2020 2024 2028 2032 2036 2040 2044 2048
Central Africa Eastern Africa Northern Africa Southern Africa Western Africa

Slide 26
African Economies: Dimensions of Transformation
Source: McKinsey Global Institute, Lions on the Move
A thread of the report story: Economic diversification

Slide 27
African Economic Challenge: Regional Transformations
2005
AFP Western Africa(2050)
2005
AFP Eastern Africa(2050)
2005
AFP Northern Africa(2050)
2005
AFP Southern Africa(2050)
2005
AFP Central Africa(2050)0
500
1000
1500
2000
2500
3000
3500
4000
45 50 55 60 65 70 75 80 85 90 95 100
Year = 2050
Exp
orts
pe
r ca
pita
(20
00
do
llars
)
Economic diversification (manufactures and services as percent of GDP)
AFP Western Africa AFP Eastern Africa AFP Northern Africa
AFP Southern Africa AFP Central Africa

Slide 28
African Economic Challenge: Coming Transformations
2005
Nigeria(2050)
2005
Egypt(2050)
2005
Ethiopia(2050)
2005
South Africa(2050)
2005
Kenya(2050)
2005
Angola(2050)
0
500
1000
1500
2000
2500
3000
3500
4000
4500
5000
30 40 50 60 70 80 90 100
Year = 2050
Exp
ort
s per
capita
(2000 d
olla
rs)
Economic diversification (manufactures and services as percent of GDP)
Nigeria Egypt Ethiopia South Africa Kenya Angola

Slide 29
African Agricultural Productivity Challenge: Global Context
A thread of the report story: Agriculture potential and challenges (e.g. water)
2.0
2.5
3.0
3.5
4.0
4.5
5.0
5.5
6.0
6.5
7.0
7.5
8.0
Ton
s/H
ecta
r
Year2008 2012 2016 2020 2024 2028 2032 2036 2040 2044 2048
Africa China India USA EU27

Slide 30
African Environmental Challenge: Climate Change and Precipitation
Source: Oli Brown and Alec Crawford, From Climate Change and Security in Africa, A Study for the Nordic-African Foreign Ministers Meeting, March 2009, p 15. Available at http://www.iisd.org/publications/pub.aspx?pno=1093
Slide 31
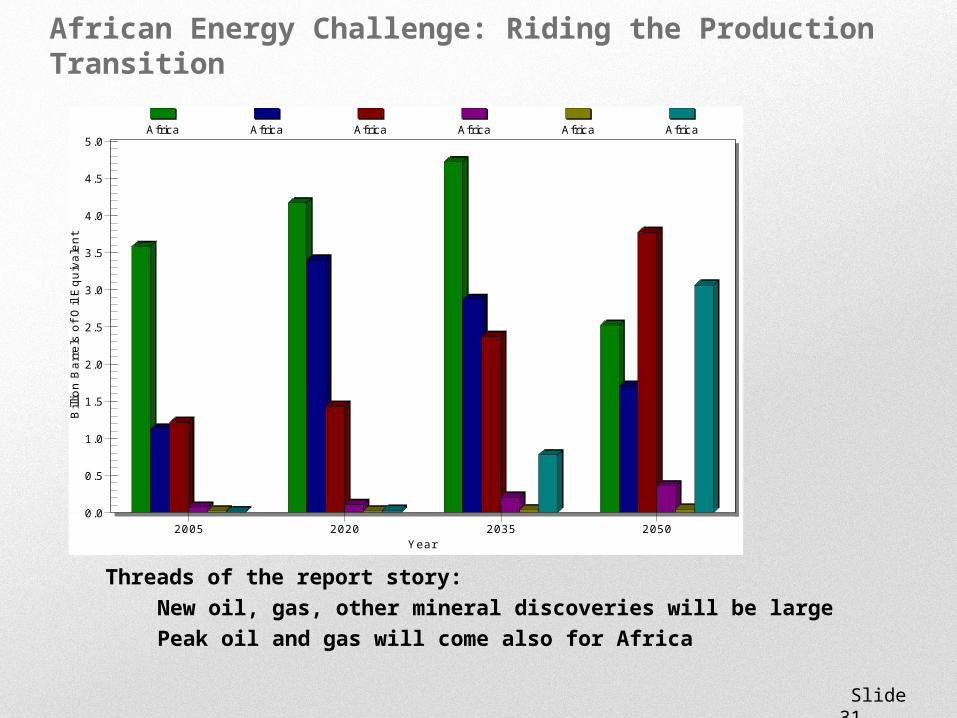
African Energy Challenge: Riding the Production Transition
Threads of the report story:
New oil, gas, other mineral discoveries will be large
Peak oil and gas will come also for Africa
0.0
0.5
1.0
1.5
2.0
2.5
3.0
3.5
4.0
4.5
5.0
Bill
ion
Bar
rels
of O
il E
quiv
alen
t
Year2005 2020 2035 2050
Africa Africa Africa Africa Africa Africa

Slide 32
African Infrastructure Challenge: Building and Maintaining
Units: Billion dollars annuallySource: Vivien Foster and Cecilia Briceño-Garmendia (ed’s) Africa's Infrastructure: A Time for
Transformation, Africa Development Forum Series, Agence Française de Développement and the World Bank, Washington DC, 2010, p 7. Available at http://www.infrastructureafrica.org/aicd/library/doc/552/africa%E2%80%99s-infrastructure-time-transformation (accessed on 3 December 2010)

Slide 33
African Infrastructure Challenge: Sanitation and Safe Water
0
5
10
15
20
25
30
35
Per
cent
Year2005 2020 2035 2050
Imrproved Sanitation Safe Water

Slide 34
African Infrastructure Challenge: Electricity
Current value in the US: 14,000
Current values in India and Africa: ~ 600
0
500
1000
1500
2000
2500
3000
3500
4000
4500
Kilo
watt-h
ours
per
capita
Year2008 2012 2016 2020 2024 2028 2032 2036 2040 2044 2048
Central Africa Eastern Africa Northern Africa Southern Africa Western Africa

Slide 35
African Regional Challenge: Rail Connections

Slide 36
African Infrastructure Leapfrog: Mobile and Broadband
0
10
20
30
40
50
60
70
80
90
100
110
120
Acc
ess
per
100
Year1995 2001 2007 2013 2019 2025 2031 2037 2043 2049
Broadband Access Mobile Access

Slide 37
African Regional Challenge: Intraregional Trade
Source: McKinsey Global Institute, Lions on the Move: 25

Slide 38
African Governance Challenge: Democracy/Freedom
Source: Freedom House, 2010 available at http://www.freedomhouse.org/template.cfm?page=25&year=2010
Free: Benin, Botswana, Cape Verde, Ghana, Mali, Mauritius, Namibia, São Tomé & Príncipe, South Africa
Partly Free: Burkina Faso, Burundi, Central African Republic, Comoros, Djibouti, Ethiopia, The Gambia, Guinea-Bissau, Lesotho, Kenya, Liberia, Madagascar, Malawi, Morocco, Mozambique, Niger, Nigeria, Senegal, Seychelles, Sierra Leone, Tanzania, Togo, Uganda, Zambia,
Not Free: Algeria, Angola, Cameroon, Chad, Republic of Congo, DR Congo, Côte d’Ivoire, Egypt, Equatorial Guinea, Eritrea, Gabon, Guinea, Libya, Mauritania, Rwanda, Somalia, Sudan, Swaziland, Tunisia, Zimbabwe

Slide 39
African Democracy: Regional History
0
1
2
3
4
5
6
7
Inde
x
Year1963 1967 1971 1975 1979 1983 1987 1991 1995 1999 2003 2007
Central Africa Eastern Africa Northern Africa Southern Africa Western Africa

Slide 40
African Government Challenge: Democratic Deficit
-4
-3
-2
-1
0
1
2
3
4
5
6
7
Year2010 2050
Central Africa Eastern Africa Northern Africa Southern Africa Western Africa

Slide 41
The Relationship between GDP per Capita and Transparency (Lack of Corruption)
In the long run GDP per Capita brings down corruption
In the short run corruption brings down GDP per capita
Afr-Eastern
Afr-Middle
Afr-Northern
Afr-Southern
Afr-Western
Amer-Carib Amer-Central
Amer-North
Amer-South
Asia-East
Asia-SoCent
Asia-SoEast
Asia-West
Eur-East
Eur-North
Eur-South
Eur-West Oceania
2
3
4
5
6
7
8
0 5000 10000 15000 20000 25000 30000
Tran
spar
ency
Inte
rnat
iona
l Cor
rupt
ion
GDP per Capita at PPP

Slide 42
African Security Challenge: Global Context
Source: Monty G. Marshall and Benjamin Cole. 2009

Slide 43
African Security Challenge: Africa in Global Context
Source: Source SIPRI, http://www.sipri.org/yearbook/2010/02/02A

Slide 44
The Relationship between GDP per Capita and Vulnerability to Conflict
In the long run GDP per Capita brings down conflict
In the short run conflict brings down GDP per capita
Afr-Eastern
Afr-Middle
Afr-Northern
Afr-Southern
Afr-Western
Amer-Carib
Amer-Central
Amer-North
Amer-South
Asia-East
Asia-SoCent
Asia-SoEast
Asia-West
Eur-East
Eur-North Eur-South
Eur-West
Oceania
0
2
4
6
8
10
12
14
16
18
20
0 5000 10000 15000 20000 25000 30000
United Nations Sub-RegionsS
tate
Fra
gili
ty Index
of M
ars
hall
and C
ole
GDP per capita at PPP

African Futures 2050
Africa is perceived far too negatively in much of world
Africa is rising on most dimensions, absolutely and relatively
Africa does face many challenges
Final: Future is always uncertain
Recapping the Recapping the Story:Story:

Development- focused African
Governance
Weak/Parasitic African
Governance
Friendly Global Context
Harsh Global Context
African Renaissance
Politics of the Belly
Arrested Development
Opportunities Lost
Alternative Futures in Africa: Exploring Uncertainty and Opportunity